Embed Size (px)
Citation preview
Dipartimento di Scienze Economiche e Sociali
UNIVERSITÀ POLITECNICA DELLE MARCHE
ON FIRMS’ PRODUCT SPACE EVOLUTION: THE
ROLE OF FIRM AND LOCAL PRODUCT
RELATEDNESS
Alessia Lo Turco∗, Daniela Maggioni§
QUADERNI DI RICERCA n. 402ISSN: 2279-9575
June 2014

Comitato scientifico:
Renato BalducciMarco GallegatiAlberto NiccoliAlberto Zazzaro
Collana curata da:Massimo Tamberi

Contents1 Introduction 1
2 Literature Review 3
3 Data and Measurement Issues 43.1 Data Sources . . . . . . . . . . . . . . . . . . . . . . . . . . . . . . . . . . . . . . . 43.2 Measuring product innovation and product relatedness . . . . . . . . . . . . . . 5
4 Empirical Analysis 104.1 Empirical model and estimation issues . . . . . . . . . . . . . . . . . . . . . . . 104.2 Baseline Results . . . . . . . . . . . . . . . . . . . . . . . . . . . . . . . . . . . . . 104.3 Does Firm Heterogeneity shape the role of capabilities? . . . . . . . . . . . . . . 16
5 Conclusions 21
Appendix 29A Additional Tables . . . . . . . . . . . . . . . . . . . . . . . . . . . . . . . . . . . . 29
On �rms' product space evolution:the role of �rm and local productrelatedness
Alessia Lo Turco∗, Daniela Maggioni§
Abstract
We explore the role of firm and local product-specific capabilities in fostering the introduc-tion of new products in the Turkish manufacturing. Firms’ product space evolution is charac-terised by strong cognitive path dependence which, however, is relaxed by firm heterogeneityin terms of size, efficiency and international exposure. The introduction of new products inlaggard Eastern regions, which is importantly related to the evolution of their industrial out-put, is mainly affected by firm internal product specific resources. On the contrary, productinnovations in Western advanced regions hinge relatively more on the availability of suitablelocal competencies. JEL: JEL: D22, O53, O12Keywords: Product relatedness; Firm heterogeneity, Product Innovation
∗ Corresponding Author. Università Politecnica delle Marche, Department of Economicsand Social Sciences; Piazzale Martelli 8, 60122 Ancona - Italy.Tel.: +39-071-2207250. E-mail: [email protected].
§ Università Politecnica delle Marche, Department of Economics and Social Sciences; Pi-azzale Martelli 8, 60122 Ancona - Italy.Tel.: +39-071-2207250. E-mail: [email protected].

1 IntroductionCountries’ development histories are the result of a long term sequence of structural changesthat explain what they are today. The continuous discovery of new production opportuni-ties is a key factor for prospering in the long run, as it carries ahead the process of creativedestruction from which development takes off. The understanding of how countries’ pro-duction structure evolves, though, entails looking at firms’ innovative behaviour which is im-portantly shaped by the availability of suitable existing local capabilities and relevant firminternal resources. In this work, we aim at exploring the relevance of firm and local techno-logical proximity in shaping the evolution of firms’ product space in Turkey during the period2005-2009.On one hand, literature has shown that knowledge externalities, which play a relevant rolein economic growth (Arrow, 1962; Romer, 1986b,a; Grossman and Helpman, 1993), are geo-graphically localised (Jaffe et al., 1993) and importantly enhance firm innovation, especiallyin small and medium size firms (Audretsch and Feldman, 2004). Despite the fact that the on-going capitalist era is characterised by rapid spur and advances in information and commu-nication technologies, the crucial difference between information and knowledge (Gertler,2003; Howells, 2012) may still make the local dimension matter in the process of innovationcreation. Tacit knowledge, indeed, has an important role in developing successful firm rou-tines and represents a key competitive element in a period of widespread access to codifiedknowledge (Gertler, 2003; Maskell and Malmberg, 1999). The local availability of highly qual-ified labor, the structure of the local economy, and the presence of research facilities andinstitutions of higher education are all factors that may favour the diffusion of knowledge.However, geographical proximity is neither a necessary nor a sufficient condition for spurringinnovation1 across firms (Boschma, 2005) and other types of proximity may be necessary tocomplement the spatial one in favouring the introduction of new products. As a matter of factin order to learn from the local knowledge pool, firms need to be able to absorb the relevantknowledge and thus need to be cognitively proximate to the local environment (Boschma,2005). As a consequence, if knowledge can only be transmitted when receiving firms are ableto absorb it, the notions of geographical and cognitive proximities become intimately related(Autant-Bernard, 2001; Baptista and Swann, 1998; Orlando, 2000).On the other hand, firm internal resources are a fundamental driver of innovation and diver-sification in a highly dynamic global environment. Firm capabilities consist in the combi-nation of technical competences with a general ability to change and adapt to environmen-tal evolution (Teece et al., 1994). As knowledge and technological relatedness are necessaryconditions for firm innovation, internal product specific resources drive firms’ own path todiversification (Breschi et al., 2003; Neffke and Henning, 2013).
Within this framework, our work aims at providing new insights on the impact of firmand local product specific capabilities on the pattern of firm innovation. We thus contributeto the literature studying the role of technological relatedness for starting a new sector in acountry (Hausmann and Hidalgo, 2009; Hidalgo, 2009), a region (Boschma et al., 2012, 2013;Boschma and Iammarino, 2009; Neffke et al., 2011) or a firm (Breschi et al., 2003; Neffke and
1Indeed, even if being geographically close facilitates the transmission of tacit knowledge,as the innovation process increasingly benefits from learning by interacting (Lundvall andJohnson, 1994), the social dimension of innovation gains in importance and social and rela-tional proximity may also matter for innovation (Boggs and Rantisi, 2003; Breschi and Lissoni,2001, 2009). In this respect, the so-called “soft location factors” are effective in retaining localqualified workers and encouraging qualified workers migration to the region.
1
Henning, 2013; Poncet and de Waldemar, 2012) and we also add to the empirical work test-ing the absolute and relative importance of the existence of a fertile regional environmentversus the endowment of relevant intra-firm resources for firm innovation (Pfirrmann, 1994;Sternberg and Arndt, 2001; Beugelsdijk, 2007; Wang and Lin, 2012).
However, compared to the existing evidence, we provide some original contributions.Firstly, for the first time, to our knowledge, we exploit firm product level data in order
to uncover the role of firms’ and their local environment current product space for firms’choice and ability of new products. Rather than focusing on firm product exports (Poncetand de Waldemar, 2012), we adopt a broader perspective by describing and inspecting howand which new products are added to firms’ existing baskets. We, thus, contribute to shedlight on the microeconomics of countries’ product diversification and extend insights on theimportance of capabilities endowments and on path dependence in productive structures’evolutions from the country to the firm level (David, 1985; Arthur, 1989; Hidalgo, 2009; Haus-mann and Hidalgo, 2009, 2011). As a consequence, we can explain the emergence of productclusters across the geographical space which justify the existence of long lasting differences -in terms of diversification, sophistication and, as a consequence, growth - across regions thatespecially characterise emerging and developing countries.
Secondly, we focus on and compare the impact of firm and local product specific capa-bilities on a firm’s decision of which product to add to its existing product portfolio, ratherthan looking at and comparing the effect of overall local and firm-specific resources on firminnovation propensity (Pfirrmann, 1994; Sternberg and Arndt, 2001; Beugelsdijk, 2007).
Thirdly, our analysis explores the role of several dimensions of firm heterogeneity in termsof internal and environmental resources in relaxing the linkage between the local and firmpre-existing capabilities on the one side and the evolution path of production on the otherside, and, as a consequence, in introducing a structural transformation in the economic sys-tem. Large, highly productive firms, firms engaged in R&D and in complex productionscould better exploit their internal resources to develop new capabilities and gain indepen-dence from the context where they operate. Foreign owned firms, on their side, like ex-porters, importers and multi-plant firms located in different regions, operate within moreopen and wider networks and, thus, have weaker ties with the local environment (Granovet-ter, 1973). This can favour their escape from the historical regional comparative advantage,due to knowledge spillovers from their international network and, for foreign firms, to theavailability of larger intra-group financial resources (Desai et al., 2004, 2008). In all thesecases, regardless of local conditions, the availability of a larger knowledge base can impor-tantly contribute to reduce a firm’s entry cost in a new brand new technology (Perez andSoete, 1988).
Finally, to the best of our knowledge this is the first piece of research investigating the im-portance of firm and local capabilities in shaping product innovation in Turkey. Relevant ter-ritorial disparities characterise the country. A laggard East contrasts with a more developedWest, where most of the Turkish industrial base is located. In this context, it is fundamental toascertain whether and to what extent geographical and technological proximity explain theinnovation performance of firms and the evolution of the country’s product space. Our anal-ysis can thus reveal the worthiness of recent cluster policies aiming at favouring the spatialdiffusion of local industrial development.
The work is organised as follows: the next section reviews the relevant literature and goesinto detail of our contribution; section 3 presents the data sources and our main relatednessindicators; section 4 describes the empirical strategy and presents the results; section 5 con-cludes.
2
2 Literature ReviewIn the process of economic development, diversification of production is an important stepwhich ultimately depends on adjustments at the firm margin and at the product marginwithin the firm. Product innovation, in other words, is a firm level phenomenon which iscomplex, uncertain and requires time and learning (Dosi, 2011; Feldman, 1994). As a con-sequence, firm innovation efforts may, in turn, importantly benefit from the availability ofa local pool of diverse knowledge and capabilities. Geographical proximity among firmsmay thus emerge as a fundamental driver of innovation. Indeed, it may reduce uncertaintyfor firms entering new fields, as it favours the flow of knowledge by enabling firms to ex-change ideas and acquire important skills and abilities required for new production processes(Boschma and Frenken, 2011; Audretsch and Feldman, 2004). However, some research ineconomic geography suggests that, unless complemented by cognitive proximity, geograph-ical proximity may not be per se either necessary or sufficient to foster the spur of knowl-edge (Boschma, 2005; Autant-Bernard, 2001; Orlando, 2000; Baptista and Swann, 1998). Inthis line, recently Boschma et al. (2012) investigate the importance of diversification in re-lated industries for regional value added and employment growth in Spain at the NUTS3 re-gion level during the period 1995-2007. By comparing the cluster classification introduced byPorter (2003) and the proximity index proposed by Hidalgo et al. (2007), they show that Span-ish provinces with a wide range of related industries tend to enjoy higher economic growthrates. Focusing on regional competitiveness, instead, Boschma et al. (2013) explore the roleof regional and country level density measures around a product on a region’s probabilityto develop a revealed comparative advantage in that product. By using export data on 50Spanish regions at the NUTS 3 level in the period 1988-2008, they show that proximity to theregional industrial structure plays a much larger role in the emergence of new comparativeadvantage industries in regions than does proximity to the national industrial structure. Thishints at important complementarities between geographical and cognitive proximity in thespur of knowledge, although regional capabilities favour the maintenance rather than the de-velopment of comparative advantages. Neffke et al. (2011) analyse the economic evolutionof 70 Swedish regions during the period 1969-2002 and find strong path dependence in thediversification process of Swedish regions. Their results confirm that technological related-ness, measured by a Revealed Relatedness indicator based on the ratio between industries’co-occurrences and their predicted value, is important in rising regions’ technological cohe-sion. Boschma and Iammarino (2009) also look at the role of “related” knowledge on regionaleconomic growth in Italian provinces for the period 1995-2003. Their relatedness indicatorhinges on the belonging of sectors/products to the same two digit sector, thus following thenotion of relatedness proposed by Frenken et al. (2007). They also point at the important roleof related extra-regional knowledge in shaping the process of regional economic growth.
At the firm level, firm expansion can be viewed as a process of exploitation of productiveopportunities (Penrose, 1959). Firms can be viewed as unique bundles of resources wherefirm specific abilities and general organisational routines are combined with product-specificcompetencies related to the production of a particular product 2. Thus, product-specificcapabilities can constitute an important knowledge base to explore new production fieldsand can be exploited by firms to diversify into technologically related products (Danneels,2002). In this line, on a sample of United States, Italian, French, UK, German, and Japanesefirms patenting to the European Patent Office from 1982 to 1993 Breschi et al. (2003) show
2A similar view of the firm is reproduced by recent mainstream models of multi-productfirms (Bernard et al., 2011).
3
that knowledge-relatedness, measured on the basis of the co-classification codes containedin patent documents, is a major determinant of firm diversification, measured as the firmprobability to be simultaneously active in another activity other than the core one. In a sim-ilar way, Neffke and Henning (2013) identify skill relatedness by using information on cross-industry labour flows and show that firms are more likely to diversify into industries that aremore “skill” related to their core activities than into industries without such ties or into in-dustries that are linked by value chain linkages or by classification-based relatedness.
These firm level studies, thus, suggest that, although inter-firm technologically relatedknowledge spillovers may play a role in the evolution of firms’ production structure, the ne-cessity of firms’ internal product specific knowledge and abilities cannot be neglected. Inparticular, the local environment can be considered of minor importance for the introduc-tion of brand new products and sectors because of the large distance between the existingpool of capabilities and the requirements of the new firms/products on the one side and itsenvironment on the other (Boschma and Frenken, 2006). In this respect, a stream of litera-ture has focused on quantification of the relative importance of firm and local resources andcapabilities in favouring firm innovation. Pfirrmann (1994) for a sample of SMEs in Germany,Sternberg and Arndt (2001) on a sample of European firms mainly of medium and small sizeand Beugelsdijk (2007) for a sample of Dutch firms, all show that the firm-specific drivers ofinnovation are more important than is a firm’s regional environment. This evidence calls intoquestion the existence of a regional environment effect tout-court and suggests that the rel-evant inter-firm interactions within bounded territories need to be more carefully assessed.This once again brings us back to the important complementarity between cognitive and ge-ographical proximity among firms in favouring the flow of tacit knowledge which enhancesfirm growth and diversification processes. In this line, and closer to our work, Poncet andde Waldemar (2012) show that the export performance of Chinese firms in a product dependson their product relatedness to the local comparative advantage, with product relatednessbeing measured on the basis of the proximity index proposed by Hidalgo et al. (2007). Thiseffect is particularly strong for domestic firms and for ordinary trade activity and for moreproductive firms, thus showing the need for sufficient absorptive capacity for the spillover tooccur.
In the present work we test the impact of both firm and local product-specific capabili-ties measured by Hidalgo et al.’s 2007 density indicators in shaping the process of firm intro-duction of new products. We also inspect the role of firm heterogeneity in affecting the de-pendence of firms’ product portfolio choices on the firm internal and local product-specificcapabilities.
3 Data and Measurement Issues
3.1 Data SourcesFor the implementation of our analysis we make use of three different firm level data sourcesprovided by the Turkish Statistical Office (TurkStat).
Our main variables of interest are computed from the Annual Industrial Product Statis-tics (AIPS). AIPS contains firm level information on each produced good, its volume and valueof production and sales. These data are available for the years 2005-2009 and are collected at10-digit PRODTR level. The latter is a national product classification with the first 6 digits cor-responding to CPA codes and including about 3,700 different products. Production data arecollected for all firms with more than 20 persons employed and whose primary or secondary
4
activity is either in section C (Mining&Quarrying) or section D (Manufacturing) of NACE Rev1.1. This database allows for the identification of new products introduced by firms and offirms’ and provinces’ production structure.Information on firms’ characteristics and location is from the Structural Business Statistics(SBS). The latter contains information on output, input costs, employment, foreign owner-ship and the province of location over the period 2005-2009 for the whole population of firmswith more than 20 employees and for a representative sample of firms with less than 20 em-ployees. The SBS covers all firms contained in AIPS. The SBS also provides information onfirms’ plants, in particular their number, location, employment, turnover and NACE sector.We then exploit these plant level data to recover production value at the province-productlevel.Information on firms’ export and import activities is available for the period of our analysisfrom Foreign Trade Statistics. Finally, we use BACI (Gaulier and Zignago, 2010) trade data atcountry-product level to compute the product proximity indicator (Hidalgo et al., 2007) and,as a consequence, the firm and local product density indicator.
While production data are recorded according to the PRODTR classification system, BACItrade data are recorded according to the 1996-HS classification. In order to match firm-product level production data with the proximity indicator computed by exploiting prod-uct level export information retrieved from BACI, we first converted 1996-HS flows into CPAby means of the HS-CPA correspondence table available from RAMON website and we con-structed a harmonised classification that is just slightly more aggregated than the CPA classi-fication, which we call HCPA. The latter contains 1,297 products of which 1,030 are actuallyproduced in Turkey. Hereafter, product code refers to HCPA classification.
It is worth highlighting that our location specific characteristics are measured at the NUTS3province level. In order to calculate production value at the province level we had to copewith the presence of multi-plant firms in our database. For single-product multi-plant firmswe assumed that the value of the single product produced by each plant is proportional to itsdeclared turnover. In order to split the production of multi-product and multi-plant firmsacross plants located in different NUTS 3 regions, we assumed that each plant producesthe same products and we attributed the production value to each plant in proportion toits turnover.3
3.2 Measuring product innovation and product relatedness
Product Innovation - To explore whether the introduction of a new product is affectedby its proximity to firm and local existing capabilities we define Iip t as our dependent variablethat is a dummy taking value 1 if at time t firm i starts producing product p, not previously- in t − 1 - produced. Since we observe the production flow of new goods, we directly ob-serve the variable when it takes value 1. On the contrary, we do not observe the whole set ofproduction possibilities for each firm and thus we decided to set Iip t to zero for the wholeset of products that the firm is not producing at time t and that belong to one of the 2digitNACE codes where the firm is actually producing at time t-1 (Frenken et al., 2007). This no-tion of product diversification is narrower than the one that considers as potential choice any
3We compared the territorial distribution of production stemming from this assumptionto the emerging one by attributing to the plant the production of those products falling withinthe 4digit NACE sector declared as the plant’s main activity. The two territorial distributionsof production are rather close.
5
of the existing HCPA 1297 products not previously produced. Such a definition of the possi-ble cases, though, would make the analysis computationally unfeasible, due to the very highnumber - roughly thirteen millions - of observations. Nonetheless, as the definition adoptedin this paper actually restricts product addition possibilities to those products that in a waymay be technically related according to their classification code (Frenken et al., 2007), in therobustness checks we will consider this possibility by repeating the baseline estimations byyear and for a random selection of zeros on the entire sample of all possible product-firmcombinations.
It is worth noticing that our sample is made up of innovators only, and thus our results areconditional on the firm innovation status. This choice follows from the goal of our empiricalexercise. Indeed, we aim at highlighting how the local and firm production structure affectfirm product choice among all the alternatives rather than studying how it may determinefirm innovation propensity.4
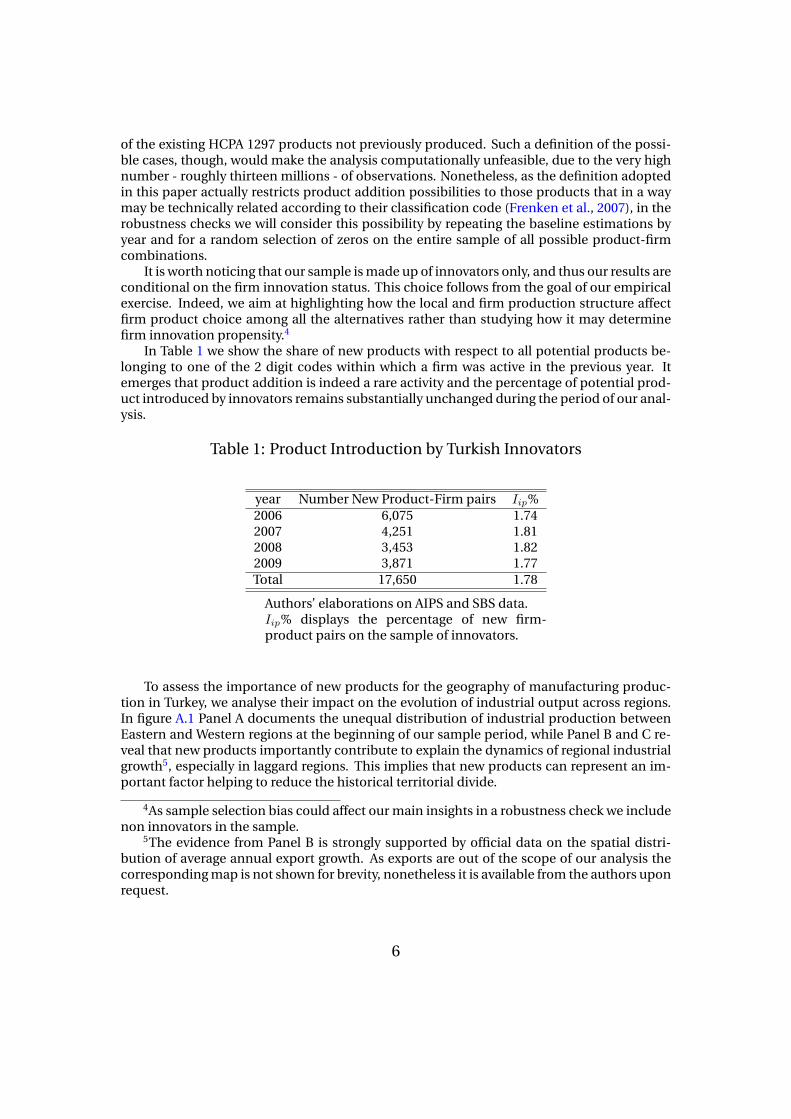
In Table 1 we show the share of new products with respect to all potential products be-longing to one of the 2 digit codes within which a firm was active in the previous year. Itemerges that product addition is indeed a rare activity and the percentage of potential prod-uct introduced by innovators remains substantially unchanged during the period of our anal-ysis.
Table 1: Product Introduction by Turkish Innovators
year Number New Product-Firm pairs Iip%2006 6,075 1.742007 4,251 1.812008 3,453 1.822009 3,871 1.77Total 17,650 1.78
Authors’ elaborations on AIPS and SBS data.Iip% displays the percentage of new firm-product pairs on the sample of innovators.
To assess the importance of new products for the geography of manufacturing produc-tion in Turkey, we analyse their impact on the evolution of industrial output across regions.In figure A.1 Panel A documents the unequal distribution of industrial production betweenEastern and Western regions at the beginning of our sample period, while Panel B and C re-veal that new products importantly contribute to explain the dynamics of regional industrialgrowth5, especially in laggard regions. This implies that new products can represent an im-portant factor helping to reduce the historical territorial divide.
4As sample selection bias could affect our main insights in a robustness check we includenon innovators in the sample.
5The evidence from Panel B is strongly supported by official data on the spatial distri-bution of average annual export growth. As exports are out of the scope of our analysis thecorresponding map is not shown for brevity, nonetheless it is available from the authors uponrequest.
6
Product Relatedness - In order to calculate the extent of relatedness between firms’new products and their own and local capabilities we hinge on the proximity indicator in-troduced by Hidalgo et al. (2007) between each pair of products which is based on the co-occurrence of products in the export basket of countries.6 To compute this index we con-verted HS export flows from the BACI CEPII trade dataset for year 2002 into the HCPA classi-fication and we calculated it as:
φpj = min{P (RCAxp|RCAxj), P (RCAxj |RCAxp)}
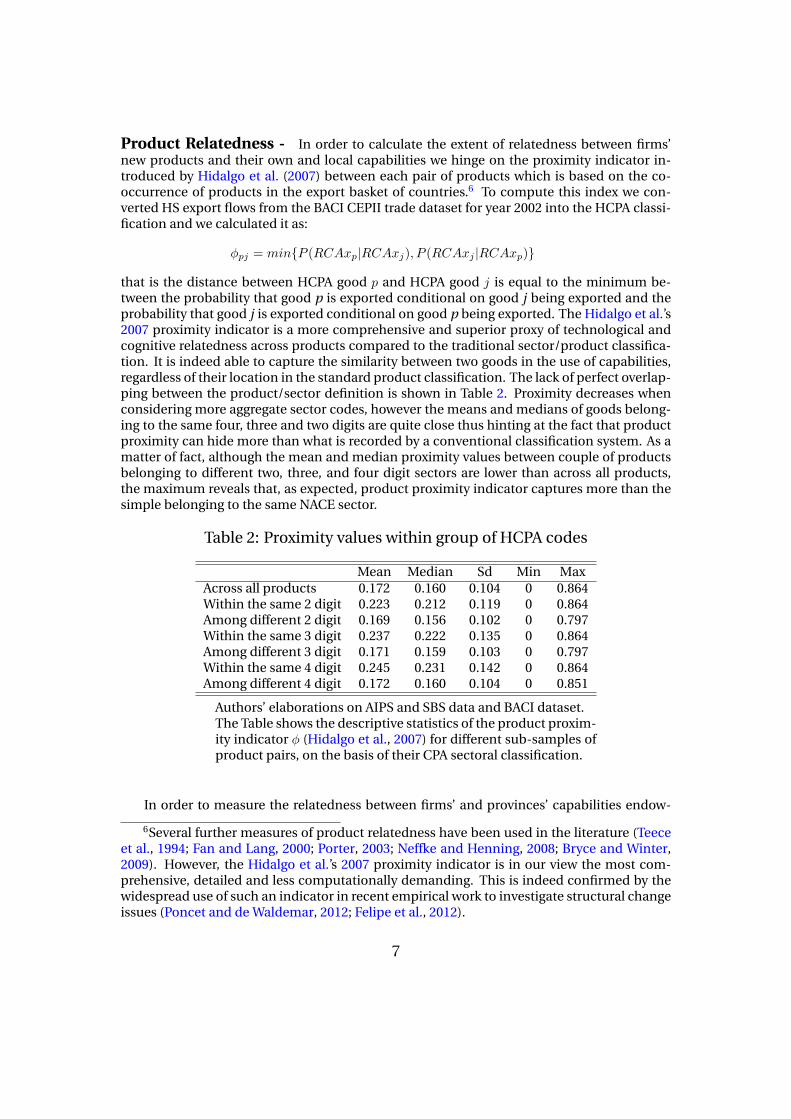
that is the distance between HCPA good p and HCPA good j is equal to the minimum be-tween the probability that good p is exported conditional on good j being exported and theprobability that good j is exported conditional on good p being exported. The Hidalgo et al.’s2007 proximity indicator is a more comprehensive and superior proxy of technological andcognitive relatedness across products compared to the traditional sector/product classifica-tion. It is indeed able to capture the similarity between two goods in the use of capabilities,regardless of their location in the standard product classification. The lack of perfect overlap-ping between the product/sector definition is shown in Table 2. Proximity decreases whenconsidering more aggregate sector codes, however the means and medians of goods belong-ing to the same four, three and two digits are quite close thus hinting at the fact that productproximity can hide more than what is recorded by a conventional classification system. As amatter of fact, although the mean and median proximity values between couple of productsbelonging to different two, three, and four digit sectors are lower than across all products,the maximum reveals that, as expected, product proximity indicator captures more than thesimple belonging to the same NACE sector.
Table 2: Proximity values within group of HCPA codes
Mean Median Sd Min MaxAcross all products 0.172 0.160 0.104 0 0.864Within the same 2 digit 0.223 0.212 0.119 0 0.864Among different 2 digit 0.169 0.156 0.102 0 0.797Within the same 3 digit 0.237 0.222 0.135 0 0.864Among different 3 digit 0.171 0.159 0.103 0 0.797Within the same 4 digit 0.245 0.231 0.142 0 0.864Among different 4 digit 0.172 0.160 0.104 0 0.851
Authors’ elaborations on AIPS and SBS data and BACI dataset.The Table shows the descriptive statistics of the product proxim-ity indicator φ (Hidalgo et al., 2007) for different sub-samples ofproduct pairs, on the basis of their CPA sectoral classification.
In order to measure the relatedness between firms’ and provinces’ capabilities endow-
6Several further measures of product relatedness have been used in the literature (Teeceet al., 1994; Fan and Lang, 2000; Porter, 2003; Neffke and Henning, 2008; Bryce and Winter,2009). However, the Hidalgo et al.’s 2007 proximity indicator is in our view the most com-prehensive, detailed and less computationally demanding. This is indeed confirmed by thewidespread use of such an indicator in recent empirical work to investigate structural changeissues (Poncet and de Waldemar, 2012; Felipe et al., 2012).
7
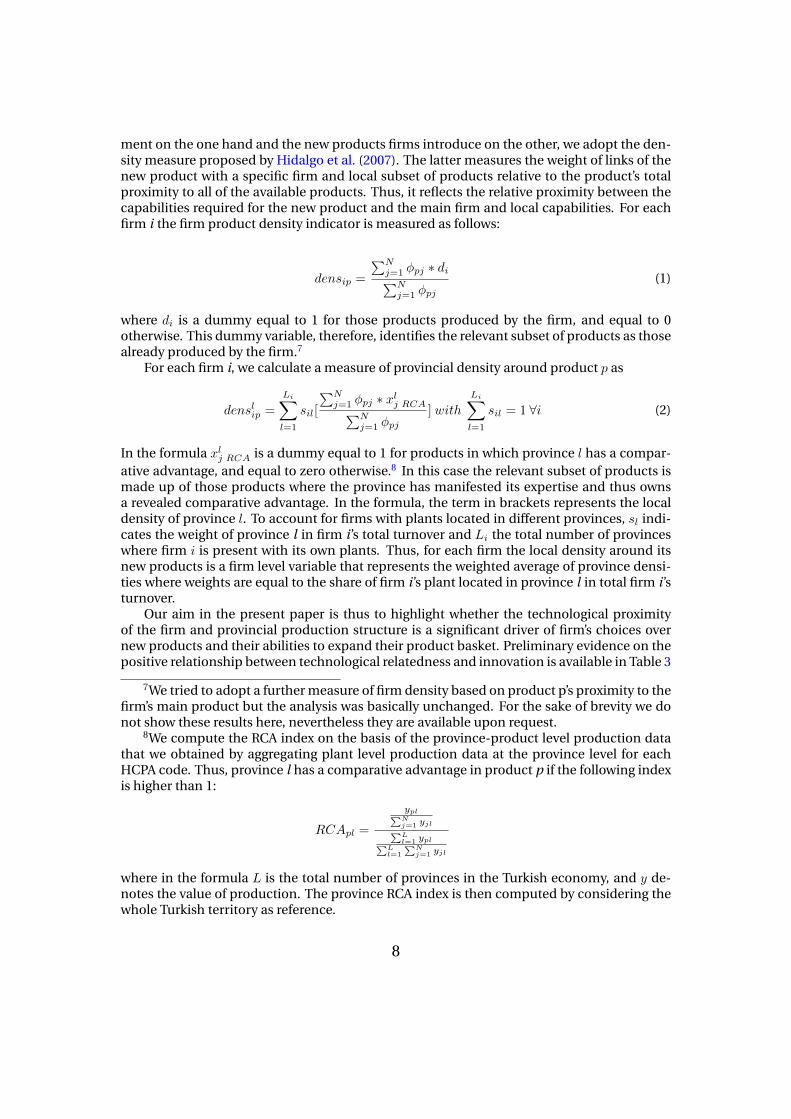
ment on the one hand and the new products firms introduce on the other, we adopt the den-sity measure proposed by Hidalgo et al. (2007). The latter measures the weight of links of thenew product with a specific firm and local subset of products relative to the product’s totalproximity to all of the available products. Thus, it reflects the relative proximity between thecapabilities required for the new product and the main firm and local capabilities. For eachfirm i the firm product density indicator is measured as follows:
densip =
∑Nj=1 φpj ∗ di∑Nj=1 φpj
(1)
where di is a dummy equal to 1 for those products produced by the firm, and equal to 0otherwise. This dummy variable, therefore, identifies the relevant subset of products as thosealready produced by the firm.7
For each firm i, we calculate a measure of provincial density around product p as
denslip =
Li∑l=1
sil[
∑Nj=1 φpj ∗ xlj RCA∑N
j=1 φpj] with
Li∑l=1
sil = 1 ∀i (2)
In the formula xlj RCA is a dummy equal to 1 for products in which province l has a compar-ative advantage, and equal to zero otherwise.8 In this case the relevant subset of products ismade up of those products where the province has manifested its expertise and thus ownsa revealed comparative advantage. In the formula, the term in brackets represents the localdensity of province l. To account for firms with plants located in different provinces, sl indi-cates the weight of province l in firm i’s total turnover and Li the total number of provinceswhere firm i is present with its own plants. Thus, for each firm the local density around itsnew products is a firm level variable that represents the weighted average of province densi-ties where weights are equal to the share of firm i’s plant located in province l in total firm i’sturnover.
Our aim in the present paper is thus to highlight whether the technological proximityof the firm and provincial production structure is a significant driver of firm’s choices overnew products and their abilities to expand their product basket. Preliminary evidence on thepositive relationship between technological relatedness and innovation is available in Table 3
7We tried to adopt a further measure of firm density based on product p’s proximity to thefirm’s main product but the analysis was basically unchanged. For the sake of brevity we donot show these results here, nevertheless they are available upon request.
8We compute the RCA index on the basis of the province-product level production datathat we obtained by aggregating plant level production data at the province level for eachHCPA code. Thus, province l has a comparative advantage in product p if the following indexis higher than 1:
RCApl =
ypl∑Nj=1 yjl∑Ll=1 ypl∑L
l=1
∑Nj=1 yjl
where in the formula L is the total number of provinces in the Turkish economy, and y de-notes the value of production. The province RCA index is then computed by considering thewhole Turkish territory as reference.
8

where t-tests reveal that newly introduced product-firm combinations systematically presenthigher firm and local densities.
Table 3: T-test
Iip = 1 Iip = 0 T-testdens 0.007 0.004 -88.796densl 0.287 0.254 -28.339
9
4 Empirical Analysis
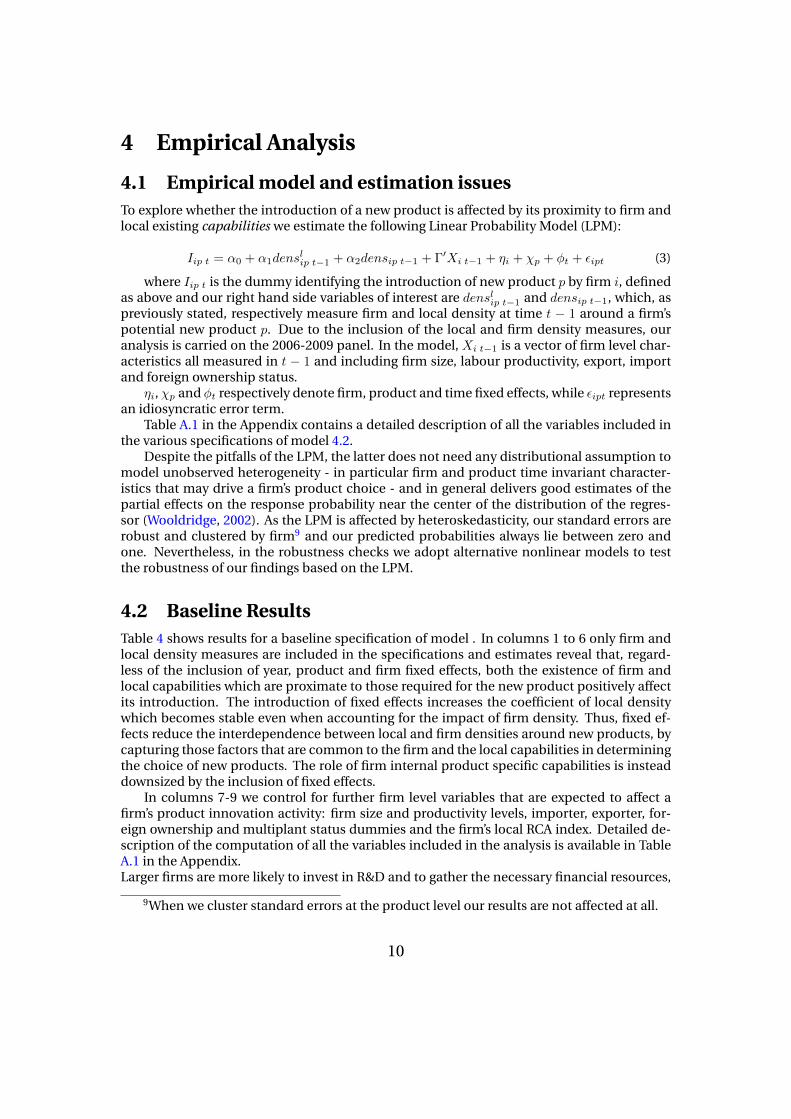
4.1 Empirical model and estimation issuesTo explore whether the introduction of a new product is affected by its proximity to firm andlocal existing capabilities we estimate the following Linear Probability Model (LPM):
Iip t = α0 + α1denslip t−1 + α2densip t−1 + Γ′Xi t−1 + ηi + χp + φt + εipt (3)
where Iip t is the dummy identifying the introduction of new product p by firm i, definedas above and our right hand side variables of interest are denslip t−1 and densip t−1, which, aspreviously stated, respectively measure firm and local density at time t − 1 around a firm’spotential new product p. Due to the inclusion of the local and firm density measures, ouranalysis is carried on the 2006-2009 panel. In the model, Xi t−1 is a vector of firm level char-acteristics all measured in t − 1 and including firm size, labour productivity, export, importand foreign ownership status.
ηi, χp and φt respectively denote firm, product and time fixed effects, while εipt representsan idiosyncratic error term.
Table A.1 in the Appendix contains a detailed description of all the variables included inthe various specifications of model 4.2.
Despite the pitfalls of the LPM, the latter does not need any distributional assumption tomodel unobserved heterogeneity - in particular firm and product time invariant character-istics that may drive a firm’s product choice - and in general delivers good estimates of thepartial effects on the response probability near the center of the distribution of the regres-sor (Wooldridge, 2002). As the LPM is affected by heteroskedasticity, our standard errors arerobust and clustered by firm9 and our predicted probabilities always lie between zero andone. Nevertheless, in the robustness checks we adopt alternative nonlinear models to testthe robustness of our findings based on the LPM.
4.2 Baseline ResultsTable 4 shows results for a baseline specification of model . In columns 1 to 6 only firm andlocal density measures are included in the specifications and estimates reveal that, regard-less of the inclusion of year, product and firm fixed effects, both the existence of firm andlocal capabilities which are proximate to those required for the new product positively affectits introduction. The introduction of fixed effects increases the coefficient of local densitywhich becomes stable even when accounting for the impact of firm density. Thus, fixed ef-fects reduce the interdependence between local and firm densities around new products, bycapturing those factors that are common to the firm and the local capabilities in determiningthe choice of new products. The role of firm internal product specific capabilities is insteaddownsized by the inclusion of fixed effects.
In columns 7-9 we control for further firm level variables that are expected to affect afirm’s product innovation activity: firm size and productivity levels, importer, exporter, for-eign ownership and multiplant status dummies and the firm’s local RCA index. Detailed de-scription of the computation of all the variables included in the analysis is available in TableA.1 in the Appendix.Larger firms are more likely to invest in R&D and to gather the necessary financial resources,
9When we cluster standard errors at the product level our results are not affected at all.
10
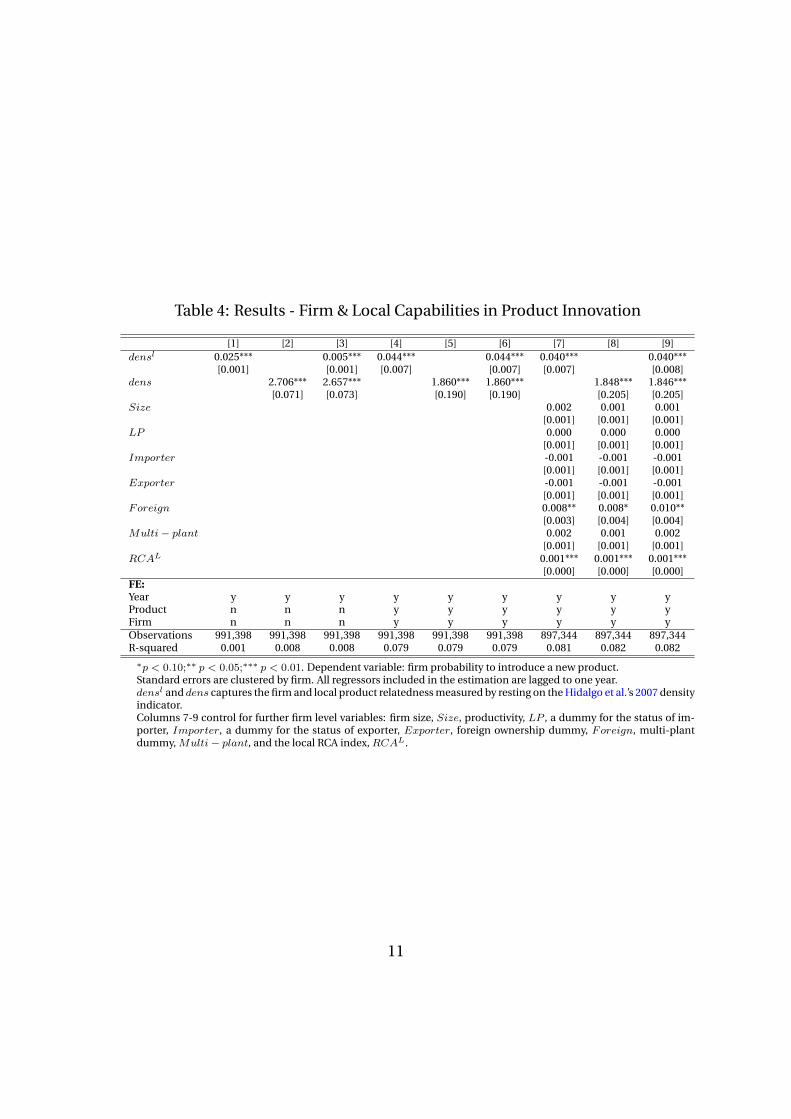
Table 4: Results - Firm & Local Capabilities in Product Innovation
[1] [2] [3] [4] [5] [6] [7] [8] [9]densl 0.025*** 0.005*** 0.044*** 0.044*** 0.040*** 0.040***
[0.001] [0.001] [0.007] [0.007] [0.007] [0.008]dens 2.706*** 2.657*** 1.860*** 1.860*** 1.848*** 1.846***
[0.071] [0.073] [0.190] [0.190] [0.205] [0.205]Size 0.002 0.001 0.001
[0.001] [0.001] [0.001]LP 0.000 0.000 0.000
[0.001] [0.001] [0.001]Importer -0.001 -0.001 -0.001
[0.001] [0.001] [0.001]Exporter -0.001 -0.001 -0.001
[0.001] [0.001] [0.001]Foreign 0.008** 0.008* 0.010**
[0.003] [0.004] [0.004]Multi− plant 0.002 0.001 0.002
[0.001] [0.001] [0.001]RCAL 0.001*** 0.001*** 0.001***
[0.000] [0.000] [0.000]FE:Year y y y y y y y y yProduct n n n y y y y y yFirm n n n y y y y y yObservations 991,398 991,398 991,398 991,398 991,398 991,398 897,344 897,344 897,344R-squared 0.001 0.008 0.008 0.079 0.079 0.079 0.081 0.082 0.082
∗p < 0.10;∗∗ p < 0.05;∗∗∗ p < 0.01. Dependent variable: firm probability to introduce a new product.Standard errors are clustered by firm. All regressors included in the estimation are lagged to one year.densl and dens captures the firm and local product relatedness measured by resting on the Hidalgo et al.’s 2007 densityindicator.Columns 7-9 control for further firm level variables: firm size, Size, productivity, LP , a dummy for the status of im-porter, Importer, a dummy for the status of exporter, Exporter, foreign ownership dummy, Foreign, multi-plantdummy,Multi− plant, and the local RCA index,RCAL.
11
either internally or from the local banking system (Beck et al., 2005, 2008). In addition, fora given size more efficient firms may more easily overcome the fixed cost of innovating. Ac-tually, recent literature on firm heterogeneity shows that firm innovation patterns are closelyrelated to heterogeneous efficiency levels, which are in turn very much related to the diversityof firms’ export activities (Melitz and Burstein, forthcoming). Finally, firms active in interna-tional markets may be more likely to innovate, as trade can be regarded as the flow of extra-regional knowledge (Boschma and Iammarino, 2009). On the one hand, importers may ac-cess new, better quality and more suitable inputs (Krishnan and Ulrich, 2001; Goldberg et al.,2009; Colantone and Crinò, 2013). On the other hand, exporters may dramatically be pushedto innovate by their own foreign customers (Baldwin and von Hippel, 2011; Goh, 2005; Eganand Mody, 1992; Salomon and Shaver, 2005; Bratti and Felice, 2012; Hahn and Park, 2011;Lo Turco and Maggioni, 2012). Foreign owned firms, then, besides being more export andimport intensive, may further benefit from technological spillovers from their headquartersand from the availability of intra-group financial resources (Desai et al., 2004, 2008). Thelatter may offset the negative impact of financial constraints that usually affect firms oper-ating in less developed economies (Gorodnichenko and Schnitzer, 2010). As a consequence,we included firm size and productivity level together with export, import and foreign own-ership status dummies. Furthermore, we included a dummy variable for multi-plant firmsto address any possible externality stemming from their simultaneous presence in differentlocations. The inclusion of the local RCA index value in the new product, RCAl, is aimedto ensure that the local density indicator does not actually capture the extent of local spe-cialisation in that product (Hausmann and Klinger, 2007; Poncet and de Waldemar, 2012;Boschma et al., 2013) instead of the availability of proximate capabilities around the firm’s lo-cal units. Results in columns 7-9 show that, among firm level characteristics included in thebasic specification, only foreign ownership exerts a positive and significant direct effect onthe introduction of new products. Among innovators, foreign firms are more likely to intro-duce a larger number of new products, possibly due to their wide international network andtheir larger knowledge base. The poor performance of other firm level characteristics in pre-dicting the pattern of product innovation may stem from the inclusion of firm fixed effects ina short-panel dataset. Alternatively, it may also indicate that while firm characteristics deter-mine firm propensity to innovate, firm-product specific capabilities especially matter for thechoice of product additions. Furthermore, local specialisation in the product is a significantdeterminant of the firm’s probability to introduce that product in that location. However, theinclusion of this set of controls does not dramatically alter either the size or significance orthe relative importance of our density indicators.
In order to account for and compare the economic magnitude of the effects of local andfirm densities around the new product, taking partial effects in column 9 as a benchmark andthe average density values for innovating and non innovating firm-product groups from Ta-ble 3 above, we calculate the relative importance of firm and local resources for new productintroductions. If the level of densities of non innovators jumped to the values of innovatorsa firm average innovation probability would increase by 0.6 and by 0.1 percentage points be-cause of firm and local density, respectively. These figures respectively imply an increase of34% and 6% in the average innovation rate displayed in Table 1 and hint at the possible higherresponsiveness of innovation to firm internal product specific resources rather than to the lo-cal ones. In the first column of Table 5 we actually confirm this insight. When we smooth thedensity indicators by taking their log, the estimated semi-elasticities imply a larger role forfirm rather than local product-specific capabilities. This finding is confirmed by Figure A.2which shows the relative importance of firm density compared to the total - firm and local- technological proximity in explaining the spatial distribution of firms’ introduction of new
12
products.10 The comparison of Figures A.2 and A.1 suggests that firm product specific capa-bilities could have led the dynamics of industrial production and innovation experienced bylaggard Eastern regions - such as Agrı, Igdır, Hakkari, Van and Erzurum - in the time spanconsidered in our analysis. Local product specific capabilities, instead, emerge as the maindriver of new product introduction for all richer and more industrial regions - such as Ankara,Istanbul, Manisa, Bursa and Konya - as highlighted in the top panel of Figure A.1.In Table 5 also further alternative density indicators are used to check the robustness of thebaseline findings. In column 2 firm local density - such as the local RCA measure - is basedon RCAs calculated as the province product share over the world export share in the prod-uct. This is to account for a possible mis-measurement of provinces’ revealed comparativeadvantage indexes due to the use of Turkish industrial structure as the benchmark for thecomparison of each province production structure. In column 3, we enlarge the scope of lo-cal RCA products by defining a product with RCA when the latter indicator is above 0.5 ratherthan above 1. In column 4, to account for the possible dependence of our density measureson the number of products that firms produce and in which locations own a comparativeadvantage, we normalise them by dividing them by the total number of firm products andthe total number of local RCA products. For the same purpose of checking the robustness ofour preferred technological proximity indicators to any possible scale effect, in column 5 wesubstitute average local and firm proximity for firm and local densities.11 Finally, in column6 the local density indicator is referred to the NUTS 2 region(s) where the firm is active. Allthese changes, which try to account for potential pitfalls of the original density indicators,leave our insights substantially unaltered.
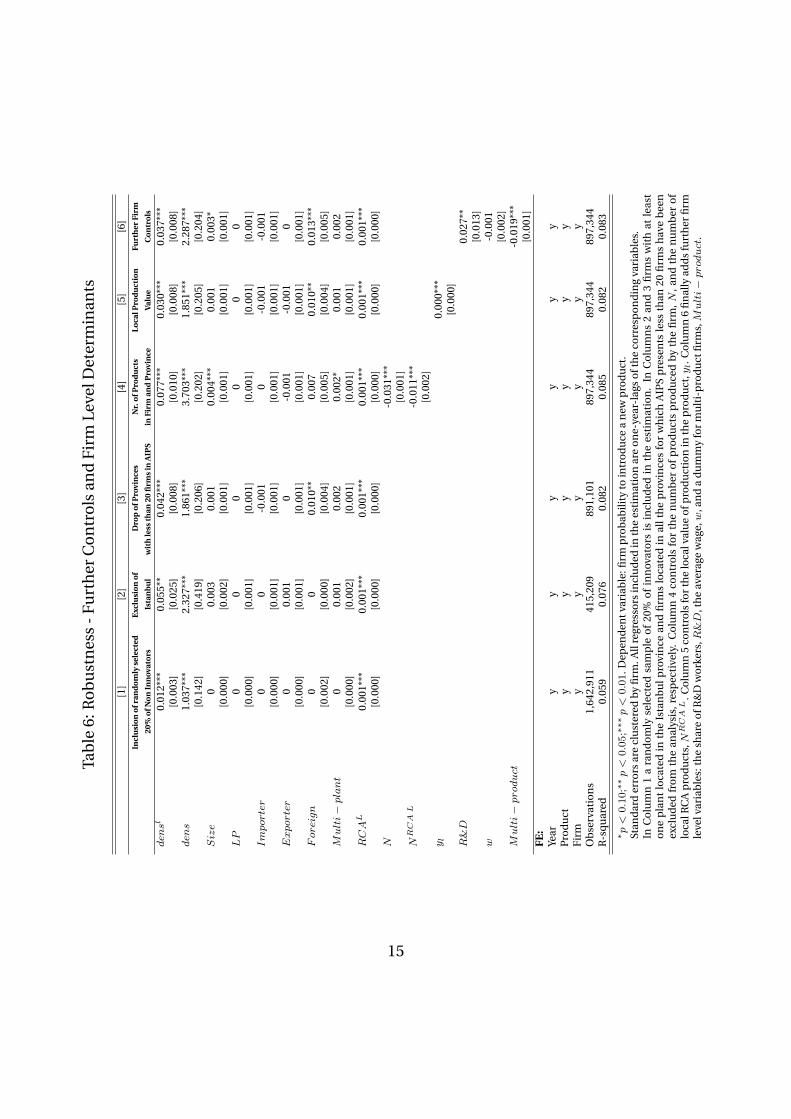
In Table 6 we show some further checks to prove the validity of our baseline results fromTable 4. Firstly, to account for the possible selection bias in our estimates stemming fromthe exclusion of non innovating firms, we randomly select 20% of them from the same twodigit codes where firms in our sample are active and attribute to them the local and firmdensity measures around the products they could potentially introduce. Results in terms ofsignificance and relative importance of the two density measures are unaffected. Secondly,we exclude those firms that have at least one plant located in the Istanbul province fromthe analysis. This is to verify that our findings are not just driven by this province, whichpresents a higher agglomeration of firms and variety of products. Thirdly, to check the va-lidity of our provincial production data aggregated from firm-level information, we excludethose provinces for which we have less than 20 firms in AIPS. The small number of firms usedto reconstruct the production data may indeed lead to poor aggregate production value prox-ies. Fourthly, we include the log of the number of products produced by the firm and the logof the number of products in which the province(s) where the firm unit(s) is(are) located hasa revealed comparative advantage in order to ensure that our firm and local density indicatorare not capturing a scale effect, rather than the availability of suitable firm and local productspecific capabilities.12 Fifthly, we include the local value of production in the product. Finally,we include further observable firm characteristics at our disposal to check that our evidence
10The relative importance of firm density in explaining NUTS 3 region average innovationrates is calculated as α2∗dens
α1∗densl+α2∗dens with coefficientsα1 andα2 taken from column 9 of Table4.
11Instead of computing a density indicator we average the proximity indicator between thepotential product p and each product produced by firm i and products in which the provinceenjoys an RCA.
12For firms located in different provinces we consider the weighted average number ofRCA products across the provinces of localisation.
13
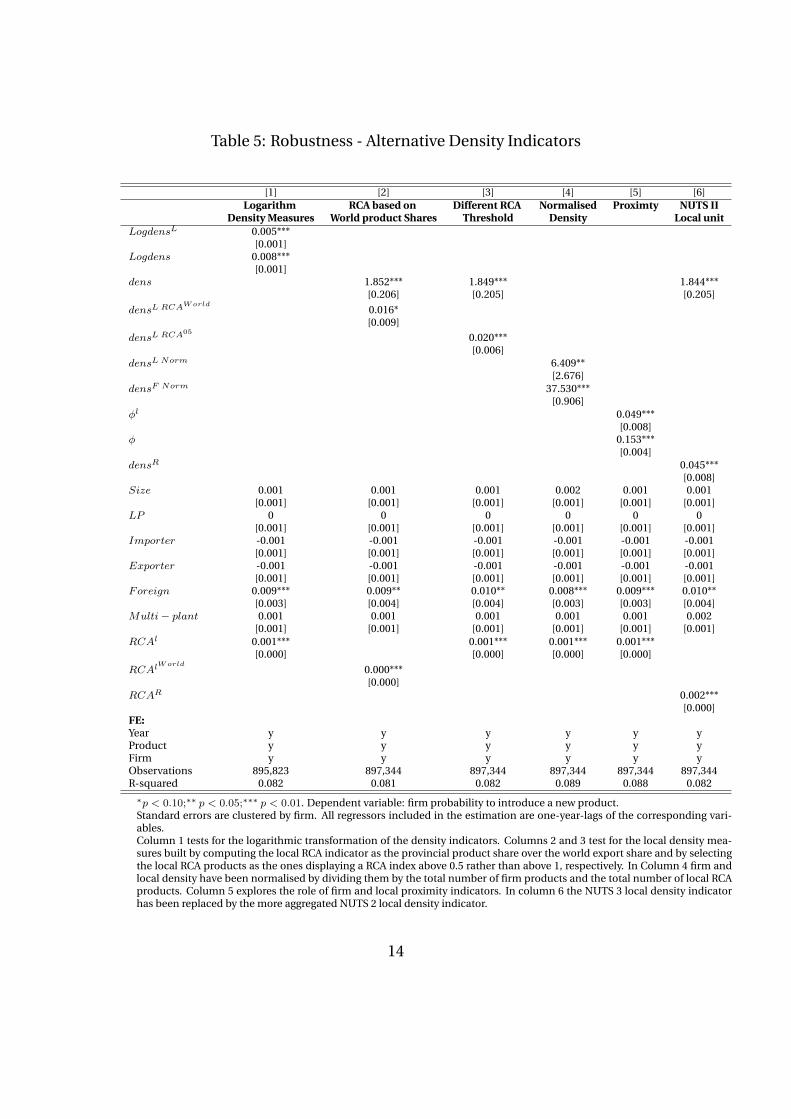
Table 5: Robustness - Alternative Density Indicators
[1] [2] [3] [4] [5] [6]Logarithm RCA based on Different RCA Normalised Proximty NUTS II
Density Measures World product Shares Threshold Density Local unitLogdensL 0.005***
[0.001]Logdens 0.008***
[0.001]dens 1.852*** 1.849*** 1.844***
[0.206] [0.205] [0.205]
densL RCAWorld
0.016*[0.009]
densL RCA05
0.020***[0.006]
densL Norm 6.409**[2.676]
densF Norm 37.530***[0.906]
φl 0.049***[0.008]
φ 0.153***[0.004]
densR 0.045***[0.008]
Size 0.001 0.001 0.001 0.002 0.001 0.001[0.001] [0.001] [0.001] [0.001] [0.001] [0.001]
LP 0 0 0 0 0 0[0.001] [0.001] [0.001] [0.001] [0.001] [0.001]
Importer -0.001 -0.001 -0.001 -0.001 -0.001 -0.001[0.001] [0.001] [0.001] [0.001] [0.001] [0.001]
Exporter -0.001 -0.001 -0.001 -0.001 -0.001 -0.001[0.001] [0.001] [0.001] [0.001] [0.001] [0.001]
Foreign 0.009*** 0.009** 0.010** 0.008*** 0.009*** 0.010**[0.003] [0.004] [0.004] [0.003] [0.003] [0.004]
Multi− plant 0.001 0.001 0.001 0.001 0.001 0.002[0.001] [0.001] [0.001] [0.001] [0.001] [0.001]
RCAl 0.001*** 0.001*** 0.001*** 0.001***[0.000] [0.000] [0.000] [0.000]
RCAlWorld
0.000***[0.000]
RCAR 0.002***[0.000]
FE:Year y y y y y yProduct y y y y y yFirm y y y y y yObservations 895,823 897,344 897,344 897,344 897,344 897,344R-squared 0.082 0.081 0.082 0.089 0.088 0.082
∗p < 0.10;∗∗ p < 0.05;∗∗∗ p < 0.01. Dependent variable: firm probability to introduce a new product.Standard errors are clustered by firm. All regressors included in the estimation are one-year-lags of the corresponding vari-ables.Column 1 tests for the logarithmic transformation of the density indicators. Columns 2 and 3 test for the local density mea-sures built by computing the local RCA indicator as the provincial product share over the world export share and by selectingthe local RCA products as the ones displaying a RCA index above 0.5 rather than above 1, respectively. In Column 4 firm andlocal density have been normalised by dividing them by the total number of firm products and the total number of local RCAproducts. Column 5 explores the role of firm and local proximity indicators. In column 6 the NUTS 3 local density indicatorhas been replaced by the more aggregated NUTS 2 local density indicator.
14
Tab
le6:
Ro
bu
stn
ess
-Fu
rth
erC
on
tro
lsan
dFi
rmLe
velD
eter
min
ants
[1]
[2]
[3]
[4]
[5]
[6]
Incl
usi
on
ofr
and
om
lyse
lect
edE
xclu
sio
no
fD
rop
ofP
rovi
nce
sN
r.o
fPro
du
cts
Lo
calP
rod
uct
ion
Furt
her
Firm
20%
ofN
on
Inn
ovat
ors
Ista
nb
ul
wit
hle
ssth
an20
firm
sin
AIP
Sin
Firm
and
Pro
vin
ceVa
lue
Co
ntr
ols
densl
0.01
2***
0.05
5**
0.04
2***
0.07
7***
0.03
0***
0.03
7***
[0.0
03]
[0.0
25]
[0.0
08]
[0.0
10]
[0.0
08]
[0.0
08]
dens
1.03
7***
2.32
7***
1.86
1***
3.70
3***
1.85
1***
2.28
7***
[0.1
42]
[0.4
19]
[0.2
06]
[0.2
02]
[0.2
05]
[0.2
04]
Size
00.
003
0.00
10.
004*
**0.
001
0.00
3*[0
.000
][0
.002
][0
.001
][0
.001
][0
.001
][0
.001
]LP
00
00
00
[0.0
00]
[0.0
01]
[0.0
01]
[0.0
01]
[0.0
01]
[0.0
01]
Importer
00
-0.0
010
-0.0
01-0
.001
[0.0
00]
[0.0
01]
[0.0
01]
[0.0
01]
[0.0
01]
[0.0
01]
Exporter
00.
001
0-0
.001
-0.0
010
[0.0
00]
[0.0
01]
[0.0
01]
[0.0
01]
[0.0
01]
[0.0
01]
Foreign
00
0.01
0**
0.00
70.
010*
*0.
013*
**[0
.002
][0
.000
][0
.004
][0
.005
][0
.004
][0
.005
]Multi−plant
00.
001
0.00
20.
002*
0.00
10.
002
[0.0
00]
[0.0
02]
[0.0
01]
[0.0
01]
[0.0
01]
[0.0
01]
RCAL
0.00
1***
0.00
1***
0.00
1***
0.00
1***
0.00
1***
0.00
1***
[0.0
00]
[0.0
00]
[0.0
00]
[0.0
00]
[0.0
00]
[0.0
00]
N-0
.031
***
[0.0
01]
NRCAL
-0.0
11**
*[0
.002
]yl
0.00
0***
[0.0
00]
R&D
0.02
7**
[0.0
13]
w-0
.001
[0.0
02]
Multi−product
-0.0
19**
*[0
.001
]F
E:
Year
yy
yy
yy
Pro
du
cty
yy
yy
yFi
rmy
yy
yy
yO
bse
rvat
ion
s1,
642,
911
415,
209
891,
101
897,
344
897,
344
897,
344
R-s
qu
ared
0.05
90.
076
0.08
20.
085
0.08
20.
083
∗p<
0.10;∗
∗p<
0.05;∗
∗∗p<
0.01
.Dep
end
entv
aria
ble
:firm
pro
bab
ility
toin
tro
du
cea
new
pro
du
ct.
Stan
dar
der
rors
are
clu
ster
edb
yfi
rm.A
llre
gres
sors
incl
ud
edin
the
esti
mat
ion
are
on
e-ye
ar-l
ags
oft
he
corr
esp
on
din
gva
riab
les.
InC
olu
mn
1a
ran
do
mly
sele
cted
sam
ple
of
20%
of
inn
ovat
ors
isin
clu
ded
inth
ees
tim
atio
n.
InC
olu
mn
s2
and
3fi
rms
wit
hat
leas
to
ne
pla
nt
loca
ted
inth
eIs
tan
bu
lpro
vin
cean
dfi
rms
loca
ted
inal
lth
ep
rovi
nce
sfo
rw
hic
hA
IPS
pre
sen
tsle
ssth
an20
firm
sh
ave
bee
nex
clu
ded
fro
mth
ean
alys
is,r
esp
ecti
vely
.C
olu
mn
4co
ntr
ols
for
the
nu
mb
ero
fp
rod
uct
sp
rod
uce
db
yth
efi
rm,N
,an
dth
en
um
ber
of
loca
lRC
Ap
rod
uct
s,NRCAL
.Co
lum
n5
con
tro
lsfo
rth
elo
calv
alu
eo
fpro
du
ctio
nin
the
pro
du
ct,yl.
Co
lum
n6
fin
ally
add
sfu
rth
erfi
rmle
velv
aria
ble
s:th
esh
are
ofR
&D
wo
rker
s,R&D
,th
eav
erag
ew
age,w
,an
da
du
mm
yfo
rm
ult
i-p
rod
uct
firm
s,Multi−product
.
15
is not driven by the omission of some further important time-varying firm level characteris-tics possibly driving a firm’s choice of products to add to its product basket. We thus includethe share of R&D workers, the average wage and a dummy for multi-product firms. The latterare found to have a lower propensity to innovate, whereas a higher share of R&D workers ispositively related to a larger extent of product innovation.Our insights are unchanged in all cases.
We further tested the robustness of our findings to alternative sample compositions andmodelling choice and results are shown in Tables A.2-A.3 in the Appendix.The first Table shows results stemming from different sample selection rules. On the onehand, we differently select our sample within our basic conservative definition of new prod-uct as a new HSCPA product within any of the two digits previously produced by the firm.First, in column 1, we randomly select the set of new potential products in order to accountfor the low percentage of product innovations in our sample. We thus repeat our baselineestimation on a subsample obtained by a random draw of 10% of the zero values in order totake into account the low percentage of 1 we have13. Second, in column 2, we restrict theanalysis to the sample of new potential products belonging to the same 2 digit NACE codewhere the firm was already producing to have a homogenous definition of 1s and 0s values.Thus, we discard those products whose production was actually initiated, but whose NACEcode falls outside any of the firm’s 2 digit NACE code. Third, in column 3, we focus on thesample of new potential products belonging to any 2 NACE code where the firm was active,but which do not belong to any 4digit NACE code where the firm was already producing.In all these cases we adopt a narrower diversification definition and nevertheless our mainfindings are unchanged. On the other hand, in columns 4 to 8, we expand the number of pos-sible product choices by considering all of the 1297 possible HCPA products present in ourdatabase as new potential products. In this respect, we also include those products belong-ing to those two digit codes where the firm is not active in firms’ innovation possibilities set(Neffke and Henning, 2013). In this respect, we also consider a more radical definition of in-novation. However, this choice substantially increases the number of potential firm-productcombinations to include in our analysis. Due to computational constraints, we implementthis analysis by year and by selecting the 10% of combinations. This set of results confirmsthe relevance of firm and local technological relatedness for the introduction of new prod-ucts.
Finally, in Table A.3 in the Appendix we present estimates of nonlinear models for thefirm’s product choice. As running a conditional logit for the whole sample was computation-ally unfeasible, we present estimates of a conditional logit model by year in columns 1 to 4.Finally, the significance of our variables of interest is confirmed in logit, rare event logit14 andprobit models.
4.3 Does Firm Heterogeneity shape the role of capabilities?Results from the previous Tables show the importance of the existing firm and local capabili-ties as a driver of firms’ product space evolution. However, they also reveal that firm level het-erogeneity hardly directly affects the choice of which product to introduce. This can be drivenby the introduction of fixed effects in the model with the short time span at our disposal.However, a further possibility is that, rather than exerting a direct effect, firm heterogeneity
13We also tested for different shares of zero observations.14The ReLogit STATA command has been used.
16
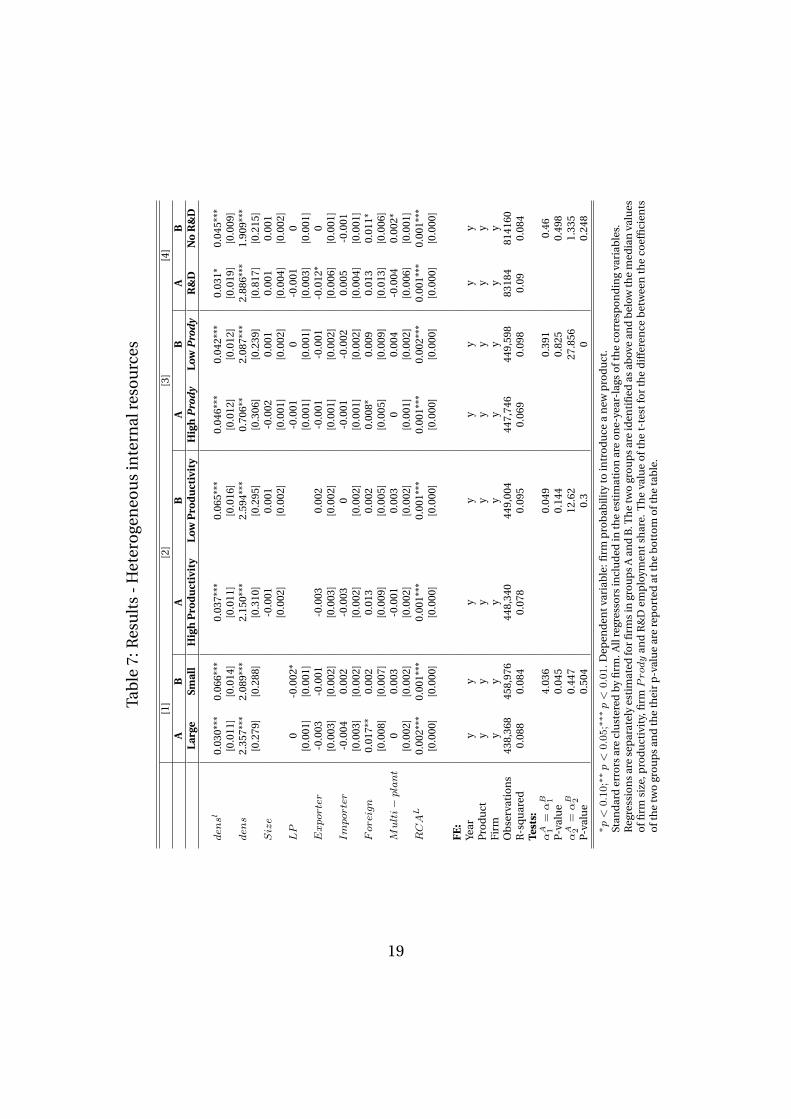
dimensions may act as a mediating factor of local and firm product specific capabilities ab-sorption. The existing set of local capabilities around a product could exert heterogeneouseffects according to different endowment levels of firm internal resources and according tothe extent of diversity of the firm specific environment. On the one hand, as larger, moreproductive, R&D intensive firms and firms producing more sophisticated goods own an im-portant stock of knowledge on their own, their extent of innovation could be less affected bythe local pool of product specific capabilities. They could then be more autonomous in theirinnovation efforts than smaller, less productive and less R&D intensive firms and firms pro-ducing simple goods. On the other hand, internationalised firms such as multi-plant firmsare active in a larger number of diverse domestic, international and more knowledge inten-sive networks - i.e. foreign networks made up of more competitive and productive firms - and,as a consequence, can draw on several pools of different knowledge stocks. Their exposure tomultiple environments reduces the contribution of product specific capabilities available ina particular geographical location to their innovation effort.In a dynamic capabilities perspective, all these firm internal and environmental features al-low firms to better grasp and exploit new opportunities across available technologies andexisting markets (Teece, 2007). Thus, we repeat the estimation in equation 4.2 for differentgroups of firms and we compare small vs large firms, high vs low productivity firms, high vslow product sophistication firms and high vs low R&D employment share firms. Product so-phistication is measured à la Hausmann et al. (2007) by means of the Prody indicator. Finally,to account for heterogeneous environmental exposure of firms we compare multi vs singleplant firms, exporters vs non exporters, regular exporters vs non regular exporters, importersvs non importers, foreign owned vs domestic firms.
Results are shown in Tables 7 and 8 where the last four rows present the Wald test forequality of the density coefficients of the two groups which are compared, group A and groupB.15 Table 7 focuses on heterogeneous effects according to different levels of some specificfirm level characteristics and highlights that the coefficient on the local density is significantlyhigher for smaller than for larger firms. Among the remaining groups no statistically signifi-cant difference emerges in the local density coefficient estimates. Interestingly enough, firmdensity is statistically higher for firms producing less complex products, as the role of firminternal capabilities shrinks when firms are engaged in the production of more sophisticatedgoods. The coefficients estimates for High and LowR&D employment share firms would im-ply a higher return from internal resources for HighR&D firms and a higher return from localresources for the LowR&D ones. These results are in line with the higher ability of HighR&Dfirms to innovate on the bases of their own skills and the greater Low R&D firms’ need of thelocal pool of capabilities to introduce new products. However, possibly due to the low num-ber ofR&D intensive firms in the sample, the differences between the two sets of coefficientsare not statistically significant, possibly due to the small number of firms hiring R&D workersin our sample.
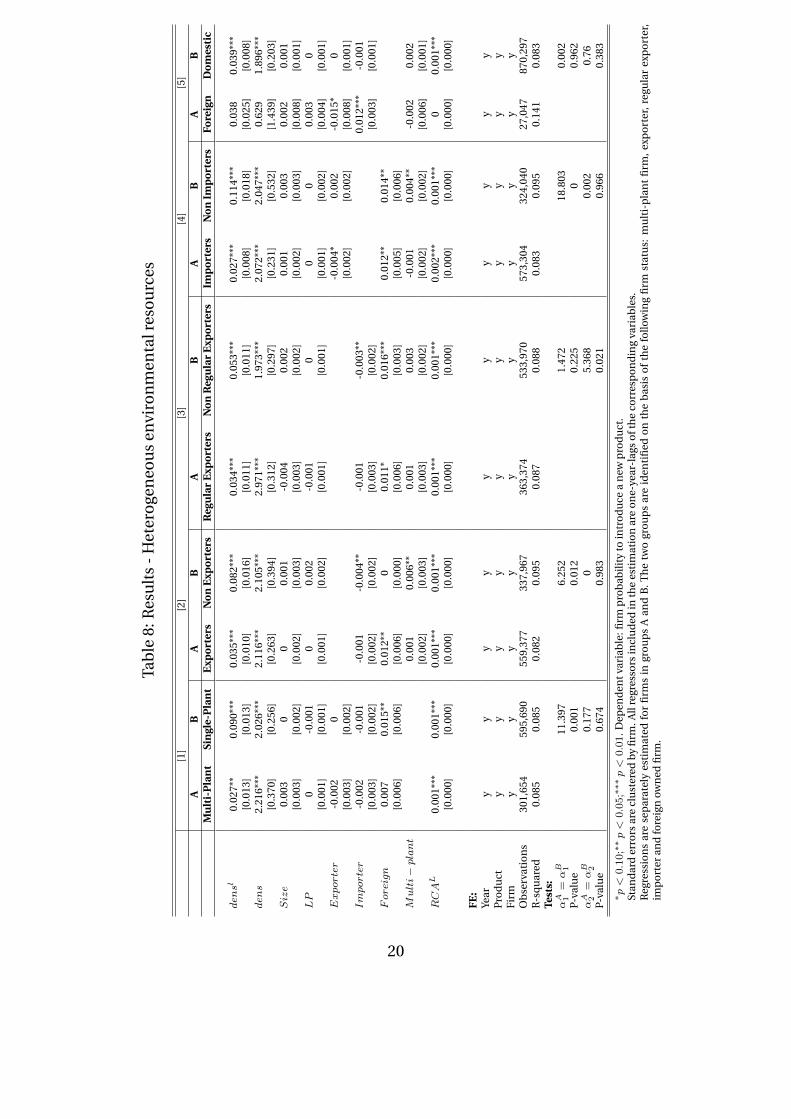
From Table 8, instead, it emerges that the coefficient on local density is statistically signif-icantly lower for multi-plant, exporting and importing firms. As expected, these firms are lessaffected by the local pool of capabilities when introducing a new product. From the Table,an interesting finding concerns regular exporters. Our data, indeed, allows for the identifi-cation of export products that are actually produced by the firm and export products that
15The two groups are defined as above and below the median of the corresponding indi-cator. As an example Large and Small firms are those whose labour units are above/equal orbelow the median of the variable size that identifies the number of employed persons in thefirm.
17

correspond to a pure intermediary activity of the firm. Regular exporters are exporters thatexport at least one of their products. Coefficient estimates imply a higher return from firmcapabilities in terms of innovation for this group of firms compared to non-regular exporters.This result could suggest that higher export embeddedness in the firm productive capabili-ties enhances the acquisition and exploitation of product specific knowledge. Thus, amongexporters, own product exporters are more able to employ their own internal resources toinnovate. Finally, no statistically significant difference emerges between foreign and domes-tic firms, although the coefficients of the two density measures are significant only on thedomestic firms’ sub-sample. This outcome, however, could be driven by the much lowernumber of foreign owned firms in our sample.
18
Tab
le7:
Res
ult
s-
Het
ero
gen
eou
sin
tern
alre
sou
rces
[1]
[2]
[3]
[4]
AB
AB
AB
AB
Lar
geSm
all
Hig
hP
rod
uct
ivit
yL
owP
rod
uct
ivit
yH
igh
Pro
dy
Low
Pro
dy
R&
DN
oR
&D
densl
0.03
0***
0.06
6***
0.03
7***
0.06
5***
0.04
6***
0.04
2***
0.03
1*0.
045*
**[0
.011
][0
.014
][0
.011
][0
.016
][0
.012
][0
.012
][0
.019
][0
.009
]dens
2.35
7***
2.08
9***
2.15
0***
2.59
4***
0.70
6**
2.08
7***
2.88
6***
1.90
9***
[0.2
79]
[0.2
88]
[0.3
10]
[0.2
95]
[0.3
06]
[0.2
39]
[0.8
17]
[0.2
15]
Size
-0.0
010.
001
-0.0
020.
001
0.00
10.
001
[0.0
02]
[0.0
02]
[0.0
01]
[0.0
02]
[0.0
04]
[0.0
02]
LP
0-0
.002
*-0
.001
0-0
.001
0[0
.001
][0
.001
][0
.001
][0
.001
][0
.003
][0
.001
]Exporter
-0.0
03-0
.001
-0.0
030.
002
-0.0
01-0
.001
-0.0
12*
0[0
.003
][0
.002
][0
.003
][0
.002
][0
.001
][0
.002
][0
.006
][0
.001
]Importer
-0.0
040.
002
-0.0
030
-0.0
01-0
.002
0.00
5-0
.001
[0.0
03]
[0.0
02]
[0.0
02]
[0.0
02]
[0.0
01]
[0.0
02]
[0.0
04]
[0.0
01]
Foreign
0.01
7**
0.00
20.
013
0.00
20.
008*
0.00
90.
013
0.01
1*[0
.008
][0
.007
][0
.009
][0
.005
][0
.005
][0
.009
][0
.013
][0
.006
]Multi−plant
00.
003
-0.0
010.
003
00.
004
-0.0
040.
002*
[0.0
02]
[0.0
02]
[0.0
02]
[0.0
02]
[0.0
01]
[0.0
02]
[0.0
06]
[0.0
01]
RCAL
0.00
2***
0.00
1***
0.00
1***
0.00
1***
0.00
1***
0.00
2***
0.00
1***
0.00
1***
[0.0
00]
[0.0
00]
[0.0
00]
[0.0
00]
[0.0
00]
[0.0
00]
[0.0
00]
[0.0
00]
FE
:Ye
ary
yy
yy
yy
yP
rod
uct
yy
yy
yy
yy
Firm
yy
yy
yy
yy
Ob
serv
atio
ns
438,
368
458,
976
448,
340
449,
004
447,
746
449,
598
8318
481
4160
R-s
qu
ared
0.08
80.
084
0.07
80.
095
0.06
90.
098
0.09
0.08
4Te
sts:
αA 1
=αB 1
4.03
60.
049
0.39
10.
46P-
valu
e0.
045
0.14
40.
825
0.49
8αA 2
=αB 2
0.44
712
.62
27.8
561.
335
P-va
lue
0.50
40.
30
0.24
8
∗p<
0.10;∗
∗p<
0.05;∗
∗∗p<
0.01
.Dep
end
entv
aria
ble
:firm
pro
bab
ility
toin
tro
du
cea
new
pro
du
ct.
Stan
dar
der
rors
are
clu
ster
edb
yfi
rm.A
llre
gres
sors
incl
ud
edin
the
esti
mat
ion
are
on
e-ye
ar-l
ags
oft
he
corr
esp
on
din
gva
riab
les.
Reg
ress
ion
sar
ese
par
atel
yes
tim
ated
for
firm
sin
gro
up
sA
and
B.T
he
two
gro
up
sar
eid
enti
fied
asab
ove
and
bel
owth
em
edia
nva
lues
offi
rmsi
ze,p
rod
uct
ivit
y,fi
rmPrody
and
R&
Dem
plo
ymen
tsh
are.
Th
eva
lue
oft
he
t-te
stfo
rth
ed
iffe
ren
ceb
etw
een
the
coef
fici
ents
oft
he
two
gro
up
san
dth
eth
eir
p-v
alu
ear
ere
po
rted
atth
eb
ott
om
oft
he
tab
le.
19
Tab
le8:
Res
ult
s-
Het
ero
gen
eou
sen
viro
nm
enta
lres
ou
rces
[1]
[2]
[3]
[4]
[5]
AB
AB
AB
AB
AB
Mu
lti-
Pla
nt
Sin
gle-
Pla
nt
Exp
ort
ers
No
nE
xpo
rter
sR
egu
lar
Exp
ort
ers
No
nR
egu
lar
Exp
ort
ers
Imp
ort
ers
No
nIm
po
rter
sFo
reig
nD
om
esti
c
densl
0.02
7**
0.09
0***
0.03
5***
0.08
2***
0.03
4***
0.05
3***
0.02
7***
0.11
4***
0.03
80.
039*
**[0
.013
][0
.013
][0
.010
][0
.016
][0
.011
][0
.011
][0
.008
][0
.018
][0
.025
][0
.008
]dens
2.21
6***
2.02
6***
2.11
6***
2.10
5***
2.97
1***
1.97
3***
2.07
2***
2.04
7***
0.62
91.
896*
**[0
.370
][0
.256
][0
.263
][0
.394
][0
.312
][0
.297
][0
.231
][0
.532
][1
.439
][0
.203
]Size
0.00
30
00.
001
-0.0
040.
002
0.00
10.
003
0.00
20.
001
[0.0
03]
[0.0
02]
[0.0
02]
[0.0
03]
[0.0
03]
[0.0
02]
[0.0
02]
[0.0
03]
[0.0
08]
[0.0
01]
LP
0-0
.001
00.
002
-0.0
010
00
0.00
30
[0.0
01]
[0.0
01]
[0.0
01]
[0.0
02]
[0.0
01]
[0.0
01]
[0.0
01]
[0.0
02]
[0.0
04]
[0.0
01]
Exporter
-0.0
020
-0.0
04*
0.00
2-0
.015
*0
[0.0
03]
[0.0
02]
[0.0
02]
[0.0
02]
[0.0
08]
[0.0
01]
Importer
-0.0
02-0
.001
-0.0
01-0
.004
**-0
.001
-0.0
03**
0.01
2***
-0.0
01[0
.003
][0
.002
][0
.002
][0
.002
][0
.003
][0
.002
][0
.003
][0
.001
]Foreign
0.00
70.
015*
*0.
012*
*0
0.01
1*0.
016*
**0.
012*
*0.
014*
*[0
.006
][0
.006
][0
.006
][0
.000
][0
.006
][0
.003
][0
.005
][0
.006
]Multi−plant
0.00
10.
006*
*0.
001
0.00
3-0
.001
0.00
4**
-0.0
020.
002
[0.0
02]
[0.0
03]
[0.0
03]
[0.0
02]
[0.0
02]
[0.0
02]
[0.0
06]
[0.0
01]
RCAL
0.00
1***
0.00
1***
0.00
1***
0.00
1***
0.00
1***
0.00
1***
0.00
2***
0.00
1***
00.
001*
**[0
.000
][0
.000
][0
.000
][0
.000
][0
.000
][0
.000
][0
.000
][0
.000
][0
.000
][0
.000
]
FE
:Ye
ary
yy
yy
yy
yy
yP
rod
uct
yy
yy
yy
yy
yy
Firm
yy
yy
yy
yy
yy
Ob
serv
atio
ns
301,
654
595,
690
559,
377
337,
967
363,
374
533,
970
573,
304
324,
040
27,0
4787
0,29
7R
-sq
uar
ed0.
085
0.08
50.
082
0.09
50.
087
0.08
80.
083
0.09
50.
141
0.08
3Te
sts:
αA 1
=αB 1
11.3
976.
252
1.47
218
.803
0.00
2P-
valu
e0.
001
0.01
20.
225
00.
962
αA 2
=αB 2
0.17
70
5.36
80.
002
0.76
P-va
lue
0.67
40.
983
0.02
10.
966
0.38
3
∗p<
0.10;∗
∗p<
0.05;∗
∗∗p<
0.01
.Dep
end
entv
aria
ble
:firm
pro
bab
ility
toin
tro
du
cea
new
pro
du
ct.
Stan
dar
der
rors
are
clu
ster
edb
yfi
rm.A
llre
gres
sors
incl
ud
edin
the
esti
mat
ion
are
on
e-ye
ar-l
ags
oft
he
corr
esp
on
din
gva
riab
les.
Reg
ress
ion
sar
ese
par
atel
yes
tim
ated
for
firm
sin
gro
up
sA
and
B.T
he
two
gro
up
sar
eid
enti
fied
on
the
bas
iso
fth
efo
llow
ing
firm
stat
us:
mu
lti-
pla
nt
firm
,ex
po
rter
,re
gula
rex
po
rter
,im
po
rter
and
fore
ign
own
edfi
rm.
20
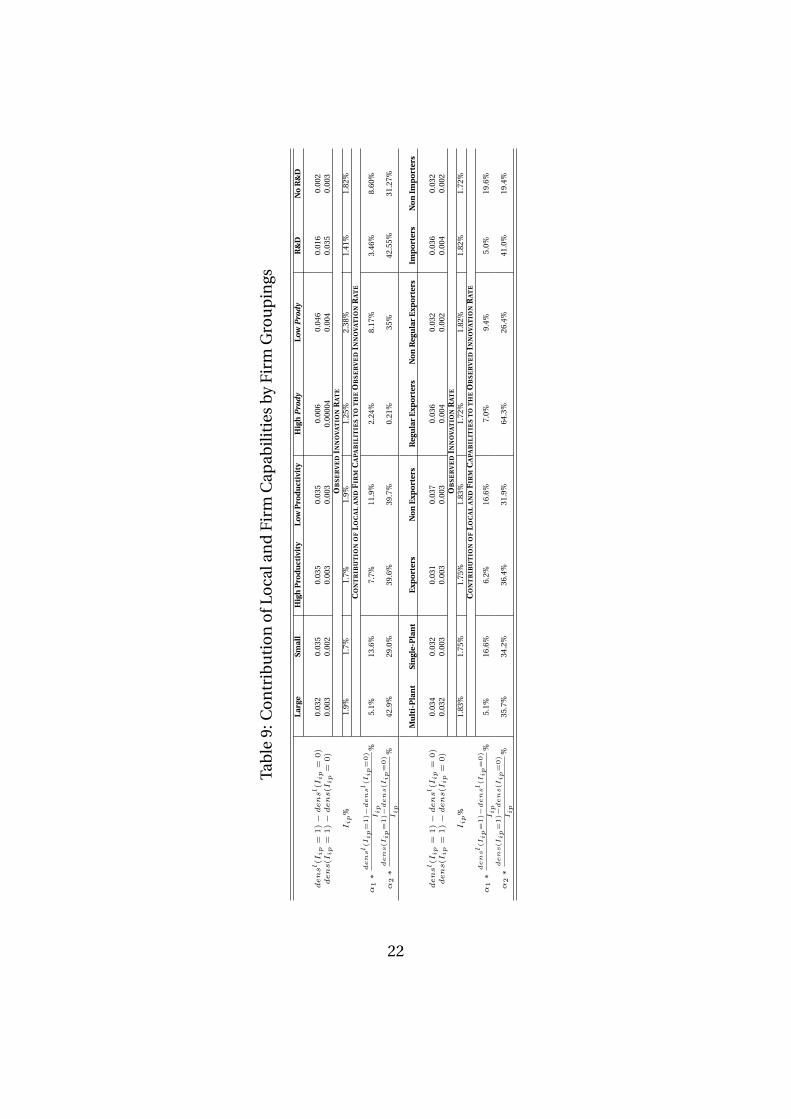
Contribution of local and firm product specific resources to innovation ratesby firm groupings - Table 9 shows back of the envelope calculations to assess whatwould happen to innovation rates in each group of firms if firm and local densities for noninnovating firm-product pairs jumped to the values observed for innovating firm-productpairs.16 Thus we take the observed differences of densities between observations with Iip = 1and observations with Iip = 0, multiply them by the estimated coefficients on local and firmdensities, respectively, and divide them by the group’s observed innovation rate ,Iip%. Thuswe get how much of the observed innovation rate is explained by firm and local product spe-cific capabilities.In line with the previous results concerning different levels of firm internal resources, a higherrelative importance of local capabilities for smaller firms emerges. In addition, we find thatthe contribution of the local environment is much higher, both in absolute and relative terms,for less productive and non R&D intensive firms, regardless of any statistically significant dif-ference in the coefficient estimates. The contribution of the local set of product specific ca-pabilities is much higher for less complex products in absolute terms, although only localresources appear to drive the innovation rate of more complex firm-product pairs.Turning to firm heterogeneity based on firms’ exposure to more or less diverse environments,the Table shows that the local environment particularly affects innovation rates of single plantand non internationalised firms, while firm internal resources,both in absolute and relativeterms, have a much more relevant role for regular exporters and for importers especially.Thus we do find some differences in the observed relative contribution of firm internal re-sources for large, R&D intensive, highly productive, multi-plant and internationalised firms,regardless of the lack of a statistically significant difference in coefficient estimates.
5 ConclusionsThis paper has explored whether and how local and firm product specific capabilities shapefirms’ introduction of new products in the context of the Turkish economy. The empiricalanalysis has revealed a number of interesting facts. Firstly, firms’ product choices are charac-terised by strong path dependence. The availability of internal and local competencies thatare technologically and, thus, cognitively proximate to those required for the new product in-deed explain the product scope evolution of innovators. Secondly, we find that firm internalresources are more relevant than the local set of available product specific knowledge in theprocess of new product choice. Thirdly, firm heterogeneity acts as a mediating factor of theimpact of firm and local product specific capabilities. Firm size and international exposureplay a role in relaxing ties with the local environment for a given level of firm internal productspecific resources, while firm regular export activity and low production complexity enhancethe role of firm product competencies for a given level of local product specific capabilities.All this evidence thus suggests that the positive industrial output dynamics experienced byEastern regions is mainly driven by firm internal product specific resources. Product inno-vation in more advanced regions, instead, rests more on local competencies, possibly due tolocal firms’ involvement in relatively more complex productions which importantly hinge onthe availability of a wide and thick pool of diverse knowledge.
Compared to existing related literature, our analysis, therefore, extends the importanceof product relatedness and cognitive proximity from the export performance of firms and
16For convenience of exposition, we omit calculations for the subgroups of domestic andforeign firms, as no significant difference actually emerged in the previous Table.
21
Tab
le9:
Co
ntr
ibu
tio
no
fLo
cala
nd
Firm
Cap
abili
ties
by
Firm
Gro
up
ings
Lar
geSm
all
Hig
hP
rod
uct
ivit
yL
owP
rod
uct
ivit
yH
igh
Pro
dy
Low
Pro
dy
R&
DN
oR
&D
densl(I
ip
=1)−densl(I
ip
=0)
0.03
20.
035
0.03
50.
035
0.00
60.
046
0.01
60.
002
dens(I
ip
=1)−dens(I
ip
=0)
0.00
30.
002
0.00
30.
003
0.00
004
0.00
40.
035
0.00
3O
BS
ER
VE
DIN
NO
VA
TIO
NR
AT
E
Iip
%1.
9%1.
7%1.
7%1.
9%1.
25%
2.38
%1.
41%
1.82
%C
ON
TR
IBU
TIO
NO
FL
OC
AL
AN
DF
IRM
CA
PA
BIL
ITIE
ST
OT
HE
OB
SE
RV
ED
INN
OV
AT
ION
RA
TE
α1∗
densl(Iip=
1)−
densl(Iip=
0)
Iip
%5.
1%13
.6%
7.7%
11.9
%2.
24%
8.17
%3.
46%
8.60
%
α2∗
dens(Iip=
1)−
dens(Iip=
0)
Iip
%42
.9%
29.0
%39
.6%
39.7
%0.
21%
35%
42.5
5%31
.27%
Mu
lti-
Pla
nt
Sin
gle-
Pla
nt
Exp
ort
ers
No
nE
xpo
rter
sR
egu
lar
Exp
ort
ers
No
nR
egu
lar
Exp
ort
ers
Imp
ort
ers
No
nIm
po
rter
s
densl(I
ip
=1)−densl(I
ip
=0)
0.03
40.
032
0.03
10.
037
0.03
60.
032
0.03
60.
032
dens(I
ip
=1)−dens(I
ip
=0)
0.03
20.
003
0.00
30.
003
0.00
40.
002
0.00
40.
002
OB
SE
RV
ED
INN
OV
AT
ION
RA
TE
Iip
%1.
83%
1.75
%1.
75%
1.83
%1.
72%
1.82
%1.
82%
1.72
%C
ON
TR
IBU
TIO
NO
FL
OC
AL
AN
DF
IRM
CA
PA
BIL
ITIE
ST
OT
HE
OB
SE
RV
ED
INN
OV
AT
ION
RA
TE
α1∗
densl(Iip=
1)−
densl(Iip=
0)
Iip
%5.
1%16
.6%
6.2%
16.6
%7.
0%9.
4%5.
0%19
.6%
α2∗
dens(Iip=
1)−
dens(Iip=
0)
Iip
%35
.7%
34.2
%36
.4%
31.9
%64
.3%
26.4
%41
.0%
19.4
%
22

regions to firm innovation activity and confirms that studying firm innovation patterns re-quires taking into account firm internal resources, besides the role of the local endowment ofrelated product specific capabilities. Nonetheless, our work clarifies that the local productionstructure importantly shapes the performance of “weaker” firms.
Some policy implications spring from our work. On the one hand, the evidence on pathdependence supports ongoing policy actions in favour of the cluster formation around newproducts to engender local industrial development. On the other hand, policy makers shouldsustain firm growth and international activities that can lead to higher innovation rates andfavour a break with the dependence on historical local specialisation and thus promote re-gional production diversification.
23
ReferencesArrow, K., 1962. The economic implications of learning by doing. Review of Economic Studies
29, 155–173.
Arthur, W.B., 1989. Competing technologies, increasing returns, and lock-in by historicalevents. The Economic Journal 99, 116–131.
Audretsch, D.B., Feldman, M.P., 2004. Knowledge spillovers and the geography of innovation,in: Henderson, J.V., Thisse, J.F. (Eds.), Handbook of Regional and Urban Economics. Else-vier. volume 4 of Handbook of Regional and Urban Economics. chapter 61, pp. 2713–2739.
Autant-Bernard, C., 2001. The geography of knowledge spillovers and technological proxim-ity. Economics of Innovation and New Technology 10, 237–254.
Baldwin, C., von Hippel, E., 2011. Modeling a paradigm shift: From producer innovation touser and open collaborative innovation. Organization Science 22.
Baptista, R., Swann, P., 1998. Do firms in clusters innovate more? Research Policy 27, 525–540.
Beck, T., Demirguc-Kunt, A., Laeven, L., Levine, R., 2008. Finance, firm size, and growth.Journal of Money, Credit and Banking 40, 1379–1405.
Beck, T., Demirguc-Kunt, A., Maksimovic, V., 2005. Financial and legal constraints to growth:Does firm size matter? Journal of Finance 60, 137–177.
Bernard, A., Redding, S., Schott, P., 2011. Multi-product firms and trade liberalization. TheQuarterly Journal of Economics 126, 1271–1318.
Beugelsdijk, S., 2007. The regional environment and a firm’s innovative performance: A pleafor a multilevel interactionist approach. Economic Geography 83, 181–199.
Boggs, J.S., Rantisi, N., 2003. The “relational turn” in economic geography. Journal of Eco-nomic Geography 3, 109–116.
Boschma, R., 2005. Proximity and innovation: A critical assessment. Regional Studies 39,61–74.
Boschma, R., Frenken, K., 2006. Why is economic geography not an evolutionary science?towards an evolutionary economic geography. Journal of Economic Geography 6, 273–302.
Boschma, R., Frenken, K., 2011. Technological relatedness and regional branching, in:Bathelt, H., Feldman, M., Kogler, D. (Eds.), In Beyond Territory: Dynamic Geographies ofKnowledge Creation and Innovation. Routledge, Taylor and Francis.
Boschma, R., Iammarino, S., 2009. Related varieties, trade linkages,and regional growth initaly. Economic Geography 85, 289–311.
Boschma, R., Minondo, A., Navarro, M., 2012. Related variety and regional growth in spain.Papers in Regional Science 91, 241–256.
24
Boschma, R., Minondo, A., Navarro, M., 2013. he emergence of new industries at the regionallevel in spain: A proximity approach based on product relatedness. Economic Geography89, 29–51.
Bratti, M., Felice, G., 2012. Are exporters more likely to introduce product innovations? TheWorld Economy 35.
Breschi, S., Lissoni, F., 2001. Localised knowledge spillovers vs. innovative milieux: Knowl-edge "tacitness" reconsidered. Papers in Regional Science 80, 255–273.
Breschi, S., Lissoni, F., 2009. Mobility of skilled workers and co-invention networks: ananatomy of localized knowledge flows. Journal of Economic Geography 9, 439–468.
Breschi, S., Lissoni, F., Malerba, F., 2003. Knowledge-relatedness in firm technological diver-sification. Research Policy 32, 69–87.
Bryce, D., Winter, S., 2009. A general inter-industry relatedness index. Management Science55, 1570–1585.
Colantone, I., Crinò, R., 2013. New imported inputs, new domestic products. Journal ofInternational Economics forthcoming .
Danneels, E., 2002. The dynamics of product innovation and firm competences. StrategicManagement Journal 23, 1095–1121.
David, P., 1985. Clio and the economics of qwerty. The American Economic Review 75, 332–337.
Desai, M.A., Foley, C.F., Forbes, K., 2008. Financial constraints and growth: Multinational andlocal firm responses to currency depreciations. Review of Financial Studies 21, 2857–2888.
Desai, M.A., Foley, C.F., Hines, J.R., 2004. A multinational perspective on capital structurechoice and internal capital markets. The Journal of Finance 59, 2451–2487.
Dosi, G., 2011. The nature of the innovative process, in: Dosi, G., e.a. (Ed.), Technical Changeand Economic Theory. Pinter Publishers, London.
Egan, M.L., Mody, A., 1992. Buyer-seller links in export development. World Development20, 321–334.
Fan, J.P.H., Lang, L.H.P., 2000. The measurement of relatedness: An application to corporatediversification. The Journal of Business 73, 629–660.
Feldman, M., 1994. The Geography of Innovation. Kluwer Academic Publishers, Dordrecht.
Felipe, J., Kumar, U., Abdon, A., Bacate, M., 2012. Product complexity and economic devel-opment. Structural Change and Economic Dynamics 23, 36 – 68.
Frenken, K., Van Oort, F., Verburg, T., 2007. Related variety, unrelated variety and regionaleconomic growth. Regional Studies 41, 685–697.
Gaulier, G., Zignago, S., 2010. BACI: International Trade Database at the Product-Level. The1994-2007 Version. Working Paper, 2010-23. CEPII.
25

Gertler, M.S., 2003. Tacit knowledge and the economic geography of context, or the undefin-able tacitness of being (there). Journal of Economic Geography 3, 75–99.
Goh, A.T., 2005. Knowledge diffusion, input supplier’s technological effort and technologytransfer via vertical relationships. Journal of International Economics 66, 527–540.
Goldberg, P., Khandelwal, A., Pavcnik, N., Topalova, P., 2009. Trade liberalization and newimported inputs. American Economic Review 99, 494–500.
Gorodnichenko, Y., Schnitzer, M., 2010. Financial constraints and innovation: Why poorcountries don’t catch up. NBER Working Papers 15792. National Bureau of Economic Re-search.
Granovetter, M., 1973. The strength of weak ties. American Journal of Sociology 78, 1360–1380.
Grossman, G.M., Helpman, E., 1993. Innovation and Growth in the Global Economy. volume 1of MIT Press Books. The MIT Press.
Hahn, C.H., Park, C.G., 2011. Direction of causality in innovation-exporting linkage: evidencefrom microdata on korean manufacturing. Korea and the World Economy 12, 367–398.
Hausmann, R., Hidalgo, C., 2011. The network structure of economic output. Journal ofEconomic Growth 16, 309–342.
Hausmann, R., Hidalgo, C.A., 2009. The building blocks of economic complexity. Proc. Natl.Acad. Sci. 106, 10570–10575.
Hausmann, R., Hwang, J., Rodrik, D., 2007. What you export matters. Journal of EconomicGrowth 12, 1–25.
Hausmann, R., Klinger, B., 2007. The structure of the product space and the evolution ofcomparative advantage. Working Paper 146. Center for International Development, Har-vard University.
Hidalgo, C., 2009. The dynamics of economic complexity and the product space over a 42 yearperiod. Working Papers 189. Center for International Development, Harvard University.
Hidalgo, C.A., Klinger, B., A., Barabasi, L., Hausmann, R., 2007. The product space conditionsthe development of nations. Science 317, 482–487.
Howells, J., 2012. The geography of knowledge: never so close but never so apart. Journal ofEconomic Geography 12, 1003–1020.
Jaffe, A.B., Trajtenberg, M., Henderson, R., 1993. Geographic localization of knowledgespillovers as evidenced by patent citations. The Quarterly Journal of Economics 108, 577–98.
Krishnan, V., Ulrich, K.T., 2001. Product development decisions: A review of the literature.Management Science 47, 1–21.
26
Lo Turco, A., Maggioni, D., 2012. Imports, exports and the firm product scope: evidencefrom Turkey. Working Papers 384. Universita’ Politecnica delle Marche (I), Dipartimento diScienze Economiche e Sociali.
Lundvall, B., Johnson, B., 1994. The learning economy. Journal of Industry Studies 1, 23–42.
Maskell, P., Malmberg, A., 1999. Localised learning and industrial competitiveness. Cam-bridge Journal of Economics 23, 167–186.
Melitz, M., Burstein, A., forthcoming. Trade liberalization and firm dynamics, in: Faini, R.,de Melo, J., Zimmermann, K.F. (Eds.), In Advances in Economics and Econometrics: The-ory and Applications. Econometric Society Monographs.
Neffke, F., Henning, M., 2013. Skill relatedness and firm diversification. Strategic Manage-ment Journal 34, 297–316.
Neffke, F., Henning, M., Boschma, R., 2011. How do regions diversify over time? industryrelatedness and the development of new growth paths in regions. Economic Geography87, 237–265.
Neffke, F., Henning, M.S., 2008. Revealed Relatedness: Mapping Industry Space. Papers inEvolutionary Economic Geography (PEEG) 0819. Utrecht University, Section of EconomicGeography.
Orlando, M., 2000. On the importance of geographic and technological proximity for R&Dspillovers : an empirical investigation. Research Working Paper RWP 00-02. Federal Re-serve Bank of Kansas City.
Penrose, E., 1959. The Theory of the Growth of the Firm. New York: John Wiley.
Perez, C., Soete, L., 1988. Catching up in technology: entry barriers and windows of opportu-nity, in: et al., D. (Ed.), Technical Change and Economic Theory. Francis Pinter, London.
Pfirrmann, O., 1994. The geography of innovation in small and medium-sized firms in westgermany. Small Business Economics 6, 41–54.
Poncet, S., de Waldemar, F.S., 2012. Product relatedness and firm exports in China. WorkingPapers 2012-27. CEPII research center.
Porter, M., 2003. The economic performance of regions. Regional Studies 37, 545–546.
Romer, P., 1986a. Endogenous technological change. Journal of Political Economy 98, S71–102.
Romer, P., 1986b. Increasing returns and long-run growth. Journal of Political Economy 94,1002–1037.
Salomon, R.M., Shaver, M.J., 2005. Learning by exporting: New insights from examining firminnovation. Journal of Economics & Management Strategy 14, 431–460.
Sternberg, R., Arndt, O., 2001. The firm or the region: What determines the innovation be-havior of european firms. Economic Geography 77, 364–382.
27

Teece, D., 2007. Explicating dynamic capabilities: the nature and microfoundations of (sus-tainable) enterprise performance. Strategic Management Journal 28, 1319–1350.
Teece, D., Rumelt, R., Dosi, G., Winter, S., 1994. Understanding corporate coherence: Theoryand evidence. Journal of Economic Behavior and Organization 23, 1–30.
Wang, C.C., Lin, G., 2012. Dynamics of innovation in a globalizing china: regional environ-ment, inter-firm relations and firm attributes. Journal of Economic Geography 13, 397–418.
Wooldridge, J., 2002. Econometric analysis of cross-section and panel data. MIT Press .
28

Appendix
A Additional Tables
Table A.1: Variables Definition and Description
Variable DescriptionSize firm size measured as the log of the number of employeesLP labour productivity measured as the log of real value added per workerExporter exporter dummy equal to 1 if the firm exports in that year and 0 otherwiseImporter importer dummy equal to 1 if the firm imports and 0 otherwiseForeign foreign ownership dummy equal to 1 if the firm is foreign ownedMulti− plant multi-plant dummy equal to 1 if the firm has more than one production unit and 0 otherwiseR&D share ofR&D workers in total employmentw log of average wage, calculated as the log of the total wage bill over number of employeesMulti− product multi-product dummy equal to 1 if the firm produces more than one product and 0 otherwise
RCAl RCA index. For each product is calculated as
ypl∑Nj=1
yjl∑Ll=1
ypl∑Ll=1
∑Nj=1
yjl
where in the formula L is the total number of NUTS3 provinces in the Turkish economy, and y denotesthe value of production
N log of the number of products produced by the firmNRCA l log of the number of products with RCA in the province(s) where the firm is activeLogdens log of density indicator described in equation 1Logdensl log of density indicator described in equation 2yl log of average local production value in the product calculated as:
Logyl = Log[∑Lil=1 slypl] with
∑Lil=1 sl = 1 ∀i
densl RCAWorld
local density measure calculated as in equation 2, but with
the set of RCA products selected on the basis ofRCA =
ypl∑Nj=1
yjl
WorldExportspTotalWorldExports
densl RCA05
average local density measure calculated as in equation 2, but withthe set of RCA products selected on the basis ofRCA > 0.5
densNorm firm density measure from equation 1 divided by the total number ofproducts that the firm produces
densl Norm average local density measure where local densities in equation 2 aredivided by the number of RCA products in each NUTS 3 Province
densR average local density measure calculated in equation 2on the basis of NUTS 2 regions locations
RCAR RCA index. For each product is calculated as
ypr∑Nj=1
yjr∑Rr=1 ypr∑R
r=1∑N
j=1yjr
where in the formulaR is the total number of NUTS2 regions in the Turkish economy, and y denotesthe value of production
29
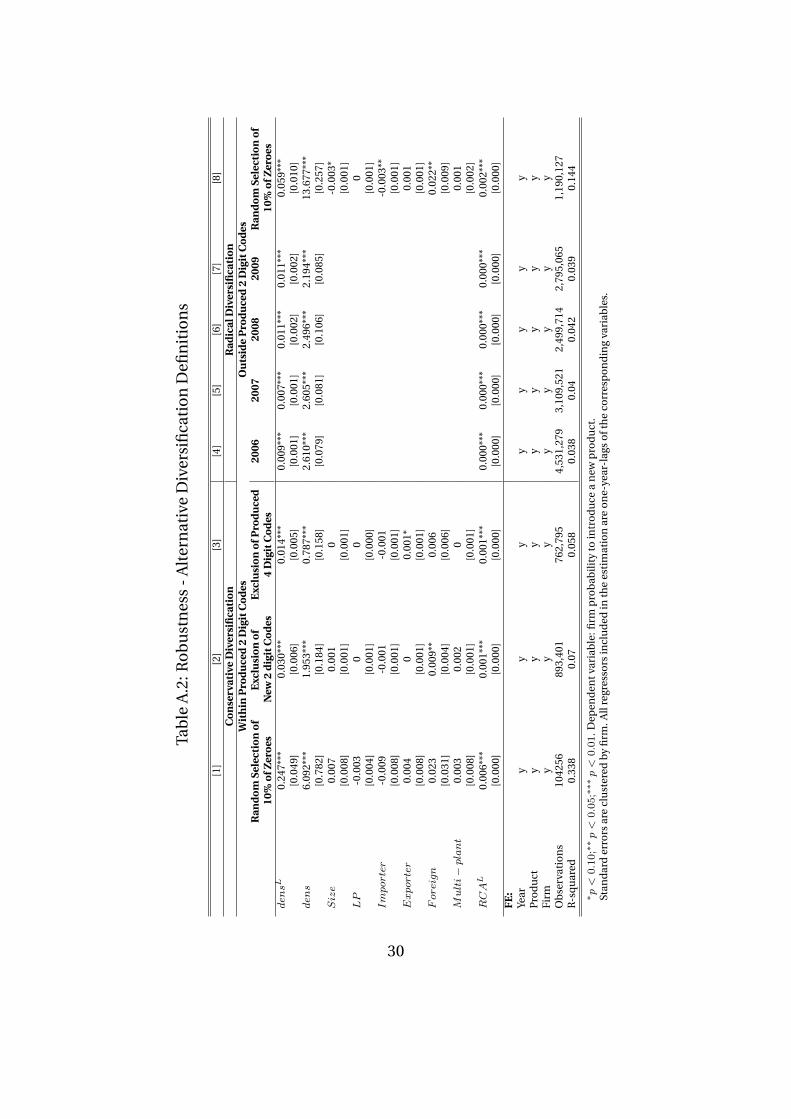
Tab
leA
.2:R
ob
ust
nes
s-
Alt
ern
ativ
eD
iver
sifi
cati
on
Defi
nit
ion
s
[1]
[2]
[3]
[4]
[5]
[6]
[7]
[8]
Co
nse
rvat
ive
Div
ersi
fica
tio
nR
adic
alD
iver
sifi
cati
on
Wit
hin
Pro
du
ced
2D
igit
Co
des
Ou
tsid
eP
rod
uce
d2
Dig
itC
od
esR
and
om
Sele
ctio
no
fE
xclu
sio
no
fE
xclu
sio
no
fPro
du
ced
2006
2007
2008
2009
Ran
do
mSe
lect
ion
of
10%
ofZ
ero
esN
ew2
dig
itC
od
es4
Dig
itC
od
es10
%o
fZer
oes
densL
0.24
7***
0.03
0***
0.01
4***
0.00
9***
0.00
7***
0.01
1***
0.01
1***
0.05
9***
[0.0
49]
[0.0
06]
[0.0
05]
[0.0
01]
[0.0
01]
[0.0
02]
[0.0
02]
[0.0
10]
dens
6.09
2***
1.95
3***
0.78
7***
2.61
0***
2.60
5***
2.49
6***
2.19
4***
13.6
77**
*[0
.782
][0
.184
][0
.158
][0
.079
][0
.081
][0
.106
][0
.085
][0
.257
]Size
0.00
70.
001
0-0
.003
*[0
.008
][0
.001
][0
.001
][0
.001
]LP
-0.0
030
00
[0.0
04]
[0.0
01]
[0.0
00]
[0.0
01]
Importer
-0.0
09-0
.001
-0.0
01-0
.003
**[0
.008
][0
.001
][0
.001
][0
.001
]Exporter
0.00
40
0.00
1*0.
001
[0.0
08]
[0.0
01]
[0.0
01]
[0.0
01]
Foreign
0.02
30.
009*
*0.
006
0.02
2**
[0.0
31]
[0.0
04]
[0.0
06]
[0.0
09]
Multi−plant
0.00
30.
002
00.
001
[0.0
08]
[0.0
01]
[0.0
01]
[0.0
02]
RCAL
0.00
6***
0.00
1***
0.00
1***
0.00
0***
0.00
0***
0.00
0***
0.00
0***
0.00
2***
[0.0
00]
[0.0
00]
[0.0
00]
[0.0
00]
[0.0
00]
[0.0
00]
[0.0
00]
[0.0
00]
FE
:Ye
ary
yy
yy
yy
yP
rod
uct
yy
yy
yy
yy
Firm
yy
yy
yy
yy
Ob
serv
atio
ns
1042
5689
3,40
176
2,79
54,
531,
279
3,10
9,52
12,
499,
714
2,79
5,06
51,
190,
127
R-s
qu
ared
0.33
80.
070.
058
0.03
80.
040.
042
0.03
90.
144
∗p<
0.10;∗
∗p<
0.05;∗
∗∗p<
0.01
.Dep
end
entv
aria
ble
:firm
pro
bab
ility
toin
tro
du
cea
new
pro
du
ct.
Stan
dar
der
rors
are
clu
ster
edb
yfi
rm.A
llre
gres
sors
incl
ud
edin
the
esti
mat
ion
are
on
e-ye
ar-l
ags
oft
he
corr
esp
on
din
gva
riab
les.
30
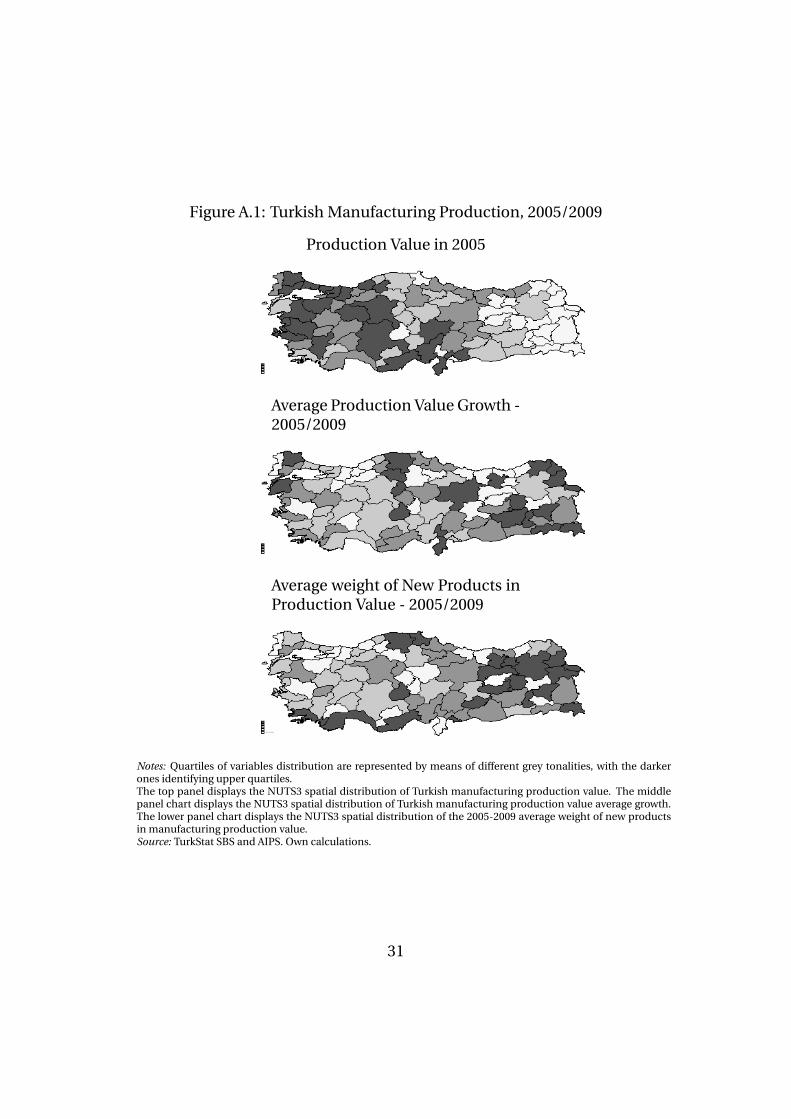
Figure A.1: Turkish Manufacturing Production, 2005/2009
Production Value in 2005
Average Production Value Growth -2005/2009
Average weight of New Products inProduction Value - 2005/2009
Notes: Quartiles of variables distribution are represented by means of different grey tonalities, with the darkerones identifying upper quartiles.The top panel displays the NUTS3 spatial distribution of Turkish manufacturing production value. The middlepanel chart displays the NUTS3 spatial distribution of Turkish manufacturing production value average growth.The lower panel chart displays the NUTS3 spatial distribution of the 2005-2009 average weight of new productsin manufacturing production value.Source: TurkStat SBS and AIPS. Own calculations.
31
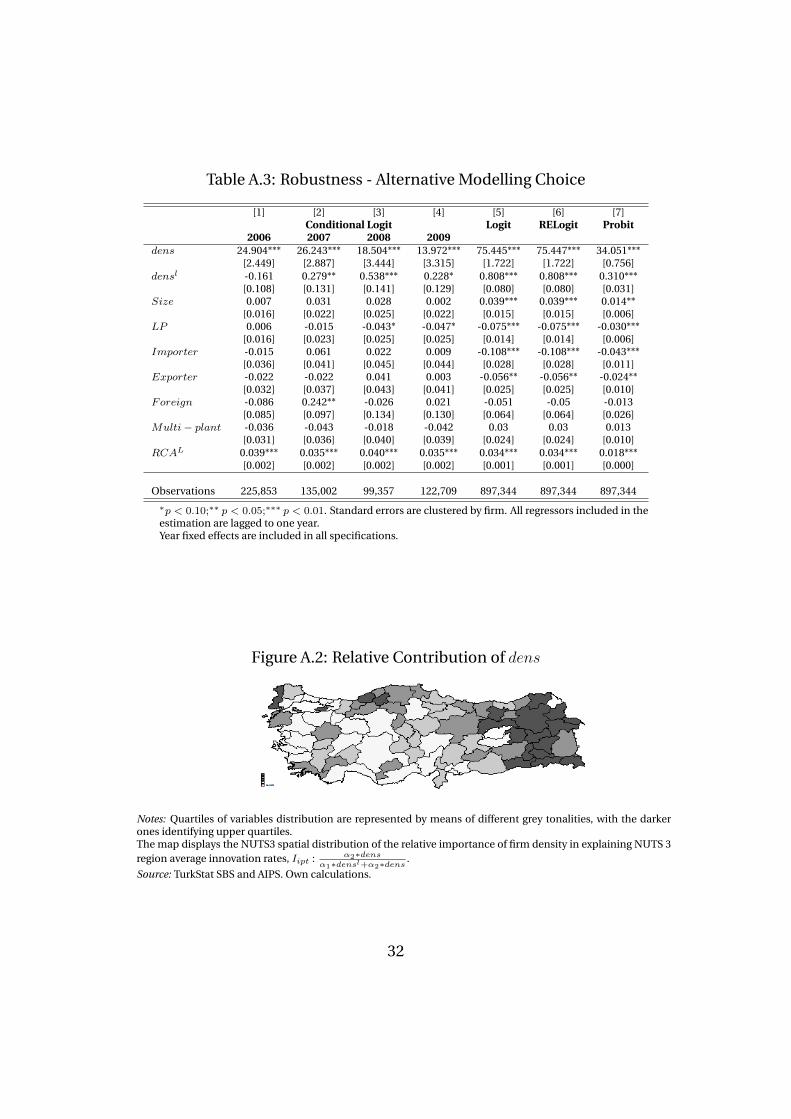
Table A.3: Robustness - Alternative Modelling Choice
[1] [2] [3] [4] [5] [6] [7]Conditional Logit Logit RELogit Probit
2006 2007 2008 2009dens 24.904*** 26.243*** 18.504*** 13.972*** 75.445*** 75.447*** 34.051***
[2.449] [2.887] [3.444] [3.315] [1.722] [1.722] [0.756]densl -0.161 0.279** 0.538*** 0.228* 0.808*** 0.808*** 0.310***
[0.108] [0.131] [0.141] [0.129] [0.080] [0.080] [0.031]Size 0.007 0.031 0.028 0.002 0.039*** 0.039*** 0.014**
[0.016] [0.022] [0.025] [0.022] [0.015] [0.015] [0.006]LP 0.006 -0.015 -0.043* -0.047* -0.075*** -0.075*** -0.030***
[0.016] [0.023] [0.025] [0.025] [0.014] [0.014] [0.006]Importer -0.015 0.061 0.022 0.009 -0.108*** -0.108*** -0.043***
[0.036] [0.041] [0.045] [0.044] [0.028] [0.028] [0.011]Exporter -0.022 -0.022 0.041 0.003 -0.056** -0.056** -0.024**
[0.032] [0.037] [0.043] [0.041] [0.025] [0.025] [0.010]Foreign -0.086 0.242** -0.026 0.021 -0.051 -0.05 -0.013
[0.085] [0.097] [0.134] [0.130] [0.064] [0.064] [0.026]Multi− plant -0.036 -0.043 -0.018 -0.042 0.03 0.03 0.013
[0.031] [0.036] [0.040] [0.039] [0.024] [0.024] [0.010]RCAL 0.039*** 0.035*** 0.040*** 0.035*** 0.034*** 0.034*** 0.018***
[0.002] [0.002] [0.002] [0.002] [0.001] [0.001] [0.000]
Observations 225,853 135,002 99,357 122,709 897,344 897,344 897,344
∗p < 0.10;∗∗ p < 0.05;∗∗∗ p < 0.01. Standard errors are clustered by firm. All regressors included in theestimation are lagged to one year.Year fixed effects are included in all specifications.
Figure A.2: Relative Contribution of dens
Notes: Quartiles of variables distribution are represented by means of different grey tonalities, with the darkerones identifying upper quartiles.The map displays the NUTS3 spatial distribution of the relative importance of firm density in explaining NUTS 3region average innovation rates, Iipt : α2∗dens
α1∗densl+α2∗dens.
Source: TurkStat SBS and AIPS. Own calculations.
32