Embed Size (px)
Citation preview

U ACCESS (IRELAND) UCITS PLC (An open-ended umbrella investments company
with variable capital and segregated liability between sub-funds)
UNAUDITED SEMI-ANNUAL REPORT
FOR THE SIX MONTH PERIOD ENDED 30 JUNE 2017

U ACCESS (IRELAND) UCITS PLC
CONTENTS
1
General Information 2
Investment Manager’s Report 4
Statement of Financial Position 5
Statement of Comprehensive Income 7
Statement of Changes in Net Assets Attributable to Holders of Redeemable Shares 9
Statement of Cash Flows 12
Notes to Financial Statements 14
Statement of Significant Purchases and Sales 42
Schedule of Investments 46
Securities Financing Transactions Regulation 2016 56

U ACCESS (IRELAND) UCITS PLC
GENERAL INFORMATION
2
Directors Syl O’Byrne (Irish) Bryan Tiernan (Irish)1 Patrick Palffy(French) Rémy Portes (French)
Registered Office 2nd Floor, Block E Iveagh Court Harcourt Road Dublin 2 Ireland
All Directors are non-executive. 1 Independent Director
Principal Investment Manager Union Bancaire Privée, UBP SA Rue du Rhône 96-98 - CP 1320 CH-1211 Geneva 1 Switzerland
Manager Carne Global Fund Managers (Ireland) Limited 2nd Floor, Block E Iveagh Court Harcourt Road Dublin 2 Ireland
Depositary BNY Mellon Trust Company (Ireland) Limited Guild House Guild Street IFSC Dublin 1 Ireland
Administrator, Registrar & Transfer Agent BNY Mellon Fund Services (Ireland) Designated Activity Company Riverside Two Sir John Rogerson’s Quay Grand Canal Dock Dublin 2
Irish Legal Advisers Dillon Eustace 33 Sir John Rogerson’s Quay Dublin 2 Ireland
Auditors KPMG 2 Harbourmaster Place IFSC Dublin 1 Ireland
Company Secretary Carne Global Financial Services Limited 2nd Floor, Block E Iveagh Court Harcourt Road Dublin 2 Ireland
Sub-Investment Managers/Portfolio Managers U Access (IRL) Trend Macro Trend Capital Management LP 1800 N. Military Trail Suite 475 Boca Raton Florida 33431 United States of America U Access (IRL) Electron Global Utility Fund Electron Capital Partners, LLC 599 Lexington Avenue 38th Floor, New York New York 10022 United States of America

U ACCESS (IRELAND) UCITS PLC
GENERAL INFORMATION (CONTINUED)
3
Representative and Paying Agent: France Société Générale 28 Boulevard Haussman 75009 Paris France Facilities Agent: United Kingdom Duff & Phelps Ltd 14th Floor, The Shard 32 London Bridge London SE1 9SG United Kingdom Paying Agent: Sweden Skandinaviska Enskilda Banken AB (publ) Kungsträdgårdsgatan 8 SE-106 40 Stockholm Sweden Financial Agent: Belgium Caceis Belgium SA Avenue du Port/Havenlaan 86C b 320 B-1000 Brussels Belgium Representative Agent: Luxembourg Société Générale Bank & Trust 28-32 Place de la gare L-1616 Luxembourg
Information and Paying Agent: Germany Marcard Stein & Co AG Ballindamm 36 20095 Hamburg Germany Paying Agent in Switzerland Banque Cantonale de Geneve 17, quai de l'lle 1204 Geneva Switzerland Representative in Switzerland Carnegie Fund Services S.A. 11, rue du Général - Dufour 1204 Geneva Switzerland Representative Agent: Spain Allfunds Bank S.A., Allfunds Bank International S.A. Calle Estafeta no 6 Edifcio 3 Complejo Plaza de la Fuenta La Moraleja Alcobendas 28109 Madrid Spain
Switzerland: The prospectus and the Key Investor Information for Switzerland, the articles, the interim and annual reports in French and other information can be obtained free of charge from the representative in Switzerland: Carnegie Fund Services S.A., 11, rue du Général - Dufour, 1204 Geneva, Switzerland, web: www.carnegie-fund-services.ch. The payment service in Switzerland is Banque Cantonale de Genève, 17, Quai de l'Ile, CH-1204 Geneva, Switzerland. The latest share prices are available on www.fundinfo.com. Each time performance data is published, it should be noted that the past performance is no indication of current or future performance, and that it does not take account of the commissions and costs incurred on the issue and redemption of units.

U ACCESS (IRELAND) UCITS PLC
INVESTMENT MANAGER’S REPORT
4
U Access (IRL) Trend Macro
As of 30 June 2017, aggregate net assets in U Access (IRL) Trend Macro (the “Fund”) totalled US$459,111,705.
Strategy Statement Trend Capital Management LP (the “Portfolio Manager”) seeks to produce consistent, absolute returns on capital by pursuing a fundamental global macro strategy. That strategy includes identifying and capitalising on fundamental trends in interest rates, currencies, and credit and equity indices in both developed and emerging markets. Active risk and liquidity management are important components of the strategy.
U Access (IRL) Electron Global Utility Fund
As of 30 June 2017, aggregate net assets in U Access (IRL) Electron Global Utility Fund (the “Fund”) totalled US$69,178,984.
Strategy Statement
Electron Capital Partners, LLC (the “Portfolio Manager”) seeks to produce absolute returns through long and short investments primarily in publicly traded equity securities. This is achieved by deploying assets globally and investing in utility and infrastructure companies. Active risk and liquidity management are important components of the strategy. Union Bancaire Privée, UBP SA 29 August 2017
U ACCESS (IRELAND) UCITS PLC
STATEMENT OF FINANCIAL POSITION
(Expressed in U.S. Dollars)
The accompanying notes are an integral part of the financial statements and should be read in conjunction therewith. 5
As at 30 June 2017
U Access (IRL) Trend Macro
U Access (IRL) Electron Global
Utility Fund Total
US$ US$ US$
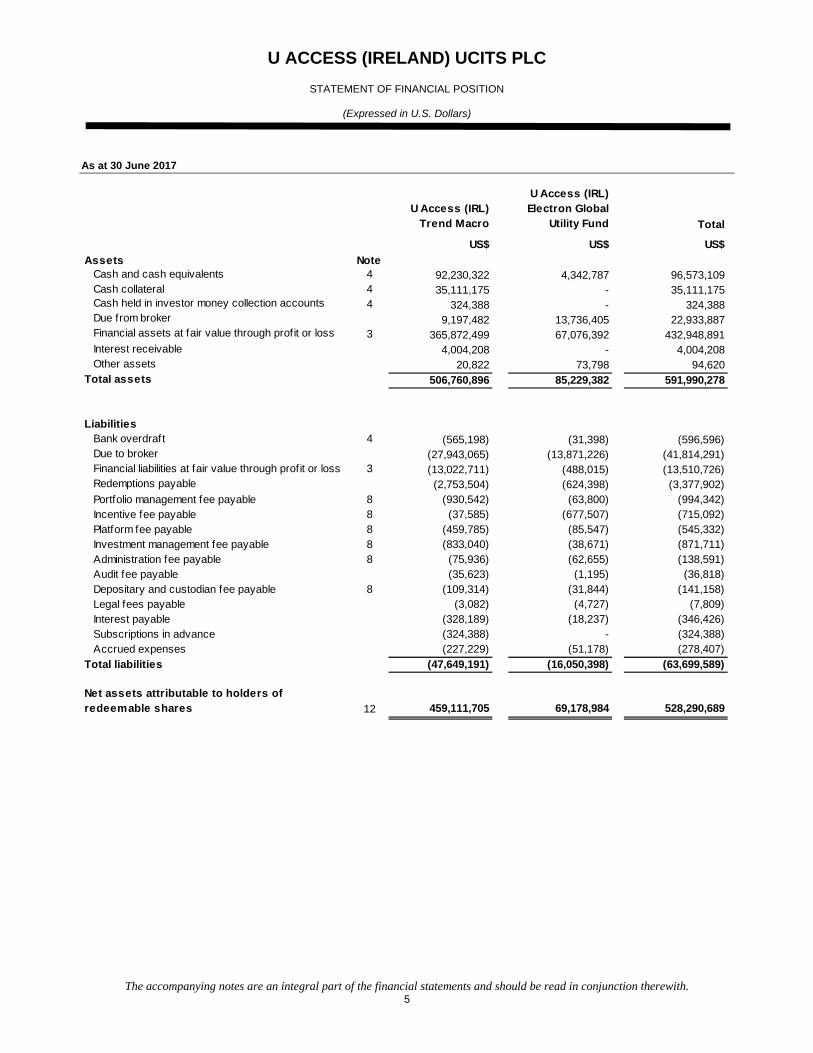
Assets Note Cash and cash equivalents 4 92,230,322 4,342,787 96,573,109 Cash collateral 4 35,111,175 - 35,111,175 Cash held in investor money collection accounts 4 324,388 - 324,388 Due from broker 9,197,482 13,736,405 22,933,887 Financial assets at fair value through profit or loss 3 365,872,499 67,076,392 432,948,891 Interest receivable 4,004,208 - 4,004,208 Other assets 20,822 73,798 94,620 Total assets 506,760,896 85,229,382 591,990,278
Liabilities Bank overdraft 4 (565,198) (31,398) (596,596) Due to broker (27,943,065) (13,871,226) (41,814,291) Financial liabilities at fair value through profit or loss 3 (13,022,711) (488,015) (13,510,726) Redemptions payable (2,753,504) (624,398) (3,377,902) Portfolio management fee payable 8 (930,542) (63,800) (994,342) Incentive fee payable 8 (37,585) (677,507) (715,092) Platform fee payable 8 (459,785) (85,547) (545,332) Investment management fee payable 8 (833,040) (38,671) (871,711) Administration fee payable 8 (75,936) (62,655) (138,591) Audit fee payable (35,623) (1,195) (36,818) Depositary and custodian fee payable 8 (109,314) (31,844) (141,158) Legal fees payable (3,082) (4,727) (7,809) Interest payable (328,189) (18,237) (346,426) Subscriptions in advance (324,388) - (324,388) Accrued expenses (227,229) (51,178) (278,407)
Total liabilities (47,649,191) (16,050,398) (63,699,589)
Net assets attributable to holders of redeemable shares 12 459,111,705 69,178,984 528,290,689
U ACCESS (IRELAND) UCITS PLC
STATEMENT OF FINANCIAL POSITION (CONTINUED)
(Expressed in U.S. Dollars)
The accompanying notes are an integral part of the financial statements and should be read in conjunction therewith. 6
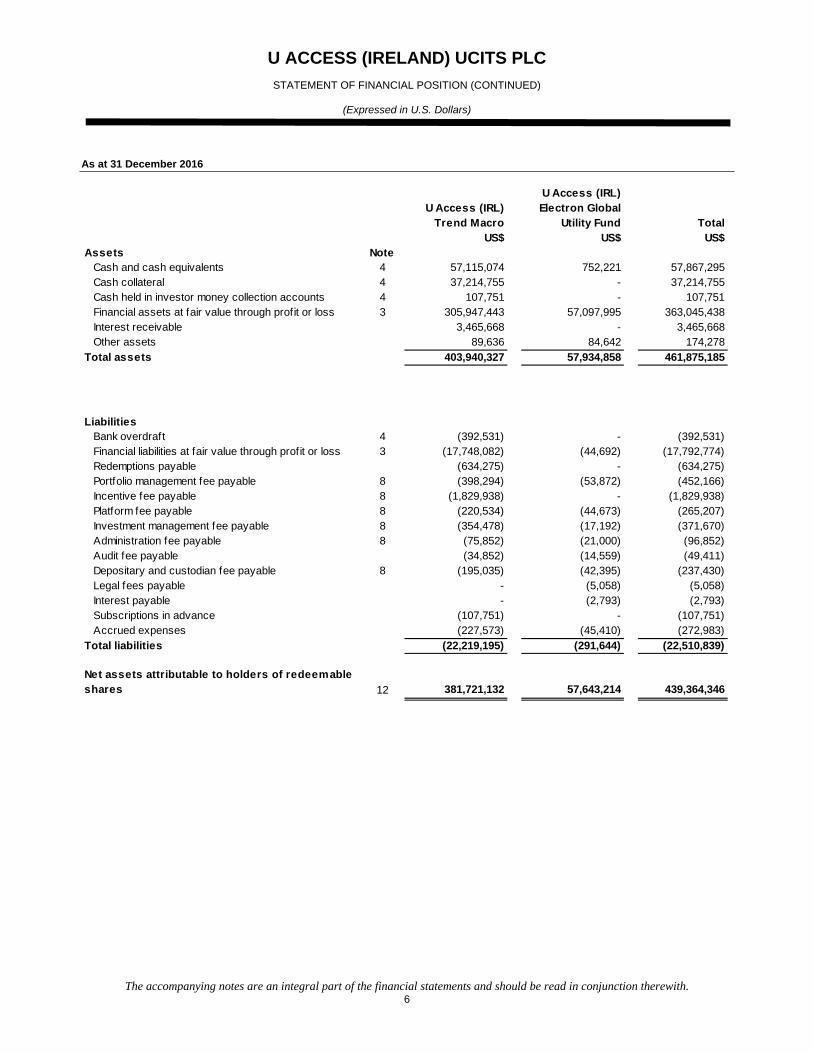
As at 31 December 2016
U Access (IRL) Trend Macro
U Access (IRL) Electron Global
Utility Fund TotalUS$ US$ US$
Assets Note Cash and cash equivalents 4 57,115,074 752,221 57,867,295 Cash collateral 4 37,214,755 - 37,214,755 Cash held in investor money collection accounts 4 107,751 - 107,751 Financial assets at fair value through profit or loss 3 305,947,443 57,097,995 363,045,438 Interest receivable 3,465,668 - 3,465,668 Other assets 89,636 84,642 174,278 Total assets 403,940,327 57,934,858 461,875,185
Liabilities Bank overdraft 4 (392,531) - (392,531) Financial liabilities at fair value through profit or loss 3 (17,748,082) (44,692) (17,792,774) Redemptions payable (634,275) - (634,275) Portfolio management fee payable 8 (398,294) (53,872) (452,166) Incentive fee payable 8 (1,829,938) - (1,829,938) Platform fee payable 8 (220,534) (44,673) (265,207) Investment management fee payable 8 (354,478) (17,192) (371,670) Administration fee payable 8 (75,852) (21,000) (96,852) Audit fee payable (34,852) (14,559) (49,411) Depositary and custodian fee payable 8 (195,035) (42,395) (237,430) Legal fees payable - (5,058) (5,058) Interest payable - (2,793) (2,793) Subscriptions in advance (107,751) - (107,751) Accrued expenses (227,573) (45,410) (272,983)Total liabilities (22,219,195) (291,644) (22,510,839)
Net assets attributable to holders of redeemable shares 12 381,721,132 57,643,214 439,364,346

U ACCESS (IRELAND) UCITS PLC
STATEMENT OF COMPREHENSIVE INCOME
(Expressed in U.S. Dollars)
The accompanying notes are an integral part of the financial statements and should be read in conjunction therewith. 7
For the six months period ended 30 June 2017
U Access (IRL) Trend Macro
U Access (IRL) Electron Global
Utility Fund TotalUS$ US$ US$
Investment Income Note Interest income 13,871,850 187 13,872,037 Other income 284 28 312 Net foreign exchange gain 5 364,871 959 365,830 Net gain on f inancial assets and liabilities at fair value through profit or loss 5 8,374,848 7,394,650 15,769,498 Total investment income 22,611,853 7,395,824 30,007,677
Operating Expenses Portfolio management fee 8 (2,492,631) (340,881) (2,833,512) Incentive fee 8 (37,648) (696,069) (733,717) Depositary and custodian fee 8 (178,947) (32,145) (211,092) Platform fee 8 (509,618) (93,330) (602,948) Investment management fee 8 (837,516) (38,670) (876,186) Administration fee 8 (138,219) (41,655) (179,874) Audit fee (19,812) (5,908) (25,720) Legal fee (37,501) (3,430) (40,931) Transaction fee 14 (135,728) - (135,728) Organisational expense (4,959) (7,438) (12,397) Operational fee (150,134) (43,725) (193,859) Other expenses (43,356) (9,165) (52,521)Total operating expenses (4,586,069) (1,312,416) (5,898,485)
Net investment income 18,025,784 6,083,408 24,109,192
Finance Costs Interest expense (2,725,948) (4,105) (2,730,053)Total finance costs (2,725,948) (4,105) (2,730,053)
Increase in net assets attributable to holders of redeemable shares 15,299,836 6,079,303 21,379,139

U ACCESS (IRELAND) UCITS PLC
STATEMENT OF COMPREHENSIVE INCOME (CONTINUED)
(Expressed in U.S. Dollars)
The accompanying notes are an integral part of the financial statements and should be read in conjunction therewith. 8
For the six months period ended 30 June 2016
U Access (IRL) Trend Macro
U Access (IRL) Electron
Global Utility Fund Total
US$ US$ US$Investment Income/(Expense) Note Interest income 4,535,022 - 4,535,022 Other income 462 - 462 Net foreign exchange gain/(loss) 5 143,108 (728) 142,380 Net gain/(loss) on f inancial assets and liabilities at fair value through profit or loss 5 3,616,199 (915,883) 2,700,316
Total investment income/(expense) 8,294,791 (916,611) 7,378,180
Operating Expenses Portfolio management fee 8 (1,426,745) (291,734) (1,718,479) Incentive fee 8 (2,001,911) (1,854) (2,003,765) Depositary and custodian fee 8 (72,801) (20,696) (93,497) Platform fee 8 (328,260) (85,581) (413,841) Sourcing fee 8 (158,147) (496) (158,643) Investment management fee 8 (290,972) (3,219) (294,191) Administration fee 8 (99,919) (47,294) (147,213) Audit fee (22,358) (13,815) (36,173) Legal fee (85,806) (21,228) (107,034) Transaction fee 14 (41,580) - (41,580) Organisational expense (4,986) (7,479) (12,465) Operational fee (169,211) (37,557) (206,768) Other expenses (146,800) (55,921) (202,721)Total operating expenses (4,849,496) (586,874) (5,436,370)
Net investment income/(expense) 3,445,295 (1,503,485) 1,941,810
Finance Costs Interest expense (1,249,939) (162) (1,250,101)Total finance costs (1,249,939) (162) (1,250,101)
Increase/(decrease) in net assets attributable to holders of redeemable shares 2,195,356 (1,503,647) 691,709
U ACCESS (IRELAND) UCITS PLC
STATEMENT OF CHANGES IN NET ASSETS ATTRIBUTABLE TO HOLDERS OF REDEEMABLE SHARES
(Expressed in U.S. Dollars)
The accompanying notes are an integral part of the financial statements and should be read in conjunction therewith. 9
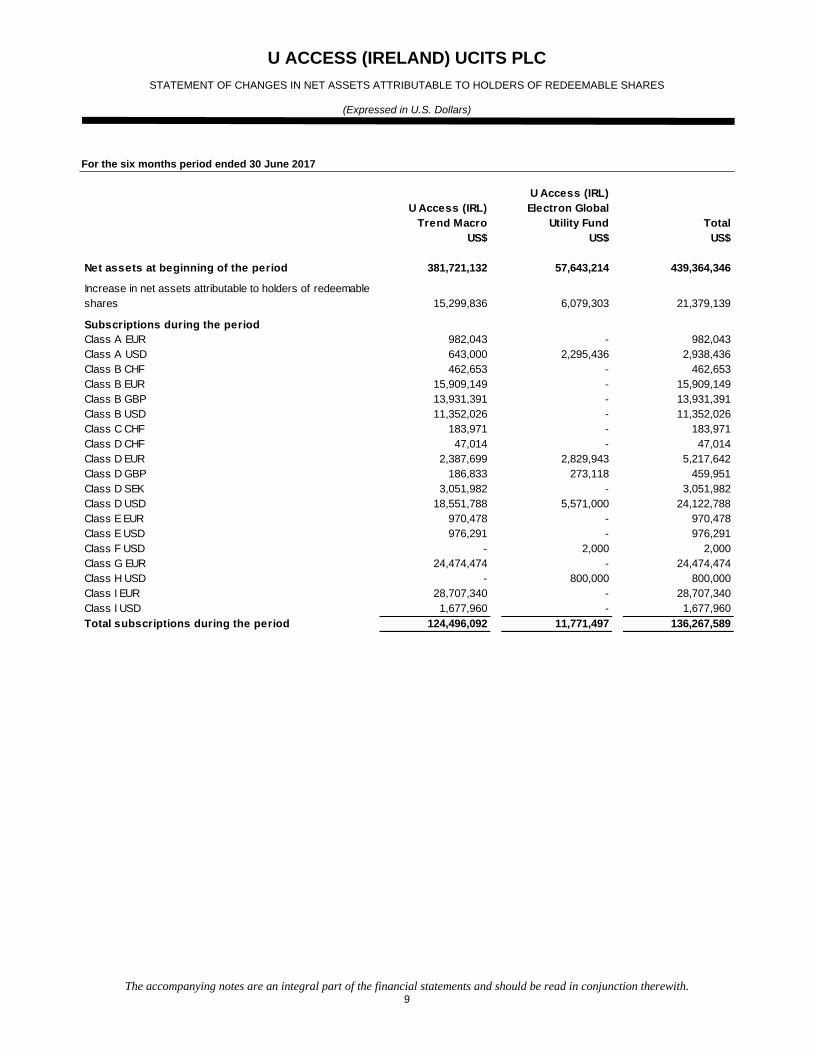
For the six months period ended 30 June 2017
U Access (IRL) Trend Macro
U Access (IRL) Electron Global
Utility Fund TotalUS$ US$ US$
Net assets at beginning of the period 381,721,132 57,643,214 439,364,346
Increase in net assets attributable to holders of redeemable shares 15,299,836 6,079,303 21,379,139
Subscriptions during the periodClass A EUR 982,043 - 982,043Class A USD 643,000 2,295,436 2,938,436Class B CHF 462,653 - 462,653Class B EUR 15,909,149 - 15,909,149Class B GBP 13,931,391 - 13,931,391Class B USD 11,352,026 - 11,352,026Class C CHF 183,971 - 183,971Class D CHF 47,014 - 47,014Class D EUR 2,387,699 2,829,943 5,217,642Class D GBP 186,833 273,118 459,951Class D SEK 3,051,982 - 3,051,982Class D USD 18,551,788 5,571,000 24,122,788Class E EUR 970,478 - 970,478Class E USD 976,291 - 976,291Class F USD - 2,000 2,000Class G EUR 24,474,474 - 24,474,474Class H USD - 800,000 800,000Class I EUR 28,707,340 - 28,707,340Class I USD 1,677,960 - 1,677,960Total subscriptions during the period 124,496,092 11,771,497 136,267,589

U ACCESS (IRELAND) UCITS PLC
STATEMENT OF CHANGES IN NET ASSETS ATTRIBUTABLE TO HOLDERS OF REDEEMABLE SHARES (CONTINUED)
(Expressed in U.S. Dollars)
The accompanying notes are an integral part of the financial statements and should be read in conjunction therewith. 10
For the six months period ended 30 June 2017 (continued)
U Access (IRL) Trend Macro
U Access (IRL) Electron Global
Utility Fund TotalUS$ US$ US$
Redemptions during the periodClass A EUR (654,440) (313,985) (968,425)Class A USD (9,219,255) (480,850) (9,700,105)Class B EUR (3,532,623) - (3,532,623)Class B GBP (5,226,097) - (5,226,097)Class B USD (8,980,050) - (8,980,050)Class C CHF (82,636) - (82,636)Class C EUR (2,248,354) - (2,248,354)Class C SEK (345,683) - (345,683)Class C USD (1,394,607) - (1,394,607)Class D EUR (5,483,586) (180,041) (5,663,627)Class D GBP - (49,407) (49,407)Class D SEK (2,808,421) - (2,808,421)Class D USD (7,454,455) (2,891,900) (10,346,355)Class E EUR (6,784,852) - (6,784,852)Class E USD (184,125) - (184,125)Class F USD - (1,247,945) (1,247,945)Class G EUR (939,432) - (939,432)Class I EUR (1,150,285) - (1,150,285)Class I USD (2,604,741) - (2,604,741)Class T USD (3,311,713) (1,150,902) (4,462,615)Total redemptions during the period (62,405,355) (6,315,030) (68,720,385)
Net assets at end of the period 459,111,705 69,178,984 528,290,689
U ACCESS (IRELAND) UCITS PLC
STATEMENT OF CHANGES IN NET ASSETS ATTRIBUTABLE TO HOLDERS OF REDEEMABLE SHARES (CONTINUED)
(Expressed in U.S. Dollars)
The accompanying notes are an integral part of the financial statements and should be read in conjunction therewith. 11
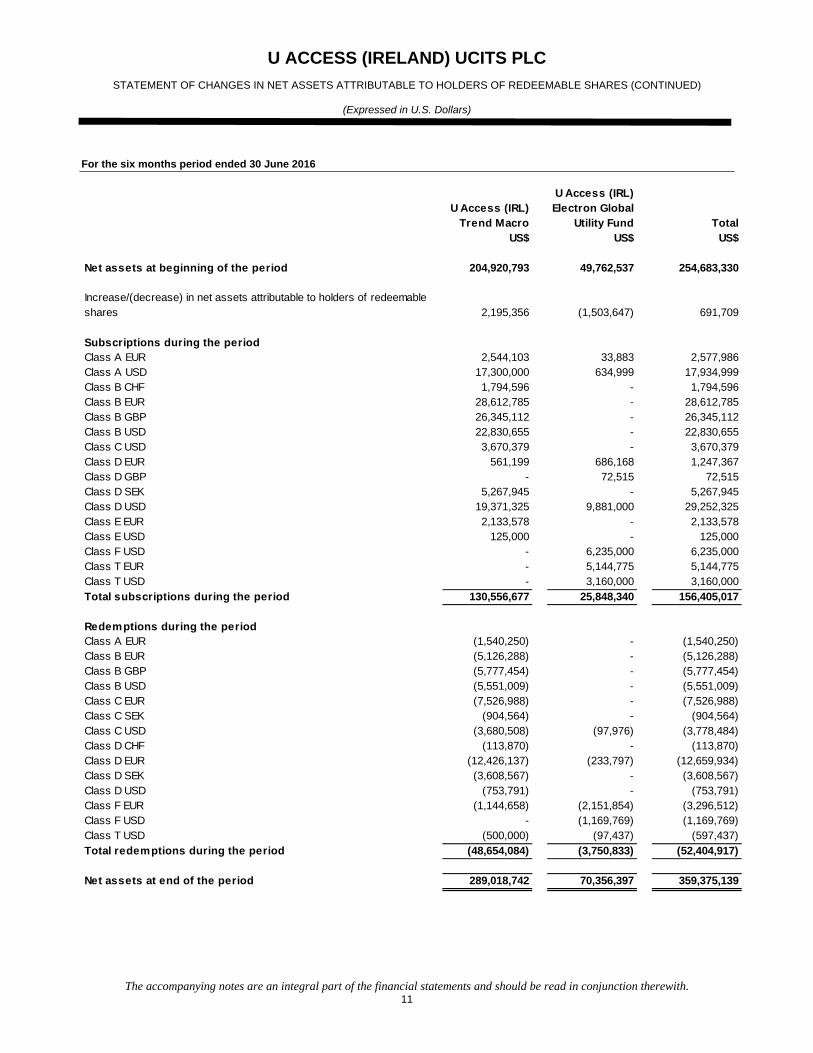
For the six months period ended 30 June 2016
U Access (IRL) Trend Macro
U Access (IRL) Electron Global
Utility Fund TotalUS$ US$ US$
Net assets at beginning of the period 204,920,793 49,762,537 254,683,330
Increase/(decrease) in net assets attributable to holders of redeemable shares 2,195,356 (1,503,647) 691,709
Subscriptions during the periodClass A EUR 2,544,103 33,883 2,577,986 Class A USD 17,300,000 634,999 17,934,999 Class B CHF 1,794,596 - 1,794,596 Class B EUR 28,612,785 - 28,612,785 Class B GBP 26,345,112 - 26,345,112 Class B USD 22,830,655 - 22,830,655 Class C USD 3,670,379 - 3,670,379 Class D EUR 561,199 686,168 1,247,367 Class D GBP - 72,515 72,515 Class D SEK 5,267,945 - 5,267,945 Class D USD 19,371,325 9,881,000 29,252,325 Class E EUR 2,133,578 - 2,133,578 Class E USD 125,000 - 125,000 Class F USD - 6,235,000 6,235,000 Class T EUR - 5,144,775 5,144,775 Class T USD - 3,160,000 3,160,000 Total subscriptions during the period 130,556,677 25,848,340 156,405,017
Redemptions during the periodClass A EUR (1,540,250) - (1,540,250)Class B EUR (5,126,288) - (5,126,288)Class B GBP (5,777,454) - (5,777,454)Class B USD (5,551,009) - (5,551,009)Class C EUR (7,526,988) - (7,526,988)Class C SEK (904,564) - (904,564)Class C USD (3,680,508) (97,976) (3,778,484)Class D CHF (113,870) - (113,870)Class D EUR (12,426,137) (233,797) (12,659,934)Class D SEK (3,608,567) - (3,608,567)Class D USD (753,791) - (753,791)Class F EUR (1,144,658) (2,151,854) (3,296,512)Class F USD - (1,169,769) (1,169,769)Class T USD (500,000) (97,437) (597,437)Total redemptions during the period (48,654,084) (3,750,833) (52,404,917)
Net assets at end of the period 289,018,742 70,356,397 359,375,139

U ACCESS (IRELAND) UCITS PLC
STATEMENT OF CASH FLOWS
(Expressed in U.S. Dollars)
The accompanying notes are an integral part of the financial statements and should be read in conjunction therewith. 12
For the six months period ended 30 June 2017
U Access (IRL) Trend Macro
U Access (IRL) Electron Global
Utility Fund TotalNote US$ US$ US$
Cash flows from operating activitiesIncrease in net assets attributable to holders of redeemable shares 15,299,836 6,079,303 21,379,139Adjustments to reconcile net increase in net assets attributable to holders of redeemable shares to net cash used in operating activities:
Net change in operating assets and liabilities: Financial assets at fair value through profit or loss (59,925,056) (9,978,397) (69,903,453) Due from broker (9,197,482) (13,736,405) (22,933,887) Interest receivable (538,540) - (538,540) Other assets 68,814 10,844 79,658 Financial liabilities at fair value through profit or loss (4,725,371) 443,323 (4,282,048) Due to broker 27,943,065 13,871,226 41,814,291 Portfolio management fee payable 532,248 9,928 542,176 Incentive fee payable (1,792,353) 677,507 (1,114,846) Platform fee payable 239,251 40,874 280,125 Investment management fee payable 478,562 21,479 500,041 Administration fee payable 84 41,655 41,739 Audit fee payable 771 (13,364) (12,593) Depositary and custodian fee payable (85,721) (10,551) (96,272) Legal fees payable 3,082 (331) 2,751 Redemptions payable 2,119,229 624,398 2,743,627 Interest payable 328,189 15,444 343,633 Accrued expenses (344) 5,768 5,424
Net cash used in operating activities (29,251,736) (1,897,299) (31,149,035)
Cash flows from financing activities Proceeds from issuance of shares 124,712,729 11,771,497 136,484,226 Payments for redemption of shares (62,405,355) (6,315,030) (68,720,385)
Net cash provided by financing activities 62,307,374 5,456,467 67,763,841
Net increase in cash and cash equivalents 33,055,638 3,559,168 36,614,806
Cash and cash equivalents at beginning of the period 4 94,045,049 752,221 94,797,270
Cash and cash equivalents at end of the period 4 127,100,687 4,311,389 131,412,076
Supplemental disclosure of cash flow informationInterest received 13,333,310 187 13,333,497Interest paid (2,397,759) 11,339 (2,386,420)

U ACCESS (IRELAND) UCITS PLC
STATEMENT OF CASH FLOWS (CONTINUED)
(Expressed in U.S. Dollars)
The accompanying notes are an integral part of the financial statements and should be read in conjunction therewith. 13
For the six months period ended 30 June 2016
U Access (IRL) Trend
Macro
U Access (IRL) Electron Global Utility
Fund TotalNote US$ US$ US$
Cash flows from operating activitiesIncrease/(decrease) in net assets attributable to holders of redeemable shares 2,195,356 (1,503,647) 691,709 Adjustments to reconcile net increase/(decrease) in net assets attributable to holders of redeemable shares to net cash used in operating activities:
Net change in operating assets and liabilities: Financial assets at fair value through profit or loss (60,735,225) (21,392,530) (82,127,755) Receivable for securities sold (11,807,280) - (11,807,280) Other assets (286,828) (5,201) (292,029) Financial liabilities at fair value through profit or loss 3,910,667 4,890,744 8,801,411 Payable for securities purchased 1,277,000 - 1,277,000 Management fee payable 241,009 7,309 248,318 Incentive fee payable 1,762,562 (197,407) 1,565,155 Platform fee payable 128,982 33,616 162,598 Sourcing fee payable 3,458 3,025 6,483 Administration fee payable 1,807 (37,290) (35,483) Audit fee payable 15,654 4,078 19,732 Depositary and custodian fee payable 34,778 15,779 50,557 Legal fees payable (23,726) 40 (23,686) Interest payable 213,518 7,210 220,728 Accrued expenses 20,707 12,453 33,160 Net cash used in operating activities (63,047,561) (18,161,821) (81,209,382)
Cash flows from financing activities Proceeds from issuance of shares 130,556,677 25,848,340 156,405,017 Payments for redemption of shares (48,164,655) (15,512,156) (63,676,811)Net cash provided by financing activities 82,392,022 10,336,184 92,728,206
Net increase/(decrease) in cash and cash equivalents 19,344,461 (7,825,637) 11,518,824
Cash and cash equivalents at beginning of the period 4 137,195,445 19,665,467 156,860,912
Cash and cash equivalents at end of the period 4 156,539,906 11,839,830 168,379,736
Supplemental disclosure of cash flow informationInterest received 4,535,022 4,432 4,539,454 Interest paid (1,036,421) (2,555) (1,038,976)

U ACCESS (IRELAND) UCITS PLC
NOTES TO FINANCIAL STATEMENTS
14
1. General information
U Access (Ireland) UCITS plc (the “Company”) was incorporated in Ireland on 5 March 2014 as an investment company with variable capital and segregated liability between sub-funds and with limited liability under registration number 540616. The Company was incorporated as GFS UCITS Fund plc and changed its name to U Access (Ireland) UCITS plc effective 15 March 2016. The Company is authorised by the Central Bank of Ireland in accordance with the European Communities (Undertakings for Collective Investments in Transferable Securities) Regulations, 2011 (as amended) (“UCITS Regulations”) and is regulated by the Central Bank of Ireland in accordance with the Central Bank (Supervision and Enforcement) Act 2013 (Section 48(1) (Undertakings for Collective Investment in Transferable Securities) Regulations 2015, (as amended) (the Central Bank UCITS Regulations).
The financial statements are prepared in accordance with the Irish Companies Acts 2014-2017, UCITS Regulations, Central Bank UCITS Regulations and in accordance with International Financial Reporting Standards (“IFRS”) as adopted by the European Union. The Company is structured as an umbrella fund consisting of different funds, each comprising one or more classes. The assets of each fund will be invested separately on behalf of each fund by the Portfolio Manager of such fund in accordance with the investment objective and policies of each fund and the applicable Investment Management Agreement. As at 30 June 2017, the Company has established two funds: U Access (IRL) Trend Macro and U Access (IRL) Electron Global Utility Fund (each a “Fund” and together the “Funds”).
Additional funds may be established by the Directors from time to time with the prior approval of the Central Bank of Ireland. The Company has appointed Union Bancaire Privée, UBP SA as the Principal Investment Manager (the “Principal Investment Manager”) to the Company. The Company has appointed BNY Mellon Fund Services (Ireland) Designated Activity Company as administrator and registrar of the Company pursuant to the Administration Agreement with responsibility for the day to day administration of the Company’s affairs. The Company has appointed BNY Mellon Trust Company (Ireland) Limited as depositary of the Company pursuant to the Depositary Agreement with responsibility for acting as custodian and depositary of the assets of each Fund. The investment objectives and policies of each Fund are summarised below. A full description of the Investment Objectives and Policies of each Fund are contained in the Supplements dated 15 June 2017. U Access (IRL) Trend Macro The investment objective of the Fund is to achieve a consistent, absolute return. The Fund is managed by the Sub-Investment Manager, Trend Capital Management LP. The Fund seeks to achieve a consistent, absolute return by gaining global exposure through long and short investment in 3 asset classes: fixed income, currencies and equities (the “Asset Classes”). Such exposure will primarily be taken indirectly through the use of financial derivative instruments (“FDI”). The Fund may invest in both developed and emerging markets and will not be restricted to any particular industry, sector or region. The Fund may invest more than 20% of its Net Asset Value (“NAV”) in emerging markets when considered appropriate to the investment objective of the Fund. While the Fund will primarily invest indirectly through the use of FDI, it may also invest directly in equities, currencies and bonds which will be either fixed or floating rate, issued by governments, governmental authorities, or corporations either explicitly or implicitly guaranteed by a government, which are either rated or unrated and exchange traded funds (“ETFs”) to gain exposure to the Asset Classes. All share classes in the Fund are accumulating shares, with the exception of the Class G EUR share class which launched on 17 May 2017. The Directors intend to make an annual distribution to shareholders in the Class G EUR share class, comprising of an annual dividend. U Access (IRL) Electron Global Utility Fund The investment objective of the Fund is to provide shareholders with a return linked to the performance of a reference portfolio (the “Reference Portfolio”). The Reference Portfolio represents a dynamically managed portfolio of investments seeking exposure to long and short equity positions and currencies. The Reference Portfolio may also consist of other instruments such as financial indices, collective investment schemes and financial derivative instruments (“FDIs”). The Reference Portfolio is managed by the Sub-Investment Manager, Electron Capital Partners, LLC. The Sub-Investment Manager is a Portfolio Manager.
U ACCESS (IRELAND) UCITS PLC
NOTES TO FINANCIAL STATEMENTS (CONTINUED)
15
1. General information (continued) U Access (IRL) Electron Global Utility Fund (continued) The investment objective of the Reference Portfolio is to achieve absolute returns through long and short investments primarily in publicly traded equity securities in the global utility sector (including, but not limited to, electric, gas and water utilities and independent power companies), utility service and fuel providers, utility equipment manufacturers (including, but not limited to, renewable and energy technology companies) and related sectors. The Reference Portfolio may invest up to 10% of its net asset value in Russian securities. The Reference Portfolio will consist of equities (including preferred stock) and currencies (the “Asset Classes”). While the Reference Portfolio will invest directly in US and non-US public equities it may also gain indirect exposure to equities (including indices) via swaps, options, futures, forwards and contracts for difference. The Fund is exposed to the economic performance of the Reference Portfolio through a total return swap (the “Portfolio Total Return Swap”) with Morgan Stanley. The Portfolio Total Return Swap will give the Fund economic exposure to the Reference Portfolio in exchange for a fixed rate of return being paid by the Fund. The performance of the Fund will primarily be determined by the performance of the Reference Portfolio. The Fund has purchased a series of Funding Assets to support the Reference Portfolio. All share classes in the Fund are accumulating shares and it is not intended to distribute dividends to the shareholders in the accumulating share classes.
2. Significant accounting policies
(a) Statement of compliance These condensed unaudited interim financial statements should be read in conjunction with the 31 December 2016 annual report and audited financial statements which have been prepared in accordance with the International Financial Reporting Standards (“IFRS”) as adopted by the European Union. The unaudited interim financial statements have been compiled using accounting policies, methods of computation and presentation which are consistent with the annual report for the year ended 31 December 2016, unless otherwise stated. These condensed unaudited interim financial statements have been prepared in accordance with International Accounting Standard 34: Interim Financial Reporting (“IAS 34”) and Irish Statute comprising the Companies Acts 2014-2017, UCITS Regulations and Central Bank of Ireland UCITS Regulations. (b) Standards, interpretations and amendments not yet effective at 30 June 2017 The following new significant standards and amendment to standards are relevant but not yet effective for the Company’s operations: IFRS 9 – Financial Instruments: Classification and Measurement In July 2014, the IASB issued the final version of IFRS 9 Financial Instruments which reflects all phases of the financial instruments project and replaces IAS 39 Financial Instruments: Recognition and Measurement and all previous versions of IFRS 9. The standard introduces new requirements for classification and measurement, impairment, and hedge accounting. IFRS 9 is effective for annual periods beginning on or after 1 January 2018, with early application permitted. Retrospective application is required but comparative information is not compulsory. Early application of previous versions of IFRS 9 (2009, 2010 and 2013) is permitted if the date of initial application is before 1 February 2015. The adoption of IFRS 9 is unlikely to have a material effect on the classification and measurement of the Company’s financial assets or financial liabilities.

U ACCESS (IRELAND) UCITS PLC
NOTES TO FINANCIAL STATEMENTS (CONTINUED)
16
3. Financial assets and liabilities at fair value through profit or loss
The following table summarises the financial assets and liabilities at fair value through profit or loss as at 30 June 2017:
U Access (IRL) Trend Macro
U Access (IRL) Electron Global
Utility FundUS$ US$
Financial assets at fair value through profit or lossHeld for trading: Equities - 65,675,690
Total equities - 65,675,690
Interest bearing securities Corporate bonds 67,561,374 - Government bonds 267,785,229 - Total interest bearing securities 335,346,603 -
Derivative contracts Contracts for difference - 1,142,569 Credit default sw aps 4,647,823 - Foreign exchange options 1,742,690 - Forw ard currency contracts 14,543,923 194,976 Futures 2,892,495 - Index options 744,188 - Interest rate options 5,082,000 - Interest rate sw aps 872,777 - Total return sw aps - 63,157
Total derivative contracts 30,525,896 1,400,702 Total financial assets at fair value through profit or loss 365,872,499 67,076,392
Financial liabilities at fair value through profit or lossDerivative contracts Contracts for difference - (487,789) Credit default sw aps (928,999) - Foreign exchange options (626,917) - Forw ard currency contracts (7,254,417) (226) Index options (253,125) - Interest rate options (2,843,500) - Interest rate sw aps (1,115,753) -Total derivative contracts (13,022,711) (488,015)Total financial liabilities at fair value through profit or loss (13,022,711) (488,015)

U ACCESS (IRELAND) UCITS PLC
NOTES TO FINANCIAL STATEMENTS (CONTINUED)
17
3. Financial assets and liabilities at fair value through profit or loss (continued) The following table summarises the financial assets and liabilities at fair value through profit or loss as at 31 December 2016:
U Access (IRL) Trend Macro
U Access (IRL) Electron Global
Utility FundUS$ US$
Financial assets at fair value through profit or lossHeld for trading: Equities - 56,370,160
Total equities - 56,370,160
Interest bearing securities Corporate bonds 63,567,288 - Government bonds 197,101,133 - Total interest bearing securities 260,668,421 -
Derivative contracts Contracts for difference - 689,801 Credit default sw aps 1,992,565 - Foreign exchange options 4,913,396 - Forw ard currency contracts 11,416,322 38,034 Futures 948,575 - Interest rate sw aps 837,954 - Total return sw aps 25,170,210 - Total derivative contracts 45,279,022 727,835 Total financial assets at fair value through profit or loss 305,947,443 57,097,995
Financial liabilities at fair value through profit or lossDerivative contracts Contracts for difference - (43,344) Credit default sw aps (1,657,033) - Foreign exchange options (2,523,942) - Forw ard currency contracts (9,426,632) - Futures (2,505,605) - Interest rate sw aps (1,386,141) - Total return sw aps (248,729) (1,348)
Total derivative contracts (17,748,082) (44,692)Total financial liabilities at fair value through profit or loss (17,748,082) (44,692)

U ACCESS (IRELAND) UCITS PLC
NOTES TO FINANCIAL STATEMENTS (CONTINUED)
18
3. Financial assets and liabilities at fair value through profit or loss (continued) A financial instrument is regarded as quoted in an active market if quoted prices are readily and regularly available from an exchange, dealer, broker, industry group, pricing service, or regulatory agency, and those prices represent actual and regularly occurring market transactions on an arm’s length basis. The Company discloses the values of its investments in accordance with IFRS 13 – Fair Value Measurement (“IFRS 13”). This requires the Company to classify fair value measurements using a fair value hierarchy that reflects the significance of the inputs used in making the measurements. The fair value hierarchy has the following levels: - Level 1 - quoted prices (unadjusted) in active markets for identical assets or liabilities. - Level 2 - inputs other than quoted prices included within Level 1 that are observable for the asset or liability, either directly (that
is, as prices) or indirectly (that is, derived from prices). - Level 3 - inputs for the asset or liability that are not based on observable market data (that is, unobservable inputs). The level in the fair value hierarchy within which the fair value measurement is categorised in its entirety is determined on the basis of the lowest level input that is significant to the fair value measurement in its entirety. For this purpose, the significance of an input is assessed against the fair value measurement in its entirety. If a fair value measurement uses observable inputs that require significant adjustment based on unobservable inputs, that measurement is a Level 3 measurement. Assessing the significance of a particular input to the fair value measurement in its entirety requires judgement, considering factors specific to the asset or liability.
The following tables analyse within the fair value hierarchy, the Company’s financial assets and liabilities measured at fair value at 30 June 2017: U Access (IRL) Trend Macro
Level 1 Level 2 Level 3 TotalUS$ US$ US$ US$
Financial assets at fair value through profit or loss held for trading
Interest bearing securities Corporate bonds - 67,561,374 - 67,561,374 Government bonds 88,561,059 179,224,170 - 267,785,229 Total interest bearing securities 88,561,059 246,785,544 - 335,346,603
Derivative contracts Credit default sw aps - 4,647,823 - 4,647,823 Foreign exchange options - 1,742,690 - 1,742,690 Forw ard currency contracts - 14,543,923 - 14,543,923 Futures contracts 2,892,495 - - 2,892,495 Index options 744,188 - - 744,188 Interest rate options 5,082,000 - - 5,082,000 Interest rate sw aps - 872,777 - 872,777 Total derivative contracts 8,718,683 21,807,213 - 30,525,896
97,279,742 268,592,757 - 365,872,499
Financial liabilities at fair value through profit or loss held for trading
Derivative contracts Credit default sw aps - (928,999) - (928,999) Foreign exchange options - (626,917) - (626,917) Forw ard currency contracts - (7,254,417) - (7,254,417) Index options (253,125) - - (253,125) Interest rate options (2,843,500) - - (2,843,500) Interest rate sw aps - (1,115,753) - (1,115,753)Total derivative contracts (3,096,625) (9,926,086) - (13,022,711)
(3,096,625) (9,926,086) - (13,022,711)

U ACCESS (IRELAND) UCITS PLC
NOTES TO FINANCIAL STATEMENTS (CONTINUED)
19
3. Financial assets and liabilities at fair value through profit or loss (continued) U Access (IRL) Electron Global Utility Fund
Level 1 Level 2 Level 3 TotalUS$ US$ US$ US$
Financial assets at fair value through profit or loss held for trading
Held for trading: Equities 65,675,690 - - 65,675,690 Total equities 65,675,690 - - 65,675,690
Derivative contracts Contracts for difference - 1,142,569 - 1,142,569 Forw ard currency contracts - 194,976 - 194,976 Total return sw aps - 63,157 - 63,157 Total derivative contracts - 1,400,702 - 1,400,702
65,675,690 1,400,702 - 67,076,392
Financial liabilities at fair value through profit or loss held for trading
Derivative contracts Contracts for difference - (487,789) - (487,789) Forw ard currency contracts - (226) - (226)
Total derivative contracts - (488,015) - (488,015) - (488,015) - (488,015)
For the period ended 30 June 2017, the Company invested in Level 1 and Level 2 securities. During the period ended 30 June 2017, the Company did not have any transfers between any of the levels of the fair value hierarchy.

U ACCESS (IRELAND) UCITS PLC
NOTES TO FINANCIAL STATEMENTS (CONTINUED)
20
3. Financial assets and liabilities at fair value through profit or loss (continued) The following table analyse within the fair value hierarchy, the Company’s financial assets and liabilities measured at fair value at 31 December 2016: U Access (IRL) Trend Macro
Level 1 Level 2 Level 3 TotalUS$ US$ US$ US$
Financial assets at fair value through profit or loss held for trading
Interest bearing securities Corporate bonds - 63,567,288 - 63,567,288 Government bonds 29,999,400 167,101,733 - 197,101,133
Total interest bearing securities 29,999,400 230,669,021 - 260,668,421
Derivative contracts Credit default sw aps - 1,992,565 - 1,992,565 Foreign exchange options - 4,913,396 - 4,913,396 Forw ard currency contracts - 11,416,322 - 11,416,322 Futures contracts 948,575 - - 948,575 Interest rate sw aps - 837,954 - 837,954 Total return sw aps - 25,170,210 - 25,170,210
Total derivative contracts 948,575 44,330,447 - 45,279,022 30,947,975 274,999,468 - 305,947,443
Financial liabilities at fair value through profit or loss held for trading
Derivative contracts Credit default sw aps - (1,657,033) - (1,657,033) Foreign exchange options - (2,523,942) - (2,523,942) Forw ard currency contracts - (9,426,632) - (9,426,632) Futures contracts (2,505,605) - - (2,505,605) Interest rate sw aps - (1,386,141) - (1,386,141) Total return sw aps - (248,729) - (248,729)
Total derivative contracts (2,505,605) (15,242,477) - (17,748,082)(2,505,605) (15,242,477) - (17,748,082)

U ACCESS (IRELAND) UCITS PLC
NOTES TO FINANCIAL STATEMENTS (CONTINUED)
21
3. Financial assets and liabilities at fair value through profit or loss (continued)
U Access (IRL) Electron Global Utility FundLevel 1 Level 2 Level 3 Total
US$ US$ US$ US$
Financial assets at fair value through profit or loss held for trading
Held for trading: Equities 56,370,160 - - 56,370,160
Total equities 56,370,160 - - 56,370,160
Derivative contracts Contracts for difference - 689,801 - 689,801 Forw ard currency contracts - 38,034 - 38,034 Total derivative contracts - 727,835 - 727,835
56,370,160 727,835 - 57,097,995
Financial liabilities at fair value through profit or loss held for trading
Derivative contracts Contracts for difference - (43,344) - (43,344) Total return sw aps - (1,348) - (1,348)Total derivative contracts - (44,692) - (44,692)
- (44,692) - (44,692)
For the year ended 31 December 2016, the Company mainly invested in Level 1 and Level 2 securities. During the year ended 31 December 2016, the Company did not have any transfers between any of the levels of the fair value hierarchy other than outlined in the table below. Changes in Level 3 assets measured at fair value for the year ended 31 December 2016 were as follows:
2016US$
Financial assets and liabilities at fair value through profit or loss:
Opening balance (6,137)Total gains/(losses):-realised - -unrealised 4,789 Sales - Transfers out of Level 3 1,348 Closing balance -
Those financial instruments not measured at fair value through profit or loss are short-term financial assets and liabilities whose carrying amounts approximate fair value because of their short-term nature and, for financial assets, high credit quality of counterparties. All these financial instruments are level 2 securities as at 30 June 2017 and 31 December 2016.
U ACCESS (IRELAND) UCITS PLC
NOTES TO FINANCIAL STATEMENTS (CONTINUED)
22
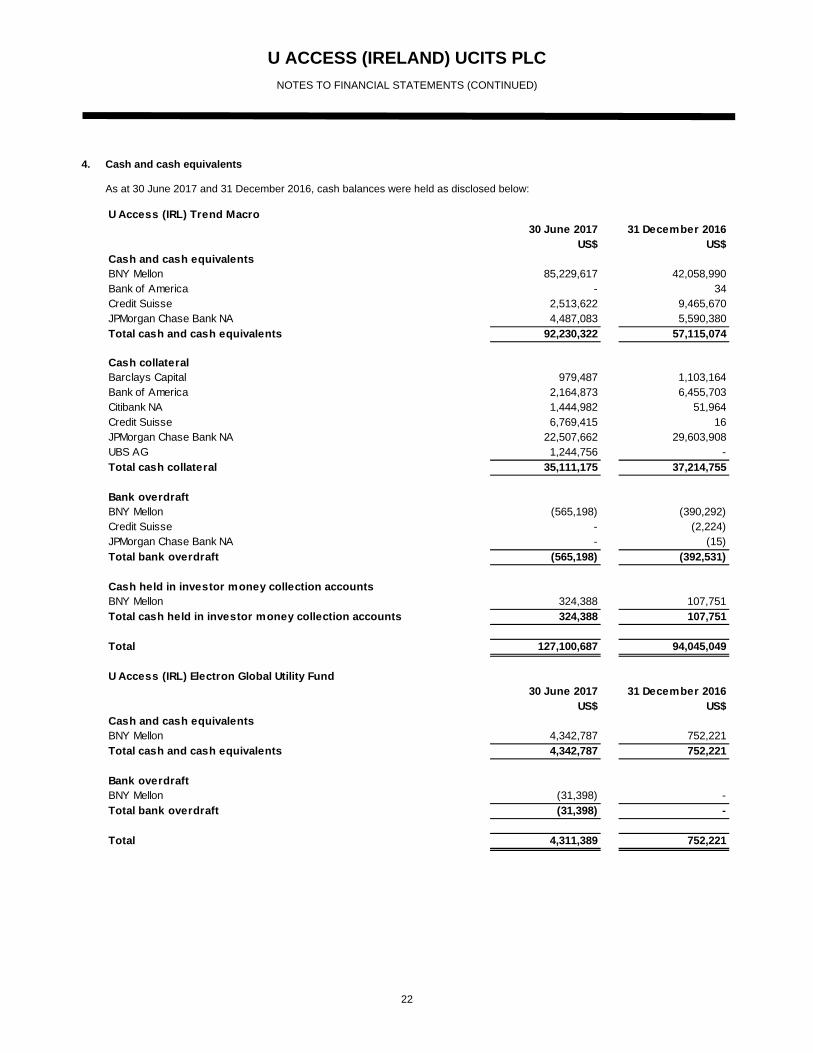
4. Cash and cash equivalents
As at 30 June 2017 and 31 December 2016, cash balances were held as disclosed below: U Access (IRL) Trend Macro
30 June 2017 31 December 2016US$ US$
Cash and cash equivalentsBNY Mellon 85,229,617 42,058,990 Bank of America - 34 Credit Suisse 2,513,622 9,465,670 JPMorgan Chase Bank NA 4,487,083 5,590,380 Total cash and cash equivalents 92,230,322 57,115,074
Cash collateralBarclays Capital 979,487 1,103,164 Bank of America 2,164,873 6,455,703 Citibank NA 1,444,982 51,964 Credit Suisse 6,769,415 16 JPMorgan Chase Bank NA 22,507,662 29,603,908 UBS AG 1,244,756 - Total cash collateral 35,111,175 37,214,755
Bank overdraftBNY Mellon (565,198) (390,292)Credit Suisse - (2,224)JPMorgan Chase Bank NA - (15)
Total bank overdraft (565,198) (392,531)
Cash held in investor money collection accountsBNY Mellon 324,388 107,751 Total cash held in investor money collection accounts 324,388 107,751
Total 127,100,687 94,045,049
U Access (IRL) Electron Global Utility Fund30 June 2017 31 December 2016
US$ US$Cash and cash equivalentsBNY Mellon 4,342,787 752,221 Total cash and cash equivalents 4,342,787 752,221
Bank overdraftBNY Mellon (31,398) - Total bank overdraft (31,398) -
Total 4,311,389 752,221
U ACCESS (IRELAND) UCITS PLC
NOTES TO FINANCIAL STATEMENTS (CONTINUED)
23
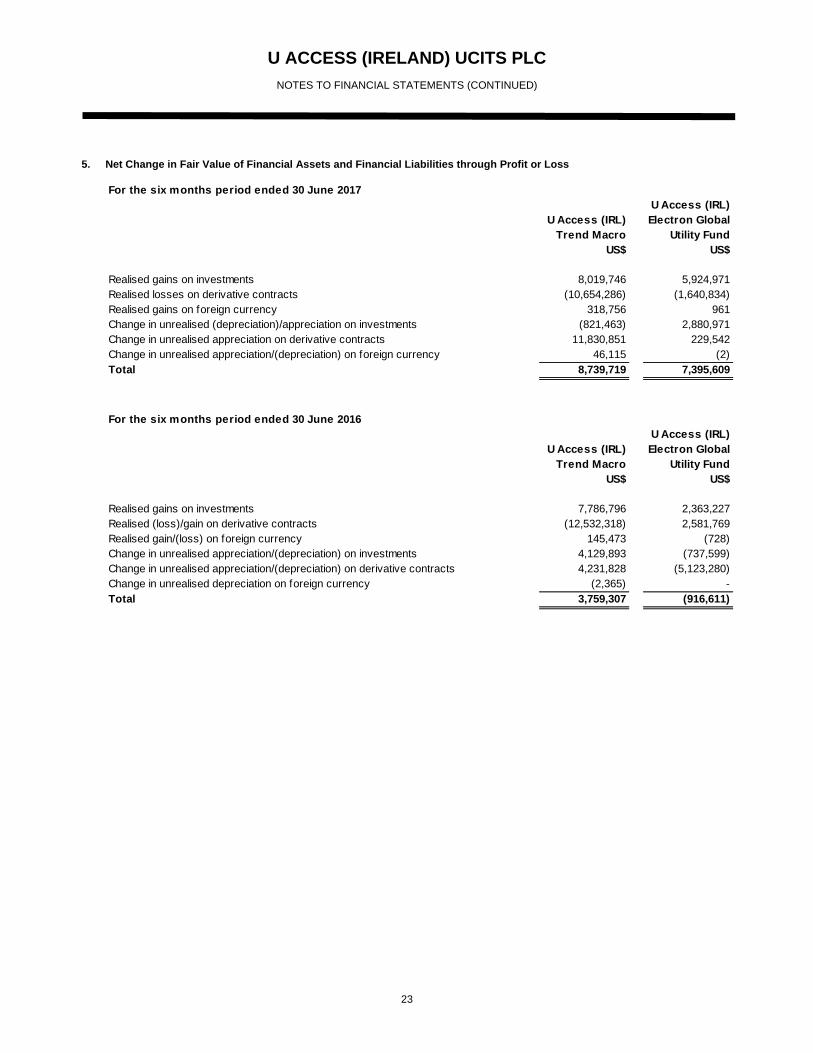
5. Net Change in Fair Value of Financial Assets and Financial Liabilities through Profit or Loss For the six months period ended 30 June 2017
U Access (IRL) Trend Macro
U Access (IRL) Electron Global
Utility FundUS$ US$
Realised gains on investments 8,019,746 5,924,971 Realised losses on derivative contracts (10,654,286) (1,640,834)Realised gains on foreign currency 318,756 961 Change in unrealised (depreciation)/appreciation on investments (821,463) 2,880,971 Change in unrealised appreciation on derivative contracts 11,830,851 229,542 Change in unrealised appreciation/(depreciation) on foreign currency 46,115 (2)Total 8,739,719 7,395,609
For the six months period ended 30 June 2016
U Access (IRL) Trend Macro
U Access (IRL) Electron Global
Utility FundUS$ US$
Realised gains on investments 7,786,796 2,363,227 Realised (loss)/gain on derivative contracts (12,532,318) 2,581,769 Realised gain/(loss) on foreign currency 145,473 (728)Change in unrealised appreciation/(depreciation) on investments 4,129,893 (737,599)Change in unrealised appreciation/(depreciation) on derivative contracts 4,231,828 (5,123,280)Change in unrealised depreciation on foreign currency (2,365) - Total 3,759,307 (916,611)
U ACCESS (IRELAND) UCITS PLC
NOTES TO FINANCIAL STATEMENTS (CONTINUED)
24
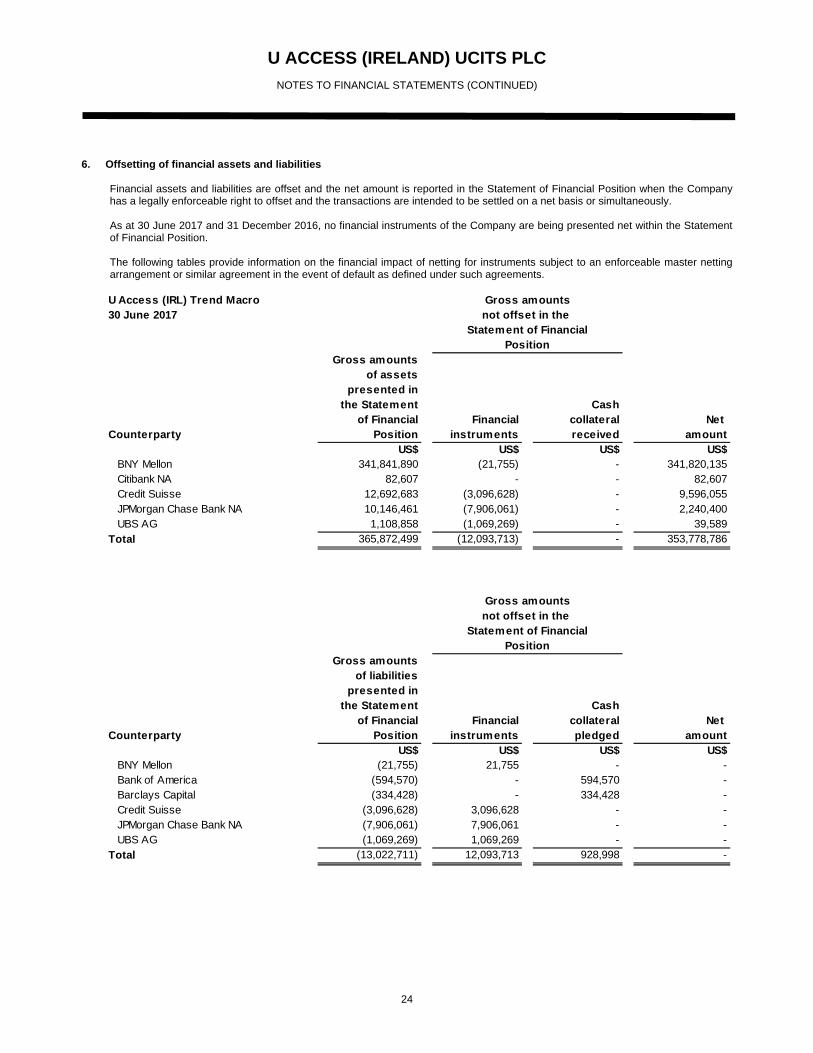
6. Offsetting of financial assets and liabilities
Financial assets and liabilities are offset and the net amount is reported in the Statement of Financial Position when the Company has a legally enforceable right to offset and the transactions are intended to be settled on a net basis or simultaneously. As at 30 June 2017 and 31 December 2016, no financial instruments of the Company are being presented net within the Statement of Financial Position. The following tables provide information on the financial impact of netting for instruments subject to an enforceable master netting arrangement or similar agreement in the event of default as defined under such agreements.
U Access (IRL) Trend Macro30 June 2017
Gross amountsof assets
presented inthe Statement Cash
of Financial Financial collateral Net Counterparty Position instruments received amount
US$ US$ US$ US$ BNY Mellon 341,841,890 (21,755) - 341,820,135 Citibank NA 82,607 - - 82,607 Credit Suisse 12,692,683 (3,096,628) - 9,596,055 JPMorgan Chase Bank NA 10,146,461 (7,906,061) - 2,240,400 UBS AG 1,108,858 (1,069,269) - 39,589 Total 365,872,499 (12,093,713) - 353,778,786
Gross amountsof liabilities
presented inthe Statement Cash
of Financial Financial collateral Net Counterparty Position instruments pledged amount
US$ US$ US$ US$ BNY Mellon (21,755) 21,755 - - Bank of America (594,570) - 594,570 - Barclays Capital (334,428) - 334,428 - Credit Suisse (3,096,628) 3,096,628 - - JPMorgan Chase Bank NA (7,906,061) 7,906,061 - - UBS AG (1,069,269) 1,069,269 - - Total (13,022,711) 12,093,713 928,998 -
Gross amountsnot offset in the
Statement of FinancialPosition
Gross amountsnot offset in the
Statement of FinancialPosition

U ACCESS (IRELAND) UCITS PLC
NOTES TO FINANCIAL STATEMENTS (CONTINUED)
25
6. Offsetting of Financial Assets and Liabilities (continued)
U Access (IRL) Electron Global Utility Fund30 June 2017
Gross amountsof assets
presented inthe Statement Cash
of Financial Financial collateral Net Counterparty Position instruments received amount
US$ US$ US$ US$ BNY Mellon 194,976 (226) - 194,750 Morgan Stanley 1,205,726 (487,789) - 717,937 Total 1,400,702 (488,015) - 912,687
Gross amountsof liabilities
presented inthe Statement Cash
of Financial Financial collateral Net Counterparty Position instruments pledged amount
US$ US$ US$ US$ BNY Mellon (226) 226 - - Morgan Stanley (487,789) 487,789 - - Total (488,015) 488,015 - -
Position
Gross amountsnot offset in the
Statement of Financial
Gross amountsnot offset in the
Statement of FinancialPosition

U ACCESS (IRELAND) UCITS PLC
NOTES TO FINANCIAL STATEMENTS (CONTINUED)
26
6. Offsetting of Financial Assets and Liabilities (continued)
U Access (IRL) Trend Macro31 December 2016
Gross amountsof assets
presented inthe Statement Cash
of Financial Financial collateral Net Counterparty Position instruments received amount
US$ US$ US$ US$ BNY Mellon 261,434,281 (129,110) - 261,305,171 Bank of America 25,170,210 (1,432,368) - 23,737,842 Citibank NA 738,702 (129,591) - 609,111 Credit Suisse 837,953 (281,241) - 556,712 Deutsche Bank 58,364 - - 58,364 JPMorgan Chase Bank NA 17,707,933 (15,302,378) - 2,405,555
Total 305,947,443 (17,274,688) - 288,672,755
Gross amountsof liabilities
presented inthe Statement Cash
of Financial Financial collateral Net Counterparty Position instruments pledged amount
US$ US$ US$ US$ BNY Mellon (129,110) 129,110 - - Bank of America (1,432,368) 1,432,368 - - Barclays Capital (473,394) - 473,394 - Citibank NA (129,591) 129,591 - - Credit Suisse (281,241) 281,241 - - JPMorgan Chase Bank NA (15,302,378) 15,302,378 - -
Total (17,748,082) 17,274,688 473,394 -
Position
Gross amountsnot offset in the
Statement of FinancialPosition
Gross amountsnot offset in the
Statement of Financial

U ACCESS (IRELAND) UCITS PLC
NOTES TO FINANCIAL STATEMENTS (CONTINUED)
27
6. Offsetting of Financial Assets and Liabilities (continued)
U Access (IRL) Electron Global Utility Fund31 December 2016
Gross amountsof assets
presented inthe Statement Cash
of Financial Financial collateral Net Counterparty Position instruments received amount
US$ US$ US$ US$ BNY Mellon 38,034 - - 38,034 Morgan Stanley 689,801 (44,692) - 645,109
Total 727,835 (44,692) - 683,143
Gross amountsof liabilities
presented inthe Statement Cash
of Financial Financial collateral Net Counterparty Position instruments pledged amount
US$ US$ US$ US$ Morgan Stanley (44,692) 44,692 - - Total (44,692) 44,692 - -
Statement of FinancialPosition
Gross amountsnot offset in the
Statement of FinancialPosition
Gross amountsnot offset in the

U ACCESS (IRELAND) UCITS PLC
NOTES TO FINANCIAL STATEMENTS (CONTINUED)
28
7. Share transactions The table below outlines the share classes available as at 30 June 2017 for U Access (IRL) Trend Macro: U Access (IRL) Trend Macro
Class A 3 Class B 4 Class C 5 Class D Class E 6 Class F 1 Class G 6 Class I Class T 2
CHF 7 CHF 7 CHF 7 CHF 7 CHF 7 EUR 7 EUR 7 CHF 7 USD
EUR 7 EUR 7 EUR 7 EUR 7 EUR 7 USD EUR 7
USD GBP 7 SEK 7 GBP 7 GBP 7 GBP 7
USD USD SEK 7 SEK 7 SEK 7
USD USD USD 1 The Class F Shares are closed to new or subsequent subscription unless permitted otherwise by the Directors at their sole discretion only for the Principal Investment Manager or its affiliates, investment funds or any other investment vehicles, managed, advised or promoted by Principal Investment Manager or its affiliates or the Principal Investment Manager’s clients having a discretionary or advisory mandate or specific investment services agreement with Principal Investment Manager or its affiliates that were previously invested in the Class C Shares or any other investors who are prior approved by the Directors at their sole discretion; 2 The Class T Shares are only available to specific investors introduced by the Portfolio Manager who have a discretionary or advisory mandate or specific investment services agreement with the Portfolio Manager; 3 The Class A Shares are only available to the Principal Investment Manager or its affiliates, investment funds or any other investment vehicles, managed, advised or promoted by Principal Investment Manager or its affiliates or Principal Investment Manager’s clients having a discretionary or advisory mandate or specific investment services agreement with Principal Investment Manager or its affiliates or at the sole discretion of the Directors; 4 The Class B Shares are only available to: (i) investors who purchase Shares through financial intermediary entities (such as a fund platform or a wealth management firm) which provide fee based investment advisory services to investors under a separate investment management agreement and which are prior approved by the Principal Investment Manager; or (ii) investors who are prior approved by the Directors in their sole discretion. No financial intermediary entity is entitled to receive retrocessions in relation to a Shareholder’s investment in Class B share. The Class B Shares are retail distribution review (RDR) compliant; 5 The Class C Shares are closed to new or subsequent subscription requests unless permitted otherwise by the Directors only for investors who are prior approved by the Directors at their sole discretion; 6 The Class E Shares and Class G Shares are only available to: (i) investors who purchase shares through financial intermediary entities having a specific arrangement with the Principal Investment Manager or affiliates, or (ii) investors who are prior approved by the Directors in their sole discretion; 7 The Class A EUR Shares, Class A CHF Shares, Class B GBP Shares, Class B EUR Shares, Class B CHF Shares, Class C EUR Shares, Class C CHF Shares, Class C SEK Shares, Class D EUR Shares, Class D CHF Shares, Class D SEK Shares, Class D GBP Shares, Class E GBP Shares, Class E EUR Shares, Class E CHF Shares, Class E SEK Shares, Class F EUR Shares, Class I EUR Shares, Class I CHF Shares, Class I GBP Shares, Class I SEK Shares and Class G EUR Shares are “Currency Hedged Class” as described in the Prospectus under “Hedged Classes – Currency Hedged Classes”. Accordingly, the Principal Investment Manager will seek, on behalf of the Company, to hedge the exchange rate fluctuation risks between the designated currency of such Classes of Shares and the Base Currency. USD shares are available at an issue price of US$100 per share, EUR shares available at an issue price of €100 per share, CHF shares available at an issue price CHF100 per share, GBP shares available at an issue price GBP100 per share and SEK shares available at an issue price SEK100 per share.

U ACCESS (IRELAND) UCITS PLC
NOTES TO FINANCIAL STATEMENTS (CONTINUED)
29
7. Share transactions (continued) The table below outlines the share classes available as at 30 June 2017 for U Access (IRL) Electron Global Utility Fund:
U Access (IRL) Electron Global Utility Fund
Class A 1 Class C 2 Class D Class F 3 Class H 4 Class T 4
CHF 5 CHF 5 CHF 5 CHF 5 CHF 5 CHF 5
EUR 5 EUR 5 EUR 5 EUR 5 EUR 5 EUR 5
GBP 5 GBP 5 GBP 5 GBP 5 GBP 5 GBP 5
USD SEK 5 SEK 5 USD USD USD
USD USD 1The Class A Shares are only available to the Principal Investment Manager or its affiliates, investment funds or any other investment vehicles, managed, advised or promoted by Principal Investment Manager or its affiliates or its Clients having a discretionary or advisory mandates or specific investment services agreement with Principal Investment Manager or its affiliates or at the sole discretion of the Directors; 2 The Class C Shares are only available to investors who are prior approved by the Directors at their sole discretion; 3 The Class F Shares are closed to new or subsequent subscription unless permitted otherwise by the Directors at their sole discretion only for the Principal Investment Manager or its affiliates, investment funds or any other investment vehicles, managed, advised or promoted by Principal Investment Manager or its affiliates or its Clients having a discretionary or advisory mandates or specific investment services agreement with Principal Investment Manager or its affiliates any other investors who are prior approved by the Directors at their sole discretion; 4 The Class H and Class T Shares are only available to specific investors who are prior approved both by the Portfolio Manager and the Principal Investment Manager; and 5 The Class A EUR Shares, Class A CHF Shares, Class A GBP Shares, Class C EUR Shares, Class C CHF Shares, Class C GBP Shares, Class C SEK, Class D EUR Shares, Class D CHF Shares, Class D GBP Shares, Class D SEK, Class F EUR Shares, Class F CHF Shares, Class F GBP Shares, Class H EUR Shares, Class H CHF Shares, Class H GBP shares, Class T EUR Shares, Class T CHF Shares and Class T GBP Shares are “Currency Hedged Class” as described in the Prospectus under “Hedged Classes – Currency Hedged Classes”. Accordingly, the Principal Investment Manager will seek, on behalf of the Company, to hedge the exchange rate fluctuation risks between the designated currency of such Classes of Shares and the Base Currency. USD shares are available at an issue price of US$100 per share, EUR shares available at an issue price of €100 per share, CHF shares available at an issue price CHF100 per share, GBP shares available at an issue price GBP100 per share and SEK shares available at an issue price SEK100 per share.

U ACCESS (IRELAND) UCITS PLC
NOTES TO FINANCIAL STATEMENTS (CONTINUED)
30
7. Share transactions (continued)
Share movements during the period ended 30 June 2017 for each share class are as follows: U Access (IRL) Trend Macro
Shares Sharesoutstanding Shares Shares outstanding
Classes 1 January 2017 Issued Redeemed Switch In Switch Out 30 June 2017
Class A EUR 44,597 8,967 (5,799) - - 47,765 Class A USD 273,678 6,193 (89,201) - - 190,670 Class B CHF 28,242 4,464 - - - 32,706 Class B EUR 622,000 141,173 (31,683) - - 731,490 Class B GBP 572,817 105,157 (39,233) - - 638,741 Class B USD 333,884 86,257 (83,679) 21,247 (1,726) 355,983 Class C CHF 13,166 1,835 (806) - - 14,195 Class C EUR 84,970 - (20,760) - - 64,210 Class C SEK 226,999 - (29,968) - - 197,031 Class C USD 116,410 - (13,500) - - 102,910 Class D CHF 20,160 478 - - - 20,638 Class D EUR 137,070 22,061 (50,685) - - 108,446 Class D GBP - 1,500 - - - 1,500 Class D SEK 1,440,953 269,827 (247,211) - - 1,463,569 Class D USD 614,242 181,323 (51,519) - (21,400) 722,646 Class E EUR 83,874 8,972 (64,450) - - 28,396 Class E USD 5,693 9,481 (1,788) - - 13,386 Class F USD 25,216 - - - - 25,216 Class G EUR - 219,432 (8,361) - - 211,071 Class I EUR 16,277 279,533 (11,211) - - 284,599 Class I GBP 686 - - 686 Class I USD 264,554 15,419 (26,418) 1,876 (499) 254,932 Class T USD 31,704 - (31,704) - - -
U Access (IRL) Electron Global Utility Fund
Shares Sharesoutstanding Shares Shares outstanding
Classes 1 January 2017 Issued Redeemed Switch In Switch Out 30 June 2017
Class A EUR 3,000 - (3,000) - - - Class A USD 51,189 22,287 (4,602) - - 68,874 Class D EUR 5,799 25,617 (1,689) - - 29,727 Class D GBP 644 2,040 (374) - - 2,310 Class D USD 128,347 53,424 (28,111) - - 153,660 Class F USD 114,017 19 (12,259) - - 101,777 Class H USD 10,000 7,529 - - - 17,529 Class T EUR 45,031 - - - - 45,031 Class T USD 236,303 - (10,971) - - 225,332

U ACCESS (IRELAND) UCITS PLC
NOTES TO FINANCIAL STATEMENTS (CONTINUED)
31
7. Share transactions (continued)
Share movements during the year ended 31 December 2016 for each share class are as follows: U Access (IRL) Trend Macro
Shares Sharesoutstanding Shares Shares outstanding
Classes 1 January 2016 Issued Redeemed Switch In Switch Out 31 December 2016
Class A EUR 20,000 45,811 (21,214) - - 44,597 Class A USD 62,862 227,844 (38,748) 21,720 - 273,678 Class B CHF - 28,242 - - - 28,242 Class B EUR 160,631 578,439 (88,369) - (28,701) 622,000 Class B GBP 390,007 319,014 (136,204) - - 572,817 Class B USD 89,506 348,482 (112,305) 43,721 (35,520) 333,884 Class C CHF 3,750 9,416 - - - 13,166 Class C EUR 223,362 - (70,681) - (67,711) 84,970 Class C SEK 334,090 - (107,091) - - 226,999 Class C USD 47,593 475 (42,663) 111,005 - 116,410 Class D CHF 13,032 9,027 (1,899) - - 20,160 Class D EUR 174,729 81,184 (118,843) - - 137,070 Class D SEK 1,081,796 971,790 (612,633) - - 1,440,953 Class D USD 331,072 416,573 (99,389) - (34,014) 614,242 Class E EUR 831 85,953 (2,910) - - 83,874 Class E GBP 1,250 - (1,250) - - - Class E USD 2,585 3,108 - - - 5,693 Class F EUR 28,276 - (28,276) - - - Class F USD 33,109 - (7,893) - - 25,216 Class I EUR - 16,277 - - - 16,277 Class I GBP - 686 - - - 686 Class I USD - 269,555 (5,001) - - 264,554 Class T USD 43,174 - (11,470) - - 31,704
U Access (IRL) Electron Global Utility Fund
Shares Sharesoutstanding Shares Shares outstanding
Classes 1 January 2016 Issued Redeemed Switch In Switch Out 31 December 2016
Class A EUR 3,000 307 (307) - - 3,000 Class A USD 16,185 11,983 - 23,021 - 51,189 Class C USD 1,000 - (1,000) - - - Class D EUR 2,545 8,278 (5,024) - - 5,799 Class D GBP - 644 - - - 644 Class D USD - 157,358 (6,466) - (22,545) 128,347 Class F EUR 41,856 - (41,856) - - - Class F USD 122,652 64,802 (73,437) - - 114,017 Class H USD - 11,700 (1,700) - - 10,000 Class T EUR - 45,031 - - - 45,031 Class T USD 301,297 34,289 (99,283) - - 236,303

U ACCESS (IRELAND) UCITS PLC
NOTES TO FINANCIAL STATEMENTS (CONTINUED)
32
7. Share transactions (continued)
For any Class of Shares, a Subscription Charge not exceeding 5% of the Subscription Price may be applied by financial intermediaries involved in the subscription of the Shares. The authorised share capital of the Company is 300,000 non-participating subscriber shares of one Euro each and 500,000,000,000 shares of no par value initially designated as unclassified participating shares. Non-participating shares do not entitle the holders thereof to any dividend and on a winding up entitle the holders thereof to receive the consideration paid therefor but do not otherwise entitle them to participate in the assets of the Company. The Directors have the power to allot shares in the capital of the Company on such terms and in such manner as they may think fit. Shareholders may redeem their Shares on a dealing day at the repurchase price which shall be the NAV per share, less Repurchase Charge, if any and any applicable duties and charges (save during any period when the calculation of the NAV is suspended). The Repurchase Charge is up to a maximum of 3% of repurchase monies. The dealing day is weekly. If requested, the Directors may, in their absolute discretion and subject to the prior approval of the Depositary, agree to designate additional dealing days for the repurchase of Shares relating to any Fund which will be open to all Shareholders. Any such additional dealing days and valuation points designated shall be notified to all Shareholders in the relevant Fund in advance.
8. Fee arrangements
Platform Fee (payable to Principal Investment Manager and to the Manager) The Principal Investment Manager is paid an annual fee (the “Platform Fee”) out of the assets of the Company on behalf of each Fund, calculated and accrued at each valuation point and payable monthly in arrears.
U Access (IRL) Trend Macro From 1 January 2016 to 17 March 2016, a maximum Platform Fee of 0.35% of net asset value of the Fund was payable. Effective from 18 March 2016, a maximum Platform Fee of 0.30% of the net asset value of the Fund was payable. For the period ended 30 June 2017, the Fund incurred a total Platform Fee of US$509,618 (30 June 2016: US$328,260) of which US$459,785 was payable at the period end (31 December 2016: US$220,534). U Access (IRL) Electron Global Utility Fund From 1 January 2016 to 17 March 2016, a maximum Platform Fee of 0.35% of net asset value of the Fund was payable. Effective from 18 March 2016, a maximum Platform Fee of 0.30% of the net asset value of the Fund was payable. For the period ended 30 June 2017, the Fund incurred a total Platform Fee of US$93,330 (30 June 2016: US$85,581) of which US$85,547 was payable at the period end (31 December 2016: US$44,673). Management Fee and Incentive Fee The Management Fee consists of a fee paid to the Portfolio Manager (the “Portfolio Management Fee”), to the Sourcing Agent up to 17 March 2016 (the “Sourcing Fee”) and to the Investment Manager from 18 March 2016 (the “Investment Management fee”). (a) Portfolio Management Fee With respect to each class of shares, the Funds shall pay a Portfolio Management Fee equal to the percentages set forth in the table overleaf of the NAV of the applicable class of shares. The Portfolio Management Fee shall be calculated at each valuation point, paid monthly in arrears and prorated for any partial period. U Access (IRL) Trend Macro For the period ended 30 June 2017, the Fund incurred a Portfolio Management Fee of US$2,492,631 (30 June 2016: US$1,426,745) of which US$930,542 was payable at the period end (31 December 2016: US$398,294). U Access (IRL) Electron Global Utility Fund For the period ended 30 June 2017, the Fund incurred a Portfolio Management Fee of US$340,881 (30 June 2016: US$291,734) of which US$63,800 was payable at the period end (31 December 2016: US$53,872).

U ACCESS (IRELAND) UCITS PLC
NOTES TO FINANCIAL STATEMENTS (CONTINUED)
33
8. Fee arrangements (continued) Management Fee and Incentive Fee (continued) (b) Investment Management Fee Effective from 18 March 2016, with respect to certain Classes of Shares, the Fund shall pay an Investment Management Fee equal to the percentage set forth in the table overleaf of the Net Asset Value of the applicable Class of Shares as of each Valuation Point, paid monthly in arrears and prorated for any partial period. Prior to 18 March 2016, such fees were referred to as sourcing fees.
U Access (IRL) Trend Macro For the period ended 30 June 2017, the Fund incurred an Investment Management Fee of US$837,516 (30 June 2016: US$290,972) of which US$833,040 was payable at the period end (31 December 2016: US$354,478). U Access (IRL) Electron Global Utility Fund For the period ended 30 June 2017, the Fund incurred an Investment Management Fee of US$38,670 (30 June 2016: US$3,219) of which US$38,671 was payable at the period end (31 December 2016: US$17,192). (c) Sourcing Fee Prior to18 March 2016, with respect to certain Classes of Shares, the Funds paid the Sourcing Agent a fee (the “sourcing Fee”) equal to the percentage set forth in the table overleaf of the Net Asset Value of the applicable Class of Shares as of each Valuation Point, paid monthly in arrears and prorated for any partial period. U Access (IRL) Trend Macro For the period to 17 March 2016, the Fund incurred a sourcing Fee of US$158,147 of which US$Nil was payable at the period end. U Access (IRL) Electron Global Utility Fund For the period to 17 March 2016, the Fund incurred a sourcing fee of US$496 of which US$Nil was payable at the period end. d) Incentive Fee With respect to each class of shares and Performance Period (as defined in the Funds’ Supplements to the Prospectus), the Company shall pay the Portfolio Manager an incentive fee (the “Incentive Fee”) equal to the percentage set forth in the table overleaf of the Net Profits (as defined in the Funds’ Supplements to the Prospectus) for each class of shares for such Performance Period as set forth in the table overleaf of the Net Profits of the applicable class of shares for each Performance Period. The Incentive Fee shall be calculated at each valuation point, accrued with respect to all shares in the applicable class, and paid annually in arrears. U Access (IRL) Trend Macro As of the 30 June 2017, the provision of the Fund for Incentive Fees was US$37,585 (31 December 2016: US$1,829,938) and the crystallised incentive fees amount on redemption since the beginning of the period was US$63 (from 1 January 2016 to 30 June 2016 US$65,844). During the period the Fund incurred total Incentive Fees of US$37,648 (from 1 January 2016 to 30 June 2016 US$2,001,911). U Access (IRL) Electron Global Utility Fund As of the 30 June 2017, the provision of the Fund for Incentive Fees was US$677,507 (31 December 2016: US$Nil) and the crystallised incentive fees amount on redemption since the beginning of the period was US$36,275 (from 1 January 2016 to 30 June 2016 US$Nil). During the period the Fund incurred total Incentive Fees of US$696,069 (from 1 January 2016 to 30 June 2016 US$1,854). Each of the Principal Investment Manager, the Portfolio Manager reserves the right to waive or rebate a portion or all of the applicable Investment Management Fee, Portfolio Management Fee, Incentive Fee or the Sourcing Fee/Investment Management fee to which it is entitled in respect of one or more classes of shares or shareholders.

U ACCESS (IRELAND) UCITS PLC
NOTES TO FINANCIAL STATEMENTS (CONTINUED)
34
8. Fee arrangements (continued) Management Fee and Incentive Fee (continued) U Access (IRL) Trend Macro The Management Fees schedule in force from 1 January 2017 to 30 June 2017 (consisting of the Portfolio Management Fee and, if applicable, the Investment Management Fee) and Incentive Fees for each class of Shares for U Access (IRL) UCITS Trend Macro were:
Class I
Shares
Management Fee
Up to 2.0% per annum2
1.50% per annum
1.50% per annum
2.0% per annum
2.0% per annum
Up to 1.5% per annum1
Up to 2.0% per annum1
1.50% per annum
1.50% per annum
Including:
Portfolio Management Fee
1.50%2 1.10% 1.00% 1.50% 1.10% 1.00%1 1.10% 1.50% 1.10%
and
Investment Management Fee
0.50%2 0.40% 0.50% 0.50% 0.90% 0.50%1 0.90% 0.00% 0.40%
16.75% of the Net
15% of the Net
20% of the Net
20% of the Net
15% of the Net
20% of the Net
10% of the Net
Profits Profits Profits Profits Profits Profits Profits
Class F Shares
Class T Shares
Incentive Fee20% of the Net Profits
20% of the Net Profits
Class G Shares
Class A Shares
Class B Shares
Class C Shares
Class D Shares
Class E Shares
1
The Management Fee will be up to 1.50% consisting of a Portfolio Management Fee of 1.00% per annum and a maximum Investment Management Fee of 0.50% per annum.
2 The Management Fee will be up to 2.00% consisting of a Portfolio Management Fee of 1.50% per annum and a maximum Investment Management
Fee of 0.50% per annum.
The Management Fees schedule in force from 1 January 2016 to 30 June 2016 (consisting of the Portfolio Management Fee and, if applicable, the Sourcing Fee) and Incentive Fees for each class of Shares for U Access (IRL) Trend Macro were:
Class A Shares
Class B Shares
Class C Shares
Class D Shares
Class E Shares
Class F Shares
Class T Shares
Class I Shares
Management FeeUp to 2.0% per annum2
1.50% per annum
1.50% per annum
2.0% per annum
2.0% per annum
Up to 1.5% per annum1
1.50% per annum
1.50% per annum
Including:
Portfolio Management Fee
1.50%2 1.10% 1.00% 1.50% 1.10% 1.00%1 1.50% 1.10%
and
Sourcing Fee/Investment Management Fee
0.50%2 0.40% 0.50% 0.50% 0.90% 0.50%1 0.00% 0.40%
16.75% of the Net
15% of the Net
20% of the Net
20% of the Net
15% of the Net
10% of the Net
20% of the Net
Profits Profits Profits Profits Profits Profits ProfitsIncentive Fee
20% of the Net Profits
1
The Management Fee will be up to 1.50% consisting of a Portfolio Management Fee of 1.00% per annum and a maximum Sourcing Fee of 0.50% per annum. 2
The Management Fee will be up to 2.00% consisting of a Portfolio Management Fee of 1.50% per annum and a maximum Sourcing Fee of 0.50% per annum.

U ACCESS (IRELAND) UCITS PLC
NOTES TO FINANCIAL STATEMENTS (CONTINUED)
35
8. Fee arrangements (continued) Management Fee and Incentive Fee (continued) U Access (IRL) Electron Global Utility Fund The Management Fees schedule in force from 1 January 2017 to 30 June 2017 (consisting of the Portfolio Management Fee and, if applicable, the Investment Management Fee) and Incentive Fees for each class of Shares for the U Access (IRL) Electron Global Utility Fund were:
Class A Shares
Class C Shares
Class D Shares
Class F Shares
Class H Shares
Class T Shares
Management Fee1.50% per
annum1
1.25% per annum
1.50% per annum
Up to 1.25% per annum2
1.50% per annum
1.25% per annum
Including:
Portfolio Management Fee
and
Investment Management Fee
0.50%1 0.416% 0.50% 0.416%2 0% 0%
Incentive Fee20% of the Net
Profits15% of the Net
Profits20% of the Net
Profits15% of the Net
Profits20% of the Net
Profits15% of the Net Profits
1.25%1.00%1 0.833% 1.00% 0.833%2 1.50%
1
The Management Fee will be up to 1.50% consisting of a Portfolio Management Fee of 1.00% per annum and a maximum Investment Management Fee of 0.50% per annum.
2 The Management Fee will be up to 1.25% consisting of a Portfolio Management Fee of 0.833% per annum and a maximum Investment Management
Fee of 0.416% per annum. The Management Fees schedule in force from 1 January 2016 to 30 June 2016 (consisting of the Portfolio Management Fee and, if applicable, the Sourcing Fee) and Incentive Fees for each class of Shares for the U Access (IRL) Electron Global Utility Fund were:
Class A Shares
Class C Shares
Class D Shares
Class F Shares
Class H Shares
Class T Shares
Management Fee1.50% per
annum1
1.25% per annum
1.50% per annum
Up to 1.25% per annum2
1.50% per annum
1.25% per annum
Including:
Portfolio Management Fee 1.00%1 0.833% 1.00% 0.833%2 1.50% 1.25%
and
Sourcing Fee/Investment Management Fee
0.50%1 0.416% 0.50% 0.416%2 0% 0%
Incentive Fee20% of the Net
Profits15% of the Net
Profits20% of the Net
Profits15% of the Net
Profits20% of the Net
Profits15% of the Net
Profits 1
The Management Fee will be up to 1.50% consisting of a Portfolio Management Fee of 1.00% per annum and a maximum Investment Management Fee of 0.50% per annum.
2 The Management Fee will be up to 1.25% consisting of a Portfolio Management Fee of 0.833% per annum and a maximum Investment Management
Fee of 0.416% per annum. Administrator’s Fees U Access (IRL) Trend Macro The Administrator shall be paid an annual fee out of the assets of the Company on behalf of the Fund, calculated and accrued at each Valuation Point and payable monthly in arrears at a rate which shall not exceed 0.15% per annum of the Net Asset Value of the Fund plus VAT, if any, thereon subject to a minimum of $120,000 per annum. For the period ended 30 June 2017, the Fund incurred an Administration Fee of US$138,219 (30 June 2016: US$99,919) of which US$75,936 (31 December 2016: US$75,852) was payable at the period end.
U ACCESS (IRELAND) UCITS PLC
NOTES TO FINANCIAL STATEMENTS (CONTINUED)
36
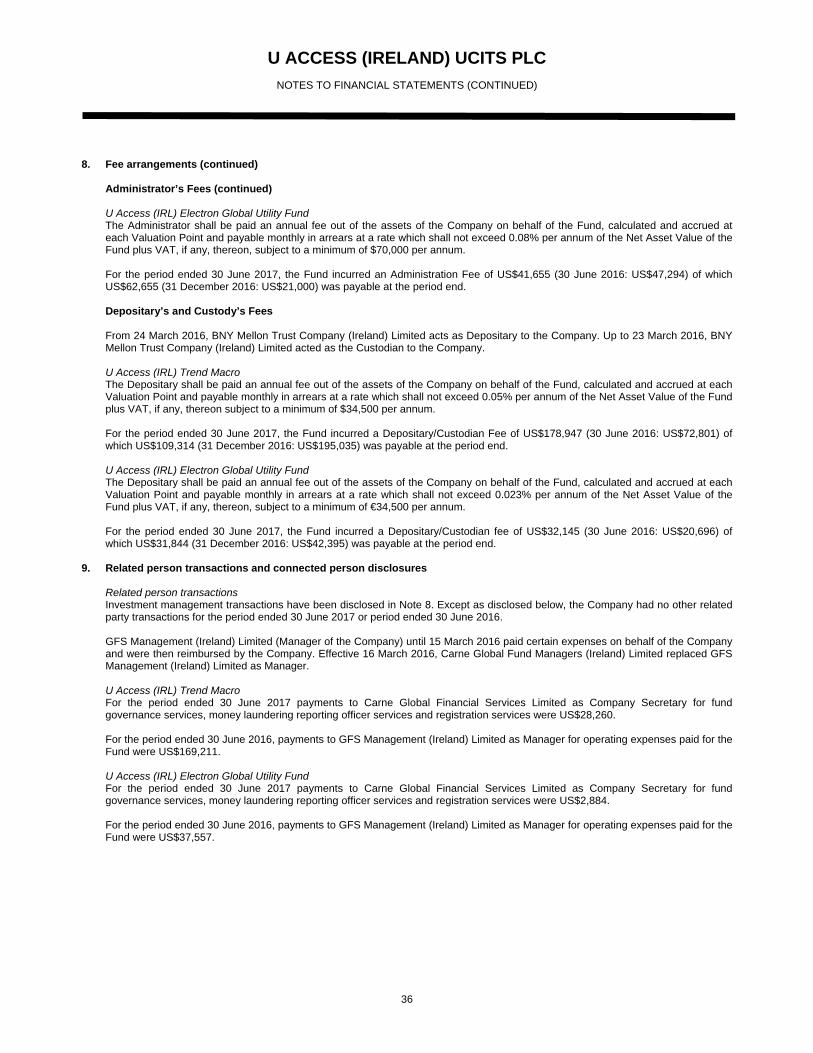
8. Fee arrangements (continued) Administrator’s Fees (continued) U Access (IRL) Electron Global Utility Fund The Administrator shall be paid an annual fee out of the assets of the Company on behalf of the Fund, calculated and accrued at each Valuation Point and payable monthly in arrears at a rate which shall not exceed 0.08% per annum of the Net Asset Value of the Fund plus VAT, if any, thereon, subject to a minimum of $70,000 per annum. For the period ended 30 June 2017, the Fund incurred an Administration Fee of US$41,655 (30 June 2016: US$47,294) of which US$62,655 (31 December 2016: US$21,000) was payable at the period end. Depositary’s and Custody’s Fees From 24 March 2016, BNY Mellon Trust Company (Ireland) Limited acts as Depositary to the Company. Up to 23 March 2016, BNY Mellon Trust Company (Ireland) Limited acted as the Custodian to the Company.
U Access (IRL) Trend Macro The Depositary shall be paid an annual fee out of the assets of the Company on behalf of the Fund, calculated and accrued at each Valuation Point and payable monthly in arrears at a rate which shall not exceed 0.05% per annum of the Net Asset Value of the Fund plus VAT, if any, thereon subject to a minimum of $34,500 per annum. For the period ended 30 June 2017, the Fund incurred a Depositary/Custodian Fee of US$178,947 (30 June 2016: US$72,801) of which US$109,314 (31 December 2016: US$195,035) was payable at the period end. U Access (IRL) Electron Global Utility Fund The Depositary shall be paid an annual fee out of the assets of the Company on behalf of the Fund, calculated and accrued at each Valuation Point and payable monthly in arrears at a rate which shall not exceed 0.023% per annum of the Net Asset Value of the Fund plus VAT, if any, thereon, subject to a minimum of €34,500 per annum. For the period ended 30 June 2017, the Fund incurred a Depositary/Custodian fee of US$32,145 (30 June 2016: US$20,696) of which US$31,844 (31 December 2016: US$42,395) was payable at the period end.
9. Related person transactions and connected person disclosures Related person transactions
Investment management transactions have been disclosed in Note 8. Except as disclosed below, the Company had no other related party transactions for the period ended 30 June 2017 or period ended 30 June 2016. GFS Management (Ireland) Limited (Manager of the Company) until 15 March 2016 paid certain expenses on behalf of the Company and were then reimbursed by the Company. Effective 16 March 2016, Carne Global Fund Managers (Ireland) Limited replaced GFS Management (Ireland) Limited as Manager. U Access (IRL) Trend Macro For the period ended 30 June 2017 payments to Carne Global Financial Services Limited as Company Secretary for fund governance services, money laundering reporting officer services and registration services were US$28,260. For the period ended 30 June 2016, payments to GFS Management (Ireland) Limited as Manager for operating expenses paid for the Fund were US$169,211. U Access (IRL) Electron Global Utility Fund For the period ended 30 June 2017 payments to Carne Global Financial Services Limited as Company Secretary for fund governance services, money laundering reporting officer services and registration services were US$2,884. For the period ended 30 June 2016, payments to GFS Management (Ireland) Limited as Manager for operating expenses paid for the Fund were US$37,557.

U ACCESS (IRELAND) UCITS PLC
NOTES TO FINANCIAL STATEMENTS (CONTINUED)
37
9. Related person transactions and connected person disclosures (continued) Each of the Directors is entitled to remuneration for services to the Company as follows: Patrick Palffy and Rémy Portes are employees of Union Bancaire Privée, UBP SA (the Principal Investment Manager) and are not entitled to receive Directors’ fees from the Company. Syl O’Byrne is an employee of Carne Global Financial Services Limited (the Company Secretary) and is entitled to an annual director’s fee of €5,500. Bryan Tiernan (Independent Director of the Company) is entitled to an annual director’s fee of €17,500 from 1 January 2017 (31 December 2016: €15,000). Connected person disclosures The Directors are satisfied that there are arrangements (evidenced by written procedures) in place to ensure that transactions carried out with connected parties of the Company are carried out as if negotiated at arm’s length and any such transactions are in the best interests of the Shareholders of the Company. The Directors are satisfied that any transactions entered into with connected parties during the period complied with the aforementioned obligation.
10. Research and data expenses
The Company reimburses the Portfolio Managers for research/financial data expenses. U Access (IRL) Trend Macro For the period ended 30 June 2017, payments to the Portfolio Managers for research expenses for the Fund were US$86,713 (30 June 2016: US$90,958). U Access (IRL) Electron Global Utility Fund For the period ended 30 June 2017, payments to the Portfolio Managers for research expenses for the Fund were US$12,514 (30 June 2016: US$16,731).
11. Organisation Costs As per the supplements to the Prospectus both Funds amortise organisational expenses which is divergent with accounting standard IAS 38 “Intangible Assets“. The difference in this instance is immaterial as disclosed below: For the period ended 30 June 2017
U Access (IRL) Trend
Macro
U Access (IRL)
Electron Global Utility
Fund TotalUS$ US$ US$
Net Assets Attributable to holders of redeemable shares per financial statements 459,111,705 69,178,984 528,290,689
Add back Organisational Expenses in accordance w ith IAS 38 (20,822) (44,959) (65,781)
Net Assets Attributable to holders of redeemable shares per IAS 38 459,090,883 69,134,025 528,224,908
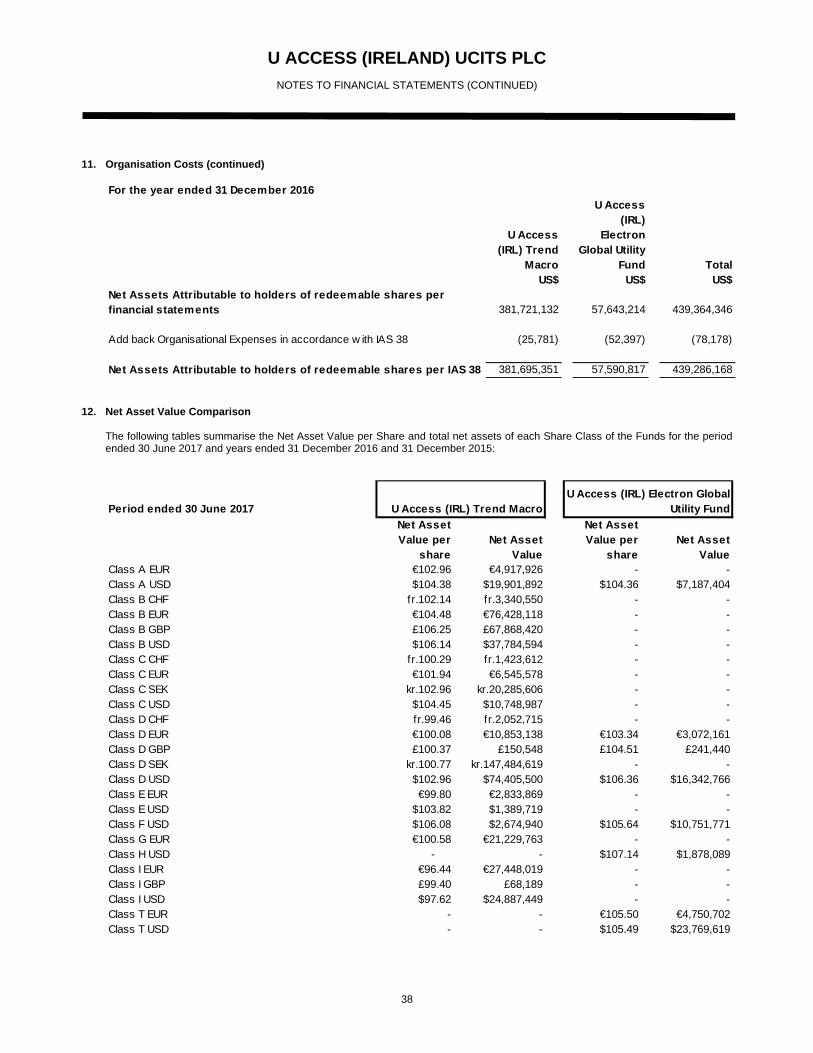
U ACCESS (IRELAND) UCITS PLC
NOTES TO FINANCIAL STATEMENTS (CONTINUED)
38
11. Organisation Costs (continued) For the year ended 31 December 2016
U Access (IRL) Trend
Macro
U Access (IRL)
Electron Global Utility
Fund TotalUS$ US$ US$
Net Assets Attributable to holders of redeemable shares per financial statements 381,721,132 57,643,214 439,364,346
Add back Organisational Expenses in accordance w ith IAS 38 (25,781) (52,397) (78,178)
Net Assets Attributable to holders of redeemable shares per IAS 38 381,695,351 57,590,817 439,286,168
12. Net Asset Value Comparison
The following tables summarise the Net Asset Value per Share and total net assets of each Share Class of the Funds for the period ended 30 June 2017 and years ended 31 December 2016 and 31 December 2015:
Period ended 30 June 2017
Net Asset Value per
shareNet Asset
Value
Net Asset Value per
shareNet Asset
ValueClass A EUR €102.96 €4,917,926 - - Class A USD $104.38 $19,901,892 $104.36 $7,187,404Class B CHF fr.102.14 fr.3,340,550 - - Class B EUR €104.48 €76,428,118 - - Class B GBP £106.25 £67,868,420 - - Class B USD $106.14 $37,784,594 - - Class C CHF fr.100.29 fr.1,423,612 - - Class C EUR €101.94 €6,545,578 - - Class C SEK kr.102.96 kr.20,285,606 - - Class C USD $104.45 $10,748,987 - - Class D CHF fr.99.46 fr.2,052,715 - - Class D EUR €100.08 €10,853,138 €103.34 €3,072,161Class D GBP £100.37 £150,548 £104.51 £241,440Class D SEK kr.100.77 kr.147,484,619 - - Class D USD $102.96 $74,405,500 $106.36 $16,342,766Class E EUR €99.80 €2,833,869 - - Class E USD $103.82 $1,389,719 - - Class F USD $106.08 $2,674,940 $105.64 $10,751,771Class G EUR €100.58 €21,229,763 - - Class H USD - - $107.14 $1,878,089Class I EUR €96.44 €27,448,019 - - Class I GBP £99.40 £68,189 - - Class I USD $97.62 $24,887,449 - - Class T EUR - - €105.50 €4,750,702Class T USD - - $105.49 $23,769,619
U Access (IRL) Trend MacroU Access (IRL) Electron Global
Utility Fund
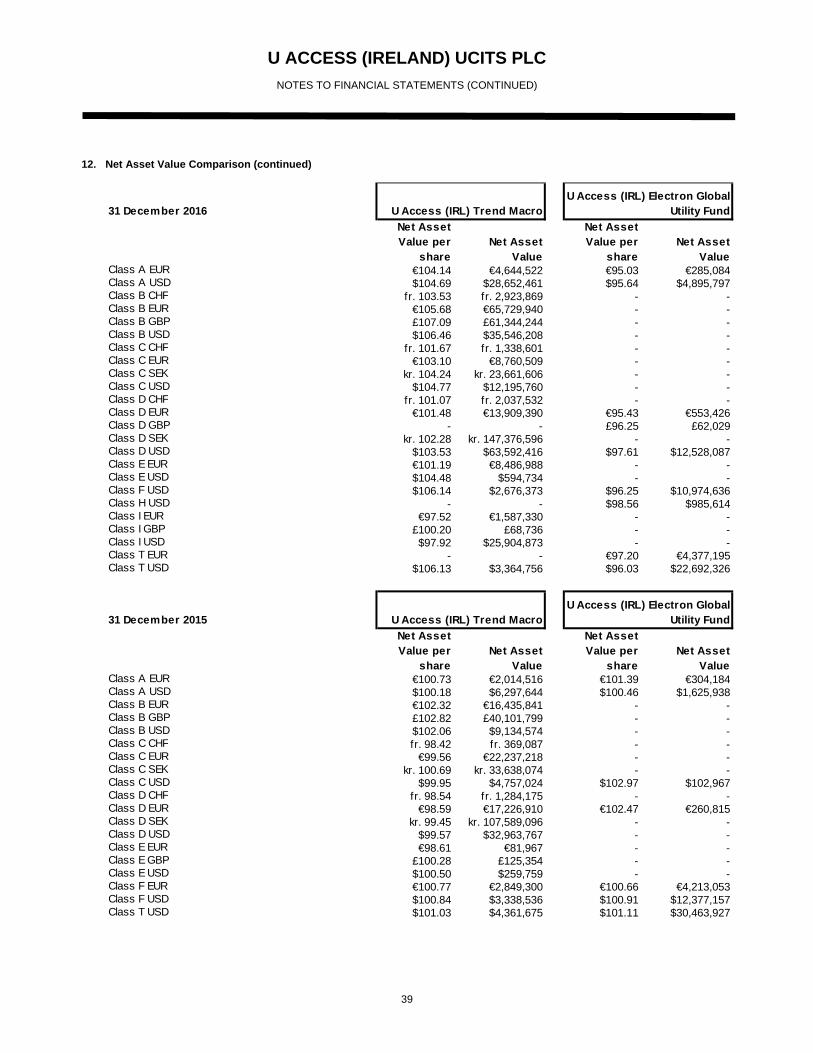
U ACCESS (IRELAND) UCITS PLC
NOTES TO FINANCIAL STATEMENTS (CONTINUED)
39
12. Net Asset Value Comparison (continued)
31 December 2016
Net Asset Value per
shareNet Asset
Value
Net Asset Value per
shareNet Asset
ValueClass A EUR €104.14 €4,644,522 €95.03 €285,084Class A USD $104.69 $28,652,461 $95.64 $4,895,797Class B CHF fr. 103.53 fr. 2,923,869 - - Class B EUR €105.68 €65,729,940 - - Class B GBP £107.09 £61,344,244 - - Class B USD $106.46 $35,546,208 - - Class C CHF fr. 101.67 fr. 1,338,601 - - Class C EUR €103.10 €8,760,509 - - Class C SEK kr. 104.24 kr. 23,661,606 - - Class C USD $104.77 $12,195,760 - - Class D CHF fr. 101.07 fr. 2,037,532 - - Class D EUR €101.48 €13,909,390 €95.43 €553,426Class D GBP - - £96.25 £62,029Class D SEK kr. 102.28 kr. 147,376,596 - - Class D USD $103.53 $63,592,416 $97.61 $12,528,087Class E EUR €101.19 €8,486,988 - - Class E USD $104.48 $594,734 - - Class F USD $106.14 $2,676,373 $96.25 $10,974,636Class H USD - - $98.56 $985,614Class I EUR €97.52 €1,587,330 - - Class I GBP £100.20 £68,736 - - Class I USD $97.92 $25,904,873 - - Class T EUR - - €97.20 €4,377,195Class T USD $106.13 $3,364,756 $96.03 $22,692,326
31 December 2015
Net Asset Value per
shareNet Asset
Value
Net Asset Value per
shareNet Asset
ValueClass A EUR €100.73 €2,014,516 €101.39 €304,184Class A USD $100.18 $6,297,644 $100.46 $1,625,938Class B EUR €102.32 €16,435,841 - - Class B GBP £102.82 £40,101,799 - - Class B USD $102.06 $9,134,574 - - Class C CHF fr. 98.42 fr. 369,087 - - Class C EUR €99.56 €22,237,218 - - Class C SEK kr. 100.69 kr. 33,638,074 - - Class C USD $99.95 $4,757,024 $102.97 $102,967Class D CHF fr. 98.54 fr. 1,284,175 - - Class D EUR €98.59 €17,226,910 €102.47 €260,815Class D SEK kr. 99.45 kr. 107,589,096 - - Class D USD $99.57 $32,963,767 - - Class E EUR €98.61 €81,967 - - Class E GBP £100.28 £125,354 - - Class E USD $100.50 $259,759 - - Class F EUR €100.77 €2,849,300 €100.66 €4,213,053Class F USD $100.84 $3,338,536 $100.91 $12,377,157Class T USD $101.03 $4,361,675 $101.11 $30,463,927
U Access (IRL) Trend MacroU Access (IRL) Electron Global
Utility Fund
U Access (IRL) Trend MacroU Access (IRL) Electron Global
Utility Fund

U ACCESS (IRELAND) UCITS PLC
NOTES TO FINANCIAL STATEMENTS (CONTINUED)
40
13. Exchange Rates The financial statements are prepared in US Dollars. The following exchange rates at 30 June 2017 and 31 December 2016 have been used to translate assets and liabilities in other currencies into US Dollars:
30 June 2017 31 December 2016Argentine peso 0.0602 0.0630Australian dollar 0.7686 0.7213Brazilian real 0.3002 0.3068Canadian dollar 0.7711 - Chilean peso - 0.0015Chinese yuan Hong Kong 0.1475 - Chinese renminbi yuan 0.1475 - Czech koruna 0.0437 - Egyptian pound 0.0552 - Euro 1.1422 1.0527Ghana cedi 0.2273 0.2324Hungarian forint 0.0037 0.0034Indian rupee 0.0155 0.0147Indonesian rupiah 0.0001 0.0001Japanese yen 0.0089 0.0086Kenyan shilling 0.0096 0.0098Mexican peso 0.0551 0.0482New Zealand dollar 0.7328 - Norw egian krone 0.1198 - Peruvian new sol 0.3076 - Polish zloty 0.2699 - Russuan rouble 0.0170 0.0163Singapore dollar 0.7264 0.6904South Africa rand 0.0764 0.0727South Korean w on 0.0009 0.0008Sw edish krona 0.1187 0.1098Sw iss franc 1.0448 0.9840Taiw an dollar 0.0329 0.0309Turkish lira 0.2842 0.2825U.K. pound 1.3025 1.2334Uruguay peso 0.0351 0.0326
14. Transaction Costs
In order to achieve its investment objective, the Company incurs transaction costs in relation to trading activity on its portfolio. These include certain broker and commission fees incurred on trades through the period. Commission fees borne by the Company include fees of US$135,728 (30 June 2016: US$41,580). As part of its trading activity conducted with counterparties for OTC derivatives, the Company does incur other transaction costs which are not separately identifiable.
15. Dividends
There were no dividends paid during the period ended 30 June 2017 or the period ended 30 June 2016. The Directors intend to make an annual distribution to shareholders in the Class G EUR share class.
16. Soft commissions
The Principal Investment Manager did not engage in any soft commission arrangements impacting the Company during the period ended 30 June 2017 or the period ended 30 June 2016.
17. Statement of changes in the composition of the portfolio A statement of changes in the composition of the portfolio for the period ended 30 June 2017 is available to shareholders on request free of charge.

U ACCESS (IRELAND) UCITS PLC
NOTES TO FINANCIAL STATEMENTS (CONTINUED)
41
18. Efficient Portfolio Management Subject to the conditions and within the limits from time to time laid down by the Central Bank of Ireland, and except as otherwise stated in the investments objective and policies of the Company, the Investment Manager may employ financial derivative instruments (“FDI”) for efficient portfolio management purposes. Furthermore, new techniques and instruments may be developed which may be suitable for use by the Company in the future, and the Company may employ such techniques and instruments subject to the prior approval of, and any restrictions imposed by, the Central Bank of Ireland. The Principal Investment Manager of the Company has identified all FDI which are used for efficient portfolio management. A UCITS is required to disclose the revenues arising from efficient portfolio management in order to hedge currency and market exposure as well as increase capital and income returns. During the financial period, futures, options, swaps, forwards and repurchase agreements were entered into for the purpose of efficient portfolio management in order to hedge currency and market exposure and/or for investment purposes. The notional amounts are detailed in the Schedule of Investments. The total returns earned in trading in repurchase agreements was US$250,002.
19. Significant events during the period
An update to the U Access (IRL) Trend Macro supplement to the Prospectus was noted by the Central Bank of Ireland on 10 February 2017. In summary, this updated supplement included the addition of three new share classes, namely the Class G EUR Shares, Class E SEK Shares and Class I SEK Shares. The Class E SEK Shares and Class I SEK Shares are accumulating share classes. The Class G EUR share class is the first distributing share class in the sub-fund. A new Prospectus was issued for the Company dated 2 May 2017 which superseded a Prospectus dated 3 June 2016. The Prospectus was updated primarily to reflect the requirements of the European Communities (Securities Financing Transactions Regulation) 2015/2365. In addition, the supplement for U Access (IRL) Trend Macro was amended in order to provide that the current Administrator’s maximum fee of 0.15% per annum of the Net Asset Value plus VAT, if any, payable monthly in arrears, shall be subject to an annual minimum fee of $120,000 and that the current Depositary’s maximum fee of 0.05% per annum of the Net Asset Value plus VAT, if any, payable monthly in arrears, shall be subject to an annual minimum fee of $34,500. A new Prospectus was issued for the Company dated 15 June 2017 which superseded a Prospectus issued on the 2 May 2017. The Prospectus was updated in order to incorporate the Supplement for U Access (IRL) Nexthera UCITS approved by the Central Bank of Ireland on 15 June 2017.
20. Subsequent events There was one new sub-fund, U Access (IRL) Nexthera UCITS, launched on 5 July 2017.
There are no other events that would have a material impact on the financial statements subsequent to 30 June 2017.
21. Directors approval The Directors approved the financial statements on 29 August 2017.

U ACCESS (IRELAND) UCITS PLC
STATEMENT OF SIGNIFICANT PURCHASES AND SALES
(Expressed in U.S. Dollars)
42
The Statement of Significant Purchases and Sales reflects the aggregate purchases of transferable securities exceeding one percent of the total value of purchases and aggregate disposals of transferable securities greater than one percent of the total value of the sales for the period. At minimum the largest 20 purchases and 20 sales must be given or all purchases and sales if less than 20.
U Access (IRL) Trend Macro Statement of Material Purchases for the period ended 30 June 2017
CostDescription Nominal US$Spain Government Bond 1.5% 30/04/2027 69,374,000 72,173,278 United States Treasury Note/Bond 0.875% 15/04/2017 35,000,000 35,024,610 United States Treasury Note/Bond 0.625% 31/07/2017 35,000,000 34,982,227 United States Treasury Note/Bond 3.25% 31/03/2017 30,000,000 30,148,828 United States Treasury Note/Bond 0.875% 15/05/2017 30,000,000 30,023,438 United States Treasury Bill 0% 10/08/2017 30,000,000 29,938,013 United States Treasury Note/Bond 0.875% 15/06/2017 20,000,000 20,008,594 United States Treasury Note/Bond 0.875% 15/07/2017 20,000,000 20,007,813 United States Treasury Note/Bond 0.5% 31/03/2017 20,000,000 20,000,000 United States Treasury Note/Bond 0.625% 31/08/2017 20,000,000 19,984,375 United States Treasury Bill 0% 14/09/2017 20,000,000 19,961,878 Russian Federal Bond 7% 16/08/2023 1,045,564,000 17,096,623 Russian Railw ays via RZD Capital Plc 8.99% 03/03/2024 970,400,000 16,928,537 SPDR S&P U.S. Financials Select Sector UCITS ETF 533,500 12,788,945 Republic of Angola 9.5% 12/11/2025 11,753,000 12,093,484 Provincia de Entre Rios Argentina 8.75% 08/02/2025 11,718,000 11,651,781 Ecuador Government International Bond 10.75% 28/03/2022 9,328,000 9,948,152 Saderea Limited 12.5% 30/11/2026 9,028,610 9,411,038 Ukraine Government International Bond 7.75% 01/09/2022 9,532,000 9,202,386 Russian Federal Bond - OFZ 8.15% 03/02/2027 479,958,000 8,412,037 Hellenic Republic Government Bond 3.375% 17/07/2017 7,532,000 7,782,675 Uruguay Treasury Bills 0% 04/05/2018 234,500,000 7,516,335 Provincia de Buenos Aire 23.64% 31/05/2022 112,840,000 7,039,038 Egypt Treasury Bill 0% 08/08/2017 127,000,000 6,742,431 Ghana Government International Bond 7.875% 08/07/2023 5,915,881 5,737,573

U ACCESS (IRELAND) UCITS PLC
STATEMENT OF SIGNIFICANT PURCHASES AND SALES (CONTINUED)
(Expressed in U.S. Dollars)
43
U Access (IRL) Trend Macro (continued) Statement of Significant Sales for the period ended 30 June 2017
Proceeds
Description Nominal US$Spain Government Bond 1.5% 30/04/2027 (69,374,000) (72,385,937)Argentine Bonos del Tesoro 10/03/2021 (274,595,420) (19,557,222)Russian Railw ays via RZD Capital Plc 9.2% 07/10/2023 (849,400,000) (14,912,467)SPDR S&P U.S. Financials Select Sector UCITS ETF (533,500) (12,952,046)Russian Railw ays via RZD Capital Plc 8.99% 03/03/2024 (732,100,000) (12,635,176)Ecuador Government International Bond 10.75% 28/03/2022 (11,129,000) (12,359,370)Kenya Infrastructure Bond 12% 06/10/2031 (1,139,600,000) (10,002,203)Republic of Angola 9.5% 12/11/2025 (9,320,000) (9,980,872)Ukraine Government International Bond 7.75% 01/09/2022 (9,532,000) (9,442,282)Republic of Argentina 31/12/2033 (19,236,733) (9,146,371)RZD Capital Limited 8.3% 02/04/2019 (497,800,000) (8,383,970)Hellenic Republic Government Bond 3.375% 17/07/2017 (7,532,000) (8,146,695)Provincia de Mendoza Argentina 8.375% 19/05/2024 (7,656,000) (8,119,720)Russian Federal Bond - OFZ 7% 25/01/2023 (409,745,000) (6,595,543)Provincia del Chubut Argentina 7.75% 26/07/2026 (6,181,000) (6,332,193)Oschadbank Via SSB #1 Plc 9.375% 10/03/2023 (5,825,000) (5,910,985)Ghana Government International Bond 7.875% 07/08/2023 (5,915,881) (5,869,372)Russian Federal Bond - OFZ 7% 16/08/2023 (301,163,000) (4,836,021)Hellenic Republic Government Bond 4.75% 04/17/2019 (3,443,000) (3,491,726)Ukraine Government International Bond 7.75% 09/01/2020 (3,373,000) (3,358,824)

U ACCESS (IRELAND) UCITS PLC
STATEMENT OF SIGNIFICANT PURCHASES AND SALES (CONTINUED)
(Expressed in U.S. Dollars)
44
U Access (IRL) Electron Global Utility Fund Statement of Significant Purchases for the period ended 30 June 2017
Cost
Description Nominal US$Aetna Inc 55,284 8,073,285 Air Products & Chemicals Inc 55,568 8,036,421 Cognizant Technology Solutions Corporation 126,453 7,447,766 Quality Care Properties Inc 295,037 5,585,050 Advance Auto Parts Inc 31,803 5,377,206 New field Exploration Company 137,402 5,055,020 Centene Corporation 76,420 4,927,562 Ferrari N.V 52,264 4,703,187 CR Bard Inc 16,406 3,856,904 Check Point Softw are Technologies Limited 28,729 3,302,399 Apple Inc 24,690 3,283,227 Alliance Data Systems Corporation 10,748 2,768,792 Amgen Inc 15,918 2,768,777 Akamai Technologies Inc 55,178 2,750,623 Activision Blizzard Inc 49,127 2,750,621 Altria Group Inc 39,121 2,750,598 Abbott Laboratories 61,811 2,750,590 Agilent Technologies Inc 48,882 2,750,590 Fiat Chrysler Automobiles NV 259,119 2,736,297 Diebold Inc 102,483 2,736,296 Waste Connections Inc 29,381 2,736,253 Concho Resources Inc 22,576 2,723,569 Monster Beverage Corporation 54,596 2,497,767 Progressive Corporation 63,637 2,497,752 PepsiCo Inc 22,385 2,497,718 Chevron Corporation 23,012 2,477,012 ConAgra Foods Inc 59,918 2,477,010 Honeyw ell International Inc 20,087 2,474,518 Sealed Air Corporation 56,573 2,474,503 Southw est Airlines Company 44,844 2,474,492 Laboratory Corporation of America Holdings 17,307 2,469,709 Lamb Weston Holdings Inc 62,131 2,469,707 Celgene Corporation 19,928 2,469,677 Amazon.com Inc 2,894 2,469,421 HP Inc 160,291 2,434,820 Electronic Arts Inc 29,882 2,434,785 Devon Energy Corporation 52,406 2,434,783 Equifax Inc 20,524 2,434,762 CBS Corporation 38,647 2,434,761 HCA Healthcare Inc 30,219 2,434,745 Cisco Systems Inc 71,404 2,417,025 The Walt Disney Company 21,885 2,416,979 Intuit Inc 20,307 2,416,939 Fiserv Inc 21,733 2,416,927 Anthem Inc 16,235 2,355,536 Marathon Petroleum Corporation 46,187 2,325,516 Public Service Enterprise Group Inc 49,439 2,219,317 Low e's Companies Inc 24,668 1,918,695 Web.com Group Inc 83,564 1,779,913

U ACCESS (IRELAND) UCITS PLC
STATEMENT OF SIGNIFICANT PURCHASES AND SALES (CONTINUED)
(Expressed in U.S. Dollars)
45
U Access (IRL) Electron Global Utility Fund (continued) Statement of Significant Sales for the period ended 30 June 2017
Proceeds
Description Nominal US$Aetna Inc (74,419) (10,327,641)Air Products & Chemicals Inc (55,568) (7,896,631)Cognizant Technology Solutions Corporation (126,453) (7,847,202)Akamai Technologies Inc (74,928) (5,134,429)Apple Inc (37,744) (4,985,004)Edw ards Lifesciences Corporation (46,988) (4,811,606)Advance Auto Parts Inc (31,803) (4,767,286)Burlington Stores Inc (52,374) (4,603,719)Biogen Inc (15,602) (4,475,902)Yum! Brands Inc (70,571) (4,469,261)Activision Blizzard Inc (87,517) (4,297,209)CR Bard Inc (16,406) (4,033,677)New field Exploration Company (137,402) (3,929,697)Low e's Companies Inc (48,170) (3,623,698)Check Point Softw are Technologies Limited (28,729) (3,249,825)eBay Inc (91,165) (3,114,196)Amazon.com Inc (3,685) (3,082,576)Intuit Inc (24,932) (3,048,545)Altria Group Inc (39,121) (2,957,939)Agilent Technologies Inc (48,882) (2,938,297)Autodesk Inc (34,464) (2,907,383)HP Inc (160,291) (2,825,930)Waste Connections Inc (29,759) (2,823,453)Fiat Chrysler Automobiles NV (259,119) (2,812,795)Anthem Inc (16,235) (2,707,186)Abbott Laboratories (61,811) (2,690,633)Southw est Airlines Co (44,844) (2,671,806)Equifax Inc (20,524) (2,648,007)Honeyw ell International Inc (20,087) (2,646,261)Electronic Arts Inc (29,882) (2,633,501)Lamb Weston Holdings Inc (62,131) (2,610,745)Hologic Inc (62,374) (2,592,624)Fiserv Inc (21,733) (2,591,660)PepsiCo Inc (22,385) (2,525,923)CBS Corporation (38,647) (2,522,103)Sealed Air Corporation (56,573) (2,493,172)Walt Disney Company (21,885) (2,474,099)Cisco Systems Inc (71,404) (2,453,084)Chevron Corporation (23,012) (2,450,778)Mastercard Inc (23,580) (2,434,635)ConAgra Foods Inc (59,918) (2,425,253)MGM Resorts International (88,419) (2,361,672)Devon Energy Corporation (52,406) (2,302,196)Marathon Petroleum Corporation (46,187) (2,294,108)Alphabet Inc (2,601) (2,258,695)Aff iliated Managers Group Inc (14,733) (2,257,198)Public Service Enterprise Group Inc (49,439) (2,196,080)Yahoo! Inc (44,771) (2,012,009)

U ACCESS (IRELAND) UCITS PLC
U ACCESS (IRL) TREND MACRO
SCHEDULE OF INVESTMENTS
(Expressed in U.S. Dollars)
46
As at 30 June 2017
Numberof Units
Fair ValueUS$
% of Net Assets
Financial assets at fair value through profit or loss
Corporate bondsBHIP 0% 12/01/2020 77,673,000 4,862,740 1.06%EP Petroecuador via Noble Sovereign Funding I Limited 6.27% 24/09/2019 8,953,060 8,953,060 1.95%Federal Grid Company OJS via Federal Grid Finance Limited 8.45% 13/03/2019 412,000,000 6,977,593 1.52%Oschadbank via SSB #1 Plc 9.38% 10/03/2023 6,261,000 6,422,033 1.40%Petroamazonas EP 4.63% 16/02/2020 5,545,012 5,158,192 1.12%Russian Railw ays via RZD Capital Plc 8.99% 03/03/2024 238,300,000 4,139,834 0.90%Saderea Limited 12.50% 30/11/2026 8,780,334 9,373,007 2.04%Stonew ay Capital Corporation 10.00% 01/03/2027 3,769,000 3,999,380 0.87%Ukraine Railw ays via Shortline Plc 9.88% 15/09/2021 13,048,000 13,279,406 2.89%Ukreximbank via BIZ Finance Plc 9.63% 27/04/2022 4,251,000 4,396,129 0.96%
67,561,374 14.71%
Government bondsArgent-Gdp 0% 15/12/2035 111,267,861 10,014,107 2.18%Argentine Republic Government International Bond 15/12/2035 28,843,861 2,944,371 0.64%Ecuador Government International Bond 10.75% 28/03/2022 9,087,000 9,694,375 2.11%Egypt Treasury Bill 0% 23/01/2018 87,125,000 4,325,093 0.94%Egypt Treasury Bill 0% 13/02/2018 39,075,000 1,917,586 0.42%Egypt Treasury Bill 0% 06/03/2018 65,000,000 3,153,576 0.69%Egypt Treasury Bill 0% 20/03/2018 44,100,000 2,118,942 0.46%Egypt Treasury Bill 0% 15/05/2018 50,225,000 2,355,031 0.51%Egypt Treasury Bill 0% 29/05/2018 101,850,000 4,732,709 1.03%Egypt Treasury Bill 0% 08/08/2017 127,000,000 6,880,463 1.50%Egypt Treasury Bill 0% 15/08/2017 33,000,000 1,775,808 0.39%Ghana Government Bond 19% 02/11/2026 21,775,000 5,158,680 1.12%Ghana Government Bond 24.75% 19/07/2021 26,128,000 6,973,099 1.52%Provincia de Buenos Aires/Argentina 23.64% 31/05/2022 112,840,000 6,979,523 1.52%Provincia de Buenos Aires/Argentina 0% 05/02/2018 48,054,206 2,891,000 0.63%Provincia de Entre Rios Argentina 8.75% 08/02/2025 11,718,000 12,064,092 2.63%Provincia de Mendoza Forw ard Rate Note 0% 09/06/2021 76,947,437 4,690,880 1.02%Provincia de Rio Negro 25.25% 06/07/2020 52,361,738 3,150,147 0.69%Provincia de Tierra Del Fuego Argentina 8.95% 17/04/2027 2,284,000 2,427,332 0.53%Provincia Del Chubut Argentina 7.75% 26/07/2026 2,808,000 2,846,877 0.62%Republic of Angola 9.5% 12/11/2025 2,433,000 2,564,139 0.56%Republic of Argentina 9% 31/12/2033 4,987,801 2,265,154 0.49%Russian Federal Bond - OFZ 7% 16/08/2023 920,006,000 15,079,440 3.28%Russian Federal Bond - OFZ 7.4% 07/12/2022 255,958,000 4,275,790 0.93%Russian Federal Bond - OFZ 8.15% 03/02/2027 479,958,000 8,481,442 1.85%United States Treasury Bill 0% 10/08/2017 30,000,000 29,972,850 6.53%United States Treasury Bill 0% 14/09/2017 20,000,000 19,961,600 4.35%United States Treasury Note/Bond 0.63% 31/07/2017 35,000,000 34,990,430 7.62%United States Treasury Note/Bond 0.63% 31/08/2017 20,000,000 19,988,281 4.35%
Description
The accompanying notes are an integral part of the financial statements and should be read in conjunction therewith.

U ACCESS (IRELAND) UCITS PLC
U ACCESS (IRL) TREND MACRO
SCHEDULE OF INVESTMENTS
(Expressed in U.S. Dollars)
47
As at 30 June 2017
Numberof Units
Fair ValueUS$
% of Net Assets
Financial assets at fair value through profit or loss (continued)
Government bonds (continued)United States Treasury Note/Bond 0.88% 15/07/2017 20,000,000 19,999,219 4.36%Uruguay Government International Bond 9.88% 20/06/2022 48,423,000 1,745,792 0.38%Uruguay Treasury Bills 0% 05/04/2018 30,116,000 996,837 0.22%Uruguay Treasury Bills 0% 04/05/2018 234,500,000 7,710,298 1.68%Uruguay Treasury Bills 0% 14/12/2017 78,417,000 2,660,266 0.58%
267,785,229 58.33%
Credit default swapsCdx Cdx.Em.27-V1 - 100 20/06/2022 (Credit Suisse) 87,200,764 3,974,001 0.86%Cdx Cdx.Em.27-V1 - 100 20/06/2022 (JP Morgan Chase) 14,785,555 673,822 0.15%
4,647,823 1.01%
Foreign exchange optionsFX option USD Call/KRW Put 1,145 27/09/2017 (JP Morgan Chase) 72,100,843 1,195,216 0.27%FX option USD Put/JPY Call 109 10/07/2017 (UBS AG) 36,317,463 11,658 0.00%FX option EUR Put/SEK Call 9.58 03/10/2017 (UBS AG) 21,309,844 242,319 0.05%FX option GBP Put/USD Call 1.30 03/10/2017 (JP Morgan Chase) 18,784,792 293,497 0.06%
1,742,690 0.38%
Future contracts90Day Euro$ Future December 2019 (2,403) 654,788 0.14%Euro Bond Future September 2017 (852) 2,237,707 0.49%
2,892,495 0.63%
Index optionsPut on 2400 S&P500 mini Index 15 September 2017 405 744,188 0.16%
744,188 0.16%
Interest rate optionsEuro 2 year MIDCV Call 98 option 15 December 2017 9,680 5,082,000 1.11%
5,082,000 1.11%Interest rate swapsIRS USD 1.75% - USD 3M LIBOR 20/09/2019 (JP Morgan Chase) 239,047,375 293,311 0.06%IRS USD 2.14% - USD 3M LIBOR 23/06/2027 (JP Morgan Chase) (26,420,892) 310,637 0.07%IRS USD 2.15% - USD 3M LIBOR 21/06/2027 (JP Morgan Chase) (26,415,811) 268,461 0.06%IRS USD 1.25% - USD 3M LIBOR 21/06/2022 (JP Morgan Chase) - 368 0.00%
872,777 0.19%
Description
The accompanying notes are an integral part of the financial statements and should be read in conjunction therewith.
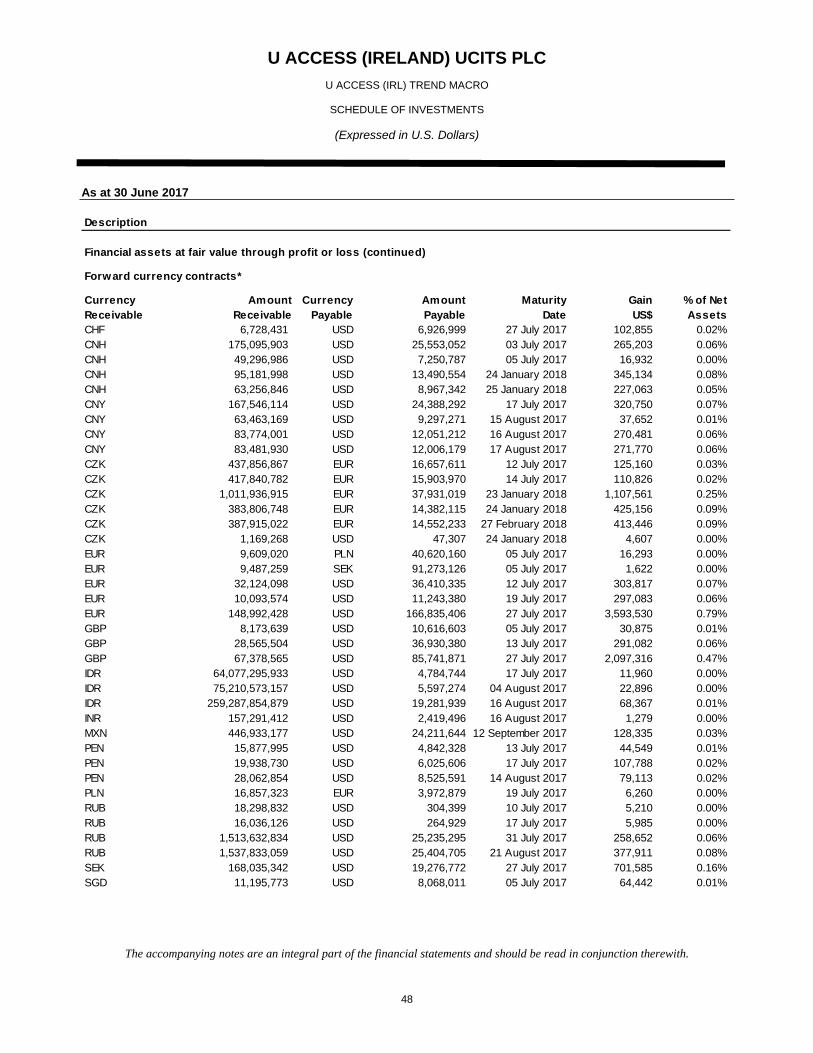
U ACCESS (IRELAND) UCITS PLC
U ACCESS (IRL) TREND MACRO
SCHEDULE OF INVESTMENTS
(Expressed in U.S. Dollars)
48
As at 30 June 2017
Financial assets at fair value through profit or loss (continued)
Forward currency contracts*
Currency Amount Currency Amount Maturity Gain % of NetReceivable Receivable Payable Payable Date US$ AssetsCHF 6,728,431 USD 6,926,999 27 July 2017 102,855 0.02%CNH 175,095,903 USD 25,553,052 03 July 2017 265,203 0.06%CNH 49,296,986 USD 7,250,787 05 July 2017 16,932 0.00%CNH 95,181,998 USD 13,490,554 24 January 2018 345,134 0.08%CNH 63,256,846 USD 8,967,342 25 January 2018 227,063 0.05%CNY 167,546,114 USD 24,388,292 17 July 2017 320,750 0.07%CNY 63,463,169 USD 9,297,271 15 August 2017 37,652 0.01%CNY 83,774,001 USD 12,051,212 16 August 2017 270,481 0.06%CNY 83,481,930 USD 12,006,179 17 August 2017 271,770 0.06%CZK 437,856,867 EUR 16,657,611 12 July 2017 125,160 0.03%CZK 417,840,782 EUR 15,903,970 14 July 2017 110,826 0.02%CZK 1,011,936,915 EUR 37,931,019 23 January 2018 1,107,561 0.25%CZK 383,806,748 EUR 14,382,115 24 January 2018 425,156 0.09%CZK 387,915,022 EUR 14,552,233 27 February 2018 413,446 0.09%CZK 1,169,268 USD 47,307 24 January 2018 4,607 0.00%EUR 9,609,020 PLN 40,620,160 05 July 2017 16,293 0.00%EUR 9,487,259 SEK 91,273,126 05 July 2017 1,622 0.00%EUR 32,124,098 USD 36,410,335 12 July 2017 303,817 0.07%EUR 10,093,574 USD 11,243,380 19 July 2017 297,083 0.06%EUR 148,992,428 USD 166,835,406 27 July 2017 3,593,530 0.79%GBP 8,173,639 USD 10,616,603 05 July 2017 30,875 0.01%GBP 28,565,504 USD 36,930,380 13 July 2017 291,082 0.06%GBP 67,378,565 USD 85,741,871 27 July 2017 2,097,316 0.47%IDR 64,077,295,933 USD 4,784,744 17 July 2017 11,960 0.00%IDR 75,210,573,157 USD 5,597,274 04 August 2017 22,896 0.00%IDR 259,287,854,879 USD 19,281,939 16 August 2017 68,367 0.01%INR 157,291,412 USD 2,419,496 16 August 2017 1,279 0.00%MXN 446,933,177 USD 24,211,644 12 September 2017 128,335 0.03%PEN 15,877,995 USD 4,842,328 13 July 2017 44,549 0.01%PEN 19,938,730 USD 6,025,606 17 July 2017 107,788 0.02%PEN 28,062,854 USD 8,525,591 14 August 2017 79,113 0.02%PLN 16,857,323 EUR 3,972,879 19 July 2017 6,260 0.00%RUB 18,298,832 USD 304,399 10 July 2017 5,210 0.00%RUB 16,036,126 USD 264,929 17 July 2017 5,985 0.00%RUB 1,513,632,834 USD 25,235,295 31 July 2017 258,652 0.06%RUB 1,537,833,059 USD 25,404,705 21 August 2017 377,911 0.08%SEK 168,035,342 USD 19,276,772 27 July 2017 701,585 0.16%SGD 11,195,773 USD 8,068,011 05 July 2017 64,442 0.01%
Description
The accompanying notes are an integral part of the financial statements and should be read in conjunction therewith.

U ACCESS (IRELAND) UCITS PLC
U ACCESS (IRL) TREND MACRO
SCHEDULE OF INVESTMENTS
(Expressed in U.S. Dollars)
49
As at 30 June 2017
Financial assets at fair value through profit or loss (continued)
Forward currency contracts* (continued)
Currency Amount Currency Amount Maturity Gain % of NetReceivable Receivable Payable Payable Date US$ AssetsTRY 49,580,044 USD 13,895,843 06 July 2017 171,886 0.04%TRY 71,993,159 USD 20,193,410 12 July 2017 197,948 0.04%TRY 21,593,023 USD 6,039,288 21 July 2017 60,546 0.01%USD 2,317,240 ARS 38,373,491 17 July 2017 30,472 0.01%USD 8,857,488 BRL 29,300,104 25 July 2017 63,974 0.01%USD 4,802,670 IDR 64,077,295,933 17 July 2017 5,966 0.00%USD 6,048,739 IDR 80,932,129,024 16 August 2017 8,883 0.00%USD 6,048,739 IDR 80,932,129,024 21 August 2017 12,152 0.00%USD 32,510,925 KRW 37,043,821,053 29 September 2017 121,926 0.03%USD 6,086,244 MXN 109,903,300 19 July 2017 50,306 0.01%USD 6,089,518 MXN 110,075,970 24 July 2017 49,509 0.01%USD 24,578,687 MXN 446,933,177 12 September 2017 238,710 0.05%USD 29,160,773 RUB 1,813,965,831 10 May 2018 137,874 0.03%USD 6,807,616 RUB 419,662,158 11 May 2018 94,195 0.02%USD 6,025,606 TWD 181,189,975 17 July 2017 63,943 0.01%USD 7,775,540 TWD 235,031,234 22 August 2017 44,503 0.01%USD 24,211,644 ZAR 314,275,567 12 July 2017 240,947 0.05%USD 11,838,780 ZAR 154,521,943 31 July 2017 95,432 0.02%UYU 132,464,716 USD 4,558,318 06 July 2017 81,427 0.02%UYU 136,248,120 USD 4,558,318 06 October 2017 129,617 0.03%UYU 153,653,633 USD 5,181,546 26 October 2017 81,981 0.02%UYU 141,543,832 USD 4,835,799 06 November 2017 1,180 0.00%
14,543,923 3.17%
Total financial assets at fair value through profit or loss 365,872,499 79.69%
Description
The accompanying notes are an integral part of the financial statements and should be read in conjunction therewith.

U ACCESS (IRELAND) UCITS PLC
U ACCESS (IRL) TREND MACRO
SCHEDULE OF INVESTMENTS
(Expressed in U.S. Dollars)
50
As at 30 June 2017
Numberof Units
Fair ValueUS$
% of Net Assets
Financial liabilities at fair value through profit or loss
Credit default swapsCDS Elliniki Dhimokratia - 100 20/06/2019 Senior Unsecured (Barclays Capital) (2,478,095) (253,659) (0.05%)CDS Elliniki Dhimokratia - 100 20/12/2020 Senior Unsecured (Bank of America) (2,807,672) (287,395) (0.06%)CDS Elliniki Dhimokratia - 100 20/06/2019 Senior Unsecured (Bank of America) (1,172,123) (172,054) (0.04%)CDS GGB 100Bps 20/06/2018 (Barclays Capital) (1,298,594) (80,769) (0.02%)CDS GGB 100Bps 20/06/2018 (Bank of America) (2,172,487) (135,122) (0.03%)
(928,999) (0.20%)
Foreign exchange optionsFX option USD Call/KRW Put 1,200 27/09/2017 (JP Morgan Chase) (72,100,843) (372,617) (0.08%)FX option USD Put/KRW Call 1,100 27/09/2017 (JP Morgan Chase) (72,100,843) (254,300) (0.06%)
(626,917) (0.14%)
Index optionsPut on 2250 S&P500 mini Index 15 September 2017 (405) (253,125) (0.05%)
(253,125) (0.05%)
Interest rate optionsEURO$ 2Y MIDCV OP Dec17 Call 98.375 15/12/2017 (9,680) (1,149,500) (0.25%)EURO$ 2Y MIDCV OP Dec17 Put 97.63 15/12/2017 (9,680) (1,694,000) (0.37%)
(2,843,500) (0.62%)
Interest rate swapsIRS USD 1.56% - USD 3M LIBOR 21/06/2019 (JP Morgan Chase) 122,981,028 (118,100) (0.03%)IRS USD 1.55% - USD 3M LIBOR 23/06/2019 (JP Morgan Chase) 120,974,782 (106,492) (0.02%)IRS USD 2.50% - USD 3M LIBOR 20/09/2027 (JP Morgan Chase) (51,515,186) (891,161) (0.19%)
(1,115,753) (0.24%)
Description
The accompanying notes are an integral part of the financial statements and should be read in conjunction therewith.
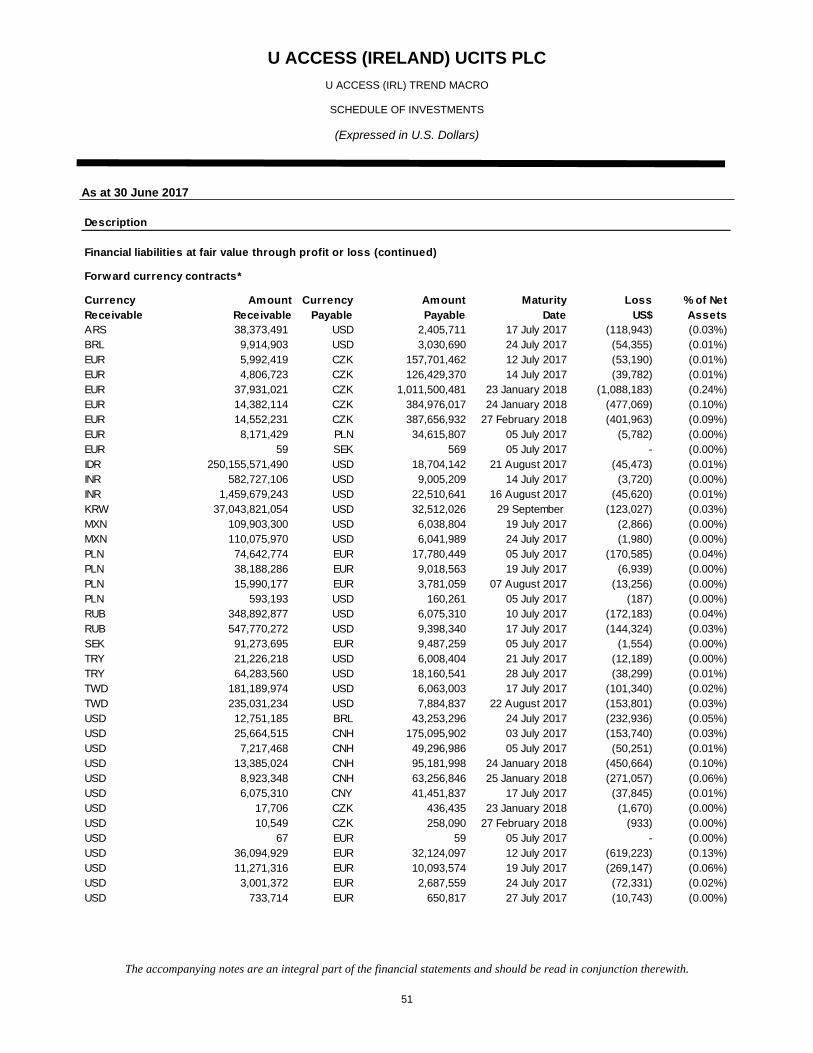
U ACCESS (IRELAND) UCITS PLC
U ACCESS (IRL) TREND MACRO
SCHEDULE OF INVESTMENTS
(Expressed in U.S. Dollars)
51
As at 30 June 2017
Financial liabilities at fair value through profit or loss (continued)
Forward currency contracts*
Currency Amount Currency Amount Maturity Loss % of NetReceivable Receivable Payable Payable Date US$ AssetsARS 38,373,491 USD 2,405,711 17 July 2017 (118,943) (0.03%)BRL 9,914,903 USD 3,030,690 24 July 2017 (54,355) (0.01%)EUR 5,992,419 CZK 157,701,462 12 July 2017 (53,190) (0.01%)EUR 4,806,723 CZK 126,429,370 14 July 2017 (39,782) (0.01%)EUR 37,931,021 CZK 1,011,500,481 23 January 2018 (1,088,183) (0.24%)EUR 14,382,114 CZK 384,976,017 24 January 2018 (477,069) (0.10%)EUR 14,552,231 CZK 387,656,932 27 February 2018 (401,963) (0.09%)EUR 8,171,429 PLN 34,615,807 05 July 2017 (5,782) (0.00%)EUR 59 SEK 569 05 July 2017 - (0.00%)IDR 250,155,571,490 USD 18,704,142 21 August 2017 (45,473) (0.01%)INR 582,727,106 USD 9,005,209 14 July 2017 (3,720) (0.00%)INR 1,459,679,243 USD 22,510,641 16 August 2017 (45,620) (0.01%)KRW 37,043,821,054 USD 32,512,026 29 September (123,027) (0.03%)MXN 109,903,300 USD 6,038,804 19 July 2017 (2,866) (0.00%)MXN 110,075,970 USD 6,041,989 24 July 2017 (1,980) (0.00%)PLN 74,642,774 EUR 17,780,449 05 July 2017 (170,585) (0.04%)PLN 38,188,286 EUR 9,018,563 19 July 2017 (6,939) (0.00%)PLN 15,990,177 EUR 3,781,059 07 August 2017 (13,256) (0.00%)PLN 593,193 USD 160,261 05 July 2017 (187) (0.00%)RUB 348,892,877 USD 6,075,310 10 July 2017 (172,183) (0.04%)RUB 547,770,272 USD 9,398,340 17 July 2017 (144,324) (0.03%)SEK 91,273,695 EUR 9,487,259 05 July 2017 (1,554) (0.00%)TRY 21,226,218 USD 6,008,404 21 July 2017 (12,189) (0.00%)TRY 64,283,560 USD 18,160,541 28 July 2017 (38,299) (0.01%)TWD 181,189,974 USD 6,063,003 17 July 2017 (101,340) (0.02%)TWD 235,031,234 USD 7,884,837 22 August 2017 (153,801) (0.03%)USD 12,751,185 BRL 43,253,296 24 July 2017 (232,936) (0.05%)USD 25,664,515 CNH 175,095,902 03 July 2017 (153,740) (0.03%)USD 7,217,468 CNH 49,296,986 05 July 2017 (50,251) (0.01%)USD 13,385,024 CNH 95,181,998 24 January 2018 (450,664) (0.10%)USD 8,923,348 CNH 63,256,846 25 January 2018 (271,057) (0.06%)USD 6,075,310 CNY 41,451,837 17 July 2017 (37,845) (0.01%)USD 17,706 CZK 436,435 23 January 2018 (1,670) (0.00%)USD 10,549 CZK 258,090 27 February 2018 (933) (0.00%)USD 67 EUR 59 05 July 2017 - (0.00%)USD 36,094,929 EUR 32,124,097 12 July 2017 (619,223) (0.13%)USD 11,271,316 EUR 10,093,574 19 July 2017 (269,147) (0.06%)USD 3,001,372 EUR 2,687,559 24 July 2017 (72,331) (0.02%)USD 733,714 EUR 650,817 27 July 2017 (10,743) (0.00%)
Description
The accompanying notes are an integral part of the financial statements and should be read in conjunction therewith.

U ACCESS (IRELAND) UCITS PLC
U ACCESS (IRL) TREND MACRO
SCHEDULE OF INVESTMENTS
(Expressed in U.S. Dollars)
52
As at 30 June 2017
Financial liabilities at fair value through profit or loss (continued)
Forward currency contracts* (continued)
Currency Amount Currency Amount Maturity Loss % of NetReceivable Receivable Payable Payable Date US$ AssetsUSD 10,616,739 GBP 8,173,639 05 July 2017 (30,739) (0.01%)USD 36,317,464 GBP 28,565,503 13 July 2017 (903,998) (0.20%)USD 231,647 GBP 181,650 27 July 2017 (5,165) (0.00%)USD 5,581,904 IDR 75,210,573,157 04 August 2017 (38,267) (0.01%)USD 1,707,665 INR 110,656,684 14 July 2017 (1,669) (0.00%)USD 4,862,836 PEN 15,877,995 13 July 2017 (24,041) (0.01%)USD 6,108,247 PEN 19,938,731 17 July 2017 (25,147) (0.01%)USD 8,572,787 PEN 28,062,854 14 August 2017 (31,916) (0.01%)USD 6,075,310 RUB 367,191,709 10 July 2017 (137,426) (0.03%)USD 9,398,340 RUB 563,806,399 17 July 2017 (126,589) (0.03%)USD 25,454,719 RUB 1,537,833,058 21 August 2017 (327,896) (0.07%)USD 1,823,540 RUB 115,080,119 10 May 2018 (17,707) (0.00%)USD 275,859 SEK 2,369,398 27 July 2017 (5,847) (0.00%)USD 8,076,651 SGD 11,195,774 05 July 2017 (55,801) (0.01%)USD 9,020,171 TRY 31,872,957 06 July 2017 (23,390) (0.01%)USD 18,025,211 TRY 63,708,726 12 July 2017 (19,662) (0.00%)USD 4,806,723 TRY 17,049,009 21 July 2017 (9,468) (0.00%)USD 8,411,765 TRY 29,909,464 28 July 2017 (20,042) (0.00%)UYU 50,429,500 USD 1,730,000 26 October 2017 (2,497) (0.00%)
(7,254,417) (1.58%)
Total financial liabilities at fair value through profit or loss (13,022,711) (2.83%)
Numberof Units
Fair ValueUS$
% of Net Assets
Total financial assets and liabilities at fair value through profit or loss 352,849,788 76.86%
Other assets 140,888,397 30.69%
Other liabilities (34,626,480) (7.55%)Net assets attributable to holders of redeemable shares 459,111,705 100.00%
% ofAnalysis of total assets Assets
Transferable securities listed on an off icial stock exchange 66.17%Financial derivative instruments dealt on a regulated market 1.72%OTC financial derivative instruments 4.30%Cash and cash equivalents 25.20%Other assets 2.61%Total Assets 100.00%
Description
Description
*Counterparties to forward currency contracts as at 30 June 2017 are BNY Mellon, Citibank NA, UBS AG and JP Morgan Chase Bank NA.
The accompanying notes are an integral part of the financial statements and should be read in conjunction therewith

U ACCESS (IRELAND) UCITS PLC
U ACCESS (IRL) ELECTRON GLOBAL UTILITY FUND
SCHEDULE OF INVESTMENTS
(Expressed in U.S. Dollars)
53
As at 30 June 2017
Numberof Units
Fair ValueUS$
% of Net Assets
Financial assets at fair value through profit or loss
EquitiesActivision Blizzard Inc 38,692 2,227,498 3.22%AdvanSix Inc 42,730 1,334,885 1.93%Akamai Technologies Inc 55,178 2,748,416 3.97%Alliance Data Systems Corporation 10,748 2,758,904 3.99%Ally Financial Inc 41,971 877,194 1.27%Amazon.Com Inc 2,894 2,801,392 4.05%Amgen Inc 15,918 2,741,557 3.96%Artisan Partners Asset Management Inc 25,984 797,709 1.15%Avon Products Inc 275,682 1,047,592 1.51%Boston Scientif ic Corporation 88,007 2,439,554 3.53%Cavium Inc 7,604 472,437 0.68%Celgene Corporation 19,928 2,588,049 3.74%Centene Corporation 69,268 5,533,128 8.00%Central Pacif ic Financial Corporation 19,470 612,721 0.89%Cheniere Energy Inc 17,325 843,901 1.22%Concho Resources Inc 22,875 2,779,999 4.02%Darling Ingredients Inc 359 5,651 0.01%DaVita Inc 21,597 1,398,622 2.02%Diebold Inc 102,483 2,869,524 4.15%Ferrari N.V 52,264 4,495,749 6.50%HCA Healthcare Inc 30,219 2,635,097 3.81%Herc Holdings Inc 21,446 843,257 1.22%Laboratory Corporation of America Holdings 17,307 2,667,701 3.86%Monster Beverage Corporation 54,596 2,712,329 3.92%Piper Jaffray Companies 10,277 616,106 0.89%Playa Hotels & Resorts N.V 2,631 31,440 0.05%Progressive Corporation 63,637 2,805,755 4.06%Proofpoint Inc 13,125 1,139,644 1.65%Quality Care Properties Inc 295,037 5,402,127 7.81%Selective Insurance Group Inc 13,587 680,029 0.98%Ulta Salon Cosmetics & Fragrance Inc 4,067 1,168,612 1.69%Visteon Corporation 9,675 987,431 1.43%Web.com Group Inc 83,564 2,114,169 3.05%Xperi Corporation 16,695 497,511 0.71%
65,675,690 94.94%Contracts for differenceActivision Blizzard Inc (38,692) 102,534 0.15%AdvanSix Inc (42,730) 64,950 0.09%Akamai Technologies Inc (55,178) 58,489 0.08%Alliance Data Systems Corporation (10,748) 45,357 0.07%Amazon.Com Inc (2,894) 75,186 0.11%Amgen Inc (15,918) 22,922 0.03%Cavium Inc (7,604) 33,306 0.05%
Description
The accompanying notes are an integral part of the financial statements and should be read in conjunction therewith.
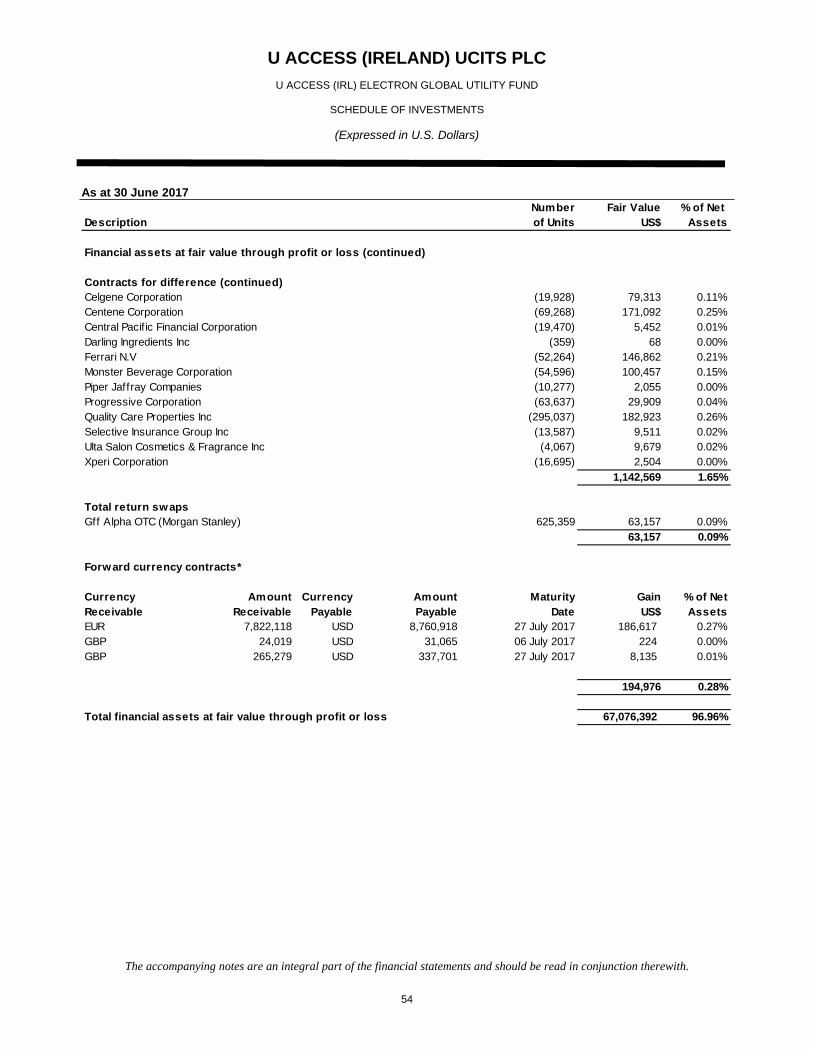
U ACCESS (IRELAND) UCITS PLC
U ACCESS (IRL) ELECTRON GLOBAL UTILITY FUND
SCHEDULE OF INVESTMENTS
(Expressed in U.S. Dollars)
54
As at 30 June 2017
Numberof Units
Fair ValueUS$
% of Net Assets
Financial assets at fair value through profit or loss (continued)
Contracts for difference (continued)Celgene Corporation (19,928) 79,313 0.11%Centene Corporation (69,268) 171,092 0.25%Central Pacif ic Financial Corporation (19,470) 5,452 0.01%Darling Ingredients Inc (359) 68 0.00%Ferrari N.V (52,264) 146,862 0.21%Monster Beverage Corporation (54,596) 100,457 0.15%Piper Jaffray Companies (10,277) 2,055 0.00%Progressive Corporation (63,637) 29,909 0.04%Quality Care Properties Inc (295,037) 182,923 0.26%Selective Insurance Group Inc (13,587) 9,511 0.02%Ulta Salon Cosmetics & Fragrance Inc (4,067) 9,679 0.02%Xperi Corporation (16,695) 2,504 0.00%
1,142,569 1.65%
Total return swapsGff Alpha OTC (Morgan Stanley) 625,359 63,157 0.09%
63,157 0.09%
Forward currency contracts*
Currency Amount Currency Amount Maturity Gain % of NetReceivable Receivable Payable Payable Date US$ AssetsEUR 7,822,118 USD 8,760,918 27 July 2017 186,617 0.27%GBP 24,019 USD 31,065 06 July 2017 224 0.00%GBP 265,279 USD 337,701 27 July 2017 8,135 0.01%
194,976 0.28%
Total financial assets at fair value through profit or loss 67,076,392 96.96%
Description
The accompanying notes are an integral part of the financial statements and should be read in conjunction therewith.
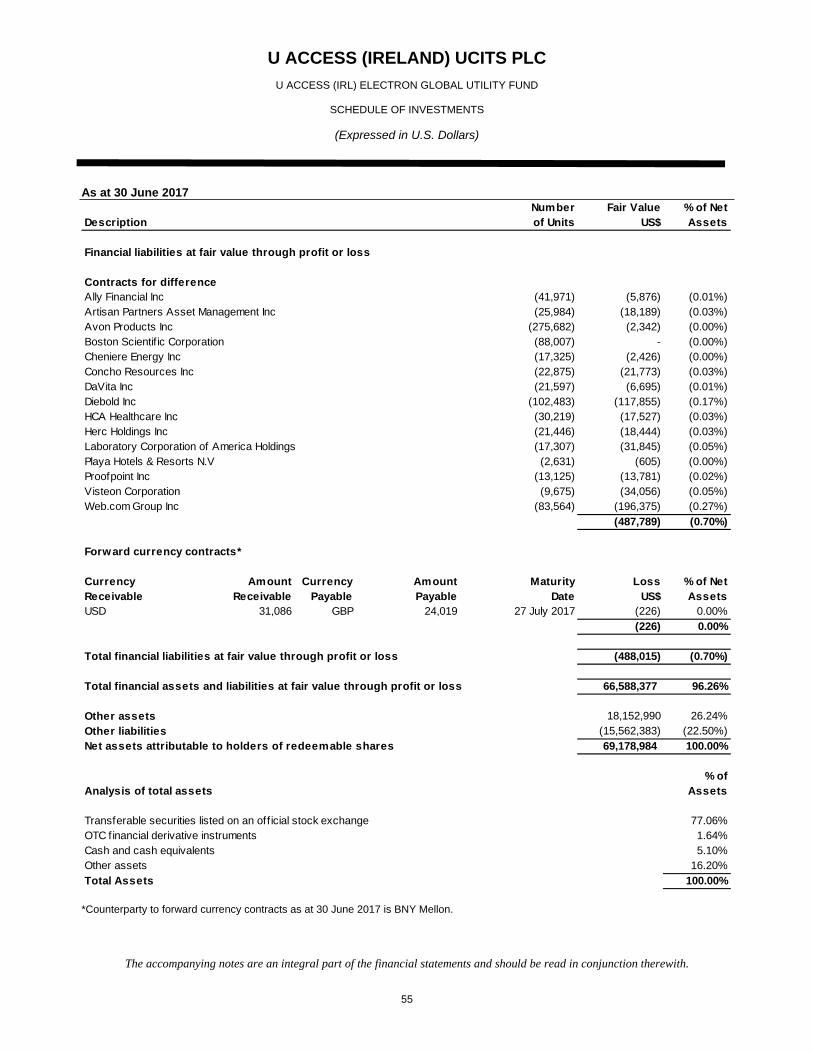
U ACCESS (IRELAND) UCITS PLC
U ACCESS (IRL) ELECTRON GLOBAL UTILITY FUND
SCHEDULE OF INVESTMENTS
(Expressed in U.S. Dollars)
55
As at 30 June 2017
Numberof Units
Fair ValueUS$
% of Net Assets
Financial liabilities at fair value through profit or loss
Contracts for differenceAlly Financial Inc (41,971) (5,876) (0.01%)Artisan Partners Asset Management Inc (25,984) (18,189) (0.03%)Avon Products Inc (275,682) (2,342) (0.00%)Boston Scientif ic Corporation (88,007) - (0.00%)Cheniere Energy Inc (17,325) (2,426) (0.00%)Concho Resources Inc (22,875) (21,773) (0.03%)DaVita Inc (21,597) (6,695) (0.01%)Diebold Inc (102,483) (117,855) (0.17%)HCA Healthcare Inc (30,219) (17,527) (0.03%)Herc Holdings Inc (21,446) (18,444) (0.03%)Laboratory Corporation of America Holdings (17,307) (31,845) (0.05%)Playa Hotels & Resorts N.V (2,631) (605) (0.00%)Proofpoint Inc (13,125) (13,781) (0.02%)Visteon Corporation (9,675) (34,056) (0.05%)Web.com Group Inc (83,564) (196,375) (0.27%)
(487,789) (0.70%)
Forward currency contracts*
Currency Amount Currency Amount Maturity Loss % of NetReceivable Receivable Payable Payable Date US$ AssetsUSD 31,086 GBP 24,019 27 July 2017 (226) 0.00%
(226) 0.00%
Total financial liabilities at fair value through profit or loss (488,015) (0.70%)
Total financial assets and liabilities at fair value through profit or loss 66,588,377 96.26%
Other assets 18,152,990 26.24%
Other liabilities (15,562,383) (22.50%)Net assets attributable to holders of redeemable shares 69,178,984 100.00%
% ofAnalysis of total assets Assets
Transferable securities listed on an off icial stock exchange 77.06%OTC financial derivative instruments 1.64%Cash and cash equivalents 5.10%Other assets 16.20%
Total Assets 100.00%
Description
*Counterparty to forward currency contracts as at 30 June 2017 is BNY Mellon.
The accompanying notes are an integral part of the financial statements and should be read in conjunction therewith.

U ACCESS (IRELAND) UCITS PLC
SECURITIES FINANCING TRANSACTIONS REGULATION 2016
56
Securities Financing Transactions Regulation (Regulation (EU) 2015/2365) (“SFTR”) came into force on 12 January 2016 and, amongst other requirements, introduces new disclosure requirements in the Fund’s annual and interim reports published after 13 January 2017 detailing the Company’s use of securities financing transactions. Securities financing transactions are defined as repurchase/reverse repurchase transactions, total return swaps (including contracts for difference “CFDs”), securities borrowing and lending and margin lending transactions.
For the period ended 30 June 2017, the Company has not entered into any stock lending, securities borrowing and margin lending transactions.
For the period ended 30 June 2017, the Company has entered into total return swaps (including CFD’s). As a result, additional disclosures have been included in this supplementary section to the unaudited semi-annual report and accounts.
The following table details the Company’s exposure to total return swaps as at 30 June 2017.
Fund CounterpartyCounterparty country
of incorporation
Total return swap
(including CFDs*) % of net assets
Currency
U Access (IRL) Electron Global Utility Fund Morgan Stanley United States of America 134,518,511 194.45%
*the value of total TRS’s is based on the aggregate gross notional value of all open positions.
U Access (IRL) Trend Macro
The total returns earned on trading in total return swaps is (US$165,065).
For the period ended 30 June 2017, U Access (IRL) Trend Macro entered into repurchase agreements. The total returns earned in trading in repurchase agreements was US$250,002. For the period ended 30 June 2017, U Access (IRL) Trend Macro did not trade in reverse repurchase agreements. U Access (IRL) Electron Global Utility Fund
The total returns earned on trading in total return swaps is US$6,633,519.
For the period ended 30 June 2017, U Access (IRL) Electron Global Utility Fund did not trade in repurchase or reverse repurchase agreements.
Maturity tenor
All total return swaps have an open maturity tenor as at 30 June 2017 as they are recallable or terminable on a daily basis.
Settlement and clearing
All OTC derivative transactions and total return swaps are entered into by the Company under an International Swap and Derivatives Association, Inc. Master Agreement (“ISDA Master Agreement”) or similar agreement. An ISDA Master Agreement is a bilateral agreement between the Company and a counterparty that governs OTC derivative transactions (including total return swaps) entered into by the parties.
Collateral and safekeeping
All collateral received/pledged by the Company under the ISDA Master Agreement is transferred bilaterally under a title transfer arrangement. Collateral received by the Company is held by the Depositary in the name of the Company and is segregated by the Depositary from the assets belonging to the Company. The collateral posted by the Company is transferred under a security interest arrangement in accordance with the ISDA Master Agreement.
Non-cash collateral received by way of title transfer collateral arrangement in relation to OTC derivative transactions, cannot be sold, re-invested or pledged.
As at 30 June 2017 the Company has not received or pledged any non-cash collateral, other than that collateral in relation to repurchase agreements.
As at 30 June 2017 there has been no cash collateral received or pledged in relation to SFTR transactions. Any collateral disclosed elsewhere in the financial statements relates to other financial derivative instruments.