1
Types of Thematic Maps All five thematic maps show where people live in Oregon, but each map uses a different way to show that distribution. Color Patch Urban Rural • This map draws boundaries around differ- ent groups of people (for example, urban residents and rural residents) • The map does not show how many people are in each group, just where each group is located Many people Few People Isopleth • This map shows a continuous distribution of population • Because we do not know how many people live in every single place in Oregon, we take an average of two cities in an area to estimate the number of people in that area 5,000 people 10,000 people 50,000 people 100,000 people 1,000 people one dot = 500 people People Dot Density • One dot equals a certain number of people • If dots are close together, lots of people live in one area • If dots are spread out, not very many people live in one area People per square mile 0-15 16-50 51-100 101-625 626-1518 Choropleth • Each county is shaded a color to show density or number of people per square mile • The symbol covers an entire county, but it does not mean that people live everywhere inside the county 10,000 people 50,000 people 100,000 people 500,000 people 1,000,000 people People Graduated Circle • One circle represents how many people live in that county • The size of the circle is proportional to the number of people that live in a county - the more people that live in a county, the larger the circle

Types of Thematic Maps - Portland State University · Types of Thematic Maps All five thematic maps show where people live in Oregon, but each map uses a different way to show that

  • Upload
    buidat

  • View
    220

  • Download
    2

Embed Size (px)

Citation preview

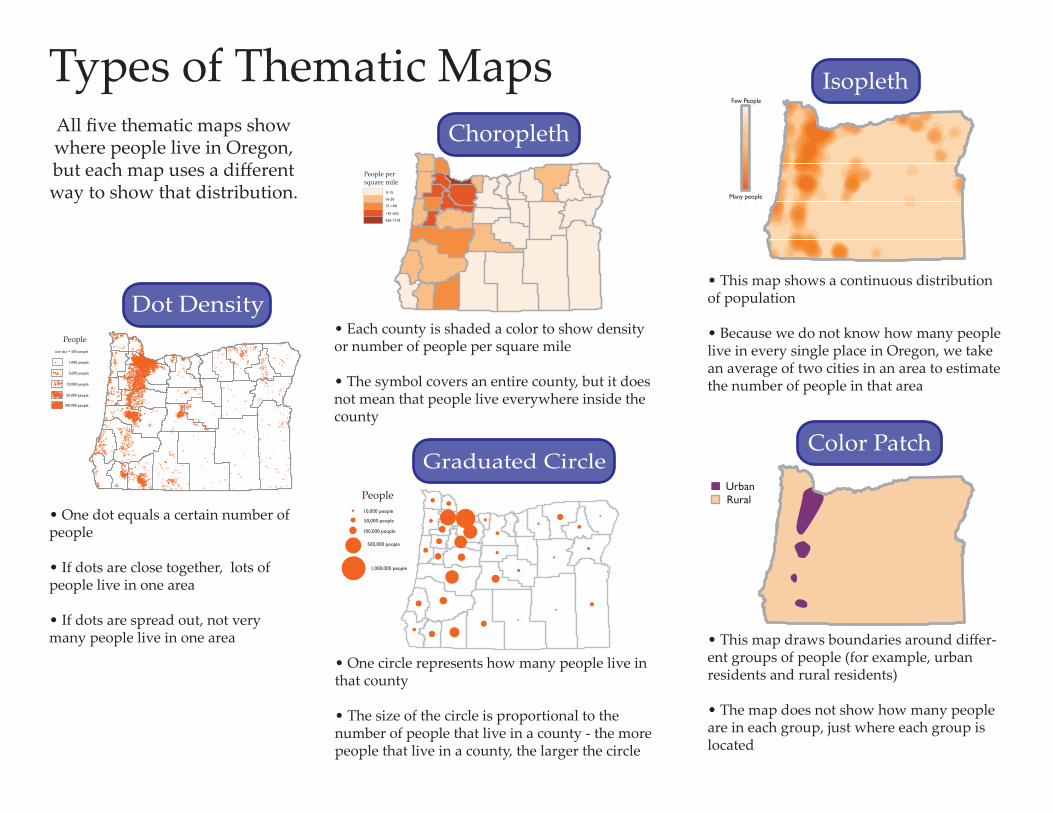
Types of Thematic MapsAll five thematic maps show where people live in Oregon, but each map uses a different way to show that distribution.

Color Patch

UrbanRural

• This map draws boundaries around differ-ent groups of people (for example, urban residents and rural residents)

• The map does not show how many people are in each group, just where each group is located

Many people

Few People

Isopleth

• This map shows a continuous distribution of population

• Because we do not know how many people live in every single place in Oregon, we take an average of two cities in an area to estimate the number of people in that area

5,000 people

10,000 people

50,000 people

100,000 people

1,000 people

one dot = 500 people

People

Dot Density

• One dot equals a certain number of people

• If dots are close together, lots of people live in one area

• If dots are spread out, not very many people live in one area

People per square mile

0-15

16-50

51-100

101-625

626-1518

Choropleth

• Each county is shaded a color to show density or number of people per square mile

• The symbol covers an entire county, but it does not mean that people live everywhere inside the county

10,000 people

50,000 people

100,000 people

500,000 people

1,000,000 people

People

Graduated Circle

• One circle represents how many people live in that county

• The size of the circle is proportional to the number of people that live in a county - the more people that live in a county, the larger the circle