Embed Size (px)
Citation preview

1.03”
12th Annual • Report and Survey of Biopharmaceutical Manufacturing Capacity and Production
Copyright © 2015 by BioPlan Associates, Inc.
T W E L F T H A N N U A L
Report and Survey of Biopharmaceutical Manufacturing Capacity and ProductionAnother report in the BioPlan Associates, Inc.’s biopharmaceutical series:
■ www.top1000bio.com Global analysis and ranking of the top 1000 global biomanufacturing facilities’ capacity, employment and pipelines
■ Biopharmaceutical Expression Systems and Genetic Engineering Tech-nologies
■ Advances in Biopharmaceutical Manufacturing and Scale-up Produc-tion, 2nd Ed, American Society for Microbiology
■ Biopharmaceutical Products in the U.S. and European Markets, 6th Ed■ Advances in Biopharmaceutical Technology in China■ Advances in Biopharmaceutical Technology in India■ Top 60 Biopharmaceutical Organizations in China■ Top 60 Biopharmaceutical Organizations in India■ Quick Guide to Clinical Trials■ Quick Guide to Biotechnology in the Middle East■ Quick Guide to Biofuels
The 12th Annual Report and Survey of Biopharmaceutical Manufacturing Capacity and Production is the most recent study of biotherapeutic develop-ers and contract manufacturing organizations’ current and projected future capacity and production. The survey includes responses from 237 responsible individuals at biopharmaceutical manufacturers and contract manufacturing organizations from 28 countries. The survey methodology includes input from an additional 164 direct suppliers of raw materials, services, and equipment to this industry. In addition to current capacity issues, this study covers down-stream processing problems, new technologies, expression systems, quality initiatives, human resources and training needs of biopharmaceutical manufac-turers, growth rates of suppliers to this industry, and many other areas.
April 2015ISBN 978-1-934106-27-3
A p r i l 2 0 1 5
T W E L F T H A N N U A L
Report and Survey of Biopharmaceutical Manufacturing
Capacity and ProductionA Study of Biotherapeutic
Developers and Contract Manufacturing
Organizations
associates, inc.
9 781934 106273
ISBN 978-1-934106-27-3

12th Annual Report and Survey of Biopharmaceutical Manufacturing Capacity and ProductionA Study of Biotherapeutic Developers and Contract Manufacturing Organizations
April 2015
BioPlan Associates, Inc.2275 Research Blvd., Suite 500Rockville, MD 20850 USA301.921.5979www.bioplanassociates.com
Copyright ©2015 by BioPlan Associates, Inc.
All rights reserved. Unauthorized reproduction strictly prohibited.
associates, inc.
AnnualRep_15.indd iAnnualRep_15.indd i 6/5/15 1:10 PM6/5/15 1:10 PM

Report and Survey of Biopharmaceutical Manufacturing Capacity and Production
WWW.BIOPLANASSOCIATES.COMii
12th Annual Report and Survey of Biopharmaceutical Manufacturing Capacity and ProductionA Study of Biotherapeutic Developers and Contract
Manufacturing Organizations
April 2015
BioPlan Associates, Inc.
2275 Research Blvd, Suite 500
Rockville MD 20850
301-921-5979
www.bioplanassociates.com
Copyright © 2015 by BioPlan Associates, Inc.
All rights reserved, including the right of reproduction in whole or in part in any form. No part of this publication may be reproduced, stored in a retrieval system, or transmitted in any form or by any means, electronic, mechanical, photocopying, recording or otherwise, without the written permission of the publisher.
For information on special discounts or permissions contact
BioPlan Associates, Inc. at 301-921-5979, or [email protected]
Managing Editor: Eric S. Langer
Project Director: Donnie E. Gillespie
Layout and Cover Design: ES Design
ISBN 978-1-934106-27-3
COVER 1: Th e Sartofl ow Advanced is a modular crossfl ow system optimized for ultrafi ltration,
microfi ltration and diafi ltration applications used in many downstream processes such as
purifi cation of vaccines, monoclonal antibodies and recombinant proteins. Photo courtesy of
Sartorius Stedim Biotech, all rights reserved.
AnnualRep_15.indd iiAnnualRep_15.indd ii 6/5/15 1:10 PM6/5/15 1:10 PM

©2015 BIOPLAN ASSOCIATES, INC. • NO UNAUTHORIZED REPRODUCTION PERMITTED • ALL RIGHTS RESERVED iii
AC K N O W L E D G M E N TWe wish to recognize our sponsoring institutions, and our media sponsors. Their efforts in assuring the cooperation and participation in the survey of their respective memberships helped guarantee the large group of survey participants to ensure data accuracy.
Our Institution Partners, all of whom contributed their time and effort to ensure the broad, international coverage of this project, include:
■ AusBiotech (Malvern, Victoria, Australia)
■ ABO China (Beijing, China)
■ BayBIO (San Francisco, CA)
■ Beijing Pharma and Biotech Center (Beijing, China)
■ BIO (Biotechnology Industry Organization, Washington, D.C.)
■ Bio-Process Systems Alliances/SOCMA (BPSA) (Washington, D.C.)
■ BioForward (Madison, WI)
■ BioIndustry Association (BIA) (London, United Kingdom)
■ BioMaryland (Rockville, MD)
■ KTN (Knowledge Transfer Network) (London, United Kingdom)
■ Colorado BioScience Association (Denver, CO)
■ D2L Pharma (Bangalore, India)
■ EuropaBio (Brussels, Belgium)
■ Massachusetts Biotechnology Council (Cambridge, MA)
■ Massachusetts Life Sciences Center (Waltham, MA)
■ MichBio (Ann Arbor, MI)
■ NC BioSciences (Research Triangle Park, NC)
■ Pharma & Biopharma Outsourcing Association (PBOA) (Ringwood, NJ)
To ensure global coverage for this project, we again invited major Media Sponsors to support our outreach to biopharmaceutical decision-makers. Our media sponsors, who helped ensure broad and representative coverage of industry participation, include:
■ Biopharm International (Iselin, NJ)
■ BioProcess International, (Westborough, MA)
■ BioProcessing Journal (Winthrop, MA)
■ Chimica OGGI/Chemistry Today (Milan, Italy)
■ Contract Pharma, (Ramsey, NJ)
■ Genetic Engineering and Biotechnology News (New Rochelle, NY)
■ Life Science Leader (Sewickley, PA)
■ Pharma IQ (London, United Kingdom)
■ Pharmaceutical Manufacturing (Schaumburg, IL)
■ Pharmaceutical Outsourcing, American Pharmaceutical Review (Fishers, IN)
■ Pharmaceutical Processing (Rockaway, NJ)
■ Pharmaceutical Technology (Iselin, NJ)
■ Pharmaceutical Technology Europe (Iselin, NJ)
AnnualRep_15.indd iiiAnnualRep_15.indd iii 6/5/15 1:10 PM6/5/15 1:10 PM

Report and Survey of Biopharmaceutical Manufacturing Capacity and Production
WWW.BIOPLANASSOCIATES.COMiv
The early participation of our authors and sponsors in evaluating the areas and trends to be surveyed this year ensured the project was designed to cover the most relevant issues in biopharmaceutical manufacturing today. Their support was, again this year, critical to the success of the project.
Eric S. LangerEditor
AnnualRep_15.indd ivAnnualRep_15.indd iv 6/5/15 1:10 PM6/5/15 1:10 PM

©2015 BIOPLAN ASSOCIATES, INC. • NO UNAUTHORIZED REPRODUCTION PERMITTED • ALL RIGHTS RESERVED v
A B O U T B I O P L A N A S S O C I AT E S , I N C . BioPlan Associates, Inc. is a biotechnology and life sciences market analysis, research, and publishing organization. We have managed biotechnology, biopharmaceutical, diagnostic, and life sciences research projects for companies of all sizes since 1989. Our extensive market analysis, research and management project experience covers biotechnology and biopharmaceutical manufacturing, vaccine and therapeutic development, contract research services, diagnostics, devices, biotechnology supply, physician offi ce labs and hospital laboratory environments.
We prepare custom studies, and provide public information our clients require to make informed strategic decisions, defi ne objectives, and identify customer needs. With market information, our clients are better able to make informed, market-based decisions because they understand the trends and needs in high technology industries.
BioPlan Associates, Inc. 2275 Research Blvd., Suite 500Rockville, MD 20850 USAwww.bioplanassociates.com Tel: 301-921-5979
AnnualRep_15.indd vAnnualRep_15.indd v 6/5/15 1:10 PM6/5/15 1:10 PM
Report and Survey of Biopharmaceutical Manufacturing Capacity and Production
WWW.BIOPLANASSOCIATES.COMvi
E D I TO REric S. Langer, MS, President, BioPlan Associates, Inc.Mr. Langer is President and Managing Partner and President of BioPlan Associates, Inc., a biotechnology and life sciences consulting company that has been providing management and market strategy services, and technology analysis to biopharmaceutical and healthcare organizations since 1989. He has 25 years’ experience in biotechnology and life sciences management and market assessment. He is an experienced medical and biotechnology industry practitioner, strategist, researcher, and science writer. He has held senior management and marketing positions at biopharmaceutical supply companies. He teaches Biotechnology Marketing, Marketing Management, Services Marketing, Advertising Strategy, and Bioscience Communication at Johns Hopkins University, American University, and lectures extensively on pricing and channel management topics. Mr. Langer has a degree in Chemistry and a Masters in International Business. He has written and consulted extensively for companies involved in: large scale biopharmaceutical manufacturing, global biotechnology in China, Asia, and the Middle East; he has expertise in cell culture markets, media, sera, tissue engineering, stem cells, diagnostic products, blood products, genetics, DNA/PCR purifi cation, blood components, and many other areas.
AnnualRep_15.indd viAnnualRep_15.indd vi 6/5/15 1:10 PM6/5/15 1:10 PM

©2015 BIOPLAN ASSOCIATES, INC. • NO UNAUTHORIZED REPRODUCTION PERMITTED • ALL RIGHTS RESERVED vii
12th Annual Report and Survey of Biopharmaceutical Manufacturing Capacity and Production • April 2015A Study of Biotherapeutic Developers and Contract Manufacturing Organizations
CONTENTS
Methodology...................................................................................... xxiii
CHAPTER 0: Demographics ........................................................................ 1Respondents’ Area of Involvement .............................................................................. 1Respondents’ Titles ...................................................................................................... 3Respondents’ Facility Locations ................................................................................... 4Respondents’ Areas of Biopharmaceutical Manufacturing Operations ........................ 6Respondents’ Production Operations, Phase of Development .................................... 8Employees at Facility ................................................................................................. 11Batches Run at Facility per Year ................................................................................ 12
CHAPTER 1: INTRODUCTION AND DISCUSSION ..................................................15
1-1 INTRODUCTION: THE BIOPHARMACEUTICAL INDUSTRY ..................................15
1-2 Some Biopharmaceutical Market Trends ...............................................................17
1-3 Market Potential .......................................................................................................19
1-4 Biopharmaceutical R&D Pipelines .........................................................................20
1-5 Biosimilars Are a Large Part of the Pipeline .........................................................26
1-6 U.S. AND WORLD BIOPHARMACEUTICAL AND RECOMBINANT PROTEIN/mAb MARKETS .......................................................................................27Overall Health of the Biopharmaceutical Sector ........................................................ 28U.S. Industry Leadership Continues .......................................................................... 30Biopharmaceuticals in the Rest-of-the-World ............................................................. 31
1-7 Biopharmaceutical Markets by Product Class ......................................................34mAbs are the Leading Product Classes .................................................................... 34
1 -8 Biopharmaceutical Blockbusters ...........................................................................36
1-9 Commercial Product Expression Systems ............................................................37
AnnualRep_15.indd viiAnnualRep_15.indd vii 6/12/15 12:58 PM6/12/15 12:58 PM

Report and Survey of Biopharmaceutical Manufacturing Capacity and Production
WWW.BIOPLANASSOCIATES.COMviii
1-10 Animal Derived Products and Biopharmaceuticals ..............................................39
1-11 Cost-containment and Price Controls ....................................................................39
1-12 Future Trends in the Biopharmaceutical Industry .................................................40
1-13 Overview of Biopharmaceutical Market Trends .....................................................41
CHAPTER 2: Overview of Critical Issues in Bioprocessing ...................................45
2-1 Protein A Resins Continue to Serve Monoclonal Antibodies Manufacture Well, While Incremental Improvements Continue ...........................46
2-2 Biosimilars: Review of Progress in 2014 ..............................................................51
2-3 Bioassays: A Critical and Commonly Outsourced Part of Biopharmaceutical Development ..............................................................54
2-4 Facility Contamination: Behavioral-Based Intervention .......................................60
2-5 Alternatives to Protein A .........................................................................................63
2-6 The Use of Membrane Chromatography throughout a Product’s Life Cycle ......72
2-7 Continuous Bioprocessing and Perfusion: Single-use Technology Aiding to Increase Adoption ...................................................................................77
2-8 Bioprocessing Equipment and Service Supplier Mergers and Acquisitions, 2014 ............................................................................................81
2-9 The Bioprocessing Equipment Supply Chain: Materials in Single-use Products are the Weakest Link ........................................................84
CHAPTER 3: Emerging Issues in Biopharmaceutical Manufacturing .......................89
3-1 Industry Trends in 2015 ...........................................................................................89Productivity and Innovation ........................................................................................ 89
3-2 Budget Issues in 2015 .............................................................................................91Budget Change Comparisons ................................................................................... 94
3-3 Operational Changes ...............................................................................................97
3-4 New Bioprocessing Products Development Opportunities in 2015 ....................98Innovations in Single-use/Disposable Equipment .................................................... 100Discussion of Needed Single-use Innovations ......................................................... 100Other Areas for Innovation ....................................................................................... 102New Product Development Focus, From 2010 to 2015 ........................................... 102New Product Development Areas: Biotherapeutic Developers vs. CMOs .............. 104New Product Development Areas: U.S. vs. Western Europe and ROW ................. 106
3-5 Factors in Biomanufacturing Creating Improvements .......................................108Factors Improving Biomanufacturing Performance, 2010 - 2015 ............................ 110Factors Improving Biomanufacturing Performance, Biotherapeutic Developers vs. CMOs .............................................................................................. 112Factors Improving Biomanufacturing Performance, U.S. vs. Western Europe vs. ROW ...................................................................................................... 114
AnnualRep_15.indd viiiAnnualRep_15.indd viii 6/5/15 1:10 PM6/5/15 1:10 PM

©2015 BIOPLAN ASSOCIATES, INC. • NO UNAUTHORIZED REPRODUCTION PERMITTED • ALL RIGHTS RESERVED ix
TABLE OF CONTENTS / FIGURES AND TABLES
3-6 Cost-Cutting Actions & Development Timelines .................................................116Cost-Cutting Changes: Specifi c to Outsourcing ....................................................... 118
3-7 Assay Development ...............................................................................................119
3-8 Perfusion Operations Issues ................................................................................121Discussion ................................................................................................................ 125Selecting Bioreactors in New Facilities .................................................................... 126
3-9 Discussion: Perfusion Operations and Continuous Bioprocessing Trends .....129Continuous Bioprocessing: Trends and Opportunities ............................................. 129
3-10 Discussion: Industry Trends and Issues ............................................................131Industry Growth and Adaptation ............................................................................... 131Cost Cutting Trends ................................................................................................ 131Trends in Assay Development ................................................................................. 132Trends in Speeding Development and Approval Timelines ...................................... 132Trends in Bioprocessing Industry Desires for Improved Products and Services ..... 133
CHAPTER 4: Capacity Utilization ............................................................... 135
4-1 Capacity Utilization Trends ....................................................................................135Capacity Utilization Defi nitions ................................................................................. 135Relevance of Capacity Utilization ............................................................................ 136Capacity Utilization in Biomanufacturing, 2015 ........................................................ 137Capacity Utilization Changes Since 2004 ............................................................... 138Average Growth Rate in Capacity Utilization, 2006-2015 ........................................ 140
4-2 Capacity Utilization: CMOs vs. Biotherapeutic Developers ...............................141
4-3 Capacity Utilization: U.S. vs. Western European Manufacturers .......................144
4-4 Respondents’ Current Total Production Capacity ...............................................145Mammalian Cell Culture ........................................................................................... 145Estimated Bioreactor Capacity Distribution, Biotherapeutic Developers and CMOs ............................................................................................ 148Biopharmaceutical Developers/Manufacturers as CMOs ........................................ 150Microbial Fermentation Capacity ............................................................................. 150Yeast Production Capacity ....................................................................................... 152Insect Cells Production Capacity ............................................................................. 153
4-5 Discussion: Current State of Capacity Utilization...............................................154Future Capacity Issues ............................................................................................ 155
4-6 Range of Titers for MAb Production .....................................................................156Annual Mab Titer Change, 2008-2015 ..................................................................... 158
4-7 Discussion: Capacity and Industry Trends ..........................................................159Capacity Utilization .................................................................................................. 159
AnnualRep_15.indd ixAnnualRep_15.indd ix 6/5/15 1:10 PM6/5/15 1:10 PM

Report and Survey of Biopharmaceutical Manufacturing Capacity and Production
WWW.BIOPLANASSOCIATES.COMx
CHAPTER 5: Current and Future Capacity Constraints ...................................... 165
5-1 Current Capacity Constraints ...............................................................................165Respondents Experiencing No Capacity Constraints .............................................. 167Respondents’ Perception of Capacity Constraints, 2004-2015 ................................ 167Perception of Capacity Constraints: Biotherapeutic Developers vs. CMOs ........... 170Capacity Constraints: U.S. vs. Western European Biotherapeutic Developers & CMOs .............................................................................................. 172
5-2 Expected Capacity Constraints ............................................................................174Respondents’ Expectations of Capacity Constraints by 2020 .................................. 174Expected Capacity Constraints by 2020: Comparing 2004 to 2015 Data ................ 176Expected Capacity Constraints by 2020: CMOs vs. Biotherapeutic Developers ... 178Expected Capacity Constraints by 2020: U.S. vs. Western Europe........................ 180
5-3 Factors Impacting Future Production Capacity ..................................................181Factors Creating Future Capacity Constraints ......................................................... 181Factors Creating Future Capacity Constraints, 2008 vs. 2015 ................................ 183Factors Creating Future Capacity Constraints: Biotherapeutic Developers vs. CMOs .............................................................................................. 185CMOs’ Capacity Bottleneck Projections, in Retrospect ........................................... 188Biotherapeutic Developers’ Capacity Bottleneck Projections, in Retrospect ........... 189Factors Creating Capacity Constraints: U.S. vs. Western European Respondents 190
5-4 Key Areas to Address to Avoid Future Capacity Constraints ............................192Analysis of Areas to Avoid Capacity Constraints: Changing Perspectives, 2006-2015 ................................................................................................................ 194Key areas to Address to Avoid Capacity Constraints; Biomanufacturers vs. CMOs: 2015 vs. Recent Years .............................................. 196Key Areas to Address to Avoid Capacity Constraints: U.S. vs. Western Europe ..... 199
5-5 Discussion ..............................................................................................................201Overall Capacity Constraints ................................................................................... 202
CHAPTER 6: Future Capacity Expansions ..................................................... 207
6-1 Planned Future Capacity Expansions ..................................................................207Planned Future Capacity Expansions, 2009-2020 ................................................... 208Planned Future Capacity Expansions by 2020; CMOs vs. Biotherapeutic Developers ............................................................................................................... 210Planned Five-Year Capacity Expansions; U.S. vs. Western European Manufacturers .......................................................................................................... 212Planned Future Capacity Expansions of >100% ...................................................... 214
CHAPTER 7: Outsourcing Trends in Biopharmaceutical Manufacturing ................. 217Why Outsource? ...................................................................................................... 217Critical Outsourcing Operations ............................................................................... 217Relating Outsourcing to Workforce Reduction ......................................................... 218Strategic Manufacturing Planning ............................................................................ 218
AnnualRep_15.indd xAnnualRep_15.indd x 6/5/15 1:10 PM6/5/15 1:10 PM

©2015 BIOPLAN ASSOCIATES, INC. • NO UNAUTHORIZED REPRODUCTION PERMITTED • ALL RIGHTS RESERVED xi
TABLE OF CONTENTS / FIGURES AND TABLES
Future Projections .................................................................................................... 2197-1 Current Outsourcing by Production System .......................................................220
Summary of Findings: ............................................................................................. 221Facilities Currently Outsourcing No Production (All Production “In-house”), 2006-2015 ................................................................................................................ 223
7-2 Future Outsourcing ................................................................................................225Biotherapeutic Developers’ Outsourcing, 2020 Projections, by System .................. 225Biotherapeutic Developers Outsourcing Some Production in 2020 ......................... 227
7-3 Outsourced Activities in Biopharmaceutical Manufacturing .............................229Comparison of Biomanufacturers’ Outsourcing, (2010-2020) .................................. 231Increased Outsourced Activities, 24-month Projections .......................................... 233Outsourcing Activities Projected at ‘Signifi cantly Higher Levels’, Comparison of 2010-2015 Trends ................................................................................................ 235Average Percentage of Activities Outsourced Today ............................................... 237Comparison of Outsourcing Activities, 2010-2015 ................................................... 239Change in Spending on Outsourcing Activities ........................................................ 241
7-4 Critical Outsourcing Issues ..................................................................................242Selecting a CMO: 2015 ........................................................................................... 242Selecting a CMO, 2006-2015 ................................................................................... 244Changes in Critical Issues when Considering a CMO, 2006-2015 .......................... 246CMOs’ Problems with Clients ................................................................................... 248
7-5 Country Selections for International Outsourcing (Off-shoring) of Biomanufacturing ..................................................................................................250U.S. vs. Western European Respondents’ Outsourcing Destinations ..................... 252Western European Respondents’ Outsourcing Destinations ................................... 2575-Year Projection for Biomanufacturing International Outsourcing/Off-shoring ....... 260Offshoring Trends ..................................................................................................... 2615-Year Projection for Percentages of Biomanufacturing International Outsourcing/Off-shoring ........................................................................................... 262Some respondent comments .................................................................................. 263
7-6 Discussion: ............................................................................................................264Selecting a CMO ...................................................................................................... 267
CHAPTER 8: Disposables and Single-Use Systems in Biopharmaceutical Manufacturing .................................................................................... 271
8-1 Use of Disposables and Single-Use Systems .....................................................271Disposables Applications in Biopharmaceutical Manufacturing ............................... 271Trends in Disposable Applications: 2006-2015 ........................................................ 274Annual Growth Rate for Disposables Market Penetration / Usage .......................... 2769-year Growth in Disposables Applications, Percentage-point Gains ...................... 278Disposable Use by Stage of Production/Application ............................................... 279Use of Disposables: CMOs vs. Biotherapeutic Developers .................................... 281Leachables and Extractables ................................................................................... 283
AnnualRep_15.indd xiAnnualRep_15.indd xi 6/11/15 4:04 PM6/11/15 4:04 PM

Report and Survey of Biopharmaceutical Manufacturing Capacity and Production
WWW.BIOPLANASSOCIATES.COMxii
Paying for L&E Testing ............................................................................................. 2848-2 Reasons for Increasing Use of Disposables & Single-Use Systems ................285
Reasons for Increased Use of Disposables, 2006 through 2015 ............................ 287Reasons for Increased Use of Disposables: Biotherapeutic Developers vs. CMOs ....................................................................................................................... 289Single Most Critical Reason for Increasing the Use of Disposables ........................ 291
8-3 Factors That May Restrict Use of Disposables ...................................................293Factors That May Restrict Use of Disposables: Trends 2006-2015 ......................... 295Factors that May Restrict Use of Disposables: CMOs vs. Biotherapeutic Developers ............................................................................................................... 297Most Critical Reasons for Restricting Use of Disposables ....................................... 299Most Important Reasons for Not Increasing Use of Disposables, 2008-2015 ......... 301Most Important Reasons for Restricting Use of Disposables: Biotherapeutic Developer vs. CMO ................................................................................................. 303Top Reasons for Not Increasing the Use of Disposables: U.S. vs. European Respondents ............................................................................................................ 305
8-4 Standards Setting for Disposable, Single-use Systems ...............................................................................................307Standardizing Single-use Designs ........................................................................... 307Standardization Factors, 2013-2015 ........................................................................ 308Suppliers’ Expectations for Standards Setting Bodies ............................................. 310
8-5 Budgets for Disposable Systems .........................................................................311Annual Growth Rate in Budgets for Single-use Components 2007-2013 ................................................................................................................ 311
8-6 Disposable Adoption Issues, Need for Single-use Sensors, and Bioreactor Attributes .............................................................................................312Single-Use Adoption Issues ..................................................................................... 312Single-use Adoption Factors, U.S. vs Western Europe ............................................ 313Single-Use Sensor Technologies ............................................................................. 314
8-7 Recycling and Disposal of Single-use Plastics ...................................................316Waste Disposal of Single-use Devices .................................................................... 316Meeting Respondents’ Demands for Recycling ....................................................... 316
8-8 Satisfaction with Vendors of Disposables for Biopharmaceutical Manufacturing ........................................................................................................317Single-Use Attribute Importance Analysis ................................................................ 319Percentage of Unit Operations that are Single-use ................................................. 322Distribution of Responses ........................................................................................ 323
8-9 Discussion .............................................................................................................324Single-use Advantages ............................................................................................ 324Growth in the Use of Single-use Systems ............................................................... 325Downstream Single-use Systems Use ..................................................................... 326CMOs’ Use of Single-use Equipment ....................................................................... 326Downstream Bottlenecks Persist ............................................................................. 327
AnnualRep_15.indd xiiAnnualRep_15.indd xii 6/5/15 1:10 PM6/5/15 1:10 PM

©2015 BIOPLAN ASSOCIATES, INC. • NO UNAUTHORIZED REPRODUCTION PERMITTED • ALL RIGHTS RESERVED xiii
TABLE OF CONTENTS / FIGURES AND TABLES
Modular: The Next Trend after Single-use? ............................................................ 327Single-use Equipment Sourcing, Quality Issues, and L&E Testing .......................... 328
CHAPTER 9: Downstream Purifi cation ........................................................ 335
9-1 Impact of Downstream Processing on Capacity .............................................................................................................335Impact of Downstream Processing on Capacity, Biopharmaceutical Developers vs. CMOs ............................................................................................. 338Impact of Downstream Processing on Capacity, U.S. vs. Western European Biomanufacturers .................................................................................... 340
9-2 Specifi c Purifi cation Step Constraints .................................................................342Changes in Impact on Capacity of Purifi cation Steps, 2008-2015 ........................... 344Specifi c Purifi cation Step Constraints, U.S. vs. Western European Biomanufacturers ..................................................................................................... 345
9-3 Downstream Purifi cation Issues Facing the Industry Today .............................346Protein A and Alternatives ........................................................................................ 346Changes in Perception of Protein A and Alternatives ............................................... 347Protein A Downstream Purifi cation Issues, U.S. vs. Western Europe ...................... 348
9-4 mAb Purifi cation Capacity Estimates; Current Upstream Production Titer vs. Max Capacity ...........................................................................................349
9-5 New Downstream Processing Technologies .......................................................352New Downstream Processing Solutions; 2010 – 2015 ............................................ 354New Downstream Processing Technologies; Biotherapeutic Developers vs. CMOs .............................................................................................. 356New Downstream Processing Technologies; U.S. vs. Western Europe .................. 358
9-6 Improvements to Downstream Operations ..........................................................360Comparison of New Downstream Technology Implementation; Biomanufacturers vs. CMOs .................................................................................... 362Comparison of New Downstream Technology Investigations; U.S. vs. W. Europe vs. ROW ................................................................................... 364
9-7 Discussion ..............................................................................................................366Upstream Expression Titer Trends and Impact on Downstream Operations ........... 366Downstream Processing Solutions .......................................................................... 366
CHAPTER 10: Quality Issues, Batch Failures, and PAT in Biopharmaceutical Manufacturing .................................................................................... 371
Introduction .............................................................................................................. 37110-1 Hurdles to Implementing Process Analytical Technology, 2008-2015 ...............372
PAT Adoption Will Increase ...................................................................................... 37410-2 Batch Failure Frequency in Biopharmaceutical Manufacturing ........................375
10-3 Primary Cause of Batch Failures and Percentages of Failures .........................377
AnnualRep_15.indd xiiiAnnualRep_15.indd xiii 6/5/15 1:10 PM6/5/15 1:10 PM

Report and Survey of Biopharmaceutical Manufacturing Capacity and Production
WWW.BIOPLANASSOCIATES.COMxiv
10-4 Quality Problems in Biopharmaceutical Manufacturing Attributed to Vendors .............................................................................................382
10-5 Automation Implementation ..................................................................................384Comparison of Implementation Plans 2009 - 2013 .................................................. 384
10-6 Quality Initiative Implementation ..........................................................................386Comparison of Quality Initiative Implementation, 2009 - 2015 ................................ 387
10-7 Global Quality Supply Management .....................................................................389Quality Supply Management-US vs. W. Europe ...................................................... 390
10-8 Discussion ..............................................................................................................391Hurdles Hindering Implementation of PAT ............................................................... 391Batch Failures Due to Single-Use Adoption or Continued Stainless Steel Use? ..... 392Quality Problems Traced to Vendors ....................................................................... 392Process Information Needs and Value Drive Automation ....................................... 393Quality Initiatives Are Becoming Commonplace and the New Industry Norm ......... 393Challenges to Implementing PAT, QbD and other Quality Initiatives ........................ 394Supply Management Issues with Single-use Systems ............................................ 394
CHAPTER 11: Hiring, Employment Growth, and Training in BiopharmaceuticalManufacturing .................................................................................... 395
Introduction .............................................................................................................. 39511-1 Hiring Trends ..........................................................................................................396
11-2 Hiring in 2020: 5-year Trends .................................................................................397
11-3 Hiring Challenges Today ........................................................................................398Hiring Diffi culties; 2010 - 2015 ................................................................................. 400Hiring Diffi culties: U.S. vs. Western Europe ............................................................. 402U.S. vs. Western Europe Hiring Trends ................................................................... 402
11-4 Training in Biopharmaceutical Manufacturing ....................................................404Changes in Training for New Manufacturing Employees, 2009-2015 ...................... 406
11-5 Discussion .............................................................................................................407Options Developing for Bioprocessing Training ....................................................... 407Continued Growth in Biopharmaceutical Manufacturing Jobs ................................. 409
CHAPTER 12: Fill and Finish .................................................................... 411Introduction .............................................................................................................. 411
12-1 Demographics ........................................................................................................411Areas of Involvement ............................................................................................... 411Geographic Location, Facilities ................................................................................ 412
12-2 Trends in Aseptic Bioprocessing Capacity ........................................................413An Analysis of US and European In-house Capacity and Capacity Utilization ................................................................................................. 413Problems in Estimating Capacity ............................................................................ 415Current Fill-Finish Trends ......................................................................................... 415
AnnualRep_15.indd xivAnnualRep_15.indd xiv 6/11/15 4:04 PM6/11/15 4:04 PM

©2015 BIOPLAN ASSOCIATES, INC. • NO UNAUTHORIZED REPRODUCTION PERMITTED • ALL RIGHTS RESERVED xv
TABLE OF CONTENTS / FIGURES AND TABLES
Recent Industry Trends ............................................................................................ 417Future Fill and Finish Trends ................................................................................... 418Suppliers’ Innovation Trends .................................................................................... 418Industry Capacity Data ............................................................................................. 419
12-3 Discussion ..............................................................................................................421Voice of Industry ...................................................................................................... 421
CHAPTER 13: Suppliers to Biopharmaceutical Manufacturing and Life Sciences ..... 425Introduction .............................................................................................................. 425
13-1 Demographics ........................................................................................................425Areas of Involvement ............................................................................................... 425Location of Vendor Sales ........................................................................................ 428Respondents’ Primary Job ...................................................................................... 430
13-2 Growth Rate of Sales by Suppliers ......................................................................431Average Industry Growth Rate, By Segment ........................................................... 433Vendor Sales Growth Rates, by Industry Segment, 2007 to 2015 ........................... 434Supplier Annual Sales, Distribution .......................................................................... 436
13-3 Discussion .............................................................................................................437
13-4 Budget Issues and Problems Faced by Industry Supplier .................................438Budget Challenges in 2015 ...................................................................................... 438Vendor Average Budget Changes for 2009 -2015 ................................................... 440Vendor Pricing Changes .......................................................................................... 442Future Price Changes .............................................................................................. 443
13-5 Cost Cutting Actions by Vendors .........................................................................444Cost Cutting Actions, By Segment ........................................................................... 446
13-6 Problems Clients Have With Their Vendors .........................................................448Vendor Expansion Plans .......................................................................................... 450Biopharma Vendor Business Trends, 2010 vs 2015 ................................................ 452Top New Technology Areas in Development by Vendors ......................................... 454
13-7 Discussion: Supplier Budget Issues ...................................................................458
13-8 Sales Staff Training ................................................................................................459Days of Training Provided ....................................................................................... 459Areas where Training May Help Sales Staff Perform, Trends 2010 - 2015 .............................................................................................................. 460Clients’ Demands on Vendors .................................................................................. 462Biopharma Vendors’ Outlook for 2015 ..................................................................... 464
13-9 Discussion ..............................................................................................................465Bioprocessing Vendors Will See Continued Market Growth .................................... 465Single-use Systems Are Increasingly Driving Sales ................................................ 465Trends Favor Increased Vendor Sales ..................................................................... 466Vendors are Offering More Services, Going for Larger Sales .................................. 467
AnnualRep_15.indd xvAnnualRep_15.indd xv 6/11/15 4:25 PM6/11/15 4:25 PM

Report and Survey of Biopharmaceutical Manufacturing Capacity and Production
WWW.BIOPLANASSOCIATES.COMxvi
FIGURESFig 0.1: Area of Primary Involvement in Biopharmaceutical Manufacturing, 2010 to 2015 ......2
Fig 0.2: Respondents’ Job Responsibilities, 2011 - 2015 .........................................................3
Fig 0.3: Facility Location ...........................................................................................................4
Fig 0.4: Facility Location, by Region .........................................................................................5
Fig 0.5: Biopharmaceutical Manufacturing Systems, (2007-2015) Trends ...............................7
Fig 0.6: Phase of Development of Surveyed Respondents.......................................................9
Fig 0.7: Phase of Development of Surveyed Respondents, 2015 (US vs Western Europe) ...10
Fig 0.8: Distribution of Employees at Facility, and Organization .............................................11
Fig 0.9: Distribution of Total Batches Run at Facility Last Year, by Scale of Production .........13
Fig 1.1: Investigational Drugs: Large Molecule (Protein Therapeutics), Worldwide, 2010 - 2015 .............................................................................................21
Fig 1.2: Current Worldwide Pipeline & Launched Products, Large Molecules, January 2015 .............................................................................................................23
Fig 1.3: Current Worldwide Pipeline & Launched Products, Large Molecules, January 2015 .............................................................................................................24
Fig 2.1: Scanned Excerpt from an FDA Form 483 ..................................................................61
Fig 2.2: Antibody binding capacities on two prototype mixed mode membranesfrom Natrix Separations. ............................................................................................74
Fig 2.3: Example of chromatographic like separation achieved on a mixed modemembrane from Natrix Separations. .........................................................................75
Fig 3.1: SINGLE most important biomanufacturing trend or operational area, 2014-2015 ....90
Fig 3.2: Biomanufacturers’ Budget Shifts in 2015 ...................................................................92
Fig 3.3: Approximate Average Change in Biomanufacturers’ Budgets for 2015 ....................93
Fig 3.4: Average Biomanufacturers’ Budget Change, 2009-2015 ..........................................96
Fig 3.5: New Product Development Focus Areas ...................................................................99
Fig 3.6: New Product Development Areas of Interest: 2010 - 2015 ......................................103
Fig 3.7: New Product Development Areas of Interest: Biotherapeutic Developers vs CMOs ...............................................................................................105
Fig 3.8: New Product Development Areas of Interest: US vs Western Europe and ROW ....107
Fig 3.9: Factors in Biomanufacturing Performance Creating “Signifi cant” or“Some” Improvements .............................................................................................109
Fig 3.10: Factors in Biomanufacturing Performance Creating “Signifi cant” or Some” Improvements: 2010 - 2015 .........................................................................111
Fig 3.11: Factors in Biomanufacturing Performance Creating “Signifi cant” or“Some” Improvements: Biomanufacturers vs. CMOs ..............................................113
Fig 3.12: Factors in Biomanufacturing Performance Creating “Signifi cant” or“Some” Improvements: U.S. vs Western Europe vs. Rest of World .........................115
Fig 3.13: Cost-Cutting Changes: Actions Undertaken During “Past 12 Months” Comparing 2011-2015 .............................................................................................117
Fig 3.14: Cost-Cutting Changes, Outsourced Jobs, by Segment, and Geography ...............118
AnnualRep_15.indd xviAnnualRep_15.indd xvi 6/11/15 4:04 PM6/11/15 4:04 PM

©2015 BIOPLAN ASSOCIATES, INC. • NO UNAUTHORIZED REPRODUCTION PERMITTED • ALL RIGHTS RESERVED xvii
TABLE OF CONTENTS / FIGURES AND TABLES
Fig 3.15: Biomanufacturing Assay ‘Areas’ Urgently Requiring New, ImprovedTesting Methods, 2011 -2015...................................................................................120
Fig 3.16: Perfusion Operations Issues: Perfusion vs. Batch-Fed Processes (2014 data) ......123
Fig 3.17: Perfusion Operations Issues: Comparison 2010 - 2014 .........................................124
Fig 3.18: Likelihood of Implementing bioreactor, by type (2014 data)....................................127
Fig 3.19: Likelihood of Implementing Single-use Bioreactors, Clinical Scale, 2012-2014 .....128
Fig 4.1: Capacity Utilization, By System................................................................................137
Fig 4.2: Capacity Utilization, By System, 2004-2015 ............................................................139
Fig 4.3: Change in Capacity Utilization, CAGR, 2006-2015..................................................140
Fig 4.4: Capacity Utilization, By System, Biotherapeutic Developer vs. CMOs ....................143
Fig 4.5: Capacity Utilization, By System, U.S. vs Western Europe .......................................144
Fig 4.6: Current Production Capacity Distribution, Mammalian Cell Culture ........................146
Fig 4.7: Production Capacity Distribution, Mammalian Cell Culture, 2011-2015 ..................147
Fig 4.8: Current Production Capacity Distribution, Microbial Fermentation ..........................151
Fig 4.9: Current Production Capacity Distribution, Yeast ......................................................152
Fig 4.10: Current Production Capacity Distribution, Insect Cells ............................................153
Fig 4.11: Mammalian Cell Culture Capacity Estimates 2003-2014 .........................................154
Fig 4.12: Microbial Fermentation Capacity Estimates 2003-2014...........................................155
Fig 4.13: Range of Titres for Mabs Obtained at Various Production Scales, Distribution .......157
Fig 4.14: Average Mab Titre Trend 2008-2015 ........................................................................158
Fig 5.1: Capacity Constraints, by Stage of Production .........................................................166
Fig 5.2: Capacity Constraints, 2004 through 2015 ................................................................168
Fig 5.3: Capacity Constraints Trends, 2004-2015 .................................................................169
Fig 5.4: Capacity Constraints, Biotherapeutic Developers vs. CMOs ..................................171
Fig 5.5: Capacity Constraints, U.S .vs. Western Europe .......................................................173
Fig 5.6: Expectations of Capacity Constraints; by Stage of Production; Five-year Projections ...............................................................................................175
Fig 5.7: Expectations of Capacity Constraints: Five-year Projections Made in 2004-2015 ..177
Fig 5.8: Expectations of Capacity Constraints: Five-year Projections Made in 2004 thru 2020 (Trend Line) .....................................................................................178
Fig 5.9: Five-year Projections for Capacity Constraints: Biotherapeutic Developers vs. CMOs ..............................................................................................179
Fig 5.10: Five-year Projections for Capacity Constraints: U.S. vs. Western Europe ..............180
Fig 5.11: Factors Creating Future Capacity Constraints ........................................................182
Fig 5.12: Factors Creating Future Capacity Constraints, 2008-2015 ......................................184
Fig 5.13: Factors Creating Future Capacity Constraints: Biotherapeutic Developers vs. CMOs ..............................................................................................186
Fig 5.14: Factors Creating Future Capacity Constraints, U.S. vs. Western European Biomanufacturers ....................................................................................191
Fig 5.15: Key areas to Address to Avoid Capacity Constraints ..............................................193
AnnualRep_15.indd xviiAnnualRep_15.indd xvii 6/5/15 1:10 PM6/5/15 1:10 PM

Report and Survey of Biopharmaceutical Manufacturing Capacity and Production
WWW.BIOPLANASSOCIATES.COMxviii
Fig 5.16: Key areas to Address to Avoid Capacity Constraints; 2006-2015 ..........................195
Fig 5.17: Key Areas to Address to Avoid Capacity Constraints; Biomanufacturers vs. CMOs ...................................................................................198
Fig 5.18: Key areas to Address to Avoid Capacity Constraints; U.S. vs. Western Europe .....200
Fig 6.1: Industry Average Planned Production Increase by 2020 ........................................207
Fig 6.2: Planned Future Capacity Expansion: 5-year Estimates, 2009 through 2020 ...........209
Fig 6.3: Planned Future Capacity Expansion: 5-year Estimates; BiotherapeuticDevelopers vs. CMOs ..............................................................................................211
Fig 6.4: Planned Future Capacity Expansion: 5-year Estimates; U.S. vs. Western Europe ..213
Fig 6.5: Percent of Respondents Projecting Production Increases of over 100% by 2020; 5-year Trend .............................................................................................................215
Fig 7.1: Current Percent Production Outsourced; by System, 2015 .....................................222
Fig 7.2: Biopharmaceutical Manufacturing Facilities Outsourcing NO Production, 2006-2015 ................................................................................................................224
Fig 7.3: Future Outsourcing: Percent Production Outsourced; by System, in 2020 .............226
Fig 7.4: Five-year Projections: % Biotherapeutic Developers Planning to Outsource at Least Some Production; Projections made 2007-2015 .......................................228
Fig 7.5: Percent of Biomanufacturers Outsourcing at Least Some Activity Today ................230
Fig 7.6: Percent of Biomanufacturers Outsourcing at Least Some Activity, 2010 - 2015 ......232
Fig 7.7: Outsourcing Activities Projected to be Done at ‘Signifi cantly Higher Levels’ Next 2 Years .............................................................................................................234
Fig 7.8: Outsourcing Activities Projected to be Done at ‘Signifi cantly Higher Levels’in 2 Years, 2010 - 2015 Trends ................................................................................236
Fig 7.9: Current Outsourcing: Average Percentage of Activity Outsourced Today ...............238
Fig 7.10: Estimated Average Percent of Activity Outsourced by Facilities, 2010 thru 2015 ...240
Fig 7.11: Change in Spending on Outsourcing for R&D or Manufacturing, 2012 - 2015 .......241
Fig 7.12: Outsourcing Issues: BioManufacturing by Contract Manufacturing Organizations ...........................................................................................................243
Fig 7.13: Important Outsourcing Issues: BioManufacturing by Contract Manufacturing Organizations, Trends 2006-2015 ............................................................................245
Fig 7.14: Important Outsourcing Issues: Response Shifts Over Time 2006-2015, Percentage Point Differences ..................................................................................247
Fig 7.15: Most Common Mistakes Biopharmaceutical Sponsors Make with their CMOs, 2010-2013 ................................................................................................................249
Fig 7.16: Country Selections as Destination for International Outsourcing of ............................... BioManufacturing (All Respondents) .......................................................................251
Fig 7.17: Percent U.S. Respondents Considering Country as ‘Possible’ Outsourcing Destination ..........................................................................................253
Fig 7.18: Percent U.S. Respondents Considering Country as “Strong Likelihood” or“Likelihood” as Outsourced Capacity Destination ...................................................255
Fig 7.19: Percent Western European Respondents Considering Country as ‘Possible’Outsourcing Destination ..........................................................................................258
AnnualRep_15.indd xviiiAnnualRep_15.indd xviii 6/5/15 1:10 PM6/5/15 1:10 PM

©2015 BIOPLAN ASSOCIATES, INC. • NO UNAUTHORIZED REPRODUCTION PERMITTED • ALL RIGHTS RESERVED xix
TABLE OF CONTENTS / FIGURES AND TABLES
Fig 7.20: Percent European Respondents Considering Country as “Strong Likelihood”or “Likelihood” as Outsourced Capacity Destination ...............................................259
Fig 7.21: Percent of Biomanufacturing Operations Off-shored (International Outsourcing) within 5 Years ...............................................................260
Fig 7.22: Percent Biomanufacturers Performing at Least “Some” of the following as International Outsourcing/Off-shoring during Next 5 Years .....................................261
Fig 7.23: Estimated % Operations Done as International Outsourcing/Off-shoring during Next 5 Years .............................................................................................................262
Fig 8.1: Usage of Disposables in Biopharmaceutical Manufacturing, any Stage of R&D or Manufacture ............................................................................................273
Fig 8.2: Usage of Disposables in Biopharmaceutical manufacturing, any Stage of R&D or Manufacture; 2006-2015 .........................................................................275
Fig 8.3: Average Annual Growth Rate, Disposables, 2006-2015 ..........................................277
Fig 8.4: 9-Year Percentage-Point Change in First-Usage of Disposables, 2006-2015 .........278
Fig 8.5: Usage of Disposables in Biopharmaceutical Manufacturing, by Stage of Manufacture (R&D Through Commercial Manufacture) ..........................................280
Fig 8.6: Usage of Disposables in Biopharmaceutical Manufacturing; Biotherapeutic Developer vs. CMO .........................................................................282
Fig 8.7: Value of Useable Leachables and Extractables Data ..............................................284
Fig 8.8: Reasons for Increasing Use of Disposable System Components in 2015 ...............286
Fig 8.9: Reasons for Increasing Use of Disposable System Components, 2006-2015 ........288
Fig 8.10: Reasons for Increasing Use of Disposable System Components, Biotherapeutic Developers vs. CMOs ......................................................................290
Fig 8.11: Single Most Critical Reason for Increasing Use of Disposables, 2009 - 2015 .........292
Fig 8.12: Reasons for Restricting Use of Disposables ............................................................294
Fig 8.13: Factors Restricting Use of Disposables, 2006-2015 ................................................296
Fig 8.14: Factors Restricting Use of Disposables, Biotherapeutic Developer vs. CMO .........298
Fig 8.15: Top Reasons for Not Increasing Use of Disposables, 2015 .....................................300
Fig 8.16: Top Reasons for Not Increasing Use of Disposables, 2008-2015 ...........................302
Fig 8.17: Top Reasons for Not Increasing Use of Disposables, Biotherapeutic Developer vs. CMO..................................................................................................304
Fig 8.18: Top Reasons for Not Increasing Use of Disposables, U.S. vs. Western Europe .....306
Fig 8.19: Single-use/Disposables Standardization Factors ....................................................308
Fig 8.20: Single-use/Disposables Standardization Factors, 2013-2015 .................................309
Fig 8.21: Single-use / Disposable Device Adoption Factors...................................................312
Fig 8.22: Single-use / Disposable Device Adoption Factors; U.S. vs Western Europe ..........313
Fig 8.23: Need for Improved Single-Use Sensors, 2012-2015 ...............................................315
Fig 8.24: Single-use Product Vendor Satisfaction Factors, 2008 - 2015 .................................318
Fig 8.25: Importance of Single-use Product Attributes vs Level of Vendor Satisfaction .........320
Fig 8.26: Percentage Point Gap between Importance of SUS Product Attributesand Level of Satisfaction ..........................................................................................321
AnnualRep_15.indd xixAnnualRep_15.indd xix 6/5/15 1:10 PM6/5/15 1:10 PM

Report and Survey of Biopharmaceutical Manufacturing Capacity and Production
WWW.BIOPLANASSOCIATES.COMxx
Fig 8.27: Estimated Percentage of Facilities’ Unit Operations That Are “Single-use” (2014 vs 2015) .........................................................................................................322
Fig 8.28: Distribution of Responses, % Single-use Devices in Biomanufacturing ..................323
Fig 9.1: Impact of Downstream Processing on Overall Capacity, 2008-2015 .......................337
Fig 9.2: Impact of Downstream Processing on Overall Capacity; Biotherapeutic Developers vs. CMOs ..............................................................................................339
Fig 9.3: Impact of Downstream Processing on Overall Capacity; U.S. vs. Western Europe ..........................................................................................341
Fig 9.4: Impact on Capacity of Depth, Chromatography and UF Purifi cation Steps ............343
Fig 9.5: Impact on Capacity of Purifi cation Steps: Experiencing at “Signifi cant” or “Severe” Constraints, 2008 - 2015 ...........................................................................344
Fig 9.6: Impact on Capacity of Purifi cation Steps, U.S. vs. Western Europe ........................345
Fig 9.7: Issues Regarding Protein A Usage ..........................................................................346
Fig 9.8: Issues Regarding Protein A Usage, 2009 - 2015 .....................................................347
Fig 9.9: Issues Regarding Protein A Usage; U.S. vs. Western Europe .................................348
Fig 9.10: mAb Operations: Current Upstream mAb Production Titer (Distribution of Responses) ......................................................................................350
Fig 9.11: Bioreactor Yield at which DOWNSTREAM mAb Purifi cation Train Becomes Bottlenecked ............................................................................................351
Fig 9.12: New Downstream Processing Solutions ...................................................................353
Fig 9.13: New Downstream Processing Solutions Comparison 2010-2015 ............................355
Fig 9.14: New Downstream Processing Solutions; Biotherapeutic Dev. vs. CMO ..................357
Fig 9.15: New Downstream Processing Solutions; U.S. vs. Western Europe..........................359
Fig 9.16: Improving Downstream Operations, 2011 - 2015 ....................................................361
Fig 9.17: Improving Downstream Operations; Biomanufacturers vs. CMOs ..........................363
Fig 9.18: Improving Downstream Operations (U.S. vs. Western Europe vs. ROW) ................365
Fig 10.1: Hurdles Hindering Implementation of PAT (2008 - 2015) ........................................373
Fig 10.2: Batch Failure Frequency Distribution, 2009 - 2015 ..................................................376
Fig 10.3: Average Rates of Failure, by Primary Cause, and Scale of Manufacture ................378
Fig 10.4: Average Rates of Failure, by Primary Cause, and Phase of Manufacturing 2009 - 2015 (Commercial Manufacture) ..........................................379
Fig 10.5: Average Rates Failure, by Primary Cause, and Phase of Manufacturing 2009 - 2015 (“Clinical” Scale) ..........................................................381
Fig 10.6: Quality Problems Traced to Vendors; 2008 – 2015 ..................................................383
Fig 10.7: Quality Initiatives Implemented Currently, or within Next 12 Months .......................386
Fig 10.8: Quality Initiative to be Implemented in “Next 12 Months,” Comparing 2009 - 2015 ...........................................................................................388
Fig 11.1: New Hires in Biopharmaceutical Manufacturing (2015) ..........................................396
Fig 11.2: New Hires in Biopharmaceutical Manufacturing (2020) ..........................................397
Fig 11.3: Areas Where Hiring Diffi culties Exist in Biopharmaceutical Operations ..................399
AnnualRep_15.indd xxAnnualRep_15.indd xx 6/5/15 1:10 PM6/5/15 1:10 PM

©2015 BIOPLAN ASSOCIATES, INC. • NO UNAUTHORIZED REPRODUCTION PERMITTED • ALL RIGHTS RESERVED xxi
TABLE OF CONTENTS / FIGURES AND TABLES
Fig 11.4: Areas Where Hiring Diffi culties Exist in Biopharmaceutical Operations; 2010 - 2015 ..............................................................................................................401
Fig 11.5: Areas Where Hiring Diffi culties Exist in Biopharmaceutical Operations, U.S. vs. Western Europe ..........................................................................................403
Fig 11.6: Training for New Operations/Manufacturing Employees ..........................................405
Fig 11.7: Changes in Training for New Operations/Manufacturing Employees, 2009 - 2015 ..............................................................................................................406
Fig 12.1: Fill-Finish Operation Type ........................................................................................411
Fig 12.2: Fill-Finish Operation Location ...................................................................................412
Fig 12.3: Fill-Finish Capacity Utilization Averages (12th Annual Report data)........................414
Fig 12.4: Most Important Trends in Fill-Finish ..........................................................................416
Fig 12.5: Novel Fill-Finish Technologies; Implementation Plans within 2 Years ......................420
Fig 13.1: Area of Biopharmaceutical Involvement, Vendor .....................................................426
Fig 13.2: Area of Biopharmaceutical Involvement, Vendor Comparison 2010 to 2015 ..........427
Fig 13.3: Geographic Locations in which Vendors Currently Actively Sell Products or Services, 2008 - 2015 ..........................................................................429
Fig 13.4: Respondents’ Primary Job Function ........................................................................430
Fig 13.5: Average Annual Vendor Sales Growth Rate, 2007 - 2015 .......................................431
Fig 13.6: Biopharmaceutical Supply Market Segment Sales Growth Distribution ..................432
Fig 13.7: Average Annual Vendor Segment Sales Growth Rates, 2015 .................................433
Fig 13.8: Average Annual Vendor Sales Growth Rate, 2007 - 2015, by Segment ..................435
Fig 13.9: Vendors’ Approx Annual Sales to Biopharmaceutical Segment % ..........................436
Fig 13.10: Vendors’ Average Budget Change for 2015 ............................................................439
Fig 13.11: Vendors’ Average Budget Change for 2009 - 2015, Summary ................................441
Fig 13.12: Vendors’ Average Pricing Changes (2015 responses) ............................................442
Fig 13.13: Vendors’ Average Pricing Changes, 2009-2014 Actual and 2015 projected ..........443
Fig 13.14: Actions undertaken to reduce overall costs, prior 12 months, 2011 – 2015 ............445
Fig 13.15: Actions undertaken to reduce overall costs in past 12 months, By Segment..........447
Fig 13.16 (See Fig 10.6; recap): Quality Problems Traced to Vendors ....................................449
Fig 13.17: Biopharma Business and Marketing Plans, 2015 ....................................................451
Fig 13.18: Biopharma Business and Marketing Plans, 2010-2015 ...........................................453
Fig 13.19: Top New Technologies or New Product Development Areas ...................................455
Fig 13.20: Areas Where Training May Help Sales Staff Perform Better; 2010 – 2015 ...............461
Fig 13.21: Client Demands of Vendors, Service and Support, 2012 - 2015 .............................463
Fig 13.22: Vendors’ Optimism; Financial Performance 2011-2014, and Projected Performance in 2015 ................................................................................................464
AnnualRep_15.indd xxiAnnualRep_15.indd xxi 6/5/15 1:10 PM6/5/15 1:10 PM

Report and Survey of Biopharmaceutical Manufacturing Capacity and Production
WWW.BIOPLANASSOCIATES.COMxxii
TABLESTable: 1.1 Biologics (Large Molecule), Worldwide, through January 2015 ................................22
Table 1.2: Worldwide Pipeline, Large Molecules, 2008-2015 .....................................................25
Table 1.3: Number of Products in U.S. and European Markets* .................................................27
Table 1.4: Summary of Worldwide Biopharmaceutical Revenue Growth by Product Class, 2007 and 2014 .................................................................................34
Table 1.5: Blockbuster Biopharmaceutical Products* ................................................................36
Table 1.6: Expression Systems/Host Cells for U.S./EU-Marketed Cultured Biopharmaceuticals ....................................................................................38
Table 3.1: Areas of Signifi cant Projected Budget Percentage Increases for Biomanufacturing, Past Years: ...................................................................................95
Table 4.1: Distribution of Mammalian Cell Culture Capacity, Product Manufacturers .............148
Table 4.2: Compound Annual Change in Mab Titre, 2008-2015 ..............................................159
Table 7.1: Percent of U.S.-based Respondents Indicating Country as a“Strong Likelihood” or “Likelihood” as Outsourcing Destination, 2009-2014 ..........256
Table 7.2: Percent of European-based Respondents Indicating Country as a“Strong Likelihood” or “Likelihood” as Outsourcing Destination, 2011-2014 ..........259
Table 8.1: Suppliers’ Expectations for Who Should be Setting Standards for SUS ..................310
Table 9.1: Percent experiencing “Serious” or “Some” capacity problems due to downstream processing 2008-2015 .......................................................................338
Table 9.2: Percent U.S. vs. Western Europe facilities experiencing“Serious” capacity problems due to downstream processing, 2009-2015 .............340
Table 9.3: Percent U.S. vs. Western Europe facilities not expecting to seebottlenecks due to downstream processing, 2008-2015 ........................................340
Table 9.4: Current Upstream Production Titer vs. Max Capacity ..............................................349
Table 10.1: Batch Failures, Average Weeks Between Failures, per Facility, 2008-2015 ............375
Table 11.1 Percentage New Hires, by Area; 2008 – 2015 .........................................................397
Table 13.1: Selected “Other” Responses, New Technology Areas in Development ..................456
Table 13.2: Average Vendor Sales and Technical Training Days, 2011 - 2013 ..........................459
AnnualRep_15.indd xxiiAnnualRep_15.indd xxii 6/11/15 4:25 PM6/11/15 4:25 PM

©2015 BIOPLAN ASSOCIATES, INC. • NO UNAUTHORIZED REPRODUCTION PERMITTED • ALL RIGHTS RESERVED xxiii
M E T H O D O LO G YThis report is the twelfth in our annual evaluations of the state of the biopharmaceutical manufacturing industry. The strength of this study’s methodology remains in its breadth of coverage, which yields a composite view from the respondents closest to the industry. This year, BioPlan Associates, Inc. surveyed 237 qualifi ed and responsible individuals at biopharmaceutical manufacturers and contract manufacturing organizations in 28 countries; plus 164 industry vendors and direct suppliers of materials, services and equipment to this industry segment. Using a web-based survey tool, we obtained and evaluated information regarding respondents’ current capacity, production, novel technology adoption, human resources, quality, and outsourcing issues. We assessed respondents’ projected reasons for bottlenecks, and their perception of how these bottlenecks might be resolved.
This year, in Chapter 2, we provide additional in-depth analysis of specifi c issues affecting the industry. These Monographs cover the events shaping the past year, and evaluate how they will affect, or create trends that will shape biopharmaceutical manufacturing over the next fi ve years. We also have included this year a chapter on Fill-and Finish operations. Over the past few years, advances in technologies, drug delivery, and single-use applications have increasingly made this segment an area of interest for innovation.
To ensure comprehensive global coverage, we partnered with world-wide organizations to ensure the most accurate overview of the worldwide biopharmaceutical industry. Our industry partners are included in our acknowledgment section. In addition, to support this coverage, we also include acknowledgment of our media partners, whose assistance enabled us to reach the high quality of respondents required in this quantitative analysis.
Further information on methodology, breakouts on specifi c segments, and data from earlier surveys may be obtained by contacting us at the address below.
Eric S. LangerPresidentBioPlan Associates, Inc.2275 Research Blvd., Suite 500Rockville, MD 20850301-921-5979 [email protected]
AnnualRep_15.indd xxiiiAnnualRep_15.indd xxiii 6/5/15 1:10 PM6/5/15 1:10 PM

Report and Survey of Biopharmaceutical Manufacturing Capacity and Production
WWW.BIOPLANASSOCIATES.COMxxiv
AnnualRep_15.indd xxivAnnualRep_15.indd xxiv 6/5/15 1:10 PM6/5/15 1:10 PM

©2015 BIOPLAN ASSOCIATES, INC. • NO UNAUTHORIZED REPRODUCTION PERMITTED • ALL RIGHTS RESERVED 1
CHAPTER 0: DEMOGRAPHICS
C H A P T E R 0:D E M O G R A P H I C S
Survey respondents included a diverse group of biopharmaceutical senior managers and executives covering a spectrum of global biopharmaceutical and CMO fi rms. In addition, in Chapter 13, we include responses from global suppliers and vendors in this industry. As
in previous years, we included fi rms of all sizes. While we specifi cally sought input from larger manufacturers with substantial current capacity, we also obtained data from mid-tier and smaller companies with clinical scale production, and also from companies using CMOs for product manufacture and from CMOs. Respondents had a broad range of responsibilities, though all were directly involved with manufacturing in some way. Most were senior staff within their organizations.
This was an international effort, and we received responses from individuals at organizations around the world, including input from facilities in 28 countries.
The diversity of respondents provides a comprehensive view of the industry from those closest to the present state of their organizations; those with a good understanding of the current and future business drivers, and their company’s manufacturing plans and needs. This offers a means for understanding the industry and its future course. The breakdown of organizations into CMOs and biotherapeutic manufacturers provides insights into two major segments of the industry. These two types of organizations have different business drivers, risk profi les, and costs of capital.
Respondents’ Area of InvolvementOf the 237 biopharmaceutical manufacturers and contract manufacturing organizations (CMOs) staff responding to this year’s survey, 23.6% were primarily involved in large-scale cell culture production for therapeutics, down from 27.7% last year; 21.9% were involved primarily in process development for biopharmaceutical manufacturing, a decline from the past couple of years; and 11.0% were involved in scale-up (or clinical-scale) production for biopharmaceuticals only, a decline to the lower levels seen in prior years. Those involved with large-scale microbial fermentation for therapeutics accounted for 4.2%, a decline from prior years, and 9.3% of respondents indicated they were primarily involved in vaccine production, near the same percentage of respondents seen in prior years. ‘Other’ large-scale biopharmaceutical manufacturing respondents accounted for 9.7% of the total, and ‘Other’ contract manufacturing (CMO) for biopharmaceuticals accounted for 3.8% of respondents. Lastly, 9.7% were employed in Large-scale contract manufacturing (CMO) for biopharmaceuticals, an increase overall from most prior years. This year, 6.8% of respondents accounted for fi ll-fi nish operations. Overall, the makeup of respondents continues to be consistent with prior years’ studies, with the most signifi cant changes seen in scale-up (or clinical-scale) production for biopharmaceuticals only, large-scale cell culture production for therapeutics and vaccine production. Despite variations,
AnnualRep_15.indd 1AnnualRep_15.indd 1 6/5/15 1:10 PM6/5/15 1:10 PM

Report and Survey of Biopharmaceutical Manufacturing Capacity and Production
WWW.BIOPLANASSOCIATES.COM2
including decreases, in reporting involvement in aspects of biopharmaceutical manufacturing, this year’s data falls within the range defi ned by prior years’ data reporting, with the relative rankings remaining largely unaffected.
Fig 0.1: Area of Primary Involvement in Biopharmaceutical Manufacturing, 2010 to 2015
"In which area of biopharmaceutical manufacturing is your organization currently involved?"
Comparison 2010 to 2015
23.6%
21.9%
11.0%
9.7%
9.7%
9.3%
6.8%
3.8%
22.3%
16.8%
10.1%
10.1%
5.9%
5.0%
2.1%
25.6%
26.1%
8.0%
6.7%
5.9%
13.4%
5.5%
28.5%
21.5%
11.3%
7.3%
6.6%
9.9%
7.0%
25.0%
23.9%
12.5%
7.1%
8.0%
11.1%
4.8%
26.3%
19.0%
14.4%
7.0%
9.2%
8.0%
10.1%
6.4%
4.2%
27.7%
8.8%7.9%
7.7%
Large-scale cell culture production for therapeutics
Process Development for biopharmaceutical manufacturing
Scale-up (or clinical-scale) production forbiopharmaceuticals only
Other large-scale biopharmaceutical manufacturing
Large-scale contract manufacturing (CMO) for biopharmaceuticals
Vaccine production
Fill/Finish operations, primarily
Large-scale microbial fermentation for therapeutics
Other contract manufacturing (CMO) for biopharmaceuticals
Year 2015Year 2014Year 2013Year 2012Year 2011Year 2010
AnnualRep_15.indd 2AnnualRep_15.indd 2 6/5/15 1:10 PM6/5/15 1:10 PM
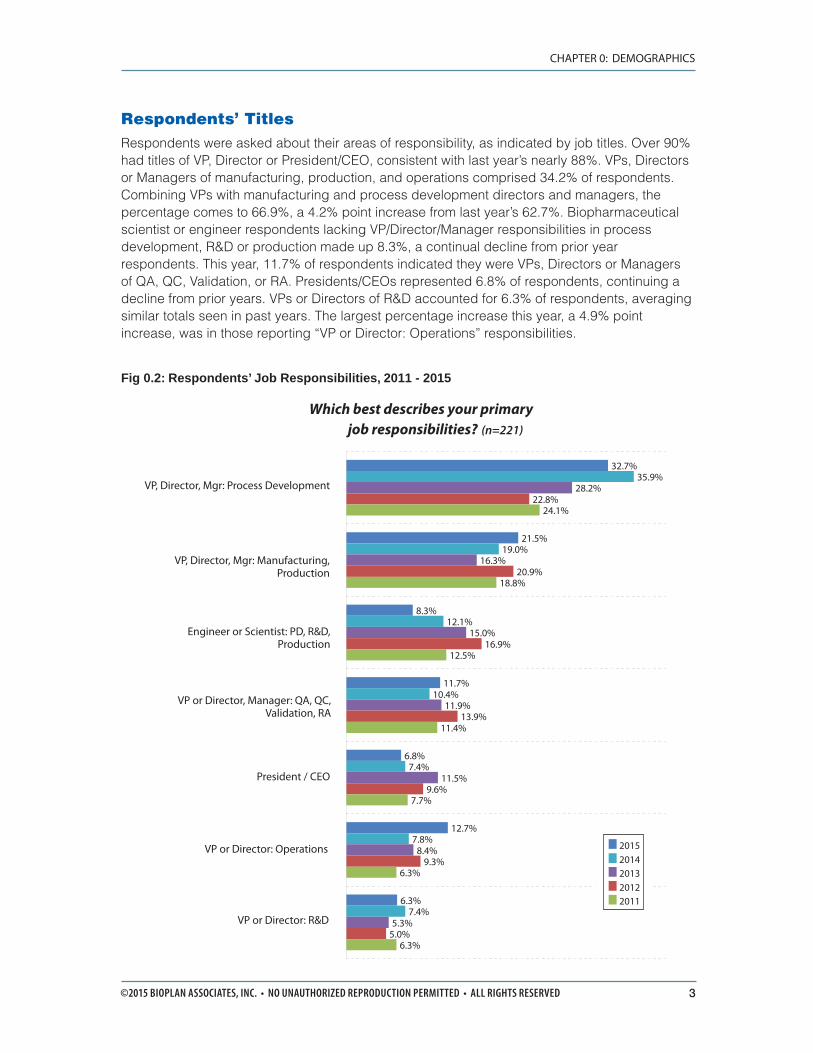
©2015 BIOPLAN ASSOCIATES, INC. • NO UNAUTHORIZED REPRODUCTION PERMITTED • ALL RIGHTS RESERVED 3
CHAPTER 0: DEMOGRAPHICS
Respondents’ TitlesRespondents were asked about their areas of responsibility, as indicated by job titles. Over 90% had titles of VP, Director or President/CEO, consistent with last year’s nearly 88%. VPs, Directors or Managers of manufacturing, production, and operations comprised 34.2% of respondents. Combining VPs with manufacturing and process development directors and managers, the percentage comes to 66.9%, a 4.2% point increase from last year’s 62.7%. Biopharmaceutical scientist or engineer respondents lacking VP/Director/Manager responsibilities in process development, R&D or production made up 8.3%, a continual decline from prior year respondents. This year, 11.7% of respondents indicated they were VPs, Directors or Managers of QA, QC, Validation, or RA. Presidents/CEOs represented 6.8% of respondents, continuing a decline from prior years. VPs or Directors of R&D accounted for 6.3% of respondents, averaging similar totals seen in past years. The largest percentage increase this year, a 4.9% point increase, was in those reporting “VP or Director: Operations” responsibilities.
Fig 0.2: Respondents’ Job Responsibilities, 2011 - 2015
Which best describes your primary job responsibilities? (n=221)
32.7%
21.5%
8.3%
11.7%
6.8%
12.7%
6.3%
35.9%
19.0%
12.1%
10.4%
7.4%
7.8%
7.4%
28.2%
16.3%
15.0%
11.9%
11.5%
8.4%
5.3%
22.8%
20.9%
16.9%
13.9%
9.6%
9.3%
5.0%
24.1%
18.8%
12.5%
11.4%
7.7%
6.3%
6.3%
VP, Director, Mgr: Process Development
VP, Director, Mgr: Manufacturing, Production
Engineer or Scientist: PD, R&D, Production
VP or Director, Manager: QA, QC,Validation, RA
President / CEO
VP or Director: Operations
VP or Director: R&D
20152014201320122011
AnnualRep_15.indd 3AnnualRep_15.indd 3 6/5/15 1:10 PM6/5/15 1:10 PM

Report and Survey of Biopharmaceutical Manufacturing Capacity and Production
WWW.BIOPLANASSOCIATES.COM4
Respondents’ Facility LocationsThis year we surveyed respondents based in 27 countries. Over 62% of the respondents were from the United States, with the Northeastern U.S. continuing to make up the largest group of respondents in the U.S., at 33.3%, a continued increase from last year’s 30.7%. Respondents from Western Europe made up 19.7% of the total, relatively unchanged from recent years. Other countries in the survey (“Rest of World”) made up 17.4% of the respondents.
Further information about biopharmaceutical manufacturing facilities worldwide is available at the Top 1000 Global Biopharmaceutical Facilities Index Web site from BioPlan Associates (www.Top1000Bio.com).
Fig 0.3: Facility Location
Where is your facility located?
33.3%
8.0%
7.5%
7.5%
6.1%
4.2%
4.2%
3.8%
2.8%
2.8%
2.3%
2.3%
1.9%
1.4%
1.4%
1.4%
1.4%
0.9%
0.9%
0% 5% 10% 15% 20% 25% 30% 35%
US-Northeast
US-Southeast
US-Central
US-Southwest
US-Northwest
Germany
India
United Kingdom
Belgium
Israel
China
Switzerland
Canada
France
Italy
Netherlands
Singapore
Denmark
Australia
Other Countries include: Austria, Bulgaria, Chile, Hungary, Iran, Japan, Korea, Lithuania, Puerto Rico, South Africa, Sweden, Taiwan
AnnualRep_15.indd 4AnnualRep_15.indd 4 6/5/15 1:10 PM6/5/15 1:10 PM

©2015 BIOPLAN ASSOCIATES, INC. • NO UNAUTHORIZED REPRODUCTION PERMITTED • ALL RIGHTS RESERVED 5
CHAPTER 0: DEMOGRAPHICS
We note that U.S. respondents declined to 62.4%, down from 65.8% in 2014, and about even with the 61.7% U.S. respondents in 2011. Western European responses have been relatively constant at around 20% since 2011.
This year ROW responses rose signifi cantly from 12.0% in 2014 to 17.4%, although still off the peak of 22.0% in 2013. This shift may simply be the result of challenges in accessing ROW demographics and bioprocessing professionals. U.S. bioprocessing professionals appear to be more motivated to participate in this and other industry surveys.
Fig 0.4: Facility Location, by Region
Western Europe respondents include: Austria, Belgium, Denmark, Finland, France, Germany, Greece, Ireland, Italy, Luxembourg, Netherlands, Portugal, Spain, Sweden, Switzerland, and the United Kingdom.
“Rest of World” respondents include: Canada, Australia, India, China, India, Singapore, Egypt, Japan, Russia, Estonia, Israel, Argen na, Brazil, Bulgaria, Cuba, Korea, Lithuania, New Zealand, Poland, Slovenia, South Africa, and Taiwan.
Respondents' Facility Location by Region (Biotherapeutic Developers and CMOs)
Rest of World17.4%
WesternEurope19.7%
U.S.62.9%
AnnualRep_15.indd 5AnnualRep_15.indd 5 6/5/15 1:10 PM6/5/15 1:10 PM

Report and Survey of Biopharmaceutical Manufacturing Capacity and Production
WWW.BIOPLANASSOCIATES.COM6
Respondents’ Areas of Biopharmaceutical Manufacturing OperationsThis year, again, almost 90% (85.9%) of respondents indicated that they were involved in mammalian cell culture, unchanged from last year’s study. For microbial fermentation, 44.9% of respondents noted involvement in this area, an increase from the previous year (42.9%). For this year, 15.7% said that their facility had production operations in yeast, a continual decline from 2013 (20.8%) and prior years. The percentage of those involved with plant cells and insect cells, has been on a slow rise over the past couple of years, but mammalian cell culture continues to dominate product development and manufacture.
This year, we see a small uptick in the overall percentage of respondents in each expression system/host cells class, except for yeast systems. This is a minor change from previous years in which each system had a small decline, except for mammalian cell culture, which has remained steady since its signifi cant increase in 2014.
The increasing use of mammalian systems is likely associated with increased adoption of mammalian systems as standardized broad platform technologies within facilities, preferably using the same mammalian systems for manufacture of as many products at possible; plus a larger percentage of products in the pipeline and having entered the market are mammalian-expressed, including various recombinant monoclonal antibody products. With increases in mammalian system yields and many facilities standardizing or preferentially using mammalian vs. microbial systems, even products that could be manufactured in microbial systems are now often manufactured in mammalian systems, if these will get the job done, such as to produce pre-clinical or early clinical supplies.
AnnualRep_15.indd 6AnnualRep_15.indd 6 6/5/15 1:10 PM6/5/15 1:10 PM

©2015 BIOPLAN ASSOCIATES, INC. • NO UNAUTHORIZED REPRODUCTION PERMITTED • ALL RIGHTS RESERVED 7
CHAPTER 0: DEMOGRAPHICS
Fig 0.5: Biopharmaceutical Manufacturing Systems, (2007-2015) Trends
In which of the following does your facility currently have production operations for biopharmaceutical products?
2007- 2015 (Trends)85.9%
75.5%79.2%
73.1%70.4%
66.4%
76.8%
42.9%
46.9%48.0%47.4%50.4%
52.7%
63.4%
18.7%20.8%20.8%
16.7%
29.9%
5.6%7.3%
10.8%10.3%8.8%10.6%
7.0%
14.1%
85.9%79.1%
44.9%
51.7%
15.7%
20.9%19.8%21.4%
7.6%
3.5%2.5%2.1%3.2%3.8%2.6%4.3%2.0%3.0%
0%
10%
20%
30%
40%
50%
60%
70%
80%
90%
Year
2015
Year
2014
Year
2013
Year
2012
Year
2011
Year
2010
Year
2009
Year
2008
Year
2007
Mammalian Cell
Culture
Microbial
Fermentation
Yeast
Insect Cells
Plant Cells
AnnualRep_15.indd 7AnnualRep_15.indd 7 6/5/15 1:10 PM6/5/15 1:10 PM

Report and Survey of Biopharmaceutical Manufacturing Capacity and Production
WWW.BIOPLANASSOCIATES.COM8
Respondents’ Production Operations, Phase of DevelopmentWe identifi ed the phases of clinical development in which respondents’ organizations (companies) had products. In 2015, almost half (47.8%) of respondent companies had R&D biopharmaceutical operations, a nearly 10% point decrease from 2014 (57.5%). 59.2% indicated their company having preclinical operations, a small decline from last year’s 63.8%. Respondent organizations involved with R&D have moved back to their relative 50% level seen in prior years, and remain much lower than the 73.3% in 2006. Preclinical started at 75.4% in 2006, decreased signifi cantly each year after, and has leveled off to close to the 60% mark, as seen in this year’s 59.2%.
The percentage of respondents whose companies have biopharmaceutical products on the market has slightly declined to 53.2%, from 55.6% last year. The percentage involved with products in Phase III development increased again this year. This area continued to see small fl uctuations as the industry continues its overall maturation, with most respondents now employed by companies with revenue streams from marketed biologics. In fact, 2009 has been widely noted as the year the biopharmaceutical industry fi nally, as a whole, turned a profi t.
AnnualRep_15.indd 8AnnualRep_15.indd 8 6/5/15 1:10 PM6/5/15 1:10 PM

©2015 BIOPLAN ASSOCIATES, INC. • NO UNAUTHORIZED REPRODUCTION PERMITTED • ALL RIGHTS RESERVED 9
CHAPTER 0: DEMOGRAPHICS
Fig 0.6: Phase of Development of Surveyed Respondents
In which phases of development does your organization currently have biopharmaceutical products?
2006-2015
59.2%
64.7%
61.2%
60.7%
53.2%
57.5%
63.8%
69.1%
64.3%
56.5%
55.6%
53.4%
56.8%
53.9%
50.0%
46.1%
56.3%
50.9%
58.0%
58.0%
52.8%
50.2%
53.5%
50.7%
59.1%
50.3%
50.7%
48.3%
50.3%
49.5%
63.3%
62.1%
58.0%
54.9%
56.7%
50.1%
57.3%
50.8%
50.8%
47.1%
49.9%
53.5%
57.9%
56.0%
53.3%
51.8%
56.0%
60.1%
69.0%
62.3%
57.6%
51.3%
44.9%
73.3%
75.4%
62.6%
63.6%
46.5%
42.8%
47.8%
0% 10% 20% 30% 40% 50% 60% 70% 80%
R&D
Preclinical
Phase I
Phase II
Phase III
Marketedbiopharmaceuticals
2015
2014
2013
2012
2011
2010
2009
2008
2007
2006
AnnualRep_15.indd 9AnnualRep_15.indd 9 6/5/15 1:10 PM6/5/15 1:10 PM

Report and Survey of Biopharmaceutical Manufacturing Capacity and Production
WWW.BIOPLANASSOCIATES.COM10
This year, we see Western Europe respondents indicating a higher response of involvement by their companies with commercial products at 61.5% vs. 50.4% for the U.S, a change from last year in which the U.S. indicated higher percentages, 56.5% and 51.0% respectively. Another reversal for this year is the U.S. showing signifi cantly higher percentages of respondent companies involved in early R&D, compared to Western Europe. U.S. respondents also indicated slightly higher percentages in preclinical development, and involvement with Phase II clinical trials than Western Europe. However, the U.S. has a slightly lower percentage in Phase I clinical trials this year vs. Western Europe, and a signifi cantly lower percentage in Phase III clinical trials this year vs. Western Europe, a decrease from previous years. Overall, the phases of development of bioprocessing organizations are rather well spread over the full spectrum from product R&D through commercial products manufacture, confi rming that this is a vital, diverse, and growing industry.
Fig 0.7: Phase of Development of Surveyed Respondents, 2015 (US vs Western Europe)
In which phases of development does your organization currently have biopharmaceutical products?
US vs Western Europe
61.4%
67.7%
66.1%
58.3%
50.4%
41.0%
59.0%
69.2%
64.1%
71.8%
61.5%
51.2%
0% 10% 20% 30% 40% 50% 60% 70% 80%
R&D
Preclinical
Phase I
Phase II
Phase III
Marketedbiopharmaceuticals
U.S
Western Europe
AnnualRep_15.indd 10AnnualRep_15.indd 10 6/5/15 1:10 PM6/5/15 1:10 PM

©2015 BIOPLAN ASSOCIATES, INC. • NO UNAUTHORIZED REPRODUCTION PERMITTED • ALL RIGHTS RESERVED 11
CHAPTER 0: DEMOGRAPHICS
Employees at FacilityTo evaluate issues such as capacity, disposables usage and other factors, we asked respondents for the number of staff within their own facility, and within their total organization. Within the survey group, the largest percentages of respondents were at facilities with 100-499 employees, continuing the overall trend from prior years. The largest share of respondents, nearly 50%, continues to be from organizations with greater than 5,000 employees. This distribution refl ects the distribution of bioprocessing and other professionals’ employment in the (bio)pharmaceutical industry, and the increasing involvement and even dominance of larger companies in biopharmaceutical R&D and products marketing.
Fig 0.8: Distribution of Employees at Facility, and Organization
About how many employees currently work at your facility & organization? (n=202)
5.9%
10.4%
6.4%
10.9%
34.2%
17.3%
10.9%
4.0%
2.5%
4.5%
4.5%
5.4%
14.4%
7.9%
13.9%
47.0%
1-9
10-24
25-49
50-99
100-499
500-999
1000-4999
5000+
# Employees at MY FACILITY
# Employees at ENTIRE ORGANIZATION
Rang
e, #
of Employ
ees at
Facility
/ O
rgan
ization
AnnualRep_15.indd 11AnnualRep_15.indd 11 6/5/15 1:10 PM6/5/15 1:10 PM

Report and Survey of Biopharmaceutical Manufacturing Capacity and Production
WWW.BIOPLANASSOCIATES.COM12
Batches Run at Facility per YearTo continue our evaluation of issues such as batch failure rates, and to ensure we are capturing organizations involved in signifi cant manufacturing processes at various scales of manufacture, we asked again this year for the number of batches or production runs the respondent’s facility (not the organization) ran over the past 12 months. We found that for ‘clinical scale’ manufacturing, the largest number of facilities reported producing between 1 and 20 batches per year (63.5%), a continued increase from 60.9% last year. At the ‘commercial scale’, almost 15% were again producing over 150 batches per year, but most (among those manufacturing) reported running between 6-70 batches per year (58.4%).
To compare consistency of respondents’ operations, year-by-year, we evaluated the number of batches run/year. This year (asking about 2014), we found between “0-10” batches were run by 40.5% (clinical scale) and 41.3% (commercial scale) of respondents. So, less than half of respondents are operating at a lower to moderate levels in terms of number of production runs.
Looking at prior years’ studies, we have found that companies are running fewer batches this year, and have decreased to 2009 levels in which we saw “0-10” batches were run at 40.0% and 42.5%, for clinical and commercial scale, respectively.
AnnualRep_15.indd 12AnnualRep_15.indd 12 6/5/15 1:10 PM6/5/15 1:10 PM

©2015 BIOPLAN ASSOCIATES, INC. • NO UNAUTHORIZED REPRODUCTION PERMITTED • ALL RIGHTS RESERVED 13
CHAPTER 0: DEMOGRAPHICS
Fig 0.9: Distribution of Total Batches Run at Facility Last Year, by Scale of Production
How many total batches did your facility run during the past 12 months?
(Commercial vs Clinical Scale)
7.9%
14.3%
18.3%
23.0%
11.9%
15.9%
2.4%
0.8%
1.6%
1.6%
26.4%
5.0%
9.9%
9.1%
8.3%
6.6%
9.1%
3.3%
3.3%
2.5%
1.7%
14.9%
1.6%
0.8%
0
1-5
6-10
11-20
21-30
31-50
51-70
71-90
91-110
111-120
121-150
>150
Distribution of Batches Run, Clinical ScaleDistribution of Batches Run, Commercial Scale
Tota
l Bat
ches
Run
, Ran
ge
AnnualRep_15.indd 13AnnualRep_15.indd 13 6/5/15 1:10 PM6/5/15 1:10 PM

Report and Survey of Biopharmaceutical Manufacturing Capacity and Production
WWW.BIOPLANASSOCIATES.COM14
AnnualRep_15.indd 14AnnualRep_15.indd 14 6/5/15 1:10 PM6/5/15 1:10 PM

©2015 BIOPLAN ASSOCIATES, INC. • NO UNAUTHORIZED REPRODUCTION PERMITTED • ALL RIGHTS RESERVED 15
CHAPTER 1: INTRODUCTION AND DISCUSSION
C H A P T E R 1: I N T R O D U C T I O N A N D D I S C U S S I O N
1-1 INTRODUC TION: THE BIOPHARMACEUTIC AL INDUSTRY
The pharmaceutical and biopharmaceutical industries remain active, profi table and growing segments, despite having only a few years ago recovering from worldwide economic problems. There are estimated to be over well over 10,000 therapeutics in R&D, both
drugs (chemical substance pharmaceuticals) and biopharmaceuticals (biotechnology-derived pharmaceuticals), with nearly 40,000 ongoing (or recently reported) clinical trials. Among these, an estimated 40% or likely over 4,000-5,000 candidate products in R&D are biopharmaceuticals. A signifi cant portion, about 1,200 products in the development pipeline, is follow-on biopharmaceuticals, mostly biosimilars but also a large number of biobetters. This industry activity represents a considerable increase from as short as fi ve years ago and also refl ects a basic shift in the pharmaceutical industry from small molecule drugs to biopharmaceuticals for new, innovative and profi table products. The large number of biosimilars and biobetters in development indicate the maturation of the biopharmaceutical industry, as its most recent major products start to go off-patent.
However, as companies of all sizes, particularly Big Pharma-type companies that now do most biopharmaceutical R&D, continue to cut back on expenses as much as possible and consolidate R&D, they may be concentrating more on fewer products, so the overall pipeline may well be shrinking somewhat. This may be showing up more in clinical trials rather than preclinical phases. But in terms of biopharmaceuticals, any such decrease in R&D is likely currently being counter-balanced by established, including Big Pharma companies, companies increasingly moving into biopharmaceuticals. But even if the pipeline is shrinking (which will only be evident in hindsight), this is not necessarily an indicator of problems. Any pipeline shrinkage may simply refl ect the industry doing a good or better job in eliminating less promising candidates before they enter and in early-stage clinical trials. This ‘failing faster,’ i.e., earlier in development, is much less costly and disruptive than products failing later in development. If industry is doing a better job of weeding out poor candidate products earlier, industry may actually be on track for increased future success, with fewer costly late-stage failures and a higher percentage of pipeline products making it to the market.
The pharmaceutical R&D pipeline and industry are becoming increasingly dependent on biopharmaceuticals. These products are being developed by an ever-increasing cross-section of the pharmaceutical industry, including Big Pharma and even generic drug companies, with many of these also active in developing biosimilars. These sources, along with smaller biopharmaceutical developers, which have been the traditional source for most innovative biopharmaceuticals, are continuing to expand the global biologics pipeline. Biosimilars are
AnnualRep_15.indd 15AnnualRep_15.indd 15 6/5/15 1:10 PM6/5/15 1:10 PM
Report and Survey of Biopharmaceutical Manufacturing Capacity and Production
WWW.BIOPLANASSOCIATES.COM16
bringing in many new biopharmaceutical players. And new entrants based in China, India and other developing countries are also increasingly entering biopharmaceutical R&D. Thus, an increasing number and percentage of new pharmaceuticals entering the market will be biopharmaceuticals vs. small molecule drugs; and they will likely originate from more diverse sources. Combine this with biopharmaceuticals generally costing much more and providing higher profi t margins, and the pharmaceutical industry will increasingly be dependent on biopharmaceuticals for profi ts, innovation and its basic survival.
As biopharmaceuticals become an even more important part of the pharmaceutical industry, many new players are entering the fi eld and most current manufacturers are expanding their bioprocessing capacity. Not only must bioprocessing output (if not liter capacity) expand to handle manufacture of an increasing number of approved products and higher volumes as markets for many products further expand, e.g., with approvals for new indications and growth in international markets, the industry must also be capable of handling a large number of pipeline products. Most recent capacity expansion generally has involved building large fi xed stainless steel bioreactor-based bioprocessing systems for commercial product manufacture, while production of supplies for R&D and clinical testing are now essentially dominated by use of single-use/disposable bioreactor-based systems, with this requiring much less facilities and infrastructure investment and construction. However, recently there has been signifi cant increase in new single-use commercial-scale manufacturing facilities under construction and coming online. The strategic importance of biopharmaceutical manufacturing and manufacturing capacity are increasing, and understanding the markets for biopharmaceuticals and bioprocessing technologies and services is becoming ever more important to those in the biopharmaceutical industry.
Planning and decision-making concerning the manufacture of biopharmaceuticals are becoming more complex as companies continue to implement cost-saving efforts, including cutting back on the number of products in their development pipelines, and outsourcing even more support and even critical tasks. In addition, manufacturers must choose from an ever-increasing number and diversity of bioprocessing options. This includes new and improved cell lines and genetic engineering/expression systems technologies; bioprocessing equipment, including new and improved single-use and stainless steel equipment; and outsourcing manufacturing to CMOs which are expanding their capacity, technologies, and service offerings. Increasingly, companies must make diffi cult and costly strategic decisions about commercial manufacture earlier in product development.
A number of questions need to be answered by biopharmaceutical developer even before a product is shown effective in clinical trials. These include aspects such as:
■ Should we use an older, off-patent expression system or a new, much higher yield, but royalty-bearing system?
■ Should we use single-use/disposable or fi xed stainless steel bioprocessing equipment for clinical supplies manufacture?
■ If we use single-use bioprocessing systems to support development, do we want to be among the fi rst pioneers to use single-use equipment for commercial manufacture or should we stick with familiar, trusted, but more expensive and labor-intensive, fi xed stainless steel equipment for manufacture?
AnnualRep_15.indd 16AnnualRep_15.indd 16 6/5/15 1:10 PM6/5/15 1:10 PM

©2015 BIOPLAN ASSOCIATES, INC. • NO UNAUTHORIZED REPRODUCTION PERMITTED • ALL RIGHTS RESERVED 17
CHAPTER 1: INTRODUCTION AND DISCUSSION
Effective planning within the biopharmaceutical and bioprocessing markets is required to avoid problems later on. This demands a high level of leadership, partnership, information sharing and communication between manufacturers, CMOs and bioprocessing technology and equipment suppliers to develop new manufacturing technologies, devices and capacity to keep pace with industry needs. Strategic production decisions must be based on solid bioprocess data, combined with a broad understanding of trends and effective benchmarking of capacity and production issues.
This study provides an on-going evaluation of the vital manufacturing trends shaping this industry, and is designed to help keep those in the industry aware of the external trends and issues affecting biopharmaceutical manufacture decision-making.
1-2 SOME BIOPHARMACEUTIC AL MARKET TRENDSThe biopharmaceutical industry survived recent years’ worldwide economic downturn. In fact, the industry has done rather well for itself during this period – not contracting or losing much at all in recent years – and has been showing consistent clear signs of full recovery and renewed growth. As much of the world economy still slowly improves, the biopharmaceutical industry continues to remain dynamic and growing. This year, as in 2014 and prior years, survey results show that companies are spending and investing more in their R&D, new technologies, bioprocessing capacity, staff and other infrastructure. Companies, particularly larger and more established ones, are continuing to aggressively look for opportunities to cut costs and increase effi ciency, with this continuing to benefi t contract manufacturing and research organizations (CMOs and CROs). Prior rather common severe cuts in staff and divestment of facilities have largely ended, but this may simply refl ect reaching the limits of eliminating in-house expertise and facilities. Some specifi c trends are discussed below.
The industry is healthy and its status is improving: The world market for biopharmaceuticals is now about ≥$200 billion; growing at ~15% annually, defi nitely a very healthy rate. New products and new markets, particularly internationally, continue to support market growth. The world market for recombinant protein therapeutics is now ≥$130 billion. The continued high growth rate in biopharmaceutical markets (revenue) will continue to drive investment in the industry, including at the expense of traditional small molecule drug development. Biopharmaceuticals vs. drugs have simply proven themselves to be profi table investments, e.g., with much higher profi ts per sale and likelihood of attaining success, including capturing market share, with this often simpler or more straightforward with innovative biopharmaceuticals. Also, biopharmaceuticals vs. drugs tend to be developed for diseases and indications generally lacking current good options for treatment. A large portion of biopharmaceuticals coming to market still involve treatment of ignored or currently untreatable indications, making them particularly welcome and needed. Many new entrant companies of all sizes and types, including generic drug and foreign companies, are developing biosimilars and plan to use these to establish them in the industry. This is resulting in a signifi cant increase in the number of players in the biopharmaceutical industry.
Overall, 2015, like 2014, is fully expected to be a good year for the biotechnology and biopharmaceutical industries, with these remaining viable, relatively insulated from the worst of the world’s economic problems, growing and well-positioned for solid future growth.
AnnualRep_15.indd 17AnnualRep_15.indd 17 6/5/15 1:10 PM6/5/15 1:10 PM

Report and Survey of Biopharmaceutical Manufacturing Capacity and Production
WWW.BIOPLANASSOCIATES.COM18
Cost-containment and Controls: The past year was another rather quiet year in the U.S. and most other major markets in terms of new calls for and implementation of cost-containment measures or cost controls for pharmaceuticals, including biopharmaceuticals. In the U.S. and many other markets worldwide, drugs for chronic hepatitis C that are actually curative but set records for related costs are resulting in increased attention to pharmaceutical pricing practices. In some other countries, cost containment and government-directed cost controls continue to adversely affect biopharmaceuticals. This includes the U.K. National Institute for Health and Clinical Excellence (NICE) issuing more product reviews rejecting some biopharmaceuticals as too expensive and not cost-effective for use by the country’s National Health Service (NHS), effectively making these products non-marketable in the U.K. In the U.S., insurance providers continue to take control of prescriptions away from physicians and consumers, forcing use of products for which they have secured preferential prices and often simply just refusing to pay for expensive biopharmaceuticals that they (not the prescribing physician and his patient) do not consider the most appropriate. As biosimilars become available, much as with generic drugs, U.S. insurers will surely force physicians, pharmacists and consumers to use these rather than more expensive innovator products.
• Manufacture in Developing Countries is Increasing: Biopharmaceutical manufacture outside of the usual major market countries is increasing, as indicated by BioPlan’s Top 1000 Global Biopharmaceutical Facilities Index (www.top1000bio.com), which ranks facilities worldwide in terms of known or estimated capacity, employment, and production. Much new and increased capacity is being added internationally, with biopharmaceutical markets in many developing countries rapidly growing and domestic/regional companies increasingly serving these markets, often with biogeneric or outright copies of innovator products that are simply marketed as substitutable for the innovator product (without much, if any, real testing). Developed country-based companies seeking to expand internationals markets will increasingly have to deal with such local/regional competition. Another factor that will result in increasing manufacture in lesser-developed countries is that these countries’ governments are increasingly seeking to assure domestic manufacture of biopharmaceuticals being sold in their markets. Already, many countries are starting to tell vaccine manufacturers that they want products for their markets manufactured in-country, preferably or requiring this be done by locally-owned or joint venture companies. And as single-use equipment and manufacturing technologies continue to improve and, particularly, as modular bioprocessing facilities enter the market, foreign countries (or their proxy/subsidized companies) will increasingly undertake manufacture of needed products, such as commonly-used vaccines, with or without the assistance and participation of original product developers and current manufacturers.
• Worldwide Standardization of Manufacturing: Particularly with larger companies, as more biopharmaceutical manufacturing is performed worldwide, companies are working to standardize their products and manufacturing processes on a worldwide basis. For many, this includes having 2nd- or even 3rd-source geographically-spread facilities either actively manufacturing or serving as backups, having received approvals for manufacture for the U.S. and other major markets. Adoption of single-use and modular bioprocessing systems for commercial manufacturing will accelerate this trend.
AnnualRep_15.indd 18AnnualRep_15.indd 18 6/5/15 1:10 PM6/5/15 1:10 PM

©2015 BIOPLAN ASSOCIATES, INC. • NO UNAUTHORIZED REPRODUCTION PERMITTED • ALL RIGHTS RESERVED 19
CHAPTER 1: INTRODUCTION AND DISCUSSION
1-3 MARKET POTENTIALThe biopharmaceutical market will continue to expand. There are currently 1,000s of therapeutics in R&D, including >40% now being biopharmaceuticals. This shift towards biopharmaceuticals refl ects a fundamental shift within the pharmaceutical industry, with the largest traditionally small molecule drug-oriented Big Pharma companies moving heavily and rapidly into biopharmaceuticals. These companies are increasingly developing their own, licensing in or otherwise acquiring more biopharmaceutical products. For these companies and others, biopharmaceuticals provide higher revenue (cost more) and profi ts per sale, and with biopharmaceuticals often requiring more complex detailing and other sales support, increasingly fi t well with the resources and marketing-intensive business models of large international pharmaceutical companies. Overall, there is a major shift towards biopharmaceutical R&D, manufacturing and marketing, often at the expense of traditional small molecule drug candidates.
However, due to economic concerns, all pharmaceuticals, particularly biopharmaceuticals which tend to be the most expensive, face increasing cost containment and control efforts worldwide. The U.S. remains the world’s main pharmaceutical market, including in terms of sales and profi ts. Government-based cost-containment and control efforts remain limited in the U.S. Despite political demands for lowering pharmaceutical expenses by government programs, such as Medicare for older patients, the major U.S. health care overhaul legislation (“Obamacare’) enacted in late 2010 is expected to have minimal, likely no, negative impact on biopharmaceutical usage. If anything, this health care overhaul will actually provide continued long-term support for use of innovative (bio)pharmaceuticals, particularly if the alternative treatments or no treatment (none being available) are overall less cost-effective options. Cost-containment and control efforts can be expected to increase in most other countries, particularly, those already having implemented cost controls, with expensive biopharmaceuticals being an easy target for elimination or reduction. India has substantially boosted its price controls and generics-favoring policies, including not allowing pharmaceuticals to be marketed by trade name (only by generic name).
However, since most biopharmaceuticals are used for indications for which there are few, if any, alternatives; the overall market is rather protected from widespread cost-containment and controls. Those countries that have imposed cost controls, so far, generally represent small markets. Improved manufacturing methods and cost management for biopharmaceutical production will continue to slowly advance, which will tend to reduce the cost of goods. With continued reductions in manufacturing costs, including better process monitoring, higher-yield expression system, and increased use of more cost-effective single-use/ disposable bioprocessing systems, biopharmaceuticals appear to be positioned to further increase their role in world pharmaceutical markets.
The world biopharmaceutical market is currently likely now ≥$200 billion/year. This continues to grow worldwide at about 15%/year, making biopharmaceuticals a fairly recession-proof, growing and profi table industry. The market for recombinant proteins now is about $125 billion. Much of this growth in biopharmaceutical revenue is due to an increasing number and sales of recombinant monoclonal antibodies, now a ≥$50 billion market. These products have been shown to be rather reliable in terms of development and reaching the market, with antibodies generally being very specifi c, targeted, not causing severe adverse effects and by now familiar and well-received in the marketplace. Recombinant monoclonal antibody sales will further rapidly increase in coming years as new products enter the market and approved indications are expanded for existing products.
AnnualRep_15.indd 19AnnualRep_15.indd 19 6/5/15 1:10 PM6/5/15 1:10 PM

Report and Survey of Biopharmaceutical Manufacturing Capacity and Production
WWW.BIOPLANASSOCIATES.COM20
But despite the industry being healthy and growing, broader economic issues, the broader pharmaceutical industry’s long-term problems with innovation and profi ts, investors now coming to expect constant cut-backs, layoffs, increased outsourcing, etc. will continue to force biopharmaceutical companies of all size to cut costs wherever possible. This is shown in this year’s survey data showing that the industry continues to recognize the need for continual improvements in performance and optimization of R&D, manufacturing and marketing. Financing, particularly for smaller companies, has gotten tighter and will remain restricted in 2015. Many companies of all sizes are having to seek alternative funding methods, increase their collaborations and licensing (vs. conducting in-house R&D), decrease the number of candidates in development, and are otherwise taking steps to make themselves more effi cient and productive.
The use of contract manufacturing organizations and the use of single-use bioprocessing equipment are making product manufacture, particularly for R&D and clinical trials, more effi cient and often less costly. Especially for smaller and under-funded companies, going with CMOs for production or using single-use equipment for in-house candidate product manufacture are the only viable options. These approaches reduce capital and fi nancing needs, because companies can avoid $50-$150 million facilities costs for construction of fi xed, dedicated stainless steel bioreactor-based bioprocessing systems, while a typical fully single-use facility for commercial manufacture can still easily cost $25-$40 million.
Despite the biopharma industry’s bright future, successful companies in this complex worldwide industry will continue to require complete and accurate knowledge of the market and competing technologies, along with adequate lead-times, large capital expenditures, and careful planning. Biopharmaceutical development and manufacture are very costly, the industry is very competitive, investors increasingly demand higher stock prices and profi ts, and weak companies and products tend to die, so no company can afford to make tactical or strategic mistakes. This makes accurate market and manufacturing planning all the more essential. The industry needs to keep on top of the current situation and future trends.
This report summarizes survey data and information obtained from biopharmaceutical manufacturers worldwide in late 2014 and early 2015. Its intent is to provide a quantitative-based overview and assessment of industry capacity, production trends, and benchmarks, along with presenting industry views on these and other subjects. As an on-going benchmarking effort, this study offers a view into current and future potential global industry problems and opportunities.
1-4 BIOPHARMACEUTIC AL R&D PIPELINESTable 1.1 provides an overview of worldwide biopharmaceutical product R&D and marketing situation by indication. As can be readily seen, cancer and infectious diseases clearly dominate the biopharmaceutical development pipeline. Also, in 2014, trials increased with nearly every indication. Cancer treatment remains by far the most active, with over 4,000 products now in development. Note these and other data provided by Biopharma Insight do not count products in development, the usual pipeline evaluation parameter; rather they cumulate signifi cant milestones, such as approvals, entering/advancement in trials, etc., for multiple indications, countries, etc. These data are still rather useful for spotting relative trends.
AnnualRep_15.indd 20AnnualRep_15.indd 20 6/5/15 1:10 PM6/5/15 1:10 PM

©2015 BIOPLAN ASSOCIATES, INC. • NO UNAUTHORIZED REPRODUCTION PERMITTED • ALL RIGHTS RESERVED 21
CHAPTER 1: INTRODUCTION AND DISCUSSION
Fig 1.1: Investigational Drugs: Large Molecule (Protein Therapeutics), Worldwide, 2010 - 2015
Source: BioPharm Insight, www.infi nata.com/biopharma-solution/by-product/biopharm-insight.html, February 2015
Note: Biopharm Insight includes multiple counts for the same therapeutic, when in multiple phases and locations of clinical trials. Therefore the total counts will be higher than the actual number of drugs and relevant trials.
3,155
1,298
1,144
975
847
788
706
563
405
383
351
349
282
248
173
122
4,341
4,346
2,518
1,118
1,052
666
712
703
630
174
355
322
309
255
273
222
144
112
536
4,021
2,198
1,012
945
617
602
644
547
159
296
317
269
217
291
224
124
90
476
5,336
2,195
1090
897
826
754
638
479
287
313
294
330
268
424
214
170
107
1,977
5,000
2,042
705
734
860
1,287
199
603
255
309
420
299
409
372
172
224
101
936
4,493
2,194
764
732
956
701
543
337
473
313
359
239
190
537
194
128
190
962
5,562
Cancer
Infectious Diseases
Immune System
Hormonal Systems
Central NervousSystem
Cardiovascular
Musculoskeletal
Hematological
Diagnostic / ImagingAgents / Delivery
Respiratory
Gastrointestinal
Dermatology
Eye and Ear
HIV Infections
Pain
Genitourinary
Nephrology
Miscellaneous
201520142013201220112010
AnnualRep_15.indd 21AnnualRep_15.indd 21 6/5/15 1:10 PM6/5/15 1:10 PM

Report and Survey of Biopharmaceutical Manufacturing Capacity and Production
WWW.BIOPLANASSOCIATES.COM22
Table: 1.1 Biologics (Large Molecule), Worldwide, through January 2015
2015 Total Pipeline
NDA / BLA Filed Phase III Phase II
Phase I / IND Filed
Pre-Clinical / Discovery
Number of Product Launched
2014 Products in the Pipeline
2013 Products in the Pipeline
2012 Products in the Pipeline
2011 Products in the Pipeline
2010 Products in the Pipeline
Cancer 5,562 43 489 1,249 1,494 1,630 657 4,346 4,021 5,336 5,000 4,493
Infectious Diseases
3,155 33 115 244 261 1,283 1,219 2,518 2,198 2,195 2,042 2,194
Immune System 1,298 16 67 180 145 583 307 1,118 1,012 1090 705 764
Hormonal Systems
1,144 19 84 166 112 289 474 1,052 945 897 734 732
Central Nervous System
975 17 44 137 77 399 301 666 617 826 860 956
Cardiovascular 847 5 64 105 58 183 432 712 602 754 1,287 701
Musculoskeletal 788 6 60 123 78 248 273 703 644 638 199 543
Hematological 706 25 62 87 64 138 330 630 547 479 603 337
Diagnostic / Imaging Agents / Delivery
563 4 4 7 10 478 60 174 159 287 255 473
Respiratory 405 4 26 86 36 85 168 355 296 313 309 313
Gastrointestinal 383 6 29 62 38 93 155 322 317 294 420 359
Dermatology 351 1 44 69 33 45 159 309 269 330 299 239
Eye and Ear 349 4 27 70 37 111 100 255 217 268 409 190
HIV Infections 282 2 12 33 45 150 40 273 291 424 372 537
Pain 248 11 14 39 16 64 104 222 224 214 172 194
Genitourinary 173 2 11 23 9 23 105 144 124 170 224 128
Nephrology 122 1 9 29 21 28 34 112 90 107 101 190
Miscellaneous 4,341 0 0 7 7 4,284 43 536 476 1,977 936 962
Total 21,692 199 1,161 2,716 2,541 10,114 4,961 14,447 13,049 16,599 14,927 14,305
Source: BioPharm Insight, www.infi nata.com/biopharma-solution/by-product/biopharm-insight.html
Note 1: A number of products had unclear status but are included in the product totals.
Note 2: Biopharm Insight’s grouping for “Marketed Products” includes: Approved, Approved-SNDA, Approved-MAA (EMEA), Approved-NDA, Approved-BLA, and Approved-International phase designations. Grouping for “NDA / BLA Filed” includes: ANDA Filed, Generic Development, NDA / BLA Approvable Letters, NDA / BLA Filed, NDA / BLA Not Approved, Regulatory Filing - Other, Tentative Approval.
AnnualRep_15.indd 22AnnualRep_15.indd 22 6/5/15 1:10 PM6/5/15 1:10 PM
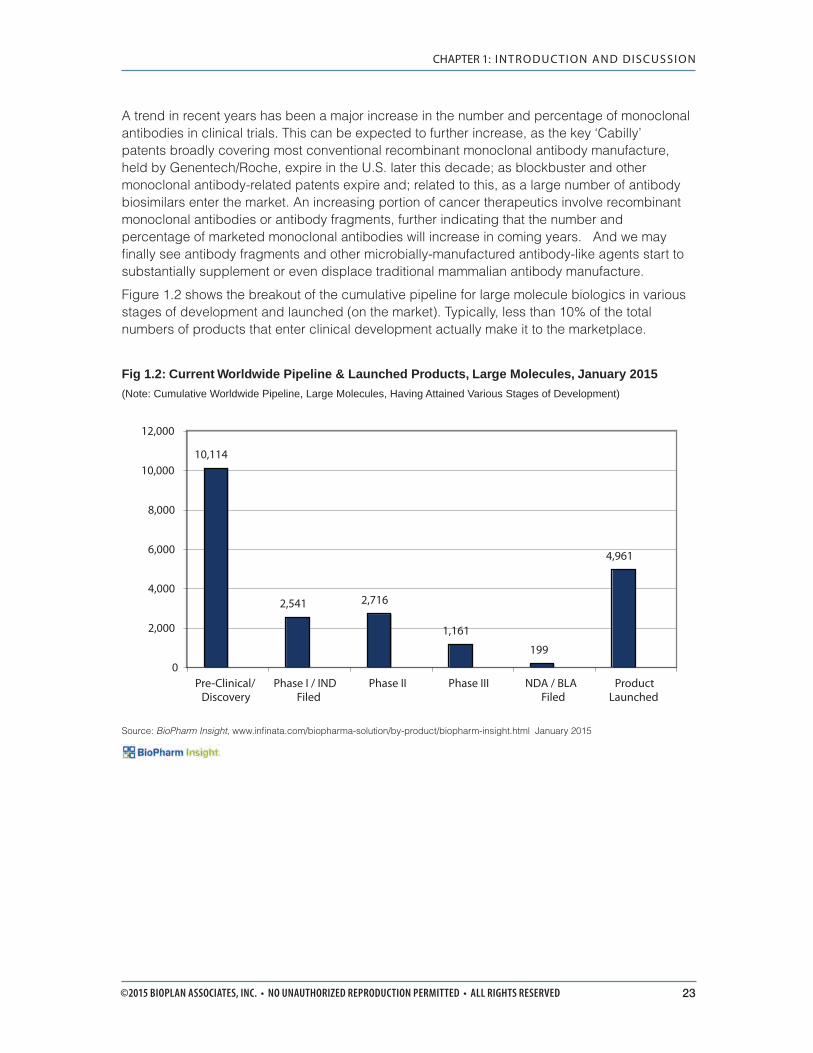
©2015 BIOPLAN ASSOCIATES, INC. • NO UNAUTHORIZED REPRODUCTION PERMITTED • ALL RIGHTS RESERVED 23
CHAPTER 1: INTRODUCTION AND DISCUSSION
A trend in recent years has been a major increase in the number and percentage of monoclonal antibodies in clinical trials. This can be expected to further increase, as the key ‘Cabilly’ patents broadly covering most conventional recombinant monoclonal antibody manufacture, held by Genentech/Roche, expire in the U.S. later this decade; as blockbuster and other monoclonal antibody-related patents expire and; related to this, as a large number of antibody biosimilars enter the market. An increasing portion of cancer therapeutics involve recombinant monoclonal antibodies or antibody fragments, further indicating that the number and percentage of marketed monoclonal antibodies will increase in coming years. And we may fi nally see antibody fragments and other microbially-manufactured antibody-like agents start to substantially supplement or even displace traditional mammalian antibody manufacture.
Figure 1.2 shows the breakout of the cumulative pipeline for large molecule biologics in various stages of development and launched (on the market). Typically, less than 10% of the total numbers of products that enter clinical development actually make it to the marketplace.
Fig 1.2: Current Worldwide Pipeline & Launched Products, Large Molecules, January 2015
(Note: Cumulative Worldwide Pipeline, Large Molecules, Having Attained Various Stages of Development)
Source: BioPharm Insight, www.infi nata.com/biopharma-solution/by-product/biopharm-insight.html January 2015
10,114
2,541 2,716
1,161
199
4,961
0
2,000
4,000
6,000
8,000
10,000
12,000
Pre-Clinical/Discovery
Phase I / INDFiled
Phase II Phase III NDA / BLAFiled
ProductLaunched
AnnualRep_15.indd 23AnnualRep_15.indd 23 6/5/15 1:10 PM6/5/15 1:10 PM

Report and Survey of Biopharmaceutical Manufacturing Capacity and Production
WWW.BIOPLANASSOCIATES.COM24
Fig 1.3: Current Worldwide Pipeline & Launched Products, Large Molecules, January 2015
Source: BioPharm Insight, www.infi nata.com/biopharma-solution/by-product/biopharm-insight.html, January 2014
Not Classified0.2%
0.9%
Pre-Clinical/ Discover
Phase I / IND Filed
11.7%
Phase II12.5%
Phase III5.3%
NDA / BLA Filed
Product Launched
22.8%
46.5%
AnnualRep_15.indd 24AnnualRep_15.indd 24 6/5/15 1:10 PM6/5/15 1:10 PM

©2015 BIOPLAN ASSOCIATES, INC. • NO UNAUTHORIZED REPRODUCTION PERMITTED • ALL RIGHTS RESERVED 25
CHAPTER 1: INTRODUCTION AND DISCUSSION
Table 1.2 presents the number of entries in the BioPharm Insight database by phase of development for years 2008-2015. Note, discovery and trials for all biopharmaceuticals increased over this period, while approvals fi led decreased by a rather insignifi cant amount.
Table 1.2: Worldwide Pipeline, Large Molecules, 2008-2015
2014
Percent of Total INDs, 2014 2014 2013 2012 2011 2010 2009 2008
Percent Change in # Drugs 2008-2015
Pre-Clinical/ Discovery 10,114 46.5% 6,469 6,030 6,339 5,779 7,052 6,398 5899 71.5%
Phase I / IND Filed 2,541 11.7% 1,517 1,581 2,725 2,608 2,156 1,821 1661 53.0%
Phase II 2,716 12.5% 2,110 2,035 3,157 3,008 2,401 1,946 1699 59.9%
Phase III 1,161 5.3% 862 868 1,269 1,155 1,044 890 774 50.0%
NDA / BLA Filed 199 0.9% 21 22 345 308 249 239 204 -2.5%
Product Launched 4,961 22.8% 3,309 2,250 1,890 1,704 1287 1,034 790 528.0%
Not Classifi ed 45 0.2% 45 60 874 62
Total 21,737 100.0% 14,333 12,846 15,725 14,562 14,189 12,328 11,089 96.0%
Source: BioPharm Insight, www.infi nata.com/biopharma-solution/by-product/biopharm-insight.html, January 2015
AnnualRep_15.indd 25AnnualRep_15.indd 25 6/5/15 1:10 PM6/5/15 1:10 PM

Report and Survey of Biopharmaceutical Manufacturing Capacity and Production
WWW.BIOPLANASSOCIATES.COM26
1 -5 BIOSIMILARS ARE A LARGE PART OF THE PIPELINEThere is a very healthy pipeline of follow-on (biosimilar and biobetter) products in development targeted for the U.S., EU and other major markets (see www.biosimilarspipeline.com). Biosimilars are further discussed in more detail in another section below. This pipeline includes nearly 700 biosimilars, about ≥50 of these presumed targeted to major markets, and about 475 biobetters in development, a total of nearly 1,200 follow-on products in the development pipeline for over 100 currently-marketed biopharmaceuticals. While biosimilars are fi nally starting to substantially penetrate the market in the European Union, in the U.S., FDA is still moving at a glacial pace – only approving its fi rst product about 5 full years after passage of BPCIA legislation enable FDA approval of biosimilars. Now, over 5 years after passage of enabling legislation, FDA still has not yet issued many needed guidelines. Basic issues affecting biosimilars future markets, such as product names (nomenclature), have yet to be resolved, with this among many issues making planning biosimilar development and marketing very diffi cult. At least the initial guidance from FDA is reassuring, in the sense that they contain few surprises and are unlikely to disrupt ongoing development activities.
Most biosimilars/biobetters are being manufactured using current vs. the generally decades-old technology and equipment being used for reference product manufacture. Biosimilars will include products pioneering new expression systems and other bioprocessing technologies. Ultimately, many of these products could well be signifi cantly better in some or many respects, including safety and effi cacy, such has having higher purity, than their usually several decades-old legacy reference products. If too different, including two better, this would negate biosimilar approval (with full approval required). Many biosimilar developers are using CMOs for development and manufacturing services. Major CMOs report recent revenue increases of 15% attributable to biosimilar contracts.
AnnualRep_15.indd 26AnnualRep_15.indd 26 6/5/15 1:10 PM6/5/15 1:10 PM

©2015 BIOPLAN ASSOCIATES, INC. • NO UNAUTHORIZED REPRODUCTION PERMITTED • ALL RIGHTS RESERVED 27
CHAPTER 1: INTRODUCTION AND DISCUSSION
1-6 U.S. AND WORLD BIOPHARMACEUTIC AL AND RECOMBINANT PROTEIN/MAB MARKETS This year (2015), we assess the worldwide biopharmaceutical drug market at >200 billion [1]. This includes all biopharmaceuticals, i.e., biotechnology-derived pharmaceuticals, including classic biologics, such as vaccines and blood/plasma products. Recombinant proteins/antibodies have crossed the threshold, now constituting well over >50% of biopharmaceutical revenue/sales and with sales crossing the ≥$100 billion/year threshold. Among these products, monoclonal antibodies (mAbs) account for the largest portion, ≥$50 billion in sales. The biopharmaceutical market is now approaching 20% of the world’s total pharmaceutical market, which is now essentially at $1 trillion/year. Growth in the biopharmaceutical markets continues to overall be approximately twice that experienced by non-biopharmaceutical products, e.g., small molecule-based drugs.
There is every reason to assume that future growth in biopharmaceutical sales will continue at the approximate 15% rate it long has been increasing; at this rate, nearly or about doubling about every fi ve years. This will be the result of continued new product approvals; expansion of indications and markets for current products, including as lesser-developed countries become increasingly affl uent; and increased demand as the population ages in the U.S. and other major pharmaceutical markets. Aging populations need treatment for various chronic and acute conditions, including cancer and arthritis, with these diseases increasingly being treated using biopharmaceuticals. As discussed in other sections, biosimilars (and biobetters) will result in many more products and companies entering the world’s biopharmaceuticals markets, and the markets (total revenue) for these reference products and their biosimilar/biobetter versions will contract as this competition leads to discounts. Further, sales will likely be reduced somewhat by other cost constraints, including insurers pushing biopharmaceutical users to cheaper products. But any market contractions due to biosimilars in the U.S. and other major markets will be more than compensated for by organic growth in the market.
As of early 2015, as shown in the table below, there were over 475 biopharmaceutical products approved in either the U.S. and/or European markets (primarily, the European Union), including ≥180 recombinant proteins and >40 monoclonal antibodies. There were >385 biopharmaceuticals approved in the U.S., including >145 recombinant products, including >40 monoclonal antibody products. There were >350 biopharmaceuticals approved in Europe, including >150 recombinant proteins. At most any time, there are likely 40-50 products either pending at FDA or with applications expected to be fi led within coming months.
Table 1.3: Number of Products in U.S. and European Markets*
Product Class U.S. Market, Number of Product
European Market, Number of Products
US/Europe Combined
Biopharmaceuticals ~400 >375 >475Recombinant proteins ≥150 >150 ≥180Antibodies, recombinant ~30 >25 >40
*Note, what constitutes a distinct product can be rather subjective, such as whether something changed in terms of active agents, formulations, trade names or approvals defi ne new, different products.
AnnualRep_15.indd 27AnnualRep_15.indd 27 6/5/15 1:10 PM6/5/15 1:10 PM

Report and Survey of Biopharmaceutical Manufacturing Capacity and Production
WWW.BIOPLANASSOCIATES.COM28
Overall Health of the Biopharmaceutical SectorThe pharmaceutical industry and, especially, the biopharmaceutical subset remains active, profi table and growing, despite having to recover from prior years’ worldwide economic problems. The worldwide pharmaceutical market is now about $1 trillion. There are estimated to be over well over 10,000 therapeutics in R&D, both drugs (chemical substance pharmaceuticals) and biopharmaceuticals (biotechnology-derived pharmaceuticals), with nearly 40,000 ongoing (or recently reported) clinical trials. Among these, an estimated 40% or over 4,000-5,000 candidate products in R&D are likely biopharmaceuticals. A signifi cant portion, about 1,200 products in the development pipeline, are follow-on biopharmaceuticals, mostly biosimilars but also a large number of biobetters [see www.biosimilarspipeline.com].
The world market for biopharmaceuticals is now about ≥$200 billion; growing at ~15% annually, defi nitely a very healthy rate, essentially doubling about every fi ve years. New products and new markets, including international, continue to support market growth. The world market for recombinant protein therapeutics is now >$100 billion. The continued high growth rate in biopharmaceutical markets (revenue) will continue to drive investment in the industry, including at the expense of traditional small molecule drug development.
Biopharmaceuticals (vs. drugs) have proven themselves to be profi table investments, e.g., with much higher profi ts per sale and likelihood of attaining success, including products making it through the development pipeline and capturing market share. This is often simpler or more straightforward with innovative biopharmaceuticals, with many, if not most biopharmaceuticals, such as antibodies and replacement enzymes, having rather clearly-understood, if not obvious, biological activities related to disease processes, with this making development, approvals and marketing easier than many small molecule drugs. Biopharmaceuticals, if only due to their larger size, tend to be more selective and targeted in biological activity than most drugs (chemical substance-based pharmaceuticals).
A large portion of biopharmaceuticals coming to market still involve treatment of ignored or currently untreatable indications, making them particularly welcome or needed and potentially attaining high sales levels.. Also, many new entrant companies of all sizes and types, including generic drug and foreign companies, are developing follow-on products, mostly biosimilars, and plan to use these to establish themselves in the mainstream biopharmaceutical industry. This is resulting in a signifi cant increase in the number of players in the biopharmaceutical industry.
A trend in recent years has been a major increase in the number and percentage of monoclonal antibodies in clinical trials. This can be expected to further increase, as the key ‘Cabilly’ patents broadly covering conventional recombinant monoclonal antibody manufacture, held by Genentech/Roche, expire in the U.S. later this decade (2018); as blockbuster and other monoclonal antibody-related patents expire and; as a large number of antibody biosimilars (and biobetters too) enter the market. An increasing portion of therapeutics in development involve recombinant monoclonal antibodies or antibody fragments, further indicating that the number and percentage of marketed monoclonal antibodies will increase in coming years. Typically, less than 10% of the total numbers of products in clinical development actually make it to the marketplace.
This industry activity represents a considerable increase from as short as ≥fi ve years ago and refl ects a basic shift in the pharmaceutical industry from small molecule drugs to biopharmaceuticals for new, innovative and profi table products. Also, the large number of biosimilars and biobetters in development indicate the maturation of the biopharmaceutical industry, as its major products start to go off-patent.
AnnualRep_15.indd 28AnnualRep_15.indd 28 6/5/15 1:10 PM6/5/15 1:10 PM

©2015 BIOPLAN ASSOCIATES, INC. • NO UNAUTHORIZED REPRODUCTION PERMITTED • ALL RIGHTS RESERVED 29
CHAPTER 1: INTRODUCTION AND DISCUSSION
However, as companies of all sizes continue to cut back on expenses as much as possible and consolidate R&D, they appear to be concentrating more on fewer products, so the overall pipeline may well be shrinking somewhat. This likely economics/recession-related decrease is showing up more in products currently in clinical trials rather than preclinical phases. But in terms of biopharmaceuticals, any recent years’ decreases in R&D are and will be increasingly counter-balanced by established, including Big Pharma companies, companies moving into biopharmaceuticals.
The pharmaceutical R&D pipeline and industry are becoming increasingly dependent on biopharmaceuticals. These products are being developed by an ever-increasing cross section of the pharmaceutical industry, including Big Pharma and even generic drug companies, with many of these also active in developing biosimilars. These sources, along with smaller biopharmaceutical developers, which have been the traditional source for most innovative biopharmaceuticals, are continuing to expand the global biologics pipeline. Also, new entrants based in China, India and other developing countries are increasingly entering biopharmaceutical R&D, although generally concentrating on biosimilars, not innovative products. Thus, an increasing number and percentage of new pharmaceuticals, including from new players, can be expected to enter the market in coming years. Combine this with biopharmaceuticals generally costing much more and providing higher profi ts and profi t margins, the pharmaceutical industry will increasingly be dependent on biopharmaceuticals for profi ts and innovation – in fact, its basic survival.
As biopharmaceuticals become an even more important part of the pharmaceutical industry, many new players are entering the fi eld, and most current manufacturers have been and/or are expanding their bioprocessing capacity. Bioprocessing output must expand to handle manufacture of an increasing number of approved products and higher volumes as markets for many products further expand, e.g., with approvals for new indications. The industry must also be capable of handling a large number of pipeline products. Most recent capacity expansion generally has involved building large fi xed stainless steel bioreactor-based facilities for commercial product manufacture. In contrast, for production of supplies for R&D, clinical testing and other applications that can be served using bioreactors up to 1,000-2000, L, are now essentially dominated by use of single-use/disposable bioreactor-based systems, with these requiring much less facilities and infrastructure investment and construction. Many products being developed using single-use systems for manufacture will continue to be manufactured using single-use systems after they enter the market.
The strategic importance of biopharmaceutical manufacturing and manufacturing capacity are increasing, and understanding the markets for bioprocessing equipment, technologies and services is becoming ever more important to those in the biopharmaceutical industry. Planning and decision-making concerning the manufacture of biopharmaceuticals are becoming more complex as companies continue to expand, implement new innovations, while also implementing cost-saving efforts, including cutting back on the number of products in their development pipelines and outsourcing more support and even critical tasks.
Also, manufacturers must choose from an ever-increasing number and diversity of bioprocessing options. This includes new and improved cell lines and genetic engineering/expression systems technologies; bioprocessing equipment, including new and improved single-use equipment; replacements for Protein A; other alternative chromatography methods; and outsourcing manufacturing to CMOs, which are also expanding their capacity, technologies, and service offerings. Increasingly, companies must make diffi cult and costly strategic decisions about commercial manufacture earlier in product development, generally setting pipeline products bioprocessing by the end of Phase II, start of Phase III, if not earlier.
AnnualRep_15.indd 29AnnualRep_15.indd 29 6/5/15 1:10 PM6/5/15 1:10 PM

Report and Survey of Biopharmaceutical Manufacturing Capacity and Production
WWW.BIOPLANASSOCIATES.COM30
Effective planning within the biopharmaceutical and bioprocessing markets is required to avoid problems later on. Strategic production decisions must be based on solid bioprocess data, combined with a broad understanding of trends and effective benchmarking of capacity and production issues. This annual study provides an on-going evaluation of the vital manufacturing trends shaping this industry, and is designed to help keep those in the industry aware of all the external trends and issues affecting biopharmaceutical manufacture decision-making.
U.S. Industry Leadership ContinuesThe U.S. continues to be the leader in biopharmaceutical development, manufacture and use, accounting for most innovations and about half (or more) of worldwide biopharmaceutical sales (revenue). The U.S. continues to be the source for most invention, development and manufacture of biopharmaceutical products. Associated with this strong U.S. biopharmaceutical market, the U.S. economy and healthcare system, more than any other major pharmaceutical market, continue to support adoption of innovative products, including new biopharmaceuticals, even where these are incredibly expensive.
Thus, U.S. biopharmaceutical sales can be assumed to be in the range of about $100 billion/year. Biopharmaceuticals can be expected to have a somewhat lesser market penetration in essentially every other country, including Western Europe and other major pharmaceutical markets. Much of this is due to the U.S. still strongly resisting price controls and rationing of drug use based on costs, etc., while these are increasingly the reality in other countries; combined with the U.S. having distinct preferences, if not being biased in favor of, the latest, greatest therapeutics and breakthrough products, which are generally the most expensive. In fact, rarely discussed (with criticism more common), with implementation of the Affordable Care Act (“ObamaCare”) and related changes in the U.S. healthcare infrastructure, continued insurance coverage for (bio)pharmaceuticals is much better assured than in many other developed countries.
In the U.S., particularly, there continues to be a distinct preference, if not bias, in favor of new, innovative products, as long as they provide some clinical improvements, some apparent overall cost savings or increased effi cacy, relative to existing products or where no or inadequate treatment was previously the case. Associated with this, the U.S. generally has among the highest prices for pharmaceuticals, particularly, biopharmaceuticals. The same cannot be said for other major market countries where cost-conscious centralized governments are often more intrusively involved, with government control of healthcare insurance or otherwise exercising various levels of control or infl uence over pharmaceutical markets and prices. For example, in the U.K., government panel (NICE) consideration that (bio)pharmaceuticals provide inadequate cost-benefi t ratios often leads to National Health Service (NHS) refusal to adopt these therapeutics.
AnnualRep_15.indd 30AnnualRep_15.indd 30 6/5/15 1:10 PM6/5/15 1:10 PM

©2015 BIOPLAN ASSOCIATES, INC. • NO UNAUTHORIZED REPRODUCTION PERMITTED • ALL RIGHTS RESERVED 31
CHAPTER 1: INTRODUCTION AND DISCUSSION
Biopharmaceuticals in the Rest-of-the-WorldWhile the U.S. and other major biopharmaceutical markets tend to grow by rapid adoption of new products and new indications for existing products, little attention or interest in breakthrough treatments is common in the rest of the world, particularly developing countries. In some countries, such as India and South Africa, there is even outright antagonism to new, innovative (and, thus, generally foreign-originating and expensive) pharmaceutical products. These countries simply cannot afford most pharmaceuticals other than the cheapest generics (if even that), and particularly cannot afford most biopharmaceuticals, other than the very cheapest, such as vaccines costing pennies/dose. Even many countries with developing middle classes still do not have high enough base incomes for their growing markets to be able to afford most biopharmaceuticals.
Biopharmaceutical market growth in most of the rest of the world tends to be driven by general economics and other broad trends. This includes in many countries overall economic improvement, the related development of a middle class, other broad economic and social trends, governments supporting improved healthcare services in these countries, introduction of health insurance, etc. As discussed below concerning biosimilars, many developing countries prefer cheaper, domestic, regional or other developing country-manufactured biopharmaceuticals, despite these generally not meeting US/EU GMP standards or otherwise presumed to be of low quality.
Biopharmaceutical companies in many developing countries serving their domestic, regional or lesser-regulated international markets are experiencing rapid growth. Markets for biopharmaceuticals are growing in many developing countries, such as India and China, with increased incomes, a new middle class, improved healthcare and initiation of health insurance, e.g., as is starting to happen in China. However, Brazil, Russia, India, and China (BRIC) and other developing countries have yet, and for the foreseeable future, to pose any threat to U.S. and European dominance of the innovative biopharmaceutical industry, particularly highly-profi table innovative product development and manufacturing. Foreign-based CMOs and CROs will continue to slowly capture market share, for as long as these companies provide perceived signifi cant cost-effectiveness advantages (but that is becoming increasingly less obvious).
But in terms of commercial U.S./EU-level cGMP manufacturing expertise and infrastructure, countries such as India and China currently lack the needed critical mass of established institutional knowledge, business practices, business culture and ethics, trained and trustworthy staff, facilities, information and quality systems, etc., needed to attain and maintain the levels of GMP quality and documentation required for globally-accepted bioprocessing. Despite the majority of drugs (mostly generics) now being manufactured in China and India, other than several products from South Korea (considered a developed country), no Asian country yet manufactures biopharmaceutical products marketed in the U.S. or European Union. A few more advanced developing countries, such as South Korea and Singapore, will be among major foreign biopharmaceutical manufacturers, and will likely attain this goal in coming years. This includes the Korean and Singapore governments subsidizing domestic companies’ building of world class large-scale facilities, with biosimilars, and, particularly, U.S. markets, being targeted by Korea.
Biopharmaceutical manufacture and marketing are expanding worldwide, including many new players in lesser-developed countries, generally primarily concerned with their domestic/regional markets. But with the U.S. by far the largest and most receptive market for biopharmaceuticals, we can expect an increasing number of companies in lesser-developed countries developing products for the U.S., EU and other major markets. Many of these companies will likely enter the
AnnualRep_15.indd 31AnnualRep_15.indd 31 6/5/15 1:10 PM6/5/15 1:10 PM

Report and Survey of Biopharmaceutical Manufacturing Capacity and Production
WWW.BIOPLANASSOCIATES.COM32
U.S. and other major biopharmaceutical markets through development of biosimilars, with the primary challenges here involving manufacturing and gaining market share against considerable competition.
The biopharmaceutical industries and markets are rapidly growing in emerging markets, including BRIC, as well as other countries in Asia, Eastern Europe and Latin America. The great majority of biopharmaceutical manufacture and consumption in emerging markets currently involves biogenerics or other non-GMP-quality copies of products developed by Western innovator companies, with most lesser-developed countries simply not able to afford most Western innovator products. These foreign markets, although still relatively small, are growing at a much more rapid pace than major Western markets, and most every major biopharmaceutical company either has or is establishing a presence in these foreign markets, and/or is forming joint ventures and collaborations with local companies. These collaborations can involve outsourcing of R&D, the licensing of manufacturing rights to organizations in developing countries, and/or establishment of local clinical research and manufacturing operations. Many large Chinese and Indian companies and also various countries are developing commercial-scale biopharmaceutical manufacturing facilities to serve domestic and regional needs.
Eventually, biopharmaceutical product manufacture will start to be outsourced to lesser-developed countries, although it will likely be many years, perhaps a decade, before any signifi cant number of U.S./EU biopharmaceuticals are primarily manufactured in developing countries. These countries simply lack the needed critical mass of facilities, knowledgeable and cGMP-experienced staff, information/data and quality systems, institutional know-how, business culture and ethics required for full U.S. /EU cGMP biopharmaceutical manufacture. We can expect increased use of developing country-based CROs and CMOs, but primarily to support pre-commercial R&D, not product manufacture.
However, many developing countries are beginning to develop domestic biopharmaceutical manufacturing capabilities. This is already happening with many vaccines, with developing countries increasingly supporting development of their own vaccine manufacturing capacity. While much of this foreign expansion into biopharmaceuticals involves biogeneric versions (copies) of established innovator products, a few foreign companies are developing their own fully innovative biopharmaceuticals.
For many biosimilar/biobetter developers, actually capturing signifi cant market share in the U.S., EU and other major markets may not be a serious goal. Rather, many foreign companies apparently look upon U.S. product approval, even if only a biosimilar, as validation of their company and its product, facilitating wider sales and at higher prices in lesser-regulated (their traditional or established) markets worldwide. Similarly, many foreign companies will view U.S. biosimilar/biobetter approval as validating their company, its management, facilities and bioprocessing capabilities, e.g., with the cost of developing a product for U.S. biosimilar approval probably more than recovered many times over in increased stock value after FDA product approval. For many small foreign companies lacking product revenue, stock price (company valuation) and company perceptions are much more important, are essentially their major products, rather than actual sales (which they will likely never attain, themselves), with this a factor potentially increasing price competition as new foreign entrants are more interested in getting established in the U.S. market than profi ts from one or a few early follow-on products.
Biopharmaceutical manufacturing capacity outside of the usual major market countries is increasing, as indicated by BioPlan’s Top 1000 Global Biopharmaceutical Facilities Index www.top1000bio.com), which ranks facilities worldwide in terms of known or estimated cumulative
AnnualRep_15.indd 32AnnualRep_15.indd 32 6/5/15 1:10 PM6/5/15 1:10 PM

©2015 BIOPLAN ASSOCIATES, INC. • NO UNAUTHORIZED REPRODUCTION PERMITTED • ALL RIGHTS RESERVED 33
CHAPTER 1: INTRODUCTION AND DISCUSSION
bioreactor capacity, along with employment, number of product, and other factors. Much new and increased capacity is being added internationally, with biopharmaceutical markets in many developing countries rapidly growing and domestic/regional companies increasingly serving these markets, often with biogeneric or outright copies of innovator products that are simply marketed as substitutable for the innovator product (without much real testing). Developed country innovator companies seeking to expand internationals markets will increasingly have to deal with this local/regional competition.
Another factor that will result in increasing manufacture in lesser-developed countries is that these countries’ governments are increasingly seeking, even demanding, domestic manufacture of biopharmaceuticals being sold in their markets. Many countries are starting to tell vaccine manufacturers that they want products for their markets manufactured in-country, preferably or requiring this be done by locally-owned, government captive, or joint venture companies. As single-use equipment and modular bioprocessing facilities increasingly enter the market, foreign countries (or their proxy/subsidized companies) will increasingly undertake manufacture of needed products, such as commonly-used vaccines, with or without the assistance and participation of original product developers and current manufacturers.
Particularly with larger companies, as more biopharmaceutical manufacturing is performed worldwide, companies are working to standardize their products and manufacturing processes on a worldwide basis. For many, this includes having 2nd- or even 3rd-source facilities either actively manufacturing or serving as backups, after having received approvals for manufacture for the U.S. and other major markets. Adoption of single-use and modular bioprocessing systems for commercial manufacturing will accelerate this trend of foreign manufacture.
AnnualRep_15.indd 33AnnualRep_15.indd 33 6/5/15 1:10 PM6/5/15 1:10 PM

Report and Survey of Biopharmaceutical Manufacturing Capacity and Production
WWW.BIOPLANASSOCIATES.COM34
1-7 BIOPHARMACEUTIC AL MARKETS BY PRODUC T CLASSTable 1.4 below shows estimates of the worldwide markets (total revenue) for various classes of biopharmaceutical products in 2014 and 2007, and the percent increase during this six-year period. [Note various classes overlap, i.e., products are classed as appropriate in multiple classes, with this particularly affecting recombinant protein products.] Thus, the numbers reported do not add up to the totals.
Table 1.4: Summary of Worldwide Biopharmaceutical Revenue Growth by Product Class, 2007 and 2014
Product Class 2007 Sales ($M) 2014 Sales ($M) Growth, 2014/2007
Recombinant proteins (rDNA) 65,300 $100,000 ≥150%
Monoclonal antibodies, rDNA 19,500 >$50,000 >250%
Insulin Products (primarily rDNA) 8,300 $44,000 >500%
Monoclonal antibodies, non-rDNA 300 $75 -400%
Vaccines ~11,000 $40,000 >350%
Cultured cells/tissues 100 $1,000 1000%
Blood Products (human) ~15,000 $30,000 200%
Misc. foreign biogenerics (rough estimate)
1,000 $2,500 250%
Total (not including overlaps in classes)
~$93,300 ≥$200,000 ≥200%
Source: BIOPHARMA: Biopharmaceutical Products in the US and European Markets; see http://www.bioplanassociates.com/publications/pub_bpuseu.htm
mAbs are the Leading Product Classes Recombinant monoclonal antibodies (mAbs) continue to be the major class of biopharmaceuticals with the greatest sales and growth in market revenue. Worldwide monoclonal antibody (mAb) revenue in 2014 was ≥$50 billion. mAbs are the main biopharmaceutical product class with the most current and expected upcoming blockbusters, i.e., products with ≥$1 billion/year in revenue.
Monoclonal antibodies have become and are increasingly perceived as a relatively mature technology and secure investment, with mAbs being very targeted/specifi c and relatively non-toxic. An increasing number of antibody design and genetic engineering/expression system platforms are becoming available. An increasing number of marketed products and expanding markets are resulting in new entrants targeting mAb development, both innovative and follow-on, including biosimilar products. mAb products tend to become well established in the marketplace, having proven to be viable therapeutics since the mid-1990s.
AnnualRep_15.indd 34AnnualRep_15.indd 34 6/11/15 4:04 PM6/11/15 4:04 PM

©2015 BIOPLAN ASSOCIATES, INC. • NO UNAUTHORIZED REPRODUCTION PERMITTED • ALL RIGHTS RESERVED 35
CHAPTER 1: INTRODUCTION AND DISCUSSION
Despite mAbs becoming a mature class of products and technologies, recombinant antibody treatment remains generally rather expensive, with some products costing over $100,000 per year or course of treatment. (One product, Soliris, costs over $400,000/year). Much of this high cost for mAbs is related to the high amounts of recombinant protein required for antibody-based treatment, e.g., often about 100 mg (1/10th gram) vs. micrograms with many other biopharmaceuticals. Plus, repeated, frequent, e.g., (bi-)weekly, doses are generally required. Patients often need grams of a mAb annually or for each course of treatment. Thus, blockbuster and most any decent-selling mAb can require manufacture of large amounts of mAbs annually, such as 100s or 1000s of kilograms/year. Volume of mAb manufacture is discussed in the downstream processing/Protein A resins section. The BioPlan Associates annual survey of the biopharmaceutical manufacturing industry now shows mAb expression yields with new bioprocesses to be exceeding 3 g/L, so each 1,000 L of bioreactor capacity produces over 3 kg/run [2]. With 100s of kgs often needed, mAb manufacture often requires use of multiple ≥10,000 L bioreactors.
Recombinant mAbs place very high demands on bioprocessing, both in terms of technical complexity, requiring multiple chromatography steps, and also costs, e.g., with Protein A resins used for purifi cation being very expensive (discussed in another section). Recombinant mAbs manufacturing accounts for ≥ 90% of the world’s mammalian cell culture capacity [3]. For example, nearly all of the facilities with the very largest bioprocessing capacity, 10s of 1,000s of L, manufacture marketed mAbs. Commercial production increasingly involves multiple sites serving different worldwide markets and/or serving as backup manufacturing facilities. For example, manufacture of blockbuster biopharmaceutical mAbs each typically requires non-stop use of multiple dedicated ≥10,000 L stainless steel bioreactor-based systems, often at multiple sites. In contrast, many recombinant protein therapeutics can have their annual world supply produced by much smaller bioprocessing systems, such as intermittent operation of one or more 1,000 L or smaller bioreactor-based systems.
Today, 500-2,000 liters is often cited as the most optimal or cost-effective target for bioreactor size for commercial-scale mammalian, including mAb, manufacture. Operating in this scale range allows use of single-use/disposable equipment, with the market seemingly targeting 1,000 L as the eventual optimal size for single-use-based mAb manufacture. [4] But single-use equipment is only relatively just beginning to be adopted for commercial product manufacture, and its scale, generally limited to 2,000 L, is still too low for much commercial antibody production Large-sized fi xed stainless steel equipment continues to dominate commercial mAb manufacture.
Hardly any mainstream mAb products are yet manufactured using single-use/disposable upstream bioprocessing systems. However, this will change over the next few years as products that are currently in development using single-use systems enter the market and are manufactured using single-use systems. To get there, FDA and regulatory agencies in other developed countries will need to be shown that products manufacturing using single-use devices are at least as safe and can be cost-effectively manufactured, at least comparable to mAb products manufactured using stainless steel systems. This hurdle has essentially already been surmounted, with many mAbs currently in clinical trials, and much of the industry can be expected to further accelerate its adoption of single-use systems for commercial manufacture, including mAbs.
AnnualRep_15.indd 35AnnualRep_15.indd 35 6/5/15 1:10 PM6/5/15 1:10 PM

Report and Survey of Biopharmaceutical Manufacturing Capacity and Production
WWW.BIOPLANASSOCIATES.COM36
1-8 BIOPHARMACEUTIC AL BLOCKBUSTERSTable 1.5 below shows blockbuster biopharmaceuticals, those with ≥ $1 billion in annual revenue in any recent year through 2013, a total of over 40 products, and their total sales/revenue (highest in any recent year). Together, blockbuster biopharmaceuticals account for >$130 billion or ≥68% of all biopharmaceutical sales. Thus, <10% of biopharmaceutical products (about 43 out of a total of 470 biopharmaceuticals of all types marketed in the U.S. and/or Europe) account for over 2/3 % of all biopharmaceutical revenue. As can be readily seen, recombinant monoclonal antibodies are, by far, the dominate leading-selling products.
Table 1.5: Blockbuster Biopharmaceutical Products*
Products Total Sales/Revenue (millions)
TNF Mab, rDNA (Humira) 10,659TNF Mab, rDNA/J&J (Remicade) 8,944 CD20 Mab, rDNA (Rituxan) 8,583TNF Receptor-IgG Fc, rDNA (Enbrel) 8,325 VEGF Mab, rDNA (Avastin) 6,745HER2 receptor Mab, rDNA (Herceptin) 6,555Insulin glargine, rDNA (Lantus) 7,590EPO, rDNA/Amgen (Epogen) 5,764G-CSF, rDNA, PEG- (Neulasta) 4,092EPO, darbo-, rDNA (Aranesp) 4,004VEGF Mab Fab, rDNA (Lucentis) 3,723Pneumococcal Vaccine(13)-CRM197 (Prevnar) 3,500Interferon beta-1a, rDNA (Avonex) 2,900Interferon beta-1a, rDNA (Rebif) 2,500Insulin lispro, rDNA (Humalog) 2,368Insulin aspart, rDNA (NovoRapid) 2,274Factor VIII, rDNA, PFM (Advate) 2,210Insulin, rDNA (Novolin) 2,185EPO, rDNA (NeoRecormon) 2,047EGF receptor Mab, rDNA (Erbitux) 1,820Interferon alfa-2a, rDNA, PEG- (Pegasys) 1,800Botulinum Toxin A (Botox) 1,775Interferon betaser, rDNA (Betaseron) 1,661Integrin Mab, rDNA (Tysabri) 1,600G-CSF, rDNA (Neupogen) 1,570HPV vaccine, rDNA (Gardasil) 1,500Factor VIIa, rDNA (Novoseven) 1,483Factor VIII, rDNA (Kogenate FS) 1,420Insulin detemir, rDNA (Levemir) 1,365Infl uenza Vaccine (Fluzone) 1,343
AnnualRep_15.indd 36AnnualRep_15.indd 36 6/5/15 1:10 PM6/5/15 1:10 PM

©2015 BIOPLAN ASSOCIATES, INC. • NO UNAUTHORIZED REPRODUCTION PERMITTED • ALL RIGHTS RESERVED 37
CHAPTER 1: INTRODUCTION AND DISCUSSION
Insulin, rDNA (Humulin) 1,249Glucocerebrosidase, rDNA (Cerezyme) 1,239RSV Mab, rDNA (Synagis) 1,230DTaP pediatric vaccine (Infanrix) 1,183Parathyroid hormone (Forteo) 1,151Immunoglobulin E Mab, rDNA (Xolair) 1,140Complement C5 Mab, rDNA (Soliris) 1,134IL-12/23 mAb (Stelara) 1,029Varicella/chickenpox vaccine (Varivax II) 1,000
*Sales in $millions. Either 2013 or the highest annual revenue reported in recent years, 2007-2013.
1-9 COMMERCIAL PRODUC T EXPRESSION SYSTEMSExpression systems, particularly the dominance of mammalian (particularly CHO), were discussed above in the context of these used for manufacture of most blockbusters and monoclonal antibodies, the products with the largest production volume, manufactured using long-established CHO and other mammalian expression systems.
Table 1.6 shows the distribution of expression systems (for recombinant products) and host cell lines (for non-recombinant products) among cultured/fermented products currently approved in the U.S. or European Union. This does not include human or animal blood-derived products, e.g., immunoglobulins, and a few other small classes of products. Truly novel expression systems (in terms of use for human biopharmaceutical manufacture), such as fungi (non-yeast), insect cells, plants and transgenic animals, have yet to make much of an impact on marketed products or even those in later-stage development. Despite many of these novel systems offering increased cost-effectiveness and other advantages, the industry remains fi xated and satisfi ed with continued use of the proven and safe (particularly in regulatory terms) CHO, E. coli and yeast systems for biopharmaceutical manufacture. For further information about the wide variety of expression systems and other genetic engineering technologies useful for recombinant protein/mAb manufacture, see Biopharmaceutical Expression Systems: Current and Future Technology Platforms, Rader, RA, BioPlan Associates, Inc., 2008.
AnnualRep_15.indd 37AnnualRep_15.indd 37 6/12/15 12:58 PM6/12/15 12:58 PM

Report and Survey of Biopharmaceutical Manufacturing Capacity and Production
WWW.BIOPLANASSOCIATES.COM38
Table 1.6: Expression Systems/Host Cells for U.S./EU-Marketed Cultured Biopharmaceuticals
System Type Number of Biopharmaceuticals
Microbial
Bacteria (E. coli) 75Yeast (Saccharomyces cerevisiae) 26Yeast (Pichia pastoris) 3
Insect cells
Trichopulsia ni (High Five) 1Spodoptera frugiperda Sf21 3
Mammalian, non-human
Chinese hamster ovary (CHO) 57Murine myeloma/hybridoma 17Baby hamster kidney (BHK) 3Madin-Darby canine kidney (MDCK) 2Chicken embryo culture 6Chicken eggs (infl uenza vaccines) 27
Mammalian, human
Human fi broblasts 4Human kidney cells (HEK) 1Human foreskin 4Human autologous cells 6Human cells, gene activation 2Human cells, EBV-transformed 1
Goats, transgenic 1Rabbits, transgenic 1
Source: BIOPHARMA: Biopharmaceutical Product in the U.S. and European Markets, (at www.bioplanassociates.com/biopharma), early 2014
AnnualRep_15.indd 38AnnualRep_15.indd 38 6/5/15 1:10 PM6/5/15 1:10 PM

©2015 BIOPLAN ASSOCIATES, INC. • NO UNAUTHORIZED REPRODUCTION PERMITTED • ALL RIGHTS RESERVED 39
CHAPTER 1: INTRODUCTION AND DISCUSSION
1-10 ANIMAL DERIVED PRODUC TS AND BIOPHARMACEUTIC ALSIf not already, eventually all biopharmaceutical products currently using animal-derived products, such as bovine serum or albumin in their manufacture, generally in culture media or use of human serum as a formulation stabilizer, will likely be updated, with animal-derived products removed. This may involve the substitution of recombinant growth factors in cell culture and recombinant human serum albumin in formulations. Currently, it remains unclear in the U.S. such process-related changes in products result in them being considered variations (receiving supplemental BLA approval), not as totally new products (receiving full BLA approvals, including 12 years data exclusivity/protection from biosimilars competition).
1-11 COST-CONTAINMENT AND PRICE CONTROLSThe past year was another rather quiet year in the U.S. and most other major markets in terms of new calls for and implementation of cost containment measures and cost controls for pharmaceuticals, with biopharmaceuticals generally the prime target, with these the most expensive class of pharmaceuticals. But in some other countries, cost containment and government-directed cost controls continue to be business-as-usual and adversely affect biopharmaceutical market development. This includes the U.K. National Institute for Health and Clinical Excellence (NICE) issuing more product reviews rejecting and restricting use of some biopharmaceuticals as to expensive and not cost-effective for use by the country’s National Health Service (NHS), effectively making these products not used in the U.K.
In the U.S., insurance providers continue to take increasing control of prescription writing and use away from physicians and consumers, forcing use of products for which they have secured preferential prices and often simply just refusing to pay for expensive biopharmaceuticals that they (not the prescribing physician and his patient) do not consider the most appropriate. As biosimilars become available, much as with generic drugs, U.S. insurers will surely force physicians, pharmacists and consumers to use these rather than more expensive innovator products.
However, signifi cant increases in implementation of cost containment and price control measures continue in some foreign countries. For example, India has implemented price controls for many pharmaceuticals, including 100s of “essential products.” This is in addition to India not allowing various types of pharmaceutical patents and arbitrarily (from a Western industry perspective) refusing and cancelling issued patents where indigenous companies plan to manufacture cheaper versions, e.g., a biosimilar (what is called in India, actually a biogeneric) version of Herceptin (breast cancer mAb) from Genentech/Roche is marketed in India. Much the same is happening in other developing countries, e.g., South Africa, that want (need) the cheapest pharmaceuticals, no matter what price the country has to pay, including the loss of domestic innovative pharmaceutical R&D and foreign investment in that country’s pharmaceutical industry. Besides wanting cheaper (or rather, needing the cheapest) pharmaceuticals, many developing countries want and are increasingly successful in terms of requiring foreign established companies to build manufacturing facilities and manufacture their products indigenously.
AnnualRep_15.indd 39AnnualRep_15.indd 39 6/5/15 1:10 PM6/5/15 1:10 PM

Report and Survey of Biopharmaceutical Manufacturing Capacity and Production
WWW.BIOPLANASSOCIATES.COM40
1-12 FUTURE TRENDS IN THE BIOPHARMACEUTIC AL INDUSTRYThe biopharmaceutical industry is continuously evolving and demanding new and improved bioprocessing technologies to reduce costs, increase effi ciencies, and improve weak development pipelines. Many large bio/pharma companies today are devoting increasing development efforts on biopharmaceuticals rather than small molecule drugs. In fact, most are now spending 40% or more of their R&D on biopharmaceuticals. To facilitate this trend, incremental innovation in improved productivity continues unabated and is a primary driver for many of the current biopharmaceutical trends. Innovation speeds discovery, drives down costs, and improves productivity. The current situation in biopharma is exciting, with biosimilars, new technologies, personalized medicines, and opportunities in emerging markets. Bioprocessing innovations are driving a number of these and other major industry trends.
Some of the ongoing biopharmaceutical trends support a future vision that includes:
■ Increasing number of global biopharma facilities
■ More biological products, but often with smaller markets
■ More multi-product facilities
■ More adoption of single-use systems at pre- and clinical scales
■ More adoption of single-use systems for commercial manufacture
■ More effi cient bioprocessing – titers and yields continue to increase
■ More continuous processing, including perfusion
■ More high-tech expression systems and other genetic engineering advances
■ More automation, monitoring and process control
■ More bioprocess modeling
■ Increased process automation
■ Modular facilities more adaptable to adopting new enabling technologies, with the ability to re-purpose spaces
■ More and more complex regulation
AnnualRep_15.indd 40AnnualRep_15.indd 40 6/5/15 1:10 PM6/5/15 1:10 PM

©2015 BIOPLAN ASSOCIATES, INC. • NO UNAUTHORIZED REPRODUCTION PERMITTED • ALL RIGHTS RESERVED 41
CHAPTER 1: INTRODUCTION AND DISCUSSION
1-13 OVERVIEW OF BIOPHARMACEUTIC AL MARKET TRENDSTrends in this industry are being driven by the need for new effi ciencies, greater quality, and cost reductions in manufacturing processes. To remain competitive, including as biosimilars and biobetters evolve, better ways of evaluating new technologies are needed that cut down on time to market and streamline the overall testing process. There is an increasing demand in the industry today for improved productivity, cost reductions, and higher quality, as companies continue to struggle to do more with fewer resources. Many are relying on suppliers’ innovations to advance production processes for current biologics, emerging biosimilars products, and for the production of biologics in emerging markets using fl exible facilities. The industry’s suppliers/innovators continue to demonstrate their commitment by investing in development of new technologies. Concurrently, end-users’ demand for improved productivity continues to fund these improvements. More streamlined new product and technology evaluation programs, coordinating trial users throughout the industry, promise to facilitate innovation and its dissemination.
The biopharmaceutical industry has survived prior years’ worldwide economic downturn. In fact, the industry has done rather well for itself during this period – not contracting or losing much at all in recent years – and shows clear signs of full recovery and renewed growth. This year, survey results again show that companies are spending and investing more in their R&D, new technologies, bioprocessing capacity, staff and other infrastructure. Some specifi c in the biopharmaceutical industry, further discussed in the context of survey fi ndings, are summarized below.
• Industry Remains Healthy and Its Status is Improving: The world market for biopharmaceuticals is now >$200 billion; growing at ~15% annually, defi nitely a very healthy rate. New products and new markets, particularly internationally, continue to support market growth. The world market for recombinant protein therapeutics is now ~$130 billion. The continued high growth rate in biopharmaceutical markets (revenue) will continue to drive investment in the industry, including at the expense of traditional small molecule drug development. Biopharmaceuticals vs. drugs have simply proven themselves to be profi table investments, e.g., with much higher profi ts per sale and likelihood of attaining success, including capturing market share. This is often simpler or more straightforward with innovative biopharmaceuticals. Many new entrant companies of all sizes and types, including generic drug and foreign companies, are developing biosimilars and plan to use these to establish themselves in the industry, particularly, as an easier way to, compared to innovative products, establish a presence in the biopharmaceutical industry in the main U.S. and EU markets. This is resulting in a signifi cant increase in the number of players in the biopharmaceutical industry.
• Industry Spending/Investment is Up: Survey results indicate that companies are investing more in biopharmaceutical R&D, including hiring staff and expanding manufacturing capacity. Increased spending is occurring in areas including process development, new technologies, capital equipment, and personnel training and development. Equipment developers and vendors are also investing more in product development and new and better technologies.
• Outsourcing Trend Remains But is Slowing: Outsourcing, including contract manufacture, continues as a major trend. However, recent survey data indicate the rate of growth in outsourcing has been slowing. Industry is likely simply running out of tasks susceptible to outsourcing that hasn’t already been outsourced, i.e., outsourcing is starting to approach its inherent limits or saturation.
AnnualRep_15.indd 41AnnualRep_15.indd 41 6/5/15 1:10 PM6/5/15 1:10 PM

Report and Survey of Biopharmaceutical Manufacturing Capacity and Production
WWW.BIOPLANASSOCIATES.COM42
• Outsourcing is Becoming More Strategic: Companies, including large Big Pharma-type companies that formerly eliminated in-house capabilities and outsourced everything feasible (and often more), are now taking a much more rational and sophisticated approach – more carefully evaluating and weighing their options, including assessing options from a longer-term perspective. Thus, there appears to be a slowing of what often seemed to be arbitrary, often irrational, quarterly balance sheet-directed, downsizing, lay-offs and closing and divestment of in-house corporate capabilities.
• Big Mergers and Acquisitions Continue But are Slowing: These continue at all levels throughout the industry. However, there appears to be a trend for fewer mega-mergers among the largest players, including Big Pharma-type companies. Besides there simply being fewer large international pharmaceutical companies due to decades of merging and purging, much of the industry is starting to realize that such mergers have had little, if any, positive outcome on the merged companies success.
• Mergers, Acquisitions and Partnering are Becoming More Strategic: Whatever the cause, corporate mergers and acquisitions are becoming more rational and strategic, in terms of being directed to improving R&D pipelines, rather than providing distractions for stockholders with promises of cost-savings from product line and facility consolidations and lay-offs. Associated with this, many larger companies are now directing more attention to acquiring smaller companies and licensing-in candidate products.
• New and Small Company Financing Remains Tight: Financing available for new startup and smaller non-public companies continues to be tight, despite improving overall fi nancial health and the pharmaceutical industry shifting its emphasis to biopharmaceuticals. Much or even most small company fi nancing and expansion is being accomplished through partnerships and collaborations with larger (bio)pharmaceutical companies, many increasingly desperate to fi ll their failing product development pipelines.
• China, India and ROW as Biopharmaceutical Manufacturers: Biopharmaceutical companies in many developing countries serving their domestic, regional or lesser-regulated international markets are experiencing rapid growth. Markets for biopharmaceuticals are growing in many developing countries, such as India and China, with increased incomes, a new middle class and improved health care. Foreign-based CMOs and CROs will continue to slowly capture market share, for as long as these companies provide perceived cost-effectiveness advantages. However, BRIC and other developing countries have yet to pose any threat to U.S. and European dominance of the innovative biopharmaceutical industry, particularly related product development and manufacturing. Recent manufacturing problems in India noted by FDA and other developed country regulatory agency inspections highlight the diffi culties developing countries face in adopting modern business methods, practices, ethics, etc.
• Pipeline Shrinkage?: Overall, the biopharmaceutical pipeline of products in development may no longer be signifi cantly expanding and, if anything, may be somewhat contracted. Most companies are now concentrating and devoting their resources to fewer products in development and devoting more concentrated development efforts on these. Whether this concentration on fewer products will result in getting more and more profi table products more rapidly to market remains to be seen.
• Single-use/disposable Equipment: The trend towards adoption of single-use equipment continues, with continued rapid changes in this market projected. Single-use equipment, particularly for upstream manufacture (e.g., bioreactors), now thoroughly dominates pre-commercial, i.e., small- to mid-scale R&D and trials supply manufacture, while fi xed stainless
AnnualRep_15.indd 42AnnualRep_15.indd 42 6/5/15 1:10 PM6/5/15 1:10 PM

©2015 BIOPLAN ASSOCIATES, INC. • NO UNAUTHORIZED REPRODUCTION PERMITTED • ALL RIGHTS RESERVED 43
CHAPTER 1: INTRODUCTION AND DISCUSSION
steel equipment continues to thoroughly dominate commercial-scale manufacturing. There will be incredible growth in the single-use systems revenue as these systems start to be used for commercial manufacture.
• Bioprocessing Continues to Improve: The slow but steady increase in expression titers and purifi cation yields continue, with incremental improvements in host cell lines, culture media, cell line engineering, expression systems, vectors, promoters, etc. Also, new downstream technologies are approaching adoption for commercial manufacturing, including new membrane fi ltration systems. More and better sensors and control equipment are also becoming available, with this remaining an area still needing much improvement. More single-use sensors will be entering the market. We can expect to see more biopharmaceuticals being approved and their markets supported by fully upstream single-use manufacturing.
• Biopharmaceutical R&D Outpacing Drug R&D: Much of the industry, particularly the largest pharmaceutical companies, is increasing its investment in biopharmaceutical R&D at the expense of drug (chemical substance-based) R&D. It is widely accepted that 40% or more of pharmaceutical industry R&D funding is now going for biopharmaceutical vs. drug development. This trend is continuing, and within a matter of years, likely 50% of pharmaceutical R&D could well be devoted to biopharmaceuticals.
• Downstream is Becoming Less of a Problem: Downstream purifi cation remains the most challenging part of bioprocessing, in the sense of still struggling to keep up with improved titers and higher output from upstream processing. But industry has adapted and is fi nding ways to increase downstream productivity. Purifi cation is no longer a continually-worsening bottleneck for much or most of the industry,
• Mammalian Manufacturing is Crowding-out Other Platforms: An increasing number of companies, particularly larger ones (including many industry leaders), are now standardizing their in-house bioprocessing to be solely or as much as possible mammalian-based, usually selecting a single or few CHO and perhaps other mammalian cell line-based manufacturing platforms. This is even done where microbial manufacture would be more effi cient. Companies clearly prefer the fl exibility and cost-savings single-use systems provide, and have little interest in using microbial platforms that continue to require use of fi xed stainless steel bioreactors and other equipment.
• Microbial Single-use Systems are Coming: Several major bioprocessing equipment companies have recently introduced next-generation single-use microbial bioreactors. This trend will continue.
• Modular Bioprocessing Facilities are Coming: Multiple bioprocessing equipment, technology developers and vendors are developing modular approaches to bioprocessing. Construction of new bioprocessing facilities, even for commercial manufacture, can be completed in days or weeks. Companies will be able to assemble bioprocessing systems using off-the-shelf or customized modules ready for plug-and-play with other modules. This modular trend will likely accelerate worldwide proliferation of commercial manufacturing, including to lesser-developed countries.
• Biosimilars are Coming, Including Finally to the U.S.: FDA just recently approved its fi rst biosimilar product. There is a very healthy pipeline of biosimilar (and biobetter) products in development targeted for the U.S., EU and other major markets (see www.biosimilars.com). This includes nearly 700 biosimilars and ~475 biobetters in development, a total of nearly 1,200 follow-on products in the development pipeline for over 100 currently-marketed biopharmaceuticals
AnnualRep_15.indd 43AnnualRep_15.indd 43 6/5/15 1:10 PM6/5/15 1:10 PM

Report and Survey of Biopharmaceutical Manufacturing Capacity and Production
WWW.BIOPLANASSOCIATES.COM44
Cost-containment and Controls: The past year was another rather quiet year in the U.S. and most other major markets in terms of new calls for and implementation of cost-containment measures or cost controls for pharmaceuticals, including biopharmaceuticals. But in some other countries, cost containment and government-directed cost controls continue to adversely affect biopharmaceuticals. As biosimilars become available, much as with generic drugs, U.S. insurers will surely force physicians, pharmacists and consumers to use these rather than more expensive innovator products.
• Manufacture in Developing Countries is Increasing: Biopharmaceutical manufacture outside of the usual major market countries is increasing, as indicated by BioPlan’s Top 1000 Global Biopharmaceutical Facilities Index (www.top1000bio.com), which ranks facilities worldwide in terms of known or estimated capacity, employment, and production. Much new and increased capacity is being added internationally, with biopharmaceutical markets in many developing countries rapidly growing and domestic/regional companies increasingly serving these markets, often with biogeneric copies of innovator products. Lesser-developed countries’ governments are increasingly seeking to assure domestic manufacture of biopharmaceuticals being sold in their markets.
• Worldwide Standardization of Manufacturing and Products: Particularly with larger companies, as more biopharmaceutical manufacturing is performed worldwide, companies are working to standardize their products and manufacturing processes on a worldwide basis. For many, this includes having 2nd- or even 3rd-source facilities either actively manufacturing or serving as backups. Adoption of single-use and modular bioprocessing systems for commercial manufacturing will accelerate this trend.
Conclusions: Overall, 2015, like 2014 and other recent years, is fully expected to be a good year for the biotechnology and biopharmaceutical industries, with these growing and well-positioned for solid future growth.
AnnualRep_15.indd 44AnnualRep_15.indd 44 6/5/15 1:10 PM6/5/15 1:10 PM

©2015 BIOPLAN ASSOCIATES, INC. • NO UNAUTHORIZED REPRODUCTION PERMITTED • ALL RIGHTS RESERVED 45
CHAPTER 2: OVERVIEW OF CRITICAL ISSUES IN BIOPROCESSING
This year we include a series of monographs that cover current issues facing bioprocessing today. These topics include:
2-1 Protein A Resins Continue to Serve Monoclonal Antibodies Manufacture Well, While Incremental Improvements Continue
2-2 Biosimilars: Review of Progress in 2014
2-3 Bioassays: A Critical and Commonly Outsourced Part of Biopharmaceutical Development
2-4 Facility Contamination: Behavioral-Based Intervention
2-5 Alternatives to Protein A
2-6 The Use of Membrane Chromatography throughout a Product’s Life Cycles
2-7 Continuous Bioprocessing and Perfusion: Single-use Technology Aiding to Increase Adoption
2-8 Bioprocessing Equipment and Service Supplier Mergers and Acquisitions, 2014
2-9 The Bioprocessing Equipment Supply Chain: The Materials Used Are the Weakest Link
C H A P T E R 2:O V E R V I E W O F C R I T I C A L I S S U E S I N B I O P R O C E S S I N G
AnnualRep_15.indd 45AnnualRep_15.indd 45 6/5/15 1:10 PM6/5/15 1:10 PM

For Ordering Information on the Full Report, ContactBioPlan Associates, Inc.301-921-5979www.bioplanassociates.com/12th

1.03”
12th Annual • Report and Survey of Biopharmaceutical Manufacturing Capacity and Production
Copyright © 2015 by BioPlan Associates, Inc.
T W E L F T H A N N U A L
Report and Survey of Biopharmaceutical Manufacturing Capacity and ProductionAnother report in the BioPlan Associates, Inc.’s biopharmaceutical series:
■ www.top1000bio.com Global analysis and ranking of the top 1000 global biomanufacturing facilities’ capacity, employment and pipelines
■ Biopharmaceutical Expression Systems and Genetic Engineering Tech-nologies
■ Advances in Biopharmaceutical Manufacturing and Scale-up Produc-tion, 2nd Ed, American Society for Microbiology
■ Biopharmaceutical Products in the U.S. and European Markets, 6th Ed■ Advances in Biopharmaceutical Technology in China■ Advances in Biopharmaceutical Technology in India■ Top 60 Biopharmaceutical Organizations in China■ Top 60 Biopharmaceutical Organizations in India■ Quick Guide to Clinical Trials■ Quick Guide to Biotechnology in the Middle East■ Quick Guide to Biofuels
The 12th Annual Report and Survey of Biopharmaceutical Manufacturing Capacity and Production is the most recent study of biotherapeutic develop-ers and contract manufacturing organizations’ current and projected future capacity and production. The survey includes responses from 237 responsible individuals at biopharmaceutical manufacturers and contract manufacturing organizations from 28 countries. The survey methodology includes input from an additional 164 direct suppliers of raw materials, services, and equipment to this industry. In addition to current capacity issues, this study covers down-stream processing problems, new technologies, expression systems, quality initiatives, human resources and training needs of biopharmaceutical manufac-turers, growth rates of suppliers to this industry, and many other areas.
April 2015ISBN 978-1-934106-27-3
A p r i l 2 0 1 5
T W E L F T H A N N U A L
Report and Survey of Biopharmaceutical Manufacturing
Capacity and ProductionA Study of Biotherapeutic
Developers and Contract Manufacturing
Organizations
associates, inc.
9 781934 106273
ISBN 978-1-934106-27-3


![Review Viral clearance for biopharmaceutical downstream ... · Viral clearance for biopharmaceutical downstream processes ... [13]. Hence a panel of ... Viral clearance for biopharmaceutical](https://img.dokumen.tips/doc/110x75/5ad5f65c7f8b9a5d058dd2b7/review-viral-clearance-for-biopharmaceutical-downstream-clearance-for-biopharmaceutical.jpg)