Embed Size (px)
Citation preview

The TurnaroundThe TurnaroundExperienceExperience
Real-world Lessons inRevitalizing Corporations and
Organizations
Frederick M. ZimmermanUniversity of St. Thomas
St. Paul, Minnesota
The Turnaround Experience: Real World Lessons in Revitalizing Corporations and Organizations
-5
-4
-3
-2
-1
0
1
2
3
4
5
6
7
8
9
10
11
12
13
14
0
500
1,000
1,500
2,000
2,500
Revenue & Cost in $ BillionsBy Virtual Year of Turnaround

Copyright Information
The Turnaround Experience: Real-world Lessons in Revitalizing Corporations and Organizations is copyrighted by the author Frederick M. Zimmerman.
The Turnaround Experience: Real-world Lessons in RevitalizingCorporations by Frederick M. Zimmerman was originally published byMcGraw-Hill in 1991. After the book went out of print after two printings,the author repurchased the copyright from McGraw-Hill in 1996. TheTurnaround Experience: Real-world Lessons in Revitalizing Corporations iscopyrighted material but permission is made available for single copying foranyone who wants to use it.
If there are question, the author can be contacted at 612-867-8368 or [email protected].
Frederick M. Zimmerman
14860 Lloyds Drive
Minnetonka, Minnesota 55345
July 14, 2011
The ISBN Number is 978-0-9839035-4-3
ii
To
Joanell Eleanor Felker Zimmerman
Frederick Josef Zimmerman
Carita Michelle Zimmerman
Christina Joanell Zimmerman
Brigitte Aimee Zimmerman
Hans Anthony Zimmerman
and
all of the people who have tried
to do their best
including
Charles Nash, Walter Chrysler, Henry Leland,George Romney,
Fred Zeder, Hans Mathias, Douglas Fraser, Dr. John Cich,
Hal Sperlich, Charles Wiman, Ray Kline, Bill Laughlin, Jim Russell,
Karl Hohlmaier, John Povolny, Tom Rowe, Jim Boaz, Bud Trisko,
Paul Moor, Lillian Gilbreth, Bud Ruvelson, Frank Gilbreth,
Larry Horsch, Mary Parker Follett, Dwight Jereczek, Denny Earley,
Ed Barker, Dr. Stacy Roback, Harold Steele, Rick Passek,
Dan Carroll, John Kraemer, Tom Perry, John Kokesh,
Steve Helmueller, Bruce Hertzke, John Kreiner, Robert L. Nichols,
Dr. James Sidman, Dr. Susan Sencer, John Walker, John Povolny,
Glen Thommes, Don Stolz, Clarence Shallbetter, Franz Mueller,
Bruce Erickson, Ray Willis, Marty Swerin, John Adams,
Francis W. How, Lee Radermacher, Mary Ann Savage,
Judith Adams, Ronaldo Custodio, Gary King, Rahn Worcuff,
Jean-Luc LaHouze, Rev. Joseph Baglio, Barbara Shallbetter,
Lee Lucas, Mel Hazelwood, Dan Stenoien, Tom Glisczinski,
George Gleeson, Fred Wagner,, Lillian Zimmerman,
Frederick Otto Zimmerman, Ruth N. Zimmerman,
and all of the doctors, nurses and staff at
Minneapolis Childrens Hospital
The Turnaround Experience: Real World Lessons in Revitalizing Corporations and Organizations
About the Author
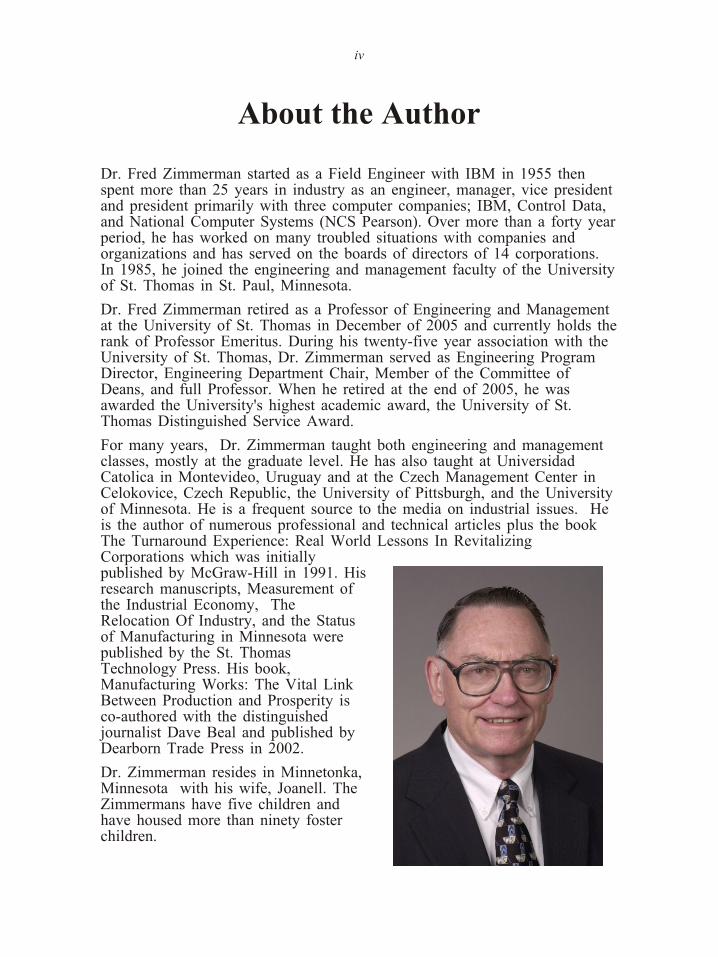
Dr. Fred Zimmerman started as a Field Engineer with IBM in 1955 thenspent more than 25 years in industry as an engineer, manager, vice president and president primarily with three computer companies; IBM, Control Data,and National Computer Systems (NCS Pearson). Over more than a forty year period, he has worked on many troubled situations with companies andorganizations and has served on the boards of directors of 14 corporations.In 1985, he joined the engineering and management faculty of the University of St. Thomas in St. Paul, Minnesota.
Dr. Fred Zimmerman retired as a Professor of Engineering and Managementat the University of St. Thomas in December of 2005 and currently holds the rank of Professor Emeritus. During his twenty-five year association with theUniversity of St. Thomas, Dr. Zimmerman served as Engineering ProgramDirector, Engineering Department Chair, Member of the Committee of Deans, and full Professor. When he retired at the end of 2005, he wasawarded the University's highest academic award, the University of St.Thomas Distinguished Service Award.
For many years, Dr. Zimmerman taught both engineering and managementclasses, mostly at the graduate level. He has also taught at UniversidadCatolica in Montevideo, Uruguay and at the Czech Management Center inCelokovice, Czech Republic, the University of Pittsburgh, and the University of Minnesota. He is a frequent source to the media on industrial issues. Heis the author of numerous professional and technical articles plus the bookThe Turnaround Experience: Real World Lessons In RevitalizingCorporations which was initiallypublished by McGraw-Hill in 1991. His research manuscripts, Measurement ofthe Industrial Economy, TheRelocation Of Industry, and the Statusof Manufacturing in Minnesota werepublished by the St. ThomasTechnology Press. His book,Manufacturing Works: The Vital LinkBetween Production and Prosperity isco-authored with the distinguishedjournalist Dave Beal and published byDearborn Trade Press in 2002.
Dr. Zimmerman resides in Minnetonka,Minnesota with his wife, Joanell. TheZimmermans have five children andhave housed more than ninety fosterchildren.
iv
The Turnaround Experience: Real World Lessons in Revitalizing Corporations and Organizations
Table of Contents
Copyright Information . . . . . . . . . . . . . . . . . . . . . . . . . . . . ii
About the Author. . . . . . . . . . . . . . . . . . . . . . . . . . . . . . iv
Preface . . . . . . . . . . . . . . . . . . . . . . . . . . . . . . . . . . 1
Acknowledgments . . . . . . . . . . . . . . . . . . . . . . . . . . . . . . 2
Introduction . . . . . . . . . . . . . . . . . . . . . . . . . . . . . . . . 4Manufacturing Still Matters . . . . . . . . . . . . . . . . . . . . . . . 4How Do Firms Turn Around? . . . . . . . . . . . . . . . . . . . . . . 8
The Individual Firm and the Turnaround Process · · · · · · · · 13
Chapter 1 — Three Key Factors in Successful Turnarounds . . . . . . . . . . . 15Tactics of Low-Cost operation . . . . . . . . . . . . . . . . . . . . . 17Tactics of Product differentiation . . . . . . . . . . . . . . . . . . . . 18Tactics of Leadership . . . . . . . . . . . . . . . . . . . . . . . . . 19
Chapter 2 — Recognizing a Turnaround Situation . . . . . . . . . . . . . . . 22Signs of decline . . . . . . . . . . . . . . . . . . . . . . . . . . . 22Recognizing a Turnaround Situation . . . . . . . . . . . . . . . . . . . 25The Stages of the Turnaround process . . . . . . . . . . . . . . . . . . 26
Chapter 3 — Profit Patterns in Successful and Unsuccessful Turnarounds . . . . . 30Selection of Turnaround Cases . . . . . . . . . . . . . . . . . . . . . 30Criteria for Success: Lasting Performance . . . . . . . . . . . . . . . . 31Profit Patterns in Successful and Unsuccessful Turnarounds . . . . . . . . . 32Practical Lessons on Profit patterns . . . . . . . . . . . . . . . . . . . 35
The Strategic advantage of Low-Cost operation · · · · · · · · · 37
Chapter 4 — Achieving Operational efficiency . . . . . . . . . . . . . . . . . 41The Economics of Breaking even . . . . . . . . . . . . . . . . . . . . 44The Strategic advantage of Upside and Downside Efficiencies . . . . . . . . 53Low-Cost Operation and Product Differentiation Interrelated · · · · · · · · 55Practical Lessons on Operational efficiency . . . . . . . . . . . . . . . . 56Case Histories· · · · · · · · · · · · · · · · · · · · · · · · · · 57
Case 1 — Masters of Production at Buick . . . . . . . . . . . . . 57Case 2 — The Harvesting of International Harvester . . . . . . . . . . 64
Chapter 5 — Achieving and Sustaining Modest Overhead . . . . . . . . . . . 72Expenses unrelated to What the Customer Is Buying . . . . . . . . . . . . 72Attaining Inventory efficiency . . . . . . . . . . . . . . . . . . . . . 80Inventory efficiency and Turnaround Success . . . . . . . . . . . . . . . 81Practical Lessons on Modest overhead . . . . . . . . . . . . . . . . . . 85Case Histories . . . . . . . . . . . . . . . . . . . . . . . . . . . . 85
Case 3 — Professional Frugality at Nash . . . . . . . . . . . . . . 87Case 4 — Majestic Laxity at the Willys-Overland Company
Chapter 6 — Lowering Cost through Design . . . . . . . . . . . . . . . . . 100Designing for Manufacturability . . . . . . . . . . . . . . . . . . . . 102

vi
Practical Lessons on Lowering Cost through Design. . . . . . . . . . . . 106Case History . . . . . . . . . . . . . . . . . . . . . . . . . . . . 106
Case 5 — Making the Most of American Motors. . . . . . . . . . . 106Author Fred Zimmerman and his wife Joanell with three of their grandchildren inthe family 1966 Rambler Convertible · · · · · · · · · · · · · · · · 114
The Value of Product Differentiation · · · · · · · · · · · · · 115
Chapter 7 — Developing Distinguishing Product Features . . . . . . . . . . . 118Managing Development for Future Trends · · · · · · · · · · · · · · 119Distinguishing Features and Turnaround Success . . . . . . . . . . . . . 125Practical Lesson in Distinguishing Product Features · · · · · · · · · · · 131Case Histories . . . . . . . . . . . . . . . . . . . . . . . . . . . 131
Case 6 — Best in Class at Ford. . . . . . . . . . . . . . . . . . 132
Case 7 — Cosmetic Surgery at Kaiser-Frazer . . . . . . . . . . . . 139
Chapter 8 — Achieving Product Quality . . . . . . . . . . . . . . . . . . . 145Quality in the Product . . . . . . . . . . . . . . . . . . . . . . . . 146Quality in the Process . . . . . . . . . . . . . . . . . . . . . . . . 147Practical Lessons on Product Quality . . . . . . . . . . . . . . . . . . 148Case Histories . . . . . . . . . . . . . . . . . . . . . . . . . . . 149
Case 8 — Getting It Right at Cadillac . . . . . . . . . . . . . . . 150Case 9 — Leaving It Wrong at Hudson . . . . . . . . . . . . . . 155
Chapter 9 — Sustaining Market Continuity . . . . . . . . . . . . . . . . . 163Avoiding Strategic drift . . . . . . . . . . . . . . . . . . . . . . . 163Servicing the Declining Market . . . . . . . . . . . . . . . . . . . . 166Practical Lessons on Market Continuity · · · · · · · · · · · · · · · 169Case Histories . . . . . . . . . . . . . . . . . . . . . . . . . . . 169
Case 10 — Saving the Best of Chrysler Corporation . . . . . . . . . 170Case 11 — Market Vacillation at AMC/Renault . . . . . . . . . . . 175
Leadership and the Turnaround Organization · · · · · · · · · 181
Chapter 10 — Outfitting the Management Team . . . . . . . . . . . . . . . 183The Management Team . . . . . . . . . . . . . . . . . . . . . . . 183Personal Characteristics . . . . . . . . . . . . . . . . . . . . . . . 189Practical Lessons on Outfitting the Management Team. . . . . . . . . . . 193Case Histories . . . . . . . . . . . . . . . . . . . . . . . . . . . 194
Case 12 — Professionals in Place at Maxwell-Chalmers . . . . . . . . 194Case 13 — Witless Dissipation at Allis-Chalmers . . . . . . . . . . 202
Chapter 11 — Focusing on Present Operations . . . . . . . . . . . . . . . . 209Focus on Needs in Turnarounds . . . . . . . . . . . . . . . . . . . . 210Styles of Decision Making in the Turnaround process . . . . . . . . . . . 213Organizational Change . . . . . . . . . . . . . . . . . . . . . . . . 214Practical Lessons in Focusing on Present Operations . . . . . . . . . . . 219Case Histories · · · · · · · · · · · · · · · · · · · · · · · · · 220
Case 14 — Cars for the Methodists at Packard . . . . . . . . . . . 220Case 15 — Last Hurrah in South Bend . . . . . . . . . . . . . . . 227
Chapter 12 — Fair Play . . . . . . . . . . . . . . . . . . . . . . . . . . 235

The Turnaround Experience: Real World Lessons in Revitalizing Corporations and Organizations
Fairness As Discussed in the Earlier Literature on Management · · · · · · 236The Manager in an Exemplary Role . . . . . . . . . . . . . . . . . . 239Fair play Extended outside the Firm . . . . . . . . . . . . . . . . . . 240Practical Lessons in Fair play . . . . . . . . . . . . . . . . . . . . . 241Case History· · · · · · · · · · · · · · · · · · · · · · · · · · 243
Case 16 — Midwestern Ethic at Deere . . . . . . . . . . . . . . 2431951 John Deere B Owned by the author . . . . . . . . . . . . . . . . 249
The Turnaround Experience Looking Ahead · · · · · · · · · · 251
Chapter 13 — The Strategic Profiles of Turnaround Cases . . . . . . . . . . . 253Successful Turnaround Profiles . . . . . . . . . . . . . . . . . . . . 253Strategic Positioning for Survival · · · · · · · · · · · · · · · · · · 254Summary of Findings . . . . . . . . . . . . . . . . . . . . . . . . 259Generality of the Findings . . . . . . . . . . . . . . . . . . . . . . 261Alternative Explanations . . . . . . . . . . . . . . . . . . . . . . . 262Need for Improved Analysis of the Declining Firm . . . . . . . . . . . . 264The Turnaround Framework . . . . . . . . . . . . . . . . . . . . . 265A Final Caveat · · · · · · · · · · · · · · · · · · · · · · · · · 266
Chapter 14 — Real or Illusory Leadership? . . . . . . . . . . . . . . . . . 267Quality in the Managerial Process . . . . . . . . . . . . . . . . . . . 267Does Management Understand Its Job? . . . . . . . . . . . . . . . . . 268Turnaround Management as a Skill · · · · · · · · · · · · · · · · · 273
Chapter 15 — Recommendations for the Future . . . . . . . . . . . . . . . 275Recommendations for Businesses Involved in Turnarounds . . . . . . . . . 276Recommendations for Boards of Directors . . . . . . . . . . . . . . . . 278Recommendations for Business Schools . . . . . . . . . . . . . . . . . 280Public Policy Recommendations . . . . . . . . . . . . . . . . . . . . 282Conclusion. . . . . . . . . . . . . . . . . . . . . . . . . . . . . 288
Appendix · · · · · · · · · · · · · · · · · · · · · · · · 291Building the Comparative Database . . . . . . . . . . . . . . . . . . 291Examining the Variables in Turnaround Success . . . . . . . . . . . . . 292Bibliography · · · · · · · · · · · · · · · · · · · · · · · · · · 299
Preface
The Turnaround Experience is an account of a longitudinal study of 16business turnaround endeavors; successful and unsuccessful. The strategiesemployed in successful turnarounds and the managerial skills and charactertraits present among successful turnaround agents are compared andcontrasted with those of unsuccessful turnaround efforts.
The proposition examined here is that the successful business strategy forturnarounds focuses on improving a firm’s effectiveness as a low-costproducer of increasingly differentiated quality products. A corollary to this is that successful turnarounds involve leaders who focus on operations, possessstrong ethical values, have good personal reputations, and follow theprinciples of fair play in dealing with employees, creditors, suppliers, andcustomers.
Sixteen attempted turnarounds were examined in this study. The cases weredrawn from occurrences during the period from 1902 to 1988 in theautomobile and agricultural equipment industries. Data covering many years,usually 20 years, were examined for each case. Specific criteria andmeasurement procedures were used to select the cases for study and toclassify the cases as successful or unsuccessful. Quantitative and narrativeinformation, business histories, and interviews were used to examinestrategies and key functional operations, including marketing, manufacturing,product development, and finance.
There were several key findings: Successful turnarounds often experiencedmore dramatic initial declines in revenue and deeper loss rates thanunsuccessful turnarounds did. Unsuccessful firms were less severely affectedby dramatic downturns but declined gradually many years. Successfulturnarounds were much more proficient in manufacturing efficiency andproduct development than were the unsuccessful cases. Most successfulturnaround agents were product people or engineers and had extensiveexperience in the industry in question. Unsuccessful turnarounds were morelikely to be head marketing or finance people who had comparatively littleexperience in the industry. Successful turnarounds usually involved constantincremental improvement and focused on operational issues. Unsuccessfulturnaround attempts often involved major dramatic shifts in products,businesses, or markets served. Successful turnaround agent able to instillvalues, they reduced their own compensation during periods of crisis, andthey shared credit for accomplishments with others. Unsuccessful turnaroundagents generally did not exhibit these characteristics.
Frederick M. Zimmerman
1

Acknowledgments
Many people have played roles in the creation of this manuscript. Theprocess began with my father, Frederick Otto Zimmerman, who found itnecessary to leave engineering school during the Great Depression to become an automobile mechanic. Later, he became an industrial arts teacher and later a quality assurance specialist. His deep understanding of product qualitycoupled with his understandings of the technical attributes of the cars herepaired instilled a certain curiosity as to the link between manufacturingmethods and economic survival.
Mom, Ruth N. Zimmerman, instilled in all of us the responsibilities of caring for and preserving what we have; even the industries that employ us. Herfrugal background and her inherent skills of waste elimination were bothhelpful during my years in industry.
My early years with IBM; in three branch offices, a large manufacturingplant and the headquarters in New York; exposed me to excellent leadershipprovided by a highly capable management team that was fully dedicated todifferentiated products, low cost of operations, organizational professionalism and fair play on the part of both managers and workers. I am particularlyindebted to C. P. Trisko, Ralph Pickard, Denny Early, Lee Lucas, Ray Kline and Jim Boaz for their constant guidance and exemplary leadership.
The difficult recession of the early 1980’s, when I was serving as CEO ofan industrial automation company, impressed upon me the need tounderstand more about the process of industrial survival. We did manage tosell some systems and the company continued. But, the experience left meconvinced that we needed a more scientific understanding of the process ofsurvival. In this regard, I am indebted to two of our investors, Larry Horschand Bud Ruvelson, whose sound advice, constant wisdom and ethicalstandards encouraged the firm to make some considerable progress duringthe most difficult economic times since the 1930’s.
In 1982, I returned to the University of Minnesota to complete graduatework I had started earlier. By chance, the doctoral program office assignedProfessor Andrew H. Van de Ven as my advisor. I cannot fully express mygratitude. As an older graduate student with mainly industrial experience, Iwas ill-equipped to effectively handle the assignments before me. ProfessorVan de Ven was not only patient, he was inspirational. His own deepinsights into organizational behavior, along with his thorough knowledge ofthe literature in the field and his own observations as a corporate boardmember, provided a source of new information to complement my ownobservation of the industrial world. In industry or in academe, I have metfew people I respect more. I also wish to extend my thanks to my otheradvisors, Professor W. Bruce Erickson, Professor Raymond Willis, ProfessorJim Simler, Professor George Greene (who really had the idea for this
The Turnaround Experience: Real World Lessons in Revitalizing Corporations and Organizations

manuscript) and to Professor A. K. Wickesberg (who instilled in all of us an appreciation for historical study of the process of management).
I am also indebted to my old friends, John Adams and Clarence Shallbetterfor sharing their own perceptions of economic processes and the role thatvalues and character traits play in the unfolding of key events.
I also wish to thank my current colleagues at the University of St. Thomas,particularly John for his added insights stemming from his years ofexperience as a Vice President of 3M, Marlene Houliston and SteveHelmueller for handling so many of the departmental responsibilities duringthe preparation of this report. Special thanks are in order for MarilynMcGee-Powell, Editor of the Journal of Applied Manufacturing Systems, forher patient and repeated editing of this manuscript.
Most of all, I wish to thank my wife, Joanell, who endured manyresponsibilities associated with an extended illness in our family and stillremained cheerful and supportive while her husband completed this work. As a mother of five wonderful children, and a foster mother to more than eighty other additional children, Joanell is a master of production in her own right.
3

Introduction
Over the past decade, U.S. trade deficits have run at record levels,sometimes $18 billion in a single month. Bank failures have reacheddepression levels. The agricultural sector has experienced severe decline.Several key industries continue to operate in a depressed state and are nowjoined by some of the previously glamorous high-tech industries. Tradedeficits have improved only marginally in spite of a shrinking dollar whilecapital markets have become increasingly volatile. Unprecedented consumerdebt, government deficits several times the amounts formerly regarded asastronomical, the quick transition of the United States from the world’slargest creditor to its largest debtor, volatile capital markets, monumentaltrade deficits, and a plethora of unfriendly and under analyzed corporatetakeovers, all provide testimony that our world economy, though prosperous,lacks equilibrium.
Manufacturing Still Matters
As with many other sociotechnical system problems, questions surfaceregarding the cause of economic difficulties. Is it the lagging character ofproduction capability? Or, is it the increasing burden it must bear? Shouldproduction be increased? Or, is it necessary to reduce the expenditures of the nonproducing part of the system? Perhaps most important, is the presentsituation largely a matter for public policy or are the remedies best left toindividual managers and companies?
Those sharing the practical view of economics argue that the performance of the entire economy is highly influenced by the performance of individualfirms. To improve the U.S. balance of payments, U.S. products have to bebetter and must be produced at lower cost. These are the practicalities thatguide firms. The key action variables are individual characteristics of specific firms and they include such basics as product quality, production efficiency,organization, and leadership. Advocates of this perspective contend that there have been few across_the_board improvements in the U.S. economy. Whathas been accomplished is due to the competitive effectiveness of individualfirms.
The deteriorating U.S. balance of payments during recent years has drawnparticular attention to tangible production as the functional area of theeconomy most crucial for survival. Manufacturing and other forms oftangible production, along with essential maintenance services, provide thereal economic wealth of the nation. Cohen and Zysman suggest that 40 to 60 percent of all jobs in the United States depend upon manufacturing alone.The following conclusions reflect their analysis:
The choices we make as a nation, the policies and priorities we choose, will determine whether the transition marks the end of a half century of
The Turnaround Experience: Real World Lessons in Revitalizing Corporations and Organizations

American power and industrial leadership.... The argument of this book isstraightforward. It can be summed up as follows:
1. There is no such thing as a postindustrial economy. Manufacturing matters. Thewealth and power of the United States depends upon maintaining mastery andcontrol of production.?
2. Changes in the extent and forms of international competition coupled with the massapplication of microelectronics_based technologies are revolutionizing production.The United States is not doing very well in this new international competition.
3. A flight offshore for cheap labor will not provide a winning long-term strategy; after a few rounds of product and process innovation, it will just compound the problem.A strategy of trying to hold onto the high value-added activities whilesubcontracting production to foreign producers who have a manufacturing edgedefines the fast track to disaster. Over time American firms will not be able tocontrol what they cannot produce. (Cohen and Zysman 1987)*
*Adapted from Manufacturing Matters: The Myth of the Post-industrial Economy byStephen S. Cohen and John Zysman — Copyright 1987 by Basic Books, Inc.Reprinted by permission of Basic Books of Harper Collins Publishers Inc.
Some people suggest that the United States is so distinctive in the provisionof services that it can build a viable comparative advantage based onfinancial, accounting, and other professional services. This question has to be dealt with factually. The stresses placed on the industrial economy of theUnites States soon permeate the service economy — sometimes with evengreater ferocity. Only four of the world’s fifty largest banks are American.They do not compare well with those in other major industrial countries asthey are generally smaller and often lose money. The banking and financeindustry is, in general, becoming the object of grave concern and the security industry is retrenching. Accounting firms are facing greater fee sensitivity asthe shrinking number of separate corporations shop for greater value inaccounting services. Major insurance firms are worrisome because of theirheavy investments in junk bonds and overpriced office real estate. Highlyleveraged consolidation continues to take place in the transportationindustries. Even the nation’s colleges and universities request ever-increasing allocations from government as they simultaneously attempt to pass onrecord tuition increases to the customers.
The future of the economy of the United States is inescapably tied to theefficiency and quality of its tangible production. In the interest of economicstability, a more favorable balance between production and consumptionmust be developed.
Improving the U.S. Economy....One Company at a Time
If the service economy is not a meaningful substitute for a strong basiceconomy, then the United States must ensure that those industries engaged in tangible production (agriculture, construction, extraction, and manufacturing)are well positioned for the future. The variation in performance of individual firms is so extensive that it is meaningless to talk about national programs
5

when so many individual industrial companies produce low-quality goods attoo high a cost. No single macro policy can renew America’s competitivestrength__though some may be helpful. The most sensible economic policy is to gear for international competition by improving one company at a time.
Yet, because of differing perspectives, public policies have not alwaysfocused on improving the effectiveness of present industries. In response tothe strains on local economies, many industrial communities have adoptedvigorous programs to attract new industry to replace industrial jobs lostthrough plant closings or staff reductions. These programs are rarely helpful.Not enough industrial movement occurs to be significant, the approach doesnot build upon the strengths of the community, and it takes too long. Inorder to survive, steps must be taken that will ensure the competitiveness ofpresent industries. To achieve economic stability, we must develop theindustrial infrastructure of our respective countries one company at a time.
The development of industrial infrastructure one company at a time shouldbe a primary objective of corrective efforts. The U.S. trade deficit will notbe improved simply by changing the dollar’s value. During the past decade,the United States’ position in such critical products as machine tools hasdeclined substantially. In 1976, approximately 96 percent of the machinetools sold in the United States were made here. Recently the U.S. position in computerized precision machine tools declined to a small fraction of the total market. Similarly, as the American steel manufacturers shaved capacity, they also reduced the variety and sizes of steels and alloys provided. TheAmerican producer wishing to obtain specialty steels often must obtain themfrom overseas suppliers and at prices likely to increase in the future. For anincreasing number of crucial industrial components, only a few suppliers(and in some cases, only one supplier) remain in the United States.Unfortunately, the U.S. negative trade balance has persisted so long that theinfrastructures have shifted. Other countries now control productiontechnology and expertise. It took considerable time for us to lose thisproduction expertise. It will take some time for us to regain it. The recent“improvement” to an annualized deficit of over $100 billion, even during aperiod when the dollar has severely depreciated, is hardly a favorableindicator.
Competition in a Global Economy
Improvement in the U.S. balance of payments depends on the ability toimprove the competitive positions of the individual firms participating instrategically important industries. These influential strategic industries employ large numbers of people in activities related to the tangible production ofgoods (and services) most integral to the development of a strong industrialinfrastructure. It is not practical to regain prosperity by diversifying into new areas where we have little experience. Instead, world economies mustcultivate the skills necessary to restore the competitive edge of particularcompanies.
The Turnaround Experience: Real World Lessons in Revitalizing Corporations and Organizations
Improving the competitive position of the individual firm in strategicindustries is the key remedy to the faltering economies of developedcountries. As evidence for this proposition, we can observe what productsare imported and which are made in the United States. One can hardly findan American TV set or an American videocassette recorder, but importedelectric tools are quite rare. We are well aware of the penetration of theJapanese automobile, yet almost all U.S. major appliances are made here.The United States imports large quantities of textiles but not much carpet.When we examine the production processes employed in the manufacture ofthese various products, we see similarities between both imported anddomestically produced goods. The same sorts of stampings, die castings,wires, switches, transmissions, actuators, and finishes used in themanufacture of major appliances, where the U.S. has almost no imports, arealso used in automobiles where competition from imports is extensive. Small electric tools are made of some of the same materials and employ some ofthe same processes as do consumer electronics. Yet the United States makesmost of its electric tools and imports almost all its small appliances. Clearly, the United States has the engineering and scientific capability to produceproducts at favorable costs in markets where the country is not doing well.
When we examine the characteristics of the markets where the United States has not done well, we quite often find that even before imports, inefficientor untrustworthy producers of mediocre products dominated the market. Incontrast, the markets that have resisted imports are often populated bywell-trained, efficient producers of high-quality products who maintain goodrelations with employees, suppliers, creditors, and customers. We must askthe question: Do foreign producers target intriguing markets or ineffectivecompanies? Why should major industrial competitors from overseas tanglewith efficient producers such as Deere, Whirlpool Corporation, 3MCompany, Loctite Corporation, or the Boeing Company, when less capablecompetitors inhabit other markets?
Conditioning individual companies for global competition is crucial toindustrial survival. The threat to the viability of the company is a problem of social as well as economic concern. Few events destroy the dignity andself-confidence of people more than the loss of permanent employment. Asthe prospects for continued employment diminish, personal problems such asdrinking or family difficulties emerge where they had not existed previously. Unfortunately, as this investigation will show, business failures often have adisproportionate effect on people who have served their company for manyyears, are above 40 in age and, ironically, are the ones that the companiestried to keep until the very end because they were the best employees.
7

Turnarounds Are Multifaceted
The effect of business failure is widespread. Many other supplier and dealerorganizations are also affected, as are financial and service institutions. Thegeneral community is affected in that when major companies close, theaffordability of essential community services is inevitably reduced. Homeprices decline, thus limiting mobility and making it difficult for even themost talented individuals to seek employment opportunities in new locations. The special skills developed by individuals, often in response to companyneeds, are frequently of limited value to other employers. Even those whohave good work habits and valid training often have limited geographical oroccupational alternatives.
Companies rarely fail because of any one single cause. Inept companymanagement is certainly a factor in some situations. Though many variablesare involved in turnaround success or failure, competent management canimpact most of them. Management is the principal catalyst and the root ofultimate responsibility in the revival of troubled firms. But the workers,financial intermediaries, government, and the community also have theirresponsibilities. Characteristics of the economy, the quality and personaltraits of the people hired by the company, the degree of support from thecommunity, and many other factors help determine turnaround success.
Our understanding of turnarounds may involve unlearning some managerialconcepts as well as assimilating new ideas. For much of the period following World War II, American industry experienced an enviable competitivesituation. The rest of the industrial world was recovering from thedestruction of its physical plant and the maiming of its work force whileAmerican industry, less affected by the war, survived and prospered. Themanagerial practices and conventions that were utilized during this artificialperiod of prosperity are seldom useful during turnaround attempts. Anyanalysis of turnarounds must therefore include a review of those managerialpractices that were relevant during periods of less affluence (before 1940 and after 1980). Fortunately, some of the richest and most applicable managerialconcepts were developed during these periods and many of these wereuniquely American.
How Do Firms Turn Around?
Not all firms are in trouble. Some are doing well, even after experiencingsevere economic hardship. Yet, we have to respect the fact that the pace ofeconomic change is rapid. International Harvester went from 103,000employees to under 16,000 in less than 4 years. Computervision fell fromhaving record earnings and being the industry leader in one of America’smost emerging industries to a weak competitor with record losses in under 5 years. Control Data’s employment dropped approximately 40 percent in 4years. Several major industrial companies have become unwilling acquisitiontargets in part because it has been difficult for them to face globalcompetition on their own. Many companies have been impacted by the
The Turnaround Experience: Real World Lessons in Revitalizing Corporations and Organizations

economic stresses of the 1980s and before. Some have come back fromdisaster to become strong and viable world-class competitors, in some casesmuch stronger than before. Others have failed. There are many questionsregarding the causes of decline of individual firms and the turnaroundprocess. How does it happen? What kind of people achieve it? How manypeople are involved? What skills are necessary? What character traits arepresent? What resources are employed? How long does it take?
To the benefit of this inquiry, considerable research on turnaroundmanagement has already been conducted, and this research can be used as afoundation for further examination of the turnaround process. In addition,there have been many successful and unsuccessful attempts at rescuingcompanies facing economic stress and much can be learned by studyingprevious attempts. A more detailed comparison of both successful andunsuccessful turnaround attempts over longer periods of time should allow us to gather some insights into how individual companies either failed orrecovered.
The history of turnarounds is an encouraging one. All 16 companiesexamined here were in severe financial difficulty during critical periods oftheir history. Yet, one of these companies is now the largest in its industry,with nearly a 60 percent market share, and is known as one of the mostadvanced producers in the world. Another is the flagship line of one of theworld’s largest automobile producers. A third firm, after two narrow escapesfrom total disaster, became the most rapidly growing U.S. producer in itsindustry and operated at record profit levels for several years.
Other turnarounds were not successful. One failed turnaround attempt wasexperienced by a huge company that at one time was the fourth-largest firmin the country. Another firm survived two turnarounds and at one timeemerged as perhaps the most efficient producer in its industry but latersuccumbed to ineffective management practices 70 years after the firstturnaround and 30 years after the second. Sometimes, the turnaroundsshowed initial promise but did not last — usually because the practices thatenabled the company to turn around were forsaken at a later stage underdifferent management. The history of successful turnarounds provides manylessons for those involved in management generally. The practice ofmanagement can well benefit from a systematic review of past practices.
This analysis focuses on turnaround attempts in two manufacturingindustries: automobiles and agricultural equipment. There are some historicalreasons for choosing these two industries. The industries have some common traits in that they involve similar manufacturing skills, are reasonably capitalintensive, and were at similar stages of growth during the periods examined.However, a more powerful reason is because a great deal more informationwas available on the personal characteristics and abilities of the peopleinvolved in turnaround efforts in these two industries. Both the automotiveand agricultural equipment industries employ vast numbers of people, playmajor roles in the U.S. economy, and are currently faced with intense global competition.
9

While these automobile and agricultural equipment industries may besignificantly different from some other types of industries such as serviceindustries, during a period of crisis, all industries have common concerns.These concerns usually involve questions about productivity, quality,integrity, and managerial training and experience. It is our hope that thelessons learned by the companies presented here will be of use to firms inother industries as well so they too are well positioned for continued growth. Because turnarounds take some time to unfold, we chose to look at thesecompanies over a period of 20 years to fully understand the reasons behindsuccess or failure. What we found was that three key factors were evident in each of the success stories: (1) a low cost operation, (2) differentiatedproducts, and (3) quality of leadership.
The Turnaround Experience: Real World Lessons in Revitalizing Corporations and Organizations

Part 1
The Individual Firm and
the Turnaround Process
Companies do not have to fail. Even the most distressed companies canresurface to again become strong world-class competitors in their industries.If the survival of individual firms can be achieved, financial systems will bemore stable, workers will have greater security, shareholders will receive ayield on their life savings, governments can afford to operate, and managerswill achieve dignity commensurate with their performance. If the individualfirm does fail, everyone is affected—it is merely a question of degree.
Survival, however, is an active process involving new skills blended withhistorical expertise, new strategies based on previous successes, and newproducts to serve more competitive markets. Survival is virtually impossibleif nobody wants to change. Yet, too much change becomes traumatic anddysfunctional. Survival requires innovation, stamina, integrity, discipline,prudence, and sacrifice.
Too often, companies attempt to survive without modifying theirbehavior—an approach which most always ends in tragedy. Sometimes,companies delay too long waiting for a clearer picture of what should bedone—another disaster. Occasionally, too much change is introduced toosoon—a tactic which brings more confusion than progress. Other companiesapproach the turnaround process more systematically and achieve betterresults. Superior methods can save the firm. Inferior methods, employed atcritical times, can destroy it.
Although the lessons relating to turnarounds have been learned before andare consistent with established theories of management, a troubled situationalso carries with it some uniqueness and particular requirements. The skillsto manage adversity are not entirely commonplace. The sharp contrastsbetween successful and unsuccessful turnaround experiences, coupled withthe enormous social and political realities of a declining industrialinfrastructure, provide evidence that remedial management is a skill worthyof cultivation, a skill needed not only for companies, but also for societies.
Part 1 examines the process of turnaround within a practical framework.Chapter 1 briefly introduces three key factors to a successful turnaroundwhich should be of interest to managers, executives, board members, andemployees. Chapter 2 discusses some common characteristics of troubled
The Turnaround Experience: Real World Lessons in Revitalizing Corporations and Organizations

firms and suggests ways to recognize turnaround situations during earlierstages when actions have a greater potential for success. Chapter 3 examines the profit patterns of successful and unsuccessful firms in the automobile and agricultural equipment industries with the hope that the analysis will behelpful in other situations.
14

Chapter 1 — Three Key Factors inSuccessful Turnarounds
The practicing manager will be primarily interested in two basic questions: Is it possible for troubled companies to come back from difficulty to becomestrong economic contributors once again? How do they do it? The evidencegathered in this inquiry, along with the evidence gathered by others suggests that it is possible for troubled companies to turn around. The successfulcompanies studied here had no special advantages which were unavailable to the unsuccessful companies. Successes and failures emerged during the sameeconomic times. The successful and unsuccessful companies were serving the same industries and, in several cases, the unsuccessful firms were moreestablished. All experienced adversity. Yet, some companies found a way tosuccessfully emerge from adversity and others failed.
What the successful companies did to survive was a process oforganizational learning involving an intricate combination of strategy, thrift,technical expertise and industrial experience superimposed on a framework of traditional morality, personal integrity, and clearly articulated, focused ideals.
The general proposition advanced here is that a successfulbusiness turnaround involves improving the company'sposition as a low-cost provider of increasinglydifferentiated products and services, along with thenurturing of an appropriate turnaround organization which is competent, possesses industry-oriented technicalexpertise, and employs a general sense of fair play indealing with employees, creditors, suppliers, shareholders,and customers.
Successful turnarounds involve this very special form of leadership.
A more detailed description of the model being described is that successfulturnarounds are a function of three principal factors:
1. A strategy that focuses primarily on improving the firm's effectiveness as alow-cost operator. Low-cost operation implies the design of products formanufacturability, the attainment of high rates of manufacturing and inventory efficiency, and the containment of overhead costs to below industry levels.
2. A strategy that focuses at a later stage on improving the firm's effectivenessas a provider of increasingly differentiated products. Producing differentiatedproducts implies products with distinguishing features, high reliability, andsignificant performance, exceptional product quality, and the development oflong-term continuity with the markets being served so that productdifferentiation can be recognized by potential buyers.
The Turnaround Experience: Real World Lessons in Revitalizing Corporations and Organizations

3. Leadership involves turnaround agents who have significant experience in theindustry being served and in some technical function such as manufacturing or engineering, and have a major propensity to focus on operational issues suchas manufacturing, product development, and sales. Successful turnaroundagents tend to have longer term associations with the company and makeincremental changes based on information which is appropriate to thedecisions being made. Successful turnaround agents enjoy generally favorablepersonal reputations and employ a sense of fair play in dealing withemployees, creditors, suppliers, and customers, and focus intensely on theimportant operational questions that are pertinent to the business the firm is in at the time.
Figure 1-1 Framework of a Successful Turnaround Process provides avery brief outline of the turnaround process, including some of thesubelements of the three principal factors listed above.
16

Many successful turnarounds possessed all the subelements for a particularmajor factor such as low-cost operation or product differentiation, but someemployed different combinations of subelements to achieve turnaroundsuccess. Again, it must be emphasized that even the best executedturnarounds are seldom effective in every respect. Similarly, unsuccessfulturnarounds rarely fail in every respect. Turnarounds are a mixture ofhundreds of partially developed successes and failures with the successfulfirms being more thorough and consistent.
Tactics of Low-Cost operation
Operational efficiency
Operational efficiency refers to the amount of work that gets done in a day.General efficiency is required in all aspects of the organization, not justproduction. But, production efficiency relates keenly to the competitive edgeof the firm and delineates the importance of well-organized factories.Operational efficiency implies modern up-to-date equipment, the systematiclayout of production space, well-trained managers and workers, and otherfactors that relate to general efficiency.
Inventory efficiency
Inventory efficiency is the ability of a firm to produce and sell higheramounts of a product, generating more revenue from lower levels of on-hand inventory. It has too large an impact on cash flow and overall efficiency tobe considered a subset of more general operational efficiency. The oppositeoutcomes of the International Harvester and Chrysler turnarounds, whichoccurred at the same time and under the same economic conditions, providetestimony that inventory efficiency has its own particular importance.Production efficiency and inventory efficiency are often pursued as separateobjectives; it is not uncommon for a firm to achieve one without the other.Successful firms tend to achieve both, however.
Modest overhead
As measured in terms of percent expense to revenue, successful turnaroundcompanies spend significantly less money on non-cost-of-sales expense thanunsuccessful companies. Successful firms generally have a widespreadreputation for frugality, operate with small central staffs, and spurn excessive spending on personal embellishments and expensive travel. In contrast,unsuccessful firms often spend large amounts of money on items not directly related to what the customer was buying, the product.
Low Cost through Design
The Turnaround Experience: Real World Lessons in Revitalizing Corporations and Organizations

Successful firms systematically design products (and services) to be produced (and delivered) at low cost. Proactive efforts aimed at the reduction ofproduct cost through design form an essential tactic if profits are to beimproved. Effective turnaround managers understand production processeswell and insist that product design and production capability interact withone another to achieve an enhanced competitive position. In contrast,management of unsuccessful turnarounds treat manufacturing more as anafterthought and less as a proactive competitive force. Difficulties with themanufacturability of specific products has contributed to the demise of someof the largest industrial firms in the United States.
The commonality of component parts is a meaningful factor in achievinglow-cost operation, and successful firms often have programs to utilizecommon component parts in the manufacture of several models; after theproducts themselves are designed for lower cost.
Tactics of Product differentiation
Distinguishing Features
In order for customers to be attracted, the product must possessdistinguishing features. Successful companies field products customers need,products often created through a blend of competent technical research andongoing familiarity with customers. Unsuccessful companies offer productsthat can be sold, but unfortunately, they cannot always be sold withsufficient margin during all economic periods. Successful turnaroundcompanies offer innovative well-tested features which are introduced to themarket in sync with or slightly ahead of emerging market trends. In contrast, unsuccessful companies offer “me too” products or, in some cases, productswith substantial negative features.
Reliability and Performance
Some products do not do enough for the customer, for periods that are longenough to secure repeat business. Successful companies ensure that theirproducts perform at levels beyond what the customer is expecting and thatthe products are reliable enough to continue performing for long periods oftime. The products of unsuccessful companies either do not meet customerexpectations or do so for short periods and then wear out.
Product Quality
Many companies fail simply because their products are simply not goodenough to effectively compete in world markets. They are able to sell a fewproducts in good times but suffer acutely when times are bad. At successfulcompanies, product quality is actively managed and constantly improved
18

even if it is already the best in the industry. At unsuccessful companies,product quality is assumed to be good, but nobody checks for sure.
Market Continuity
Market continuity can be briefly described as the predisposition of the firmto focus on providing products for one very familiar market beforeexpanding into any new markets or into other new activities. Successfulfirms work very hard to remain familiar to their historical customers andthey avoid making changes that are confusing to customers. Unsuccessfulfirms often jump from one market niche to another or into altogether newmarkets, all without much success while neglecting their mainline businesses. They allow competitors to exploit their historical markets.
Tactics of Leadership
Focus on Operations
Focus on operations can be described as the propensity to focus onoperational problems such as production cost, product quality, customersatisfaction and short-term sales. Unsuccessful firms stray away fromday-to-day operational issues to acquisitions, divestitures, poorly thought-outexpansion, politics, entertainment, or other matters which are either lessimmediate or else totally unrelated to the firms' present business.
Managerial Stability
Because of the long-drawn-out nature of the turnaround process, managerialstability is often present among successful turnaround cases while instabilityand internal political turmoil often characterize failure. Most successfulturnarounds involve a top-management team that is essentially constant for at least 7 or 8 years following the period of crisis. Unsuccessful firms havefrequent managerial changes, sometimes even when progress is being made.
Experience in the Industry Being Served
The evidence is quite strong that those who head successful turnaroundefforts have vast experience in the industry being served while those whohead unsuccessful attempts commonly do not. One reason why experiencemay be powerful as a determinant of success is because so much of whatneeds to be known is unique to particular processes, competitors, suppliers,customers, or individual people within an industry. Broad managerialconcepts are rarely sufficient for the short time available for a turnaround.Detailed, industry-specific knowledge is almost always required.
The Turnaround Experience: Real World Lessons in Revitalizing Corporations and Organizations

Technical Experience
It is a mistake to assume that all problems can be solved with theapplication of management principles. Some problems are technical problems. Technical experience is common in the backgrounds of successful turnaround agents and is often lacking in those who fail. Empirically, successfulturnaround agents frequently have engineering or manufacturing backgrounds either by education or by virtue of many years of experience inmanufacturing or engineering positions. Unsuccessful turnaround agents aremore likely to have backgrounds in finance or marketing. Perhaps moreaccurately, successful turnaround agents understand how to make money inphysical, people, process, and customer terms. They understand more aboutthe inner workings of their companies.
Knowledge exploration
Knowledge exploration is a concept difficult to measure, but meaningful toturnaround success. Decision making in unsuccessful turnarounds isfrequently too intuitive, often lacking an essential knowledge base, andinsufficiently grounded in fact. Successful firms are more studious aboutobtaining the information necessary for good decisions, they do not simplyrely on information that is available. Successful companies arrange to gather, or to know, the information critical to making key strategic decisions.Unsuccessful firms frequently have significant gaps in their information andare disinclined to seek external information that is needed. Suboptimaldecisions made on the basis of inaccurate, but available, information werevery costly and contributed to the ultimate demise of very large firms.Successful firms overtly seek information necessary for appropriate decisions.
Incremental changes
Gradual and consistent incremental improvement is the managerial style ofsuccessful turnarounds. Improvements are made one day at a time byimproving one thing at a time. Great changes in corporate strategy arediscussed only rarely at the meetings of successful companies. What isdiscussed are letters of complaint from dealers or customers, ideas presentedby employees as to how products or quality can be improved. Gradual andconstant incremental improvements, interspersed by occasional majorimprovements, provide the framework for successful companies to constantly progress. The rate of change is not linear. Periods of relative stabilizationand consolidation follow periods of major innovation. Successful companies“do common things uncommonly well” and once in a while, they dosomething that is wonderful.
Incremental change extends far beyond product changes to the process oforganizational learning as old values are used as a foundation for new values and beliefs. The subtle mechanisms of change resistance are well understoodby successful turnaround agents who show more appreciation for the positive
20

contributions of people who may have been with the organization at the time problems developed. In contrast, unsuccessful firms make abrupt, drasticchanges in plant location, markets served, products, and the makeup ofmanagement teams.
Fair play
Though fair play is a very difficult concept to measure, proxy indicatorsindicate that successful turnaround agents are generally perceived as dealingfairly with employees, creditors, suppliers, and customers. Successfulturnaround agents commonly know many employees on a first-name basisand tend to nurture long and mutually beneficial relationships with them.Often, the executive corps at successful companies take substantialcompensation reductions during periods of economic difficulty as the firststep in programs or retrenchment. As a counter example, unsuccessfulturnaround executives often extract too much compensation at times whenemployees are being asked for greater personal sacrifice. Equity theory,commitment theory, and historical writings in the field of managementprovide some theoretical basis for the relevance of fair play as a variable inorganizational performance. In addition to the internal considerations, fairplay by successful companies often extends outside the firm to suppliers and other members of the general community.
The Turnaround Experience: Real World Lessons in Revitalizing Corporations and Organizations

Chapter 2 — Recognizing aTurnaround Situation
A crisis serious enough to necessitate turnaround is a feature event for anycompany, an experience that can be catastrophic or a healthy and positiveforce of strengthening and renewal. A turnaround attempt can draw togetherthe people of the organization or it can tear them apart. It can fosterinnovation or stop it completely. A turnaround event is different from otherperiods of economic reversal because of the uncommon severity of thesituation. A turnaround event occurs when the very existence of the company is threatened.
Yet, turnaround situations frequently go unrecognized. Company managersoften fail to differentiate routine business situations requiring less spectacular change from more serious situations where extraordinary action is requiredfor the firm's survival. Occasionally, gradual drift takes place until thethreatened firm deteriorates beyond the point where reasonable action cansave it. These are the most serious cases because they represent situations inwhich the firm could have been saved but was not. The resulting catastrophe takes a cruel toll on employees, creditors, suppliers, stockholders, customers,and members of the local community. For both business and societal reasons, it is worthwhile to understand the early signs of decline.
Signs of decline
The signs of decline indicate slippage in the company's financial andcompetitive performance.* The warning signals present during the onset ofdecline frequently occur in one or more of seven basic families of problemswhich are easy to detect:
· Liquidity problems including frequent cash shortages, borrowing levelsup to collateral limits, or cash-on-demand status with many vendors
· Collection problems including an unusually large number of disputedbalances or frequent sales to a customer base which is not equipped to pay
· Profit problems such as ongoing losses in the general business or chroniclosses in a main segment
· Quality problems and other product problems resulting in low levels ofcustomer acceptance
· Employee problems including attrition of high-caliber people, lowmorale, high rates of absenteeism, or low productivity
22
· Organizational problems including a confusing organizational structure,dispersed responsibility, or inappropriate staffing for key positions
· Ethical problems including the falsification of financial statements,excessive executive compensation, unreasonable perquisites, theft,chemical dependency, or improper supplier-purchaser relationships
John Argenti (1976) lists 12 major causes of corporate demise in CorporateCollapse. He sees failure as a sequential process involving a succession ofsteps.
1. Poor management, including one-man rule, a non-participative board ofdirectors, an unbalanced top team, and lack of management depth.
2. Defective accounting information, including erroneous cash flow forecasts,costing systems, and asset valuations.
3. Exposure to change, including competitive, economic, social, andtechnological change.
4. Externally induced constraints, including governmental, union, public opinion, and consumer constraints.
5. Overtrading, involving expansion that is faster than cash flow or profits willpermit.
6. The big project, in which cost and time are underestimated and revenue isoverstated.
7. Excessive gearing, in which the company borrows more money than thevolume of business can reasonably support.
8. Bad financial ratios, which, with traditional financial analysis, indicateslippage in the firm's competitive position.
9. Creative accounting, involving the delayed publication of financialinformation, capitalized research and development costs, payment of dividends from borrowed money, reduction of maintenance on capital equipment,treatment of extraordinary income as ordinary income, and incorrect valuationof assets.
10. Normal business hazards, involving strikes by suppliers and fires or otherdisasters for which the firm is unprepared.
11. Nonfinancial symbols of decline, including low morale, poor maintenance,poor housekeeping, and slippage in quality of service.
12. “Last few months” indicators, including low stock prices, management denial of circumstance, and callous disregard for customers.
Lorrange and Nelson (1987) add that organizational decline is commonlypreceded by early warning signals including:
The Turnaround Experience: Real World Lessons in Revitalizing Corporations and Organizations

· Replacement of substance with form and a scarcity of clear goals anddecision benchmarks
Goodman (1982) focuses on the troubled firm's organizational characteristicsincluding:
· Operating the same way as in the past, independent of the operatingenvironment
· No firm plans for corrective action
Any one or more of these disorders may plague the company in trouble, and it is surprising how often problem situations fester and worsen beforeresponsible members of management or the board of directors initiatecorrective action. The unusual managerial practices of AlleghenyInternational went on for years and finally made the cover of Business Weekbefore changes were made in the firm's management. The sorry state ofsome savings and loan institutions was well understood by distant observersbut apparently not by the regulators, managers, or directors most directlyinvolved. Lengthy periods replete with early warning signals occurred atAllis-Chalmers, Control Data, Lone Star Industries, CPT, LTV, and manyother troubled firms, yet insufficient action was forthcoming. The resultswere diminishing business prospects, shrinking employment, and worseningcommunity well-being.
However, it is not always true that managerial incompetencies are rampantthroughout the troubled organization. Economic and market conditions alsostress corporate resources and cause revenues, cashflows, and profits todecline. These misfortunes affect capable as well as incapable firms, and itcannot be assumed that because a company is in trouble it has no soundmanagement and no distinctive competencies. Organizations, like people, getsick, but some recover — in part because they may not be sick all over.
This distinction between illness and failure is an important one that is toooften lost on the casual observer of the company in trouble. Often, failure isthe result of extreme behavior, too few or too many controls, an overlypowerful chief executive or a mere figurehead, or too few or too manymarkets or products (Miller 1977). Bank officials, directors, and newlyrecruited managers often make the assumption that everything needs to bechanged to restore a troubled company to health. Most companies in troubleare doing at least some things very well. Well-trained, dedicated, competentpeople are interspersed with people of limited training and dedication.Turnaround management is a specific science which requires the ability tonurture, encourage, and reinforce what is good as well as root out what isunsatisfactory. The turnaround practitioner is well advised to proceedcautiously. Many potentially successful turnarounds have been ruined bynewly appointed top managers operating with the assumption that everythingneeded changing when everything did not. Turnaround managers must bequick but not cavalier and must appreciate the limitations of the informationsupplied.
24
Recognizing a Turnaround Situation
Some terms might be helpful to the recognition of problem situations. Somesituations referred to as “turnarounds” may not be turnarounds under alldefinitions because the company did not actually survive as an activeparticipant in its major business. Occasionally, corporate names survive when customers are lost, plants are closed, employees lose their lifetimeemployment, and the company's market influence is severely damaged. Also,the endurance of the recovery should also be considered in determiningwhether success or failure has been achieved. A turnaround of a year or sois not much of a turnaround. We must also integrate our discussion of theturnaround process with other lessons we have learned in management.
The Turnaround candidate
For a company to be considered a turnaround candidate, the situation mustbe serious. Survival as a major participant in the industry needs to be atstake. That doesn't mean that the company will survive completely intact.Some unsuccessful turnarounds unfold with a skeleton of the initial company surviving in a formal sense, but with the company's market position greatlyweakened and employment greatly reduced. A turnaround candidate could be defined as a company or business entity faced with a period of crisissufficiently serious to require a radical improvement in order to remain asignificant participant in its major industry.
The requirements for the radical improvement may have been imposed by avariety of causes including the state of the economy, mistakes made bymanagement, distress to key customers, a physical disaster, crime, or evensporadic unpredictable events. We should understand the causes of declinebecause of their relationship to the ultimate remedies applied; however themain objective is to examine the state the company was in and how it gotout of it. The following criteria are offered as conditions necessary toestablish a company as a turnaround candidate as distinguished from other,more usual, business situations.
1. Profitability has declined from the previous 4-year average for a period of atleast 1 year and profitability should not only be low but slipping.
2. Profitability is either negative or significantly below the industry average and there are instances when other competitors are clearly able to achieve higherprofit rates selling similar products.
3. Real revenue has declined represents a measure taken after adjustment forinflation to eliminate the instances where revenue increases solely because ofinflation while actual business levels are down.
4. Market position is deteriorating as represented by a loss in market share, adecline in the number of key distributors or dealers, or price erosion in thecompany's products.
The Turnaround Experience: Real World Lessons in Revitalizing Corporations and Organizations

5. Investors, board members, or managers express concerns regarding thecondition of the company, and initiate actions in response to these concerns.These concerns commonly coincide with a deterioration in the company's cash position to the point that satisfaction of cash obligations is difficult.
The above criteria, along with other subjective information about theindividual case, can help us make a judgment about whether we are dealingwith a true turnaround situation or a more routine business fluctuation.
The Stages of the Turnaround process
Most corporate crises start slowly and then accelerate and become critical.As Hofer (1980) and others have observed, the greatest opportunity forturnaround success is in the early stage of the crisis before resources arefully spent and when enough time remains for corrective actions to work.Yet, it is also during this early stage of the crisis when there exists the leastconsensus among organization members about the degree of difficulty, itsfundamental causes, and what should be done. As circumstances worsen,consensus is often easier to achieve, but there is less time available and lessmaneuvering room to implement strategies. Time, by itself, influencesturnaround outcome, and it is useful to examine turnaround events in threedistinct stages: the preturnaround situation, the period of crisis, and theperiod of recovery. Each of these three stages has distinct characteristicswhich can impact failure or success. Figure 2-1 provides a visual example of revenue and cost histories during an actual turnaround of an authenticcompany. Each stage is identifiable and possesses it own unique operationalcharacteristics and organizational dynamics.
The Preturnaround situation
The pre-turnaround situation is that period of time before profitability begins to decline severely or, if profitability has declined, before the point when the general health of the firm becomes an appreciable concern to investors,employees, or other stakeholders. This could include the early life of a firmwhen it is getting established.
During the preturnaround situation, gradual drift may be taking place. Thecompetitive position of the firm may indeed be weakening, but the condition may be rationalized by managers and stakeholders as a temporary misfortune due solely to external events, such as the general state of the economy,temporary abnormalities in world trade, an uncooperative banker, or otherfactors. A preturnaround situation may also be quite robust. Decline cansometimes occur quickly as in the case of International Harvester whichwent from its best year ever in 1979 to devastating losses in the next fewyears.
26
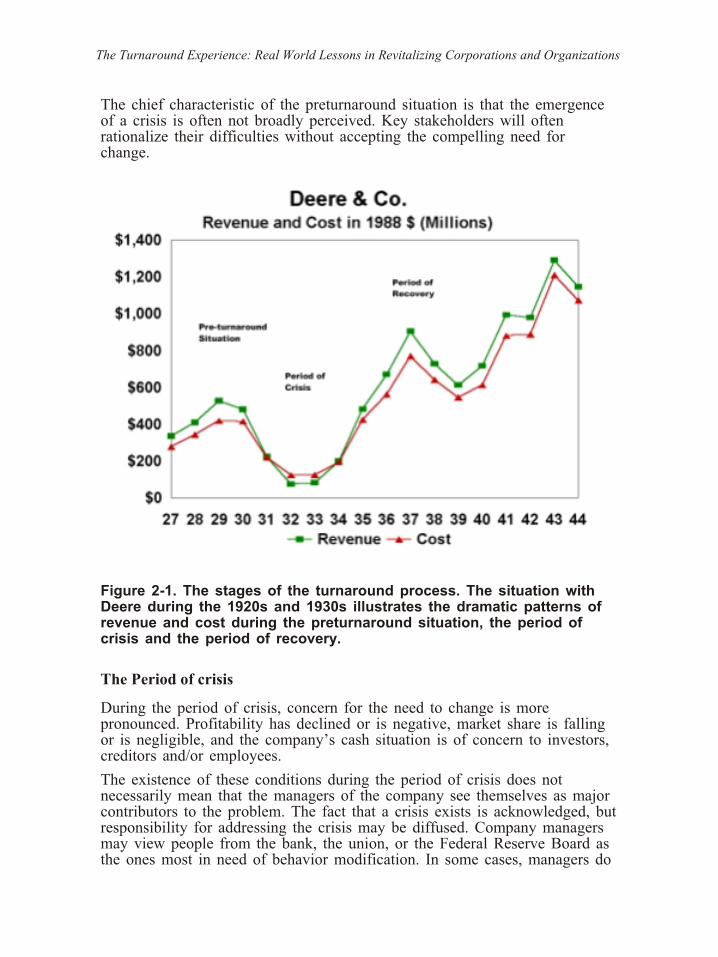
The chief characteristic of the preturnaround situation is that the emergenceof a crisis is often not broadly perceived. Key stakeholders will oftenrationalize their difficulties without accepting the compelling need forchange.
Figure 2-1. The stages of the turnaround process. The situation withDeere during the 1920s and 1930s illustrates the dramatic patterns ofrevenue and cost during the preturnaround situation, the period ofcrisis and the period of recovery.
The Period of crisis
During the period of crisis, concern for the need to change is morepronounced. Profitability has declined or is negative, market share is fallingor is negligible, and the company’s cash situation is of concern to investors,creditors and/or employees.
The existence of these conditions during the period of crisis does notnecessarily mean that the managers of the company see themselves as majorcontributors to the problem. The fact that a crisis exists is acknowledged, but responsibility for addressing the crisis may be diffused. Company managersmay view people from the bank, the union, or the Federal Reserve Board asthe ones most in need of behavior modification. In some cases, managers do
The Turnaround Experience: Real World Lessons in Revitalizing Corporations and Organizations

seek changes in their own behavior and occasionally bravely shoulder theresponsibility. In the period of crisis it is broadly perceived that somethingmust be done.
The Period of recovery
During the period of attempted recovery, specific actions are put in motionto improve the health of the firm. The actions taken can be appropriate orinappropriate — effective or ineffective. The actions can be specific steps, or they can be thinly veiled rationalized abdications. The turnaround itself maybe either successful or unsuccessful. But, concern is expressed and attemptsare made to restore the financial health and market position of the firm.Successful recovery occurs when the firm experiences a return toprofitability, substantial improvement in its balance sheet, and a restorationof its competitive position.
The Nature of Recovery
The recovery of a turnaround firm is more than the restoration of bookprofits. It matters how the profits are restored. Recovery has to beaccomplished by actual improved performance on the part of the firm itself,without the benefit of legal restructuring, such as bankruptcy. Formalrestructuring procedures occasionally permit the company to become betteroff by exporting problems to other parties (unsecured creditors, lenders,governments, investors, or employees) who must involuntarily assume thedebts the firm is obliged to pay but cannot. In a scientific sense, thesesituations are not turnarounds, they are . What societies need are turnarounds that operate in a positive sum game rather than the shifting of obligationswithin a zero sum game—recoveries that make the firm better off withoutmaking someone else worse off.
Furthermore, the term recovery must be interpreted as a lastingevent—covering at least several years and resulting in a measurably bettersituation for the company in terms of profits, market position, technicalcontribution, and general contribution to the economy. Key necessaryconditions for recovery are a return to profitability and a substantialimprovement in the balance sheet and in market position (increased marketshare or increased sales through a more secure market share in a smallermarket). After a valid recovery has been accomplished, the firm shouldoperate without a serious threat to its viability for at least several years.
Individual Turnaround events
Most companies will experience severe adversity at some time during theirhistory. Individual turnaround events can occur during severe recessions,industry market conditions, or internally induced misfortune. Usually, theseevents span several years, perhaps 15 years for the above three stages tounfold. So, the proper investigation of turnarounds involves the close
28

monitoring of company affairs over very long periods. In order to identify aturnaround event, the situation, the period of crisis, and the period ofrecovery should all be identifiable and quantifiable and should be totallysupported by qualitative as well as quantitative information.
Turnaround agents
Turnaround agents are those individuals or groups of individuals mostinvolved in directing the turnaround attempt during the period of recovery.In most cases, the chief turnaround agent is the firm's chief executive.However, many people are involved in leadership roles in the mostsuccessful turnaround cases. One person may receive the bulk of thepublicity but a more thorough examination will reveal that team efforts,rather than singular leadership, are really responsible for the restoration ofcompany health. We, therefore, must distinguish between the chiefturnaround agent, such as Lee Iacocca in the case of Chrysler, and the othervery important additional turnaround agents, such as Hans Matthias ofmanufacturing, Hal Sperlich of product development, Douglas Fraser of theUnited Auto Workers, or Gerald Greenwald of finance who played crucialroles in restoring the competitive strength of the firm. The turnaroundprocess involves many essential steps and seldom can total success or failure be attributed to any single individual.
The Turnaround process
The turnaround process is that amalgam of managerial skills, systems, andprocedures used; the value systems and individual character traits exhibited;and the actions taken during the turnaround event to achieve a recovery. The turnaround process is a multifaceted process of organizational learning. Many people throughout the company learn to do things in a new, usually lesscostly, way. A broadly based learning experience of this magnitude is noteasy to describe because it involves so many people and so many parts ofthe organization. Serious examination of the process involves considerationof a great many variables—some are managerial, some are technical. Somelend themselves to quantitative analysis, and some are more organic. Theentire process is holistic, and every variable impacts every other variable.
The Turnaround Experience: Real World Lessons in Revitalizing Corporations and Organizations
Chapter 3 — Profit Patterns inSuccessful and Unsuccessful
Turnarounds
Turnarounds take time. Little can be learned by examining turnaroundsituations for short periods such as 2 or 3 years. Because of the amount oftime that passes when a firm becomes weaker, attempts to become stronger,and then finally either recovers or fails, long observation periods arenecessary to capture the intricacies of the turnaround process, especiallysince successful firms often look worse during the early stages of theturnaround and operate unprofitably for longer periods than do theunsuccessful firms. Successful firms average 3 years in the red beforeprofitability is restored. Long periods of observation are also necessarybecause so many things change, especially management, within unsuccessfulcompanies. Each new wave of management usually brings with it a newstrategy and a new operational focus. Understandably, these must befollowed over long periods to distinguish successful from unsuccessfulactions.
Selection of Turnaround Cases
The selection of turnaround cases covered here was based on a speciallyprepared database of information on most of the significant firms operatingin the automotive and agricultural industries since the turn of the century.The initial industry database contained sales, financial, and operational dataon the key firms in these industries for the period from 1900 to 1985.Obtaining a full set of data for the entire time period for all firms was notpossible. But, it was possible to gather a fairly complete set for most of thesignificant firms.
The second step was the identification of companies suitable for the studyusing the criteria explained in Chapter 2 (revenue and profit declines andconcerns among stakeholders). This selection process involved theexamination of sales and financial and operating results of the firms todetermine when a falloff in business occurred, and the use of industrialbusiness histories to determine when and if turnaround attempts took place.
The 16 turnaround cases were then examined over a 20-year period, in mostcases. The most severe period of crisis was considered to be year 0. Usually, this was the year when the most money was lost. Data were then collectedfor the 5 preceding years, year 0, and 14 succeeding years for a total of 20years. Financial records, product specifications, actual component parts,manuscripts, histories, interviews, and other data were examined to provideinformation for the full analysis.
30
In order to facilitate comparisons among the various stages of the turnaround process, data were collected separately for the full period (up to 20 years)and for each of the following stages:
1. The preturnaround situation (year -5 through year -2)
2. The period of crisis (year -1 through year +1)
3. The period of recovery (year +2 through year 11)
4. Additional periods (year 12 through year 14 and in one case through year17)
The actual stages did vary somewhat from one case to another and when the individual cases were analyzed, each year of every case was examinedseparately. Groupings by virtual time periods were employed to facilitatecomparisons. The appendix discusses the research procedures in more detail.
Criteria for Success: Lasting Performance
The method used for determining whether the turnaround was successfulcentered around three necessary conditions: a return to profitability, asubstantial improvement in profitability, and an overall improvement inmarket position — all lasting at least several years and resulting in ameasurably better situation for the company with respect to these criteria.More specifically, a turnaround was classed as successful if the followingwere achieved:
1. Profitability improved from the levels of the period of crisis for a period of at least several years.
2. Profitability was positive.
3. Market position was significantly strengthened either by increasing marketshare or by successfully concentrating on an important subset of the market.
The measures employed in evaluating turnaround success included:Units of production
Units of production as a percent of the industry total
Revenue in current dollars
Revenue as a percent of estimated industry revenue
Revenue in constant dollars (1988 $ 000)
Revenue as a percent of the U.S. gross national product
After-tax earnings in current dollars
After-tax profit rate (as a percent of revenue)
Because of the lack of standardization in accounting systems over the spanof time examined, and the differing requirements of financial reporting, afew data points were either unavailable or unusable for at least some yearsof the earliest cases. Narrative information supplemented the quantitativeinformation in classifying a case as a success or failure. Table 3-1 notes the
The Turnaround Experience: Real World Lessons in Revitalizing Corporations and Organizations

final placement of the individual cases into the successful and unsuccessfulcategories based on the measures and narrative information listed above.
Note that a number of these cases are not from recent years. The readershould not be put off by this. These cases are included because of theirrelevancy. Indeed, one of the most exciting aspects of putting this booktogether was to discover how applicable these earlier experiences were to the very problems facing U.S. companies today.
Profit Patterns in Successful and Unsuccessful Turnarounds
Companies that ultimately succeed in turnarounds are quite often moreseverely affected initially. Successful companies experience more pronounced downturns and respond more quickly. Unsuccessful companies tolerateconditions lethal to their survival long before actions are taken. TheSchendel and Patton (1976) landmark study of turnarounds hypothesized that rapid decline promotes action and gradual drift does not, a hypothesisreinforced by several of the cases studied here. Success was preceded bymore serious declines in revenue and profit. Revenue falloff was moresubstantial. Loss rates were more severe. Costs had to be reduced muchmore in order to survive. Failing companies experienced less severity. Figure 3-1 displays the profit patterns of successful and unsuccessful firms duringtheir turnaround attempts.
Table 3-1. Cases in the Turnaround Sample
Case 1 Buick from 1906 — 1925 Successful
Case 2 International Harvester from 1966 — 1985 Unsuccessful
Case 3 Jeffery Motors from 1911 — 1930 Successful
Case 4 Willys-Overland from 1916 — 1935 Unsuccessful
Case 5 American Motors Corporation from 1951 — 1970 Successful
Case 6 Ford Motor Company from 1975 — 1988 Successful
Case 7 Kaiser-Frazer from 1944 — 1956 Unsuccessful
Case 8 Cadillac from 1897 — 1916 Successful
Case 9 Hudson Motor Co. from 1927 — 1946 Unsuccessful
Case 10 Chrysler Corporation from 1975 — 1988 Successful
Case 11 AMC/Renault from 1971 — 1987 Unsuccessful
Case 12 Maxwell-Chalmers from 1916 — 1935 Successful
Case 13 Allis-Chalmers from 1963 — 1986 Unsuccessful
Case 14 Packard from 1929 — 1948 Successful
Case 15 Studebaker-Packard from 1949 — 1966 Unsuccessful
Case 16 Deere & Co. from 1927 — 1946 Successful
The decline in revenue experienced by both the successful and unsuccessfulfirms was substantial but the declines were especially severe among thesuccessful cases, as Table 3-2 makes clear. From year -3 to year 0, constantdollar revenue declined 46 percent in the case of Packard, 86 percent in thecase of Deere, 43 percent for American Motors in the 1950s and 57 percentfor Chrysler in the 1980s. Other firms experienced similar declines in
32

physical units of production. Buick's shipments declined from 30,525 in 1910 to 13,389 in 1911. Though some production capacity was diverted to trucks,Jeffery automobile shipments declined from 10,417 in 1914 to 4608 in 1916. Shipments totaled only three units during year 0 of the Cadillac case.Maxwell-Chalmers production declined by 46 percent from year -3 to year 0.
Unsuccessful firms also experienced revenue and profit declines but, with the exception of Hudson and Willys-Overland, they were not as pronounced.Hudson revenue did decline 86 percent from 1929 to 1932, andWillys-Overland's production declined by 46 percent from 1918 to 1921. The other five unsuccessful firms either experienced relatively small revenuedeclines or had revenue increases (Table 3-2).
Table 3-2. Change in Revenue and units produced between Year -3 and Year 0
Percent Change in
Revenue Constant
Dollars (1988)
Percent Change in
Units Produced
Successful Cases
Cadillac * *
Buick ** **
Jeffrey *** ***
Maxwell-Chalmers -46.2
Packard -44.6 -54.2
Deere -86.0
American Motors I -43.0 -51.3
Chrysler 56.7 -48.3
Ford -23.1 -48.9
Unsuccessful Cases
Willys Overland -45.9
Hudson -82.7 -80.9
Studebaker-Packard -15.6 -56.1
International Harvester -0.8
Allis Chalmers -3.2
Kaiser-Frazer **** +186.9 +75.9
American Motors II +6.4 -14.5
*Units produced at the predecessor to Cadillac, the Henry Ford Motor Company, increased from no units in 1899to 3 units in 1902.
** Although Buick sales in year 0 were actually greater than the sales in year -3, the company did experience a57 percent decline from 30,525 units in 1910 to 13,389 units in 1911.
*** Jeffrey vehicle sales had declined from 10,417 in 1914 to 4608 in 1916.
**** Kaiser-Frazer revenue declined from $2,419,606,000 in 1948 to $1,166,223,000 in 1949 (1988 Dollars). Unit sales declined from 317,963 in 1948 to 141,309 in 1949.
The Turnaround Experience: Real World Lessons in Revitalizing Corporations and Organizations

Figure 3-1. Net Profit Rates: Successful and unsuccessful Turnarounds.
During periods of crisis, successful companies experience more dramaticdeclines and deeper loss rates than unsuccessful companies. These sharpdeclines appear to have prompted dramatic action to restore health andprofitability. Unsuccessfully companies drifted more gradually towardoblivion.
One of the unsuccessful companies, International Harvester Corporation(IHC), was at one time the fourth-largest firm in the country. At other timesin its history, IHC was the largest firm in its industry by a factor of 8. Three of the unsuccessful firms (Hudson, Willys-Overland, and Allis-Chalmers)were at one time the third- or fourth-largest in their industries. Most of theunsuccessful turnarounds involved companies which were comfortably among a very few leading companies in their industries. In contrast, three of themost successful cases, Cadillac, Jeffery, and Maxwell-Chalmers, were quitesmall firms when the turnarounds were attempted, and two of these, Cadillacand Maxwell-Chalmers, were near liquidation. This study did not yieldevidence that either firm size or economies of scale were substantial factorsin turnaround success.
34

AMC/Renault and Chrysler Corporation provide an interesting contrastbetween the profit patterns of successful and unsuccessful turnaround firms.Both firms were adversely affected by the oil crisis of the 1970s and therecession of the early 1980s, although AMC should have been less affectedbecause the recession was moving buyers toward AMC's traditional market.Chrysler experienced a 57 percent decline in real revenue from year -3 toyear 0. AMC experienced a 6.4 percent increase. Chrysler's loss rate reached 18.5 percent of revenue during the low point of its crisis. AMC's loss ratewas 2.0 percent of revenue. After its crisis in 1976, AMC's real revenueincreased to record levels in 1978 and 1979, while Chrysler's revenue haddeclined to $18 billion (1988 dollars) from $ 29.6 billion 2 years earlier.Yet, as AMC revenue climbed to record levels, so did cost. During its lastyear of significant profit, AMC's 1979 earnings were 2.7 percent of revenue.When revenue declined in 1980 and 1981, the company did not reduce cost,and huge losses began to accumulate. In 1987, AMC was absorbed intoChrysler after losing $683 million in 5 years.
In contrast, Chrysler Corporation, although affected much more severely,chose to bring costs down to the levels of then current real revenues, whichreached slightly more than $12.0 billion in 1982. Chrysler's real costs, which had reached nearly $30 billion in 1977 (1988 dollars), were reduced to lessthan $12 billion 5 years later (Appendix Table A-3). Chrysler's systematicreduction of the firm's breakeven point produced record profits in subsequent years and a solid position in the industry (Table 3-2). American Motors, atone time one of the most efficient and systematic producers of cars in theworld, succumbed to inefficiency and disappeared as an independentcompany.
Practical Lessons on Profit patterns
· Large dominant firms, as well as smaller producers, fail. Size does notseem to be a factor in turnaround success.
· During the early years of a turnaround, successful turnarounds oftenexperience more pronounced business declines and deeper loss rates thanfirms that ultimately fail.
· Improved performance on the part of successful turnarounds is frequentlynot apparent for about 2 years. From year 2 forward, the successfulcompanies began to emerge as much more consistent and much moreprofitable.
· Successful and unsuccessful firms experience loss periods of similarlength, 3 years for successful companies versus 2.71 years forunsuccessful companies before profitability is restored.
· Successful firms accept economic conditions for what they are and reduce cost to existing revenue levels. Unsuccessful firms commonly attempt tosell more to cover existing costs and put less emphasis on cost reduction.
The Turnaround Experience: Real World Lessons in Revitalizing Corporations and Organizations

· During the period of recovery, successful firms averaged after-taxprofitability of 6.5 percent while the unsuccessful firms operated at anaverage loss rate of 1 percent.
36

Part 2
The Strategic advantage of
Low-Cost operation
Low-cost operation provides a strategic advantage far more enriching thanthe simple preservation of needed cash. Low-cost operation enables thefunding of better product quality, more differentiated products and bettercustomer service. Low-cost operation disciplines and conditions theorganization for international competition and forms a bond that bringsmembers of the troubled company together and promotes commitment.Low-cost operation is absolutely essential to the survival of the troubledfirm.
In contrast, higher costs produce three principal side effects far moresignificant than the mere reduction of profits. All operate independently buthave a similar effect on the probability of turnaround success:
1. Excess or unnecessary costs reduce profit, cash flow, and the availabilityof resources. To persevere under unfavorable business conditions, the troubled firm must develop high levels of efficiency in its main operations so that itcan satisfy financial obligations and fund product differentiating activities.Perhaps the most damaging aspect of inefficiency is the opportunity cost—thecost of not being able to adequately fund essential activities such as productdevelopment, effective marketing, and customer service. This is the economicconsideration, the most well known of the three side effects.
2. Unnecessary costs result in operational inefficiency. The things that costmoney—extra people, extra facilities, extra programs, and extra managers—get in the way of efficient operation, just as excess inventory impedes operationalefficiency. This is the operational consideration.
3. Unnecessary costs reduce commitment. Organization members are skepticalwhen they are asked to reduce costs while the firm continues to makeacquisitions, pay executive bonuses, or offer elaborate executive perquisites.Workers are seldom motivated to save money when management is stillspending it. The reduction of manager-induced costs affects organizationalbehavior by providing organization members with important evidence that thecompany is serious in its collective resolve to improve its situation. This is the organizational behavior consideration.
The Turnaround Experience: Real World Lessons in Revitalizing Corporations and Organizations

Cost efficiencies are dynamic ingredients in the internal culture of successful firms, and effective turnaround agents understand the difficulty of turning acompany around when too much money is being spent. Reducible cost mustbe avoided, and successful turnaround efforts require a high degree ofwell-placed frugality. However, successful turnaround agents also understandthe relationships among cost effectiveness, operational effectiveness, andorganizational behavior, and they actively work to reduce costs for reasonsbeyond the simple preserving of cash.
The cost efficiencies necessary for a successful turnaround extend beyondproduction alone and involve general internal efficiencies. Production cost, or operation cost in the case of a service company, is especially consequentialbecause it represents such a significant percentage of total cost for mostfirms. However, in equally important ways, nonproduction costs such asoverhead, administration, and interest also reduce the firm's ability to survive as a viable competitor.
Successful turnarounds differ from unsuccessful turnarounds in one veryimportant and consistent respect: for at least several years, the companybecomes established as a low-cost provider in its industry. Unsuccessfulfirms concentrate on other matters and do not attain status as low-costproviders. The relationship between low-cost operation and turnaroundsuccess among the 16 cases examined can be summarized as follows:
1. The successful companies were noticeably more efficient in manufacturingthan the unsuccessful firms. Gross profit rates and inventory turn ratios weresignificantly higher. Narrative information corroborated the statisticalindications of greater efficiency. The differences in manufacturing efficiencyaccounted for more than 70 percent of the differences in profitability betweensuccessful and unsuccessful firms.
2. Successful companies stayed with their cost-reduction programs longer andmade deeper cuts. Successful firms brought the costs down to the then current levels of revenue. Unsuccessful firms attempted to increase the level ofrevenue to cover existing costs, either by selling into new markets or bymaking acquisitions.
3. Cost-reduction programs during the successful turnarounds were pragmatic,disciplined, and even-handed. Management often played an exemplary role inthe cost-reduction programs of successful firms by accepting less pay and byeliminating unnecessary perquisites.
4. Successful companies handled money conservatively on an ongoing basis withcost consciousness more likely to be a cultural trait than was the case with the unsuccessful firms. Successful firms spent money primarily to improve current operations rather than for expansion into new business areas or for corporateimage.
5. The successful companies spent less on selling, general and administrativeexpense, and other non-cost-of-sales-expense. Dramatic increases in operational efficiency were sought in all departments (sales, finance, operations, product
38

development, and others) of the successful organizations. The efficientmanagement of the organization was viewed as crucial to turnaround success.
An encouraging finding is that attainment of low-cost operation among thecompanies examined was achieved independent of scale. Some peoplesuggest that larger companies have an advantage in economies of scalebecause they can amortize their fixed costs over a larger number of units and thus have higher profits per unit sale. It is also argued that they can investthese profits in better operational methods that will further increase their cost advantage. This logic often contends that smaller firms are at an almostimpregnable disadvantage to larger-scale competitors. To some extent, thisperspective is implicit in the theory that profitability is correlated to marketshare (Schoeffler, et al. 1974). However, economists have maintained for avery long time that at some point, economies of scale fall prey to the law of diminishing returns. The 16 cases examined here indicate that diminishingreturns may be present in some circumstances because larger firms often didworse than smaller firms. In the industries discussed here, as well as someothers we have studied, an interesting historical pattern emerges. Dominantproducers, first Ford during the 1920s, then International Harvester duringthe 1970s, and later General Motors during the 1980s, were all relegated tomuch weaker positions over time—a truly surprising phenomenonconsidering their vast size and enormous resources. In these industries, themost efficient producers gained ground on larger, less efficient firms, andthen surpassed them. The important lesson is that successful firms areefficient first and large second. It does not work the other way around.Efficiency is a necessary condition of market leadership. Firms that becomemarket dominant develop manufacturing efficiencies and general operatingefficiencies before attaining market leadership.
Evidence also suggests that it makes no sense to discuss firm-wide scaleeconomies. Scale economies have to be analyzed vis-a-vis the particularoperational process, an assembly line, a particular machine tool, anindividual plant, or perhaps even the abilities and characteristics of a singular worker. The people active in successful turnarounds spent much of their time in pursuit of micro efficiencies and small-scale improvements.
One of the most important questions is whether cost reduction or revenueexpansion (or both) is the preferred strategy in a turnaround situation. Thepractical real-world question is how easily can a company sell its way out of a problem. For reasons that are both economic and inherent in the timeconstraints facing the turnaround agent, revenue expansion is a risky strategy that may result in little profit improvement. The all-too-frequent pattern ofexpenses growing faster than revenue makes the revenue expansion strategyimpractical for many turnaround situations unless it is preceded by majorimprovements in efficiency.
Part 2 examines the linkages between operational efficiency and turnaroundsuccess. Chapter 4 discusses the breakeven profile of the typical firm introuble and then describes the practical improvements in operationalefficiency needed to restore health to an industrial firm. Chapter 5 reviewssteps successfully taken to achieve and sustain modest overhead. Chapter 6
The Turnaround Experience: Real World Lessons in Revitalizing Corporations and Organizations

examines the linkages between product (or service) design and operationalefficiency.
40
Chapter 4 — Achieving Operationalefficiency
During the early life of General Motors, the company's largest operation,Buick, experienced a decline in automobile production of 55 percent from1910 to 1911 and a loss of market share from 17 to 7 percent. Buick hadabruptly dropped its most popular car, the Model 10, because the companywas not able to produce the car for less money than the selling price. But,over the next 6 years, as the prices of Buick products were graduallyreduced, Buick revenue quadrupled while net profits increased sevenfold.The dramatic reversal of Buick's fortunes was not achieved with abreakthrough new product, marketing wizardry, or a timely divestiture. Itwas achieved with many small, painstaking improvements in operationalefficiency. The sum of these improvements established Buick as a low-costproducer, a key to survival for companies in trouble.
From 1980 to 1982, the Ford Motor Company lost $3.3 billion as yearly carshipments dropped to under half of the levels of the late 1970s. Physical-unit market share dropped from 20 percent in 1977 to 16 percent in 1980. Yet by 1987, Ford had emerged as one of the world's most profitable automobilecompanies with an after-tax profit rate of 6.5 percent of sales. As was thecase with Buick in 1915, Ford in the 1980s achieved a turnaround bymaking thousands of incremental improvements to become a low-costproducer of differentiated products.
Companies able to implement successful turnarounds achieve and maintainoperational efficiency. They exhibit much better statistical performance onthe traditional measures of manufacturing efficiency, and they achieveefficiency in other matters as well. Production efficiencies and other internalefficiencies combine to provide the successful firm with a competitive costadvantage that enables further improvement in products and services.
The differences between successful and unsuccessful turnarounds in the gross profit rate (the residual profit on revenue after production costs have beendeducted) are particularly striking. During the period of recovery (years 2through 11), the gross profit rate averaged 19.56 percent among successfulfirms versus 13.29 percent among unsuccessful firms, a rate nearly 50percent higher among successful firms.
All the successful firms in our sample enjoyed gross profit rates above 15percent during the most critical stages of their recovery periods. Of the seven unsuccessful cases, only Allis-Chalmers' gross profit rates exceeded 15percent, and this advantage was offset by higher expenses in othercategories. As evidenced by better performance on manufacturing measuresand narrative reports on the procedures employed, operational efficiency was a primary factor in every successful turnaround case and was absent inalmost every unsuccessful case (Table 4-1).
The Turnaround Experience: Real World Lessons in Revitalizing Corporations and Organizations

Table 4-1. Gross Profit Rates during Periods of Attempted Recovery
Successful
Case 1 Buick from 1906 — 1925 Very High
Case 3 Nash Motors from 1911 — 1930 23.90%
Case 5 American Motors Corporation from 1951 — 1970 14.92%
Case 6 Ford Motor Company from 1975 — 1988 16.53%
Case 8 Cadillac from 1897 — 1916 Very High
Case 10 Chrysler Corporation from 1975 — 1988 17.48%
Case 12 Maxwell-Chalmers from 1916 — 1935 15.73%
Case 14 Packard from 1929 — 1948 11.55%
Case 16 Deere & Co. from 1927 — 1946 36.88%
Mean of successful cases 19.56%
Unsuccessful
Case 2 International Harvester 1966 — 1985 14.37%
Case 4 Willys Overland from 1916 — 1935 11.23%
Case 7 Kaiser-Frazer from 1944 — 1956 5.74%
Case 9 Hudson Motor Co. from 1927 — 1946 8.09%
Case 11 AMC/Renault from 1971 — 1987 12.50%
Case 13 Allis-Chalmers from 1963 — 1986 22.80%
Case 15 Studebaker-Packard from 1949 — 1966 11.63%
Mean of unsuccessful cases 13.29%
*The gross profit rates of American Motors ranged from 14.48% to 20.09% during the period from 1958 through1964 but declined during the late 1960s under different management.
**Packard’s statistical gross profit rates were lower because of the company’s role as a prominent defensecontractor in World War II. Packard’s gross profit rates averaged 21.99% from 1936 to 1939.
Note: The gross profit rates were computed on the basis that each year of each case is taken as one observation.Some cases were followed for more years than others, because of the termination of a business or othercircumstances.
This observed difference in gross profit rates accounted for about 70 percentof the difference in after-tax net profit rates (10 percentage points) betweensuccessful and unsuccessful turnaround firms. If these higher gross profitrates had been experienced by the unsuccessful firms, most of them wouldhave operated at respectable levels of net profit during the critical years ofattempted turnaround and probably would have survived.
If more complete cost-of-sales figures could be included for the very earlyCadillac and Buick cases, and if the gross profits of Packard had not beenartificially lowered by the company's role as a defense contractor in WorldWar II, the observed difference in gross profit rates between successful andunsuccessful companies would have been several points higher.
The higher gross profit rates among successful firms was widespread andpronounced, even when similar products were produced. During themid-1930s, Deere's gross profit rates averaged 36 percent. International
42

Harvester operated in the same industry making the same sort of products on a much larger scale during the same economic period, yet had gross profitrates between 19 and 28 percent. International Harvester was from five toeight times the size of Deere at the time, but IHC's vast size did notgenerate higher rates of operational efficiency. Oliver, Minneapolis-Moline,and Allis-Chalmers had gross profit rates similar to those of InternationalHarvester and all ultimately failed.
Massey-Harris experienced even lower gross profit rates (about 17 percent)and was restructured at a later time. Only Deere and J. I. Case had grossprofit rates in excess of 35 percent. Although these companies have passedthrough many changes in the 50 years since, these are the two majorlong-line agricultural equipment companies that survive in the United Statestoday.
A similar situation has existed in the U.S. automobile industry at varioustimes in its history. During the late 1940s, two operators, Nash and GeneralMotors, experienced gross profit rates that were approximately 50 percentgreater than the rest of the industry. General Motors continued with solidperformance, but Nash experienced a sales decline in the mid-1950s thatcould have been lethal had it not been for the firm's operational efficiency.Nash did survive the crisis under the name American Motors. However, thereconstructed Ford Motor Corporation began to emerge as thesecond-most-efficient operator in the industry. Chrysler Corporation rankedbehind the others. Chrysler had lower gross profit rates than Ford, GM, andAMC from 1958 through 1960 and lagged behind Ford and GM in grossprofit rates from 1961 through the mid-1980s. The problems experienced byChrysler Corporation during the late 1970s began shortly after World War II and were related to problems of operational efficiency.
These substantial differences in operational efficiency impacted the healthand survivability of each firm and the outcome of the turnaround attemptsexamined. Table 4-1 displays the differing gross profit rates amongsuccessful and unsuccessful companies during their period of attemptedrecovery. The high correlation between operational efficiency and turnaround success is understandable because manufacturing costs represent a largefraction of total costs for industrial companies. However, managers of bothsuccessful and unsuccessful companies were in positions to observe theseimportant cost relationships. The difference between successful andunsuccessful firms was that the managers at the successful firms knew whatto do and did it. Managers at the unsuccessful firms apparently did not know what to do to improve the efficiency of factory or other operations.
Companies successful in turnaround situations prevail because the turnaround agents possess analytical, managerial, and technical expertise. Successfulturnaround agents like Walter Chrysler, Charles Nash, or Donald Petersen do tend to manage people well and exhibit strong leadership traits. However,they also understand more about the economics of breaking even in physicalterms and in process terms, for instance, how products can be designed forquicker assembly, how fit and finish can be improved by redesigning
The Turnaround Experience: Real World Lessons in Revitalizing Corporations and Organizations

stamping dies, and what product characteristics are of most interest tocustomers.
Lewis C. Veraldi served as Ford's vice president of car program management during the development of the highly successful Taurus/Sable project, whichwas chartered when Ford was losing over $1 billion per year. People whohave had the opportunity to speak with Veraldi will be struck by the endless array of specifics he committed to memory. He could recall at will almostevery dimension on the car. He knew the weight of each part, what materials were used, why they were used, and how many fasteners were used inassembly. Perhaps more important, Veraldi could remember which Fordemployee or supplier suggested the improvements which led to greateroperational efficiency. To a very large extent, Ford's consistently improvingprofits were due to executives like Donald Petersen, Lew Veraldi, and JohnManoogian, who understood the technical and managerial aspects of breaking even in physical as well in financial terms.
Successful turnaround agents apply both technical and managerial expertiseto restore the firm to health. Their understanding of the economics ofbreaking even is characteristically internal to the firm. This internal focusoften leads to remedies that are polar opposites of the actions taken byunsuccessful firms. Unsuccessful firms often spend more time onacquisitions, new markets, and new ventures, and less time on internalefficiencies.
The Economics of Breaking even
Managers of companies in difficulty often believe that the mere restorationof sales is sufficient to restore profits. The success of this approach iscontingent upon the efficiency achieved by the firm in obtaining additionalrevenue. If the firm has to spend an additional 99.5 cents to bring in anadditional $1.00 in revenue, it doesn't matter much whether more is sold ornot. For instance, from 1983 to 1987, General Motors revenue increasedfrom $75 billion to $102 billion while profits declined by $180 million. It isquite difficult for a company to work its way out of a hole if each additional dollar of revenue costs nearly a dollar to obtain. Under some circumstances,the true revenue and variable cost lines on the breakeven chart can beparallel or even divergent. Variable cost can exceed variable revenue, thusnecessitating an improvement in efficiency.
Donald Hambrick and C. Schecter (1980) have suggested that mostshort-term turnaround attempts by industrial companies employedefficiency-oriented rather than entrepreneurial (revenue expansion) moves.One explanation for this finding may be that the relationship betweenvariable costs and revenue was such that revenue expansion moves did notimprove profits enough to meet the demands of the turnaround situation. The value of additional revenue in a turnaround situation depends on the natureof the firm's cost structure. If variable costs are low, additional revenue hasvalue. If variable costs are high, additional revenue will not solve the firm's
44

financial difficulties. In these cases, the reduction of cost emerges as theappropriate short-term strategy and internal efficiency should be emphasizedmore than selling.
Short-run costs are often divided into two groups: fixed costs, which remainfixed over wide ranges of output levels, and variable costs, which vary withthe number of units produced. The manner in which costs change asrevenues change can by very crudely illustrated by the breakeven chart inFigure 4-1.
Figure 4-1. Although this breakeven chart illustrates some theoreticalconcepts useful to the turnaround manager, the underlyingassumptions are overly simplistic and perhaps do not match real-world patterns of cost and revenue relationships. Two improper assumptions are often responsible for its misuse: variable costs are low withrespect to revenue, and variable costs are constant over wide rangesin output. Neither assumption seems to be supported by evidence inthe cases examined here.
Commonly, the firm operating in a reasonably competitive environment hasavailable three possible ways to improve profits: reduce fixed cost, reducevariable cost, or sell more. In this sense, the successful and unsuccessfulfirms clearly differed in their approaches. Successful firms developed internal efficiencies that reduced both fixed and variable costs, while unsuccessfulfirms attempted to remedy their situations by selling more or by acquiringadditional business segments.
The Turnaround Experience: Real World Lessons in Revitalizing Corporations and Organizations

Although revenue expansion is subject to pitfalls, quite often turnaroundagents pursue it as their primary strategy to improve profit performance. One possible explanation may be that selling is perceived as less painful thanreducing costs. Very few managers enjoy reducing costs, especially if people are involved. It is often more comfortable to launch new programs aimed atgenerating new business than to institute broad programs of internalefficiency. In addition, turnaround agents may not possess the skillsnecessary to implement efficiencies (organizational skills, technical skills,motivational skills). Also, most business downturns since World War II have been mild and short and often managers are not expecting and are notprepared for more serious downturns of longer duration. Whatever thereasons, managers often procrastinate in improving efficiency and opt instead for revenue expansion. Yet, we should look closely at the economics ofbreaking even to determine under what conditions revenue expansion andcost reduction will work.
As a practical matter, the relationship between revenue changes and costchanges is quite intricate and seldom can it be suitably described by asimple diagram. Still, it is useful to explore the revenue and cost relationship as an ingredient in strategy formulation for the troubled firm. We should beparticularly interested in small incremental changes in the position the firm is presently operating from. We can begin by examining the changes that takeplace in both revenue and cost when there are changes in unit volume. Asmore (or fewer) units are sold, revenue changes, yielding the incrementalrevenue per unit.
Incremental revenue = change in revenue change in units of output
Costs also change as more (or fewer) units are produced, yieldingincremental cost per unit.
Incremental cost = change in cost change in units of output
Although it makes intuitive sense to examine costs as a function of thenumber of units produced, most companies produce such a wide variety ofproducts in different price categories that analysis of costs in relation to thenumber of units produced has practical limitations. For these reasons, it ismore practical to examine costs in relation to revenue. This is not a seriouslimitation if we are dealing with firms that have extensive competition,which is certainly the case with most firms in turnaround situations. Oneway of looking at incremental cost is to express it as a ratio of the changein cost divided by the change in revenue. For instance, if cost changes by$85,000 when revenue changes by $100,000, then incremental costs are 0.85or 85 percent of incremental revenue.
Incremental cost rate = change in cost = $85000 =0.85 change in revenue $100,000
We could also look at the matter from the perspective of incremental profit.In our example, the incremental profit would be 0.15, or 15 percent ofincremental revenue.
46

Incremental profit rate = change in profit = $15,000 = 0.15 change in revenue $100,000
In the United States, accurate data on incremental revenue and incrementalcost are not commonly available in the conventional accounting records, sothe turnaround manager is left to deal with some cost problems intuitively.Our understanding of the economics of breaking even could be improved ifeven the fixed and variable costs were neatly divided into identifiablecategories on the accounting statement, but they are not. The accountingconcepts of direct and indirect costs are helpful, and sometimes they areinterpreted to have meanings similar to “variable” and “fixed costs.”However, real-world conventions impede the use of this information. Often,variable selling or customer service expenses are included as indirect cost,and the standard costs used to describe the costs of production includeoverhead costs, which in reality are quite fixed. As Oscar Morgenstern(1954, 1959) has observed, traditional accounting practice does notcorrespond closely with economic theory.
An additional problem arises because of the lack of uniformity amongindividual companies and sometimes even within the same company. Thislack of uniformity in accounting treatment, though less of a problem nowthan earlier and less of a problem here than in some other countries, is stillappreciable enough so that comparisons between companies are difficult. The most scrupulous company-to-company comparisons of product cost figuresand breakeven points can provide only rough approximations. Evenday-to-day conventions such as how time cards are charged can affectintracompany comparisons. For those interested in business history as a form of analysis, we have the added complexity of accounting conventionschanging over time.
Still, we do have information that provides some insights into changing costpatterns during the turnaround process. In this investigation, incremental cost changes were compared with incremental revenue changes for 16 companiesover several decades. The time periods for the individual companies rangedfrom 20 to 50 years. Business cycles spanned both good times and bad. Two important questions about cost grew out of this analysis and both arerelevant to turnaround situations:
1. Are variable costs sometimes much greater as a percentage of revenue than we may have suspected? The data in some of the cases examined suggest thatvariable costs can run from 90 to 110 percent of revenue. Several companiesspent more money getting additional business than they received by getting it. Incremental costs advanced faster than incremental revenue. This findingimplies that severe limitations apply to revenue expansion strategy as aremedy for turnaround situations unless expansion is preceded by efficiency.
2. Are variable cost rates constant over short-range changes in revenue or arethey higher when revenue is increasing than when revenue is falling off? Theinformation collected in the cases we examined suggests that if revenue isincreasing, costs commonly increase by a high percentage (for example, 95percent of revenue). However, if revenue drops it is likely that a lower
The Turnaround Experience: Real World Lessons in Revitalizing Corporations and Organizations

percentage will be saved (for example, 70 percent of revenue). With respect to revenue movements away from a particular point, variable costs (as a percentof revenue) are usually higher going up and lower going down.
The notion of marginal cost generally implies that costs of small changes inoutput are bidirectional. An increase in revenue should increase cost.Reductions in revenue should provide some cost relief. However, long agoeconomists observed the stickiness of cost during periods of decliningrevenue. More recently, Jeffrey Ford (1980) referred to the lack ofbidirectionality in cost movements as “structural hysteresis,” awell-developed concept describing how decreases in structure during periodsof decline do not follow the same path as increases in structure duringperiods of growth.
This resistance to cost reductions during periods of declining revenue wasconfirmed in Ford's analysis of companies in distress. Costs do decline when revenues decline, but not by nearly as much as they increase when revenueincreases. A check valve seems present in the system. Firms often addsizable costs when revenue increases and cut back slightly when revenueretreats. The difference ranges greatly from firm to firm, but the magnitudeof this difference can be around 25 percent. If revenue goes up by $1.00,perhaps $0.90 or $0.95 will be added to costs. If revenue drops by $1.00,costs will be reduced by only about $0.70 or $0.80 and sometimes far less.
Upside and downside efficiency refers to the degree cost varies as revenuefluctuates. When revenue is Increasing and incremental cost increases arelow as a percentage of incremental revenue, and the resulting incrementalprofit is correspondingly high, this condition is referred to as upsideefficiency. When revenue is decreasing and incremental cost reductions arehigh as a percentage of incremental revenue, and the resulting incrementalprofit erosion resulting from declining revenues is reduced, this condition isreferred to as downside efficiency.
In order to illustrate this point further, let us examine the changes in revenue and costs in the automobile industry after World War II. Generally, mostproducers saw their revenue increase during this period, but so did cost.There were, however, periodic reversals, some quite severe. In order togather more definitive information about the performance of cost duringdifferent economic periods, these were roughly divided into economicallyidentifiable periods such as the postwar buyers market and the auto slump of the early 1980s.
48 Chapter 4 — Achieving Operational efficiency
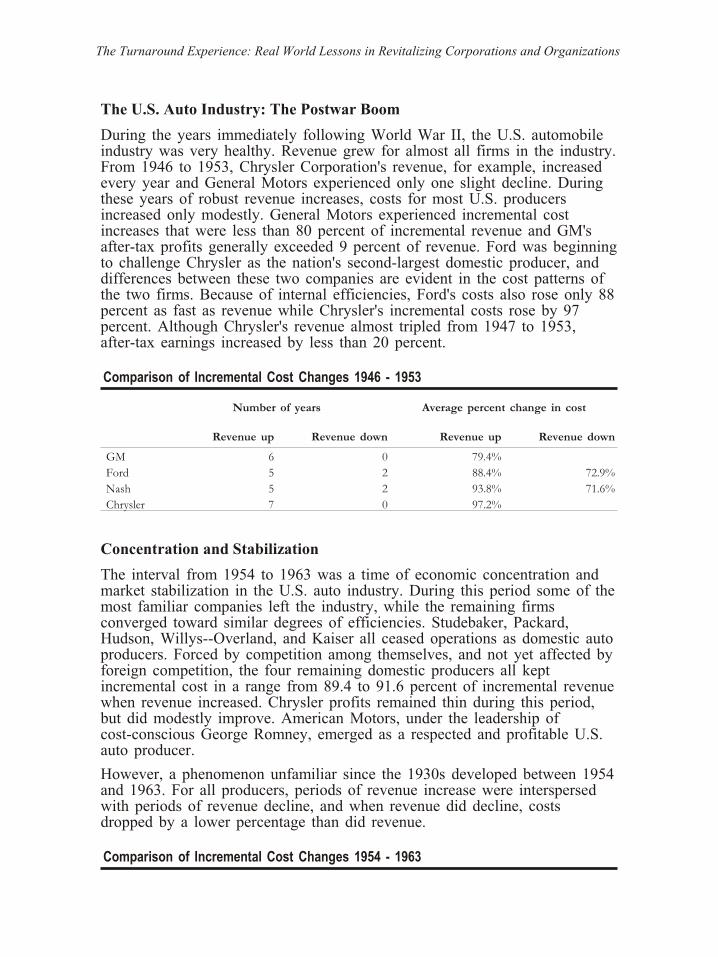
The U.S. Auto Industry: The Postwar Boom
During the years immediately following World War II, the U.S. automobileindustry was very healthy. Revenue grew for almost all firms in the industry. From 1946 to 1953, Chrysler Corporation's revenue, for example, increasedevery year and General Motors experienced only one slight decline. Duringthese years of robust revenue increases, costs for most U.S. producersincreased only modestly. General Motors experienced incremental costincreases that were less than 80 percent of incremental revenue and GM'safter-tax profits generally exceeded 9 percent of revenue. Ford was beginning to challenge Chrysler as the nation's second-largest domestic producer, anddifferences between these two companies are evident in the cost patterns ofthe two firms. Because of internal efficiencies, Ford's costs also rose only 88 percent as fast as revenue while Chrysler's incremental costs rose by 97percent. Although Chrysler's revenue almost tripled from 1947 to 1953,after-tax earnings increased by less than 20 percent.
Comparison of Incremental Cost Changes 1946 - 1953
Number of years Average percent change in cost
Revenue up Revenue down Revenue up Revenue down
GM 6 0 79.4%
Ford 5 2 88.4% 72.9%
Nash 5 2 93.8% 71.6%
Chrysler 7 0 97.2%
Concentration and Stabilization
The interval from 1954 to 1963 was a time of economic concentration andmarket stabilization in the U.S. auto industry. During this period some of the most familiar companies left the industry, while the remaining firmsconverged toward similar degrees of efficiencies. Studebaker, Packard,Hudson, Willys--Overland, and Kaiser all ceased operations as domestic auto producers. Forced by competition among themselves, and not yet affected by foreign competition, the four remaining domestic producers all keptincremental cost in a range from 89.4 to 91.6 percent of incremental revenue when revenue increased. Chrysler profits remained thin during this period,but did modestly improve. American Motors, under the leadership ofcost-conscious George Romney, emerged as a respected and profitable U.S.auto producer.
However, a phenomenon unfamiliar since the 1930s developed between 1954 and 1963. For all producers, periods of revenue increase were interspersedwith periods of revenue decline, and when revenue did decline, costsdropped by a lower percentage than did revenue.
Comparison of Incremental Cost Changes 1954 - 1963
The Turnaround Experience: Real World Lessons in Revitalizing Corporations and Organizations

Number of years Average percent change in cost
Revenue up Revenue down Revenue up Revenue down
Chrysler 6 3 89.4% 92.2%
Nash/AMC 6 3 90.4% 88.3%
GM 6 3 90.5% 86.7%
Ford 6 3 91.6% 82.6%
From Prosperity to Tension
During the mid-1960s most domestic auto producers enjoyed some of thebest years in the history of the U.S. industry. General Motors' profitsexceeded $2 billion and 10 percent of revenue in 1965. Chrysler's profit ratein 1963 was the best it would be for the next 19 years. Ford also enjoyedrecord profits in 1965. As the high growth period of the 1960s drew to aclose, however, several domestic producers began to experience problems.Markets shrank with the recession of 1970. Competition from foreign autoproducers became significant for the first time, and the oil crisis of the early 1970s brought volatility to markets and changed consumer tastes forautomobiles. In spite of generally increasing sales, the fortunes of U.S. autoproducers began to decline.
For Chrysler Corporation, revenue increased during 7 out of 9 years duringthis period, but incremental cost rates crept up to nearly 97 percent ofincremental revenue. Ford's revenue increased 8 of 9 years, but incrementalcost rose to over 99 percent of incremental revenue. While Ford's revenuesdoubled from 1965 to 1972, profits increased only 23 percent. Revenue forGeneral Motors increased only 6 of the 9 years, but incremental costsremained at 89 percent. Although AMC had only 3 years where revenueincreased, incremental costs remained low as a percent of revenue.
However, downward trends in revenue continued for several U.S. autoproducers from 1964 to 1972. Business, in general, was becoming morevolatile. In addition to the volatility, an important phenomenon developed:the industry had significantly lower rates of decline in incremental costduring the years when revenue fell. For GM, costs declined only 43 percentof revenue during down years. For Ford and AMC, the figures were 68percent and 55 percent. Chrysler costs declined by 51 percent of revenuedeclines in 1969 and then increased during 1970, another down year. Acommon situation with uncompetitive firms was taking place in the U.S. auto industry. When revenue increased, costs increased nearly as much; whenrevenue declined, not much money was saved. This is the folly of therevenue-expansion strategy for inefficient firms.
Comparison of Incremental Cost Changes 1964 - 1972
50

Number of years Average percent change in cost
Revenue up Revenue down Revenue up Revenue down
AMC 3 5 86.6% 54.7%
GM 6 3 89.1% 43.4%
Chrysler 7 2 96.7% -25.7% *
Ford 8 1 99.2% 68.6%
* Chrysler Corporation incremental costs increased 26 percent when revenue declined.
Loss of Control
By the mid-1970s, the cost situation of U.S. auto producers had becomecritical. Even during the better years, when revenue was increasing, costswere generally increasing faster. U.S. products were becoming harder to sell. Consumers, now faced with viable alternatives from other countries, were no longer willing to accept cost increases routinely passed along by the majorU.S. auto producers. Inefficiencies caused costs to rise at rates the marketwould not absorb. Only GM managed to keep average incremental costsunder 100 percent of revenue, but even at GM, profit margins sank. Thecompany that had after-tax profit rates of more than 10 percent in 1964 and1965 was earning 4 percent in 1979 and operating at a slight loss in 1980.
The combination of higher incremental costs during up years, lowerincremental costs during down years, and increasing numbers of down yearsresulted in disaster for the U.S. auto industry. In the late seventies, U.S. auto producers lost billions of dollars and Ford, Chrysler, and AMC teetered onthe brink of insolvency. Survival required major changes in productdifferentiation and improved internal efficiencies. The dire situations at Fordand Chrysler prompted rapid adaptation to the environment. AMC did notadapt sufficiently and ultimately ceased operations as a separate company.
Comparison Incremental Cost Changes 1973 - 1980
Number of years Average percent change in cost
Revenue up Revenue down Revenue up Revenue down
GM 6 2 97.7% 61.6%
Chrysler 4 4 107.8% 68.1%
AMC 6 2 101.2% 102.2%
Ford 7 1 119.4% 57.8%
Adaptation and Rebuilding
By the early 1980s, it became clear that the U.S. automotive industry wouldhave to change radically in order to survive. Massive re-engineeringprograms were instituted at Chrysler and Ford in particular. Fixed costs and
The Turnaround Experience: Real World Lessons in Revitalizing Corporations and Organizations

variable costs were trimmed, and giant steps were taken to improve theinternal efficiencies of both firms. Quality became an essential ingredient tosales, and end-product quality became a high priority at both firms. Toimprove end-product quality, in-process quality was also improved. Within-process improvements came an important fringe benefit: operationalefficiency greatly improved because of fewer internal stoppages and rerunsdue to bad parts. Other steps to improve efficiency were also taken and theU.S. auto industry was able to produce more new models, each with moreadvanced engineering features, and bring them to market more quickly and at lower cost. All these tasks were accomplished with smaller staffs.
The recession of the early 1980s did not affect GM as severely, and GM did not make as many fundamental changes to improve efficiency. This mayhave been the company's undoing. By the late 1980s, GM's profit marginsshrank further and it lost significant market share.
Comparison Incremental Cost Changes 1981 - 1987
Number of years Average percent change in cost
Revenue up Revenue down Revenue up Revenue down
GM 4 3 79.3% 100.3%
Chrysler 2 4 89.0% 87.0%
AMC 4 3 107.5% 172.3%
Ford 4 2 125.3% 654.0%
How Efficiency Changes over Time
The above analysis of incremental revenue and costs shows how efficiencycan change over time and how it can be influenced by external factors suchas foreign competition and the availability of natural resources. The analysissuggests some refinements in our thinking about what should be done inturnaround situations.
The ratio of cost increase to revenue increase is one rough measure ofefficiency and over a prolonged period GM had the better record atgenerating additional revenue at a reasonable cost. However, thiscomparative advantage changed markedly over the years. In the 1940s, GMspent only $0.79 to obtain an additional $1.00 in revenue. By the 1970s, this ratio rose to $0.98. Although GM's profit margins still ranked as the bestamong American producers at the time, the 1970s was a period of declinevis-a-vis GM's previous performance. From 1981 to 1987, GM's performance has improved but less than either Chrysler or Ford in terms of this measureof efficiency.
Chrysler and Ford had similar performance from 1947 to 1980 with onedistinction: Ford's efficiency in generating new revenue worsenedconsiderably from 1950 to 1980 going from roughly 88 to 119 percent.
52

However, the company actively reduced costs when revenue declined, whileChrysler and GM lagged Ford by 8 to 10 percent in this regard.
American Motors was threatened more by mediocre downside efficiencycoupled with too many down years than by its weakness in upsideefficiency. During American Motors' turnaround from 1954 to 1963, itsperformance was very respectable. Upside efficiency was roughly equal tothat of GM and Ford and downside efficiency was better. From 1964 to1972, after the departure of George Romney, American Motors' upsideefficiency performance was again acceptable. American Motors handledrevenue increases well, and the firm did a better-than-average job withrevenue declines, but, since declines are less efficient than advances,American Motors gradually lost ground and the firm ultimately ceasedoperations as a separate company. The experience of American Motorsreinforces the interdependence of low-cost operation and productdifferentiation.
Chrysler's improvement in upside efficiency since 1980 is only a part of thestory. Some of the Chrysler turnaround was due to the downside efficiencyachieved in the years prior to 1981. The substantial cost reductions of almost $6 billion initiated from 1978 to 1980 were crucial in the Chryslerturnaround of the 1980s.
The Strategic advantage of Upside and Downside Efficiencies
Both upside and downside efficiencies are important in turnaround situationsin several ways. Turnaround progress is very slow if each additional dollarof revenue costs close to or more than a dollar to obtain. This was often thecase with International Harvester in the 1960s and 1970s, Studebaker in the1950s, and Hudson in the late 1920s. There continues to be evidence todaythat, in several industries, firms are spending incrementally more to attractand conduct business than they are receiving in incremental revenue, acondition indicating a fundamentally weak competitive position.
Comparing Deere and International Harvester offers another example ofradical differences in internal efficiencies. The relative performances ofDeere and International Harvester ebbed and flowed over the years, andthere were times when IHC did better. However, Deere gradually gainedground on IHC because of more internal efficiencies. For most of the past50 years, Deere captured additional revenue at significantly lower costs thanInternational Harvester. Gross profits at Deere were about 70 percent higherthan IHC's, and incremental profit rates were roughly double. This pattern of achieving greater internal efficiency began in the 1930s, when Deere wasone-eighth the size of IHC. The pattern continued through the 1970s and1980s, when Deere overtook International Harvester in both revenues andprofits up to the point in 1985 when International Harvester exited theindustry, where at one time it had held a 70 percent market share amonglong-line producers.
The Turnaround Experience: Real World Lessons in Revitalizing Corporations and Organizations

Figure 4-2 may be representative of the true breakeven situation of theindustrial firm that lacks upside and downside efficiency. Being able tocapture additional revenue at a reasonable cost is an especially keyingredient to the successful turnaround. This capability reduces the demandon resources, increases profits once they are obtained, and moves the firm'sbreakeven point to the left.
The economics of breaking even is a subtle ingredient in turnaround success, and some managers never fully understand the intricate relationships between costs and revenue. Consequently, the revenue expansion strategy is oftenpursued as the major remedy while efficiency moves are neglected.Unsurprisingly, profits are seldom fully restored. Revenue restoration is ofimmense consequence to the troubled firm, but successful exploitation of therevenue expansion strategy depends upon attaining both upside efficiencyand product differentiation.
54

Low-Cost Operation and Product Differentiation Interrelated
For turnaround situations, the important variables of low-cost operation andproduct differentiation are interrelated. Low-cost operation affects productdifferentiation by providing resources that enable the company to moreadequately differentiate its products. Product differentiation also impactslow-cost operation by reducing the frequency of revenue decline, when costs may be reduced by a lower percentage than the falloff in revenue. Profitsinevitably shrink if product differentiation is not continuously enhanced, andthis crucial relationship between product differentiation and low-costoperation is one reason why “cash cow” or “harvest” strategies seldom work in the real world. The harvest strategy produces an inherently unstablecondition in which managers mistakenly assume that market position can beheld without investment.
Figure 4-2. Possible breakeven chart for a troubled firm. Howprofitability changes as revenue changes is wholly dependent upon the behavior of variable cost and the presence or absence of upside anddownside efficiency. The typical dilemma of the inefficient firm is thatwhen revenue increases, costs increase by nearly as much, thuslimiting the effectiveness of the revenue expansion strategy.Correspondingly, when revenue falls, expenses are not proportionatelyreduced. For profitability to be improved, efficiency moves mustprecede strategic moves.
Successful turnaround agents understand the imperative to improveorganizational performance and reduce cost simultaneously and they possessthe managerial skills to accomplish more with fewer resources. Some ofthese attributes will be discussed in later chapters. Successful turnaround
The Turnaround Experience: Real World Lessons in Revitalizing Corporations and Organizations

agents understand that any attempt to sell an undifferentiated or low-qualityproduct by employing greater resources will most likely result in greaterexpenditures and greater losses. The appropriate strategy is efficiency first,then get the product right, and sell later. This sequence of actions has proved to be the most effective in achieving turnarounds that last.
Because low-cost operation and product differentiation interact positively toreinforce competitive strength, efficiency must be asserted in every aspect ofthe organization in order to effect recovery. The turnaround agents observedin this analysis understood the importance of efficiency and allocatedsignificant portions of their own time to ensure that efficiency was improved. Following this step, product differentiation was improved so that sales couldbe obtained with fewer resources.
The matter of operational efficiency must be examined in excruciating detail. Mere conceptual knowledge that efficiency must be improved is notsufficient in implementing a turnaround. Specific managerial and technicalsteps must be taken to restore the operational efficiency of the troubled firm. This means that managers must commit their time and be present on thefactory floor or at those locations where the firm's chief value-addedactivities take place. Achievement of low-cost operation also involvesextensive technical knowledge of company products and of operationalprocesses. The achievement of low-cost operation is an outgrowth of specific knowledge rather than general conceptual knowledge. The process involvesknowing what the product is like, how it can be changed, what productionequipment can do, what people can do, and how to integrate all theseimportant variables into a cohesive, effective, goal-integrated system whichwill last.
Practical Lessons on Operational efficiency
· Concentrate on efficiency first and then concentrate on marketing andsales. Revenue expansion based upon inefficient operations results insevere operating losses.
· Successful companies reduce cost to present revenue levels. Unsuccessfulcompanies attempt to increase revenue to cover existing costs.
· Implement proven efficiencies immediately—but work through people.
· Achieve scale economies on a component or process basis. Do notconsider the size of the overall business unit.
· Retain and develop managers who know how to achieve efficiencies inthe industry being served.
· Work productively with suppliers to reduce product cost—but do so onthe basis of trust.
· Constantly reinvest to sustain and improve efficiency—but understandoperational processes well enough to know what really pays off.
56

Case Histories
In 1910, the fledgling Buick Motor Company and its younger parent, theGeneral Motors Company, experienced a problem common to manyexpansion-minded firms. Expansion and acquisitions caused cash to run short and for a brief period, General Motors was in jeopardy. Buick and GMemerged from the crisis to continue much stronger than before, benefittingfrom the forethought that preceded the crisis and the corrective measures that were taken during it. Nearly 70 years later, as the venerable InternationalHarvester Corporation completed the most profitable year in its history, thecompany was moving into a period of decline which would ultimately causeit to exit from its major business. The early history of Buick and the recenthistory of International Harvester provide useful illustrations of the practicalsteps that must be taken to restore the companies to a position of low-costoperators.
Case 1 — Masters of Production at Buick
In Flint, Michigan, in 1899, David Dunbar Buick organized the BuickAuto-Vim and Power Company for the purpose of building engines for marineand agricultural use. In 1902, the company was reorganized as the BuickManufacturing Company. From the very beginning, Buick engines utilizedoverhead valves, an engine design principle that David Buick thought wouldultimately become the standard for the industry. But Buick was less a promoter than an engineer and soon found it necessary to seek financial backing fromsome local businessmen. Among the businessmen who expressed an interest inDavid Buick's work was William Crapo Durant, who headed one of Flint'smost successful businesses, the Durant-Dort Carriage Company, and had otherbusiness interests. As the grandson of a prominent lumberman and governor of Michigan, the nephew of a congressman, and a prominent business executive in his own right, Durant had many associations with the financial community inthat part of Michigan. His own financial backers included most of theprominent people in Flint (Dunham and Gustin 1985, 10 to 61).
Within a few months, Billy Durant infused money into the Buick MotorCompany and took control. Under Durant, the Buick Motor Companyincreased promotional activities, established an extensive distribution system,developed several new models, and set up manufacturing processes for all ofthem. Buick soon became one of the nation's leading producers of automobiles. Buick's unit sales increased from 37 in 1904 to 8820 in 1908, making Buick the largest single producer of automobiles. Its production total exceeded thecombined total of the two next-largest producers, Ford and Cadillac (Dunhamand Gustin, 1985).
Durant was seldom satisfied with the status quo, and he began to lay plans forbuilding Buick into the largest automotive complex in the world. Durant,
The Turnaround Experience: Real World Lessons in Revitalizing Corporations and Organizations

personally, could promote the company and raise capital, but he did not possess the necessary technical skills and he was not interested in handling importantday-to-day matters. To achieve his goals, Durant needed technical andmanagerial talent to augment his own entrepreneurial skills. David Buick left the company in 1908, and Durant never recruited experienced manufacturingpersonnel. Even though the Buick Motor Company was first in unit sales, itproduced so many models that its breakeven point kept rising.
Durant's strategy was to build an automotive empire through acquisition underthe umbrella of the newly formed General Motors Company, with the Buickoperation in Flint as its backbone. By mid-1910, Durant had either purchasedor negotiated cooperative arrangements with 30 companies involved in theproduction of automobiles and parts. Some of these, such as Cadillac andChampion Ignition, turned out to be excellent acquisitions, but many of theremaining operations such as Elmore, Welch, and Heany Lamp had severeproblems. Losses incurred by Heany Lamp alone were estimated at $12 million(Dunham and Gustin 1985). In these early years of GM, only Cadillac, Buick,and a few component divisions made substantial profits. Most of the otheroperations lost money, sometimes lots of money. Since many of Durant'sacquisitions were financed on the back of the Buick balance sheet, the company was heavily in debt. Buick's debt alone, was estimated at $7 million.
Meanwhile, both technical and sales problems surfaced at Buick. An internaldebate had developed over the future of the division's leading car, the Model10, as some Buick directors felt the company could not effectively competebuilding a low-priced car. Given Buick's high breakeven point at the time, theconcern may have been well placed. Ultimately, the Model 10 was droppedfrom the 1911 Buick line and sales for 1911 fell by 55 percent. Buick's marketshare declined from 17 percent in 1910 to less than 7 percent in 1911 (Table4-2).
By 1910, GM was in financial trouble. An interim loan was negotiated duringthe summer of 1910, only after a persuasive speech by Wilfred Leland ofprofitable Cadillac. But cash needs remained high and Buick sales continued toslip. By November of that year, the company again needed cash. A syndicateled by the Seligman and Lee Higginson firms agreed to underwrite a loan of$15 million, with many strings attached. Durant was relegated to a backgroundposition. The board of directors and the important finance and executivecommittees were all reorganized, and James J. Storrow of Lee Higginson wasnamed president of GM. Two months later he was succeeded by anothermember of the banking fraternity, Thomas Neal. However, during this period,James Storrow's influence remained very high.
The new regime began to take action to improve production by drawing uponthe established production expertise of Cadillac. Cadillac, Champion Ignition,
58

and Weston-Mott were operating quite well, but severe problems existed atOldsmobile, Oakland (later to become Pontiac), and at several other GMoperations. Meanwhile, with the onslaught of problems at Buick, it becameapparent that more professional technical management was needed. At aboutthe time of the banking crisis, Charles Nash, an experienced productionmanager with Durant's old Durant-Dort Carriage Company, was asked to jointhe Buick organization. When Storrow's influence rose in GM, he quicklysought a more lasting solution to the management problems of GM's largestoperation and Nash was appointed head of Buick after being recommended byDurant. In 1911, with the help of James Storrow, Nash hired another technicalman to assist in Buick's turnaround, Walter Chrysler. Chrysler was a formerlocomotive mechanic who became the Pittsburgh plant manager of AmericanLocomotive Company. Chrysler was anxious to enter the automotive businessand took the position at Buick at a substantial reduction in pay (Chrysler 1937).
Table 4-2. Buick Production 1904 to 1921
Year Number of models Price range Units produced
1904 1 $750 37
1905 1 $750 to $1200 750
1906 2 $1150 to $1250 1,400
1907 5 $1150 to $2525 4,641
1908 4 $900 to $2500 8,820
1909 5 $900 to $2750 14,606
1910 6 $950 to $2750 30,525
1911 8 $800 to $2750 13,389
1912 5 $900 to $1725 19,812
1913 4 $950 to $1650 26,666
1914 3 $950 to $1985 32,889
1915 4 $900 to $1635 43,946
1916 3 $985 to $1875 124,834
1917 2 $660 to $1835 115,267
1918 4 $790 to $1845 77,691
1919 2 $1595 to $2585 119,310
1920 2 $1495 to $2695 115,176
1921 2 $1795 to $3295 82,930
Chrysler and Nash were different as people but shared some common interestsand traits. Both were from modest backgrounds. Chrysler was a farm boy from Kansas, Nash an orphan born in Illinois and raised in Michigan. Neither had acollege education. Both worked hard and demanded results. Nash was a bitmore reserved than Chrysler, but they worked well together. While WalterChrysler was implementing improvements to make the shop more productive,Nash was organizing the company and reducing the inventory. Chrysler andNash were friends with Henry and Wilfred Leland of Cadillac, and both were
The Turnaround Experience: Real World Lessons in Revitalizing Corporations and Organizations

occasional visitors to the Leland country home in Wilchester, where there wasan opportunity to discuss alternative approaches to manufacturing (Leland 1966, 114).
During the time Chrysler and Nash worked together at Buick, they took manysteps to improve the effectiveness of Buick operations: they reduced inventory,improved financial controls, developed a new six-cylinder Buick, and madepainting and assembly operations substantially more efficient. They also reduced the number of major models offered from eight models to two with theresulting improvement in parts commonality. They oversaw other improvements in the production processes that resulted in Buick's output increasing from 45cars per day in 1911 to 200 per day in 1915. Walter Chrysler described some of the activities in his book, Life of an American Workman:
We evolved a better working method merely by supporting the roof onstouter trusses and taking out the posts that were in every workman's way.
We were doing our painting before we started to assemble; in that way wecould have a stock of parts painted and ready without holding up otherworkmen. Then we developed a way to squirt paint, using air pressure; itwas the old principle of the atomizer. We went on with one improvementafter another until, in that same room, instead of merely forty-five cars wewere making 200 cars each day.
When you had figured out a way to speed the crankshaft flow, some otherkink would be revealed. Starting with the assembly line, we workedbackward through the plant until everything was tied in. Every new thingwas an invention....The motors began to get their shapes riding on aconveyer line; then the axles, crankshafts, camshafts; until now it would be difficult to find an operation which requires men to exert their muscles like they used to. The workmen have machines to do their bidding....Out of ourinsistent needs, machine tools were developed. A machine tool salesmanwould no sooner show his head inside my office than we'd be after him:“We have to have a machine that can do.” Then he'd take his pencil outand write down what we needed… We were making the first machine ofconsiderable size in the history of the world for which every human beingwas a potential customer.
Henry Ford, after we developed our line, went to work and figured out achain conveyer; his was the first. After that, we all used them. Instead ofpushing the cars along the line by hand, they rode on an endless-chainconveyer operated by a motor. (Chrysler 1937, 135 to 137).
In 1912, Nash became president of General Motors and continued to workwith James Storrow to improve its effectiveness. In a formal sense, Nashremained head of Buick while he was also president of GM. However, WalterChrysler was heavily involved in the day-to-day responsibility for Buick.
During the Nash-Storrow regime, many inefficient manufacturing operationswere eliminated. Buick, Cadillac, Oakland, Oldsmobile, and General Motors
60

Truck became the surviving end-product manufacturing divisions. Many product improvements were made and a program of testing and product evaluation wasinitiated. Significant progress was made in attracting competent administrativeand technical talent. Some progress, although it was far from complete, waseven made in getting the sprawling GM empire to work together. GM emerged from the banking crisis intact, with its competitive position greatly strengthened (Fink 1975, 64).
One of the most notable aspects of the Buick turnaround was the systematicconcentration on a smaller number of more thoroughly tested and moreefficiently produced production models. In 1911, Buick produced 13,389 carsdivided among eight basic models for an average of 1673 units per model. In1917, Buick produced 115,267 cars divided among two models. Averageproduction per model had increased from 1673 to 57,633.
Many engineering improvements were introduced during the Nash-Chrysler eraat Buick, including improved lubrication and braking systems, more efficienttransmissions, and easier access to frequently replaced parts. In 1914, thecompany completed development of a new overhead valve six-cylinder engine.Consistent with the efficiency and standardization programs instituted by Nashand Chrysler, all Buick engines now standardized on a 3.75 inch bore, thuscreating the opportunity for further sharing of component parts.
Product quality and in-process quality also received the attention of Buickmanagers. They added centrifugal water pumps and dual ignitions to the Buickproduct line along with diagonal struts to stabilize suspension characteristics.The firm adopted a slogan which reflected the program of constantimprovement. The slogan served the division well for the next 50 years. “When better automobiles are built, Buick will build them” (Dunham and Gustin1985).
The sound management practices of Nash, Chrysler, and other members of the General Motors team, from 1911 to 1915, allowed the firm to grow andprosper. From 1911 to 1916, General Motors sales increased 3.7 times whileprofits grew 7 times. By 1915, GM was making more than 15 percent netprofit and reinvesting most of the earnings in the business. (Table 4-3).
Meanwhile, Billy Durant was busily forming a new venture called Chevrolet.Durant raised a huge sum for those days, $80 million. However, instead ofusing all the money to build Chevrolet automobiles, Durant used much of it to buy GM stock with the objective of regaining control of GM. Storrow andNash unwittingly played into Durant's hands by holding down dividends infavor of reinvesting the proceeds in improving the company's operations. Many stockholders interested in short-term gains were therefore attracted to theDurant camp. In January 1916, the fledgling Chevrolet Motor Company became
The Turnaround Experience: Real World Lessons in Revitalizing Corporations and Organizations

the controlling owner of the General Motors Company. Durant had regainedcontrol.
Table 4-3. General Motors Company
Sales Profits and Reinvested Earnings 1911 to 1915
Year Sales Net profits Profit rate % Reinvested
earnings
1911 $42,733,303 $4,066,251 9.5 $2,474,177
1912 64,744,496 4,746,756 7.3 2,856,082
1913 85,603,920 8,184,053 9.6 6,410,937
1914 85,373,303 7,819,968 9.2 620,105
1915 94,424,841 14,794,191 15.7 13,408,839
1916 156,900,296 28,789,560 18.4 17,010,437
Source: Lawrence Seltzer The Financial History of the North American Automobile Industry Houghton MifflinBoston 1928 pp. 230-231.
The regaining of control by the Durant interests caused some of GeneralMotors' most experienced managers to depart (Chandler 1962). In June 1916,Nash resigned to take over, with Storrow's backing, the Thomas B. Jefferycompany in Kenosha, Wisconsin, the enterprise that eventually becameAmerican Motors. Chrysler remained head of Buick, and Buick continued toprosper. By 1919, Buick was making half of GM's total profit (Fink 1975, 120). Yet, in spite of the warm feeling that existed between Durant and Chrysler,Durant continued to interfere. In 1919, a final argument ensued over themanufacture of auto frames—Durant wanted to build them, Chrysler wanted to buy them from A. O. Smith, an innovator in frame-making processes and oneof GM's most trusted vendors. Chrysler retired in 1919.
From 1917 to 1921, Buick continued to be a strong contributor to the progress of GM, accounting for roughly 60 percent of its unit sales. But Buick could not contribute enough to overcome Durant's ambitious acquisition and spendingplans. In 1921, GM faced another crisis owing to a slowdown following WorldWar I and Durant was removed permanently. In the meantime, Chrysler, Nash, the Lelands, and several other key people left to pursue other opportunities.But they left behind them a legacy of operational efficiency along with a cadreof trusted associates that served GM well for many years.
The Buick turnaround of 1911 to 1920 was one that focused on businessbasics, primarily production basics. Chrysler and Nash worked hard, studiedhard, instilled values, taught other people, and, judging by externals, abided by a code of traditional morality. Most important, both were masters of production.They knew a great deal about how to produce quality products at a lower cost.
62

Nash's approach to finance was quite basic, he didn't spend much. When hedid, it was to improve the company rather than to enhance executiveperquisites or to acquire silly external signs of company prosperity. Chrysler saw the need to cultivate a strong productive working relationship with suppliers, abelief that finally contributed to his departure from GM.
The primary strategy behind the Buick turnaround was to become a low-costproducer by dramatically improving operational efficiency through incrementalimprovement, better product design, and a smaller number of productionmodels. Financial resources were deployed to provide for the long-termdevelopment of the company, a policy that left the firm somewhat vulnerableto the 1916 equivalent of a hostile takeover.
Buick Survived Because…
· Operational efficiency was vastly improved.
· Top management understood the strategic advantage of goodmanufacturing.
· Parts were made more common.
· Run sizes were increased by focusing on fewer models.
· Quality was improved.
· Earnings were reinvested to further improve operational efficiency.
· Process improvements were researched and implemented.
The Turnaround Experience: Real World Lessons in Revitalizing Corporations and Organizations

Case 2 — The Harvesting of International Harvester
In 1979, the International Harvester Company (IHC) reported record revenuesof more than $8 billion and record earnings of $370 million. The company had enjoyed a long and noble history as one of the most significant industrial firmsin the history of the United States. Yet 3 years later, this huge, prestigiouscompany was losing more than a billion dollars per year and was teetering onthe brink of insolvency. In 1985, International Harvester was forced byeconomic circumstance to divest itself of what was, for most of its history, itsmajor business, agricultural equipment—an enormous business in which IHChad been by far the dominant producer. International Harvester’s failure wasnot due to lack of size, product recognition, market position, or experiencedfinancial managers. It had all of these. International Harvester failed because itcombined several characteristics that almost always lead to disaster—rampantinefficiency, lack of focus on the day-to-day aspects of the business, managerialarrogance, and industrial inexperience on the part of top management.
International Harvester was formed in 1902 as an outgrowth of the mergeractivities of J. P. Morgan. Many companies were merged into what becameInternational Harvester, among them McCormick Harvesting Machine Company (which dated back to the activities of Cyrus McCormick in 1831), the DeeringHarvester Co., Warder-Bushnell, Plano Harvester, and Milwaukee Harvester. Bythe start of World War I, International Harvester was the fourth-largest firm inthe country.
IHC continued as the market leader in agricultural equipment for well over ahalf century. During the early 1930s, the company was eight times the size ofits nearest competitor, Deere & Co. Revenues came from agriculturalequipment, trucks, steel, and other products. It emerged from World War II inexcellent financial condition, with after-tax profits at 7.1 percent of sales.Revenues from both the farm and the truck business segments were high. Theshortages caused by World War II and the Korean War produced a seller’smarket. But, as the seller’s market subsided in the late 1950s, some of IHC’slong-established competitors, such as Minneapolis Moline and Oliver, werebeginning to weaken.
International Harvester continued as the industry’s largest firm well into the1970s (though Deere did take over first position in agricultural machinery in1958). Still, IHC total revenues remained about 2 ½ times larger than those ofDeere & Co. The company was a leading supplier of farm equipment, trucks,construction equipment, appliances, and many other products. By 1963, thecompany employed 103,000 people, and the corporation’s individual revenues,apart from those of related suppliers and dealers, equaled one-third of 1percent of the nation’s entire gross national product.
64

Harvester, however, was a huge complex of many different businesses, very few of which were in strong competitive positions:
Harvester’s hefty dividends only exacerbated the strategic syndrome ofnurturing more businesses than it could afford… Instead of husbanding itsresources, Harvester drifted, propagating more businesses, ultimatelystarving them all, and, inevitably, losing market share in its three mainheavy equipment businesses. A former Harvester executive draws an oldhorticultural analogy: “You water all of the plants but you’ve got limitedwater, so none of your plants really blossom and produce the kinds offlowers that you want them to produce. (Marsh 1985, 123-124)
In 1962, an executive from the company’s aging Wisconsin Steel Division,Harry Bercher, became president of the company. Wisconsin Steel producedsteel solely for International Harvester and its profitability was difficult todetermine. Bercher continued to make investments in the steel business but did not seem to fully understand the mainstream businesses of the company(Christiansen et al. 1982). By 1971, after-tax earnings had dropped to 1.5percent of sales and Brooks McCormick, a great-grandnephew of CyrusMcCormick, took over to rejuvenate the company and execute a turnaround.International Harvester did improve under Brooks McCormick. From 1971 to1976, the following changes took place:
· Capital spending increased from $62.7 million to $168.4 million.
· Earnings rose from $45.2 million to $174.1 million.
· Return on sales rose from 1.5 to 3.2 percent.
· Agricultural equipment revenue increased from $857 million to $2262million.
· Total revenues grew from $2.9 billion to $5.5 billion.
In spite of the improvements made during the early 1970s, the company wasstill less efficient than several of its smaller competitors. Although InternationalHarvester was larger than Deere, Caterpillar, or Paccar, profit rates weresubstantially lower, a disparity that would have been even greater hadInternational Harvester invested as heavily in research and the development ofnew products. Value added per employee was two-thirds what it was at Deereand Caterpillar and three-quarters of what it was at Paccar (Christiansen et al.1982, 771).
Over several decades, International Harvester had slipped behind itscompetitors in product differentiation as well as in operational efficiency.Although the company was huge, revenues came as a result of offeringpractically every available product to the principle markets being served. Only a few individual product lines were market leaders. In most markets, IHC hadmajor, stronger competitors. IHC enjoyed a solid position in very large trucks
The Turnaround Experience: Real World Lessons in Revitalizing Corporations and Organizations

but lagged both Ford and GM in medium-sized trucks and almost everyone insmall trucks. In the worldwide truck market, IHC had to contend with many,very able foreign competitors including Benz, Saab-Volvo, Iveco, Hino,Mitsubishi, Renault, and Nissan. A similar situation existed in agriculturalequipment. Deere had taken over first place in farm equipment as the result ofdecades of superior operational efficiency, lower-cost product design, greaterinvestment in plant modernization, and better product development. The J. I.Case Division of Tenneco, Ford, and others, including some short-lineproducers, were all eating away at IHC’s market share.
In many respects, Brooks McCormick was a product of the environment hewas trying to change. The company was regarded as “staid, old fashioned,conservative, inbred and having little sense of direction” (Christiansen et al.1982, 762). McCormick set about to reorganize the company and instill newvigor. Two consulting firms were brought in to address the company’sorganizational structure and to assess manufacturing personnel utilization. Theresulting organization exhibited a fairly traditional group-divisionmarket-oriented structure of the type the United States employs to addressoverseas markets. This contrasted with the more functional organization thatIHC had been using for many years. Most of the leaders in the neworganization were also top-level managers in the old organization, but many had changed positions. Unfortunately, the new organizational changes did notdirectly address the company’s inadequacy in manufacturing efficiency, nor didit explicitly provide for stronger product offerings. Instead, the changes wereoriented to IHC’s main strength—marketing.
As a part of the general reorganizing at IHC in the mid-1970s, the companyalso recruited a new chief executive officer. This choice also reflected interestsin areas other than those which troubled the company most. The companywent outside for a new CEO and recruited Archie McCardell from Xerox, who had a functional background primarily in finance. Before joining IHC, he hadserved on the board of directors of American Express, General Foods, andBlue Cross and had spent some years in financial positions with Ford.McCardell then hired Warren Hayford of Continental Group as the companypresident. Soon, more and more of the key executives at Harvester werereplaced by individuals with little experience in Harvester’s main industries.Barbara Marsh describes what transpired:
By 1980, early retirements of veteran executives had robbed Harvester of an invaluable store of market wisdom it would sorely miss as the recessions inits markets gained ferocity that year. Executive recruits from othercompanies and other industries streamed into Harvester’s top ranks in theMcCardell era frequently lacked the intimate knowledge of its businessnecessary for reading and reacting to the ominous signs in the company’smarketplace. One former long time executive who left for another companyin 1981 says: “It was horrible working there in the last three or four years.
66
There was so much change with top management being replaced from theoutside that we lost all executive knowledge of products and markets.”(Marsh 1985, 226)
Under McCardell and Hayford, International Harvester exhibited a tendency todeal only globally, and not specifically, with the company’s slipping competitiveposition. Costs were too high, and the answer to this rather general conclusionwas an attempt to persuade union workers to accept lower pay rather thanaddress product design, production processes, and managerial expertise for their impact on profitability. International Harvester workers were asked for $100million in labor concessions along with significant changes in work rules. Labor relations stalled, as they often do when traditional avenues of improvement arenot explored before help is requested of the union. A prolonged strike in 1979and 1980 worsened employee relations as the company sought concessionsfrom its manufacturing workers at a time when executives were being awardedlarge salaries and extensive bonuses (Marsh 1985, 235). The strategy to reducelabor costs backfired and after a costly strike lasting 170 days, the longest inthe history of the industry, the company was forced to drop most of itsdemands.
The aftermath of the strike created additional problems for Harvester. Ahigh-cost producer, the firm had difficulty operating profitably on anything lessthan very high volume. Following settlement of the strike, the company began a massive effort to catch up on lost production. Unfortunately, the United Stateswas entering its worst economic downturn since the 1930s. Harvester’s newmanagement team was out of touch with trends in the marketplace, and thehigh production levels were continued long after there were sales to supportthem. Dealers had been neglected by the new breed of outsiders. Plant updating had lagged. Incremental product improvement and quality programs were setaside in pursuit of more flamboyant, all-encompassing “grand slam” efforts that lacked specificity.
The absence of specificity at International Harvester was evident in the caliberof its forecasting. On March 21, 1981, The Wall Street Journal reported thatInternational Harvester officials had projected a $90 million loss for the fiscalyear ending October 31 and that the firm would be profitable during its fourthquarter and in 1982. Seven months later, when the results were announced, theactual loss for the quarter was $393 million, helped by a $243 million tax credit. The actual loss for 1982 became nearly $1.3 billion.
International Harvester was in a serious profit tailspin that was not beingreversed by the recipes being applied. From 1980 to 1985, the company lostover $3 billion and flirted with formal bankruptcy on several occasions. (Table4-4)
The Turnaround Experience: Real World Lessons in Revitalizing Corporations and Organizations

Table 4-4 International Harvester Profitability and Inventory Efficiency
Year Revenue Profit Profit, % Inventory turn
ratio
1979 $8,035,650,000 $369,572,000 4.6 3.43
1980 5,968,414,000 (374,798,000) (6.3) 2.56
1981 7,040,920,000 (635,684,000) (9.0) 4.31
1982 4,292,000,000 (1,266,000,000) (29.5) 5.66
1983 3,601,000,000 (533,000,000) (14.8%) 5.82
1984 4,802,000,000 (61,000,000) (1.3) 6.93
1985 3,507,000,000 (363,636,000) (10.4) 10.50
Source: Moody’s Industrial Manual, 1981, 1983, 1985, and 1986.
The historical contrast between the operations at Deere and InternationalHarvester was striking. At IHC, commonality of parts was not a priority. Forapproximately 40 years, from about 1920 to 1960, John Deere tractors had1400 fewer parts than comparably powered International Harvester products.During the 1970s, IHC’s huge inventory turned only at a ratio of around 3. AtDeere, the ratio was usually around 6, and perhaps would have been higher had Deere not placed so much of its inventory with dealers. While Deere executives made concerted attempts to remain in touch with customers and dealers, IHCmanagement was less attentive. During the 1930s, the people at Deere hand-addressed much of their correspondence to customers. During the farm crisisof the early 1980s, Archie McCardell sporadically visited distraught IHC dealersin a posh limousine. Most important, Deere led International Harvester in gross profit rates every year from 1955.
was replaced during the downtrend, by board member Louis Menk, retiredchairman of Burlington-Northern railroad, who in turn was replaced bymanufacturing executive Donald Lennox. Lennox proceeded to concentrate onthe reduction of corporate costs and focused the company on selected markets. Many operations were closed. Eight company limousines were sold. Greaterstress was placed on the commonality of parts and the efficient utilization ofinventories. Costs were reduced in other important ways. Finally, in January1985, the company divested itself of the business that at one time had made itone of the largest firms in the country. The agricultural equipment business was
68

sold to the J. I. Case Division of Tenneco. Figure 4-3 shows the changes inrevenue and cost.
Figure 4-3 Revenue and cost at International Harvester. InternationalHarvester revenue and earnings peaked in 1979, but the companylacked the efficiency that would have enabled it to adjust to the lowerrevenue levels of the next 4 years. When revenue did increase, costsincreased by nearly as much. When revenue fell, not much money was saved. Within 6 years of record earnings and record profits, thecompany exited what, for most of its history, had been its majorbusiness.
During its unsuccessful turnaround attempt, International Harvester applied thewrong remedies, cajoled the wrong people, and spiraled downward until itnearly went out of business. Ultimately IHC management was forced to reducethe size of the company dramatically in order to survive at all, and then withonly a weakened portion of its business intact. The magnitude of the dramaticdecline in International Harvester is seldom completely understood. A few facts describe the changes from the mid-1970s to 1986):
· Employment was reduced from more than 100,000 workers to 16,836.
The Turnaround Experience: Real World Lessons in Revitalizing Corporations and Organizations

· The number of plants was reduced from 47 to 8.
· Plant square footage was reduced from 38 million square feet to 7.5million square feet.
· Net worth before the obligations on preferred stock declined from $2196million to $41.7 million.
· Net worth after preferred stock obligations declined from a positive $2246 million to a negative $871 million.
Whether the efforts of future IHC managers will be sufficient to allow such aweak company to prevail in what is increasingly becoming a global marketremains to be seen. Perhaps what is left of International Harvester can surviveas a revitalized Navistar International. That can be the subject of anotherlongitudinal study at another time.
In the meantime, it is worthwhile for us to ponder both the causes of thedecline and its cost. The cost to the country, families, creditors, communities,banks, and government institutions of International Harvester’s mismanagementwas staggering and it may never be accurately assessed. It did not need tohappen. The company surely had a sufficiently comfortable position from which to stage a successful turnaround at many points during its long history. But,company management failed to initiate the basic requirement of becoming alow-cost producer of differentiated products and, in the view of someobservers, to play fair with employees, creditors, suppliers, and customers. Thecompany lacked discipline and failed to maintain a basic expertise in operational efficiency.
International Harvester Failed Because....
· Operational efficiency lagged that of competitors.
· Workers were pressed for concessions before management did its ownjob.
· Forecasting systems were defective.
· Appreciation was not shown for old values as a foundation for newbeliefs.
· Top management lacked experience in the industry being served.
· Major businesses were victimized by ill-managed diversification.
70

The Turnaround Experience: Real World Lessons in Revitalizing Corporations and Organizations

Chapter 5 — Achieving andSustaining Modest Overhead
During the 1920s, two companies emerged from crises to becomehigh-volume producers of automobiles. One became the industry'sthird-largest producer and failed. On less than half the volume, the otherattained the highest profit rate of any firm in the industry and operatedindependently for another 60 years before merging with another successfulcompany. The first firm, Willys-Overland, loudly focused its energies onpromotion, publicity, and sales. The firm's chief executive became famous as a business entrepreneur and later as an ambassador. The second firm, NashMotors, which later became American Motors, focused on product quality,inventory efficiency, and the minimization of overhead. While John NorthWillys was busily promoting both cars and his public image, Charles Nashwas eating lunch with the factory hands at the Kenosha plant and gettingtheir ideas on how costs could be reduced.
Every brain in the plant, from foreman to president, meets every Mondayafternoon at 5 o'clock to offer and hear suggestions for improving thisprocess or that, to consider communications from owners and dealersoffering comments or constructive criticism, to discuss conditions, salesplans, etc. Always when at home Mr. Nash presides over these sessions.(Forbes 1972, 217)
Expenses unrelated to What the Customer Is Buying
As unrefined as the concept may seem, some companies are in financialtrouble because they spend too much money. In particular, they spend toomuch on items unrelated to what the customer is buying — the product orservice provided. The well-managed company prudently and carefully spends money designing, building, and nurturing the products and services itprovides to customers. All these expenditures benefit customers.Unsuccessful companies spend money on overhead, offices, promotion, andexecutive compensation, and none of these benefit customers. This simpledifference is often a crucial factor in turnaround success.
Beyond the fact that successful and unsuccessful companies spend money on different things, they also spend different amounts. Though some variationexists, the unsuccessful companies examined here spent a higher fraction oftheir revenue on general and administrative expenses, selling expenses, andother non-cost-of-sales expenses (14.0 percent versus 13.2 percent) duringthe period of recovery. This figure includes income taxes, however. Since the successful firms were far more profitable during their recovery periods, theafter-tax measure presents a bias in favor of the unsuccessful companies.When non-cost-of-sales expenses excluding income taxes are compared, the
72 Chapter 5 — Achieving and Sustaining Modest Overhead

actual difference is almost 4 percentage points (9.5 percent versus 13.2percent), a significant fraction of usual corporate profit rates. As apercentage of revenue, the successful companies spent about 28 percent lessmoney on overhead.
The reputations of the chief turnaround agents corroborate the statisticalevidence. Charles Nash, who had a widespread reputation for frugality,conducted the company affairs from a modest office with no carpet and apedestrian desk. He was intensely interested in the day-to-day managementof the business and generally spurned social activities. Yet, Nash Motors was still able to produce milestone products and greatly increase market sharewhile spending very little money for product development, selling, andgeneral and administrative expense.
Mr. Nash's office on the second floor of the administration building inKenosha is typical of the man himself; it is well furnished but extremelymodest; no rug adorns the floor, but the chairs are comfortable and thebroad flat desk at which Mr. Nash works costs less, perhaps than the deskof many a chief clerk or office manager. And, as any man in the Nashorganization will testify, the door to that office is always open. (Forbes1972, 224)
The Packard Motor Car Company of the 1930s also operated with a smallcentral staff while it simultaneously developed a whole new line ofautomobiles, revamped its dealer network, maintained first place in prestigeauto sales, and became established as a respected defense contractor. AtAmerican Motors during the 1950s George Romney avoided excessivespending on personal embellishments and expensive styles of travel. Officercompensation was substantially reduced at Packard, Deere, Chrysler, NashMotors, and American Motors during the 1950s, when business turneddownward.
In contrast, Allis-Chalmers, Studebaker-Packard of later years, InternationalHarvester, and Willys-Overland made substantial expenditures on itemsunrelated to the production of products. Allis-Chalmers averaged 20.2percent of revenue for non-cost-of-sales expenses. From 1979 to 1982,revenue at Allis-Chalmers declined by 46.5 percent, but non-cost-of-salesexpenses were reduced by only 21 percent. Willys-Overland also spent morethan 15 percent of revenue on non-cost-of-sales items. One successful firm,Deere, spent heavily on non-cost-of-sales items, mostly due to the heavyproduct development program, but in the main, successful companies weremuch less inclined to spend higher percentages of their revenue on itemsunrelated to production. (Table 5-1).
The Turnaround Experience: Real World Lessons in Revitalizing Corporations and Organizations

Table 5-1 Non-Cost-of-Sales Expense as a Percent of Revenue
During the Period of Recovery
Excluding tax expense
%
Including tax expense
%
Turnaround outcome
Jeffery (Nash) 4.44 7.56 Successful
Packard 6.83 9.23 Successful
Hudson 7.56 8.09 Unsuccessful
Kaiser-Frazer 8.04 9.03 Unsuccessful
Chrysler 8.43 11.52 Successful
Ford 9.04 11.71 Successful
Maxwell-Chalmers 9.56 10.34 Successful
American Motors 10.45 12.82 Successful
Studebaker-Packard 12.94 14.99 Unsuccessful
International Harvester 13.86 14.66 Unsuccessful
Willys-Overland 15.24 15.50 Unsuccessful
AMC-Renault 15.37 14.70 Unsuccessful
Deere 17.71 25.70 Successful
Allis-Chalmers 18.20 20.24 Unsuccessful
Achieving and sustaining modest overhead did not adversely affect theability of the successful firms to compete. During the Chrysler turnaround of the 1980s, the number of salaried staff members was reduced from 44,000 to 23,000. Yet, even with this very substantial staff reduction, the companyentered one of its most prolific periods in terms of new-vehicle development, marketing, and service. Ford Motor Company also operated with smallerstaffs. After losing billions of dollars in the early 1980s, Ford respondedwith the award-winning Taurus/Sable project that came in under budget andwith a smaller staff. The Taurus/Sable project and other Ford projects wereso successful that the firm came back from disaster to become the industry'sprofit leader and to accumulate over $10 billion in cash. Major technical and marketing accomplishments were implemented during periods of expensereduction at American Motors, Deere, and Packard, during the 1950s. Theredoes not seem to be evidence that vast resources are crucial to either product differentiation or corporate development.
The Packard Motor Car Company of the 1930s illustrates what can be donewith a small central staff. Packard spent little money on advertising andpromotion, reduced executive compensation, and still maintained high-qualityproducts. Statistically, Packard had the lowest non-cost-of-sales expense ofany firm in the sample except Nash. Yet the company produced one of thelongest lists of prestigious automobiles in the history of the world.Sixty-seven Packard models produced in the 1930s are recognized as fullclassics by the Classic Car Club of America, all produced by a companywith very low expenditures on research and development.
Maintaining modest overhead was a learned behavior rather than an inherenttrait. The successful companies learned to keep expenses low as a part of the
74

turnaround process. Successful firms generally had higher overhead expenses during their preturnaround periods, but they learned to reduce these expenses to below industry levels. Unsuccessful firms actually permitted overheadexpenses to grow as a percent of revenue. Table 5-2 shows this progression.
Table 5-2 Non-Cost-of-Sales Expense as a Percent of Revenue Excluding Tax Expense
Preturnaround period
%
Period of crisis % Period of recovery %
Successful cases 10.03 15.21 9.53
Unsuccessful cases 7.76 11.24 14.01
The Vigilance of Cost-Reduction Programs
Most successful and unsuccessful companies reduced costs as revenuedeclined. But the successful companies stayed with their cost-reductionprograms longer until costs were more comfortably below revenue levels.Unsuccessful companies permitted expenses to stabilize or increase whenprofits were still very low or even negative. These patterns reflected different operating philosophies. Successful firms gracefully accepted lower revenuelevels during times of adversity and brought expenses down to matchrevenue. Unsuccessful firms put less emphasis on cost reduction and tendedto pursue revenue expansion as the principal remedial strategy.
Two excellent examples of ongoing vigilance in the reduction of costoccurred with the Deere & Co. and Chrysler turnarounds. From 1929 to1932, Deere reduced constant dollar costs by more than 70 percent. From1977 to 1980, Chrysler reduced constant dollar costs by 48 percent and thenfollowed with further reductions in the next 2 years. Figures 5-1 and 5-2illustrate the cost-reduction programs of Deere and Chrysler over the severalyears of their turnaround periods.
Chrysler actually reduced constant dollar costs from $29 billion in 1977 to$12 billion in 1982, a reduction of 57 percent. Ford reduced costs from $68billion in 1978 to $45 billion in 1982, a reduction of 34 percent. Yet, forthree of the unsuccessful cases, expenses during year 0 (the low point)actually grew during the period of crisis even though profits had worsenedconsiderably. Among the unsuccessful firms, only Hudson substantiallyreduced cost during periods of adversity. Even then, the reductions were notenough. Hudson lost money 7 of 10 years during its attempted recovery.
Table 5-3 shows the cost reductions of successful and unsuccessful firms inconstant dollars.
Pragmatic and Even-Handed Cost-Reduction Programs
Cost-reduction programs during the successful turnarounds were pragmatic,disciplined, and even-handed with respect to rank. Often, top managementset the course for cost reductions by reducing its own pay and eliminating
The Turnaround Experience: Real World Lessons in Revitalizing Corporations and Organizations

unnecessary expenses in its offices. Several successful turnaround managersplayed exemplary roles in cost reductions. For instance, during the greatdepression, the Packard Motor Car Company reduced total officercompensation from $748,000 in 1929 to $152,000 in 1933, resulting in anaverage yearly compensation of about $16,000 per officer. Nash Motorsreduced the total compensation of its officer group from $802,000 in 1928 to $96,547 in 1937 resulting in an average yearly compensation of $16,091 perofficer. Substantial reductions in officer pay also took place at Deere.Iacocca's salary at Chrysler was reduced to one dollar per year during thecrucial stages of the Chrysler turnaround. During the 1950s, George Romneyand the management team at American Motors voluntarily took substantialpay cuts as the first element of cost-reduction programs.
Figure 5-1 Cost reduction at Deere & Co. Deere reduced constantdollar costs by more than 70 percent from 1929 to 1932 starting withthe amounts paid to managers and owners. These dramatic costreductions strengthened the firm’s efficiency and prepared it tocapitalize on the revenue expansion which was to occur during thelater 1930s and the 1940s.
The management teams of unsuccessful turnarounds did not usually playexemplary roles in cost reductions and occasionally continued to consumecorporate resources when the organizations needed to reduce cost. In contrast to the behavior of Romney at American Motors, during the same period andunder similar economic conditions, James Nance, president of StudebakerPackard, collected $150,000 (about $700,000 in 1988 dollars) per year during
76
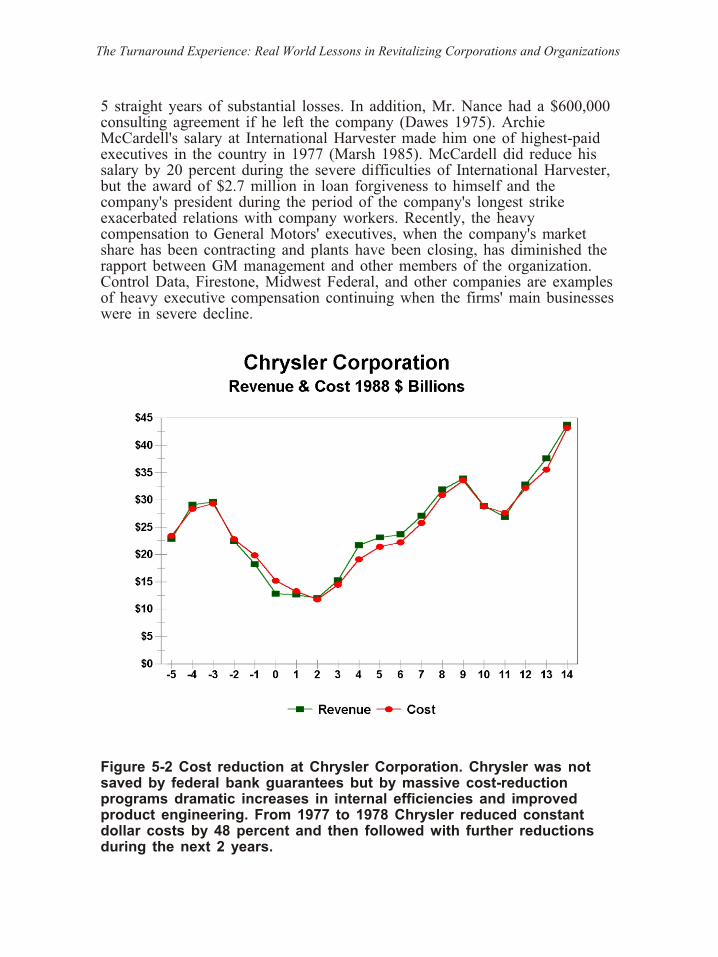
5 straight years of substantial losses. In addition, Mr. Nance had a $600,000consulting agreement if he left the company (Dawes 1975). ArchieMcCardell's salary at International Harvester made him one of highest-paidexecutives in the country in 1977 (Marsh 1985). McCardell did reduce hissalary by 20 percent during the severe difficulties of International Harvester,but the award of $2.7 million in loan forgiveness to himself and thecompany's president during the period of the company's longest strikeexacerbated relations with company workers. Recently, the heavycompensation to General Motors' executives, when the company's marketshare has been contracting and plants have been closing, has diminished therapport between GM management and other members of the organization.Control Data, Firestone, Midwest Federal, and other companies are examples of heavy executive compensation continuing when the firms' main businesses were in severe decline.
Figure 5-2 Cost reduction at Chrysler Corporation. Chrysler was notsaved by federal bank guarantees but by massive cost-reductionprograms dramatic increases in internal efficiencies and improvedproduct engineering. From 1977 to 1978 Chrysler reduced constantdollar costs by 48 percent and then followed with further reductionsduring the next 2 years.
The Turnaround Experience: Real World Lessons in Revitalizing Corporations and Organizations

The conservative handling of costs was more of an ongoing process at thecompanies which experienced successful turnarounds. Most of them avoidedlavish expenditures in both good times and bad. The money they spent wasdirected toward improving the effectiveness of existing operations. WalterChrysler and Charles Nash refocused the resources of the Buick and GMorganizations away from dividends and acquisitions to improving productquality and manufacturing efficiency. Henry and Wilfred Leland did thesame at Cadillac. George Romney spurned frivolous spending when he waschief executive of American Motors, but he spent substantial funds to keepAMC plants upgraded and efficient.
Table 5-3 Total Company Constant Dollar Cost (1988 dollars)
Year -3 total cost
($000)
Year Zero total
cost ($000)
Percent change
year -3 to year 0
Year 0 profit as
percent of revenue
Successful Cases
Packard 280,544 212,492 -24.3 -49.9
Deere 417,972 122,462 -70.7 -66.8
American Motors 2,815,744 1,691,053 -39.9 -4.8
Chrysler 29,297,999 15,199,417 -48.1 -18.5
Ford 64,047,395 53,693,209 -16.2 -4.2
Unsuccessful Cases
Hudson 1,334,578 297,087 -77.4 -21.0
Studebaker-Packard 2,881,214 2,607,761 -9.5 -4.4
InternationalHarvester
7,404,984 7,451,420 +.6 -1.5
Allis-Chalmers 2,308,905 2,469,493 +7.0 -7.1
Kaiser-Frazer 1.,885,185* 1,296,276 -34.8 -11.2
AMC-Renault 3,876,654 4,425,940 +14.7 -2.0
*Year -3 for Kaiser-Frazer was 1946 an atypical year in the U.S. auto industry because of the end of World WarII. Year -2 (1947) is used instead.
Unsuccessful companies were more sporadic in their spending andoccasionally wasted large sums of money on poorly thought-out plans forexpansion. Studebaker-Packard spent over $41 million on just one of severalmisguided acquisitions during a time when the company was severelypressed for cash. Kaiser constructed two plants which were never used.Studebaker-Packard did the same. Hudson bought a steel company.International Harvester invested heavily in capacity expansion at a time when it was already experiencing severely declining sales, an erosion of marketshare, and the initial stages of a serious recession.
Both successful and unsuccessful companies showed progress in reducingtheir losses, but the progress made by the successful companies was morepronounced, more internally focused, more technical, and less oriented tofinancial juggling, and it tended to be much longer lasting. Acquisitions,
78
mergers, or divestitures were sought much more by the unsuccessfulcompanies. Acquisitions, mergers, or divestitures played almost no role inthe recovery of any of the successful companies.
The Systematic Withdrawal of Resources Improves Performance
An important operating principle which applies to all business situations butfits particularly well with turnaround situations is that it is usually possibleto do more with less. Sandor Brendt (1978) discussed the concept ofaccomplishing more with less by describing the work of a European scientist, Ilya Prigogine, who was awarded the Nobel Prize for his observations on the development and entropy (increasing amounts of disorder) of complexsystems. Using the laws of thermodynamics as a basis for his study ofcomplex systems, Prigogine addressed the conditions under which complexity and disorder expand within a system to curtail progress and increase costs.Unfortunately, some of these same entropic conditions tend to occur almostnaturally with a firm in trouble. The struggling company is often viewed byinvestors, bankers, creditors, or other stakeholders as being out of control.Various mechanisms are then instituted to restore the health of the firm,actions sometimes viewed as restoring control. In a practical sense, when acontrol mechanism or another function is added to a complex system like amachine or an organization, energy is consumed. The governor on an engine requires some energy to operate, and though the engine is better controlled,it is less efficient. Entropy can exist in organizations as well as inmachinery. It takes time for people to communicate with the coordinatorsand the managers at various levels and even with other members of theorganization. Under some circumstances, the organization itself becomes anenormous consumer of its own resources.
Chester Barnard also observed entropy in organizations and commented onunproductive communication paths in Functions of the Executive (1938). Henoted that the number of communication paths increases geometrically withthe number of people in the organization. These additional communications,resources, and control mechanisms pose severe burdens, which the alreadystressed turnaround organization can seldom afford. The result is aninhibition of the organization's effectiveness. Paul Lawrence and Davis Dyermake similar observations in their book Renewing American Industry (1983), wherein they suggest that the companies most likely to progress towardsuccessful adaptation are those that fall in the intermediate ranges in bothresource scarcity and information complexity. Resource surplus retardsadaptation.
No single person turns a company around. Turnarounds progress because the entire organization learns new tasks and how to do old tasks better. Toomany resources interfere with organizational learning. Few people will takethe trouble to learn a task or accept full responsibility if they feel it issomebody else's job. The presence of many specialized organizationalelements reduces overall effectiveness. Conversely, if fewer people areinvolved in a function, a renewed sense of responsibility often surfaces on
The Turnaround Experience: Real World Lessons in Revitalizing Corporations and Organizations

the part of those who remain. An important holistic advantage emerges inoperating with fewer resources. Giving responsibility to one person or tosmall units improves effectiveness because participants can see the entireproblem, thus reducing the need for special technical groups. Organizationallearning permits the company to get more done while it systematicallywithdraws resources. If a company promotes broadly based organizationallearning, it can improve performance while using fewer resources.
Broadly based organizational learning does not take place at unsuccessfulcompanies. Willys-Overland, for example, never really learned to producebetter cars at lower cost. Except for a brief period under the stewardship ofWalter Chrysler, the company did not progress toward either modestoverhead or operational efficiency. Nor did the company learn to producecars of distinction. Perhaps it was for these reasons that Walter Chryslerchose not to take a permanent position in the company when he had theopportunity.
At Willys-Overland, the perquisites and rewards of management becamedisconnected from responsibilities. Public notoriety was achieved at theexpense of detailed involvement in the day-to-day problems of the business.The results were enormous losses to investors, creditors, and dealers alongwith layoffs and ultimately the loss of employment for the company'semployees. At one time, close to 1 percent of the nation's GNP was relateddirectly or indirectly to the activities of the Willys-Overland Company.Production reached 315,000 units in 1928, and employment reached 21,000,with many more people employed by dealers and suppliers. Managementbecame comfortable, and the firm's leader retired to become an ambassadorafter selling his stock shortly before the market crash in 1929. Five yearslater, the firm declared bankruptcy. Meanwhile, the officers and owners ofsurviving companies were developing technically appropriate improvements,cutting their own compensation, and pledging their personal assets to keeptheir firms in business.
Attaining Inventory efficiency
The principle of modest overhead extends well beyond the executive officeand permeates the production process as well, particularly regarding thehandling of inventory. During the late 1920s, Willys-Overland consistentlytied up between $20 and $35 million in inventories. Nash had $6 million to$7 million. Willys-Overland's inventory turn ratio was about 7, while Nash'swas 19. Nash operated at 4 times the dollar profits on one-half the marketshare. In terms of inventory efficiency and other measures as well, Nash was clearly the superior company.
Yet, earlier, Willys-Overland was a highly prominent company. In 1916, theWillys-Overland Company produced 140,111 units, approximately 1 of every 10 American cars, while Nash Motors' predecessor, the Thomas B. JefferyCompany, produced 4608 units, a market share of well under 1 percent. The
80

steps taken during the successful Jeffery/Nash turnaround provide importantlessons about inventory efficiency as an ingredient to turnaround success.
Inventories represent unutilized resources and indicate inefficient production.The successful turnaround firm will rigorously manage its inventories, but in some very special ways. Cash is absolutely critical to a firm in trouble, andinventory efficiency can make available huge amounts of cash. Assume twocompanies with annual sales of $1 billion find themselves in trouble. Theunsuccessful firm could have an inventory turn ratio of about 6.4 andinventories of about $156 million, while the successful firm could have aninventory turn ratio of about 9.7 and inventories of about $104 million. Thedifference is $52 million and, for a company in trouble, that is a preciousamount.
A good historical illustration of the importance of inventory efficiency canbe developed by comparing Chrysler Corporation to International Harvester.Both these firms were hit hard by the recession of the early 1980s.Chrysler's turnaround was successful, at least for a decade. InternationalHarvester was unsuccessful, and it was forced to exit the industry in which it was once so dominant. These two firms exhibited great differences ininventory efficiency. International Harvester had revenues of $8 billion andrecord profits in 1979. Inventory turns per year, however, were typicallyaround 3, resulting in a huge inventory of $2.342 billion. ChryslerCorporation gradually worked on inventory efficiency until it achieved aninventory turn ratio of more than 13 in 1986. During the entire period ofrecovery, Chrysler's inventory turn ratio averaged 11.02. Had this same level of inventory efficiency been achieved by International Harvester in 1979, the firm would have entered the downturn with an additional $1.6 billion incash. At one point International Harvester had an inventory of over $2.3billion, turning at a rate of only 2.56 times per year. This immense inventory amounted to about $1000 for every farm in the United States. InternationalHarvester actually had in its possession, in the form of excess inventory, areserve of hidden cash greater than the face value of the bank guaranteesreceived by Chrysler Corporation. Conversely, if Chrysler Corporation hadoperated during its turnaround with the same level of inventory efficiency as International Harvester, the firm's turnaround would have required anadditional $3.2 billion in cash. Considering Chrysler's financial position atthe time, raising this amount of money would have been very difficult. Theoutcomes of these two turnarounds, involving so much money and so manypeople, were in part determined by the specific matter of inventoryefficiency.
Inventory efficiency and Turnaround Success
Inventory is much more than a reserve of potential cash. Inventory acts as anegative index of operating efficiency. Charles Nash was against inventory,not because Nash Motors couldn't afford inventories, but because inventorygot in the way of efficient production. His concept of production imposed
The Turnaround Experience: Real World Lessons in Revitalizing Corporations and Organizations
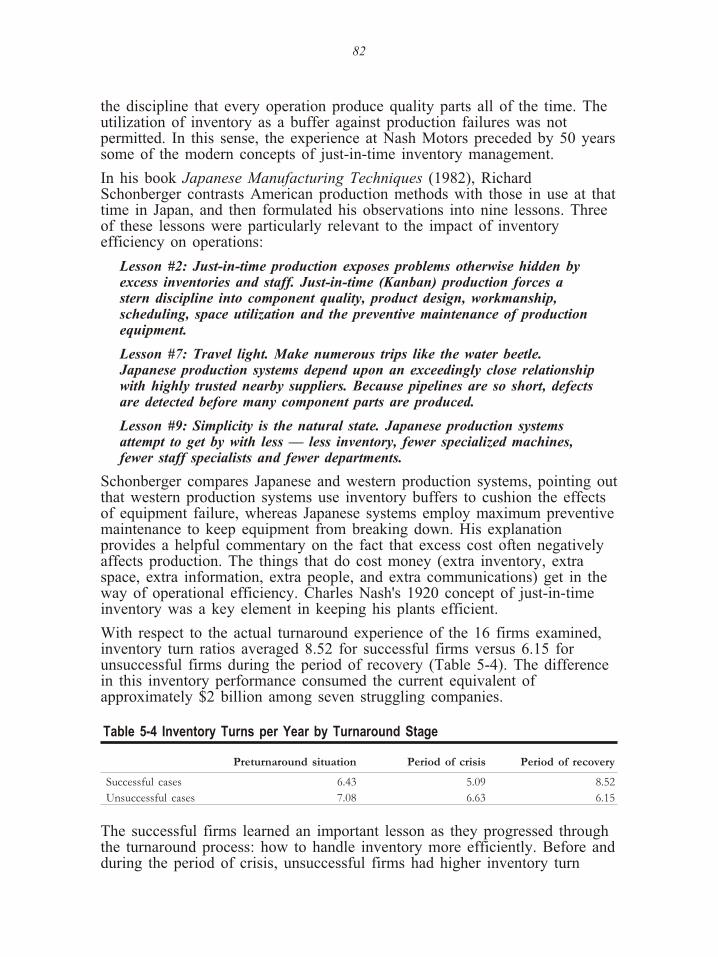
the discipline that every operation produce quality parts all of the time. Theutilization of inventory as a buffer against production failures was notpermitted. In this sense, the experience at Nash Motors preceded by 50 years some of the modern concepts of just-in-time inventory management.
In his book Japanese Manufacturing Techniques (1982), RichardSchonberger contrasts American production methods with those in use at that time in Japan, and then formulated his observations into nine lessons. Threeof these lessons were particularly relevant to the impact of inventoryefficiency on operations:
Lesson #2: Just-in-time production exposes problems otherwise hidden byexcess inventories and staff. Just-in-time (Kanban) production forces astern discipline into component quality, product design, workmanship,scheduling, space utilization and the preventive maintenance of productionequipment.
Lesson #7: Travel light. Make numerous trips like the water beetle.Japanese production systems depend upon an exceedingly close relationship with highly trusted nearby suppliers. Because pipelines are so short, defects are detected before many component parts are produced.
Lesson #9: Simplicity is the natural state. Japanese production systemsattempt to get by with less — less inventory, fewer specialized machines,fewer staff specialists and fewer departments.
Schonberger compares Japanese and western production systems, pointing out that western production systems use inventory buffers to cushion the effectsof equipment failure, whereas Japanese systems employ maximum preventive maintenance to keep equipment from breaking down. His explanationprovides a helpful commentary on the fact that excess cost often negativelyaffects production. The things that do cost money (extra inventory, extraspace, extra information, extra people, and extra communications) get in theway of operational efficiency. Charles Nash's 1920 concept of just-in-timeinventory was a key element in keeping his plants efficient.
With respect to the actual turnaround experience of the 16 firms examined,inventory turn ratios averaged 8.52 for successful firms versus 6.15 forunsuccessful firms during the period of recovery (Table 5-4). The differencein this inventory performance consumed the current equivalent ofapproximately $2 billion among seven struggling companies.
Table 5-4 Inventory Turns per Year by Turnaround Stage
Preturnaround situation Period of crisis Period of recovery
Successful cases 6.43 5.09 8.52
Unsuccessful cases 7.08 6.63 6.15
The successful firms learned an important lesson as they progressed throughthe turnaround process: how to handle inventory more efficiently. Before and during the period of crisis, unsuccessful firms had higher inventory turn
82

ratios. However, successful firms substantially improved their inventoryefficiency as their turnarounds progressed. Ford's inventory turn ratio rosefrom 7.4 in 1979 to 12.4 in 1988, as the firm made progress toward fullrecovery. Chrysler's rose from 6.4 in 1979 to 13.4 in 1986. The inventoryturn ratio of American Motors under Romney progressed from 5.1 in 1953 to 11.0 in 1962. The unsuccessful firms did not improve their inventoryefficiency. International Harvester, for example, had inventory turn ratios ofbelow 3.5 for the first 9 years of its attempted turnaround (Figure 5-3).
The strategy of using common component parts was frequently employed toachieve inventory efficiency. However, this requires further clarification.Several successful firms (Buick from 1911 to 1919, American Motors in the1950s and 1960s, and Chrysler Corporation in the 1980s) did utilizewell-organized programs to utilize common component parts in themanufacture of several products. Hudson and Kaiser both used common parts extensively, but their turnarounds were still unsuccessful. In the Hudson andKaiser cases, although the firms used common parts, the products themselves were not designed for manufacturability and many were quite expensive toproduce. Hudson used the same piston and valve assemblies in bothsix-cylinder and eight-cylinder engines, but the engines were antiquated indesign and expensive to manufacture. The successful companies employedstandardized parts within a framework of design for manufacturability, valueengineering, and installation requirements, and these qualities permittedhigher levels of inventory efficiency. Chapter 6 discusses the design formanufacturability in more detail.
The Turnaround Experience: Real World Lessons in Revitalizing Corporations and Organizations

Figure 5-3 Inventory efficiency: successful and unsuccessfulturnarounds. Successful firms learned to handle inventory moreefficiently as a condition necessary for survival. After experiencinglower rates of inventory efficiency during the preturnaround and crisisperiods the successful firms met and surpassed the unsuccessfulfirms in what is one of the most important sources of cash.
Inventory efficiency is not always coincident with manufacturing efficiency.Companies often pursued operational efficiency and inventory efficiency asseparate objectives and occasionally managed to achieve one without theother. Deere, for instance, achieved exceptionally high operational efficiencybut not such high inventory efficiency, in part because of the company'spropensity to place consignment products with its dealers. Successful firmstended to achieve both, however, and the pursuit of both strategies increasedthe probability of turnaround success. Table 5-5 displays the inventory turnsper year of a sample of companies during the 1920s and 1930s. Substantialdifferences existed among the major producers.
During the 1920s, Nash Motors, the Hudson Motor Car Company, andChrysler Corporation had relatively high inventory turns per year, perhapsindicating greater attention to the operational considerations of inventory.Other companies, such as Studebaker, Willys-Overland, and Reo, had highsales during this period without attaining either high levels of manufacturingor inventory efficiency. During the depression, sales fell off, and withoutefficient manufacturing, these companies were in serious trouble and allultimately failed.
When industry began to emerge from the depression during the 1930s,companies varied widely in their inventory efficiency. Packard and Hudsonimproved theirs while International Harvester continued with low inventoryturns per year in spite of very high sales. Chrysler became the industryleader. During the late 1950s and early 1960s American Motors, underGeorge Romney, emerged from crisis to again become the industry leader ininventory efficiency.
Table 5-5 Comparison of Inventory Turns per Year
Year GM Chrysler Nash Hudson Packard Studebaker IHC Reo Willys Deere
1924 —- —- 13.55
1925 —- —- 12.93
1926 6.77 9.95 19.56 —- 6.77
1927 7.35 9.66 16.91 13.38 7.56 —- —- 4.55 7.46
1928 7.60 7.01 20.79 14.11 7.25 —- 3.92 6.90 2.99
1929 7.98 9.84 19.74 14.93 8.12 5.57 —- 4.78 8.84 3.18
1930 7.21 7.98 18.74 11.41 5.20 4.86 —- 4.45 5.53 3.01
1931 7.60 8.32 26.65 8.54 3.81 3.97 —- 3.28 6.77 1.91
1932 5.73 7.43 14.99 7.15 2.69 —- —- 2.63 6.88 0.68
1933 4.92 6.91 4.33 5.24 3.53 —- —- 3.10 —- 0.74
1934 6.09 9.65 9.20 11.52 3.06 —- —- 3.54 —- 1.52
84

1935 5.89 10.60 10.18 12.91 6.16 —- 2.57 3.70 —- 3.04
1936 6.38 11.02 5.51 9.64 7.33 —- 2.58 3.13 —- 3.95
Source: Data are from Moody’s Industrial Manual and Lawrence Seltzer The Financial History of the NorthAmerican Automobile Industry, Houghton Mifflin, Boston, 1928. Gaps in the data on inventory turn ratio existbecause of variations in the financial reporting of the companies.
Although it is difficult to isolate a single cause of turnaround success,modest overhead and high rates of inventory efficiency are commonlypresent among successful companies. These well-managed firms spend lessmoney on general and administrative expenses, office buildings, purposelesstravel, unnecessary selling expenses, and other items not related to productsor customers. They employ frugality as an ongoing mode of operation. Inaddition, cost-reduction programs at the successful firms are longer lastingand more even-handed with respect to rank. When expenses must be cut,managers lead the way by cutting their own salaries first beforeimplementing cost reductions elsewhere in the organization. When expensesneed to be reduced, they are reduced. Unsuccessful firms apply token costreductions and then permit expenses to rise before the firm's health isrestored. Excessive costs impede efficient operations.
Practical Lessons on Modest overhead
· Successful companies spend money on important things that relate towhat it is the customer is buying.
· Unsuccessful companies spend money on things unrelated to what thecustomer is buying.
· Successful companies systematically withdraw resources to improveoperational performance.
· Successful companies keep inventory efficiency high to preserve cash and to improve operational efficiency.
· Employees view cash preservation and modest overhead as indices ofcompetence and trustworthiness.
· Employees are anxious to help save money — if management is too.
Case Histories
Willys-Overland and Nash Motors exhibited radically different corporatepriorities as they progressed during the 1920s. As John North Willys soughtsales volume and personal prestige, Charles Nash was nurturing newprograms to reduce expenses, improve relations with dealers, and build better products. In particular, the two firms contrasted in their treatment ofoverhead expenses. Willys tolerated them with minimal scrutiny. Nashactively sought to reduce them in every possible way. As the depressiondeepened during the 1930s, the frugality employed at Nash Motors enabled
The Turnaround Experience: Real World Lessons in Revitalizing Corporations and Organizations

the firm to survive while Willys-Overland, a firm that at one time shipped80 percent as many cars as General Motors, filed for bankruptcy—a common outcome when too much money is spent.
86

Case 3 — Professional Frugality at Nash
In Chicago, before the turn of the twentieth century, Thomas Jeffery and Philip Gormully founded and developed the second-largest bicycle factory in thecountry by producing a bicycle named the “Rambler.” The two men alsomanufactured tires in another operation which ultimately became part of U.S.Rubber. By the mid-1890s, Jeffery and his son, Charles, had developed a keeninterest in building automobiles. Thomas Jeffery produced his first car in 1897;it was followed 1 year later by a more advanced design by Charles. By 1900, acar known alternatively as the “G & J” and the “Rambler” was exhibited at afew of the automotive shows. But, Philip Gormully died suddenly in 1900,prompting the two Jefferys to reassess the business. The bicycle business wassold to the Pope interests, and the Jefferys headed North to Kenosha,Wisconsin, to purchase a large factory for the purpose of building automobiles.
In selling their bicycle business, the Jefferys retained the rights to the Ramblername, and the earliest Rambler automobile appeared in 1902. It was awell-built, high-quality, inexpensive, one-cylinder car that sold for $750.Production during the first year totaled 1500, a production level exceeded onlyby Oldsmobile. Although the Jeffery company produced a wide variety of good cars, sales did not keep pace with the rest of the industry. Thomas Jeffery wascomfortable with production of 3000 to 3500 units. Production volume of theRambler peaked in 1913 at 4435 units. From 1905 to 1913, the company'smarket share declined from over 10 percent to 1 percent. After Thomas Jefferydied suddenly in 1910, his son, Charles, took over and made several changes,one of which was to affect the name recognition of the product in the market.In an apparent burst of sentimentality, Charles named the new car after hisdeceased father. By 1914, one of the respected names in the industry hadpassed from the scene. The new car was called the “Jeffery.”
Several new models of Jefferys were produced in 1914, including the company's first six-cylinder car. Two four-cylinder models were offered in addition to thenew six. Furthermore, the conservative company offered the more commonleft-hand drive for the first time. The combination of three new models, amore conventional configuration, and a six-cylinder engine temporarily boostedsales. Unit sales for 1914 were 10,417, more than twice the 1913 shipments.But, the higher sales levels did not last. In 1915, sales slipped back to 3100units (Table 5-6). In contrast, sales for Buick, which shipped half as many carsas the Jeffery company in 1906, increased to 124,000 units in 1916.
The Turnaround Experience: Real World Lessons in Revitalizing Corporations and Organizations

Table 5-6 Rambler and Jeffery Product Offerings
Year Name Cylinders Price Range Units produced
1902 Rambler 1 $750 1500
1904 Rambler 1 & 2 $650 to $1350 2342
1905 Rambler 1 & 2 $750 to $3000 3807
1906 Rambler 2 & 4 $800 to $3000 2765
1907 Rambler 2 & 4 $950 to $2500 3201
1908 Rambler 2 & 4 $1400 to $2250 3597
1909 Rambler 2 & 4 $1150 to $2500 1692
1910 Rambler 4 $1800 to $3350 2273
1911 Rambler 4 $2175 to $4150 3000
1912 Rambler 4 $1650 to $4200 3550
1913 Rambler 4 $1650 to $2750 4435
1914 Jeffery 4 & 6 $1550 to $3700 10417
1915 Jeffery 4 & 6 $1450 to $2900 3100
1916 Jeffery 4 & 6 $1035 to $1350 4608
Meanwhile, World War I had begun in Europe, and the Jeffery Companybecame a substantial producer of army trucks. By 1915, truck shipments wereoutpacing automobile shipments by 2 to 1. The name change to Jeffery, aninconsistent and confusing assortment of cars, and a partial withdrawal fromthe automobile market in favor of trucks discouraged potential buyers. By 1915, the manufacturer that at one time had been in second place in the industry was selling approximately 3 percent of the volume of Willys-Overland. Thecompany's market share dropped from 10 percent in 1906 to one-third of 1percent in 1915.
In May of 1915, Charles Jeffery set sail on the Lusitania, which was sunk by the Germans during the voyage. Charles was among 761 survivors, but the longhours spent in the cold water before being rescued helped him to reassess hispriorities. The next year, at the age of 40, he decided to retire. Jeffery'sretirement would open his company to new leadership that would ultimatelyorchestrate the Jeffery Company's transition from a small family-owned concern into a major producer and alter the course of U.S. automotive history.
Meanwhile, the Durant interests had repurchased control of General Motors,prompting the gradual withdrawal of several GM executives. James J. Storrow,an investment banker from Boston, was called upon to provide money andmanagerial leadership during the GM problems of 1911. Storrow then recruitedCharles Nash to help unscramble the manufacturing problems of GM duringthe period between the two regimes of William C. Durant. Later, Nash servedas President of GM, and Storrow was chairman of the board of directors. Inspite of strong personal ties between Nash and Durant, it became clear thatDurant's repurchase of GM would mean a reemphasis of acquisitions, financialdealings, and external expansion as opposed to the emphasis on efficiency and
88

internal investment which characterized the Nash-Storrow regime. In 1916,Nash and Storrow left GM in search of new opportunities.
Storrow, Nash, and Walter Chrysler initially tried to purchase the PackardMotor Car Company. When that deal fell through, Storrow and Nash purchased the Thomas B. Jeffery Company. Chrysler declined to join them, reportedlybecause he did not want to put his family to the trouble of another move.GM's future chairman, Alfred B. Sloan, Jr., was impressed enough with Nash to buy stock in the new company when Nash left GM, and he remained onexcellent terms with him. Sloan remarked in his autobiography that theinvestment was “highly profitable” (Sloan 1964). What Nash was able toaccomplish with the Jeffery Company was summarized by James Storrow in aninterview at the New York office of the Lee Higginson Co. in 1925.
Charlie Nash had been a good wagon manufacturer, and then a fine Buickfactory man. I picked him to be head of General Motors. In five years, heturned a wreck into a concern having $25,000,000 in the bank. WhenDurant took control of General Motors away from us, I wired Nash tocome here, and I said: “Charlie, you did a fine job of G.M.; if you coulddo that once, you can do it again; look around for another wreck; I'll back you.” He picked the Jeffery outfit, which we bought for less than$5,000,000. Nash made a hundred million dollars for us out of it in sevenyears. There was nothing to the Jeffery outfit. Nash was everything. Hecould do the same thing with a railroad. (Seltzer 1928)
What Nash did, of course, was to organize production. He believed that salesperformance was an outgrowth of efficient production. If the company's cost of production was low, it could afford to add differentiating quality features thatwould enable further penetration of the market. This happened with Nashproducts. The products were efficiently produced at low cost. Part of theproduction savings were then reinvested in differentiating features such ashigher-quality engines with more main bearings and overhead valves, betterbrakes, and dual ignition. For a company of modest size, Nash Motorscontributed a significant number of engineering features. But, the facility to dothis originated with efficient production. In the words of Charles Nash, “Salesis ninety percent a production problem” (Forbes 1972, 212).
During the recovery period, Nash Motors experienced dramatic growth, notonly in revenue and physical units but in market share as well. Physical unitsincreased by a factor of 12. Revenue grew by a factor of 10. Profits grewenormously and market share increased four times (Table 5-7).
The steps Charles Nash took to restore the vitality of the newly constitutedNash Motors, to achieve turnaround, and to become one of the mostsignificant producers in the industry were very specific operational steps. Nashwas a strong believer in collecting valuable information which was external tothe firm. “We don't pretend to know it all here at the factory,” he would say.
The Turnaround Experience: Real World Lessons in Revitalizing Corporations and Organizations

“The Nash product is a result of cooperation, extended by our partners in thebusiness, the Nash dealers.” Nash placed a very high value on communicationsfrom dealers and customers. Nash products were innovative and the customerreceived good value. He emphasized efficiency, distinguishing product features,and product quality. Company management believed in using the money savedby efficient production to increase the quality and value of the productsproduced.
Table 5-7 Nash Motors 1917 to 1927
Year Output Revenue (000) Profits (000) Unit market share
%
1917 12,027 $16,761 $2,027 1.00
1918 10,283 41,072 1,474 1.09
1919 27,081 41,754 5,089 1.63
1920 35,084 57,186 7,007 1.84
1921 20,850 25,428 2,226 1.37
1922 41,652 40,238 7,613 1.76
1923 56,677 58,590 9,280 1.51
1924 53,626 57,284 9,281 1.62
1925 85,428 97,821 16,256 2.21
1926 135,520 131,175 23,346 3.43
1927 122,606 113,441 24,089 3.98
Nash spent a great deal of time walking around the plant looking for ways toimprove the production process. He understood the production process verywell and worked cooperatively with managers and the rest of the work force to eliminate wasted motions and material. Nash Motors had a policy that,whenever possible, employees would be paid according to results. Inventorieswere systematically handled in a just-in-time fashion. Only small quantities ofinventories were kept on hand, and the flow of inventory through the plantwas highly efficient.
Employees, whether union or nonunion, were treated alike. Interest was shownin the welfare of the workers. The company maintained an athletic field, atennis court, and a baseball field with a seating capacity of 6000. The companyprovided free legal advice, free title examination for those interested in buyinghomes, temporary loans in the case of emergency, as well as assistance inarranging home loans. The company employees' club maintained a band, anorchestra, and a motion picture theater. By the mid-1920s, Nash Motors hademerged as one of the most efficient and consistently profitable firms in theindustry. Table 5-8 displays some key ratios among major producers of thetime.
Nash Motors based its operating procedures on the principle that too manyresources can get in the way of efficient production. Charles Nash did not want
90

extra inventory, not only because it was expensive but because it sat in themiddle of the factory floor. Total quality control was another modern conceptanticipated at Nash. Nash products were carefully made, and quality achievedduring the production process was emphasized as the key ingredient toend-product quality. With procedures similar to those employed by his friendHenry Leland of Cadillac, Nash understood that the highest cost of bad qualitywas disruption of the product process itself. He wanted superb in-processquality, not only to satisfy customers but also to keep production from beinginterrupted because of bad parts.
Table 5-8 Nash Operational Performance versus Other Manufacturers
Manufacturer 1926 profits per car 1926 profits of sales % 1929 sales-to-inventory
ratio
Nash 170 17.8 19.74
Packard 400* 17.1 8.12
General Motors 143 16.7 7.98
Ford 55* 12.8* ?
Chrysler 90 10.5 9.84
Studebaker 119* 8.8* 5.57
Hudson 52 3.3 14.93
Willys-Overland 8.84
*Approximations
Source: Moody’s Industrial Manual 1928 and 1930
One operational area where Nash Motors clearly excelled was in the efficientmanagement of inventories. During the 1920s, the inventory turns per year atNash Motors were superb when compared to those of other manufacturers.Nash's inventory turns per year climbed above 9 to 1 in 1921, reached 12 to 1in 1923, and were nearly 20 to 1 in 1926. All of this was accomplished without the benefit of computerized material-requirements planning systems,computerized process planning, or large professional staffs. Yet, the Nash
The Turnaround Experience: Real World Lessons in Revitalizing Corporations and Organizations
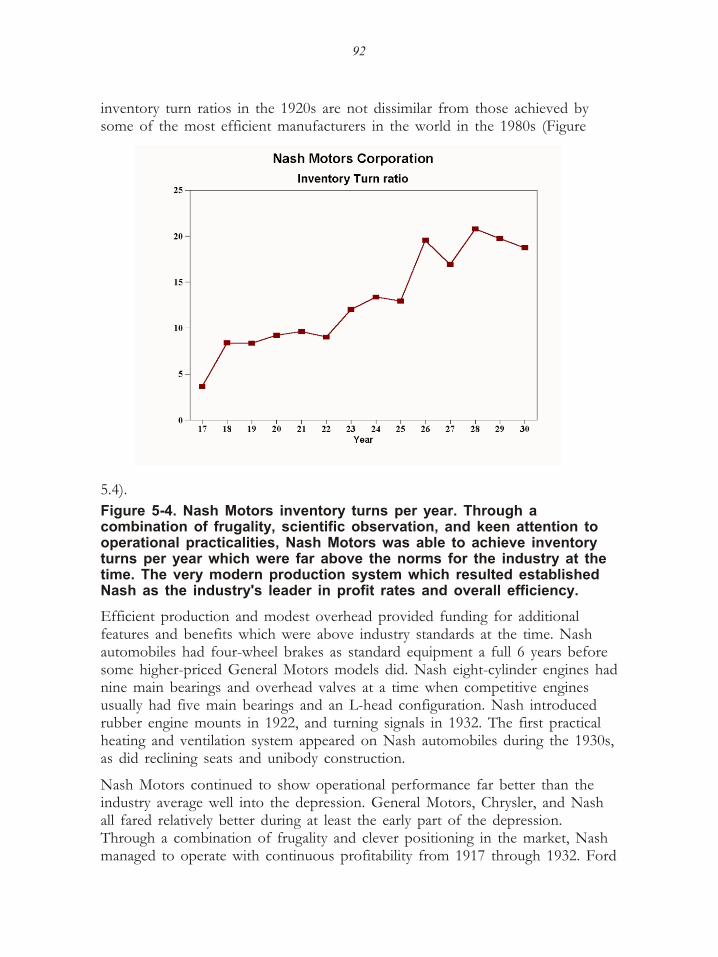
inventory turn ratios in the 1920s are not dissimilar from those achieved bysome of the most efficient manufacturers in the world in the 1980s (Figure
5.4).
Figure 5-4. Nash Motors inventory turns per year. Through acombination of frugality, scientific observation, and keen attention tooperational practicalities, Nash Motors was able to achieve inventoryturns per year which were far above the norms for the industry at thetime. The very modern production system which resulted establishedNash as the industry's leader in profit rates and overall efficiency.
Efficient production and modest overhead provided funding for additionalfeatures and benefits which were above industry standards at the time. Nashautomobiles had four-wheel brakes as standard equipment a full 6 years beforesome higher-priced General Motors models did. Nash eight-cylinder engines had nine main bearings and overhead valves at a time when competitive enginesusually had five main bearings and an L-head configuration. Nash introducedrubber engine mounts in 1922, and turning signals in 1932. The first practicalheating and ventilation system appeared on Nash automobiles during the 1930s, as did reclining seats and unibody construction.
Nash Motors continued to show operational performance far better than theindustry average well into the depression. General Motors, Chrysler, and Nashall fared relatively better during at least the early part of the depression.Through a combination of frugality and clever positioning in the market, Nashmanaged to operate with continuous profitability from 1917 through 1932. Ford
92
lost money in 1927, 1928, 1932, 1933, and 1934. Chrysler lost money in 1932and 1933. Hudson lost money from 1930 to 1934 and from 1938 to 1940.Packard money in 1931, 1932, and 1934. Studebaker, Franklin,Willys-Overland, and several others entered receivership or ceased operations.But Nash operated profitably until 1933, when some modifications to the Nashproduct line necessitated greater investments to revitalize sales. This wasaccomplished in a few years, and by 1940 Nash emerged as an efficientproducer of higher-quality and innovative, lighter cars. By 1941, the companywas operating again at an acceptable rate of profit and at a gross profit thatwas the second highest in the industry.
What type of leadership style did Nash employ to achieve these combinationsof product quality and organizational efficiency? He was distinctly frugalhimself. He was a tough but well-respected, value-oriented working managerwho had a particular strength in organizing production. He was ratherconventional in his personal life. The following quotations provide us with abrief sketch of Charles Nash.
A bit paternalistic by today's standards, what with his practice of personally distributing $10 bills to his factory workers at Christmas time, Nashnevertheless enjoyed a uniquely cordial relationship with his employees.Oftentimes at noon he would be found in the company cafeteria, eating hislunch side by side with the factory hands. He could call hundreds of themby name, and he rejoiced when they responded by calling him “Charlie.”(Brown, 1981)
Charles Nash was as steady and careful as Mr. Durant was brilliant and daring— or reckless as you may chose to call it. In 1910, Mr. Nash had littleexperience in automobiles, but he demonstrated talent in the art ofmanufacturing and administration....The great automotive producers in GeneralMotors had been Mr. Durant, Mr. Nash and Mr. Chrysler. (Sloan 1964, 8 to55)
Mr. Nash gets more satisfaction from his association with “the boys” in theorganization than from “society.” (Forbes 1972, 223)
But, if you would watch this manufacturer of motor cars enjoying therecreation which he likes best, you would not have to travel further than hishome in Kenosha and see him in action with his four little grandchildren. He is an even greater success as a granddaddy than as a motor manufacturer. (Forbes1972, 224)
The resignation of Charley Nash left a big hole in the General Motorsorganization. He had been a vital factor in the success of the corporation and I hated to see him go away. Not only was he a loyal friend and a grand man but I knew him to be one of the country's greatest industrialists. The tremendoussuccess that he has made at Racine with the Nash Motor Company is
The Turnaround Experience: Real World Lessons in Revitalizing Corporations and Organizations
something any of the friends he left behind him at General Motors would have predicted from the day he left Michigan to go to Wisconsin. (Chrysler 1937,144)
Charles Nash compiled an impressive record by emphasizing efficiency,frugality, and returning to the customer part of that savings in the form ofhigher-quality, market-appropriate products. He fully understood the importance of being a low-cost producer, and he also understood how this cost leadershipcould be transformed to provide greater product differentiation. The Jefferyturnaround was based on efficient production and modest overhead. Theseefficiencies permitted the company to invest in product-differentiating featuresand higher product quality. The personal traits of the leader were basic. He was quiet, honest, didn't spend much money, and focused on managing the business the firm was in at the time. He liked building things, he liked the people whobuilt them, and he liked the customers who bought them. As an innovator, heskillfully judged his product offerings to accommodate what he thought thesociety would need in the future — more fuel-efficient, lower-cost, well-builtsmaller cars employing unibody construction. The company, known later asAmerican Motors, survived as a separate company until 1987 as one of fourremaining U.S. auto producers. It now operates as the Jeep/Eagle Division ofChrysler Corporation.
Nash Survived Because…
· Operational efficiency was among the highest in the world.
· Inventory efficiency was the highest.
· Management focused on operational matters.
· Employees were individually known and respected by top officers.
· Frugality prevailed in all matters.
· Money that was spent pertained to what the customer was buying.
· Quality problems were brought to the attention of the entire organizationand suggestions were sought.
Case 4 — Majestic Laxity at the Willys-Overland Company
Prior to 1920, the Willys-Overland Company was one of the largest automobile producers in the country. The company started as the Overland Company, butafter a troubled start, one of the Overland dealers, John North Willys, made atrip to the factory to register his concerns regarding the tardy deliveries ofOverland products. Willys ended up taking over control of the company in1907 and began pouring his energies into improving the company's offerings
94 Chapter 5 — Achieving and Sustaining Modest Overhead

and building a stronger sales organization. Sales greatly improved — from 4860 cars in 1909 to over 140,000 cars in 1916. Market share moved from negligiblelevels before the arrival of Willys to more than 10 percent by 1915.
By 1915, Willys-Overland was the industry's third-largest producer withproduction volume nearly equal to that of General Motors, which producedonly 102,000 cars in 1915. Willys-Overland was not only an enormous producer of automobiles but also a substantial component supplier to other automobilecompanies, because of its ownership of Auto-Lite Electric Company and othercomponent suppliers. In contrast to the 91,000 cars produced byWillys-Overland in 1915, Hudson produced 12,684, Jeffery produced 3100, andMaxwell produced 44,000. Chevrolet, then a separate company, produced 13,292 cars in 1915.
John North Willys achieved both prominence and personal wealth, and hebegan to travel and diversify his interests. By 1916, the dual problems ofneglect and overexpansion began to surface in the Willys organization. Thecompany had acquired several related and unrelated businesses, and some ofthem were not successful. In addition, the costly development of thesleeve-valve engine had begun. The sleeve-valve engine employed a series ofprecision sleeves to accomplish the intake and exhaust valving from thecombustion chamber. The purpose was to alleviate some of the wear andperformance problems of the poppet-valve engines used by othermanufacturers. However, when other manufacturers solved some of these sameproblems by improving metallurgical processes, the few advantages of thesleeve-valve engine could not outweigh its additional cost and its otheroperational disadvantages of excessive oil consumption and limited revolutionsper minute. Willys-Overland was faced with a cost disadvantage after asubstantial capital investment.
As Willys withdrew from day-to-day involvement in the company, he left thebusiness in the hands of individuals who built a comfortable life for themselves but neglected day-to-day operations and wasted company resources. Salesdeclined from 140,000 units in 1916 to 48,000 in 1921. Willys-Overlandfinances, already stretched thin from the acquisitions, were stretched further.Financial backers exhibited concern, and in 1919 they actively sought an outside manager to bring the affairs of the company back into order. Meanwhile,Walter Chrysler had left General Motors in 1919, perhaps intending to retire or perhaps because of dissatisfaction with the Durant financial interests, afterDurant had gained control of GM. In 1920, the backers of Willys-Overlandwere able to convince Chrysler to undertake the task of revitalizingWillys-Overland for a fee of $1 million per year.
Walter Chrysler was not an admirer of Willys products and did not manifest astrong interest in becoming personally involved in the company, but he did his
The Turnaround Experience: Real World Lessons in Revitalizing Corporations and Organizations

job as a turnaround agent. He significantly reduced overhead expenses,increased operational efficiencies, got the company refinanced, and worked with an outside consulting firm to develop a new automobile for the company.Through a combination of frugality, better production management, improvedhandling of inventories, and the restructuring of the operations, Chrysler wasable to reduce the company's bank loans from $46 million to $18 million.Production and sales improved, as seen in Table 5-9. (Forbes 1972, 35).
Table 5-9 Willys-Overland Production and Market Share
Year Production Market share %
1909 4,860 3.8
1910 15,598 8.6
1911 18,745 9.4
1912 28,572 8.0
1913 37,422 8.7
1914 48,461 8.9
1915 91,904 10.3
1916 140,111 9.2
1917 130,988 7.5
1918 88,753 9.4
1919 80,853 4.9
1920 105,025 5.5
1921 48,016 3.2
1922 95,410 4.0
1923 196,038 5.2
1924 163,000 4.9
1925 215,000 5.6
1926 182,000 4.6
1927 188,000 6.1
1928 315,000 7.8
1929 242,000 5.1
1930 69,000 2.4
1931 74,750 3.7
1932 26,710 2.3
1933 29,918 1.8
1934 7,916 0.4
Willys remained president during the period but operated with instructions from his financial backers to cooperate with Chrysler. This he did. He even willinglyaccepted the reduction in his own salary imposed by Chrysler and workeddiligently to sell the merits of Chrysler's involvement to the concerned dealerorganization.
However, Willys was far more comfortable in a sales mode than in aretrenchment mode, and he had long considered Willys-Overland to be his own personal company. In 1923, he arranged with some financial backers in Toledo
96

to take the company into bankruptcy and regain control through this means.Chrysler had already become involved in the troubled Maxwell-ChalmersCompany, and Willys again took control of Willys-Overland. The new modelcar developed during the Chrysler era was later sold with the plant to DurantMotors to raise cash.
Willys then poured his energies into selling cars and restoring the confidence of the dealer network. What was to follow, of course, was the most robustautomobile market for the next 30 years. He enthusiastically barked the meritsof Willys-Overland products, copied elements of the respected styling ofPackard, and effectively marketed his way back into third place in the industry.
The turnaround of Willys-Overland after the departure of Chrysler was markedby extreme response to the marketplace. Under Willys, relations with dealerswere cooperative and cordial. Even more important, they were continuous.Willys was on the road constantly, recruiting, encouraging, and listening todealers. The company manifested no particular operational or technologicalstrengths, but it did display a limited closeness to the customer.
This willingness to respond aggressively to customer's interests enlarged theWillys-Overland product line beyond what would be expected for the share ofthe market the firm possessed. Production increased from 48,016 in 1921 to315,000 in 1928. However, the number of basic Willys-Overland modelsproliferated greatly to achieve greater sales. Table 5-10 comparesWillys-Overland and Nash Motors for the years 1927 to 1928 and reflects thediffering emphases of the two firms.
With a much lower market share, Nash Motors had been able to make almost4 times the profit of . Even during its best sales year in 1928, Willys-Overlandachieved a gross profit rate of only 11.4 percent as compared to 20 to 30percent by GM, Chrysler, Nash, and Packard. Though the company did well insales all through the 1920s and gained significant market penetration, it had not cultivated the skill to manufacture cars efficiently. One sage observer of theindustry remarked that John North Willys could build more cars and make lessmoney doing it than anyone in the industry (Kennedy 1941).
The Willys-Overland problem of manufacturing inefficiency was exacerbated bymanagement's decision to enter the low-priced field as a high-cost producer.The Whippet automobile was announced in 1926. The car was similar in sizeand price to a Chevrolet, but the engine was smaller and lacked the styling anddurability of the Chevrolet. However, the car sold well, and 197,000 Whippetswere produced in 1928. Manufacturing costs remained high, and the incremental revenue achieved in 1928 was actually less than the additional costs incurred inobtaining the revenue. The expenses of Willys-Overland were too high for thelow-priced field.
The Turnaround Experience: Real World Lessons in Revitalizing Corporations and Organizations

When the great depression arrived, the strategy of a car for every taste wasinappropriate. For one model after another, car sales fell below their breakevenpoints. Total unit sales fell from 315,000 units in 1928 to 242,000 in 1929.Sales fell again to 69,000 units in 1930, then to 26,710 in 1932, and 7916 in1934. From 1928 to 1934, unit sales declined by 97.5 percent. In 1935, thecompany entered receivership. John North Willys had sold his stock in 1929before the crash.
Table 5-10 A Comparison of Nash and Willys-Overland Profits
Nash
Year Units Revenue ($000) Profits ($000) Unit market share %
1923 56,677 $58,590 $9,280 1.51
1924 53,626 57,284 9,281 1.62
1925 85,428 97,821 16,256 2.21
1926 135,520 131,175 23,346 3.43
1927 122,606 113,441 22,671 3.98
1928 138,137 120,746 21,342 3.44
Willys-Overland
Year Units Revenue ($000) Profits ($000) Unit market share %
1923 196,038 – 13,034 5.22
1924 163,000 – 2,087 4.92
1925 215,000 —- 11,423 5.56
1926 182,000 —- 1,820 4.60
1927 188,000 153,120 6,342 6.10
1928 315,000 187,233 6,382 7.85
After the company emerged from receivership with a plan of reorganization inAugust of 1936, operations were centered around a small, low-cost,four-cylinder automobile which utilized the old Whippet engine. The engine,although not initially known for its durability, was refined during the 1930s byBarney Roos, an engineer who had enjoyed successful experiences withPierce-Arrow, Marmon, and Studebaker. This engine's performance allowed thecompany to predominate in the manufacturer of Jeeps during World War IIand provided it with some life even after the war. After two bankruptcies,significant losses in the 1950s, a 15-year stretch as part of Kaiser Industries,and 17 years as a part of American Motors, the operation survives today aspart of Chrysler Corporation.
The Willys-Overland turnaround of 1920 to 1928 was primarily a sales-basedturnaround that was made possible by some quick operational and financialmeasures taken during the 2-year stay of Walter Chrysler. But, the turnaround
98

was not successful in the long term. Inefficiencies in production and excessively high overhead ultimately consumed the resources necessary to create productdifferentiation. In less favorable economic times, the company's products wereinsufficiently differentiated, and the company failed to develop new ones. Theefficiencies of Willys-Overland were such that the firm could operate profitablyonly during boom periods against competitors who had plenty of business.
The Willys-Overland turnaround is interesting because of its emphasis.Sales-based turnarounds can work for short periods but do not necessarilyprovide the company with the operational expertise to survive over longerperiods under differing conditions. In the final analysis, Willys-Overlandresurfaced only after restructuring on the strength of the product capabilities of one of its engines, and then only with the help of two court restructurings. The turnaround did not fail because of the great depression. Other, smaller firmsdid survive. Nor did it lack sufficient sales. Other survivors sold substantiallyfewer units. The turnaround ultimately failed because the desires and the skillsnecessary to achieve operational efficiencies and modest overhead were notnurtured and sustained over prolonged periods. The company did not developthe organizational infrastructure that fostered efficiency and proficiency inproduct development. The turnaround also failed because the company spenttoo much money and time on things unrelated to what the customer wasbuying.
Failed Because…
· Variable costs exceeded variable revenue.
· Operational efficiency was lacking.
· Management lacked technical experience.
· Inventory efficiency was poor.
· Top management became diverted and did not focus on operationalmatters.
· Too much money was spent.
· Expenditures were unrelated to what the customer was buying.
The Turnaround Experience: Real World Lessons in Revitalizing Corporations and Organizations

Chapter 6 — Lowering Cost throughDesign
From 1980 to 1982, Ford Motor Company experienced devastating lossestotaling more than $3 billion that threatened the existence of the 80-year-oldcompany. Market share slipped from 23 percent in 1977 to less than 14percent in 1982. Over the years, Ford had always been able to produceinteresting new products, but from 1970 to 1982, the company found itdifficult to produce those interesting new products at less than the sellingprice. Incremental costs had substantially outpaced incremental revenue, andduring the early 1980s, Ford losses exceeded $3 billion. Yet years later, in1987, 1988, and 1989, the Ford Motor Company emerged as one of the most profitable automobile companies in the world. Integral to Ford’s turnaroundwas its ongoing commitment to the lowering of costs through product design.
A quarter of a century earlier, American Motors had been faced withextreme competition when unit sales plummeted from 333,829 units in 1950to 113,571 in 1954, a domestic market share of under 2 percent. At the time, American Motors manufactured two lines of full-sized automobiles and twolines of compacts including seven complete engines. Forced by the pressuresof losing $60 million from 1954 to 1957, American Motors’ astutemanagement chose to concentrate its efforts on one well-designed makecalled the “Rambler.” By 1960, sales moved up to 485,000 units, andAmerican Motors regained a 7.25 percent market share, while profitsrebounded to healthy levels. What enabled American Motors to move fromdisaster to vitality in the fiercely competitive low-priced market was intensefocus on the manufacturability of its products.
At the close of World War II, one of the country’s most reputable andefficient industrialists teamed with an experienced automobile marketeer toenter the automobile business. Within 3 years, Kaiser-Frazer had surpassed,in unit sales, all other independent producers, including such highly regarded marques as Packard, Nash, Hudson, Studebaker, and Willys-Overland. Eightyears later, the firm suspended all operations in North America. What led tothe demise of Kaiser-Frazer was not product styling or ineffective marketingbut limited experience in designing products for low-cost production.
The design of products (and services) for manufacturability (anddeliverability) is a favorable strategic attribute with application acrossindustries. Service providers, material suppliers, utilities, retailers, andwholesalers must also be concerned with the design of their products anddelivery systems. Design of delivery systems for service companies is asimportant as the design of the products of manufacturing companies. It isdifficult for a firm to make money if products and services are expensive todeliver.
100

The process of turning around a company is only partly managerial; it isalso technical. There are limits to what managerial concepts can accomplishin reducing the cost of difficult-to-build products. Successful companies have clear-cut programs to design products and services for manufacturability andlow-cost delivery. Successful manufacturability programs include highlyintricate processes involving broad consensus among team players and clearunderstanding of technical detail on the part of management.
Many firms have greatly improved their competitive position by improvingthe design of their products. IBM, Black and Decker, Deere, Maytag,Lincoln Electric, and Chrysler all endured competitive pressure to designproducts for low-cost delivery. The manufacturability features incorporatedinto the Ford Taurus and the Mercury Sable product design wereinstrumental in the resurgence of Ford Motor Company from billion dollarlosses in the early 1980s to the industry’s leading profit position in 1986 and 1987. From 1981 to 1987, Ford’s market share increased from 16.4 to 20.2percent, while GM’s market share slipped from 45.8 to 36.3 percent. Duringboth 1986 and 1987, at much lower revenue levels, Ford earned greaterprofits than GM. What is perhaps most significant is the 1983 to 1987differences in before-tax profit rates. Ford’s before-tax profit rate rose from4.87 to 10.30 percent, while GM’s before-tax profit rate shrank from 7.98 to1.97 percent.
Ford and GM employed different strategies in pursuing profitabilityfollowing the recession of the early 1980s. GM launched an all-out programof factory automation designed to reduce per-unit manufacturing cost. Fordchose to incrementally improve the efficiency of internal operations andimprove the manufacturability of its products. The result is clear. Ford didmuch better.
Automation versus Designing for
The manager wishing to improve profitability must achieve a delicatebalance between efficiency in the manufacture and design of products so that they can be effectively produced. Both strategies are necessary, andcompetence with one strategy usually improves the odds of being successfulwith the other. IBM has product costs among the lowest in its industry andhas long been a leader in factory automation. However, the manufacturability of the IBM ProPrinter was such that heavy assembly automation was notrequired. The unit snapped together with minimal assistance from either tools or fixturing. The design of the IBM ProPrinter allowed IBM to continue asan active competitor in a highly competitive market dominated by foreignproducers.
During the highly competitive decade of the 1980s, much has been writtenregarding the need to apply computer technology to U.S. manufacturing as adefense against low-cost foreign competition. Situations do exist in whichautomation is the appropriate solution, while in other instances changes in
The Turnaround Experience: Real World Lessons in Revitalizing Corporations and Organizations

materials, in product characteristics, or product design will have a greaterimpact on cost, particularly short-term cost, which is of most immediateinterest to the turnaround agent. Unfortunately, some of the late-arriving textmaterial on manufacturing is appropriate for very large-scale activities suchas those carried on in Chevrolet plants, yet the average size of Americanplants is shrinking. Automation can help a producer attain greater economies on a smaller scale, but like any other turnaround factor, it does not lenditself to simple, block-diagram interpretations. By itself, automation is not an especially useful turnaround strategy because it takes a long time to installgood automation, even with the help of a solid and experienced supportstaff. Until automation becomes easier to install, more cost-effective, andmore sophisticated, the lowering of costs through product design will remain a highly practical turnaround strategy.
Bold new design initiatives such as the Ford Taurus often require newautomation systems, of course. However, many companies such asHarley-Davidson have been able to significantly increase profits by couplingdesign changes with the intelligent use of existing machinery. This wasindeed the case during the troubled times of Maxwell-Chalmers whenproduct designs were modified to make most effective use of equipment inthe Chalmers factory. The same methodologies have been employed at inother instances since. Product designs and production methodologies mustwork together and not be treated as separate unconnected activities, as is still the case with many companies.
Designing for Manufacturability
Successful companies routinely address product manufacturability as a mainpriority. Product manufacturability programs were present at Deere, Buick,Cadillac, Nash, Chrysler, Packard, and American Motors during the late1950s and early 1960s. The managers of these successful turnaroundsunderstood production processes well and insisted that product design andproduction efficiency interact to improve competitive position. The successful firms actively reduced their number of component parts by designing partsusable in several applications with only minor modifications. AmericanMotors made five engines, three sixes and two V8s from nearly identical sets of pistons and valves. Deere’s two-cylinder tractor contained 1400 fewerparts than the comparably powered International Harvester models. ChryslerCorporation built several passenger cars and several series of minivans fromthe same basic platform. Many other examples in the case materials provideadditional evidence that successful turnaround companies achieve low-costoperation through the effective design of products and services. Theyaccomplish manufacturability not only by employing more capable designersbut also through the assistance of key suppliers, maintenance people, andcompany employees.
In contrast, management of the unsuccessful turnarounds treatedmanufacturing more as an afterthought rather than as a proactive competitive
102

force. Product manufacturing difficulties with specific products contributed to the unsuccessful turnaround performance of Willys-Overland (with thesleeve-valve engine), International Harvester (with crawler tractors and sometrucks), Hudson (with the Monobilt body and frame), Kaiser (with itssculptured styling), and AMC-Renault during the later years with the Pacer.Unsuccessful firms more commonly employed only short-term cost-reductionprograms and neglected manufacturability and parts commonality in productdesign.
Attention to detail is the key to reducing manufacturing cost through product design. Each individual part must be properly designed to meet competitivecost requirements. An expensive part, an expensive procedure, or anadditional service requirement can plague a company through the entire lifeof a product. For example, the Hudson valve lifter was installed in allHudson engines from the 1920s through 1947 and in all eight-cylinderengines from 1948 to 1952. In contrast to other valve lifters in use at thetime, Hudson’s was much more expensive to produce—probably about $2more per unit in today’s cost. While most valve lifters required machiningon one or two basic machines, the Hudson part required complex operationson several different machines. Further, the design of the part produced earlywear, which altered the critical valve clearance, thus affecting engineperformance, and also made the engine very noisy. The significance of thisone bad part in the history of the Hudson Motor Car Company becomesclear when we reflect on the fact that the company made approximately 35million of them. A poorly designed, expensive, unreliable part with a runsize of 40 million is not the way to implement a turnaround. Hudson’spractice of pinning piston rings also added extra cost to the product,increased the probability of ring breakage during both assembly and repair,and probably did not improve product performance in any material way.Hudson did have some product designs that employed the same nominalparts. However, the machining tolerances were such that a great many partsdesigned to be the same were identified with different part numbersreflecting various sizes over and under the nominal dimensions of the part.This variety further complicated manufacturing efficiency at Hudson.
Willys-Overland also neglected manufacturing cost, as did InternationalHarvester and AMC-Renault. Willys-Overland’s profit margin eroded formany years because of the expensive sleeve-valve engine. Initially the engine had some advantages over the conventional poppet-valve engine, butimprovements in the metallurgy and design of poppet-valve components soon erased any appreciable difference in performance. Willys-Overland was leftwith an expensive design that burned too much oil. International Harvesterhad too many basic components for both its trucks and its farm equipment.American Motors’ Pacer had 500 lb of additional weight as compared to cars in the same price class. Though the car handled well, this additional weightraised manufacturing cost and reduced gas mileage during a major oilshortage. AMC-Renault after-tax profit margins ranged from -5.8 percent to2.7 percent during the years when the Pacer was a significant seller. Thedesign of product for manufacturability did not emerge as an important part
The Turnaround Experience: Real World Lessons in Revitalizing Corporations and Organizations

of the turnaround strategies employed by the unsuccessful companies (Figure 6-1).
104
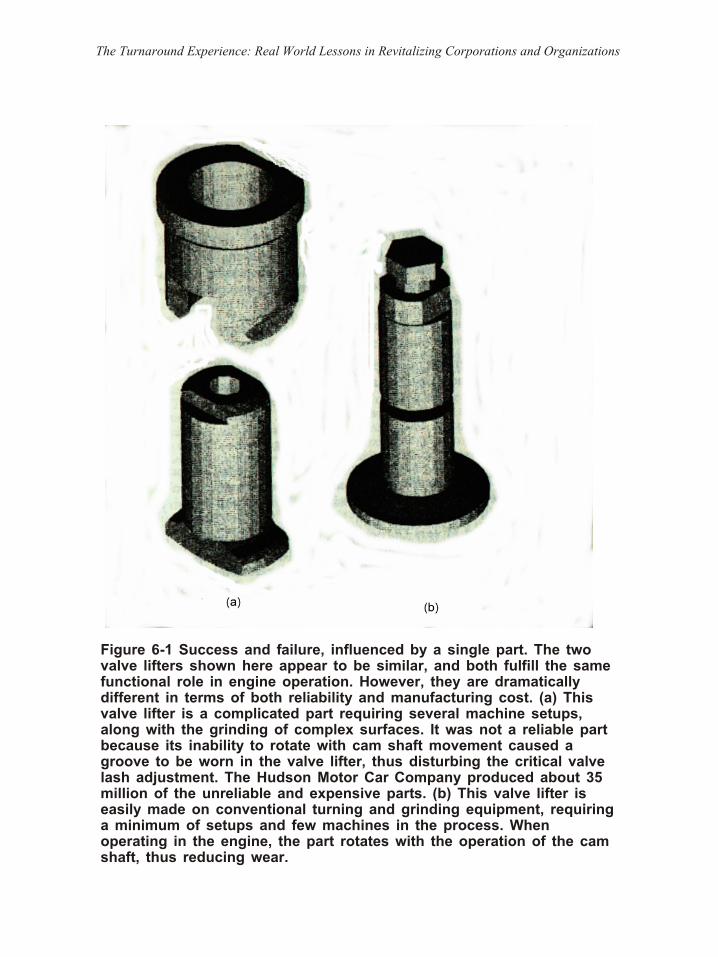
Figure 6-1 Success and failure, influenced by a single part. The twovalve lifters shown here appear to be similar, and both fulfill the samefunctional role in engine operation. However, they are dramaticallydifferent in terms of both reliability and manufacturing cost. (a) Thisvalve lifter is a complicated part requiring several machine setups,along with the grinding of complex surfaces. It was not a reliable partbecause its inability to rotate with cam shaft movement caused agroove to be worn in the valve lifter, thus disturbing the critical valvelash adjustment. The Hudson Motor Car Company produced about 35million of the unreliable and expensive parts. (b) This valve lifter iseasily made on conventional turning and grinding equipment, requiring a minimum of setups and few machines in the process. Whenoperating in the engine, the part rotates with the operation of the camshaft, thus reducing wear.
The Turnaround Experience: Real World Lessons in Revitalizing Corporations and Organizations

Practical Lessons on Lowering Cost through Design
· Successful companies routinely address design as a main priority inlowering the cost of the products and/or services provided.
· Successful companies critically examine most offered services and mostutilized parts to ensure that the costs for these items are below industrystandards while quality is maintained.
· Unsuccessful companies do not sufficiently scrutinize the quality anddelivery cost of most frequently used components.
· Commonality of parts is an appropriate strategy only if the parts are easyto produce.
· Well-orchestrated programs of lowering cost through design have at leastas much cost impact potential as automation programs.
Case History
American Motors Corporation’s recent acquisition by Chrysler Corporation is ironic because 25 years earlier, AMC had developed what was probably themost advanced concepts of design for manufacturability existing in theindustry at the time. Low-cost product designs helped the Nash Motor CarCompany, reconstituted as American Motors Corporation, surface as the lone survivor among the independent producers during the falloff of the seller’smarket and fierce competition between Ford and General Motors. From 1955 to 1963, five out of the six independent producers ceased operations but,under dire financial and competitive circumstances, American Motors foundways to survive. The chief prescriptions were simple: spend less money than is taken in and design easily produced products. The company not onlysurvived, but for a brief period of time, the American Motors Ramblerbecame the third best selling car in the world. In many respects, AmericanMotors’ performance of the late 1950s anticipated by 30 years the demandsthat U.S. producers must face in surviving against low-cost globalcompetition today.
Case 5 — Making the Most of American Motors
For more than 20 years, under the stewardship of Charles Nash, Nash Motors,Inc., was an especially well-run automobile company. Production was efficient,costs were low, innovation was high, and a good rapport existed between thecompany and its work force. The depression affected Nash Motors, but thefirm successfully weathered this period because of its low production costs anda strong balance sheet. Charles Nash, however, was growing older. As heentered his mid-seventies, the company merged with the Kelvinator Co., amanufacturer of home appliances. This merger provided the company with
106
some diversification and a knowledgeable successor to Nash in KelvinatorCEO, George Mason, an understudy of Nash’s friend Walter Chrysler.
Mason was a capable, personable, and innovative chief executive officer, wellrespected in the industry. During his regime, Nash-Kelvinator built high-quality, innovative products, including automobiles with unibody construction, recliningseats, and the first truly good heating and ventilating system, the Nash Weather Eye. A joint venture with a British firm produced the Nash-Healey sports car,which brought further traffic to Nash showrooms. One of Mason’s mostsignificant accomplishments was the authorization to build a high-quality,well-designed, compact car. To name the car, the designers reached well backinto Nash/Jeffery history and picked the name Rambler.
The 1950 Rambler represented a marked departure from contemporary attempts to build a lower-cost automobile because the car was of very high quality.Ramblers came complete with radios, rustproofing, attractive bright metal trim,reclining seats, and thoroughly proven running-gear components. Two bodystyles were offered, a safety-oriented convertible with a reinforced steel top and an all-steel station wagon. Considered a niche car at the time, the car sold well, with sales reaching 57,000 units in its second year.
Meanwhile, the fierce price competition between Ford and Chevrolet hadproduced a decline in the sale of medium-priced cars produced by theindependents. Kaiser-Frazer sales fell from 166,000 in 1948 to 23,000 in 1953.Packard unit sales declined from 98,000 in 1949 to 71,000 in 1953. Studebakersales fell from 268,000 in 1950 to 161,000 in 1953. Full-size Nash model salesdropped from 169,000 to 94,000 during the same period, while full-size Hudson sales plummeted from 144,000 to 57,000. Improved engine, drive train, andmodel offerings from higher-volume manufacturers intensified the competitivepressure on independent automobile producers. A wider variety of cars wasbeing produced, more efficiently and in greater volumes by the majorproducers, thus putting pressure not only on the independent producers butalso on their dealers, and many dealers were switching to the major brands.
Mason understood well the practical problems facing smaller manufacturers, and to buffet his firm from the increasing competition, he initiated the formation of American Motors via a merger between Hudson and Nash in 1954. Initially,Mason wanted to merge with Packard. He felt that Packard was strongerfinancially and enjoyed more prestige in the marketplace. The higher-pricedPackards would line up well with the medium- and low-priced products offered by Nash, but the Packard deal fell through primarily because of resistance onthe part of Packard’s new president, James Nance. Mason then turned toHudson.
Theoretically, the opportunity for synergy existed between Hudson and Nash.Both companies offered conservative, medium-priced cars that often competed
The Turnaround Experience: Real World Lessons in Revitalizing Corporations and Organizations

with one another. Both firms employed unibody construction. Both emphasized six-cylinder rather than eight-cylinder engines. Both used some of the sameelectrical components and other parts. Both dealer networks neededstrengthening, but the merger was one of near desperation on the part ofHudson and perceived opportunity on the part of Nash. By the mid-1950s, theindependents were caught in a cost squeeze between Ford, Chrysler, and GM.The market share of the independents had decreased from 19.2 percent in 1948 to 4.1 percent in 1954 (Edwards 1965, 14). Hudson sales had been hitparticularly hard. By 1954, both Nash-Kelvinator and, to a much greater extent, Hudson were incurring substantial operating deficits (Table 6-1).
Table 6-1 Hudson and Nash Shipments, 1948 - 1954
Marque 1949 1950 1951 1952 1953 1954
Nash (full-size) 143,268 169,466 105,499 100,005 93,694 25,232
Nash Rambler 0 20,782 57,555 53,055 41,885 37,779
*Total Nash 143,268 190,248 162,154 153,060 135,579 62,911
Hudson (full-size) 144,685 143,581 92,586 79,117 57,040 36,436
Hudson Jet 21,143 14,224
Total Hudson 144,685 143,581 92,586 79,117 78,183 50,660
Combined total 287,953 333,829 254,730 232,777 213,762 113,571
The merger did not work immediately. Production was concentrated in themore efficient Nash plant at Kenosha, Wisconsin, and the slow-selling HudsonJet was dropped in favor of the Rambler. But the early days of the newlycreated American Motors Corporation were fraught with confusion becauseMason’s new responsibilities forced him to leave some important detailsunattended. In late 1954, Mason died and the title of CEO passed to his ablelieutenant, George Romney. Romney took immediate action to correct many ofthe company’s problems. The results were not immediate; in 1955 and 1956American Motors showed greater and deeper losses.
George Romney had gained considerable experience in the automobile businessas the coordinator of the production capabilities of the U.S. auto companies insupport of the war effort in World War II. In his previous American Motorspositions of vice president and executive vice president, he spent considerabletime in efforts to improve AMC’s manufacturing efficiency. Born of Mormonmissionary parents when they were residing in Mexico to escape religiouspersecution, Romney was educated in the obligations of the Mormon religion.His sense of responsibility and proper behavior was well cultivated—attributeswhich served him well as AMC’s crisis deepened.
108
Romney quickly took several important steps to turn the operations of thecompany around. He effected austerity measures beginning with the chairman’sown comforts and compensation. George Romney cut his own salary by 26percent, insisted on staying in single rooms at modest motels, spurned fancyoffices and expensive dinners, and frequently carried his own lunch. Othermanagers followed suit. Twenty-four executives took voluntary pay cuts.Overhead expenses were trimmed $38 million in 1955 to $28 million in 1958.Following the expense reductions at higher levels, he respectfully confronted the company’s bargaining unit with the objective of improving productivity.Productivity did improve. He initiated high-profile programs to improvemanufacturing productivity by standardizing components, by improving rapportwith workers, and by developing products that were explicitly designed forhigher rates of operational efficiency (Mahoney 1960).
Still, the sales of American Motors’ midsized cars (Hudson and Nash)continued to languish. By 1956, unit sales of the midsized cars had declined to25,000 units, less than one-tenth of Hudson/Nash’s total for the 1950 modelyear. Romney’s strategy was to concentrate the full efforts of AMC’s dwindlingresources and energies on one main model, the Rambler. Hudson’s smaller car,the Jet, had been dropped under Mason.
Romney also took steps to develop a more broadly based decision-makingsystem within the company and to improve and cultivate the management team. With missionary zeal, he instituted an intensive program to mend relations with the company’s dealers. The theme of this program was America’s emerginginterest in a high-quality compact car as opposed to the opulent gargantuanautomobiles of the late 1950s, which Romney titled the “dinosaur in thedriveway.”
Perhaps the most important contribution of all during the Romney era wasdevelopment of the American Motors’ manufacturing strategy. He wasparticularly interested in having American Motors be competitive inmanufacturing cost. During this period, American Motors developed aphilosophy that Romney articulated before the U.S. Senate Subcommittee onAntitrust and Monopoly in 1958:
Our studies, based on our own experience and that of our competitors,[show] that optimum manufacturing conditions are achieved with aproduction rate of 62.5 cars per hour per assembly line. To absorb thedesired machine-line and press-line rate, two final assembly lines would berequired. Of course, your press line and your machine line are the principle lines on which you depend for work leading up to subassemblies and theultimate production of the car itself on the assembly line. This would result in production of 1,000 cars per shift.
A company that can build between 180,000 and 220,000 cars a year on aone shift basis can make a very good profit and not take a back seat to
The Turnaround Experience: Real World Lessons in Revitalizing Corporations and Organizations
anyone in the industry in production efficiency. On a two shift basis,annual production of 360,000 to 440,000 cars will achieve additional smalleconomies but beyond this volume, only theoretical and insignificantreductions in manufacturing costs are possible. It is possible to be the bestwithout being the biggest (Edwards 1965, 155).
The strategy emphasized commonality of parts, operational efficiency, design for manufacturability, effective purchasing, and product design for the minimization of tooling expense. Aluminum extrusions replaced the expensively tooled metalstampings for window frames, a change which made the rest of the door easier to produce and made production of a common component for hardtop,convertible, and two-door sedan models possible. The doors and door framesfor the prior year’s senior Rambler became the door and door-frame assemblyfor the Rambler American. Running gear parts were largely standardized among product lines. Wherever possible, parts were designed so that right and leftversions of the part were interchangeable.
Both Nash and Hudson had pioneered the development of unibody automobile construction (integrated body and frame of all welded components), the samesystem that had become the standard for small-car production throughout theworld by the 1970s. The unibody design of the Rambler allowed the companyto produce a lightweight car which was very strong and yet employed fewercomponent parts. The design of the Rambler body and frame unit was a keyelement in manufacturing efficiency. Components such as the dashboard andthe rear storage shelf, which had previously been bolted to other structuralcomponents, became welded structural components themselves. The resultswere better products, lighter products that consumed less fuel, and lowermanufacturing cost.
The American Motors’ penchant for designing products for manufacturabilitywas reflected in engine design as well. Larger engines differed from smallerengines only in terms of stroke. Bores, pistons, valves, and most other engineparts were the same except for occasional minor modifications. The companywas able to produce five separate engines (three V6s and two V8s) from nearlyidentical sets of pistons and valves.
The programs of constant improvement in design for manufacturabilitydeveloped a competitive edge for American Motors. By 1958, the firm’samortization of tooling was the lowest of any U.S. producer, an edge it was tohold for most of the next decade (Table 6-2).
The savings resulting from product manufacturability and manufacturingefficiency provided funding for further increases in product quality. Ramblerbodies were fully dipped in rustproofing, and extensive use of galvanized steelwas introduced on the 1963 model. Mufflers and tail pipes were ceramic-coated to reduce corrosion. The sturdy Rambler six-cylinder engine had seven
110

main bearings, a strong block, hydraulic lifters, and a heavy-duty timing chain.Competing engines in the same price class often had three or four mainbearings, rubber timing belts, and thinwall castings. The company pioneered inlow-cost sound insulation and individually adjustable reclining seats. In 1961,American Motors introduced separate independent front and rear brakingsystems and the collapsible steering column to promote safety. AMC was alsothe first U.S. firm to install seat belts (Table 6-3).
Table 6-2 Amortization of Tools, Dies, and Equipment Per Car
Year AMC Stud/Pack Ford GM Chrysler
1956 138 118 77 132 59
1957 112 82 111 152 104
1958 62 85 177 205 119
1959 32 35 108 166 110
1960 23 61 76 175 163
1961 47 72 109 171 139
1962 44 76 88 141 94
1963 40 96 148 90
Source: Charles E. Edwards, Dynamics of the United States Automobile Industry, University of South
Carolina Press, Columbia, SC, 1965, p.206.
By conserving resources and concentrating on a particular niche in theautomotive market and by emphasizing product quality and value, the companybegan to gain in sales. The year 1958 was a record one for the newcorporation. Shipments of American Motors automobiles increased to 217,332compared to 95,198 during 1954. Revenue rose to $470,349,000, and profitsrose to $26 million. In the following years, revenue and profits grew evenmore. The company remained a healthy supplier of 6 to 7 percent of thenation’s automobiles.
By 1960, the rapidly rising sales of the Rambler prompted responses from the“Big Three.” Ford, General Motors, and Chrysler all introduced new compactcars in 1960. Ford’s offering, the Falcon, was especially popular, selling over400,000 cars during its first year. Even Studebaker experienced a resurgencewith its 1959 Lark. Competition became very intense. Yet, American Motorsactually picked up market share in both 1959 (up 2.06 percent) and 1960 (up0.07 percent) and suffered only a very small decline (down 0.5 percent) in 1961.
What Romney did to keep American Motors competitive was to make sure that every part of the company ran smoothly and at low cost. The combination ofdesign of products for manufacturability, manufacturing efficiency, generalfrugality, and intense market focus allowed American Motors to emerge with aposition of low-cost leadership and reasonable product differentiation. Profits
The Turnaround Experience: Real World Lessons in Revitalizing Corporations and Organizations
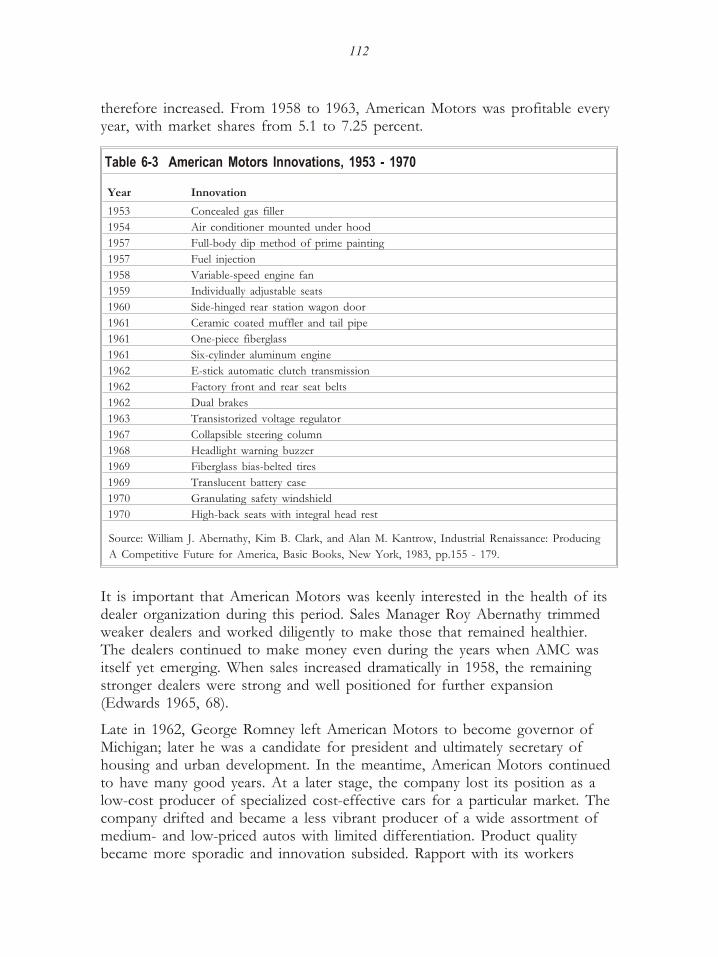
therefore increased. From 1958 to 1963, American Motors was profitable everyyear, with market shares from 5.1 to 7.25 percent.
Table 6-3 American Motors Innovations, 1953 - 1970
Year Innovation
1953 Concealed gas filler
1954 Air conditioner mounted under hood
1957 Full-body dip method of prime painting
1957 Fuel injection
1958 Variable-speed engine fan
1959 Individually adjustable seats
1960 Side-hinged rear station wagon door
1961 Ceramic coated muffler and tail pipe
1961 One-piece fiberglass
1961 Six-cylinder aluminum engine
1962 E-stick automatic clutch transmission
1962 Factory front and rear seat belts
1962 Dual brakes
1963 Transistorized voltage regulator
1967 Collapsible steering column
1968 Headlight warning buzzer
1969 Fiberglass bias-belted tires
1969 Translucent battery case
1970 Granulating safety windshield
1970 High-back seats with integral head rest
Source: William J. Abernathy, Kim B. Clark, and Alan M. Kantrow, Industrial Renaissance: Producing
A Competitive Future for America, Basic Books, New York, 1983, pp.155 - 179.
It is important that American Motors was keenly interested in the health of itsdealer organization during this period. Sales Manager Roy Abernathy trimmedweaker dealers and worked diligently to make those that remained healthier.The dealers continued to make money even during the years when AMC wasitself yet emerging. When sales increased dramatically in 1958, the remainingstronger dealers were strong and well positioned for further expansion(Edwards 1965, 68).
Late in 1962, George Romney left American Motors to become governor ofMichigan; later he was a candidate for president and ultimately secretary ofhousing and urban development. In the meantime, American Motors continuedto have many good years. At a later stage, the company lost its position as alow-cost producer of specialized cost-effective cars for a particular market. Thecompany drifted and became a less vibrant producer of a wide assortment ofmedium- and low-priced autos with limited differentiation. Product qualitybecame more sporadic and innovation subsided. Rapport with its workers
112

diminished. The company survived as a separate entity until 1987 but not as the effective competitor it had been from 1955 to 1963.
During the time of the company’s 1956 to 1963 recovery, however, AmericanMotors’ strategy focused on the efficient production of high-quality productsfor a particular market niche—an ambitious program that was made possible by a rigorous program of designing products for . Very few financial steps weretaken during the American Motors turnaround. During the recovery, thecompany issued only a minor amount of new common stock. The additions tonet worth were gained almost totally through profits (Table 6-4).
Table 6-4 American Motors, 1953 - 1963
Year Units Sales ($ 000) $ Profits/Unit Market share, %
1953 213,762 $478,697 $3,712 3.48
1954 113,571 400,344 (17,274) 2.06
1955 161,790 441,127 (6,956) 2.04
1956 104,190 408,404 (19,746) 1.80
1957 114,084 362,234 (11,833) 1.87
1958 217,332 470,349 26,085 5.12
1959 401,466 869,850 60,342 7.18
1960 485,785 1,057,716 48,234 7.25
1961 372,485 875,724 23,579 6.75
1962 454,664 1,056,395 34,241 6.56
1963 480,365 1,132,356 37,807 6.29
American Motors Survived Because.....
· Production was focused on fewer models.
· Lower costs were achieved through design.
· Top management understood how to break even in physical terms.
· Quality was maintained at high levels.
· Continuity was maintained with key historical markets.
· Ideals were present and were clearly articulated.
· Management played an exemplary role.
The Turnaround Experience: Real World Lessons in Revitalizing Corporations and Organizations

Author Fred Zimmerman and his wife Joanell with three of their grandchildren in the family 1966 Rambler Convertible
114
Part 3
The Value of Product
Differentiation
Successful companies offer differentiated products that customers perceive as having value and uniqueness. Product differentiation is not accomplishedmerely through clever promotion or adroit management of the sales effort,although these are indeed desirable attributes. The products really arebetter—they have more meaningful features and benefits, higher reliability,better performance, and higher overall quality. In some cases, differentiatedproducts are newly developed products with more modern features orsuperior performance. In other cases, they are enhanced older products,incrementally improved to add value while ensuring continuity with majorhistorical markets. In all cases, differentiated products arise from experiencein the industry, experience with customers, and experience in the proficientmanagement of the development function.
The Strategic Value of Differentiated Products
Companies successful in turnarounds recognize the direct connection between differentiated products and profitability, the strategic value of making a good product or providing a good service. Differentiated products reduce volatility in unit sales and lower marketing expense by nurturing repeat business.Perhaps most important, differentiated products nourish the feelings of prideand confidence which organizations in trouble so desperately need. Theeffect of differentiated products on a troubled firm is holistic, an atmospheric effect that makes people want to belong to a class act.
What is surprising is how much effort and energy go into the attemptedresurrection of companies in trouble without any serious investigation of theproducts being offered to the customer. Often, market strategies, productionfacilities, corporate officers, names, and financial arrangements change whenproducts do not change. The usual result is sadness and despair for the loyal people in the affected organization and continued slippage of the firm.
Successful firms display an overwhelming resolve to bring differentiatedproducts to market and then bracket this resolve with well-thought-outstrategies and tactics. Unsuccessful companies seem to perceive the productas inconsequential to success or failure, for their energies are diverted to matters unrelated to products such as reorganizations or frequent strategy
The Turnaround Experience: Real World Lessons in Revitalizing Corporations and Organizations
changes. Successful firms make incremental improvements to producedifferentiated products. Unsuccessful firms often fail to improve existingproducts even when product shortcomings are widely perceived. Successfulfirms put great emphasis on product quality, particularly in-process quality.Unsuccessful firms often neglect quality issues. Unsuccessful companiesconcentrate less on improving products, often making significant and abruptmarketing changes in search of new markets for marginal products, whilesuccessful firms avoid abrupt changes in market position but make moreimprovements in products being offered to familiar markets.
The continuous effort to improve products provides an ongoing strategicadvantage not always apparent to unsuccessful managers, who commonlyview their products as differentiated, most often incorrectly. Successful firms collect more data and talk to more people to ensure that their products aregood, and then continue to make improvements even when the products arehighly regarded. Unsuccessful companies fail to systematically appraise theirproduct offerings in comparison to the competition's and therefore take noparticular steps to improve them. Differentiated products provide a strategicadvantage that can vanquish high market-share positions of largercompetitors.
Efficiency and Effectiveness of Product-Differentiating Resources
The achievement of product differentiation depends upon the company'sinternal efficiencies and effectiveness in the management ofproduct-differentiating resources. Some managers perhaps have a broadconceptual understanding of what the market needs, but they do not knowabout product development or marketing. Though product changes tend to be incremental at successful companies, product planning is very technical andis often based on sound scientific research; major developments do notalways consume large amounts of time and money. Product-differentiationefforts are conducted efficiently, often with the full cooperation of majorsuppliers to augment and amplify the skills of the firm itself. This results inrapid improvement of product offerings—accomplished on time and ataffordable cost.
In contrast, unsuccessful firms often lack the skills to economically createproduct differentiation, an enormous practical liability for the firm in distress. Frequently, firms spend large sums of money to create unneeded products,develop features out of touch with the market, or else simply take too longto develop features and benefits fielded much earlier by the competition.Successful turnarounds do not depend so much on the allocation ofproduct-differentiating resources but instead upon the adroit management ofthose resources. Product differentiation is achieved because small numbers of competent managers and technical people get the right things done quickly.Unsuccessful firms often lack the ability to interject quality and productivityinto the product-differentiating process. Or, they are too slow.
116
Differences also exist in the planning for product differentiation. Successfulcompanies utilize longer-range, pro-active programs to incrementallydifferentiate their products by adding features in advance of or in sync withcustomers' expectations, by improving reliability, and by rigorously attending to product quality. In an interactive manner, product differentiationcomplements low-cost production, allowing a firm to insulate sales duringrecessions. In addition, successful companies reinforce product developmentactivities by retaining continuity with key markets. Unsuccessful firms arefar more likely to seek entry to some new market as a remedy to falteringsales and spend less time improving products.
The objective of Part 3 is to discuss the elements of product differentiationas they apply to the turnaround process. Chapter 7 examines the processesinvolved in developing distinguishing product features. Chapter 8 describesthe steps successful companies have taken to achieve lasting product quality. Chapter 9 reviews how firms sustain continuity with their major markets.
The Turnaround Experience: Real World Lessons in Revitalizing Corporations and Organizations

Chapter 7 — DevelopingDistinguishing Product Features
Distinguishing features enable firms to sell their products when times are bad and to sell them for more money when times are good. For a company introuble, these are pivotal advantages. However, achieving distinguishingfeatures is not easy. The process demands that managers have a thoroughunderstanding of the market and of the probable moves of both current andanticipated competitors. Product-differentiated features must be developedthoroughly, so that new features are reliable, and quickly, so that they hit the market in a timely manner.
Unsuccessful firms also attempt to develop distinguishing product featuresbut often fail because they develop the wrong thing and take too long to doit. Often, they spend too much money on the process and involve too manyof the wrong people. Yet, unsuccessful firms' difficulties with productdevelopment are not resource-based. Even the most technical companiesseldom spend over 5 percent of revenue on research and developmentcombined (Ford Motor Company, for instance, spends about 3.7 percent).Companies such as Hudson, Studebaker-Packard, Control Data,Computervision, and International Harvester had vast resources at theirdisposal. The development of products suitable for the firm's historicalmarketplace was clearly feasible, and indeed, product development did occur. Poor product development stems primarily from four strategic difficulties:
1. Development activities focused on the past rather than emerging trends.
2. Development activities focused on products for new unfamiliar markets ratherthan on familiar markets.
3. Development activities focused on gadgetry rather than on product featuresand benefits that more accurately reflect user requirements.
4. Development activities that are inefficiently executed and take too long tosatisfy the market being served, often resulting in products which areinsufficiently tested and refined.
118

Managing Development for Future Trends
Successful companies skillfully detect future market trends and then timeproduct enhancements that lead or at least equal the pace set by the marketbeing served. Unsuccessful companies lag behind in the market. The product development activities of the major independent auto firms following WorldWar II illustrate this point. The independent producers emerged from WorldWar II in excellent financial condition and with good position in theirmarkets. The war provided most of them with defense contracts substantialenough to reduce or eliminate many of their prewar liquidity problems. Both Packard and Studebaker, for instance, had about $32 million in cash at theend of 1945. In relative terms, their market position also improved. To some degree, 4 years without automobile production leveled the playing fieldregarding the public's perception of which companies were superior. Also,product differentiation achieved during the thirties worked in favor of theindependents after the war. Packard, a favorite staff car for generals, stillcarried some of its prewar prestige.~ Nash's innovative unibody construction, excellent heating system, and quiet economical operation appealed to manybuyers. Studebaker quickly adopted postwar styling, as did Kaiser-Frazer.Hudson got off to a fast start in production after the war and had an amplesupply of cars available at the right time. Indeed, many sophisticated buyersappreciated the quality and engineering features the independents had beenforced to develop during the 1930s in order to survive at all.
The anticipation of a strong market for cars also interested new candidatesfor dealerships. Kaiser-Frazer, with no prewar model at all, enlisted 4600dealers by 1948. These favorable conditions allowed the independents (Nash, Hudson, Studebaker, Packard, Willys, and Kaiser-Frazer) to prosper, and allthese firms operated profitably during the years immediately following World War II. In 1948, the independents produced 19.2 percent of the cars sold inthe United States. By 1949, however, several of the independents wereclearly failing to keep pace with key emerging trends in the marketplace,particularly in engine technology and car design.
The internal combustion engine underwent radical changes in the yearsfollowing World War II. Affluent Americans, with rapidly expandingfamilies, sought larger cars with more pep and more fuel efficiency inproportion to the power delivered. The L-head side-valve straight-cylinderconfiguration, which dominated the domestic auto industry during the 1930s,could accommodate neither need. However, only Chevrolet, Buick, and Nash offered overhead valves, and only Ford, Mercury, Lincoln, and Cadillacoffered . Most engines offered by the industry in 1946 had been designed atleast 15 years earlier.
During this era, General Motors research, under the direction of Charles F.Kettering, designed a lighter, more powerful, and more economical enginewhich became the standard design configuration of the industry during the1960s and early 1970s. Beginning with the 1949 Cadillac and Oldsmobilemodels, GM led the automobile market trend toward more powerful and
The Turnaround Experience: Real World Lessons in Revitalizing Corporations and Organizations

more fuel-efficient engines. Five emerging trends in engine design were ofparticular significance:
1. Overhead valves became the standard in the industry. After 1953, almost alldomestic car manufacturers offered overhead valve engines except Hudson,Willys, and Kaiser-Frazer. GM and Nash adopted this technology muchearlier.
2. The industry average bore-to-stroke ratio (the ratio of the diameter of thecylinder to distance traveled by the piston) changed from about 0.75 in thelate 1940s to about 1.1 in the 1950s (Figure 7-1). These higher revvingshort-stroke engines usually ran quieter, were more compatible with automatictransmissions, and indirectly increased horsepower by permitting the engine to operate smoothly at higher revolutions. Kaiser-Frazer, Hudson, and Studebaker all lagged behind this trend.
Figure 7-1. Bore to stroke ratios, 1946 to 1965. Engine geometrychanged markedly in the highly competitive years from 1949 to 1965as producers sought greater fuel efficiency and performance inengines compatible with automatic transmissions. The ratio of enginebore diameter to the length of the stroke increased by 50 percentduring this period. Some producers, led by GM and later others, werewell ahead of industry trends. Others, such as Kaiser, Studebaker, and
120

Hudson, followed far behind industry trends in spite of new enginedevelopment programs.
3. Compression ratios (with the piston at its low point, the ratio of the volumeof the cylinder to the volume of the combustion chamber) also increased from an average of about 6.5 in the 1940s to as high as 11.0 in the mid-1960s(Figure 7-2). Here again, General Motors led this trend which greatlyincreased engine efficiency. Kaiser-Frazer, Packard, Hudson, and Studebakerwere all slow followers.
Figure 7-2. Engine compression ratios, 1946 to 1965. Compressionratios also increased, from an average of 6.5 in the late 1940s to 9.5 in the mid-1960s. Some compression ratios were even higher, but Kaiser, Packard, Hudson, and Studebaker lagged GM, Chrysler, Ford, andAmerican Motors in this significant indicator of engine efficiency.
The Turnaround Experience: Real World Lessons in Revitalizing Corporations and Organizations

4. Cubic-inch displacement (a measure of engine size) increased modestly inproportion to the weight of the cars from an average of about 220 cubicinches in 1946 to about 300 in 1956. During this time, Kaiser-Frazer retainedonly a modest displacement of 226 cubic inches in its rather expensivelypriced car. Hudson and Studebaker also offered medium-priced cars with small antiquated engines, although they did offer a few models more consistent with market trends.
5. Horsepower per cubic inch rose substantially because of the modern designcharacteristics of the engines delivered by the more progressive companies. Inthe 1940s, U.S. manufacturers averaged about 0.45 hp/cubic inches. In 10years, several innovative manufacturers doubled the horsepower per cubicinch. Kaiser-Frazer, Hudson, and Studebaker still offered engines with under0.6 hp/cubic inches.
The companies that lagged behind in automobile market trends did, in fact,develop new engines during this period. Hudson developed not one but fournew engines, each with an L-head design, each with low bore-to-strokeratios, and each with relatively low compression ratios. Though Hudsonmanufactured one durable 308-cubic inches engine that established Hudson'sfame in racing, it was not modern in design, it was not fuel-efficient, and itcould not be used as a building block for more advanced products in thefuture. For its 1954 Jet, Hudson employed some of the same design featuresit used on engines built in the early 1930s. The company was the lastmanufacturer in the industry to offer a splash-oil system. During a timewhen Hudson showed good sales and profits and had the resources todevelop modern products, the company adhered rigidly to designphilosophies that lagged 20 and 30 years behind leading manufacturers.
Studebaker also developed an engine during the post-World War II period,but it was heavy, relatively small, and of relatively low compression. As late as 1963, it achieved horsepower per cubic inch of 0.69 as opposed to 0.9with several Chrysler and GM engines. Packard also developed anoverhead-valve V8 which hit the market a full 6 years after Cadillac.Packard unit sales were nearly 50 percent higher than Cadillac's before theGM overhead-valve V8 made its debut in 1949. Six years later, whenPackard finally offered an overhead-valve V8, Packard sales had fallen to 40 percent of those of Cadillac.
Kaiser did not develop a modern engine, which it desperately needed, butspent vast sums to develop other products for unfamiliar markets. Thedevelopment of the Henry J compact car, an unusual move for a high-costproducer, siphoned resources from products for Kaiser-Frazer's traditionalmarketplace, and as a result, the producer that led all independents in 1948and individually held an 8 percent market share went out of business 8 years later. As with Packard, Hudson, Studebaker, and to some extent ChryslerCorporation of that era, Kaiser-Frazer dissipated its resources on projectswhich were strategically out of sync with changes in the market.
122
Nash (later AMC) was an exception to the above pattern. Nash enginesfeatured overhead valves as early as 1918, and in 1946, some Nash engineshad a bore-to-stroke ratio of 0.83 and a compression ratio of 7.3 — bothrelatively high for the industry at that time. Thus Nash entered thecompetitive period of the 1950s with engine characteristics more compatiblewith emerging trends than those of the other independents. More important,however, the firm did not stop there. In 1955, the firm offered ahigh-compression, overhead-valve V8 engine designed by Packard, followedby a V8 of their own design in 1956. In 1962, the firm announced two newsix-cylinder engines, each with high bore-to-stroke ratios, higher compression ratios, and overhead valves. Since Nash (AMC) offered products to theeconomy-minded consumer, the need for powerful V8 engines was lesscritical than for the much higher-priced Kaiser-Frazer, Hudson, and Packardmodels. But Nash still designed V8s along with some of the most modernand best-developed V6s in the industry. Nash clearly led the rest of theindependents in engine technology in the years following World War II.Whether this fact explains Nash's survival (as American Motors) is unclear,but the timely development of market-appropriate features and benefitscertainly worked to the firm's advantage.
In addition to the trends specific to engine technology, drive train andstyling trends also emerged during the postwar period:
1. Automatic transmissions became more common. In 1946, only Oldsmobile and Cadillac offered fully automatic transmissions. Buick and Pontiac followed in1948, Chevrolet in 1950. Ford, Chrysler, and most of the independents offered automatics in 1951, but General Motors had exploited this developmentseveral years earlier.
2. Pounds per horsepower (a measure of total car weight to power available)declined from an average of about 33 in 1946 to 23 in 1954 and to 15 by1962 . As with engine technology, the independents lagged behind trends inthe marketplace. In pounds per horsepower, the 1954 Kaiser, 1954 Hudson Jet, and the 1957 Studebaker Scotsman remained high, at 27. More powerfulHudson models had higher power-to-weight ratios but, by the mid-1950s,Hudson was severely out of step with industry trends.
3. The width-to-height ratio increased from 1.1 in 1946 to 1.4 in 1964 (Figure7-3).Unsuccessful companies also lagged behind industry trends with respectto the external dimensions of the car they produced. At 1.28, thewidth-to-height ratio of Hudson automobiles was the industry's most advancedwhen “step-down” styling was announced in 1948. However, for reasons thatare quite unclear, when the new Hudson Jet arrived in 1954, thewidth-to-height ratio was reduced to 1.08, thus producing a malproportionedcar for the period.
The Turnaround Experience 123
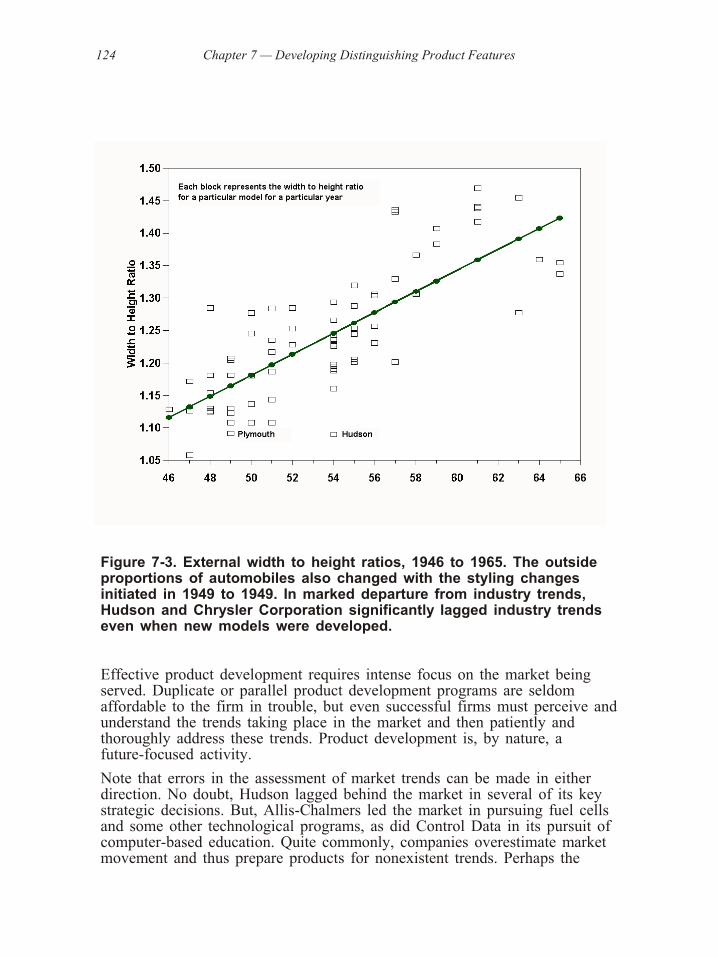
Figure 7-3. External width to height ratios, 1946 to 1965. The outsideproportions of automobiles also changed with the styling changesinitiated in 1949 to 1949. In marked departure from industry trends,Hudson and Chrysler Corporation significantly lagged industry trendseven when new models were developed.
Effective product development requires intense focus on the market beingserved. Duplicate or parallel product development programs are seldomaffordable to the firm in trouble, but even successful firms must perceive and understand the trends taking place in the market and then patiently andthoroughly address these trends. Product development is, by nature, afuture-focused activity.
Note that errors in the assessment of market trends can be made in eitherdirection. No doubt, Hudson lagged behind the market in several of its keystrategic decisions. But, Allis-Chalmers led the market in pursuing fuel cellsand some other technological programs, as did Control Data in its pursuit ofcomputer-based education. Quite commonly, companies overestimate marketmovement and thus prepare products for nonexistent trends. Perhaps the
124 Chapter 7 — Developing Distinguishing Product Features

importance of comprehending market trends is one reason why people withexperience in the industry being served do better as turnaround agents. Theyhave more information. They have both formal and informal sources ofinformation, and it is easier for them to cross-check that information. Anexperienced CEO remarked that he estimated only 60 percent of theinformation he received was accurate. With respect to the future, it isprobably closer to 15 percent. If this level of accuracy is prevalent, theindividual charting the course of product development will need to collectinformation from several sources in order to be reasonably certain of making correct decisions regarding future product offerings.
Distinguishing Features and Turnaround Success
Distinguishing features influenced the turnarounds of all the successfulcompanies. Cadillac employed the first self-starter, the firstproduction-volume V8 engine, and the first breaker-point ignition. Nashemployed dual-ignition systems, more main bearings, and four-wheel brakesas standard equipment. During the 1957 to 1963 turnaround, AmericanMotors used dual brakes, full-body rustproofing, and ceramic mufflers. Deeretractors were highly reliable, maneuverable, and could run on cheap fuel.Packard products of the 1930s were quiet and had excellent styling.Chrysler's turnaround of the 1980s was in part due to arrival of itsinnovative “minivan.”
In contrast, the unsuccessful companies offered “me-too” products as latearrivals in the market and sometimes failed to detect important trends in themarketplace. Hudson modeled key elements of its 1948 styling after the 1942 Buick. Kaiser offered innovative styling, but its drive train components wereobsolete. Studebaker-Packard produced the last versions of theonce-prestigious Packard by using the chassis of one of the least expensivecars in America. On one occasion after another, unsuccessful firms failed todeliver products that were perceived by customers as being special. In somecases, as with IHC's crawler tractors, Kaiser's engines, Hudson's antiquatedsplash-oil system, or Studebaker's anti-slip differential, substantial negativefeatures were present in the products of the unsuccessful firms.
In their excellent book Industrial Renaissance: Producing a CompetitiveFuture for America, Abernathy, Clark, and Kantrow (1983) tabulate some ofthe important innovations in the history of the U.S. automobile industry. The authors also weigh each innovation for its impact on production and thencategorize it in accordance with the type of innovation (process, drive-train,body/chassis, or other). From this listing, the innovations that occurredduring the recovery periods of both the successful and the unsuccessful firms were derived (Tables 7-1 and 7-2).
The Turnaround Experience 125
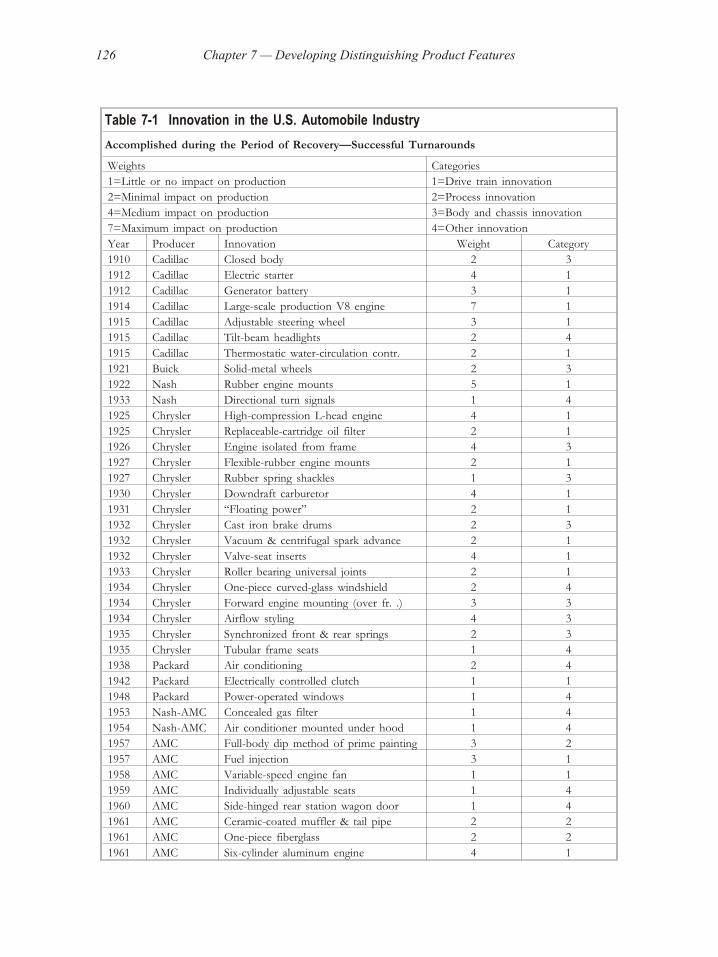
Table 7-1 Innovation in the U.S. Automobile Industry
Accomplished during the Period of Recovery—Successful Turnarounds
Weights Categories
1=Little or no impact on production 1=Drive train innovation
2=Minimal impact on production 2=Process innovation
4=Medium impact on production 3=Body and chassis innovation
7=Maximum impact on production 4=Other innovation
Year Producer Innovation Weight Category
1910 Cadillac Closed body 2 3
1912 Cadillac Electric starter 4 1
1912 Cadillac Generator battery 3 1
1914 Cadillac Large-scale production V8 engine 7 1
1915 Cadillac Adjustable steering wheel 3 1
1915 Cadillac Tilt-beam headlights 2 4
1915 Cadillac Thermostatic water-circulation contr. 2 1
1921 Buick Solid-metal wheels 2 3
1922 Nash Rubber engine mounts 5 1
1933 Nash Directional turn signals 1 4
1925 Chrysler High-compression L-head engine 4 1
1925 Chrysler Replaceable-cartridge oil filter 2 1
1926 Chrysler Engine isolated from frame 4 3
1927 Chrysler Flexible-rubber engine mounts 2 1
1927 Chrysler Rubber spring shackles 1 3
1930 Chrysler Downdraft carburetor 4 1
1931 Chrysler “Floating power” 2 1
1932 Chrysler Cast iron brake drums 2 3
1932 Chrysler Vacuum & centrifugal spark advance 2 1
1932 Chrysler Valve-seat inserts 4 1
1933 Chrysler Roller bearing universal joints 2 1
1934 Chrysler One-piece curved-glass windshield 2 4
1934 Chrysler Forward engine mounting (over fr. .) 3 3
1934 Chrysler Airflow styling 4 3
1935 Chrysler Synchronized front & rear springs 2 3
1935 Chrysler Tubular frame seats 1 4
1938 Packard Air conditioning 2 4
1942 Packard Electrically controlled clutch 1 1
1948 Packard Power-operated windows 1 4
1953 Nash-AMC Concealed gas filter 1 4
1954 Nash-AMC Air conditioner mounted under hood 1 4
1957 AMC Full-body dip method of prime painting 3 2
1957 AMC Fuel injection 3 1
1958 AMC Variable-speed engine fan 1 1
1959 AMC Individually adjustable seats 1 4
1960 AMC Side-hinged rear station wagon door 1 4
1961 AMC Ceramic-coated muffler & tail pipe 2 2
1961 AMC One-piece fiberglass 2 2
1961 AMC Six-cylinder aluminum engine 4 1
126 Chapter 7 — Developing Distinguishing Product Features
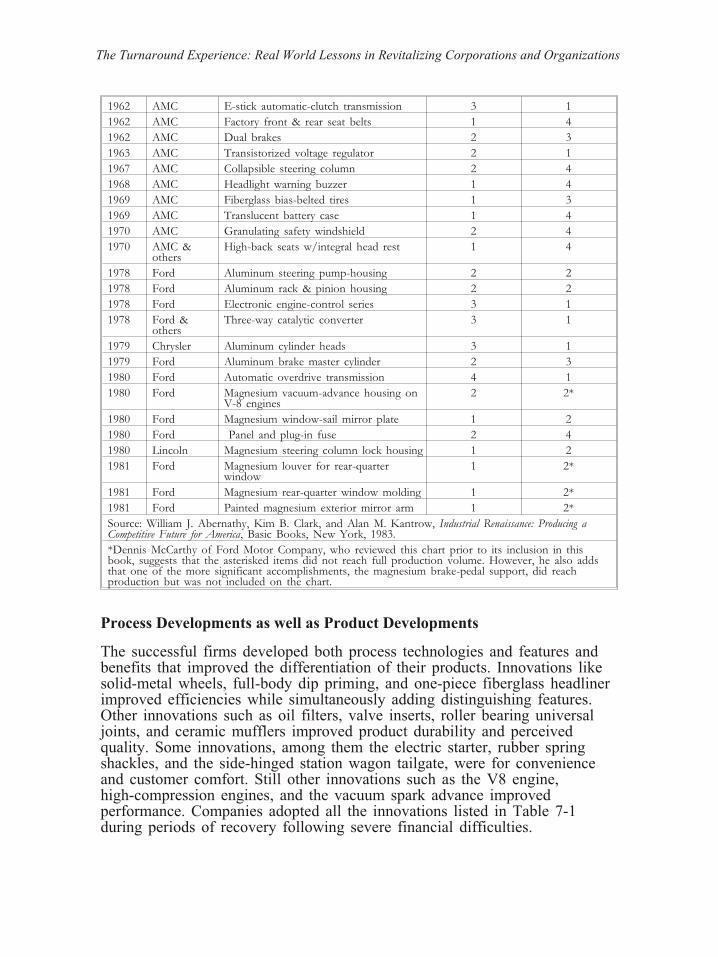
1962 AMC E-stick automatic-clutch transmission 3 1
1962 AMC Factory front & rear seat belts 1 4
1962 AMC Dual brakes 2 3
1963 AMC Transistorized voltage regulator 2 1
1967 AMC Collapsible steering column 2 4
1968 AMC Headlight warning buzzer 1 4
1969 AMC Fiberglass bias-belted tires 1 3
1969 AMC Translucent battery case 1 4
1970 AMC Granulating safety windshield 2 4
1970 AMC &others
High-back seats w/integral head rest 1 4
1978 Ford Aluminum steering pump-housing 2 2
1978 Ford Aluminum rack & pinion housing 2 2
1978 Ford Electronic engine-control series 3 1
1978 Ford &others
Three-way catalytic converter 3 1
1979 Chrysler Aluminum cylinder heads 3 1
1979 Ford Aluminum brake master cylinder 2 3
1980 Ford Automatic overdrive transmission 4 1
1980 Ford Magnesium vacuum-advance housing onV-8 engines
2 2*
1980 Ford Magnesium window-sail mirror plate 1 2
1980 Ford Panel and plug-in fuse 2 4
1980 Lincoln Magnesium steering column lock housing 1 2
1981 Ford Magnesium louver for rear-quarterwindow
1 2*
1981 Ford Magnesium rear-quarter window molding 1 2*
1981 Ford Painted magnesium exterior mirror arm 1 2*
Source: William J. Abernathy, Kim B. Clark, and Alan M. Kantrow, Industrial Renaissance: Producing aCompetitive Future for America, Basic Books, New York, 1983.
*Dennis McCarthy of Ford Motor Company, who reviewed this chart prior to its inclusion in thisbook, suggests that the asterisked items did not reach full production volume. However, he also addsthat one of the more significant accomplishments, the magnesium brake-pedal support, did reachproduction but was not included on the chart.
Process Developments as well as Product Developments
The successful firms developed both process technologies and features andbenefits that improved the differentiation of their products. Innovations likesolid-metal wheels, full-body dip priming, and one-piece fiberglass headlinerimproved efficiencies while simultaneously adding distinguishing features.Other innovations such as oil filters, valve inserts, roller bearing universaljoints, and ceramic mufflers improved product durability and perceivedquality. Some innovations, among them the electric starter, rubber springshackles, and the side-hinged station wagon tailgate, were for convenienceand customer comfort. Still other innovations such as the V8 engine,high-compression engines, and the vacuum spark advance improvedperformance. Companies adopted all the innovations listed in Table 7-1during periods of recovery following severe financial difficulties.
The Turnaround Experience: Real World Lessons in Revitalizing Corporations and Organizations

7-2 Innovation in the U.S. Automobile Industry 1932-1981
Accomplished during the Period of Recovery Unsuccessful Turnarounds
Weights Categories
1=Little or no impact on production 1=Drive train innovation
2=Minimal impact on production 2=Process innovation
4=Medium impact on production 3=Body and chassis innovation
7=Maximum impact on production 4=Other Innovation
Year Producer Innovation Weight Category
Willys-Overland None listed
1932 Hudson Proferall camshaft 3 1
1933 Hudson Vacuum-operated clutch 2 1
1935 Hudson Rear trunk integral with body 1 3
1936 Hudson “Electric hand” transmission select 2 1
1937 Hudson Double automatic emergency brakes 1 3
1937 Hudson Steel-torque steering arm 2 3
1939 Hudson Safety hood latch 1 3
1940 Hudson “Airfoam” seat cushion 1 4
1953 Packard Four-way power seat 1 4
1955 Packard Tubeless tires 1 3
1956 Packard&Others Push-button transmission selector 1 1
1956 Packard Electric door latches 1 4
1956 Packard Nonslip differential 3 1
1956 Packard Torsion-bar suspension 4 3
1956 Studebaker Ribbed brake drum 1 3
1957 Studebaker Limited Slip differential 3 1
1958 Stud-Pack Off-center rear spring mounting 1 3
1963 Studebaker Front-wheel disc brakes 2 3
1947 Kaiser-Frazer Gas tank beneath license 1 4
1950 Kaiser Fold away rear-seat cargo area 1 4
1951 Kaiser Narrow corner post & windshld 1 4
1951 Kaiser Padded dash 1 4
1951 Kaiser Molded plastic body 4 2
1974 AMC/Renault Freestanding front & rear bumpers 1 3
1981 AMC/Renault “Select drive” 2 1
Source: William J. Abernathy, Kim B. Clark, and Alan M. Kantrow, Industrial Renaissance: Producing a
Competitive Future for America, Basic Books, New York, 1983.
In addition to the specific innovations listed in Table 7-1, the successfulfirms were also prompt in adopting innovations developed by others. Nashquickly adopted four-wheel brakes and overhead valves. Deere ceasedproduction of its unsuccessful three-row tractor in favor of the more practical four-row configuration pioneered by International Harvester. AmericanMotors became an early adopter of curved glass to improve internalspaciousness and styling. Overall, the successful companies were much more on the leading edge of both process and product innovations during theirturnaround periods than were the unsuccessful firms. Further, many of theseinnovations had substantial impacts on the production process and were more
128
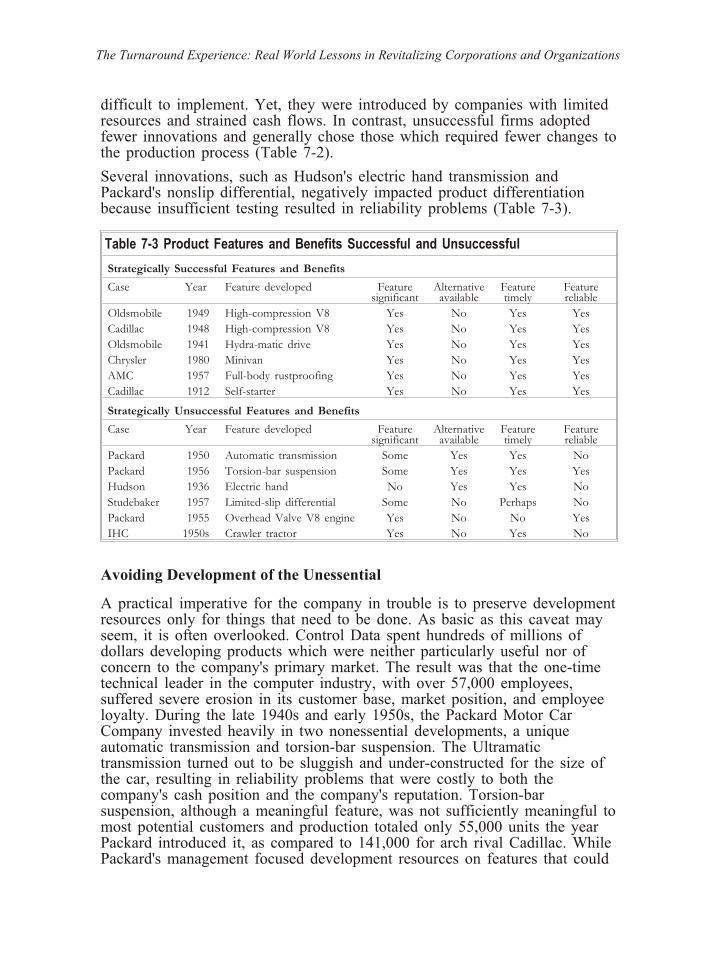
difficult to implement. Yet, they were introduced by companies with limitedresources and strained cash flows. In contrast, unsuccessful firms adoptedfewer innovations and generally chose those which required fewer changes to the production process (Table 7-2).
Several innovations, such as Hudson's electric hand transmission andPackard's nonslip differential, negatively impacted product differentiationbecause insufficient testing resulted in reliability problems (Table 7-3).
Table 7-3 Product Features and Benefits Successful and Unsuccessful
Strategically Successful Features and Benefits
Case Year Feature developed Featuresignificant
Alternativeavailable
Featuretimely
Featurereliable
Oldsmobile 1949 High-compression V8 Yes No Yes Yes
Cadillac 1948 High-compression V8 Yes No Yes Yes
Oldsmobile 1941 Hydra-matic drive Yes No Yes Yes
Chrysler 1980 Minivan Yes No Yes Yes
AMC 1957 Full-body rustproofing Yes No Yes Yes
Cadillac 1912 Self-starter Yes No Yes Yes
Strategically Unsuccessful Features and Benefits
Case Year Feature developed Featuresignificant
Alternativeavailable
Featuretimely
Featurereliable
Packard 1950 Automatic transmission Some Yes Yes No
Packard 1956 Torsion-bar suspension Some Yes Yes Yes
Hudson 1936 Electric hand No Yes Yes No
Studebaker 1957 Limited-slip differential Some No Perhaps No
Packard 1955 Overhead Valve V8 engine Yes No No Yes
IHC 1950s Crawler tractor Yes No Yes No
Avoiding Development of the Unessential
A practical imperative for the company in trouble is to preserve development resources only for things that need to be done. As basic as this caveat mayseem, it is often overlooked. Control Data spent hundreds of millions ofdollars developing products which were neither particularly useful nor ofconcern to the company's primary market. The result was that the one-timetechnical leader in the computer industry, with over 57,000 employees,suffered severe erosion in its customer base, market position, and employeeloyalty. During the late 1940s and early 1950s, the Packard Motor CarCompany invested heavily in two nonessential developments, a uniqueautomatic transmission and torsion-bar suspension. The Ultramatictransmission turned out to be sluggish and under-constructed for the size ofthe car, resulting in reliability problems that were costly to both thecompany's cash position and the company's reputation. Torsion-barsuspension, although a meaningful feature, was not sufficiently meaningful to most potential customers and production totaled only 55,000 units the yearPackard introduced it, as compared to 141,000 for arch rival Cadillac. WhilePackard's management focused development resources on features that could
The Turnaround Experience: Real World Lessons in Revitalizing Corporations and Organizations

have been procured, or were not essential, it surrendered Packard's positionin prestige automobiles to the more innovative Cadillac Division of GM.
Strategically successful features have four common attributes:
1. The feature is significant. People perceive it as something that needs to bedone.
2. Low-cost, suitable alternatives are not readily available. The decision to forgodevelopment means not having the feature.
3. The feature is developed in a timely manner. The window of opportunity isnot missed because decision or development times took too long.
4. The feature is reliable and well-tested. The feature generates goodwill and not ill will.
Involving Top Management
Not only does it matter if the company has the resolve to innovate, it alsomatters whether competent technical people are left to do their job. Productdifferentiation is an essential survival attribute well deserving of the attention of top management. But often, ill-prepared members of top managementbecome too involved in product differentiation to the exclusion of competent members of product development teams, as was the case with Hudson in itsfinal years. A. E. Barit, the former stenographer who became president of the company when Roy Chapin died, had no flare for market analysis, productdevelopment, or design. Yet, he meddled in all three and failed to allowsome of Hudson's competent product people to take the lead in theirspecialties. This resulted in missed opportunities, and resources weresquandered on products aimed at markets the company had not served formany years.
Both Kaiser and Studebaker-Packard had similar experiences. DuringStudebaker-Packard's later years, its management showed little interest ingenuine innovation but was fascinated with new gadgets — gadgets thatcustomers did not always perceive as meaningful. Kaiser-Frazer's topmanagement, although not experienced in the automobile industry, washeavily involved in the development of new products for new markets —unnecessary products for nonexistent markets. In successful cases, CEOsknew products but seldom meddled. Walter Chrysler, for instance, was quitetechnically knowledgeable, yet he allowed the chief members of his technicalteams to chart the company's engineering direction. He was still involved but in a supportive way. Barit of Hudson, Nance of Studebaker-Packard, Scott of Allis-Chalmers, and some of the other unsuccessful CEO; role in productdevelopments wanted not only involvement but authorship of productfeatures and benefits. Unfortunately, they were often wrong.
130

Practical Lesson in Distinguishing Product Features
· Successful firms focus on emerging trends in the marketplace. Theyprovide features and benefits ahead of or in sync with major markettrends.
· Unsuccessful firms lag behind market trends or over-anticipate markettrends.
· Successful firms provide meaningful features and benefits, not gadgets.
· Successful firms avoid development of the unessential.
· Successful firms manage development tasks very well. Unsuccessful firms often take too long.
· Successful firms produce reliable new products. New products fromunsuccessful firms are often poorly tested and unreliable.
· Successful chief executive; role in product developments are supportive of development staffs. Unsuccessful CEOs interfere with limited information and too much pride.
· Both successful and unsuccessful companies spend ample money onproduct development, but successful companies accomplish much morefor the money.
Case Histories
From 1980 to 1982, the Ford Motor Company lost $3.3 billion as yearly carshipments dropped to less than half the levels of the late 1970s. Physicalunit market share dropped during a time when the market itself becamesmaller. Five years later, Ford surpassed mighty GM in total dollar profits.Much of this turnaround was due to Ford's attention to distinguishing product features by virtue of its relentless goal to be “best in class.” Kaiser-Frazerhad the highest sales of any independent automobile producer in 1948, but 7 years later the firm had stopped domestic production. While Fordconcentrated on meaningful features, Kaiser-Frazer concentrated on style and curiosities, which provided only short-term differentiation. The result wasmissed opportunities in historical markets and ultimate withdrawal from thebusiness.
The Turnaround Experience: Real World Lessons in Revitalizing Corporations and Organizations
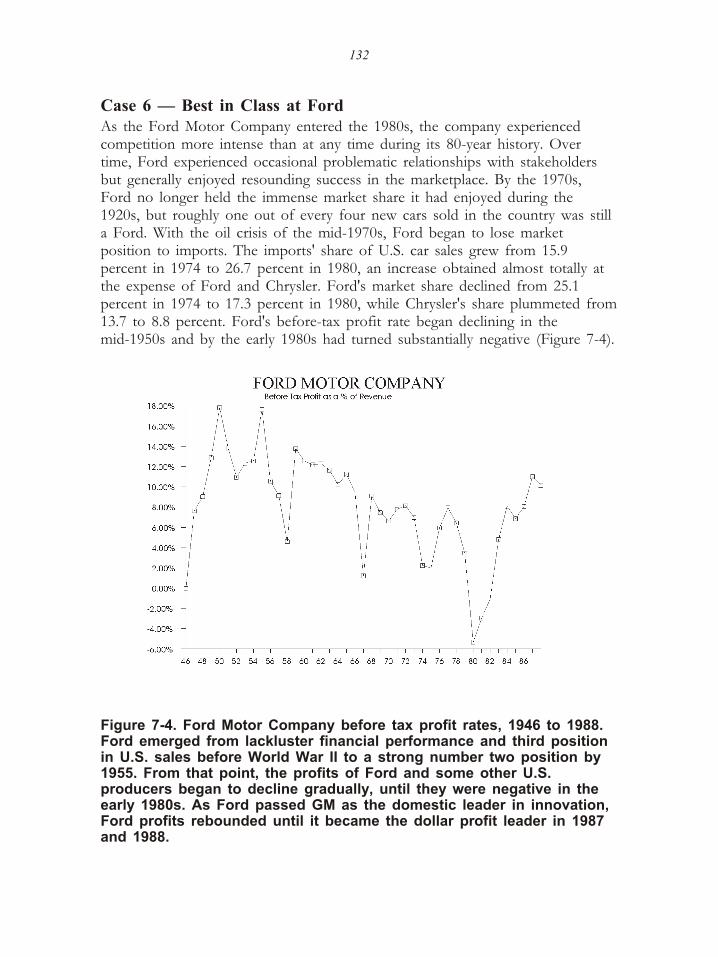
Case 6 — Best in Class at FordAs the Ford Motor Company entered the 1980s, the company experiencedcompetition more intense than at any time during its 80-year history. Overtime, Ford experienced occasional problematic relationships with stakeholdersbut generally enjoyed resounding success in the marketplace. By the 1970s,Ford no longer held the immense market share it had enjoyed during the1920s, but roughly one out of every four new cars sold in the country was stilla Ford. With the oil crisis of the mid-1970s, Ford began to lose marketposition to imports. The imports' share of U.S. car sales grew from 15.9percent in 1974 to 26.7 percent in 1980, an increase obtained almost totally atthe expense of Ford and Chrysler. Ford's market share declined from 25.1percent in 1974 to 17.3 percent in 1980, while Chrysler's share plummeted from 13.7 to 8.8 percent. Ford's before-tax profit rate began declining in themid-1950s and by the early 1980s had turned substantially negative (Figure 7-4).
Figure 7-4. Ford Motor Company before tax profit rates, 1946 to 1988.Ford emerged from lackluster financial performance and third positionin U.S. sales before World War II to a strong number two position by1955. From that point, the profits of Ford and some other U.S.producers began to decline gradually, until they were negative in theearly 1980s. As Ford passed GM as the domestic leader in innovation,Ford profits rebounded until it became the dollar profit leader in 1987and 1988.
132

Ford lost nearly $2 billion in 1980, over $1 billion in 1981, and nearly $500million in 1982. Car sales plummeted. In March 1980, Henry Ford II retired asFord's chief executive, and Philip Caldwell was named as his successor.Caldwell exercised courage in marshaling support for product developmentfrom Ford's board of directors during a period when the firm was losingbillions of dollars per year. Five years later, a product-development executive,Donald Petersen, was named president and later succeeded Caldwell aschairman.
Ford and Chrysler were both caught in a squeeze between fierce foreigncompetition and General Motors, whose earlier attention to downsizing gainedit a temporary edge in strategic position. To meet the severe competitivedemands confronting Ford, GM's management put in place strategicallyimportant pro-active action plans. Ford actively sought, with both Chrysler andthe United Auto Workers, a moratorium on imports. It established newproduct-development programs and initiated cost-reduction and productivityprograms, often in cooperation with organized labor.
In March 1982, Ford reached a milestone agreement with the United AutoWorkers wherein the workers agreed to a series of wage concessions savingFord more than $300 million per year. The UAW conceded to the following(Harvard Business School 1982):
1. Gave up an annual 3 percent “improvement factor” in wages.
2. Gave up the equivalent of two weeks of paid time off per year.
3. Deferred cost-of-living adjustments for 18 months.
4. Allowed that newly hired and certain rehired employees would initially bepaid 85 percent of the negotiated rate for the job classification.
In turn, Ford agreed to the following concessions (Harvard Business School1982):
1. Give 6 months' notice of any plant closing.
2. Avoid closing any plant due to outsourcing for 2 years.
3. Review certain recently announced plant closings.
4. Guarantee workers with 15 years of service, 75 percent of their earnings andinsurance benefits if they were laid off and remained unemployed.
5. Provide some senior employees with preferential placement.
6. Increase the company contribution to the laid-off workers' supplementalbenefit fund.
7. Provide a share of North American before-tax profits exceeding 2.3 percent of sales to employees.
8. Experiment with “lifetime job security concepts” at two facilities.
The Turnaround Experience: Real World Lessons in Revitalizing Corporations and Organizations

However, during the early 1980s, Ford needed more than lower costs, it alsoneeded cars that would sell. Several new-product programs were initiated butchief among them was the Taurus/Sable program which brought dramaticchanges to car program management. Lewis C. Veraldi served as Ford's vicepresident of car program management during the development of the highlysuccessful Taurus/Sable project, which became the model program-management system for the Lincoln, Thunderbird, and other Ford products at later times.Veraldi started with Ford as an apprentice tool and die maker in 1944 and then progressed through a variety of engineering and management positions whilecompleting his engineering degree at night. Veraldi was well-equipped to handle the Taurus project because of his executive experiences in both manufacturingand engineering. The 7 years he spent in Europe heading the successful Fiestaproject provided him with insights into foreign as well as U.S.product-development methods. A former tool-and-die maker himself, he wascomfortable working with production people and other members of the Fordorganization.
Ford's situation was extremely serious between 1980 and 1982, when thecompany lost $3.26 billion and witnessed a 50 percent decline in unit salesfrom 1978 levels. Yet the $3.3 billion project was approved, and much of thedevelopment effort took place when the company was experiencing its deepestlosses. Veraldi remarked, “Ford had always followed General Motors' designs.We were never the pacesetter, but being in a loss position allowed us to dosomething innovative. It was almost a blessing. Being in the trenches helpedus” (Mishne 1988).
Ford's Taurus team consisted of people throughout the Ford organization, andvendors and other stakeholders as well. Veraldi imported Jack Telnack fromFord of Europe to serve as the design executive. John Risk handled planning,and Al Gutherie served as chief engineer. It was an experienced crew,experienced not only in the engineering aspects of product development butalso in dealing with the inner complexities of the Ford Motor Company. Asexperienced practitioners who had earned their spurs, they were trusted andtherefore able to get things accomplished with a minimum of formality.Representatives from manufacturing engineering, product engineering, safety,production, legal, public relations, dealer relations, and many otherconstituencies combined efforts to design and produce a new car which wouldbe simultaneously engineered — a car that would have lasting value to thecustomer, have superb features and benefits, be safe to drive, and inexpensiveto produce.
As his first step in managing the Taurus project, Veraldi requested his staff toidentify and document why various cars were perceived as good. The best
134

automobiles in the world were identified and measured in each of 400 separateautomotive features. The Taurus team examined each feature in detail andestablished a design objective to meet or exceed all competitors on each ofthese 400 attributes (a sample is displayed in Table 7-4). They tracked suchfactors as heater-switch feel, noise, foot comfort, glove compartmentaccessibility, handling characteristics, and hundreds of other design attributes toensure that the Taurus would be the “best in class” in each of thesecharacteristics.
The rigorous demands of the Taurus project required both the people skills and the managerial skills of Veraldi and others in the Ford organization. With 4000new components and targeted quality levels substantially above what wascustomary for U.S. manufacturers, top performance was required of all teammembers. Veraldi remarked,
The auto industry is constructed with “chimneys” — engineering,marketing, suppliers. The prevailing attitude has been, “Don't touch myfield.” Design would pass its ideas to manufacturing, then manufacturingwould claim that the design didn't work. You have to get everythingtogether working toward a common objective. If you don't have teamwork,then the work isn't devoted to the good of the product." ( 1988)
By involving the production people in the design process, by clearlyunderstanding the legal, marketing, and financial requirements of the project upfront, and by focusing on feature-by-feature superiority over competition, prideand confidence began to emerge within the ranks of the Taurus team. Theteam's slogan, “Do common things uncommonly well,” reflected thethoroughness that began to typify the entire Ford organization.Veraldiexplained, “Taurus is a vehicle used to show how people working together canaccomplish more than people working apart. It's the obvious concepts that arealways ignored.” (Mishne 1988)
Ford's sales profitability and productivity improved with the Taurus and withthe Continental, Thunderbird, and Lincoln TownCars, which also employed theTaurus team approach. By 1987, Ford's market share had risen substantiallyfrom its low in 1980. During the first year of production for the Taurus/Sable, production lines were producing 63 cars per hour versus 50 cars per hour withthe same number of people on previous models (Mishne 1988).
The Turnaround Experience: Real World Lessons in Revitalizing Corporations and Organizations

Table 7-4 Ford Taurus/Sable Best-in-Class Expanded Images
Sample Assessment of 400 Design Elements
Feature Car line Effort DN05
objective
DN05
status
Remarks
Rear-seat comfort Opel Senator B-I-C B-I-C DN05 is equal to Opel Senatorfor rear-seat comfort.
Wind noise Audi 100 B-I-C LessthanB-I-C
Wind-noise improvement planaimed at achieving B-I-C status to be in place by 8-87.
Perceived kneeroom
BMW B-I-C B-I-C DN05 equivalent to BMW.
W/S wiper-system noise
Mazda 626 &Honda Accord
B-I-C B-I-C DN05 is B-I-C.
Seat-belt bucklingease—front
Toyota Cressida B-I-C B-I-C Toyota Cressida rated best due topassive system. BMW528E ratedbest among conventionalcontinuous loop systems. DN05’sadjust tongue-buckle assemblyantiroping D-ring and retractordesign objectives will ensureexcellent component accessibilityand will allow single-handedlatching of restraint system. Thiswill make system equivalent toB-I-C competition.
Hood raising from pop-open
Toyota Cressida 9# 8# 7# DN05 objective is 8# using dualgas cylinders. Effort may vary onambient temperature (as doesCressida). DN05 to be B-I-Coverall.
Climate controloperatingefforts—rotary
Saab 900 B-I-C B-I-C DN05 efforts will be comparableto Saab.
Brakepedal—effor2from 60 mi/ht (at15 ft/s
Toyota 23 lb B-I-C B-I-C At the request of chassisengineering, a consumer surveywas conducted at Dearborn testtrack by NAAO MarketingResearch. The results indicateDN05 considered B-I-C.
Fuel-tank fillingease (spitback)
BMW/Mazda B-I-C B-I-C Angle of fuel-filler pipe has beenrevised to make DN05 B-I-C. Nospitback with ball check in fillpipe.
Clutch-pedal effort @ idle
Accord 9#(rating)
B-I-C B-I-C Latest released level clutch showspedal effort to be B-I-C.
B-I-C = Best in class, DN05 = Ford Taurus/Mercury SableSource: Ford Motor Company.
Table 7-4 During its turnaround of the 1980s, the Ford Motor Company compared the features and benefits of its proposed Taurus/Sable(Code name DN05) to the best ten cars in the world on 400 attributes.The program objective of this $3.4 billion product developmentprogram for this medium priced car was to meet of exceed the bestcar in the world (regardless of price) on 80 percent of these 400attributes. The program was successful and for several years, the Ford Taurus became the best selling car in the world.
136

Ford's reduction in incremental cost was substantial during the years of itsrecovery. Following reductions of $19 billion (1988 dollars) in annual expensesfrom 1979 to 1982, Ford was then postured to bring in additional revenuefrom a lower expense base. The efficiency and manufacturability resulting fromthe well-planned development activities of Ford, coupled with cooperativeprograms with organized labor, enabled the company to add incrementalrevenue at little additional cost. From 1982 to 1987, Ford added only $0.76 ofincremental before-tax cost per dollar of incremental revenue — a veryrespectable rate of upside efficiency. Ford returned to profitability in 1983 withearnings of $1.9 billion. Profitability increased every year for the next 5 yearsuntil the $5.3 billion of 1988 exceeded that of much larger GM (see Figure7-5).
Figure 7-5. Ford and GM net profit rates. Ford's after-tax profit ratewas approximately two-thirds that of GM from 1975 to 1978, and Fordoperated unprofitably during the recession of the early 1980s. As bothGM and Ford emerged from this very deep recession, Ford became the profit rate leader among U.S. producers.
The Ford turnaround resulted from much more than adroit management ofnew projects. Virtually all elements of the company improved within anatmosphere of labor and management cooperation. Relations greatly improvedthrough a program of employee involvement launched jointly by Ford and theUnited Auto Workers, and by the late 1980s, Ford management and UAWrepresentatives were sharing offices at some plants. One middle-ranking Fordmanager summed up the atmosphere at the Ford Motor Company in thefollowing way, “When I talk to Donald Peterson, I have the feeling he likesme.”
The Turnaround Experience: Real World Lessons in Revitalizing Corporations and Organizations
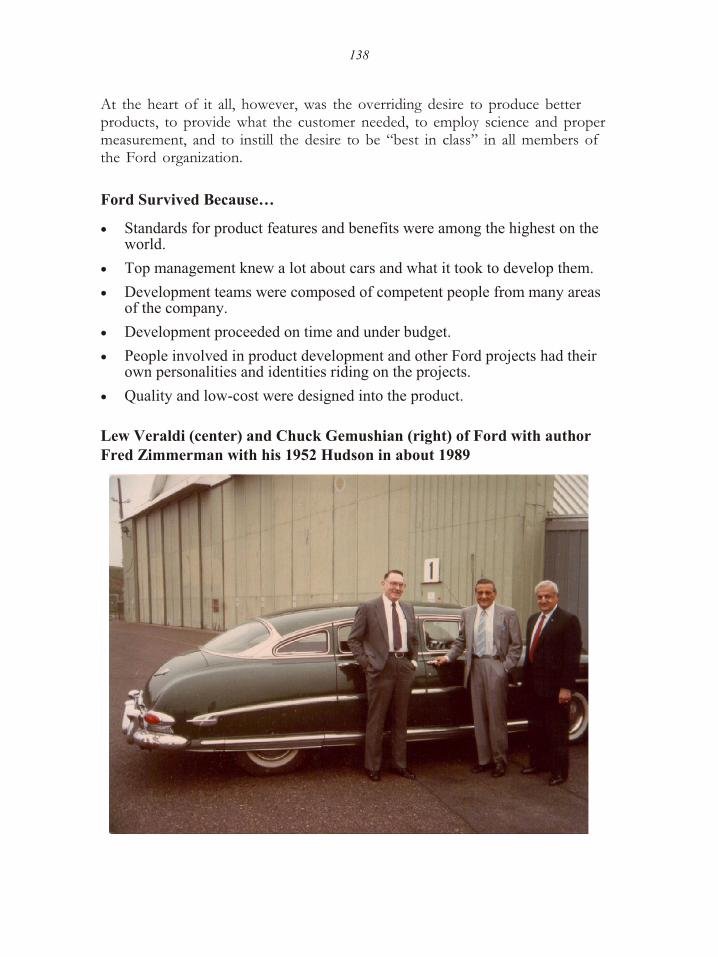
At the heart of it all, however, was the overriding desire to produce betterproducts, to provide what the customer needed, to employ science and propermeasurement, and to instill the desire to be “best in class” in all members ofthe Ford organization.
Ford Survived Because…
· Standards for product features and benefits were among the highest on the world.
· Top management knew a lot about cars and what it took to develop them.
· Development teams were composed of competent people from many areas of the company.
· Development proceeded on time and under budget.
· People involved in product development and other Ford projects had theirown personalities and identities riding on the projects.
· Quality and low-cost were designed into the product.
Lew Veraldi (center) and Chuck Gemushian (right) of Ford with authorFred Zimmerman with his 1952 Hudson in about 1989
138

Case 7 — Cosmetic Surgery at Kaiser-FrazerDuring the closing years of World War II, west coast industrialist Henry J.Kaiser began to lay plans for a postwar automobile company. Kaiser had beena very successful defense and public works contractor. Among theaccomplishments of the Kaiser industries and its associate companies were thebuilding of Hoover Dam, Grand Coulee Dam, 1490 warships, the first steelmill on the west coast, and numerous other spectacular construction andengineering feats — most of which were accomplished on schedule and underbudget. Kaiser enterprises were extensive, including a substantial engineeringand construction business, Kaiser Steel, Kaiser Aluminum & Chemicals, andother smaller enterprises.
In order to facilitate his goal of a postwar automotive company, Henry Kaiserultimately teamed with another historic name in the automobile industry, . In1944, Joe Frazer, a respected and established sales executive who wasresponsible for Chrysler's market penetration in the thirties, became presidentand chief executive of Graham-Paige, a firm that had suffered severely duringthe great depression. Frazer immediately began preparing for the resurgence ofthe automobile industry that many expected to emerge after World War II.Graham-Paige joined Kaiser Industries to form the Kaiser-Frazer Corporationin August 1945. Henry J. Kaiser was named chief executive and Joe Frazer,president. Kaiser-Frazer Corporation purchased the remaining Graham-Paigeassets in February 1947.
The first Kaiser and Frazer automobiles were introduced in 1947. The twomakes were nearly identical. The initial styling was modern for its time. Fenders were blended into the sides of the car. The car was wide and roomy insidewith a large amount of room in the front passenger area due to an attractivelydesigned concave dash. Visibility was excellent compared to other cars of thisera.
Apart from the styling, the car's design was mainly prewar. The engine wasdesigned by Continental Motors and was nearly identical to the Graham-Paigeengines of the 1930s. It was not an especially durable engine, having only three main bearings and only moderate displacement for a full-size car. But theKaiser-Frazer design was light in weight, and the cars had at least averageperformance for the late 1940s.
In order to provide a production facility for the automobile business,Kaiser-Frazer management arranged to lease (and later purchase) a huge surplus bomber plant at Willow Run, Michigan. At 4 million square feet under oneroof, the Willow Run plant suddenly became the largest single automotive plant in the world. This huge plant, together with the Frazer's sales expertise and the construction and steel capabilities of the Kaiser industries generated enthusiasm
The Turnaround Experience 139

for the industry's first new entrant in nearly 20 years. Kaiser-Frazer stockquickly tripled in value.
The early sales of Kaiser-Frazer automobiles were sensational. By 1948,Kaiser-Frazer was the sales leader among the six independent producers (seeTable 7-5). Revenue for 1948 was $342 million and after-tax profits exceeded$10 million. Clearly, this was an exceptional showing for a company manypredicted would not get out of the starting blocks.
Table 7-5 1948 Unit Sales of Independent Auto Producers
Manufacturer 1948 Unit Sales
Kaiser-Frazer 181,316
Hudson 142,454
Nash 118,621
Studebaker 102,123
Packard 98,898
Willys (Cars) 32,635
Several important observations must be made regarding the success ofKaiser-Frazer during the postwar years, however. Most important, a seller'smarket prevailed because of the 4-year shutdown of domestic automobileproduction during World War II. Most companies were still production-bound,and materials were still scarce. The huge Willow Run plant plus its associationwith Kaiser Steel gave Kaiser-Frazer some advantages during this period. Inaddition, practically all the other producers were offering cars styled beforeWorld War II. Only Kaiser-Frazer offered new styling.
Kaiser-Frazer cars were relatively undifferentiated except for styling. Quality was below average, and the internal engineering of the actual production modelswas quite dated. Though Kaiser-Frazer engineers had experimented with a newV8 engine and front-wheel drive, these innovative concepts never reachedproduction. When the other automobile producers announced new, moremodern styling for 1948 to 1949, the Kaiser-Frazer lost its key advantage. By1949, Kaiser-Frazer was competing against lower-priced, attractively styled carswith modern overhead-valve V8 engines, good engineering, and automatictransmissions. Cadillac and Oldsmobile provided the most formidablecompetition.
Many members of the Kaiser organization were capable but inexperienced inautomobile production. Production methods were oriented to the wartimerequirement of finishing things quickly. The first Kaiser automobiles went intoproduction quickly, but the company never became a low-cost producer.Kaisers prices were similar to those of Buick and Chrysler, while Frazer's prices compared with Lincoln and Packard. Even with these high prices, gross profitmargins were low by industry standards (Table 7-6).
140

Table 7-6 Gross Profit Rates of Major Producers, 1947 and 1948
1947 1948
Nash 21.8% 21.3%
GM 19.6% 24.2%
Kaiser-Frazer 11.1% 12.5%
Studebaker 8.9% 11.1%
Packard 7.0% 15.2%
Joe Frazer expected that competitive automobile companies would be offeringsuperior products during the 1949 model year, and he advocated reducingKaiser-Frazer production schedules to an annualized rate of 70,000 cars, untilKaiser-Frazer announced its new car 18 months later. His production planallowed for profitable operations at a much lower level of production. In sharpcontrast, Henry Kaiser did not believe that sales would decline thatsubstantially, and the company continued at full production for much of 1949.Frazer turned out to be correct. Kaiser-Frazer sold only 58,000 cars in 1949and lost over $30 million.
In spite of Frazer's feel for the market, his influence began to erode atKaiser-Frazer shortly after the 1949 experience. A philosophy of continuedexpansion was emerging at Kaiser-Frazer. A new full-sized car and a newcompact car were being made ready. Henry J. Kaiser and his able son, Edgar,were convinced that they would ultimately prevail in the automobile business as they had in so many others. By 1950, Edgar Kaiser had replaced Joe Frazer asthe company's president.
Basically skipping the 1950 model year, Kaiser-Frazer announced a new line ofcars for 1951. The body of the Kaiser was completely new. The Frazer was tobe new but retained the basic body shell of the 1949 models in order to use up an existing inventory of parts. Both were roomy cars with an innovativehatchback design available, but only the Kaiser sold well. The newly styledKaiser sold 139,000 units. The modified Frazer sold 10,000.
The 1951 Kaiser was an attractively styled automobile. In many respects, thecar resembled cars produced 15 or 20 years later. But, again, the car wasdifferentiated only with respect to styling and a few innovative safety features.The car still had the same old prewar flat-head six-cylinder engine, and otherengineering features were nearly identical to earlier models. Though the car didsell well immediately after its introduction, this high rate of sales was notsustained. Most manufacturers restyled again in 1952, and Kaiser's main edgeagain eroded.
During the 1950s, the firm also announced its new compact car — the “Henry J.” This car was both small and sprightly but it was not inexpensive. Pricedabout the same as a Chevrolet with far less room, far fewer features, no trunk,
The Turnaround Experience: Real World Lessons in Revitalizing Corporations and Organizations

and inexpensive plastic upholstery, it sold mainly to a curiosity market. About120,000 were produced during the 4-year production run.
Though the new Kaiser and, to a lesser extent, the Henry J sold well at thetime of their introduction, they were produced at very high cost. Kaiserautomobiles had a limited number of body styles (no station wagon, noconvertible, and no two-door hardtop), but the sculptured shape of the Kaiserbody created some manufacturing problems and the company offered a hugeassortment of exterior colors and styles of upholstery, some of them rathergaudy. Gross profit rates were under 5 percent for both 1951 and 1952. Theinventory turn ratio shrank to 4.8 for 1951. The company lost $12 million in1951 and $5 million in 1952. Former vice president and secretary HickmanPrice described matters in the following way:
The money started to go out at a rate that was incredible. All sorts ofresearch was done — but in general not basic research, not engineeringresearch, of how to make a better product. It was what I would call apurifying operation, and at this Edgar Kaiser was good. But, the cost wasunbelievable. The people working on a project like that you simply couldn't count. The plane fares alone, back and forth from California, plus plusplus plus plus, were out of this world. (Langworth 1975, 110)
During the same era, Willys-Overland had emerged from the war as anestablished producer of utility vehicles — primarily the Jeep. The Jeep soldmodestly well and the firm was profitable from 1942 through 1953. Thecompany began to experience substantial operating losses, however, when itbegan to produce a small conventional automobile, the Aero-Willys. SinceWillys-Overland had been a supplier of engines to Kaiser, and Joe Frazer had,at one time, been president of Willys-Overland, considerable rapport alreadyexisted between the two firms. Kaiser-Frazer purchased the automobile-relatedassets of Willys-Overland in April of 1953, and with Joe Frazer out of thecompany and the Frazer automobile no longer in production, the company was renamed Kaiser Motors Inc.
Kaiser kept the Aero-Willys in production into 1955 — longer than the HenryJ. The car itself was well designed and very economical. But, with list prices$200 above those of Ford and Chevrolet, it was also expensive. Again, KaiserMotors was not equipped to build a low-priced car because the firm was ahigh-cost producer. Gross profits were negative for both 1953 and 1954, andnet profits were substantially negative. After losses of $27 million in 1953 and$35 million in 1954, the decision was made to exit from passenger-carproduction to concentrate on the other Kaiser interests and on the manufacture of Jeeps. Five years later, in 1960, the remnants of the once-impressive Willysand Kaiser vehicle businesses were sold to American Motors in exchange forAMC stock.
142
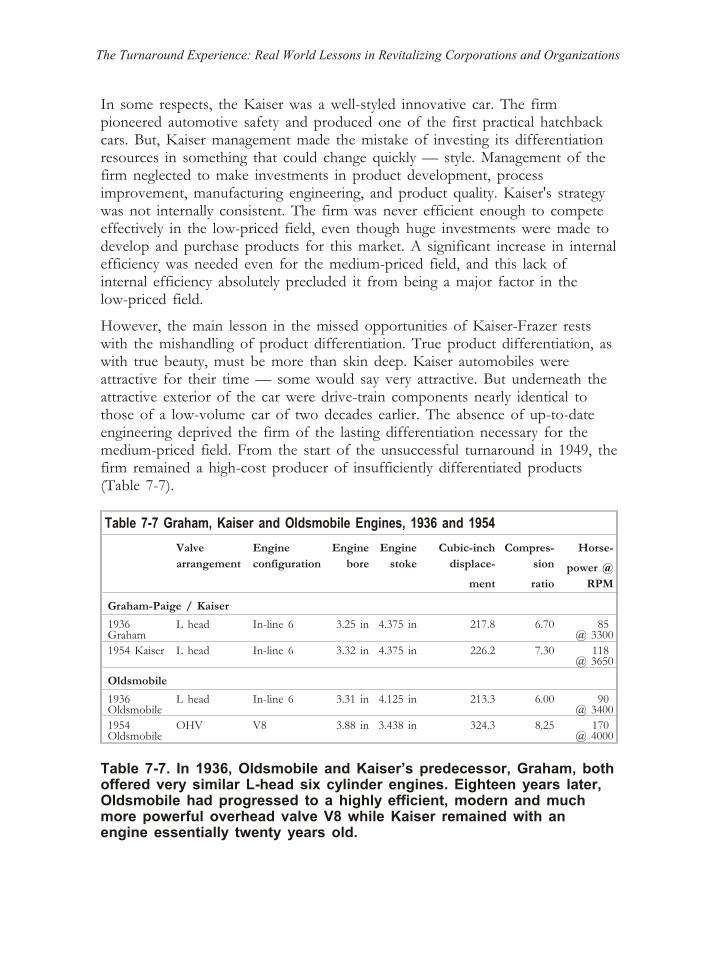
In some respects, the Kaiser was a well-styled innovative car. The firmpioneered automotive safety and produced one of the first practical hatchbackcars. But, Kaiser management made the mistake of investing its differentiationresources in something that could change quickly — style. Management of thefirm neglected to make investments in product development, processimprovement, manufacturing engineering, and product quality. Kaiser's strategywas not internally consistent. The firm was never efficient enough to competeeffectively in the low-priced field, even though huge investments were made todevelop and purchase products for this market. A significant increase in internal efficiency was needed even for the medium-priced field, and this lack ofinternal efficiency absolutely precluded it from being a major factor in thelow-priced field.
However, the main lesson in the missed opportunities of Kaiser-Frazer restswith the mishandling of product differentiation. True product differentiation, as with true beauty, must be more than skin deep. Kaiser automobiles wereattractive for their time — some would say very attractive. But underneath theattractive exterior of the car were drive-train components nearly identical tothose of a low-volume car of two decades earlier. The absence of up-to-dateengineering deprived the firm of the lasting differentiation necessary for themedium-priced field. From the start of the unsuccessful turnaround in 1949, the firm remained a high-cost producer of insufficiently differentiated products(Table 7-7).
Table 7-7 Graham, Kaiser and Oldsmobile Engines, 1936 and 1954
Valve
arrangement
Engine
configuration
Engine
bore
Engine
stoke
Cubic-inch
displace-
ment
Compres-
sion
ratio
Horse-
power @
RPM
Graham-Paige / Kaiser
1936Graham
L head In-line 6 3.25 in 4.375 in 217.8 6.70 85 @ 3300
1954 Kaiser L head In-line 6 3.32 in 4.375 in 226.2 7.30 118 @ 3650
Oldsmobile
1936Oldsmobile
L head In-line 6 3.31 in 4.125 in 213.3 6.00 90 @ 3400
1954Oldsmobile
OHV V8 3.88 in 3.438 in 324.3 8.25 170 @ 4000
Table 7-7. In 1936, Oldsmobile and Kaiser’s predecessor, Graham, both offered very similar L-head six cylinder engines. Eighteen years later,Oldsmobile had progressed to a highly efficient, modern and muchmore powerful overhead valve V8 while Kaiser remained with anengine essentially twenty years old.
The Turnaround Experience: Real World Lessons in Revitalizing Corporations and Organizations

Kaiser Failed because…
· Product differentiation was limited to cosmetics and did not extend tomeaningful technical features.
· Top management was competent but had little experience in the industrybeing served.
· Development and operational decisions were directed from levels whichwere too high in the company.
· Quality was insufficiently considered.
· Expediting replaced operational efficiency.
144
Chapter 8 — Achieving ProductQuality
The Cadillac Division of General Motors had a humble beginning as thefailed experimental shop of Henry Ford. But rigorous attention to productquality allowed the Cadillac automobile to complete its evolution from alow-priced car with few sales to a prestigious marque with lasting presencein the world marketplace.
Fortunately for the firm in trouble, good quality lowers cost. The highestcost of bad quality occurs during the production process, when poorly madeparts preclude efficient final assembly. Effective turnaround agentsunderstand the cost of bad quality and make process changes that improvequality, at least to some degree, very quickly. Their approach is often rathersimple, and often emotional. They display their feelings in ways that clearlyconvey their intentions to workers, vendors, and other managers. Theyexpress horror and indignation, not at the workers who produce the parts, but at the parts that are bad. They may use humor, expletives, or physicaldestruction of the part itself in order to illustrate the need for perfection, butthey are not vindictive or personal. They determine causes of bad qualitythrough realistic investigation and effect corrections and reinforce themthrough ongoing systems of discipline. Turnaround managers who aresuccessful attend to quality problems with vigor and dispatch.
In contrast, unsuccessful turnaround managers vacillate and are too polite.Production people tend to distrust overly polite managers when the companyis on the brink of failure. The workers themselves want managerial action as an indication of corporate resolve. The workers do not want to lose theirjobs because the products being produced do not meet customer expectations. They want the problems fixed, and they are most willing to participate inimprovements. What workers detest most is the rationalization that noproblems exist.
The human power to rationalize quality into one's own products iswidespread, and many companies in trouble believe that they are unable tomake suitable profits because other producers with lower-quality productsunderprice them. This rationalization is seldom verified, but its presenceinhibits management from taking meaningful action to restore the firm'shealth. As an example, the top officers at a major manufacturer of potatoharvesters felt that the firm's products were substantially better than anyother products in the market, and if the agricultural economy would improve, prices could be raised and profitability restored. However, upon closerinspection, iron filings were found in the hydraulic tanks, the main frames of the units were welded up crooked, thus causing premature wear on workingparts, the paint was peeling, nameplates were improperly mounted, and thecompany went 4 years without making a scheduled delivery on time. When
The Turnaround Experience: Real World Lessons in Revitalizing Corporations and Organizations

some of the quality problems were corrected, the company did sell morebecause the basic design of the unit was adequate. But for many years,managers of the company had deluded themselves into believing that theyhad a quality product without ever checking. Ironically, it was the production workers who made the suggestions for improvement. The workers knew theproblems were there all along, but managers did not consider the employees'suggestions, insisting instead that the company already made the “Cadillac”of the industry.
Today's Cadillac automobiles are not alone in holding the lofty distinctionthe marque enjoyed in an earlier era, but the word Cadillac still connotessuperb craftsmanship. It is more than a superlative, however; it has atechnical meaning. Quality is a form of discipline relating to theinstitutionalization of product quality throughout the production process. Dr.Armand V. Fiegenbaum defines quality as:
The total composite product and service characteristics of marketing,engineering, manufacture, and maintenance through which the product and service in use will meet the expectation of the customer. (Feigenbaum 1983, 7)
Quality in the Product
There are several ways in which successful companies exploit quality as adistinguishing characteristic. First, they act cautiously but quickly inaddressing quality problems. They do not delay or pretend that importantproblems do not exist. They resist the temptation to hide behind the weakexcuse that additional information is required to verify the obvious fact thatthe product could be improved. Successful managers understand thetechnologies of their products well enough to know what can be done andwhat should be done. Then, they do it. They take action. Unsuccessful firmsoften let problems slide as they await further evidence that a problem exists,or they rationalize the problem as minimal.
Successful turnaround agents respond to quality problems quickly and withthoroughness, often incurring additional expense when the firm can leastafford it. The result of prompt action on defects is not only a better productbut reduced manufacturing cost. Ford's production efficiency improved withits quality initiatives as did those of Buick, Cadillac, and Nash, andAmerican Motors in earlier times. By taking quick action to improve quality, the successful firms experienced the dividend of improved productionefficiency.
The fact that unsuccessful companies take too long to address major qualityissues results in a twofold penalty: negative product differentiation and highcost. Hudson machining tolerances andmountings were both examples ofquality being neglected in ways that impacted process efficiencies. Productquality is often either neglected altogether or oriented to cosmetic featuresrather than in-depth quality. In a few cases, such as the Studebaker problems with rust, Kasier problems with fit and finish, Firestone 500 Radial tires, or
146

the lack of engine durability in Hudson's number-one seller — theEssex-—blatant quality problems were either neglected or dealt with slowlyby unsuccessful firms.
Sound product design provides the cornerstone for product quality, andsuccessful firms treat quality as an iterative process involving engineering,manufacturing, and support organizations until the resulting product fullymeets the expectation of the customer. The Ford Taurus, the Deere Model A tractor, the Chrysler K car, and the Rambler automobile are examples of this iterative approach to product development — these developments took timeto fully implement but were constantly in a state of improvement.
Successful firms also understand, more completely, the economics of quality. Packard, for instance, understood that the proper heat treatment of steelcould reduce both raw-material cost and processing cost while enhancingquality. Ford engineers understood that body fit and finish were closely tiedto the design and size of stamping dies. Deere understood the mathematicalreliability of fewer, well-made components. Nash engineers understood theadvantages of heavier main bearings and dual ignition systems. In anotherindustry, the IBM Corporation understood the qualitative advantages oflubrication-free nylon gears and more reliable ribbon cartridges in itstypewriter products. Successful companies know more about their productsand how they work so that they can be in a better position to improvequality while lowering cost. Unsuccessful companies are often headed bychief executives who do not know how their products work.
Successful firms also continue to improve the quality of products even when they are better than other products on the market. Charles Nash met with his chief managers and workers every week on the matter of product quality,meetings which began by reading any letters of complaint from customers.Whether the product was good was not the question. The question was,could the product be better? Ford used as its standard some of thehighest-priced automobiles in the world and produced a sedan for thelow-priced field, using the slogan “do common things uncommonly well.”Programs of constant improvement have been present at Toyota, Honda, andMazda but also at American producers such as Snap-On Tools, Maytag,Onan, Winnebago and the 3M Company.
Quality in the Process
The mere determination to produce quality products is insufficient to restorea firm's competitive edge. Scientific investigation and discipline are the traits needed for a successful turnaround. Design characteristics, productionprocesses, and user requirements must be scientifically examined in search of even minuscule contributors to low quality. Then, improvements must beimplemented and carefully monitored to ensure that shipped products meetcustomer expectations. Though the firm may be teetering on the brink ofliquidation, science and discipline must prevail to get things right prior toshipment of product.
The Turnaround Experience: Real World Lessons in Revitalizing Corporations and Organizations

Successful companies carry the concept quality through to completion in allaspects of the organization, not merely the final assembly of end products.Quality becomes systemic and proceeds from discipline. It applies toeverything. Much emphasis is put on quality during the production process(as opposed to emphasis on end-product quality only). Henry Leland ofCadillac described this emphasis in the following way:
It is the foreman's job to know that every piece of work turned out by hisdepartment is RIGHT, and it is his work to teach his men how to make itRIGHT. It doesn't cost as much to have the work done RIGHT the firsttime as it does to have it done poorly and then have a number of men tomake it right afterward. (Automotive Quarterly Editors and PrincetonInstitute for Historic Research 1983, 26)
This emphasis on quality as an ongoing discipline is one factor whichdistinguished the successful from the unsuccessful turnarounds. End-productquality was meaningful because the successful firms sought to satisfycustomers. But in-process quality impacts both end-product quality and unitcost. The successful turnaround agents understood that the highest cost ofbad quality occurs during production, when defective components inhibit theproduct from moving to the next stage of assembly. They understood that itwas not possible for the production process to move freely unless adiscipline existed which required top quality at every stage in the production process. More recently, the Japanese have rediscovered the same concept.
The superior quality performance of the successful firms resulted fromprocess consistency and constant improvement of both products andprocesses, but of these two, the discipline surrounding processes wasprimary. If the process, itself, is not predictable, mere rhetoric and companyspirit will not provide customers with quality products.
Practical Lessons on Product Quality
· Both successful and unsuccessful companies believe their products to beof high quality, but credibility varies. Successful companies constantlycheck to ensure that products meet or exceed customer requirements.Unsuccessful companies presume that quality is high but do not check.
· Successful companies quickly take action on quality problems.Unsuccessful companies gather more evidence.
· Discipline in operations is prevalent among successful companies. Quality is maintained because precision is expected at every link in the valuechain, and when quality is not forthcoming, changes are made.Unsuccessful companies lack discipline.
· Successful companies improve the product even when it is better thancompeting products. Unsuccessful companies become satisfied whenquality is about the same as that of weaker competitors.
148
· In-process quality is the major emphasis at successful companies. Atunsuccessful companies, more emphasis is on the end product.
· Top managers at successful companies are emotional about quality andother issues. Top managers at unsuccessful companies display lessemotion and are hard for people to read.
· Top managers at successful companies instill pride in company andproduct by clearly articulating, through words and actions, what isimportant and by supplementing these articulations with outstandingtechnical knowledge. The combination of pride, technical competence,fairness, and experience helps organization members to believe that theyare part of a class act.
Case Histories
In 1902, the financial backers of Henry Ford, exasperated by Ford'sproclivity to tinker and the fact that only three cars had been produced inseveral years, sought the advice of a respected manufacturing manager todetermine whether the firm should be salvaged or liquidated. Therecommendation was that the firm should not be liquidated if quality andmanufacturing could be improved. Many improvements were made inproduct design, quality, and manufacturability as the firm continued withoutHenry Ford under the name of Cadillac. Cadillac then rose from its earlybeginnings as a low-cost one-cylinder car to become one of the mostprestigious and successful marques in the world. What enabled Cadillac toprogress from its humble beginnings to the flagship position in the GM fleetwas rigorous attention to product quality.
Twenty-five years later, the Hudson Motor Car Company was enjoyingunprecedented success as one of the four largest producers of American cars. Hudson produced 276,000 cars in 1927, a market share of 8.96 percent. By1929, sales had grown to over 300,000 units. The firm's popular Essexmodel had provided many innovative features to the moderately priced field,and Hudson stock appreciated greatly during the 1920s. Two years later,however, the Hudson Motor Car Company had entered a period ofunprofitability which was to last, almost uninterrupted, until World War II.What caused Hudson to decline was not primarily the economy of the 1930s, for other producers fared better. What caused Hudson to decline was itsfailure to pursue top product quality, a shortcoming which resulted in amarket share slippage of more than 50 percent.
The Turnaround Experience: Real World Lessons in Revitalizing Corporations and Organizations
Case 8 — Getting It Right at CadillacTogether with a group of prominent Detroit investors, Henry Ford formed theDetroit Automobile Company (later, the Henry Ford Company) in 1899. Thefinancial backers were interested in producing a commercially viable passengercar, but Henry Ford found it difficult to complete the full design, develop, andproduce a major product in the time allotted. After 3 years, only threeprototype models had been produced. The company had largely exhausted itscapital, and Ford's backers had lost interest in further support of his efforts.They no longer had faith that Ford could mold his product ideas into aworkable business and decided to liquidate the company.
In order to reassure themselves that they had made the right decision, theysought the technical advice of Henry Leland of the machining firm of Lelandand . Leland and Faulconer was a major supplier to the then-infant automobileindustry and manufactured the engines for Oldsmobile as well as componentparts for other manufacturers. Leland had a strong background in precisionmachining, stemming from his long experience as a plant superintendent for the Brown & Sharpe Company, a prominent manufacturer of machine tools.
Leland was 56 at the time of the difficulties at the Henry Ford Company.Through the years he had developed the reputation of being absolutely fanatical about efficiency and precision in production. His son, Wilfred, worked withhim. Wilfred was a highly competent technical person in his own right who had a flare for engineering and product design. Together, they trained, influenced,or encouraged by close association some of the most influential names in theearly history of automobiles, including Horace Dodge, Fred Zeder (later head of Chrysler engineering), Alanson Brush (Pontiac/Oakland) and, at a later stage,Charles Kettering and Alfred Sloan. Together, the Lelands developed a highlyrespected position as perhaps the most qualified suppliers of precision parts tothe then-infant automobile industry.
Henry Leland's disciplined and technological approach to machine design andproduction contrasted rather sharply with the informal trial-and-error methodsemployed by Ford (Nevins 1954). Leland's assessment was that the design ofthe Ford engine was neither advanced from an engineering standpoint nor costeffective. A much better engine could be designed that would be far less costlyto build — less costly by an amount which represented a significant percentage of the total cost of the automobile at the time. The financial backers boughtLeland's product concept, and the firm of Leland and Falconer was given acontract to manage the company, which was renamed the Cadillac MotorCompany in honor of the founder of Detroit. Later, the two firms of Lelandand Falconer and Cadillac were combined. Thus, the Cadillac motor car rosefrom the ashes of Henry Ford's earlier unsuccessful efforts in the automotiveindustry.
150

The Turnaround Experience: Real World Lessons in Revitalizing Corporations and Organizations
Figure 8-1 Excerpts from a Cadillac advertisement; 1914.
MotorCadillac pistons are gauged to similar accuracy. The result is that neither cylinders
nor pistons can possibly vary in diameter even a hair's breadth. Consequently ANYpiston will fit in ANY cylinder. They do not have to be “paired.” If it ever becomesnecessary to replace a piston, all the owner has to do is replace the piston. He is notnecessarily obliged to replace the cylinder also, or possibly a pair of cylinders or thewhole four as might be the case where they are cast in pairs or all together.
In finishing the cylinders and pistons, we do not stop at simply machining. Every one of them is ground to a polished surface resulting in practically perfect compression andconsequently maximum power. The piston rings are finished with the same precision and are also made from our own special formula, different from that of which the cylindersand pistons are cast. This metal possesses exceptional spring qualities not easily affectedby the heat of the motor. Therefore, they retain their efficiency long after the ordinaryring would be rendered practically worthless. The crank shaft is substantially supportedby five large bearings, insuring that firmness and rigidity essential to a smooth running,vibrationless and durable motor.
IgnitionIn the very essential matter of Ignition the Cadillac is equipped with two separate and
complete systems, each with its individual set of spark plugs. Either system is efficientfor operating the car, entirely independent of the other. For one system we use theBosch high tension magneto. As an auxiliary ignition, we have adopted the new DelcoDistributor System. We use this system not merely for starting but to afford Cadillacusers a dependable reserve ignition that can be used for running any distance withsatisfactory results.
Drive ShaftThe drive is direct by special heat treated high carbon steel shaft, fitted with two
universal joins having hardened and ground bushings and pins. The joints are enclosedin spherical housings and run in oil baths. The forward joint, which is telescopic, is soconstructed that it is self centering, resulting practically in the elimination of friction and bindings strains characteristic of ordinary construction. The drive shaft revolves onTimken bearings. The torsion member is V shaped tubular. When the car is carrying anormal load, the power is transmitted in practically a straight line from the motor to therear axle, with the result that the maximum of generated power is delivered to theground. The foregoing are some more reasons why the Cadillac shows more power thanany other car having a motor of its size."
TransmissionThe Cadillac transmission is as superior to the usual transmission as the Cadillac
motor is superior to other motors. It is more substantial, more positive, and by operatorsof long experience it has been pronounced the most easily operated of any they haveever used. It is our own design, manufactured in our own factory. It is the selective type of sliding gear. There are three speeds forward and reverse, direct on high. The gears,also the transmission shaft and clutch shaft, are made of chrome nickel steel. Theconstruction is Cadillac quality throughout. The utmost skill is exercised in cutting andfinishing the gears and other parts according to the Cadillac system of limit gaugeswhich insures hair's-breadth accuracy. These parts are then treated by a special processwhich gives them extreme strength, toughness and wear resisting qualities.
The gear teeth are “backed off” or beveled by machinery especially designed for thepurpose. This facilitates the shifting of the gears without he crashing and grindingcharacteristic of some construction. The main transmission shaft, the jack shaft and theclutch revolve on five annular ball bearings.
The Lelands did indeed produce a highly reliable one-cylinder engine. Thisstrong but small one-cylinder engine matched the needs of the marketplace, for the first Cadillacs were very small cars. In spite of the car's modest size, theCadillac soon gained a widespread reputation for quality, reliability, andprecision. In 1908, Leland had five Cadillacs shipped to a prestigious technicalexhibition in Europe. The five cars were completely disassembled and the parts intermixed with some newly manufactured off-the-shelf parts. Then the carswere reassembled and driven 500 miles at full speed. All five Cadillacs ranperfectly — a magnificent accomplishment for 1908. The result was that thefirm won the coveted DeWar Trophy for Manufacturing Excellence entitled“Standard of the World”; still the Cadillac slogan today.
Henry Leland understood at an early stage the important principle inmanufacturing that the real cost of bad quality is in house in the form ofinefficient production. He understood that parts that are not accuratelymachined do not fit together and cause delays in production as well asinconvenience to the customer later on. Leland insisted that parts be machineddown to a tolerance of one-thousandth of an inch or even less for more critical parts. Leland would roam through the plant throwing parts away, breakingcastings, and hiding poorly made parts so that they would not find their wayinto the production process. In this stirring and colorful manner, he exhibitedthe crucial leadership quality of being able to clearly articulate the importance of quality and accuracy.
Fred Zeder referred to Henry Leland as “a prince...the Grand Old Man ofDetroit. He was indefatigable and so patient in his directing and guidingwherever needed” (Crabb 1969). Other individuals liked Henry Leland less well, but respect for his engineering abilities, his interest in quality, and knowledge of production was widespread.
Ultimately, many key innovations and inventions appeared in the Cadillac motor car first. The electric starter project was begun in 1910 after a close friend ofthe Lelands, Byron Carter of CarterCar, was fatally injured while cranking a car. At the time of Carter's death, Henry Leland made the following remark to close associates:
I'm sorry I ever built an automobile. Those vicious cranks, I won't haveCadillacs hurting people that way. (Leland 1966, 131)
As with other successful turnarounds, production efficiency enabled the firm to add distinctive features and benefits. The industry's first electric starter, firstgenerator and battery system, and the first coil ignition system were all projectssponsored by Cadillac when Charles Kettering was just beginning his DelcoLaboratory. Cadillac introduced thermostatically controlled water circulation,tilt-beam headlights, and an adjustable steering wheel. Wilfred Leland developed the industry's first production V8 engine, which reached the market in 1915.
152

Key advancements were made in lighting, engineering, and manufacturingprocesses.
Quality, workmanship, and production discipline built the Cadillac motor carinto one of the most differentiated products in the industry. The advertisingemployed by Cadillac prior to World War I was highly technical. Prospectivebuyers were treated as competent, rational individuals who were interested inknowing why the Cadillac motor car was better. Cadillac advertisements oftenread more like an engineering manual than an advertisement for a motor car.Figure 8-1 displays some excerpts from a long and detailed advertisementcovering the 1914 Cadillac Thirty.
As respect for the workmanship in the Cadillac motor car grew, sales increaseddramatically and Cadillac soon became the number three producer. Cadillac(along with Buick) became one of two chief contributors to the profit of theGeneral Motors Company, which it had joined in 1909. It was Wilfred Leland's persuasive speech and the consistent profitability of Cadillac that convinced thebanking community to make a critical $15 million loan to General Motors in1910. Production for those early years is shown in Table 8-1.
Table 8-1 Cadillac Production
Year Units
1902 3
1903 2,497
1904 2,457
1905 3,942
1906 3,559
1907 2,884
1908 2,377
1909 7,868
1910 10,039
1911 10,071
1912 12,708
1913 17,284
1914 7,818
1915 20,404
Cadillac's widespread reputation for quality and engineering moved it graduallyinto the flagship position in the GM product line. The automobile that initiallybegan as a small, $750, one-cylinder car ultimately became the top-of-the-linemake for the largest automobile company in the world. This rise had itsfoundation in sound manufacturing processes and superb product quality.
The Turnaround Experience: Real World Lessons in Revitalizing Corporations and Organizations

Henry Leland exhibited a strong-willed crusader mentality; not only with regardto the virtues of precision but also in both civic affairs and social issues. Withothers, he became engaged in a long and difficult struggle to clean up the cityof Detroit. Leland and his compatriots campaigned for honest elections andeven arranged, through their Civic Uplift League, to rate political candidates as“qualified,” “preferred,” or “recommended.” He was active in the WestminsterPresbyterian Church and was an active campaigner against alcoholic beverages.He actively promoted the establishment of a joint Thanksgiving Day sermonthat featured clergy from the Protestant, Catholic, and Jewish faiths. Hesupported the YMCA activities for Chinese youth as well as Father McCarthy'sChinese Mission Society. Leland was widely known as a patriotic American(Leland 1966).
Rigorous, conservative, and uncompromising as he was, Leland was also anearly defender of trade unions. Although some authors question his sincerity inthis regard (May 1975), the following quotes reflect his public statements on the matter:
If tonight it was a question if every trade union in Detroit should beabolished, then I would stand with my rifle if necessary and say No! youdon't do it. Because that is the only weapon they have againstunscrupulous employers. Because there are many employers sounscrupulous that if it were not for the organization they would have beencrushed, perhaps just as the agitators picture it. Therefore we must haveorganized labor, but we must also have organized employers.
During my years as an employer I have always and constantly striven toincrease wages. I have gone through several panics in which I have sweatblood to keep the men employed....I do not believe any man can say thatduring all the time I have treated my employees with anything but justiceand consideration. Some of you know that the most humble employee whohas a grievance is welcomed at the president's office. (Leland 1966, 168)
Even in advanced age, Leland remained technically up to date. He waspresident of the Society of Automotive Engineers from 1909 to 1914. Heorganized the National Foundry Association and the American Institute ofWeights and Measures. He made many trips to Europe to examine theeffectiveness of factories in Germany, France, and England. In 1920, Lelandwas awarded an honorary doctorate of engineering from the University ofMichigan (Leland 1966, 169 to 170).
Although it is somewhat difficult to obtain complete financial information onthe early history of Cadillac, we do know that it was quite profitable.
The Cadillac purchase by General Motors], in the light of its then currentearnings and of its subsequent history, was exceedingly well advised. For the year ended August 31, 1909, the company reported earnings of $theequivalent of a forty-two percent return on the amount of General Motors'
154

investment; its net worth, after the payment of $675,000 in dividends, was$2,862,709. (Seltzer 1928, 135)
Cadillac continued to contribute heavily to the profits of General Motors formany years as well as serving as a font of technical expertise, particularlymanufacturing expertise, during critical points in GM's history.
In 1917, the Lelands left General Motors. Some historians say that it was tomanufacture the Liberty aircraft engine, which was a World War I defenseproject temporarily spurned by Billy Durant. Some suggest that, as with WalterChrysler and Charles Nash, there was a clash of philosophies between theLelands and the individuals in charge at GM at the time. In any case, theLelands left to form a new company to build 6500 Liberty engines in supportof the U.S. defense effort in World War I. Later on, when Henry Leland wasin his late seventies, the Lelands began production of another premium motorcar, the Lincoln, which was later incorporated into Ford.
The Cadillac turnaround was based on production expertise, quality, andproduct innovation. Cadillac emerged from near-liquidation, prospered, andachieved lasting industrial prominence because it efficiently built better cars.The Cadillac organization became a source of production expertise thatfavorably influenced the state of the industry and the competitive position ofAmerican automobile manufacturers for a very long time. Cadillac's ability tofocus on the lucrative high-priced segment of the market was a directoutgrowth of the division's reputation for quality.
Cadillac Survived Because…
· Standards for product quality were among the highest in the world.
· In-process quality was pursued as the key element in end-product quality.
· Products increased in their differentiation and new markets werepenetrated because of high quality standards.
· Operational efficiency was high.
· Ideals were present and were clearly articulated.
· Distinguishing features and benefits proceeded from a technical base.
Case 9 — Leaving It Wrong at HudsonThe Hudson Motor Car Company was organized in 1909 by individuals whohad been previously associated with several automobile companies, but primarily Oldsmobile. The principal financial backer and namesake for the firm was J. L.Hudson, the founder of the Detroit department store that makes up part ofDayton to Hudson Corporation today. The company established an earlyreputation for innovation by providing one of the industry's first
The Turnaround Experience: Real World Lessons in Revitalizing Corporations and Organizations

counterbalanced crankshafts, reasonably priced closed cars, and engines notedfor speed and endurance. The Hudson Super Six, an advanced engine for itstime, became famous for its smoothness, endurance, and high speed. Hudsonadvertising featured the engineering orientation of the company and showedindividual pictures of “the 48 engineers who designed the Hudson Motor Car.”The advertising also described chief engineer Ned Coffin as “the foremostengineer in the industry” — a phrase which drew the objections of the FordMotor Company.
The early history of Hudson was glamorous. The company lost $17,000 duringits first year but then was consistently profitable for the next 22 years. By 1916, the company was producing over 25,000 cars per year and had accumulatedrevenues of over $20 million. Two years later, in 1918, the company launched a companion lower-priced car, the Essex. The Essex contained some of theadvanced engineering features that characterized the early Hudson automobiles.The car was light but strong, was constructed from good materials, and wasnoted for its easy handling characteristics. The engine was a well-designedF-head four-cylinder of 143 cubic inches. At 50 horsepower, it was 2 ½ timesmore powerful than the similarly sized Ford engine. A moderate number ofbody styles was offered including one of the industry's first moderately pricedclosed automobiles.
During its early life, the Essex Four established several endurance andcross-country speed records. The combination of speed, durability, a closedconfiguration, and attractive price resulted in an instant market success. Salesduring the first full year of production reached nearly 22,000 — an excellentrecord for a first-year car. By 1920, the combined Hudson and Essexproduction had risen to 46,000 cars — more than either Nash or Maxwell.Sales declined during the recession that followed World War I, but Hudson still operated profitably and was able to escape some of the difficulties that plaguedboth GM and Ford during the same period. By 1925, car production hadreached 269,000 cars, and Hudson became the industry's third-largest producer.Owing to sales of 109,000 of the higher-priced Hudson, which the companydescribed as “the largest-selling closed car in the world,” profits stood at $21million on sales of $209 million. Hudson stock was riding high, and it wascomfortably one of the country's largest industrial companies.
The year of 1925, however, turned out to be the peak year for Hudson profitsduring its entire 45-year history. Production actually increased after 1925 to276,000 in 1927, to 282,000 in 1928, and to 301,000 in 1929, but Hudsonproducts gradually lost market share to various Chrysler models and the newlyannounced Ford Model A. Hudson's unit market share declined from 8.96percent in 1927 to 6.28 percent in 1929. Profits for the years 1927, 1928, and1929 were $14 million, $13 million, and $12 million.
156
On the surface, Hudson's situation appeared to be favorable. Sales were atrecord levels. Profits were at near-record levels. Hudson stock increased to $139 per share in 1925, and the principals in Hudson became wealthy. Some choseto travel and became less active in the business. Several became activelyinvolved in the new field of aviation. Hudson CEO Roy D. Chapin was aprominent speaker, a director of several companies, a vice president of theDetroit Symphony, and active in a variety of civic affairs. Chapin had built oneof the most lavish mansions in all of Michigan, a home later occupied byHenry Ford II. During Herbert Hoover's term as president, Chapin wasappointed secretary of commerce.
Beneath the surface, however, Hudson's product differentiation was slipping. As product differentiation slipped and the price premium for Hudson productsdeclined, costs began to increase more rapidly than revenue. The newsix-cylinder engine introduced for the Essex in 1925 was not a good one. Theengine was actually smaller than in its four-cylinder predecessor, resulting in asmall-displacement, high-revolution-per-minute engine in a full-sized car. Inorder to achieve sufficient power, final drive gear ratios were increasedultimately to 5.4 to 1. With engine revolutions roughly twice the level of thoseof modern automobiles, the car was very noisy at normal driving speeds andwas prone to early wearout and low reliability. The antiquated thermosiphoncooling system and the splash-oil system with babbitted bearings were lesssophisticated than the fully pressurized oil systems with precision bearingsoffered on many other models. With a very long stroke, high revolutions perminute, and only three main bearings, the engine quickly gained a reputation for ongoing trouble.
In 1930, Hudson management felt the need to offer a straight-eight engine tomeet competitive pressures in a declining market. Yet, the company spurned the opportunity to design a completely new engine and, instead, used thecomponents of the highly controversial Essex Six to produce a straight-eightengine that was actually smaller and less durable than the highly successfulSuper Six of the 1920s. The Super Six, holder of many speed and endurancerecords, displaced 288 cubic inches. At 214 cubic inches, the new Great Eightwas 75 percent the size of the Super Six. The engine's durability was furthercompromised by its splash-oil system and easily worn valve lifters. Ultimately,the Great Eight was enlarged to 252 cubic inches to become the CommodoreEight and remained in production through 1952, but it was never a goodengine from the standpoint of either quality or reliability.
Hudson had difficulty achieving low-cost operations as well. Between 1925 and1929, revenue increased by only $174,000. Costs, however, increased by$9,957,000. On sales of 60 percent fewer automobiles, the Nash Motor CarCompany was making 55 percent more profit. Chrysler's 1929 production wasonly about 25 percent higher than Hudson's, but profits were 108 percent
The Turnaround Experience: Real World Lessons in Revitalizing Corporations and Organizations

higher. Hudson's gross profit rate in 1929 was meager compared to that of itscompetitors (Table 8-2).
Hudson entered the great depression in a weak strategic position. At a timewhen the market itself was shrinking, the company was losing market sharebecause of quality and feature shortcomings. Hudson's physical unit marketshare declined from 9 percent in 1927 to 2.5 percent in 1933. Productiondeclined from 301,000 units in 1929 to 58,000 units in 1932. Revenue, in thishighly competitive market, declined by 87 percent. The price of Hudson stockfell from more than $130 per share in the 1920s to less than $3 in 1932. Withthe Roosevelt inauguration in 1933, Secretary of Commerce Roy Chapinreturned from Washington to again run the company.
Table 8-2 1929 Gross Profit Rate by Manufacturer
Manufacturer Gross Profit Rate
Packard 28.4%
General Motors 26.7%
Nash 23.0% (est.)
Chrysler 16.7%
Willys 13.9%
Hudson 7.9%
Hudson had lost $5.5 million in 1933 and was operating at an 18 percent lossrate when he returned. The company's serious problems were worsened byattrition among key managers. Chief engineer Ned Coffin had retired in 1930,Roscoe Jackson had died in 1929, and other key Hudson managers had left topursue other interests. Chapin bravely shouldered the revitalizing of the firmthat had been the industry's third-largest producer 6 years earlier.
In 1933, a new car, the Terraplane, was developed to replace the Essex —which by this time had achieved negative differentiation. Many componentswere actually the same as those on the Essex but the car's name and advertising promoted the image of higher speed. With the announcement of thehigher-speed Terraplane in 1933, the company's market share began to increase. By 1934 it was back up to nearly 4 percent. By 1935, the company was againproducing 100,000 cars, and by 1936, production reached 123,000 — still a farcry from the 301,000 units the firm produced in 1929.
Reflecting the austerity of 1933, the company revived the term Super Six andapplied it to a somewhat larger Essex engine for placement in
158

Hudson-designated cars. This marked the first time since 1929 that the Hudsonmarque had fielded a six cylinder engine, but it was not the quality of the older Super Six. Hudson's quality was still suspect. The company improved the Essex engine, but many of its weaknesses remained. In spite of being very expensiveto produce, Hudson valve lifters were prone to early wear, which caused noiseand loss of engine efficiency. The long-stroke design caused excessive pistontravel and vibration at high speeds. In addition, distributors were mounteddirectly in the path of water splashed by the front wheels, the result beingmany stranded and exasperated motorists.
In February 1936, Chapin died and was succeeded by Abraham Barit, who hadpreviously been vice president and treasurer. Barit, who had joined Hudson in1909 as a stenographic clerk, was also unsuccessful in making the company into a low-cost producer of quality products. From 1929 to 1941, the companyenjoyed no year when gross profit rates exceeded 15 percent and for 9 of those years, gross profit rates were less than 10 percent. Hudson lost money in allbut 3 years from 1931 to 1940. Combined losses for the period exceeded $18million.
The arrival of World War II provided Hudson with some modest opportunities as a defense contractor. But, lacking the engineering talent of a Packard or theproduction expertise of Ford or GM, the company was awarded small defensecontracts. Yet the firm did emerge after World War II to produce awell-designed modern sedan with a durable engine, superb roadability, and some excellent safety features. Hudson automobiles were consistently winning overhalf of the stock car races in the early 1950s — a tribute to the durability ofHudson automobiles of that period. The step-down Hudsons of 1948 to 1954did sell well initially. Production rose to more than 140,000 units per year from 1948 to 1950. Hudson profits rose to more than $10 million for each of theseyears. Again, gross profits were low — usually around 13 percent. Thecompany was still not a low-cost producer, and its product differentiation wasnot appreciated by all market segments. After 1950, Hudson began toexperience increasing competition from models with more modern styling, more advanced engine design, and a wider choice of body styles. Chrysler, DeSoto,Oldsmobile, and Cadillac all had overhead-valve V8 engines, and virtually all the major competitors had them by 1955. Hudson's L-head six was a durableengine as well as a relatively new engine (1948 was its first year), but it was not as efficient as the engines that employed more modern engineering concepts.Hudson's management made only a few incremental improvements and nomajor replacements for the 1948 to 1954 models. Hudson step-down sedanswere good cars that were showing their age.
Under Barit's leadership the company neglected the incremental improvement of products in its main niche and squandered its few remaining reserves ondeveloping a compact car (the Hudson Jet) to compete directly with other,
The Turnaround Experience: Real World Lessons in Revitalizing Corporations and Organizations

more efficient suppliers in an unfamiliar market. The styling of the compact car was too high and unattractive. The technology of the newly designed Jet engine was traceable to the Hudson engines of the 1930s, and only 35,000 were everproduced.
Hudson was not efficient enough to persevere by offering products in thelow-price class, nor was quality sufficient to attract customers in the higherprice ranges. The opportunity costs of the ill-fated Jet damaged the company at a critical time. The company failed to develop a modern fuel-efficient V8engine, which was fully necessary for cars in Hudson's main market at the time. The company offered no station wagon. The belt line of the car was too highfor that period (the car had been fashioned after the 1942 Buick), and visibilitywas restricted. Some individual features such as door latches and the antiquated L-head straight-eight engine fell far short of what the competition offered.Many of these problems could have been corrected with fewer resources thanwere consumed by the Jet.
By 1953, Hudson was again losing a substantial amount of money and mergedwith Nash to form American Motors Corporation. It was a merger in nameonly. The more efficient Nash-Kelvinator Corporation was clearly the acquiringparent. Within a matter of months, the less efficient Hudson plants were closed and the diminishing production of Hudson automobiles was shifted to theNash plant at Kenosha. Three years later, in 1957, the Hudson name was laidto rest after a final production run of under 6000 units, one-fiftieth of themarque's all-time high.
In its prime, Hudson was one of the world's largest auto producers, with adomestic market share of over 9 percent. For short periods, it was thethird-largest firm in terms of production volume and was clearly a major player. Company officers and owners became wealthy as the company prosperedduring its early years. Total employment reached 17,000 people. An additional2200 businesses were involved in selling and servicing Hudson cars. At itszenith, Hudson was probably involved in nearly one-half of 1 percent of thegross national product of the United States. Now the company is gone. But, we can learn from the experience. Hudson's decline began in 1925, a full 29 yearsbefore operations ceased. While management became involved in other projects
160

and other activities, the company failed to keep its quality high, its productsdifferentiated, and its production efficient (Figure 8-2).
Figure 8-2. Hudson Motor Car Company — units produced. Hudsonhad been the third-largest producer of U.S. automobiles during the1920s, but the firm's lack of attention to quality and operational issues cause its market share to drop markedly during the 1930s. During thefirst decade of Hudson's attempted turnaround, the firm lost money inall but 3 years.
The Turnaround Experience: Real World Lessons in Revitalizing Corporations and Organizations

Hudson Failed Because…
· Product differentiation was not based on quality and did not extend tomeaningful technical features.
· Top management spent too much time on interests unrelated to thewelfare of the firm.
· Known quality problems and product shortcomings remained in theproduct for years after they were discovered.
· Development and operational decisions were direct from levels whichwere too high in the company.
· Manufacturability was insufficiently considered.
· Efficiency seriously lagged that of competitors.
162

Chapter 9 — Sustaining MarketContinuity
Most companies in trouble are short of customers. With this situation, it isnot a bad idea to seek new customers, but it is a bad idea if old customersare lost in the process. Market continuity, the maintenance of continuity with historical markets, is a pragmatic necessity for companies in trouble. It could be briefly described as the propensity to focus on providing products for one very familiar market segment before expanding into any new markets orother new activities.
The development of markets is long and arduous, requiring the extra effortsof competent marketing personnel working with product development,manufacturing, and customer support. Once a market has been penetrated, itmust not be neglected. Market share is never a static condition but insteadrequires constant attention to customers and the timely development of newproducts to suit their needs. Successful firms gracefully accept the idea thatretaining markets is hard work, and they react with responsiveness and vigor to serve the present customer base. Even when new markets are cultivated,they are not cultivated at the expense of historical markets. Historicalmarkets are nurtured and preserved as if they were the firm's only marketeven if new programs are contemplated, for the troubled firm can rarelyafford a decline in its customary business as it pursues any new strategy.
Avoiding Strategic drift
For reasons that are difficult to fathom, unsuccessful firms frequently exhibit a bizarre tendency to enter unfamiliar markets while neglecting familiar ones. The strategy of shifting distribution channels, selling systems, or markets isboth complicated and inherently risky. Few firms can accomplish strategicshifts in the market served, especially during troubled times when cash fromold markets is needed and the resources to develop new markets are limited.Beyond the resource considerations, there is the timing issue. It takes a longtime to change markets, and few companies in trouble can afford the time ittakes to thoroughly develop new markets and still work historical markets to their full potential.
A major insurance company provides a good example of marketdiscontinuity. Fraught with cyclical economic problems in its homegeography, the firm elected to move into new, faster-growing suburbs wherethe insured were more prosperous and actuarial factors were more favorable.The firm was so confident of the sound basis of its new strategy that itbegan to terminate some of its established agents with the thought of shifting the resources to the new market. Unfortunately, what the firm did not realize was that other, higher-caliber competitors also appreciated the advantages of
The Turnaround Experience: Real World Lessons in Revitalizing Corporations and Organizations

serving this suburban market and that these able competitive firms hadprovided decades of reliable service. Understandably, the new entrantsuffered major losses in both the new market and the old, which hadsustained the company for more than 70 years. The planning logic employed in this tragic episode would be tantamount to the Detroit Lions transferringto the NFC Western Division because the San Francisco Forty-Niners dowell there.
Instead of concentrating on gradual, incremental improvements, unsuccessfulcompanies often make significant and abrupt changes in market position.They frequently jump from one market segment to another without fullyunderstanding the requirements of either. In five of seven unsuccessful cases, management elected to bring out a low-priced car in the hopes of stimulating sales. Studebaker produced the Scotsman and then the Lark. Kaiser producedthe Henry J. economy car. Hudson produced the Terraplane and then the Jet. Willys-Overland produced the Whippet. AMC/Renault produced the Allianceand the Encore. Often, these products were abridged versions of othercompany products that were not sufficiently differentiated for their ownmarkets. The image that resulted was usually one of a “cheap” small car.Meanwhile, the new market initiatives consumed huge resources andimpoverished programs directed toward familiar markets. The resulting losses in historical markets brought swift closure to firms that had previously beenamong the largest in their industries (Table 9-1).
Table 9-1 Important Strategic Shifts of Turnaround Candidates
Case Historical
market
New target
market
Pace of
change
Key strategy Successful ?
Cadillac Low-priced,one-cylindercar
Low-pricedone-cylinder car
Gradual High qualityfeatures andbenefits
Yes
Buick Medium-priced cars
Medium-pricedhigher-quality cars
Gradual Fewer models insame market
Yes
Packard High-pricedcars
Upper-mediumhigher-quality cars
Medium High quality andefficiency
Yes
AmericanMotors
Conservativemarket andmid-range
Conservativemarket only
Medium High quality,practical features
Yes
Kaiser-Frazer Upper-medium price bracket
Low-pricedeconomy car
Abrupt Low quality, fewfeatures
No
Hudson Upper-medium price bracket
Low-pricedeconomy car
Abrupt High quality,outdated features
No
Willys-Overland Medium pricebracket
Low-pricedeconomy car
Medium Heavy salespromotion
No
AMC/Renault Conservativemarket
Low-pricedeconomy car
Medium Lower quality,ordinary features
No
Allis-Chalmers Industrial andfarmequipment
Filters and otherproducts
Slow Investment changes No
164
During the time when Kaiser and Studebaker were actively seeking unrelated new ventures, American Motors was concentrating its marketing effortsinstead of diffusing them. AMC's target market was the same one that itspredecessor, Nash Motors, had served for years — the conservative market,the practical market, the functional market. This was a market the majorfirms in the industry had neglected. With their huge engines, bulky exteriors, heavy bumpers, and gaudy embellishments, the traditional Fords, Chevrolets,and Plymouths had become much larger and less economical in response toperceived changes in the market. What American Motors understood,however, was that a significant fraction of the market had not changed andthat a large pent-up demand existed because of neglect by the majorproducers. American Motors did not shift markets during the 1950s. With the arrival of the Rambler, the people at American Motors simply did what theyalways did, and they accentuated it with effective advertising thatemphasized the firm's consistent practicality in contrast to the wastefulexcesses of competitors.
American Motors managers also understood the emotional biases presentamong potential buyers and then nurtured those biases by supplying products that not only provided good service but also were advertised in a way thatbestowed dignity upon the clear-thinking, patriotic American Motorscustomer. Foreign producers were beginning to penetrate the Americanmarket with products that delivered superior economy and, in the case of the Volkswagen, delivered quality and reliability as well. Yet, less than 15 years had passed since the end of World War II, and American Motorsmanagement correctly discerned that some Americans did not want to buyGerman or Japanese cars. Neither French nor English cars were very good,and American producers had leapfrogged this market segment to producewhat George Romney described as the “dinosaur in the driveway.” So, in aneffort to strengthen its market continuity, American Motors announced a new model of an older car with a spirited new name, the Rambler American. Itwas a brilliant strategy directly targeted to the rational buyer who wanted tobe practical but who did not want to buy a foreign car. The strategy washighly successful, and more than 90,000 Rambler Americans were soldduring the model's second year in 1959.
The original Rambler American was not a new car. In reality, it was a carthat had been in production from 1952 through 1955, when it wassuperseded by what became the Rambler Classic. George Romney’s logicwas straightforward. It was still a good car, and the company should build it again in 1958. So, the company pulled the old dies out of storage andproduced, as a new model, a car they had taken out of production 3 yearsearlier. The strategy of the Rambler American not only minimized newtooling expense, but also cemented AMC's continuity with its historicalmarket.
Unfortunately, 20 years later AMC's managers forgot these lessons. After1970, the firm became increasingly inconsistent in dealing with its traditional market. Under the management of members of the family who at one timemanaged Hudson, the Rambler American and the Rambler Classic were
The Turnaround Experience: Real World Lessons in Revitalizing Corporations and Organizations

dropped in favor of a new marque called the Hornet. The Hornet was named after an earlier higher-priced Hudson model unfamiliar in the traditionalRambler marketplace. The new Hornet had attractive styling, but it was lessroomy than its predecessors and was particularly limited in its headroom.The station wagon model was far less utilitarian, and there was noconvertible, long an American Motors strong point and the model thatoriginated the Rambler. The colors were gaudy, and the models themselveslooked cheap. To partly compensate for the Hornet's lagging sales, the firmannounced the Rebel, which it later renamed the Matador, which then grewin length and bulk with no change in interior dimensions. The basic Matador was then supplemented with the Matador Coupe, which had entirely different tooling and looked altogether different from other members of the Matadorfamily. It sold poorly, and the entire Matador line was dropped in 1977.
Meanwhile, AMC had developed a new marque with the name Pacer, a term borrowed from the defunct . The Pacer had some interesting design features,but the car came in 500 lb overweight, which reduced its value as aneconomy car during the oil crisis. The model departed from AMC traditionsin other ways — by having limited and awkward seating, very heavy doors,and a tendency to rust. After sales declined to 10,000 units in 1979, AMCdiscontinued production the following year.
From 1968 to 1987, AMC developed very few new products and none thatexcelled. The Matador Coupe was a flop. The Pacer was an improperlymanaged project. In 1979, the company renamed its 9-year-old Hornet theConcord, the name of an unsuccessful Plymouth model produced in the early 1950s. Then, when the company did manage to locate the resourcessufficient for a major new product program, continuity with the firm'straditional market was again destroyed by naming the car “Renault” indeference to its foreign partner. All this occurred as the American consumer, prodded by exceedingly high oil prices, was redeveloping an interest in theproduct philosophies that American Motors so successfully exploited duringthe 1950s.
Servicing the Declining Market
Historical markets must be treated with the utmost care and attention even if they are declining markets, because declining markets often provide robustopportunities as less conscientious firms neglect them. Crown Cork serves as an excellent example of a conscientious firm achieving success in a declining market. As Continental Can pursued insurance and other ventures andAmerican Can became a brokerage house, Crown Cork was able to gainground on less-interested competitors in the can market, which thecompetitors saw as pedestrian and unattractive. With fervent attention toproduct quality and customer service, Snap-on Tools continued to post record sales and profits in a market others saw as fiercely competitive anddominated by low-cost offshore suppliers. While Control Data diversifiedinto new and uncharted waters, chief competitor Crey Research concentratedon providing state-of-the-art products to the market the two firms had
166
historically served for many years. Crey stockholders prospered during the1980s while Control Data stock declined to under $10 per share, down from$130 in 1968 and $78 in 1973.
One of the best examples of successful activity in a declining market isDeere's performance during the early 1980s. Deere also experiencedproblems resulting from the devastated farm economy of that period. Deeredid poorly, but everyone else did worse. When the smoke cleared, weakerand less focused producers such as Allis-Chalmers, White, and InternationalHarvester had exited the business while Deere emerged with a 60 percentmarket share in what developed into a healthier industry later on.
In 1982, Hambrick, MacMillan, and Day published a useful analysis ofindustrial product businesses that provided interesting insights into the valueof offering a dedicated service to declining markets. Using PIMS (ProfitImpact of Market Strategy) data, the authors divided 1028 business units into the four boxes of the Boston Consulting Group (BCG) matrix and thenexamined the operational performance within each group: star (strongposition in growth market), cash cow (strong position in mature or decliningmarket), wildcat (weak position in growth market), and dog (weak positionin mature or declining market). Some interesting conclusions were reached:
The results do not support BCG's advice that Dogs should be promptlyharvested or liquidated. This should come as a relief to many managers,because more and more of their industries are maturing and because allbut the market leaders qualify as Dogs. What is needed is creative positiveresearch and thinking about how Dogs can be managed for maximumlong-term performance. (Hambrick et al. 1982, 528)
One of the more interesting aspects of their study was on the frequencydistribution of the business units studied. It seems sobering that 71 .3 percent of American industries would be reduced to the categories of “cash cows”and “dogs.” Using the BCG criteria, only 11.1 percent were stars. Whetherwe believe in the BCG analytical approach is not the central question here.The question is, do the theories of management that we have in placeadequately address the needs of those companies striving to dramaticallyupgrade their performance in static or declining markets? We must addresswhat can be done for the dogs, the cash cows, and even the wildcats toenable them to compete effectively against world-class competition, becausethey make up 89 percent of our companies.
Unquestionably, some businesses do not provide necessary services to themodern economy. However, as we review the list of companies havingproblems, many of them do provide necessary services — particularly byoffering useful products and services to large, gradually declining markets. In many cases, these markets are declining not because we cannot compete inthese worldwide markets but because we have neglected them. As Hambrick, MacMillan, and Day point out, many troubled companies have significantpotential, and creative thinking is needed to discover how these troubledcompanies can be managed for maximum long-term performance. The
The Turnaround Experience: Real World Lessons in Revitalizing Corporations and Organizations

mistake would be to assume that these important companies are not worthmanaging correctly.
The successful firms studied here survived in part because they displayed aless confusing and more consistent image to their current and potentialcustomers. The unsuccessful firms often made changes that many people didnot understand. Even in something as basic as what the products were called, the successful and unsuccessful companies displayed different approaches.The successful firms made a total of four major product-name changes while unsuccessful companies made 22 basic name changes. Successful turnaroundagents, such as Iacocca, resisted the temptation to tamper with names evenwhen image problems existed. Five of the eight successful firms made noname changes at all. When changes were made, they were made for nearlyunavoidable reasons such as when the Henry Ford Company changed itsname to Cadillac because Henry Ford was starting another company.
Unsuccessful firms often jumped from one market niche to another or intoaltogether new markets. Unsuccessful firms displayed a greater tendency tostray from familiar markets to acquisitions, divestitures, or other markets.The outcomes of these differing approaches provide evidence that activeperformance in familiar markets is a necessary condition for turnaroundsuccess.
The unsuccessful companies were not very good students of their ownhistory. In fact, during his unfortunate reign at Studebaker-Packard, CEOJames Nance had the corporate archives removed from the premises, anunfortunate cleavage with Packard's glorious past and Studebaker's lineage as the nation's oldest automobile manufacturer. Unsuccessful turnaround agentsexhibited little appreciation for the many good things that were done to build some of the largest firms in the United States.
Unsuccessful turnaround agents also lacked an appreciation for the smallconsistencies that fostered consumer familiarity with historical markets. AsInternational Harvester tractors moved from being red to gray and red, asMinneapolis Moline moved from yellow to gray, and as Allis Chalmers from orange to white, Deere tractors remained green. Buick engines have sportedoverhead valves since 1902. The Packard name was one of the most reveredin the industry, but within 5 years of the marque's demise, new models were called Clippers. These symbolic changes, though small, altered publicperceptions of the products and confused customers. Successful companiesknew more about their own history. When Japanese business manager AkiroSueno returned to his bombed-out family business following World War II,his first act was to compose a company history. Knowledge of the company's history provides a meaningful anchor for sustaining continuity with keymarkets, particularly for companies short of customers.
168

Practical Lessons on Market Continuity
· Successful companies nurture, protect, and develop products for historical markets before moving into new markets. Unsuccessful companies oftenleave historical markets unprotected.
· Successful companies actively preserve product identifiers, such asnames, product colors, advertising, or product attributes, that retaincontinuity with historical markets. Unsuccessful companies frequentlychange product identifiers.
· Successful companies assume that markets are captured on the basis ofmerit arising from better products and service. Unsuccessful companiesoverestimate the importance of the strategic selection of markets.
· Successful companies are able to more accurately gauge the rate ofchange in markets and provide products that are in phase with changes.Unsuccessful companies are frequently out of phase.
· In order to preserve investment and field a wide variety of products tocover different circumstances, successful companies are less inclined tototally discard products. Instead, they adroitly stash products and featuresthat they believe will be useful at other times or extend product lines inother ways. Unsuccessful companies time product announcements poorly.
Case Histories
The severe recession of the early 1980s dealt harshly with both Chrysler and AMC/Renault. Both suffered harsh declines in unit sales and both lostmoney. AMC/Renault should have been better off because the combinationof recession and higher oil prices was moving at least some buyers closer tothe firm's historical market. As the customers approached, AMC/Renaultbegan to shift position and outmaneuver the approaching customers byconfusing them with new names, new styles, and unfamiliar products.Chrysler Corporation's situation was much more serious and more needed tobe changed. Yet, Chrysler management doggedly clung to the protection ofhistorical markets.
The Turnaround Experience: Real World Lessons in Revitalizing Corporations and Organizations

Case 10 — Saving the Best of Chrysler CorporationThe revival of Chrysler Corporation in the 1980s is a story of triumph andtragedy. It was indeed a grand triumph for the firm to regain the profitabilityand prominence it had experienced at an earlier time in its history. It was tragic to see the economic difficulties of the early 1990s send the company into anew crisis.
Mistakes were made during the Chrysler turnaround, but most of them madewere after 1986. During the earlier period of recovery, what was accomplishedwas remarkable. Several other authors (e.g., Abodaher 1985; Reich andDonahue 1985) have covered the Chrysler Corporation in great detail, so thefull story will not be recounted here. But some interesting aspects of theChrysler turnaround of the 1980s should be underscored so that it might becompared with other cases. In some important respects, the main themes weresimilar — efficiency, quality, innovation, leadership. But it was one of the most complicated and ambitious turnarounds in history. Chrysler Corporation had togreatly improve product quality, develop and bring to market entirely newmodels of cars, achieve more efficient production, nurture the loyalty of keyvendors, mend fences with its anxious and depleted work force, and restore the confidence of its dealer network, all at lower cost.
The company's financial situation before the late 1970s was extremely severeand required dramatic steps in financial restructuring which tended to dominatethe news. However, the publicity surrounding the financial restructuring partlyobscured the operational and cultural steps that were taken in order for thefirm to survive. Certainly the loan guarantees and the financial restructuringsdid set the stage for the revival of Chrysler Corporation. But Chrysler neededto restore the effectiveness of its dealer network, dramatically reduce overheadcosts, trim losing operations, make investments to raise cash, and design carsthat would sell before it could effect a full operational turnaround. In addition,Chrysler plants had to attain new levels of productivity and efficiency, all whileworkers and managers labored with reduced compensation.
The ability of Chrysler's leaders to establish credibility was key in implementingthese crucial operational steps. Chrysler managers had to demonstrate theircommitment to the principle of fairness. When overhead was trimmedsubstantially and executive pay was reduced, a workable arrangement with theunion became possible — as did a deal with the banks and the government.However, as a part of these agreements, Chrysler had to establish that it coulddeliver completed designs of salable automobiles on time and in the face ofmassive personnel cuts. Ultimately, the success of the turnaround rested on ahigh degree of cooperation with organized labor and Chrysler's development ofa whole new line of differentiated products, which were adroitly marketed toChrysler's historical markets.
170

An extremely important element of the Chrysler turnaround strategy was thesubstantial reduction of cost. During the turnaround, Chrysler reduced costsfrom more than $16 billion to less than $10 billion. Adjusted for inflation, thisrepresented a reduction of nearly 60 percent. Salaried and production staff were reduced in approximately the same proportion — each by about 50 percent.Worldwide, Chrysler employed more than 250,000 people in 1977 (Moody's1984). By 1983, Chrysler's employment was down to 97,000. The Chryslerbreakeven point was cut from 2.5 million cars to 1.2 million cars.
To achieve this increase in productivity along with a simultaneous reduction incost, Iacocca sought and received the cooperation of the United Auto Workers, then headed by Douglas Fraser. Fraser helped immeasurably in working outdelicate arrangements with the union membership, in exerting political pressureto obtain approval of the bank guarantees, and in serving as a highlycompetent, savvy, and experienced company director. In 1985, Douglas Fraserwas awarded an honorary doctorate of laws by the University of Notre Damefor his many accomplishments including his role in the Chrysler turnaround.Lee Iacocca gives similar credit to Fraser and goes on to emphasize the needfor government, management, and labor to work together in the revitalizationof our basic industries (Iacocca 1984).
Few people recognize the sacrifices made by the Chrysler workers during theturnaround of 1979 to 1982. Not only had employment been decimated by thelayoffs instituted under Ricardo and Iacocca, but wage concessions amountingto hundreds of millions of dollars were agreed upon on two occasions and insome cases required as covenants to the loan guarantees. In 1982, the averagehourly wage for Chrysler workers was approximately 80 percent of what it wasfor Ford and GM counterparts.
Yet, even against considerable odds, and with a substantially reduced staff, the“new Chrysler Corporation” achieved its goals: revitalizing its dealer networkand bringing out a new family of cars on time. Chrysler's decision toconcentrate production on one basic platform, thereby reducing the number ofparts needed to produce a variety of automobiles, was key to achieving thesegoals (see Table 9-2).
The Turnaround Experience: Real World Lessons in Revitalizing Corporations and Organizations

Table 9-2 Chrysler Manufacturing Statistics 1980 and 1986
1980 1986
Daily vehicle production (units per day) 4000/day 8000/day
Steel inventories at stamping plants (no. Of days’ supply) 32.6 days 6.0 days
Assembly plant inventory turn ratio (sales to inventory) 16.8 47.5
Total inventory turn ratio (sale to inventory) 6.6 8.0
Number of faults/front-drive vehicle Down 42%
Warranty work Down 25%
Reference: Mechanical Engineering, p. 55 to 59, July 1987.
The character of Chrysler's leaders clearly played a role in the second Chryslerturnaround. Lee Iacocca's willingness to work for less pay, his ability to clearlyarticulate ideas, his willingness to accept the historical expertise of ChryslerCorporation as a building block for the infusion of new values, and his generallove for the automobile all helped him enlist employees, dealers, creditors, andcustomers as partners in the turnaround process.
Both revenue and profits returned, and the company learned to make a profiton a much lower level of production. In 1978, Chrysler Corporation producedmore than 1.1 million cars and lost $ 205 million. In 1984, the companyproduced more than 1.1 million cars and made a profit of $ 2.3 billion. Market share increased in 1984 and again in 1985. As can be seen from Table 9-3,there has been distinct improvement. This improvement was preceded by somefinancial restructuring, but the true strength of the turnaround lay in soundpractices of manufacturing engineering, timely product development, wholesome working relationships with employees and vendors, and attention to thebusiness the company was in at the time.
Unfortunately, as Iacocca himself has admitted, mistakes were made and hispersonal reputation for vigor and resourcefulness began to recede in the late1980s. Preoccupation with other ventures, the Statue of Liberty, two books, and other personal involvements took some time away from Chrysler Corporation.Misguided strategic moves, including an expensive foray into the defensebusiness, an aborted joint venture with Maserati, and the costly movement ofOmni and Horizon production to an AMC plant on the verge of closure,siphoned resources away from the pressing problem of revitalizing Chrysler'smainstay products. The AMC acquisition worked out well regarding the Jeepbut not well at all regarding the Renault-sponsored vehicles. The creation of anoverlapping holding company confused channels and increased cost. Chrysler'sbreakeven point, which had declined to 1.1 million vehicles in 1985, had risento 1.9 million vehicles by 1989.
172

Table 9-3 Chrysler Corporation Unit Sales, Revenues, and Profits
Year Domestic units Total sales ($000) Domestic profits
($000)
Unit market share
%*
1976 1,333,401 15,537,800 422,600 13.34
1977 1,236,359 16,708,300 163,200 11.19
1978 1,126,164 13,618,300 (204,600) 10.09
1979 928,618 12,001,900 (1,097,300) 8.79
1980 638,974 9,225,300 (1,709,700) 7.12
1981 749,648 9,971,000 (475,600) 8.78
1982 600,502 10,040,000 170,000 7.53
1983 903,533 13,240,400 700,900 9.84
1984 1,163,221 19,573,000 2,380,000 11.19
1985 1,219,931 21,255,400 1,635,000 11.05
1986 1,308,991 22,886,300 1,403,600 11.43
1987 1,091,904 26,279,100 1,289,700 10.62
1988 1,000,000 31,884,200 1,050,200 10.92
*Automobiles only, not minivans and light trucks.
The turnaround of Chrysler Corporation lingered on for several more years,with ups and downs, before the company was ultimately acquired by DaimlerBenz in the late 1990s. Questions will always remain as to whether it was fullysuccessful over the long term. However, there can be no doubt that substantialprogress was made from 1980 to 1987. The Chrysler turnaround of the 1980sranks as one of the most ambitious in the history of the country because itinvolved a complete reorientation of product development, production, andfinance as well as heavy coordination with both government and organizedlabor.
The Chrysler turnaround had attributes in common with the Cadillac, Nash,Deere, and American Motors turnarounds in that a key element of the strategywas to develop a wide variety of products from the same set of common parts, while improving overall product quality. As we have seen in other cases, fairplay toward employees, creditors, suppliers, and customers was a centralelement in the progress made. But, in particular, the Chrysler turnaroundavoided one mistake that is commonly made — the desertion of historicalmarkets as new markets are cultivated. The capitalization on the alreadyestablished Omni and Horizon, the nurturing and improvement of the K Car,the strengthening of relations with existing dealers, the retention of familiarChrysler names such as New Yorker, Imperial, and Town and Country allhelped to retain continuity with customers. In the specific sense of marketcontinuity, the Chrysler turnaround of the early 1980s was laced with wisdom.It will always be wondered if a separate Chrysler Corporation could havecontinued to nurture the spirit of innovation and cooperation that madeprogress possible.
The Turnaround Experience: Real World Lessons in Revitalizing Corporations and Organizations
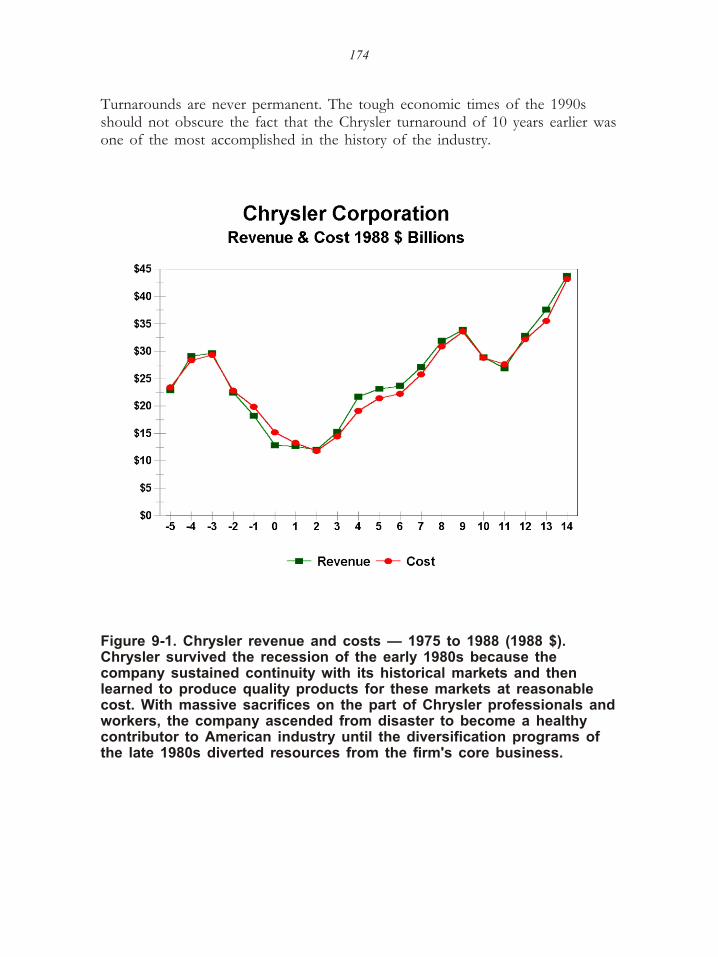
Turnarounds are never permanent. The tough economic times of the 1990sshould not obscure the fact that the Chrysler turnaround of 10 years earlier was one of the most accomplished in the history of the industry.
Figure 9-1. Chrysler revenue and costs — 1975 to 1988 (1988 $).Chrysler survived the recession of the early 1980s because thecompany sustained continuity with its historical markets and thenlearned to produce quality products for these markets at reasonablecost. With massive sacrifices on the part of Chrysler professionals and workers, the company ascended from disaster to become a healthycontributor to American industry until the diversification programs ofthe late 1980s diverted resources from the firm's core business.
174
Chrysler Survived Because…
· Labor and management worked cooperatively to restore the health of thecompany.
· Both labor and management played exemplary roles.
· Continuity was maintained with major historical markets.
· Costs were reduced to current levels of revenue. Revenue was notexpanded to cover costs.
· A wide variety of products was produced from the same componentsparts.
· Operational efficiency dramatically improved.
· Inventory efficiency dramatically improved.
Case 11 — Market Vacillation at AMC/RenaultIn 1973, American Motors sold more than 500,000 vehicles, had roughly a 5percent market share, and operated at a nearly 5 percent after-tax margin. Tenyears later, the firm produced 383,000 vehicles and lost $146 million dollars.From 1980 through 1986, the firm lost $794 million; it was acquired byChrysler in 1987.
It seems ironic that such hard times would fall on American Motors because,for much of the twentieth century, AMC and its predecessor, Nash Motors,enjoyed one of the strongest records of consistent profitability. From 1916 to1931, Nash profit rates were among the best in the industry. During thedepression, the firm conserved cash and emerged from World War II inexcellent financial shape and again with excellent profits. The GM and Fordsales war of the 1950s put pressure on the independent producers. The mergerwith Hudson was in part a response to this pressure. The problems resultingfrom this competitive pressure were adroitly handled by George Romney,AMC's CEO from 1955 to 1963. The firm once again became both healthy and prominent.
Romney left American Motors in 1963 to become governor of Michigan. Hissuccessor was the company's sales manager, Roy Abernathy. Abernathy was inturn succeeded by the son of a founder of the Hudson Motor Car Company.Roy D. Chapin, Jr. became CEO of American Motors in the late 1960s.
The future looked bright for AMC during the early 1970s. The oil crisis waspushing buyers into AMC's traditional marketplace. The company sold arespected line of intermediate cars including a well-received economical butnearly full-size station wagon. There was some confusion in the marketplace
The Turnaround Experience: Real World Lessons in Revitalizing Corporations and Organizations
because the highly successful Rambler had been replaced by a new car calledthe “Hornet” (the name of Hudson's leading model during the early 1950s).The rear of the Hornet was then truncated to produce the Gremlinsubcompact, which shared most of its components with the Hornet. Even theAMC muscle cars, the Javelin and the AMX, were popular in the marketplace.The long-established AMC six-cylinder engines were well constructed, withseven main bearings and strong components, and were considered to be among the industry's most durable sixes. The company's V8s, which shared manycomponents with the sixes, also performed well. Sales of the AMC models were robust, and the newly acquired Jeep operations broadened the company'sproduct line even further.
In 1975, the firm announced an innovative new car called the Pacer. The Pacerwas billed as the industry's first wide small car. The handling of the car wassuperb because of the wide tracking, rack and pinion steering, and disk brakes.An innovative electric overdrive gave the car very good performance and goodeconomy. Visibility was excellent. The front seats were very comfortable, andthe rear seats were on a par with today's models. To ease passenger entry tothe rear, AMC engineers creatively made the right door 4 in wider than the left door.
The Pacer was an initial sales success. About 150,000 were shipped during thefirst year of production, which was an impressive figure for an independent.Though industry sales declined, AMC's physical unit market share remained at7.4 percent. But, the firm had difficulty producing the Pacer, and thepositioning of the car in the marketplace was suboptimal. Though the Pacershared many mechanical components with other AMC cars, it also had manydifferences. The engines and automatic transmissions were the same, but thefront end, steering, suspension, and many body-hardware mechanisms were alldifferent. When the early sales of the Pacer outstripped production, AMC wasforced to make some awkward and time-consuming production changes.
Pacer's final design did not meet specifications; it came in almost 500 lb abovethe targeted weight. Manufacturing costs rose, and AMC's gross profit ratedeclined from 15.16 percent in 1973 to 8.7 percent in 1975. AMC lost $35million in 1975 and $34 million in 1976, the peak sales year for the Pacer.
In addition to production problems with the Pacer, the car was probably notpositioned properly in the marketplace. The original Pacer had weight, gearing,and performance characteristics similar to those of the more popular models of the Mercedes-Benz. It was a very good road car. But, the initial Pacers weremarketed as a low-priced small car, and that is the image that took hold. These first cars had spartan interiors encased in inexpensive-looking plastic. The rearwindows did not open, thus limiting ventilation, and the bottom one-third ofthe body, with its pronounced inward curvature, tended to rust.
176

Curiously, AMC offered some options that corrected many of these deficiencies, such as vent windows front and rear, attractive fender flaps, and, later on, anup-scale “Limited” edition with extra sound deadening, many conveniencefeatures, and all-leather premium upholstery. But, before these later programstook hold, the Pacer had been promoted as a cheap car. This problem wascompounded by the fact that workmanship on some of these cars had declined to levels lower than usual for AMC products. The Pacer could have emerged as a well-designed lower- to medium-priced high-quality innovation car. Whatactually emerged was a cheap car of unusual design and poor constructionwhich was manufactured at high cost and lacked the convenience features oftraditional AMC products.
American Motors' management went through many transitions during the 20years that followed Romney's departure. Roy Abernathy followed Romney asCEO. Under Abernathy, the Rambler's size increased while its quality decreased. Roy D. Chapin, Jr., the son of the former Hudson chief executive and AMC'sfirst treasurer, was the next chairman. Chapin pushed new cars and new,unfamiliar names but at the expense of continuity in the marketplace. Following Chapin was Gerald Meyers, the former executive vice president and RoyChapin's son-in-law. Meyers was the executive most closely associated with thePacer's development and production. As American Motors became pressed forcash because of declining production efficiency and subdued productinnovation, AMC sought a financial and technical partner. In 1979, AMC madean arrangement with Regie Nationale des Usines Renault for financing, jointmarketing, and the joint development of a new car. The arrangement withRenault brought in another company leader, Jose. J. Dedeurwaerder, whorepresented the Renault interests. AMC cars became more like their Europeancousins. Joseph E. Cappy, formerly of Ford, served as AMC's chief executiveofficer in the mid-1980s. Many other officers changed as well. Along with these managerial changes came many changes in AMC's relationship to themarketplace.
For reasons that are difficult to understand, AMC seems to have had greatdifficulty offering a consistent set of products, names, and images to itsmarketplace. For more than 20 years, AMC did not have a consistent name for its make of automobiles. Under Romney, the focus was clear — the companymade Ramblers. Ramblers sold well and gained a well-recognized identity. Butunder Chapin, a Hudson man, Rambler was replaced by the Hornet (a heavierHudson model produced in the early 1950s). The Hornet was replaced by theConcord, which in turn was replaced by the Renault Alliance and the RenaultEncore. The names of its intermediate-sized cars also created confusion. First,the make of the car was the Rambler and the model was the Ambassador.Then the make was called the Rebel and then the Matador, and then
The Turnaround Experience: Real World Lessons in Revitalizing Corporations and Organizations

production was cut. During this same time, the competition was presenting amore consistent image of its products.
American Motors management under Romney in the 1950s and early 1960sdisplayed a far more cultivated feel for the marketplace being served. Thesepeople realized that a considerable number of American consumers liked theattributes of a compact economy car, but they did not want to buy a foreigncar. The Rambler American was designed for this audience. When AMCdropped the Concord and renamed its successor the Renault Alliance, manyAMC loyalists were alienated.
In addition to the problem of names, the firm over time withdrew some of itsmost successful models from the marketplace without offering successormodels. The well-designed intermediate station wagons of the late 1960s grewlonger during the 1970s and then were dropped in the late 1970s. Suddenly, acompany whose models sold well to the station wagon marketplace had no real station wagon (on a car chassis) except the very small and not very utilitarianHornet —which was more like a less practical hatchback. The Javelin and AMX sports cars were curtailed without replacement. The whole intermediate serieswas canceled. Finally, the rather popular Concord series was dropped at aboutthe same time that Ford introduced two new models that were nearly identicalin appearance and dimensions — the Ford Tempo and the Mercury Topaz.
During the past few years, AMC did build some cars that had the potential fordifferentiation. But, the confusing and inconsistent manner in which they haveapproached the marketplace has made it difficult to develop continuity withpotential buyers. In addition, the firm's historical emphasis on quality and valuedeclined.
While these actions are unfolding, AMC's market share shrank substantially. The sale of conventional automobiles (not Jeeps) declined from 485,000 in 1970 to150,000 in 1985. Market share had gone from over 7 percent without Jeep to 4 percent with Jeep. From 1974 to 1985, total unit sales had declined from545,000 to 392,000, and market share had slipped from 7.5 percent to 4.6percent.
Sales drifted still lower in 1986 and 1987 and in early 1987, AMC's passengercars fell to under 1 percent of total industry sales. In 1987, what was left ofwhat at one time had been one of the most profitable and successful firms inthe industry was absorbed by Chrysler Corporation.
What happened, of course, is along the way American Motors lost its historicallegacy of internal efficiency. Gross profit rates were well above 20 percent formuch of Nash-AMC history. By the early 1980s, gross profit rates had declined to 7.6 percent. Inventory turns per year, once a hallmark of Nash productionexpertise that often approached 20 to 1, declined to 5 to 1 in the early eighties.
178

The central theme of earlier Nash strategy had been to operate efficiently andthen use some of the savings to improve product quality and differentiation.This successful strategy was lost during the 1970s and 1980s, when the firmbecame a high-cost producer of insufficiently differentiated products which were offered without regard to market continuity (Figure 9-2).
Figure 9-2. AMC/Renault market share — 1974 to 1986. In 1974,AMC/Renault produced 1 of every 13 U.S. cars. After an almostsystematic neglect of historical markets, AMC/Renault's market sharedropped to under 2 percent by 1987, when the firm that had been, atone time, one of the most efficient producers in the industry ceasedoperations as a separate company.
AMC/Renault management became involved in many issues unrelated to theinitial core business of producing high-quality reasonably priced fuel-efficientautomobiles. The company acquired Jeep, AM General, Wheel Horse Products(garden tractors), and other companies. The company sold Kelvinator and, later on, AM General. It formed a long-term joint venture with Renault and with the People's Republic of China. But it couldn't generate enough internal cash todevelop a smaller-displacement fuel-efficient engine, an essential requirement to
The Turnaround Experience: Real World Lessons in Revitalizing Corporations and Organizations

the markets being served. By the early 1980s, AMC/Renault engines hadapproximately twice the displacement of those of other manufacturers in theirprice class. The penalty paid in fuel consumption eroded a long-standing AMCcompetitive edge. Though durable, the engine's basic design was over 50 yearsold.
As with many other unsuccessful turnaround cases, the AMC/Renault case is asad one. AMC began the 1960s with a clearly articulated mission which wasbeing executed in an efficient manner by creditable managers with extensiveindustrial experience in the markets being served. What transpired over timewas a lack of attention to detail, a dearth of incremental improvements, andvacillation as to how to address the markets being served. By the mid-1980s,AMC/Renault employment had declined to less than two-thirds of its peakemployment of 33,000 and was still dropping. Sales of passenger cars in early1987 fell to less than 1 percent of the market. The company could have donemuch better.
AMC/Renault Failed Because…
· Continuity with major historical markets was not preserved.
· Operational efficiency declined.
· Manufacturability was lacking in key high-volume products.
· Quality declined.
· The company failed to develop new products with technically meaningfulfeatures and benefits.
· Managerial stability was lacking.
· Old values were not used as the foundation of new beliefs.
· Historical markets were starved by unproductive diversification.
180

Part 4
Leadership and the
Turnaround Organization
Money, low-cost operation, product quality, and distinguishing features areall helpful to the company in trouble — but they may not be forthcoming ifthe firm lacks leadership. Yet leadership is a term open to interpretation.Some people take leadership to mean an impressive, outgoing personality,yet many of our greatest leaders are quiet and contemplative and not veryimposing as public speakers. Some people equate leadership with notorietyor general business experience, although the evidence suggests that notorietywears out quickly and that general business experience does not alwaysindicate whether the person knows what to do in certain industries. Othersliken leadership to goal direction, objective setting, and the creation offormal plans and strategies. Yet, evidence also suggests that the best plansare flexible and adaptive, often blended with the culture of the firm, andconveyed informally via unwritten messages and managerial actions.
Leadership is undeniably of crucial importance, and successful turnaroundmanagers exhibit distinctive leadership characteristics which are seldompresent in managers of unsuccessful turnarounds. Effective turnaround agents focus the attention of the firm on operational issues, such as enhancing theproduct, reducing cost, and improving product quality and customer service.Ineffective turnaround agents lead the firm to acquisitions, financialrestructurings, or other activities less central to the firm's major business.Successful turnaround leaders are often people with extensive experience inthe industry being served, while unsuccessful turnarounds are often headedby people from other industries. The functional background of successfulturnaround leaders is often technical — either manufacturing or engineering— perhaps because these disciplines provide a basic grounding in productsand customer requirements. Unsuccessful turnaround managers frequentlyhave functional backgrounds in finance or sales. Successful managersconscientiously seek sufficient knowledge in areas crucial to importantdecisions, rather than relying solely on readily available information.Successful turnaround leaders utilize the company's historical skills as a basis for new strategic initiatives and are alert to industry trends. Unsuccessfulturnarounds often involve inconsistent strategies, poor forecasting, and a lack of awareness of technological and industry trends. Successful turnaroundsoften involve a high degree of managerial stability in which the top
The Turnaround Experience: Real World Lessons in Revitalizing Corporations and Organizations
leadership remains constant for many years, often more than 10 years andoccasionally more than 20. Finally, although it is difficult to obtain hardevidence, there are sample suggestions that successful turnaround agentsoften foster an atmosphere of traditional morality involving characteristicssuch as sobriety, thrift, hard work, and honesty and exhibit great fairness indealing with employees, creditors, stockholders, and customers.
Both successful and unsuccessful turnarounds do some things well and somethings less well. Most turnarounds experience a mixed set of difficulties,skills, strategies, and luck. Successful turnarounds involve more consistencyand a greater propensity to focus on managerial basics such as operationalefficiency, product improvement, and the work ethic of the organization. Asthey work through a much longer list of top managers, unsuccessfulturnarounds occasionally manifest these same traits, but usually not for longperiods.
Part 4 discusses the qualities of successful leadership and the turnaroundorganization. Chapter 10 describes the practical aspects of outfitting themanagement team. Chapter 11 entreats the turnaround manager to focus onpresent operations. The pivotal role of fair play in turnaround management is covered in Chapter 12.
182
Chapter 10 — Outfitting theManagement Team
Though the leadership qualities of the CEO profoundly affect successfulturnarounds, one person alone seldom reverses the adverse fortunes of acorporation. Turnaround success requires teamwork, and the team's makeupis decisive. Thus, most companies that succeed have deep teams, with manyindividuals sharing both responsibility and the spotlight. In the wars forcorporate survival, the victorious CEOs are often trustworthy, mild-mannered people with good negotiating skills who can share center stage and motivateothers to reach for greater accomplishments. They seldom act alone.
Because the company in trouble cannot afford additional failures, allelements of the company must be competent. Seldom are enough resourcesavailable to permit success if even some departments are operating poorly.The turnaround process is a team event, and each functional area must do its job well. Sales must sell, manufacturing must produce quality productsefficiently, and the financial team must keep the company operating withinits resource base. Each element of the team must be effective and havespecial characteristics.
The Management Team
The Chief Executive
The characteristics needed by the chief executive reflect both the nature ofthe company's difficulties and the special organizational dynamicssurrounding turnaround situations. Because of the typical requirement toimprove quality while costs are being reduced, the individual should haveindustry and technical experience, as well as managerial experience. Because of the frequent need to obtain further cooperation from creditors, employees,dealers, and investors, he or she needs to radiate fairness and honesty. Theindividual needs to explore the environment and determine what informationhe or she needs in order to address the weighty questions being faced andmust be able to separate what the firm does well from what it does lesswell. The individual should also have stamina and perseverance. Companiesin trouble do not react well to frequent managerial changes.
Beyond these tangible qualifications, turnaround CEOs should have another,more subtle and somewhat contradictory attribute: The chief turnaroundagent must attract enough attention to be noticeable and distinguishable, yetnot so much attention that all the credit redounds to this one person. This isa delicate balance for what is often a high-profile job. If the CEO is anoverly polite, amorphous functionary, with few technical ideas and little
The Turnaround Experience: Real World Lessons in Revitalizing Corporations and Organizations

experience with the company's business, it is doubtful that people within thecompany will see the CEO as credible. On the other hand, if the CEOmonopolizes all the credit when progress is made, the hard-working peoplewho contribute to that progress may feel that their extraordinary efforts arenot being recognized. The CEO must be a visible champion of ideas and anadvocate for change but in a nurturing way that makes it possible for othersto share in accomplishments.
Experience in the industry being served eases the difficulty a CEO has inturning a company around. Regardless of the intellect a turnaround managermay possess, there are some elements of knowledge that simply cannot bederived from logic. In seven of the nine cases discussed in this book, thesuccessful turnaround agents had extensive experience in the industry. Theother two had extensive experience in closely related industries. In the seven unsuccessful cases, the turnaround agents were often unfamiliar with theindustries in which they were operating. Successful firms displayed a greater inclination to promote from within, while unsuccessful firms exhibited aproclivity to bring in outsiders.
Technical experience is also helpful to the CEO because of the pressing need to lower costs while simultaneously providing better products. Six of thenine successful turnarounds were headed by manufacturing people. One washeaded by a product development engineer. The other two were headed byindividuals with extensive product experience in the industry. None of thesuccessful turnaround agents were financial people, and only Iacocca had afunctional background primarily in sales. Iacocca's sales experience, however, was preceded by a bachelor's degree in engineering from Lehigh and amaster's degree in engineering from Princeton—all accomplished in 4 years.Also, his first assignments at Ford were in engineering. Financial people and salespeople were more numerous among the unsuccessful cases (Table 10-1).
Successful turnarounds also involve a much greater degree of managerialstability — an average of 16 years on the job for successful turnaroundagents versus 4.3 years for the unsuccessful. While top managementremained constant for many years at the successful firms, unsuccessfulcompanies occasionally fielded a new chief executive every year or two orthree. Greater consensus among top executives and the board of directors isalso present at successful companies. Bickering between and amongmanagers and directors was the case with Studebaker, Kaiser-Frazer, andseveral other unsuccessful firms.
Differing viewpoints often emerge during a troubled business situation, andin order to reverse the adverse trends of a company in trouble, some changes must be made. What needs to change and what does not is, of course, one of the CEO's most delicate decisions. Successful managers spurn sweepingchanges in favor of incremental changes in strategies, policies, andmanagerial appointments. Old values are used as a foundation for newbeliefs, and appreciation is shown for the positive contributions of peoplewho were part of the organization at the time problems developed.
184

Table 10-1 Backgrounds of Chief Turnaround agents
Case Name of chief turnaround
agent
Main functional areas Industry or
related
experience
Successful Cases
Cadillac Leland Manufacturing Yes
Buick Nash/Chrysler Manufacturing/Manufacturing Yes/Yes
Jeffery (Nash) Nash Manufacturing Yes
Maxwell-Chalmers Chrysler Manufacturing Yes
Packard Macauley Law and manufacturing Yes
Deere Wiman Engineering Yes
American Motors I Romney Manufacturing Yes
Chrysler Iacocca Engineering and sales Yes
Ford Petersen Engineering and productdevelopment
Yes
Unsuccessful Cases
Willys-Overland Chrysler/Willys/Others Mainly sales Yes
Hudson Chapin/Mcean’y/Chapin/Barit Finance and sales Yes
Studebaker-Packard Nance/Francis/Churchill/Egbert/Others
Finance, Sales, andManufacturing
Some
InternationalHarvester
McCardell/Menk/Lennox Finance and thenManufacturing
Little
Allis-Chalmers Scott/Bueche Finance & engineering Little
Kaiser-Frazer H. Kaiser, Frazer, E. Kaiser Construction & sales Little
AMC/Renault Chapin/Meyers/Deudeweader/Cappy
Sales, manufacturing, andother
Yes
The ability of chief turnaround agents to gain the trust of employees,creditors, and customers was a positive force in several turnaround successes. For the successful and unsuccessful firms alike, the trustworthiness of thetop management team became a factor in rallying the troops to put forth theextra efforts needed for a turnaround. CEOs like Petersen, Wiman, Romney,Chrysler, Iacocca, and Nash were somehow able to elicit enough trust tomobilize the companies, whereas organizations remained suspicious ofunsuccessful CEOs (Table 10-2).
The Financial Team
Top financial people need not have exhaustive knowledge of the more exotic branches of corporate finance, but they do need to know the business. Theyshould also possess good negotiating skills and be regarded as dependable by the present and potential creditors. But most important, they must know thebusiness. During Chrysler's successful period in the 1930s, B. E. Hutchinson, Chrysler Corporation’s top financial executive, knew the business very well.An experienced production supervisor, he could interpret terms like directlabor, material cost, overhead, and productivity in realistic terms.
The Turnaround Experience: Real World Lessons in Revitalizing Corporations and Organizations

The great inventor Charles F. Kettering once noted that organizations losetheir effectiveness when they begin substituting symbols for things. Ketteringsuggested that it is all right to use a symbol for a thing if you fullyunderstand what the thing is. The inability to comprehend the organizationaland technical factors behind symbols appears to be a fundamental problemwith many financial and accounting people at unsuccessful firms. Theysimply do not understand the crucial dynamic relationships underlying thefinancial reports, and often they are disinclined to find out.
Table 10-2 Top Management Characteristics of Turnaround Organizations during thePeriod of recovery
Top
management
industry
experience
Top
management
technical
experience
Managerial
stability
Knowledge
exploration
Incremental
change
Successful Cases
Cadillac Yes Yes Yes Yes Yes
Buick Related Yes Yes N/A Yes
Jeffery (Nash) Yes Yes Yes Yes Yes
Maxwell-Chalmers Yes Yes Yes Yes Yes
Packard Yes Yes Yes Yes Yes
Deere Yes Yes Yes Yes Yes
American Motors I Yes Yes Yes Yes Yes
Chrysler Yes Yes Yes Yes Yes
Ford Yes Yes Yes Yes Yes
Unsuccessful Cases
Willys-Overland Yes No Some No No
Hudson Yes No Some No No
Studebaker-Packard No No No No No
InternationalHarvester
No No No No No
Allis-Chalmers No Some Some No No
Kaiser-Frazer No No Some No No
AMC/Renault Yes No No No No
George Gleeson, a financial consultant for troubled companies, sharesKettering's caution against short-cutting a thorough understanding of thebusiness. He deplores the inappropriateness of discussing strategy, mission,business segments, and long-range plans when nobody is selling the productor collecting the money. Gleeson once described the unspecific globalismrampant in some corporations today as “like trying to paint the SistineChapel with a four-inch brush.”
Just as American students need a more thorough understanding of scienceand mathematics in order to compete in today's global economy, financial
186

staff members of troubled companies must thoroughly understand thebusiness in physical and scientific, as well as symbolic, terms. This needaffects where financial people spend their time. You will not find Gleesonpouring over the latest standards of the American Institute of Certified Public Accountants, nor will you find him researching the latest techniques offinancial manipulation. You will find him out talking to the productionpeople about reducing scrap and inventory or working with dissatisfiedcustomers to resolve whatever problem is keeping them from paying theirbills. These actions bring long-term success.
Robert Townsend once described the position of controller as the conscienceof the organization, and he implored the controller not to treat the CEO asthe chief customer. The operating people are the customers. The financialteam must have the respect and participation of the operating units.
The Product team
The product team must not only be able to develop new products, it must be able to develop substantially better products which can be produced at muchlower cost, and it must accomplish this in shorter periods of time. These arethe requirements of today's marketplace—even for companies in the strongest market position. Some companies take the task too lightly and developproducts which are only different, not better and not lower in cost. Often,they compound these errors by taking too long.
As Ford's fruitful experience with the Taurus/Sable project demonstrated,today's product teams are composed of people of various ranks andresponsibilities across the corporation. Effective product developmentinvolves manufacturing and engineering along with purchasing, legal,marketing, service, and other support activities. The product team must work with all these constituencies in a collaborative manner and still take chargeof the project. Ford's term for it was “program management.” In othercircles, the term “simultaneous engineering” has been used to describe theprocess of developing the product in an iterative manner involving manydisciplines.
Unsuccessful firms often have dogmatic product teams, occasionally headedby the CEO. Many times their vision is clear but, unfortunately, incorrect.Unsuccessful product teams frequently think that they are brilliant, and thusthey employ fewer of the interrogating techniques and cross-checks thattypify successful projects like the Taurus. The Taurus project was successfulbecause Ford paid painstaking attention to the requirements of manyconstituencies and then realistically appraised the design of Ford productsversus that of competitors. Unsuccessful product teams often profess to know all the answers, thereby denying themselves valuable insights from associates and customers.
Product teams may commit another error—taking too long. Most probably, it would have been in the best interest of GM to field an earlier response tothe Ford Taurus, but the immensity of GM's bureaucracy worked against the
The Turnaround Experience: Real World Lessons in Revitalizing Corporations and Organizations
timely completion of this important development program. By the time theproduct hit the sales floor, the U.S. car market was in decline. So it was also with Packard's V8, Hudson's replacement for the step-down sedan, ControlData's replacement for its Cyber series, and many other projects.
These dual problems of conceit and procrastination hinder the corporation'sability to survive in troubled times. A good product team avoids both. Teammembers, including top management, must be knowledgeable about theindustry and should possess up-to-date scientific and technical knowledge, as well as managerial skill. They must be open to new ideas and be willing tostudy how other competitors or industries solve their problems.
The Sales Team
Lyle Altman, one-time CEO of Network Systems described it simply. Agood salesperson is one who sells. For the struggling firm without muchtime, this may mean knowing the customers in personal, as well asconceptual, terms. This distinction is important.
The revenue-expansion strategy is both risky and time-limited as the soleremedy for a troubled firm. Yet, attaining sufficient revenue is clearlypreeminent, and good salespeople are indispensable to a firm's survival.Unfortunately, limited understanding of both the sales process for theindustry and the specific customer base of the company leads manycompanies in trouble to seriously mishandle their sales organizations at themost unfortunate times. They sometimes make too many changes, at thewrong time, and for the wrong reasons—with disastrous results.
Sales are most often slow at troubled companies because of low productquality, lack of differentiating features, high prices, a bad economy, distresson the part of key customers, or even ineffective sales administration. Often,the sophomoric answer is to bring in “stronger” sales or marketingexecutives. In some circumstances, this may be warranted. In other cases, itmay create problems for these reasons:
1. The new sales or marketing executives may not be competent. They may bein the job market because they were ineffective in their last job. Some salesand marketing people are far more effective at selling themselves than theyare at selling the company's goods. Personnel changes in marketing or saleswill not necessarily improve anything, though sometimes they may.
2. The old salespeople may be well respected within the organization. Goodsalespeople tend to be well liked inside, as well as outside, the organization.The chief executive or the board of directors may believe that strongermarketing people are needed, but the replacement of good salespeople mayhurt morale, particularly if the salespeople are hard-working.
3. New sales and marketing people may not know any of the customers. Sellingoften results from the salesperson's intimate knowledge of what a specificcustomer needs. It takes a great deal of time to accumulate this knowledge,and the pressing demands of the turnaround situation may not permit enough
188
time to bring new people through their learning curves. New sales andmarketing people may not sell enough, soon enough.
4. New salespeople almost always spend more. Their very presence, which isseldom inexpensive, often represents a signal to the organization thatadditional expenditures on marketing are now in vogue. If the new programswork, the company may (or may not) improve (see Chapter 4). However, theprograms may not work better, and the company may spend more money onthe sales function, sell less, and operate less profitably.
If the company is doing quite poorly, it may be necessary to make somechanges in the marketing and sales organizations. However, most successfulturnaround agents find it unwise to change too many things at once, lest theorganization lose its orientation. Most companies have some good people insales and marketing. Effective turnaround agents work to keep them.
Special teams
Companies in trouble often have special problems which need attention.These problems are often significant enough so that they should not betreated as the routine responsibilities of the functional departments of thecompany. The Packard turnaround of the 1930s, which involved offering amedium-priced car, required a resource to finance cars and an ability tomove larger volumes of used cars. Previously, most Packard customers hadpaid cash, and the low-volume sales of “senior” Packards meant thatused-car sales were not an important determinant of dealer profitability.Packard management recognized these two needs as integral to itsmedium-priced car strategy and recruited people who could address them.Similarly, the special teams at Ford during the 1980s were instrumental indeveloping new concepts of stamping-die design, which permitted areduction in the number of body side stampings from nine to two. Thisimproved both the quality of the fit and the profitability of the Taurus/Sableproducts. In the 1980s, Chrysler Corporation used special teams to work outthe complicated financial rearrangements. Walter Chrysler utilized specialteams to make full use of the well-equipped Dodge Brothers manufacturingfacilities.
During the hectic periods of a turnaround, many things must be done andsome of them are unusual. Unsuccessful firms often miss the opportunity toconcentrate special attention on important main events which, in some cases, may require carefully chosen additional skills. Special teams are importantbecause they divide responsibility along practical lines. Turnarounds arehectic enough without line managers becoming distracted with new specialtasks. Carefully selected, modest, easy-to-work-with special teams can takecare of some unusual special requirements while the rest of the organizationremains focused on the main business.
Personal Characteristics
The Turnaround Experience: Real World Lessons in Revitalizing Corporations and Organizations

Skills and competencies of the management team provide the foundation fororganizational improvement, but skills and competencies alone are notenough. The traumatic circumstances of a turnaround require the presence ofcertain character traits.
Pride versus Ego
With respect to turnarounds, there are two types of pride. One is helpful and one is not. It is helpful for the members of the organization to have pride intheir company and for the management team to reflect this pride. It is nothelpful for the management team to be overly preoccupied with its ownimportance. Charles Nash epitomized what was important in running abusiness: “Oriental rugs, factory administration buildings with imposinggranite columns and uniformed office attendants have no place in thesuccessful conduct of the automobile manufacturing business,” he would say. “I belong to the common people and I'm proud I do. I honestly treasure thegood-will and the respect and the confidence of the men working with meand for me more than all of the money I have ever made. If I didn't havethat—if I gave them cause to lose it...well I guess I wouldn't sleepnights.”(Kimes, 1977)
Chester Barnard suggested that each executive possesses a “zone ofindifference” with respect to the organization. Unless the decision isespecially controversial, the organization will tend to go along. Barnard alsosuggested that the zone of indifference varies greatly from one executive toanother because some are more trustworthy and more confidence exists withrespect to their leadership. In spite of what some executives think, membersof organizations do not think about them very much. Most members oforganizations are busy people, busy with their responsibilities, theircustomers, their families, and their own personal needs. Members oforganizations simply do not have the time to worry a great deal aboutexecutives unless their behavior falls outside a normal band of typicalbehavior. Nor is there great emotion regarding who should have executivejobs.
The fact that their existence is not material comes as a shock to someexecutives, who are amazed when their directives are not followed or theirmessages are not clearly understood or people do not know who they are.Nobody thinks about Chester A. Arthur very much any more. Yet his civilservice reforms have outlasted his personal notoriety as president of theUnited States. The capable executive recognizes that the only lastingnotoriety results from selfless dedication to the ideals of the organization and its people and its customers. The only lasting personal reward comes fromthe intrinsic quality in performing the managerial task. All members of theorganization feel that they are important and they are quick to pick up thesincerity, idealism, and humility of top management.
Justice
190

Unavoidably, the turnaround agent becomes the purveyor of either justice orinjustice, in hiring, firing, promotions, and retention. If justice prevails, anorganization's morale improves and the probability of a successful outcome is enhanced. If injustice prevails, organization members become disenchantedand success is far less probable.
Most companies in trouble employ highly dedicated, competent people aswell as individuals of lesser talent and fidelity. Almost always, in aturnaround situation, more people are employed than the company canafford. Choices must therefore be made regarding who goes and who stays.At this juncture the opportunity exists to either promote or retard justice.
Actions taken by management during this critical stage of head-countretrenchment send profound messages to members of the organization. Ifmanagement uses the occasion to correct long-term problems of poorattendance, theft, laziness, incompetence, and other weaknesses, it conveysthe message that the organization is serious about correcting its problems,and morale improves. If head-count reductions are arbitrary or unjust orpenalize the individuals most respected for their forbearance and expertise by the informal organization, they can hurt morale very deeply. Most people inorganizations want to be part of a class outfit, and successful turnaroundagents grasp this subtlety and work to provide an atmosphere of justice even as costs are reduced. Unsuccessful turnaround agents tend to be arbitrary,rather than just, and further damage morale with poorly thought-outpromotions or enlistments.
Perseverance
Turnaround efforts are long and arduous and require stamina on the part ofboth managers and workers. Some people are not up to it. They don't workhard enough or long enough.
Hard work, in a turnaround setting, means something different than simplyputting in long hours. Often, the people who are most respected for beingconscientious are not the people who spend night and day at work. Suchpeople are often viewed as narrow and incapable of balancing personal goals involving family and other considerations with professional goals. Instead,the people with perseverance budget their time very carefully. They seldomgolf during the workday. They don't usually play racquetball at lunch. Theystick to business. They don't spend too much time in meetings, but they doput in an honest day's work, often visiting customers or suppliers. Then they go home to do something else, and return early the next day to pursueobjectives with renewed vigor. That is perseverance in a turnaround setting.
Chester Barnard once mentioned that it is virtually impossible to getmembers of an organization to support a decision which conflicts with theirown personal moral beliefs. This is especially true regarding the building ofperseverance in an organization in trouble. Most people have no difficultywith putting in extra hours, without additional compensation, when thecompany is in desperate need. However, the prudent manager will recognize
The Turnaround Experience: Real World Lessons in Revitalizing Corporations and Organizations
that turnarounds go on for very long periods (usually about 4 years). Hence,to maintain perseverance, they avoid wasting people's time, so that energiescan be preserved for the most critical main events. Unsuccessful firms oftenwaste people's time and diminish perseverance by holding poorly plannedmeetings for long periods without taking action on the problems discussed,by attempting to gain consensus on trivial issues, or by foot dragging onthose key decisions that do need to be made. Too often, these actions onlymake people late for supper, thereby compounding the company's problemsby reducing support from the families of organization members, a cardinalmistake. The quality and timeliness of managerial actions affect bothorganizational commitment and perseverance.
Mostly, however, perseverance applies to the managers themselves. Theturnaround process is long, and key managers simply must stick with it. Thetrack record of turnarounds involving many changes in management is poor.
Temperance
It is not fashionable in business schools to discuss sobriety as an attribute of management. As a practical matter, however, personal temperance does playa role in turnaround success. The evidence gathered among the casesexamined here coincides with the author's personal experience that manybusiness problems could be averted by a more widespread adoption ofpersonal temperance. It does not seem circumstantial that the key turnaround agents at Cadillac,
Packard, Nash, Deere, and American Motors during the 1950s all enjoyedgenerally temperate reputations, and several were active campaigners againstalcohol. Organization members, creditors, and other associates are quitelikely to distrust people who drink excessively or behave immodestly inother ways. Alan K. “Bud” Ruvelson, one of the nation's more experiencedventure capitalists, describes the four horsemen of the apocalypse ofcompany problems as “the four B's: booze, boy/girl problems, bucks, andballots (people running for office, either internally or externally).” Whetherthe personal behavior of executives should be a material consideration inturnaround success is not the issue. Concerns regarding personal behaviorcannot be evaluated within a narrow legalistic framework. Motivationoperates within a framework of perceptions. Organization members willdecide for themselves what they regard as relevant qualities in executives,and what a legalistic framework suggests they ought to consider is not ofmuch interest to them. The fact is that intemperate executives are notpopular with organizations in trouble, and we should resist the temptation toexclude from our business analyses nonbusiness variables that do indeedaffect the business. The process of turnaround is difficult enough withoutincurring additional problems which the organization does not need.
Successful companies often sustain a culture of traditional morality involving characteristics such as sobriety, thrift, hard work, and honesty. IBM's policyof sobriety during its formative years drew some remarks and wisecracks,
192
but IBM became one of the most formidable corporations in history. Cadillacand Deere, in particular, hired at least partly on the basis of character traits,as did General Motors at various times. Most successful turnaround agentshad reputations of being fundamentally honest and trustworthy and of having fairly wholesome personal lives.
Yet, unsuccessful firms often violate this simple precept of temperanceduring times of corporate stress. Intemperance often occurs in out-of-towntravel and company meetings—even meetings called to discuss ways out ofthe crisis. It is amazing how managers will justify meetings at expensiveresorts some distance from headquarters to discuss the adversities of troubled companies. The liquor, the golf, the entertainment, and the expensivesurroundings are probably not of material accounting cost to majorcorporations, but the cost in terms of organizational cohesiveness is oftenexceedingly high. Members of organizations often evaluate the mannerismsof executives in very simple terms. If the company is in trouble, executivesshould not compound the trouble by staying in too-expensive places or byindulging themselves at corporate expense. Many people see indulgence asevidence that the seriousness needed during troubled times is lacking.
Practical Lessons on Outfitting the Management Team
· Successful turnaround leaders clearly articulate ideals, purposes, andprocedures using unambiguous language. Unsuccessful turnaround leaders are polite, but vague.
· Successful turnaround leaders have widespread reputations for honestyand trustworthiness. Unsuccessful turnaround leaders are often shrewd,but mistrusted.
· Turnaround leaders who are successful over the very long term sharecenter stage and the credit for success with other members of theorganization.
· Successful turnaround teams include salespeople who know customers,visit customers, and like customer—and who also sell.
· Successful turnaround teams include financial and accounting people who understand and appreciate the technical and managerial aspects of thebusiness.
· Special teams are used for one-time projects, in part so that the rest of theorganization can remain focused on the main business.
· Successful turnaround teams rarely include people who drink too much,spend too much, or are indulgent in other ways.
· Successful turnaround leaders are purveyors of justice, especially duringdownturns when expenses must be cut. They sustain morale by protectingthe conscientious, dedicated worker to the maximum degree possible.People who do not work hard or are not conscientious are usuallydismissed.
The Turnaround Experience: Real World Lessons in Revitalizing Corporations and Organizations

Case Histories
The cases we will examine in this chapter provide an interesting contrast inthe makeup of management teams. Allis-Chalmers was certainly aninnovative company at one time and indeed had vast technical resources.However, the makeup of the management team was vastly different from that of the successful Maxwell-Chalmers turnaround of the 1920s. In one case,the team was very experienced, rather basic in its approach and beliefs,scientific in its development of products, and focused on what needed to bedone at the time. Idealism certainly existed, but it was constrained to thehere and now. In the other case, management took bold steps withoutpossessing a thorough knowledge of what would happen. Experience playedless of a role, and more was left to the intuition of fewer people—intuitionthat was often wrong.
Case 12 — Professionals in Place at Maxwell-ChalmersDuring the early 1920s, the Maxwell-Chalmers Company sank deeply into crisis. Unit sales declined to less than one-fourth the level of 1916, as dealers andcustomers together became disenchanted with the slipping quality and sporadicperformance of Maxwell-Chalmers products. The management team, thoughexperienced in the automobile industry, did not appear to know what to do torestore profits and consumer confidence. After heavy losses in 1920 and 1921,financial backers elected to bring in Walter Chrysler, who was then engineeringa temporary resurgence of . Over time, Chrysler brought in a deep andexperienced management team composed of people who did know what to do.The firm survived and prospered, and within 12 years U.S. production hadexceeded that of the mighty Ford Motor Company. The firm survives today asChrysler Corporation.
Jonathan Maxwell started out in the bicycle business with another auto pioneer, Elmer Apperson, and later was involved with the Haynes, Oldsmobile, andNorthern automobile operations. In 1903, he teamed with Benjamin Briscoe toform the Maxwell-Briscoe Motor Car Company, which soon became anestablished producer of automobiles. However, Benjamin Briscoe's ambitionswere immense, and in 1910, the Maxwell-Briscoe Motor Car Company wascombined with 129 others to form the ill-fated United States Motor CarCorporation. The new firm offered 28 models of automobiles produced underseven trade names (Seltzer 1928). A shortage of capital and lack oforganizational cohesiveness forced the company into bankruptcy in 1912, andBenjamin Briscoe left the firm. Walter Flanders, formerly of Ford andEveritt-Metzger-Flanders (EMF), was called upon to reorganize the company as the Maxwell Motor Car Company (Rae 1965, 44).
Walter Flanders had some understanding of production but was reputed to beflamboyant, intemperate, and in possession of few engineering skills. His
194

namesake firm, EMF, enjoyed the dubious nicknames of “Every Morning Fixit” and “Every Mechanical Fault.” Reliability and quality problems also surfaced atMaxwell during the Flanders era (Rae 1965, 84). Maxwell's technical capabilitieswere further compromised by forced sell-off of some of its most valued assets,and one of the major Maxwell plants was sold to Billy Durant's new company,Chevrolet, as a part of the financial restructuring of 1914 (Crabb 1969, 326).Perhaps in an effort to augment its reduced production capabilities, which were caused by the sale of a major plant, the Maxwell Motor Car Company engagedin a quasi-official relationship with the Chalmers Motor Company in 1917. This “leasing” of the Chalmers facilities provided a modest resolution to Maxwell'sneed for production capacity. However, the arrangement produced a legion oforganizational “turf” issues along with the problem of updating an additionalmodel. These problems proved stressful to the company's already thin resourcebase. However, in spite of its problems, the Maxwell-Chalmers Companyenjoyed several years of strong unit sales and emerged as one of the moresignificant producers of automobiles (Table 10-3). By 1917, output rose to90,000 units, and profits exceeded $5 million. Maxwell-Chalmers' market shareclimbed to 6 percent.
Table 10-3 Maxwell-Chalmers/Chrysler Corporation Output, Sales, and Profit,
1904 to 1921
Year Maxwell output
($000)
Chalmers output
($000)
Profits ($000) Unit market
share, %
1904 10
1905 823
1906 2,000
1907 3,785
1908 4,455
1909 9,490
1910 10,000 6,350 9.03
1911 16,000 6,250 11.16
1912 (Company bankrupt)
1913 17,000 6,000 5.33
1914 21,000 6,200 2,500 5.00
1915 44,000 9,800 ,6.00
1916 69,000 21,000 5,426 5.90
1917 75,000 (low) 5,507 4.58
1918 34,000 (low) 2,292 4.13
1919 50,000 (low) 1,500 3.32
1920 34,168 10,000 (Heavy losses) 2.32
1921 16,000 (low) (Heavy losses) 1.38
After 1917, Maxwell-Chalmers unit sales, market share, and profits all declined.The recession following World War I accentuated the decline, and by 1921, the company was experiencing heavy losses. The financial backers of Maxwell
The Turnaround Experience: Real World Lessons in Revitalizing Corporations and Organizations
sought a more lasting solution to the company's problems. SomeMaxwell-Chalmers' backers had worked with Walter Chrysler and approachedhim with a proposal to take over management of the Maxwell-Chalmerscompany in addition to his responsibilities at Willys-Overland. A short timelater, Chrysler devoted his full attention to the Maxwell-Chalmers turnaround.In contrast to his assessment of Willys-Overland, Chrysler saw more potentialin the Maxwell-Chalmers enterprise and elected to take a much lower fee alongwith a percentage of the company's stock.
Chrysler approached the Maxwell-Chalmers turnaround in the same manner hehad employed at Buick and Willys-Overland. He walked around the companyassessing people, looking for ways to improve products and to increaseproduction efficiency. He improved relations with the company's creditors andtried to develop a more competent cadre of trusted associates. When asked byBertie Forbes, “What is the secret of your ability to make going concerns outof these bankrupt companies?” Chrysler replied,
The first thing I do when I start to look into the affairs of a failingcompany is to study the personnel of the organization and the individualityof the men. I am concerned first of all with executives, because if theirprinciples are not right it is useless to look at the results of men. When Ihave measured up in my own mind the capacity of the executives, I get out into the operation of the plant and watch the men. I look around to seehow many of them are standing still and how many of them are movingaround the plant. Highly paid men should be busy with accomplishment,not useless motion. If there is a lot of useless movement I know the plant is badly operated.
I do not believe in idle machines or idle men. Outside of the idleinvestment involved, it is bad policy. If a man is working next to an idlemachine it not only has a bad effect on him mentally, but he takes lesscare of his own machine because he thinks he has a ready substitute. Ibelieve in keeping people out of temptation, for many cannot resist it.
I have the floor space measured and estimate the amount of its productivecapacity and then check up to see whether it is overcrowded or is runningunder its capacity, also whether the plant is overmanned. If it isovermanned and we are producing, I reduce the force arbitrarily.
I proceed to get the organization into shape by cutting out everyunnecessary expense and wasteful practice the moment I discover it.
Men should look forward, and progress stops when they refuse to listen toother people's opinions, although they should make their own decisions. Inever want to get to the place where I so dominate the job that no oneunder me dares to make suggestions.
I gauge men through my intuition and experience....Then, too, these cuts in the organization give me a big opportunity to learn something about mymanpower. I find out how much fight the men have in them and learn a
196

lot about their individual force. By cutting to the quick I get rapid contactsand am able to measure up my men's resourcefulness under emergencyconditions without delay (Forbes 1972, 37 to 39).
Walter Chrysler had the respect of his organization. He roamed through theplant asking workers how he could help them. He stayed late with thedevelopment engineers and took an interest in their work, but he did not takecharge of their efforts. When talking to the press, he heaped praise upon hismanagement team and his development engineers. Chrysler was an executivecomfortable with sharing center stage.
The Maxwell-Chalmers turnaround involved many people. Almost immediatelyafter taking over, Chrysler employed the services of Fred Zeder, Owen Skelton, and Carl Breer, who designed Willys-Overland’s new car during Chrysler’sassociation with that company. After Chrysler left, John North Willys sold thedesign and the factory to Durant Motors to raise cash, and as a result, Zeder,Skelton, and Breer were back on their own. In 1922, they moved to Michiganto work exclusively for Walter Chrysler.
Zeder, Skelton, and Breer soon began work on a new automobile which washighly differentiated from other automobiles of that day, a car which laterevolved into the first Chrysler automobile. Building the first Chrysler car wasvery much a team effort. Zeder and Breer worked primarily on engines, Skelton handled axles, transmissions, and brakes, Breer designed many essentialmiscellaneous parts, George Mason (later president of Nash-Kelvinator) tookcare of production. Many other individuals were involved on other projects(Rae 1965; Langworth and Nordbye 1985). Yet, informality prevailed and manyactivities overlapped as the company’s mode of operation closely paralleled thatof a skunk works.
Modern materials were used to ensure strength and reduce weight in the firstChrysler car and the result was a quick, economical, and durable vehicle. Thecar was designed with particular concern for manufacturing cost. As with someother successful turnarounds, considerable emphasis was placed on thecommonality of parts and design for efficient production. The innovationdisplayed by the Chrysler engineering staff, headed by Fred Zeder, allowed thecompany to produce a broad spectrum of products from a basic catalog ofprimary components. Although the car featured modern attributes such as ahigh-compression engines and hydraulic brakes, its designers spurned exoticprocesses and trendy design elements and instead opted for dependability,manufacturability, quality, and the ability to make maximum use of themachinery in the Chalmers factory (Langworth and Nordbye 1985, 28).
Most of the people involved with the turnaround of Maxwell-Chalmers and the emergence of Chrysler were technically trained and experienced, but otherdisciplines were well represented. Chrysler, Mason, and K. T. Keller (Chrysler’s
The Turnaround Experience: Real World Lessons in Revitalizing Corporations and Organizations

successor as president) were production people. Zeder, Skelton, Breer, andClark were engineers. Herbert Henderson was an industrial designer. Joe Fields, the sales manager, was a former agricultural equipment salesperson who hadspent time with National Cash Register. B. E. “Hutch” Hutchinson, in chargeof finances, was trained as an accountant at MIT and then Ernst & Ernst.However, he was also an accountant who came out of school to take a jobshoveling coal into a blast furnace. Later, he rose to the position ofsuperintendent of the open-hearth furnace section of that company (Chrysler1937, 178). The market planning activities of the early Chrysler Corporationattracted the attention of the highly academic Econometric Society. In all, themanagement team was seasoned, well-educated, and eclectic.
In contrast to the rather dashing profiles of contemporary Hudson andWillys-Overland executives, an informal atmosphere of traditional down-homevalues permeated the management team in the early days of ChryslerCorporation. Walter Chrysler and George Mason liked to fish and hunt andgenerally spurned social activities. Chrysler put great importance on the securityof his family and continued association with old friends such as A. B. Sloan,William Durant, and Charles Nash. He took extra pains to let the employees of the company know that he was not special. He had a good rapport withworkers in the organization and chatted with them often about many subjects.Fred Zeder was a religious person who attended church daily. B. E. Hutchinson was reputed to be a kind and professional person who was fond of saying:“Gentlemen, let’s have less heat and more light in this discussion.” K. T. Keller was a conservative who believed that dependability, passenger comfort, andquality were more important to an automobile than style. While the managersof other companies grew wealthy and sought diversions, the people at Chryslerworked hard at developing an exciting industrial company.
The fortunes of the company began to improve. Output jumped from fewerthan 45,000 cars in 1922 to 182,000 in 1927. Profits grew from the severelosses of the 1919 to 1921 era to more than $19 million in 1927. The marketshare of the company grew to nearly 6 percent, and the company occupiedsixth place in sales (Table 10-4). But, the Chrysler turnaround was still gathering momentum. On July 30, 1928, the company was asked to purchase DodgeBrothers, Inc., thus increasing Chrysler's market share, further enabling it tobecome the unchallenged number-three producer.
The Dodge brothers figured crucially in the emergence of the American motorcar industry in several ways. Both John and Horace Dodge were excellentmachinists, and Horace Dodge worked under the wise stewardship of HenryLeland at Leland & Faulconer. With this expertise in hand, the two brothersopened the Dodge Brothers Machine Shop in 1901 to provide component parts to the fledgling auto industry. One of their earliest customers was the FordMotor Company, and John and Horace Dodge became two of only a handful
198

of stockholders in that company. For many years, they played a significant rolein the emergence of Ford. As late as 1914, the Dodge Brothers Machine Shopbuilt all the components for Ford cars, except the body, tires, and wheels.
Table 10-4 Maxwell/Chalmers Output, Sales, and Profit, 1921 to 1941
Year Output ($000) Total sales ($000) Profits ($000) Unit market share,
%
1921 16,000 (low) (Heavy losses) 1.38
1922 44,811 46,123 832 1.89
1923 49,546 58,138 2,678 1.50
1924 79,144 81,364 4,115 2.46
1925 132,343 137,321 17,126 3.42
1926 162,242 163,891 17,400 4.11
1927 182,195 172,344 19,500 5.90
1928 313,769 315,305 34,167 7.82
1929 375,094 375,033 24,207 7.82
1930 230,904 207,789 922 7.93
1931 244,916 183,805 3,421 12.02
1932 204,416 136,547 (10,131) 17.23
1933 397,373 238,676 16,555 24.42
1934 512,554 362,255 12,496 22.57
1935 738,319 516,830 44,948 21.79
1936 926,165 667,138 73,443 24.33
1937 997,315 769,808 60,000 24.51
1938 478,126 413,250 19,000 22.50
1939 657,538 549,806 42,000 22.10
1940 934,959 744,561 58,000 24.60
1941 878,356 888,366 65,000 23.37
Note. Shipments and financial figures for Dodge Brothers, Inc., are not included for the time preceding the acquisition of that company by Chrysler Corporation in 1928.
In 1914, however, Henry Ford decided to concentrate company gains inhimself. The giant Ford complex at Highland Park came into full production,and with that Ford began to systematically cut off his old, and sometimesfaithful, suppliers. The Dodge brothers were affected not only because of thefalloff in Ford business but also because the dividends in the Ford MotorCompany were cut to zero. Some authors suggest that Henry Ford wanted toplow the full proceeds of Ford profits directly into the company. Others implythat he wanted to diminish the possibility of Dodge Brothers becoming a viable builder of automobiles. At any rate, the combination of the two moves resulted in the Dodge Brothers building its own car, and later a successful suit wasbrought against Henry Ford for nonpayment of dividends (Seltzer 1928).
The first Dodge car sold 45,000 units. By 1920, production grew to 141,000,and Dodge emerged as one of the nation's larger producers, with profits of $24
The Turnaround Experience: Real World Lessons in Revitalizing Corporations and Organizations

million in 1919 and $18.4 million in 1920 (Heasley 1977, 20 to 21). Dodge cars garnered an early reputation for dependability and good value.
Although the Dodge brothers were excellent machinists and were generally fairin dealing with their business associates, their personal lives were less orderly(Nevins 1954). Both John and Horace Dodge died in 1920 at an early age,some say of diphtheria, a malady perhaps worsened by what some authors have suggested was a less temperate lifestyle. The widows sold the company to aninvestor syndicate headed by Dillon Read.
Dodge sales were strong during its early history but fluctuated wildly during the Dillon Read period. In 1921, sales dropped to 81,000, then recovered to265,000 in 1926, and then dropped to 67,000 in 1928. In 1928, the investors'syndicate approached Walter Chrysler to see whether he had an interest inpurchasing Dodge Brothers, Inc., an inquiry that resulted in the ChryslerCorporation buying Dodge Brothers in a transaction financed by Dillon Read.
Chrysler purchased Dodge Brothers primarily because of its productionfacilities. The Dodge plant was well-equipped, complete with a fine foundry and forge. It provided Chrysler Corporation with a building block to expand andstrengthen its position in the industry and to broaden the company's productline. In 1928, Chrysler produced both theand the Plymouth (named, in part,after a popular brand of binder twine well known to the farm people atChrysler). With the arrival of a fuller product line and better productionfacilities, the Chrysler Corporation began to grow. By 1929, unit sales had risen to 375,000 units and profits exceeded $24 million.
A steady stream of quality automobiles and product innovations contributed toa substantial cushioning of sales during the great depression. The companyintroduced overdrive to increase gas mileage while reducing noise and enginewear, the downdraft carburetor, floating power, vacuum-spark advance, morereliable universal joints and brake drums, and many other innovative featureswhich were user-oriented. The company pioneered many significant engineeringand product features. Hydraulic brakes improved safety, tubular axles addedstrength and reduced weight, and floating power reduced noise and vibration.The advanced aerodynamics of the 1934 models improved gas mileage andperformance. Standardized parts improved production efficiency and loweredcost. These fruits of Chrysler's engineering staff allowed the company toincrease market penetration greatly during a period of severe economicdifficulty. In 1928, Chrysler production lagged that of Willys-Overland and unitsales for 1929 were only about 20 percent higher than those of Hudson.Hudson sales dipped to under 18,000 in 1931, and Willys-Overland salesdropped to 6552 in 1934. Chrysler sales remained relatively strong, dropping
200

only to 204,000 in 1932, the only year of the great depression when ChryslerCorporation operated at a loss.
Figure 10-1. U.S. auto production of Chrysler and Ford. The domesticsales of Ford Motor Company peaked at 1.8 million units in 1923, ayear when predecessors of Chrysler Corporation produced under50,000 units. By 1929, Chrysler production had risen to 375,000 units,while Ford production of the new Model A had rebounded to over 1.5million. Ford sales suffered badly during the depression, however,while Chrysler sales continued to grow. By 1936, Chrysler had movedahead of Ford to become the nation's second-largest producer, acondition which prevailed for the next 14 years.
Meanwhile, by 1940, Ford's market share slipped to well under 20 percent (16percent in 1940 and 18.3 percent in 1941). Chrysler Corporation had surpassedthe Ford Motor Company and moved into a strong number-two position in the U.S. market (Figure 10-1).
The Maxwell-Chalmers turnaround was headed by a broadly based managerialteam composed of conscientious individuals who understood the practicalitiesof production, product innovation, and organizational teamwork oriented toquality and function rather than style. In their own way, and in a mannerconsistent with their values, the people at Chrysler produced products theythought society needed. They were interested in economy, durability, andpassenger comfort rather than fashion.
The Turnaround Experience: Real World Lessons in Revitalizing Corporations and Organizations

Not all Chrysler innovations were well received by the marketplace. But enough were to move the company to a strongly profitable number-two position.However, in later years, when the original Chrysler management had died orretired, the company began to forsake its earlier competitive advantages:production efficiency, product innovation, superb engineering, and its basicdown-home approach to supplying products for the market. With this formula,Chrysler Corporation was perhaps the best-run automobile company during the1930s and certainly showed the most stability during a disastrous depression.From a position of near bankruptcy in 1921 (which would have been its second bankruptcy), the company emerged as the country's second-largest produceronly 12 years later.
At a later stage, the company moved away from its position of supplyingwell-built, reliable cars to conservative people with an appreciation forengineering. Less flashy than the postwar GM and, perhaps, less gifted atmarketing than the refinanced and newly managed Ford, Chrysler Corporationfaltered in the early 1950s. A few years later, Chrysler corporation began tocompete directly in the high-performance, high-style arena. Performanceimproved, styling became more exotic, fuel economy plummeted, and qualitydeclined. Consequently, traditional Chrysler customers looked for otheralternatives while customers in the new market remained loyal to otherproducers. But, from 1924 to 1941, the deep and technically competentmanagement team at Chrysler Corporation enabled the company to emergefrom disaster to become the best-run automobile company of the period.
Maxwell-Chalmers Survived Because…
· Managers were experienced in the industry being served.
· Talent, competence, and goodwill were distributed broadly throughout the organization.
· Top managers were technically competent.
· Products became differentiated in advance of industry trends.
· Product features and benefits were rooted in technical advances ratherthan cosmetics.
· Each major part of the company did its job well. Engineering developedgood products, manufacturing efficiently produced quality products, salessold, and finance understood how to make money in physical terms.
Case 13 — Witless Dissipation at Allis-ChalmersThe Allis-Chalmers corporation began operations in the Milwaukee area ofWisconsin in 1847 as the Reliance Works—a machinery and foundry companyand a producer of specialized machinery. A successful local businessman,
202

William P. Allis, purchased the firm in 1861 and later renamed it the William P.Allis Company. The firm expanded and became well known for its ability toproduce large machinery—particularly in support of the nearby lumber andflour industries.
The William P. Allis Company soon developed a distinctive business philosophy which emphasized excellence in engineering and efficiency of production. Thebuildings were flimsy, but the production equipment was first-rate, allowing thecompany to produce large-scale equipment such as pump engines, saw mills,flour mills, and other specialized machinery. One of the firm's primary technical accomplishments was the refinement of a huge band saw that, for mostlumber-making operations, was both faster and far more efficient than thealternative technologies of the time. By the 1870s, the company had become amajor manufacturer of stationary steam engines and gigantic blowing enginesfor use in the manufacture of steel. On the basis of these technologies, thefirm then manufactured electrical generating equipment. In 1901, the William P.Allis Company acquired three other companies including the Frazer & Chalmers Works in Chicago. The name of the company was then changed to theAllis-Chalmers Company.
The Allis-Chalmers Company had considerable manufacturing prowess involving more than 3 million square feet of manufacturing space and some first-rateequipment. By 1906, the West Allis plant alone consisted of 1,416,000 squarefeet of floor space on 113 acres of land, and the firm had additional majorplants in Chicago and Scranton, Pennsylvania.
Although a decade of technical accomplishment followed the formation ofAllis-Chalmers, the company experienced business difficulties and enteredreceivership in 1912. A local successful business leader and a member of theGerman community of Milwaukee, General Otto Falk, acted as the company'sreceiver. Falk soon reorganized the company to improve efficiency and upgrade the training of company personnel. The company prospered as a qualitymanufacturer of specialized generators and other machinery. In order to utilizeall of the company's huge manufacturing capacity, Otto Falk chartered thedevelopment of an Allis-Chalmers tractor, and by 1935, tractors and farmequipment accounted for more than half the company's sales. The innovativeand practical designs of Allis-Chalmers agricultural products were especiallyappealing to medium and small-scale farmers, and by the mid-1930s,Allis-Chalmers was quite comfortably established as one of the industry's mostsignificant producers. By 1966, total Allis-Chalmers sales rose to $857 million,and the company became number 130 of the Fortune 500.
By the 1960s, however, the strains of being such a widely diversifiedmanufacturer began to show. Although the company continued to be aninnovator by building nuclear power plants, an experimental tractor powered by
The Turnaround Experience: Real World Lessons in Revitalizing Corporations and Organizations

fuel cells, a popular low-cost hay baler which featured more-weather-resistantround bales, and a line of tractors with power-shift wheels and other innovative products, profit rates were not high. From 1963 to 1966, net after-tax profitrates averaged 2.6 percent. In 1967, sales dropped by 4.3 percent but after-taxearnings declined by 81 percent.
During the mid-1960s, Allis-Chalmers became embroiled in a costly series ofuntimely hostile takeover attempts. Ling-Temco-Vought was the first companyto express an interest in acquiring Allis-Chalmers. Later renamed LTV, thatcompany was an active acquirer of many businesses during the 1960s, most ofwhich it later sold. LTV filed for bankruptcy in 1986. But in 1967, the LTVoffer was a traumatic event to Allis-Chalmers. Initially, talks were held with arival merger candidate, General Dynamics. Later, Allis-Chalmers managementdecided to actively resist any takeover. With some help from the Wisconsinstate government, and with filing a complaint against LTV, the CEO of LTV,James Ling, withdrew the offer to acquire Allis-Chalmers in August of 1967.
The LTV episode alerted the investment community to the possibleundervalued financial condition of Allis-Chalmers, and other companies beganto buy Allis-Chalmers stock. CEO Robert Stevenson then began to holdexploratory talks with other possible merger partners as a defense againstfurther hostile takeovers. None of these discussions reached fruition, and inJune of 1968, the Allis-Chalmers board of directors elected David G. Scott aspresident. A former executive of Colt Industries and General Electric, Scott was experienced in acquisition matters.
The takeover battles continued, with other companies involved. Ultimately,Allis-Chalmers prevailed, but the company began to experience operationalproblems—perhaps resulting from management's preoccupation with otherissues. Peterson and Weber (1978) describe the situation as follows:
Allis-Chalmers had many obsolete, inefficient plants; it was burdened withhigh labor costs for some products relative to its competitors, and its shareof market and sales volume was insufficient in some areas to operate itsplants efficiently or to invest in modern facilities. Salaried overhead washigh, and the company feasted or starved in its capital goods markets. Newtechnological developments which created sales opportunities required heavy investment and research expenditures. Finally, the company's reentry intosteam turbines was devastated by new environmental and economic forces.(Peterson and Weber 1978, 397)
In 1968, revenues declined again from $821 million to $767 million. Grossprofit declined as well to 6.4 percent. But, selling and general and administrative expenses rose from $100 million in 1967 to $131 million in —in part due toadditional reserves set aside by the new CEO. The company reported anafter-tax loss of $55 million for the year, but the actual 1968 loss of $122million was much greater than the reported loss because $60 million worth of
204
future tax benefits resulting from the 1968 loss were booked into currentprofits. (Bhattacharyya 1969) This unusual accounting treatment drew criticalcomment from the business press. (Fortune 1969)
David Scott then took some initial steps to put the company in a morecompetitive position. He reduced total headcount by 8000 people, including areduction of more than 1000 people in the headquarters staff. He also spentsubstantially on plant rearrangement. Some plants were decommissioned, at very high one-time costs, while new facilities were opened at the rate of about oneper year. About $40 million per year was reportedly expended for capitalimprovements (Peterson and Weber 1978, 397).
Along the way, however, Allis-Chalmers became involved in a highlycomplicated series of acquisitions, divestitures, joint ventures, and specialtransactions with other companies, often foreign companies, which addedfurther ambiguity to the company's mission. These transactions are listed inTable 10-5.
The lackluster performance of Allis-Chalmers continued in spite of theaggressive diversification program. The company was only marginally profitablein the years from 1969 to 1974, when profit rates ranged from 0.6 percent to2.2 percent. During the same time period, Deere profits ranged from 4.0percent to 8.4 percent.
For a brief period from 1976 to 1979, earnings rose to record levels ($81million in 1979) and profit rates approached average levels. The peak year was1977, with an after-tax profit rate of 4.36 percent. However, these were alsopeak years, for the other agricultural-equipment producers as Deere andInternational Harvester also enjoyed record earnings. By 1980, however, therobust sales of the late 1970s had waned and Allis-Chalmers experienced a 43percent decline in earnings. By 1981, the company was again operating at a loss of $28 million. By 1982, the loss grew to $207 million. The year 1983 wasmarginally less poor, with a loss of $142 million. Things worsened again in1984, with a loss of $261 million. An additional $169 million loss occurred in1985, and the company's net worth became negative. In response to the severelosses of the 1980s, the company had to sell off many of its better operationsin order to raise cash or to realize capital gains. Along the way, many workerswere displaced, several facilities were closed, and part of the savings was madeat the expense of the company's retirement fund. The company's auditorssoberly inserted the following excerpt in their qualified opinion of the 1985operations of Allis-Chalmers:
As described in the Termination of Pension Plans note on pages 20 and 21, during 1985, the company terminated several pension plans havingaggregate unfunded benefits of $170 million. As a result of these
The Turnaround Experience: Real World Lessons in Revitalizing Corporations and Organizations

terminations, the Pension Benefit Guarantee Corporation may assert aclaim for up to 30 percent of the company's net worth...(Moodys 1986)
From 1968 to 1985, Allis-Chalmers made 20 major acquisitions, joint-venturearrangements, or divestitures. In the process, the number of companyemployees declined from 33,500 in 1963 to 12,000 in 1985, and has declinedfurther since. A total of 29 manufacturing plants were sold or closed in therecent downsizing of Allis-Chalmers (Allis-Chalmers Corporation Annual Report 1985).
Allis-Chalmers workers were concerned about the viability of the company long before the problems became public and were frustrated with their inability toengage in meaningful dialogue regarding resolution of the problems.Representatives of the United Auto Workers eagerly sought a meeting withDavid Scott. Finally, after several months, word arrived that Scott would be atthe next meeting. He was, but in the form of a videotape. Understandably,worker representatives were somewhat underwhelmed with the potential ofdialoguing with a videotape.
In contrast to the close association with workers enjoyed by Charles Nash andWalter Chrysler, David Scott fostered an air of remoteness in dealing with theorganization of Allis-Chalmers, as typified by the special entrance enabling himto reach his office without passing by either workers or company operations. At year end 1985, David C. Scott retired as the CEO of Allis-ChalmersCorporation, and his successor, Wendel Bueche, set about to salvage what wasleft of a company that at one time was a respected and innovative producer oftechnically advanced special machinery and practical farm equipment. Thedramatic changes Allis-Chalmers experienced from 1967 to 1985 aresummarized in Table 10-6.
Table 10-5 Allis-Chalmers Ownership Transactions, 1969 to 1981
Year Transaction
1969 Write-down of assets of $124 million
1969 Sale of preferred stock to Fiat
1969 Acquired Standard Steel
1969 Acquired International
1972 Acquired Pennsylvania Electric Coil
1972 Acquired Paulista S.A.
1974 Acquired Svedala-Arba
1974 Acquired Stephenson-Adamson
1974 Joint venture with J. M. Voith G.m.b.H
1975 Acquired Material Movement
1976 Acquired an electric motor repair shop
1977 Reduced equity in Fiat-Allis in exchange for Allis-Chalmers stock held by Fiat
1977 Acquired Clough Manufacturing
1977 Acquired Sala International of Sweden
206
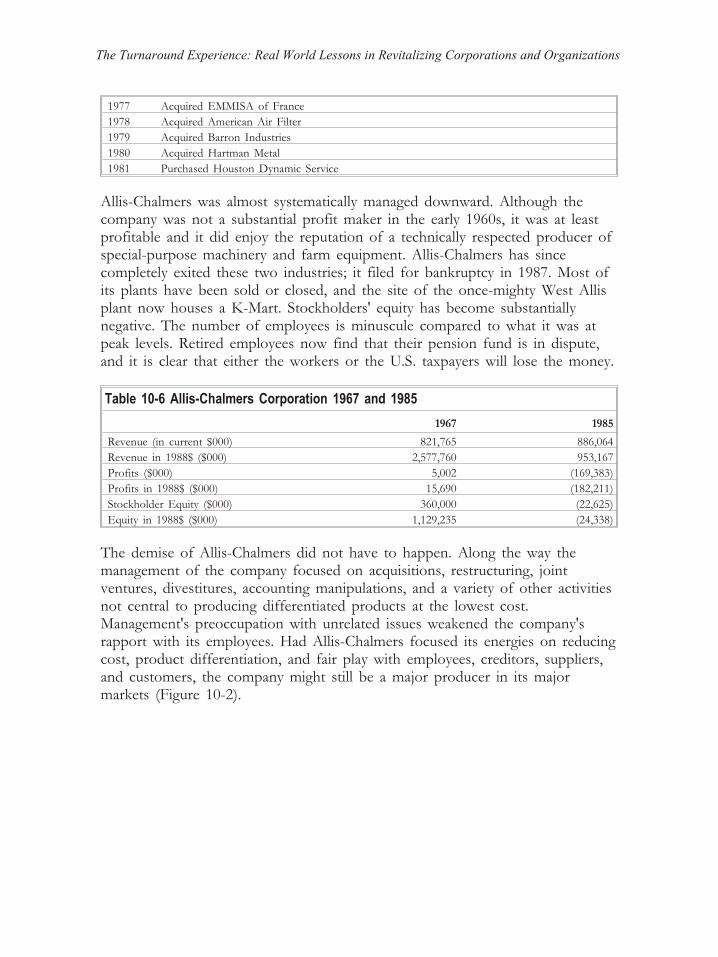
1977 Acquired EMMISA of France
1978 Acquired American Air Filter
1979 Acquired Barron Industries
1980 Acquired Hartman Metal
1981 Purchased Houston Dynamic Service
Allis-Chalmers was almost systematically managed downward. Although thecompany was not a substantial profit maker in the early 1960s, it was at leastprofitable and it did enjoy the reputation of a technically respected producer ofspecial-purpose machinery and farm equipment. Allis-Chalmers has sincecompletely exited these two industries; it filed for bankruptcy in 1987. Most ofits plants have been sold or closed, and the site of the once-mighty West Allisplant now houses a K-Mart. Stockholders' equity has become substantiallynegative. The number of employees is minuscule compared to what it was atpeak levels. Retired employees now find that their pension fund is in dispute,and it is clear that either the workers or the U.S. taxpayers will lose the money.
Table 10-6 Allis-Chalmers Corporation 1967 and 1985
1967 1985
Revenue (in current $000) 821,765 886,064
Revenue in 1988$ ($000) 2,577,760 953,167
Profits ($000) 5,002 (169,383)
Profits in 1988$ ($000) 15,690 (182,211)
Stockholder Equity ($000) 360,000 (22,625)
Equity in 1988$ ($000) 1,129,235 (24,338)
The demise of Allis-Chalmers did not have to happen. Along the way themanagement of the company focused on acquisitions, restructuring, jointventures, divestitures, accounting manipulations, and a variety of other activitiesnot central to producing differentiated products at the lowest cost.Management's preoccupation with unrelated issues weakened the company'srapport with its employees. Had Allis-Chalmers focused its energies on reducing cost, product differentiation, and fair play with employees, creditors, suppliers,and customers, the company might still be a major producer in its majormarkets (Figure 10-2).
The Turnaround Experience: Real World Lessons in Revitalizing Corporations and Organizations

Once innovative Allis-Chalmers survived a hostile takeover attempt in the late1960s only to succumb to its own internal shortcomings a few years later.
Figure 10-2. Allis-Chalmers real revenue and cost. As is the case withmany companies during periods of inflation, Allis-Chalmers continuedto post record sales and earnings when revenue was static ordeclining in real terms. In reality, aggressive strategic measuresinstituted by Allis-Chalmers management were not working. By 1985,real revenue had declined to 40 percent of the levels of the 1960s andstockholders' equity had become negative. The company later filed forbankruptcy.
Allis-Chalmers Failed Because…
· Top managers lacked experience in the industry being served.
· Management did not focus on day-to-day operational matters.
· Management diversified into new and unfamiliar ventures whileneglecting familiar markets.
· Product differentiation was not sustained.
· Too much money was spent on items unrelated to what the customer wasbuying.
· Top management appeared to be uninterested in either the company'smain products or the people who designed, sold, and produced them.
208
Chapter 11 — Focusing on PresentOperations
An experienced professional football coach once remarked that it wasembarrassing to lose to the Green Bay Packers under Vince Lombardibecause they had only six plays. In ways similar to Lombardi's Packers,successful turnaround agents focus attention on the basics—blocking andtackling. They center the company's attention on the business it is in at thetime, and they scorn diversions. They focus on operational issues such asimproving the product, reducing production cost, and improving productquality and customer service. They do this daily, not weekly or monthly orduring planning periods. Habits, gestures, memorandums, and meetings focuson immediate events. Planning tends to be, as Robert Hayes (1985) says itshould be, an incremental extension of today's small steps rather than agrand plan long into the future.
Unsuccessful turnaround agents often lack sufficient understanding of theirbusiness to manage operations in a detailed way. They may pressure theirsales organizations for higher sales without understanding that variable costsmay be higher than prices. They tend to have meager knowledge of bothproducts and production processes and therefore miss the potential thatsuperior performance in these areas can have for enhancing performance.They are inclined to spend more time in meetings discussing overallcorporate strategy and less time with customers or key employees in theoperating units in search of incremental improvements. They have a greatpropensity to make deals to get into new businesses or get out of oldbusinesses without any deep understanding of what is required to have anyof these businesses operate profitably. The planning logic appears to be, ifwe can't manage what we've got, we had better manage something else.
Why companies in dire straits choose to dissipate scarce resources in oblique activities remains a mystery to us. There is plenty to do just to keep thebusiness functioning, and most companies in trouble have imperfections thatneed to be remedied in order to restore health. The activities that reallycount are making better products, selling, gaining cooperation with vendors,training staff, and collecting money. Successful managers spend time inperforming these tasks, and they are careful to continue performing them.
I can recall an instance when a Fortune 500 company was grappling withprofit problems in an operation that was later dismantled after losing tens ofmillions of dollars. At that time, the division was losing roughly a milliondollars a month. Morale was low, and the decision was made to sponsor acompany necktie to improve morale. That might have been a suitable project if it had taken 5 minutes. But, practical obstacles surfaced. For instance, thenecktie manufacturer was located in Hong Kong, and the matter became aninternational transaction. Also, necktie styles were changing and an internal
The Turnaround Experience: Real World Lessons in Revitalizing Corporations and Organizations

debate broke out as to how wide the necktie should be. The project draggedon and on, month after month, and while losses continued to mount, thenecktie matter was featured at divisional staff meetings. It was ridiculous,and company management lost enormous respect for these and otherdiversionary actions.
Companies in trouble must focus on what needs to be done. Managementcannot afford to spend time on vague global concepts or unrelated trivialissues. This need to focus begins with company ideals but affects strategicplanning, decision making, and organizational change.
Focus on Needs in Turnarounds
Clearly Defined Ideals and Executive Responsibility
The superiority of flourishing companies begins with ideals and is reinforced by executive responsibility. The ideals of successful firms are easilyunderstood basic concepts that emphasize service to the community. Anexample might be Du Pont's slogan: “Better things for better living throughchemistry.” Note that it is specific, not open-ended, and it impliescommunity well-being as an objective. Unsuccessful company ideals areoften less specific and usually espouse objectives rather than service.Compare the Du Pont statement with the “strategic evolution” ofAllis-Chalmers, which had as its objective to “redeploy our assets andinvestments for efficient utilization and worldwide optimization”(Allis-Chalmers 1985).
Harrington Emerson (1960) listed “clearly defined ideals” as the first of his12 principles of efficiency. In turnaround work, it is especially important formembers of the organization to understand the mission of the company andits reason for existence. Philip Selznick (1957) noted that the ideals of thecompany become “institutionalized” as a step in the development ofleadership. As a practical matter, when the difficulties of an organization are intense, members of the organization need an important, noble purpose inwhich to believe.
In the case of American Motors in the 1950s, the noble purpose was thebuilding of a high-quality practical compact car that did not consume somany natural resources. In the case of Chrysler, it was the survival of theAmerican industrial system against the onslaught of imports. In the case ofDeere, it was building durable products with low-cost operation for use bythe wellspring of American wealth—agriculture.
People involved in turning a company around need something to get excitedabout. They need ideals. These ideals must be clearly understood byorganization members. Reinforcement of these ideals can come from anylevel in the organization.
210

Lew Veraldi of Ford provides a meaningful example of clarity in thepromotion of ideals. An arm-waving, foot-stomping, gregarious Italian with a big heart and a huge sense of responsibility, he would emit sparks ifdevelopment projects were not proceeding with sufficient dispatch to wardoff foreign competition. If they were, however, he was all heart and quitewilling to note how individual accomplishments fulfilled the Taurus/Sablemission. As one seasoned Ford manager noted: “I don't think anyone wasever confused about what Veraldi wanted.”
Good leaders can cultivate ideals, but the leaders must be believable asindividuals and appear to be operating within their own framework ofidealism. With the special tensions of a turnaround situation, the individualmanagers have to be perceived as fair, honest, and appreciative of the needto integrate the goals of the organization with those of the individual (1941). If the leaders receive excessive personal compensation or indulge insuperfluous ostentation, the organization is likely to think that the leaders do not believe in “the cause.”
This link between ideals and the personal credibility of the leader wasrecognized by Chester Barnard in his concept of the “zone of indifference,”which theorized that members of the organization will grant to executivessome considerable range of operating freedom. March and Simon (1963)referred to this same concept as the “zone of acceptance.” Barnard addedanother thought that is often overlooked in human relations withinorganizations. What matters is how all people and all stakeholders are treated — not necessarily how the specific individual is treated. It doesn't matterwho the victim is. People will use how others are treated as an index of how they will be treated. Barnard was very interested in the effect thatopportunism could have on an executive's ability to mobilize theorganization. He addressed this in two chapters, “The Theory ofOpportunism” and “The Nature of Executive Responsibility,” in TheFunctions of the Executive. The following quote is indicative:
Executive responsibility, then, is that capacity of leaders by which,reflecting attitudes, ideals, hopes, derived largely from without themselves,they are compelled to bind the wills of men to the accomplishment ofpurposes beyond their immediate ends, beyond their times. Even when these purposes are lowly and the time is short, the transitory efforts of menbecome a part of that organization of living forces that transcends manunaided by man; but when these purposes are high and the wills of manymen and many generations are bound together, they live boundlessly.(Barnard 1953, 283 to 284)
Ideals and executive responsibility frame the discipline system so essential to a focus on present operations.
Strategic planning
David Scott of Allis-Chalmers and Charles Nash of the Jeffery turnaroundapproached strategic planning in opposite ways. Scott examined the
The Turnaround Experience: Real World Lessons in Revitalizing Corporations and Organizations
profitability trends in different business segments and then attempted to veerthe company toward arenas of perceived opportunity. Nash looked at thebusiness he was in and tried to find ways his firm could do better. For Scott, strategic management meant working out a new joint venture, selling off anold business, or buying a new one. Nash's idea of strategic management isreflected in the subject matter of his meetings. He began the meetings, which often involved whoever wanted to attend from the plant work force, byreading aloud any letters of complaint from customers and then asking forsuggestions to keep the problems from happening again. The second item ofdiscussion was how the company could improve its efficiency and be morecost-effective. The third item was how the company could utilize some ofthe savings from the efficiencies just discussed to make a better-qualityproduct. Nash continued this focused practice for the years during which thefirm progressed from being a minor player in the industry to a leader ininnovation, inventory management, and profitability (Brown 1981). Withsimilar focus, George Romney engineered the American Motors turnaroundof the 1950s and Henry Leland guided the reconstruction of Cadillac. Fewsuccessful turnaround agents spend much time on general strategic planning.
With respect to the markets they entered, successful firms also moreaccurately gauged their ability to fully implement their strategic plans.Unsuccessful firms often had strategic plans that were internallyinconsistent—such as expansion plans that outran finances or a low-pricedcar being marketed by a high-cost producer, as happened withWillys-Overland, Kaiser, and Hudson. Successful firms developed internallyconsistent plans which more realistically considered the firm's resources.Often, they modified strategies to consider the firm's resources in physical as well as financial terms. An example occurred with the design of the firstChrysler car when managers determined that the Chalmers factory was notequipped to efficiently manufacture an overhead-valve engine, so an L-headengine was produced instead.
The literature on strategic planning is long and reflective. One of the bestdefinitions of strategy was provided by Igor Ansoff (1965): “Strategy is theact of matching the firm to its environment.” This paraphrase is a fittingdescription of the strategic planning process in turnarounds.
In a Harvard Business Review article entitled “Strategic planning—Forwardin Reverse,” Robert Hayes (1985) noted that an incremental approach leadsto an improved strategic system because the strategy is tested sequentially as it is being developed. Hayes suggests that the traditional ends-ways-meanslogic of planning should be reversed. Instead of concentrating on endobjectives first and then determining what methods, resources, andprocedures are required to obtain the objectives, companies should criticallyexamine their current methods and resources first and then see what research and development activities would best complement the present resources.Since a feedback loop is involved, the ability does exist to modify thepresent situation in order to meet a more attractive set of objectives. Thesuccessful turnaround consists of incremental steps to improve theeffectiveness of the organization one day at a time.
212

Styles of Decision Making in the Turnaround process
A seasoned expert remarked that “anyone can manage if they have thefacts,” and, indeed, facts are seldom plentiful in turnaround situations. Yet,the need for decision making does not change. The turnaround manager isoften forced by circumstance to make decisions with something less thancomplete details. Mintzberg (1978) described three different modes ofdecision making: planning (analytical), adaptive (political), andentrepreneurial (intuitive). He suggested that these three modes are oftenintermixed at different levels in the organization and at different stages inthe organization's development. Kilmann and Mitroff (1976) proposed thatinformation gathering and decision making employ qualitative as well asquantitative analysis along two scales: thinking versus feeling and sensationversus intuition. Their theory held that it is through the interaction of thesequalitative and quantitative forces that the decision-making process takesplace. Bibeault (1982, 372) also found that intuition was a common style ofdecision making in troubled situations in his 1978 survey of 81 turnaroundcompany chief executives. In response to the question, “Were the majorturnaround moves accomplished according to a formal plan or mostly byintuitive management action?” the responses were “intuitive actionfirst=19.3%; intuitive action followed by formal plan=50.6%, and formal plan followed by implementation=30.1%.”
One obvious question, however, is, how informed is the intuition? Intuitionin the hands of competent individuals with extensive experience in a relatedindustry is one thing. Intuition in the hands of rank amateurs is quiteanother. March and Simon (1963) developed the theory of “boundedrationality” and thereby delineated a lack of exposure which can surface inturnaround environments. Practitioners can make intuitive decisions outsidethe boundaries of their rationality (their domain). They may depend toomuch upon intuition and present knowledge and not enough upon experience and required knowledge. This is the fundamental dilemma for turnaroundagent needing to make difficult decisions. Time pressures may create aninclination to use intuition outside the manager's domain, the province overwhich one's experience is functional. Intuition amortized over a very smalldomain usually leads to unfavorable results during a time of crisis. For these reasons, the effective turnaround manager will wish to complement intuitionwith knowledge exploration.
Knowledge exploration
Knowledge exploration is a concept difficult to measure, but meaningful tothe study of turnarounds and can briefly be described as a systematicappraisal that has to be made regarding what information is necessary (asopposed to what is available) in order to make a proper decision. The keyelements of this necessary information are actively sought. In his descriptionof “the program planning model,” Andrew Van de Ven (1980) explained that this necessary step of “knowledge exploration” is key to effective decisionmaking.
The Turnaround Experience: Real World Lessons in Revitalizing Corporations and Organizations

Decision making in unsuccessful firms is frequently too intuitive andinsufficiently grounded in fact. Successful firms are more studious aboutobtaining the information necessary for good decisions. The successfulcompanies arranged to gather, or to know, that information which wascritical to the making of key strategic decisions. Unsuccessful firmsfrequently had significant gaps in their information flows and tended to make decisions mostly on what information was available rather than on the basisof what information was needed. Forecasting and market information wasparticularly lacking at International Harvester, Studebaker-Packard,Willys-Overland, and Kaiser. The unfortunate decisions made on the basis of inaccurate but available information were very costly to the firms involvedand contributed to their ultimate demise.
The depth and relevance of the background of key turnaround agents areother factors in the usefulness of the intuition as it is applied to thedecision-making process. The intuition needs to be specifically experiencedrather than general or amateurish. In addition, professional analysis, usuallyinvolving data external to the firm, needs to be performed as part of theintuitive process.
Organizational Change
Incremental changes
Gradual and consistent incremental improvement was the operative style inplace during the successful turnarounds. Improvements were made one day at a time by improving one thing at a time. The Monday afternoon meetings of Charles Nash are a case in point. Great changes in corporate strategy werenot discussed at these meetings. What was discussed were any letters ofcomplaint from either dealers or customers and ideas presented by employees as to how the product could be made less expensively and how quality could be improved. Gradual, incremental improvements turned Deere'sunsatisfactory Model GP tractor into the highly successful models A and Bwhich had production runs of more than 20 years. Gradual incrementalchanges were made at American Motors under Romney, at Cadillac underthe Lelands, and at the Japanese companies today.
The concept of incremental change extended far beyond product changes.Incremental changes aided the process of organizational learning as oldvalues were used as a foundation for new values (Quinn 1980). Theprocesses of change resistance ( 1983) were understood by the successfulturnaround agents. More of an appreciation was shown for the positivecontributions of people who may have been a part of the organization at thetime problems developed.
In contrast, the unsuccessful firms made many abrupt, drastic changes inplant location, markets served, products, and members of managerial teams.Examples of non-incremental change are the substantial infusion of
214

Continental Can and Xerox management into International Harvester, orKaiser's invasion of the unfamiliar low-priced car market, or AmericanMotors renaming its major car Renault. Other examples might be thechanging of the Packard assembly plant, or Hudson's invasion of theunfamiliar low-priced car market, or the aggressive acquisition of unfamiliarbusinesses by .
Incremental change is the long-established process of testing smalloperational improvements as a part of the process of continual organizational improvement. In their classic book Organizations, March and Simon (1963)describe in detail the cognitive limits to the rational model of decisionmaking and also put forth some cogent arguments for why an incrementalapproach is necessary and practical:
An individual can attend to only a limited number of things at atime....Rational behavior involves substituting for the complex reality amodel of reality that is sufficiently simple to be handled by problem solving processes....
A large complex task is broken down into a sequence of smaller tasks, theconjunction of which adds up to the accomplishment of the larger. Thefactorization of a large task can be more elaborate for an organization thanfor an individual, but the underlying reason is the same: the definition of the situation at any one moment must be sufficiently simple to be encompassedby the human mind. (March and Simon 1963, 151 to 152)
At the root of the need for incremental change is the fact that insecurity and uncertainty permeate the troubled organization. Confidence is usually low. Iftoo many things change too quickly, two problems develop. First, people inthe organization lose their orientation, and they may respond with behaviorthat is neither predictable no constructive. Second, they may simply getconfused about what to do. Bibeault puts it another way in his bookCorporate Turnaround:
In all probability, you will not have all of the facts, or, in theorganization's seasoned eyes, the seasoned judgment to take on all mattersof policy and industry practice in the first month or two. Making premature decisions increases the likelihood of making erroneous decisions. At best,you will be viewed as a meddler. At worst, you'll rupture the normal chains of command and confuse the organization. (Bibeault 1982, 178)
By keenly focusing on day-to-day operational matters and by constantlymaking small incremental changes for the better, the wise manager buildsteam confidence and gradually builds competitive strength. Old valuesprovide a useful and effective base for the building of new values.
Bringing about Change
Obviously, turnarounds involve some changes in the manner in which thefirm conducts its business, and some of these may need to be quite majorchanges. Yet, as experienced managers know, concluding that changes are
The Turnaround Experience: Real World Lessons in Revitalizing Corporations and Organizations

necessary is quite a different matter than getting things to actually change.We can benefit from the contributions that others have made in examiningsuccessful changes under turbulent conditions.
Tushman and Romanelli (1985) have proposed a “punctuated equilibrium”model of organizational evolution wherein organizations progress throughconvergent periods of minimal change punctuated by reorientations involving more change. These reorientations set the directions for the next convergentperiod. Convergent periods may be quite long. Reorientations tend to berelatively short periods of discontinuity during which power, structure, andsystems are realigned to adapt more readily to the newly perceivedenvironment.
Andrew Pettigrew (1985) found a similar need for change interspersed bystabilization when he examined the practical aspects of implementing change in large, and often older, organizations. He observed that the implementation of change was a longer-term process interlaced with political behavior andorganizational behavior. Pettigrew divides an effective change process intofive steps:
1. Problem sensing
2. The development of concern
3. The acknowledgment and understanding of the problem
4. Planning and action
5. Stabilizing the change(s)
In his book about Imperial Chemical Industries, An Awakening Giant,Pettigrew describes the ineffectiveness of moving from step 1 (problemsensing) to step 4 (planning and action), without deliberately taking the timeto cultivate step 2 (the development of concern) and step 3 (theacknowledgment and understanding of the problem).
Pettigrew’s analysis, however, is far more thought-provoking and subtle thana mere caution against proceeding too quickly. Rather, it is a scholarlytreatise concerning the workings of organizational change withinorganizations that need to change very much. Several points warrantadditional comment. First, it is not necessarily true that the need to changewill be acknowledged even by those individuals who will be most adverselyaffected if changes are not made. Second, the analysis that is a necessarypart of formulating the turnaround strategy needs to be thought-provokingand should involve new information. A systematic appraisal has to be maderegarding what few facts have to be either known for certain (rarely) orinterpolated (often) in order to make a proper decision as described by the“knowledge exploration” step advanced by Van de Ven.
Noel Tichy (1983) describes three sets of dynamic forces that influence theease with which changes can be introduced. These forces are:
216

1. Technical resistant forces
a. Resistance due to habit
b. Resistance due to fear of the unknown
c. Resistance due to absence of skills
d. Resistance due to organizational predictability
e. Resistance due to sunk costs
2. Political resistant forces
a. Resistance due to need for power
b. Resistance due to over-dependence on others
c. Resistance due to competition for power
d. Resistance due to threats to powerful coalitions
e. Resistance due to sunk costs
f. Resistance due to resource limitations
3. Cultural resistant forces
a. Resistance due to selective perception (cultural filters)
b. Resistance due to values and beliefs
c. Resistance due to security by regression to past
d. Resistance due to conformity by norms
e. Resistance due to climate for change
*Reprinted with permission from Noel M. Tichy, Managing StrategicChange: Technical, Political and Cultural Dynamics, Wiley, New York,1983.
The accomplishment of essential change is one of the most pressing tasks ofthe turnaround agent. To deal with the many aspects of resistance, theturnaround agent must be an effective teacher using old values as afoundation in order to reduce cultural resistance to change. New ways ofachieving objectives must be taught with technical credibility as well asmanagerial credibility in order to further reduce change resistance.Negotiating skills are indispensable in order to weave a workable patternthrough the forces of political resistance.
Power
The Turnaround Experience: Real World Lessons in Revitalizing Corporations and Organizations
Power can influence the change process, and some turnaround agents have agreat deal more power than others. French and Raven (1959) described thefive bases of power:
1. Reward power, whereby the influencer has the ability to reward anotherperson.
2. Coercive power, whereby the influencer has the ability to punish others.
3. Legitimate power, which corresponds to a concept of authority or legallygranted power.
4. Expert power, based on the perceived special knowledge of the influencer.
5. Referent power, which is accrued to the influencer because others desire toimitate the influencer.
The amount of power the turnaround agent has depends in part upon thepersonal history and characteristics of the individual and the circumstancessurrounding how he or she arrived on the scene. If the individual isconsidered to be competent in certain products or processes or is especiallyskilled in dealing with difficult situations, the expert power may be great. Ifthe individual has full authority from financial backers or owners, reward (or coercive) power may be great. When Walter Chrysler arrived at Maxwell, for instance, he possessed a broad base of power involving expert power,coercive power, referent power, and legitimate power. Though HaroldChurchill at Studebaker was probably a good manager, he was unfortunatelyendowed with a much narrower power base which contributed to his muchshorter stay as chairman. Some measure of power is often necessary to bring the change process through to fruition.
Acquisitions
Acquisitions are very time-consuming and distracting events. The literatureon acquisitions generally suggests that the yields accrue to the seller.Whether a firm should, or should not, acquire other firms is not the issuehere. The issue is whether acquisitions are helpful to the turnaround process. The successful companies made very few acquisitions of any consequence,and several acquisitions, such as Chrysler's foray into aerospace, probablyhindered success much more than they helped. Several unsuccessful firmsmade acquisitions, and generally they did not work out either. In the casesstudied here, the inclination of successful turnaround managers to concentrate on managing the present business versus looking to new areas is reflected in their general disinterest in diversification. Acquisitions played almost no role at all in the turnarounds of any of the successful companies. The merger ofNash and Hudson to form American Motors occurred during year -2 of thefirst American Motors turnaround, and the assumption of Hudson liabilitiesmay have hurt Nash. The acquisition of Dodge by Chrysler Corporationcame seven years after the Maxwell-Chalmers period of crisis, and after the
218

firm had enjoyed several years of profits in excess of 10 percent and aquadrupling of market share. The Dodge firm was offered to ChryslerCorporation because a banking syndicate had problems managing thecompany in a consistent manner, not because Chrysler was actively seekingacquisitions.
Nor did divestitures play much of a role with the successful companies.There were some consolidation efforts by Storrow, Nash, and Chrysler whenthey were with GM, but they focused mostly on operating efficiently or they simply stopped producing certain products. There was little interest in eitherbuying or selling portions of the business.
In contrast, the unsuccessful turnaround agents were almost frenetic aboutchanging the company's mission. From 1968 to 1985, Allis-Chalmers made20 major acquisitions, joint-venture arrangements, or divestitures. In theprocess, the number of company employees declined from 33,500 in 1963 to 12,000 in 1987, when the firm entered bankruptcy.
Practical Lessons in Focusing on Present Operations
· Strategic planning at successful companies is rudimentary and near-term.The focus is on operational issues such as improving the product,reducing production cost, and improving product quality and customerservice.
· Successful turnaround leaders center the company's attention on thebusiness it is in at the time, and they scorn diversions. Acquisitions,divestitures, diversifications schemes, and new ventures attract very littleattention.
· Planning at successful companies tends to be an incremental extension oftoday's small steps rather than a grand plan long into the future.Unsuccessful turnaround leaders are more inclined to forecast the future,but their forecasts are often wrong.
· Ideals play more of a role at successful companies. People at companies in trouble need something to get excited about. Unsuccessful companies areunexciting.
· Old values and old beliefs form the basis for new beliefs at successfulcompanies. Unsuccessful companies often discard the past, therebydenying senior organization members a sense of pride.
· Change is introduced both continuously and sporadically at successfulcompanies. Incremental improvements are made constantly. Radicalchanges are made less frequently and are interspersed by period ofstabilization.
The Turnaround Experience: Real World Lessons in Revitalizing Corporations and Organizations

Case Histories
The two cases selected for this chapter involve the same company but 20years apart. The Packard Motor Car Company turnaround of the 1930s was a masterfully executed example of strategic planning, thorough implementation, and incremental improvement. Twenty years later, under different leadership, the same company flitted from one manufacturing plant to another, from one corporate structure to another, from one chief executive to another, and from one strategy to another until finally two of the most prominent names in thehistory of the auto industry went out of business. It did not have to happen.The Studebaker-Packard turnaround of the 1950s lacked the attention todetail, the consistency, and the focus on operations that characterized earlierefforts.
Case 14 — Cars for the Methodists at PackardDuring the prosperous period of the late 1920s, the Packard Motor CarCompany sold more than half the high-priced motor cars produced. Profitswere enormous — sometimes more than 20 percent of sales. The company had achieved what was perhaps the most extensive product differentiation in theindustry, owing to a solid reputation for high product quality, advancedengineering, distinctive styling, and refined manufacturing processes includingthe very sophisticated heat treatment of metals. The strong technical capabilities of the company enabled it to obtain business as a defense contractor inaddition to its profitable automobile business. Packard engineers designed themost important aircraft engine of World War I, the Liberty, of which nearly20,000 were produced. Packard also produced marine engines and a highlyreputable line of trucks.
Packard's strong tradition of engineering excellence and product quality datedback to before the turn of the century, when James Ward Packard chose tobuild his own car after experiencing unsatisfactory performance from hisWinton. The early Packards had interesting features including an automaticspark advance and a modern-style sliding-gear transmission. The cars were alsoreliable; in 1903, a Packard Model F was driven from San Francisco to NewYork. In 1904, a new four-cylinder Packard Model K set a new 1-mile speedrecord of 77.6 miles per hour. Packards of this era were fine, quality cars forthe day, and their reputation soon spread. Instead of relying on artisticpromotional literature, the firm confidently adopted the slogan “Ask the manwho owns one.”
The two Packard brothers, James Ward Packard and William Dowd Packard,had another business which survives today as Packard Electric, so their primary interest did not remain in automobiles. They soon enlisted a partner in theform of Detroit business leader Henry B. Joy. By 1902, the firm had movedfrom Warren, Ohio, to Detroit and into a modern factory designed by Alfred
220

Kahn, later the designer of many of the Ford assembly plants. The assets ofproduct quality and good engineering were then combined with some of theindustry's most efficient manufacturing facilities. Packard sales and productionbegan to grow, and by 1906, production exceeded 1000 four-cylinder units. By1911, Packard was producing six-cylinder cars in the $4000 to $7000 pricerange, and in 1915, the firm startled the industry with the announcement of anadvanced V-12 engine called the “Twin-Six”. The Packard Twin-Six sold welland helped to establish the company as the technical leader in the high-pricedfield. By 1923, Packard registrations reached 13,382. By 1927, registrations roseto 31,355 very expensive automobiles.
During the 1920s, Packard consolidated and strengthened its position in thehigh-priced market where the Packard automobile was widely recognized as one of the most prestigious marques in the world. The accompanying comparisonof 1929 registrations illustrates the relative significance of Packard versus othermanufacturers in the high-priced field.
Table 11-0 1929 Registrations
Packard 44,634
Cadillac 14,936
Pierce Arrow 8,386
Peerless 8,318
Lincoln 6,115
During the 1920s, the company made huge profits. Although Packard's physical unit market share was modest, the automobiles sold for very high prices —often 10 times the price of a Ford and 4 times the price of a Buick. The firmwas in excellent financial condition; after-tax profit rates often approached 20percent of revenue.
But the depression dealt harshly with Packard in two ways: the absolute size ofthe luxury market was severely reduced, and many people who could afford aluxury car were reluctant to flaunt their prosperity. Packard continued to be astrong force in the high priced market, but between 1929 and 1932, this market declined by close to 90 percent. Packard sales tailed off with the market, andby 1934, Packard sold only 6552 units. This represented a more than 85percent decline from 1929 levels.
During the mid-1930s, Packard and Packard dealers lost money for severalyears running. Though the Packard motor cars of this era were among themost distinctive automobiles ever produced, the number of Packard dealers had declined from 900 in 1930 to 500 in 1933 (Fortune 1937, 43). The financialfigures for those years are shown in Table 11-1.
Packard's chief executive since 1916 had been Alvin Macauley. Macauley waseducated as an engineer and patent attorney and joined National Cash Register
The Turnaround Experience: Real World Lessons in Revitalizing Corporations and Organizations

in this capacity early in his career. He was formal but personable and practical,and his potent interest in mechanics led him to spend most of his time in thefactory and the experimental shop improving the inventions that came beforehim. In time, his interests in product development gained him an importantengineering position at the Burroughs Adding Machine Company. Later, he was made responsible for that company's production. In 1910, he left Burroughs tobecome General Manager of Packard, then a producer of 2000 cars per year.With him, he brought an enterprising young tool and die maker, Jesse Vincent,who emerged as one of the most reputable engine designers of all time (Forbes1972, 178 to 192).
Table 11-1 Packard Registrations, Revenue, Profits, and Unit Market Share, 1926 to1941
Year Registrations Sales ($000) Profits ($000) Unit market share, %
1926 29,588 77,364 13,207 0.74
1927 31,355 71,659 9,831 1.02
1928 42,961 94,677 19,198 1.07
1929 44,634 107,542 21,695 0.93
1930 28,318 57,690 9,034 0.97
1931 16,256 29,987 (2,909) 0.79
1932 11,058 15,517 (6,824) 0.93
1933 9,081 19,230 107 0.55
1934 6,552 17,315 (7,291) 0.29
1935 37,653 49,967 3,316 1.11
1936 68,772 73,053 7,053 1.81
1937 95,455 109,572 3,052 2.35
1938 49,163 50,655 (1,618) 2.30
1939 62,005 75,560 546 2.08
1940 73,794 82,242 774 1.94
1941 69,653 115,319 2,061 1.78
Under the leadership of Macauley and Vincent, Packard improved its productdevelopment program and the efficiency and quality of its production. Thecompany formalized and organized duties. It provided “Packard principles” and “Packard standards” to guide the organization on matters relating to operatingprocedures and product quality. The company was also somewhat paternalistic.Packard treated its employees well but encouraged particular character traitssuch as a good work ethic and individual sobriety. President Macauley wasstrongly against drink.
Macauley accepted the declining nature of the luxury car market with grace and resolved to adapt to the changing times. In 1933, he gathered his managerstogether and with great professionalism and decorum he proclaimed:
222

Gentlemen, our company has an Episcopalian reputation. And, it is time we do business with the Methodists. (Fortune 1937, 44)
The managers of Packard then began to implement one of the most structurally difficult turnarounds in the history of the automobile business. It involved thesimultaneous penetration of new and old markets, a radical change in theproduction system, a blending of new cultural values with old, a revitalizing ofthe dealer network, and a whole new family of products.
In the 1920s, Packard management recognized the likelihood that thethen-burgeoning high-priced market might not endure forever. Packarddeveloped a Light Eight, which made its debut in 1932, as a lower-priced carthan those Packard had offered previously. Although it was a well-engineered,quality automobile, Packard's manufacturing facilities and methods were notappropriate to a new-product offering in the upper-medium-priced field.Packard needed a radically new approach to manufacturing products for thisnew market.
To accomplish this transition, Alvin Macauley imported one of General Motors' most reputable production people, George Christopher. Christopher, who hadformerly headed production at Pontiac. With Macauley's permission, Christopher gutted the old body plant, bought some additional equipment, and laid out oneof the most efficient plants in the industry at the time. Packard's fastestproduction workers were transferred to the new plant, while the mostmeticulous remained at the senior plant.
The product which emerged from the new plant and succeeded the Light Eight was called the Packard 120. It was still a quality automobile but in thehigh-medium-price category. The styling of the car was distinctly Packard, andsome of the engineering features were later utilized by higher-priced models.Yet, the Model 120 sold for approximately one-third the price of the SuperEight and one-fourth the price of the Packard Twelve. Later it was joined bytwo more models in the midrange price class, the Packard 115 and the Packard110.
In support of the medium-priced car strategy, Packard painstakingly rebuilt itsdealer network to meet the higher-volume marketing requirements of the newcar. To do this, Macauley selected a hard-driving, brash New Yorker whosepersonal image was somewhat out of character with the patrician reputation ofPackard. But Max Gillman could sell cars and, in spite of his brusque manner,was actually well groomed in the Packard tradition, having been associated with the firm since 1919. He was known locally for his attention to business and his cold realism as reflected in the most famous Gillman quote: “Ya, I've readBabbitt. So what?” (Fortune 1937, 43).
The Turnaround Experience: Real World Lessons in Revitalizing Corporations and Organizations

Packard had always had good relations with its dealers and fostered severalindustry innovations including:
1. A uniform accounting system
2. An allied real estate business that enabled the dealers to enjoy good businesslocations
3. Frequent newsletters and personal contacts with the members of Packardmanagement including Macauley
4. Special discounts to liquidate year-end inventories
5. A special program on spare parts which allowed certain parts to be availableonly from Packard dealers
Gillman used the foundation of these good relationships and the new Packardproducts to build the number of dealers from 500 in 1933 to 1980 (1700 in the United States and 280 overseas) by 1937. Packard needed to develop anotherskill in order to implement its turnaround: the selling of other models of usedcars. During the 1920s, 80 percent of Packard trade-ins were other Packards.During the mid-1930s, as the company gained market share, 65 percent oftrade-ins were other makes (Fortune 1937, 47). To accomplish this conversion,Macauley recruited another GM manager, Bill Packer, an individual especiallyknowledgeable in the practical problem of handling step-up sales. The company also expanded its installment sales program. Previously, most Packard customers had paid cash.
With detailed attention to product development, production efficiency,marketing, and short-term sales performance, the Packard 120 was a success.Packard production for the Twelfth Series (mid-1934 to mid-1935) grew toalmost 32,000, of which approximately 25,000 were 120s (Table 11-1).
However, Macauley was not so naive as to neglect old markets as he pursuedthe new. The senior Packards continued to be produced with great care. Afterall, they had earned the company an after-tax profit rate of more than 20percent in 1929.The majestic Super Eights and Packard Twelves of the 1930swere among the most prestigious automobiles in the world at the time. Packard management reasoned that a viable medium-priced car would help rebuild thePackard dealer network, which would also sell the highly profitable seniormodels. A key element of Macauley's strategy was that Packard remain themarket leader of the lucrative luxury automobile market.
The strategy of parallel marketing of both junior and senior Packards workedespecially well during the mid-depression years. Senior Packards of this era were marvelous machines, and almost all are full classics today. Packard evenpioneered the development of air conditioning — first offered in 1938. ThePackard Twelves continued to outsell the Cadillac V12s and V16s of the period
224

by a substantial margin. The Super Eights also continued to be automobiles ofhigh distinction.
But, the depression continued. The severe economic contraction of 1938sharply lowered auto sales and again reduced the size of the luxury market. For a relatively small producer like Packard, it became increasingly difficult to fundthe production of several distinct models of automobiles. Intense competitionemerged within the company for the funding that was available. GeorgeChristopher, who later became president of Packard, did not grasp themarketing subtleties that Macauley did, and support for the senior Packardsgradually began to decline. With this came a corresponding decline inprofitability and a limitation of the company's potential to attract people to thePackard showrooms. However, Packard remained a significant producer and areputable defense contractor.
After World War II, the market for automobiles turned around and became aseller's market. Packard built some fine cars after World War II, but they didnot carry the distinction of earlier Packards. The prestigious senior Packardswould probably have sold well during this postwar period and no doubt wouldhave added profits. But Packard's leadership had changed, and Packard's maincompetitors were now Buick, DeSoto, Hudson, and Chrysler. Packard was nolonger a low-cost producer in comparison with this new competition, andwithout the senior Packards providing an umbrella of prestige, the productswere not sufficiently differentiated. The company fell far short of its fullpotential. Management changed again. A former GM president, Charles E.Wilson, then secretary of defense, pulled the defense contracts. Aninappropriate acquisition of Studebaker, the unnecessary and expensivedevelopment of the Ultramatic automatic transmission, an ill-timed move to adifferent manufacturing plant, and a tardy development of the V8 were allmanagerial mistakes that the firm made in later years. Finally, the last of theonce-glorious Packards were produced with Studebaker bodies in 1958.
Still, the Packard turnaround of the 1930s is perhaps one of the mostambitious. In order for the turnaround to be effective, Packard had to developnew products to match the market, it had to restructure its distribution system,establish an entirely new production system, set up financing programs, andcreate trade-in re-marketing systems. Considering its encompassing nature, thePackard turnaround of the 1930s was indeed a major achievement.
It also had some familiar aspects. The leading characters had technicalbackgrounds. Products were highly differentiated. Costs were systematicallylowered and controlled. Old values and old products were retained andappreciated as new products and values were cultivated. Product quality was
The Turnaround Experience: Real World Lessons in Revitalizing Corporations and Organizations

paramount and proceeded from traditional morality and discipline. Mostly,however, it was a turnaround of intense focus on present operations (Fig.11-1).
Figure 11-1. Packard Motor Car Co. revenue and cost. The PackardMotor Car Co. suffered acutely from the decline in the luxuryautomobile market brought about by the depression of the 1930s.Packard regrouped, however, by focusing intently on day-to-dayoperations and by capitalizing on the firm's well-accepted reputationfor quality products. By the late 1930s, the company had emergedfrom disaster to regain profitability and to become one of thecountry's respected defense contractors.
226

Packard Survived Because…
· Management focused on operational matters.
· Management focused on the business the firm was in and resisted thetemptation to diversify.
· Highly differentiated products were developed at very low cost.
· Talent and competence were distributed broadly throughout theorganization.
· Management fostered and articulated noble ideals.
· Efficiency and quality were rigidly maintained.
· Costs were lowered through design.
· Historical markets were nurtured and protected as new markets werecultivated.
Case 15 — Last Hurrah in South BendHenry and Clem Studebaker began operating their wagon-making shop in South Bend, Indiana, in 1852. The firm prospered first as a producer of horse-drawnvehicles and later as a respected manufacturer of motor cars, and market sharerose to 3.6 percent in 1927. Some difficulties surfaced in the 1930s, whenPresident Albert Erskine sought to support the price of Studebaker stock bypaying dividends in excess of earnings. As the depression increased in severityand length, this practice depleted the company's cash reserves. The firm entered receivership in 1935 but emerged in time to participate in the upward trend ofthe later thirties. The arrival of World War II brought extensive business toStudebaker for the manufacture of trucks and other defense products. The firm ended 1944 with nearly $32 million in cash.
As was the case with the other automobile manufacturers, Studebaker's firstpostwar models were virtually identical to the 1942 models which had beendiscontinued shortly after the war began. But Studebaker was the firstestablished manufacturer with true postwar styling. The 1947 Studebakers werelow, attractive, and very modern in appearance. Studebakers of these years were also known for their excellent visibility and high gasoline mileage. Thiscombination of attributes was well received by the public, and sales rose from103,000 in 1947 to nearly 200,000 in 1949. The company prospered from carsales but was also a significant manufacturer of trucks. In 1948, revenue grewto $384 million, with profits of $19 million. Shipments and revenue grew againin 1949, and profits grew still further, to $27.6 million. Studebaker hadestablished itself as an innovative supplier of well-designed, stylish products.Referring to the progress the firm was making toward becoming accepted as a
The Turnaround Experience: Real World Lessons in Revitalizing Corporations and Organizations

price-class participant with Ford, Plymouth, and Chevrolet, the firm adopted the slogan “Four to see instead of three.”
Shipments and revenue grew again in 1950, when Studebaker produced 268,000 units. Profits were high but lower than in 1949. Studebaker had begun toexhibit one of the telltale signs of the slipping firm, costs increasing faster than revenue.
In 1951, in celebration of the firm's upcoming one-hundredth anniversary,Studebaker announced a new overhead-valve VB engine and its own automatictransmission — an achievement of sufficient technical credibility to elicit anoffer from the Ford Motor Company to purchase Studebaker transmissions foruse in Ford products. The new engine and transmission, coupled with theattractive styling of Studebaker products, initially provided a creditable offeringto the marketplace. Over 200,000 units were shipped in 1951, and it appearedthat Studebaker would be a factor in the automobile market well into thefuture.
Meanwhile, the Packard Motor Car Company was having some good years aswell. Packard was also a highly respected defense contractor during World WarII, and though the profits on these contracts were small, the firm finished thewar in excellent financial condition with $32 million in cash at the end of 1945. Postwar Packards sold well, with production reaching a high of 105,000 units in 1949 as opposed to 81,000 for rival Cadillac. The company did miss anopportunity by failing to offer a “senior Packard” in the true sense of the term. In the seller's market that existed after the war, automobiles of the type offered by Packard before the war would have sold well and probably at highermargins. But still, the Packards of the 1940s were good cars that outsold bothCadillac and Lincoln.
The efficiency and innovation of these two older firms varied over time.Packard had attained a respected level of efficiency in its turnaround during the 1930s, and the firm's excellent history of significant engineeringaccomplishments added credibility to the firm's reputation as an innovator.Among the many Packard achievements were automatically adjusted torsion-barsuspension, the first straight-eight engine, the first 12-cylinder engine, the firstcar with air conditioning (1938), a front-end suspension system that was to berigorously copied later by Rolls Royce, one of the first four-speed gearboxes,the first car with spiral (quieter) gears, and the first hypoid rear axle. Packarddesigned and built aircraft, marine, and jet engines. The company's qualitycontrol laboratory and its advanced understanding of the heat treatment of steel were nationally recognized.
But after World War II, many key Packard personalities were advanced in age.Macauley and Vincent, perhaps the two most influential members of themanagement team, had joined the company during the World War I era and
228
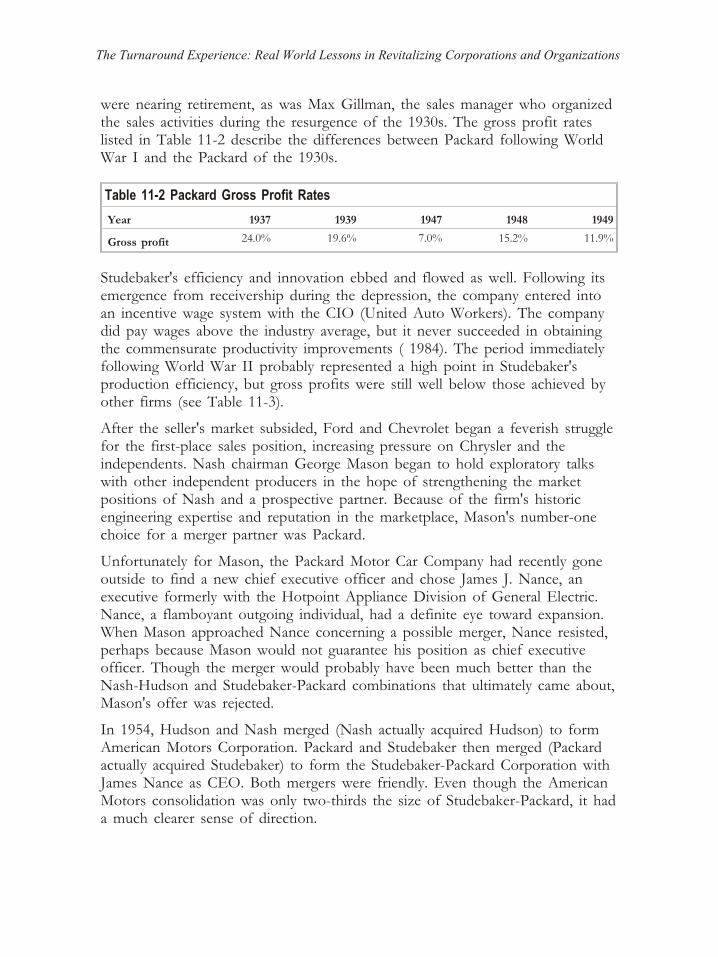
were nearing retirement, as was Max Gillman, the sales manager who organized the sales activities during the resurgence of the 1930s. The gross profit rateslisted in Table 11-2 describe the differences between Packard following WorldWar I and the Packard of the 1930s.
Table 11-2 Packard Gross Profit Rates
Year 1937 1939 1947 1948 1949
Gross profit 24.0% 19.6% 7.0% 15.2% 11.9%
Studebaker's efficiency and innovation ebbed and flowed as well. Following itsemergence from receivership during the depression, the company entered intoan incentive wage system with the CIO (United Auto Workers). The companydid pay wages above the industry average, but it never succeeded in obtainingthe commensurate productivity improvements ( 1984). The period immediatelyfollowing World War II probably represented a high point in Studebaker'sproduction efficiency, but gross profits were still well below those achieved byother firms (see Table 11-3).
After the seller's market subsided, Ford and Chevrolet began a feverish struggle for the first-place sales position, increasing pressure on Chrysler and theindependents. Nash chairman George Mason began to hold exploratory talkswith other independent producers in the hope of strengthening the marketpositions of Nash and a prospective partner. Because of the firm's historicengineering expertise and reputation in the marketplace, Mason's number-onechoice for a merger partner was Packard.
Unfortunately for Mason, the Packard Motor Car Company had recently goneoutside to find a new chief executive officer and chose James J. Nance, anexecutive formerly with the Hotpoint Appliance Division of General Electric.Nance, a flamboyant outgoing individual, had a definite eye toward expansion.When Mason approached Nance concerning a possible merger, Nance resisted,perhaps because Mason would not guarantee his position as chief executiveofficer. Though the merger would probably have been much better than theNash-Hudson and Studebaker-Packard combinations that ultimately came about, Mason's offer was rejected.
In 1954, Hudson and Nash merged (Nash actually acquired Hudson) to formAmerican Motors Corporation. Packard and Studebaker then merged (Packardactually acquired Studebaker) to form the Studebaker-Packard Corporation withJames Nance as CEO. Both mergers were friendly. Even though the AmericanMotors consolidation was only two-thirds the size of Studebaker-Packard, it had a much clearer sense of direction.
The Turnaround Experience: Real World Lessons in Revitalizing Corporations and Organizations

The combined size of Studebaker and Packard before the merger was verysubstantial. Peak employment was more than 38,000. Revenue was nearly $1billion in 1953 (a $4 billion corporation in 1988 dollars).
Table 11-3 Studebaker Profitability and Inventory efficiency
Year Company Gross profit % Inventory turns
per year
Net profit on sales
%
1947 Nash 21.8 7.1 7.2
1947 GM 19.6 5.5 5.5
1947 Studebaker 8.9 8.5 3.4
1947 Packard 7.0 6.6 2.8
1949 GM 26.4 7.9 11.5
1949 Nash 21.6 8.7 7.2
1949 Studebaker 12.2 12.5 5.8
1949 Packard 11.9 8.0 3.6
The Studebaker-Packard merger had dubious synergy. The two companiesserved quite different markets, and their products utilized different components. Both companies had considerable unused manufacturing capacity. TheStudebaker facilities in South Bend were huge in size and very old, with aninflexible, out-of-step layout. Packard added two new facilities shortly beforethe Studebaker merger. The combined plant sizes of the two firms reached 14million square feet — an enormous capacity both then and now. Thecombination of many plants at several locations reduced Studebaker-Packard'sefficiency. Also, the new firm, and the Studebaker firm before it, was unable to work productively with the employees and their bargaining units to improve the efficiency of the company's operations. Combined gross profits declined as seen in Table 11-4.
Table 11-4 Studebaker-Packard Gross Profit Rates
1950 1951 1952 1953 1954 1955 1956
10.9% 8.5% 8.8% 6.2% 6.6% 2.0% 0.5%
The early years of the Studebaker-Packard Corporation were fraught withconfusion, misunderstandings, unstable leadership, and a failure to address some of the firm's major operational needs. The acquisition of the vast and inefficient Studebaker facilities plus two other plants during a period of declining demandaggravated the company's cash-flow problems. Studebaker-Packard hired outside consultants to find a solution, but they approached operational problems onlyin portfolio terms. They provided a list of strategic selections asking whether it
230
would be better to be in this plant or that, in this business or that. They failedto address the questions of how any of the businesses or plants ran.Meanwhile, the company's products attained an unfortunate reputation forskimpy design, poor quality, and a marked propensity to rust prematurely.
In an effort to attract volume while market share was shrinking, the firmmarketed its newly developed V8 engine to American Motors in return for atacit agreement to utilize some of Hudson's unused metal-stamping facilities.When Nance failed to follow through with the counterpurchase, AmericanMotors chief executive George Romney canceled the arrangement and AMCdeveloped a more efficient engine on its own.
The Studebaker-Packard Corporation lost more than $120 million from 1954through 1958. The magnitude of these losses necessitated a curtailment of many company programs — among them the Packard program. In 1957, the finalmodel of the once-prestigious Packard automobile appeared on a Studebakerchassis. In 1958, the make was entirely dropped.
During the years shortly before and immediately following the merger, themanagers and directors of the Studebaker-Packard operations failed toproactively address significant problems of manufacturing efficiency, productdifferentiation, and day-to-day sales. Studebaker body designs went essentiallyunchanged after 1953, as did Packard bodies after 1951. Incrementalimprovements were not made on some of their engineering projects. Bothcompanies produced their own automatic transmissions when alternatives wereavailable, and both had problems with them. The long-awaited Packard V8 wastoo heavy, as was the earlier Studebaker V8. In addition, difficulty in dealingwith Nance caused a prominent customer, American Motors, to build its ownengine. Quality problems were neglected at both Studebaker and Packardoperations.
Instead of concentrating on the problems facing the company and working outaction plans to address them, the board of directors offered a confusing andoften contradictory set of directions for the company to follow. The companyhad five presidents in the 11 years from 1954 to 1963, the year when the U.S.automobile operations of Studebaker were permanently shut down. Muchinternal bickering occurred among members of the board of directors. Anacquisition strategy emerged, and several significant acquisitions were made atan enormous cost of precious cash. One of these acquisitions, FranklinManufacturing, cost the company more than $41 million at a time when cashwas scarce. Others such as Trans-International Airlines and Domowatt (anItalian maker of appliances) were complete failures. Some helpful acquisitionsdid go through, but at an enormous cost to the main business and thecompany as a whole.
The Turnaround Experience: Real World Lessons in Revitalizing Corporations and Organizations

An unexpected problem emerged when each new acquisition brought with itsome new personalities in the corporate management of Studebaker-Packardand to the board of directors. Many of these people thought they could run the company better than the present management. So, the bickering increased. Fora while, the Curtis-Wright company looked like a savior, but in the end, thatfirm lost interest as well. Studebaker stopped all automobile production in theUnited States in 1963 and stopped its Canadian production in 1966; 114 yearsafter Henry and Clem started it all.
There was a brief respite when Harold Churchill ran the company in the late1950s. Churchill, a manufacturing executive, concentrated on improving internal efficiency rather than expansion. He was interested in the present businessrather than diversification, and the temporarily successful Studebaker Lark wasdeveloped during his tenure. The firm was profitable and made $30 million in1959 and remained profitable until 1962. But the bad managerial decisions ofhis predecessors and the board of directors had created a situation that wasdifficult to address. A dispute arose among board members as to whether theprofits from the Lark should be used to improve the present business, whichChurchill favored, or whether they should be used for acquisitions. Churchilldid not have the political base to continue. In November 1960, he was replaced by a board member who favored an aggressive acquisitions policy.
Many lessons can be learned from the unsuccessful Studebaker-Packardturnaround: Focus on efficiency, customers, and products; enlist theparticipation of organization members; and strive to become a low-costproducer (particularly if you are in the low-priced field) of products thatcustomers can respect. In a turnaround situation, most other activities aresecondary. But the management of Studebaker-Packard elected to concentrateon other things. As a result, a firm that had proud historical antecedents, dating back 60 years in one case and more than 100 years in another, ceased to exist.Over time, 30,000 people lost their jobs, the town of South Bend has still notfully recovered, and foreign producers have moved in to fill the niches that atone time belonged to these two proud firms (Figure 11-2).
232

Figure 11-2. Studebaker-Packard units produced. The unit shipments of Studebaker and Packard automobiles exceeded 340,000 units in 1950,more than the units of the Oldsmobile division of GM. But, as thecompany dissipated its resources on ill-fated acquisitions, andmanagers and directors squabbled among themselves, twolong-respected marques lost potential and existing customers. Whilequality was neglected and internal efficiencies were left to chance,customers left for other makes. In 1966, the company ceased vehicleproduction, after having been in business for 114 years.
The Turnaround Experience: Real World Lessons in Revitalizing Corporations and Organizations

Studebaker-Packard Failed Because…
· Management failed to concentrate on the business the firm was in.
· Resources were diverted into new ventures while historical markets wereneglected.
· Managerial stability was lacking.
· Ideals were lacking.
· Little regard was shown for the company's past achievements and for thecompany's latent strengths.
· Top management lacked experience in the industry being served.
· Top management failed to play an exemplary role.
· Labor and management did not work well together.
234

Chapter 12 — Fair Play
In our modern world of strategic analysis and portfolio management, themore traditional values of fairness and decency do not receive muchattention in the management literature. Yet, in situation after situation,evidence suggests that adherence to concepts of basic fairness is as important to a successful turnaround as strategic direction, marketing experience, orother managerial attributes. Though fair play is a very difficult concept tomeasure, the proxy indicators available on the sample companies in thisstudy suggest that successful turnaround agents are generally perceived asdealing fairly with employees, creditors, suppliers, and customers. Theperception of fairness (or lack of it) influences the willingness oforganization members to expend the extra effort necessary to mobilize aturnaround. Successful turnaround agents exhibit honesty and trustworthiness, downplay their own importance, and allow others to share inaccomplishments. The firm in trouble needs managers who have anappropriate and balanced perspective of their personal value and theirpersonal responsibilities.
Quite often, we see highly successful business executives who do notnecessarily look the part. They don't dress well. They drive very ordinarycars. They stumble over words. They do not exude brilliance. Their publicstatements seem simple and unrefined. But, within their own organizations,they possess one essential attribute key to the entire motivational process:people perceive them as trustworthy. This perception is not easily achieved.An image of trustworthiness takes time to develop and requires many tests.But, over time, the organization comes to appreciate the reliability of itsleaders. These leaders may or may not be flamboyant, but organizationmembers know that they possess knowledge of the business, sound judgment, and a willingness to teach and that they will evaluate employees fairly andgive equitable rewards.
Organization members see them as people of fundamental goodwill. Thesequalities are often difficult to determine by those with only casual exposureto the company, such as members of the board of directors or stock analysts. They may be overlooked by aloof, out-of-touch members of highermanagement and may not be observable at all by members of the corporatestaff. Yet, integrity and trust are firmly entrenched in our most scientificunderstanding of motivation.
The Turnaround Experience: Real World Lessons in Revitalizing Corporations and Organizations

Fairness As Discussed in the Earlier Literature on Management
Managerial thought is rich in the evaluation of fairness as a variable inorganizational performance. Mooney and Riley emphasized the importance of fair play in their book The Principles of Organization (1939):
The leader must be sensitive to the rights of the led and he must takemeasures to ensure that they are maintained for every individualthroughout the organization. In other words, he must hug closely to thepolicy of “fair play.” To this end, the leaders must begin by playing fairwith each other.
Members of the scientific management school viewed fair play as anessential factor in managerial effectiveness, organizational efficiency, andincentive compensation systems. Taylor spoke about the need for a “greatmental revolution,” fundamental to the concepts of efficiency, which couldbe realized only through the legitimate coincidence of interest betweenworkers and management. Harrington Emerson (1913) listed “fairness” asone of his 12 principles of efficiency. Lillian Gilbreth devoted much of her1919 classic, The Psychology of Management, to the need for moral trainingwithin organizations:
Moral development according to scientific management results from theprovisions for cultivating:
1. Personal responsibility
2. Responsibility for others
3. Appreciation of standing
4. Self-control
5. “Squareness”
This squareness is exemplified first of all by the attitude of the management. It provides, in every way, that the men are given a “square deal,” in that the tasks assigned are of the proper size, and the reward that is given is of theproper dimensions, and is assured. (L. Gilbreth 1919)
A few years later, Oliver Sheldon (1960) wrote of the necessary integrationthat must take place between the goals of the organization and those of thesociety as a whole. In her many lectures of the same period, Mary ParkerFollett stressed the need for goal integration between workers andmanagement (Follett 1941). These theories produced a central premise thatunderscored the linkages between the integrity of members of theorganization and the success of the organization itself. When events takeplace which alter the ways in which success is earned and distributed,motivation of the individuals in the organization is affected. If the events are opportunistic or unsavory, they represent an affront to the individual's mostpowerful needs, and demotivation takes place. We may wish to reflect uponthe following excerpt from Chester Barnard's chapter “ExecutiveResponsibility” in Organization and Management:
236
Now we shall confine our thoughts to the second aspect of leadership —the more general; the more constant; the subjective; that which reflects theattitudes and ideals of society and its general institutions. It is this aspect of individual superiority in determination, persistence, endurance, courage;that determines the quality of action; which often is most inferred fromwhat is not done, from abstention; which commands respect, reverence. It is the aspect of leadership we commonly imply in the word “responsibility,”the quality which gives dependability and determination to human conduct,and foresight and ideality to purpose. (Barnard 1948)
If fairness is not present in organizations, it does not matter who is adversely affected. People tend to see the way others are treated as an index of howthey will be treated. Much of the motivational process is built around trust,more specifically, the perceptions of trust. Trust in managers as purveyors of fairness is crucial to long-term achievement.
Equity Theory
Managing a turnaround is often like dealing with children. Equity isparamount. In dealing with our own children, few of us would be surprisedif we experienced outcries of indignation as a result of giving one M&M toone child and 40 M&Ms to another. Yet, on occasion after occasion, wedistribute the rewards, perquisites, and remuneration of decliningorganizations in ways that violate our most primitive understanding of theequity principle. Some executives (not all) earn more, travel moreluxuriously, spend more, receive more personal service, and require moremaintenance than other valuable people within the organization. Often theseadditional costs are remitted without commensurate competence orresponsibility being received in return. Turnaround specialist George Gleesonhas noted: “We are paying for crepes suzette but we are getting chickensalad.” In contrast, the welfare of others is often disregarded as people arelaid off, endure pay reductions, or are reassigned under distressingcircumstances.
People expect executives to be reasonably paid, of course, and no one isgoing to argue for total parity among organization members, even of acompany in trouble. However, we may have moved beyond the point ofreasonableness in compensating our executives, particularly those involved in troubled situations. First Bank Systems, for instance, wrote off severalhundred million dollars because of imprudent bond-trading strategies as boththe president and then the chief executive received executive compensationwell in excess of a million dollars per year. For several years, executives ofMidwest Federal were proudly listed among the highest-paid executives inthe upper midwest while that institution was accumulating a negative networth of more than $900 million. Control Data once suffered the indignity of having one of its officers earn more than the corporation. Similar extremesituations have occurred at Allegheny International, E. F. Hutton, and other
The Turnaround Experience: Real World Lessons in Revitalizing Corporations and Organizations

companies. Less flamboyant breaches of equity exist elsewhere and arewidespread.
Some retrenchment is no doubt essential to the survival of some firms, andsuch emergencies are recognized by organization members, but equity isnecessary as an operating principle. Miner (1980) describes Adams'fundamental concepts of equity theory in the following way:
Although the term equity is used to describe the theory, it is at least asappropriate to describe it as inequity theory. The major motivating forceconsidered is a striving for equity, but some degree of inequity must beperceived before this force can be mobilized.
The theory starts with an exchange whereby the individual gives somethingand gets something in return. What the individual gives may be viewed asinputs, or investments in the relationship....
On the other side of the exchange are various things the individual mayreceive, the outcomes of the exchange relationship....
The third type of theoretical variable, in addition to the inputs provided and the outcomes received is the reference person or group used in evaluatingthe equity of one's own relationship....
Inequity is said to exist when the ratio of an individual's outcomes toinputs departs to a significant degree from the ratio perceived for thereference source....
Equity, balance, or reciprocity exists when outcome/input ratios for theindividual and the reference source are equal, and the motivating force can arise when there is a departure either way from this steady state....
Inequity, when perceived, results in dissatisfaction either in the form ofanger (underreward) or guilt (overreward). A tension is created inproportion to the amount of inequity. This tension in turn serves as amotivating force to reduce the inequity and move it to zero. (Miner 1980,107 to 110)
Similarly, Chester Barnard (1938) decried individual opportunism as ademotivating force in organizations. Opportunism is clearly perceived by theinformal organization, and it diminishes the willingness of organizationmembers to actively participate in the attainment of the organization'sobjectives.
With her “law of the situation,” Mary Parker Follett (1941) asserted thatpeople interpret a wide variety of meanings from the same event. Shecautioned practicing managers to make sure that the “situations” aroundimportant decisions are thoroughly understood by organization members. The simple act of making the right decision is not sufficient to enlist thecooperation of the organization. On important matters, the organization needs to understand the rationale, the situation, and the reasoning processes that go into the making of a decision. By providing organization members with full
238

knowledge of the background conditions, both the perception and therealities of fairness can be cultivated.
The Manager in an Exemplary Role
Walter Chrysler said it best. “If the spirit is not right, it is useless to look at results.” The key strategy for turnaround sometimes boils down to retainingthe most honest people who want to work hard, who know something aboutthe business they are in, and who want the company to succeed. Thisstrategy implies the need for these traits on the part of top management. Inthis study, most if not all of the successful turnarounds were headed bypeople who exhibited character traits involving old-fashioned honesty,morality, and hard work.
Observing the variance in executive behavior during periods ofcost-reduction is of interest. The cost reduction programs of successfulturnarounds begin with top management voluntarily shouldering adisproportionate share of the cost reductions. The management teams ofunsuccessful turnarounds in the cases studied here did not typically includethemselves in cost reductions. Occasionally, they continued to consume orwaste corporate resources when it was crucial for the organizations to reduce cost. Even when their firms faltered badly, some executives displayedinflated views of their own value and less conscientious views of theirresponsibilities. In some cases, the firm's board of directors reinforced thesemisperceptions by approving lucrative compensation packages or severancepackages at inopportune times. A few weeks into the very critical strike atInternational Harvester, in which the company was asking for concessionsfrom the union, the board of directors voted to forgive $2.7 million in loansto the two top officers of the company. The strike became the longest in thehistory of the industry, and the company lost as did the other stakeholders.We should wonder about the role of managerial arrogance in the demise ofthe firm. As one employee in the truck engineering department noted:
Morale is low. We see Lee Iacocca working for a dollar a year and thegeneral feeling is that our top guys are lapping up the gravy. (Marsh 1985, 248)
Ironically, executive compensation may have attenuated the momentum ofChrysler Corporation in later years. Huge compensation packages to Iacocca, though appropriate by some standards, may have reduced the corporateresolve to operate profitably. Only one Chrysler board member, DouglasFraser, expressed concern as to how Iacocca's compensation would affectcooperation from other constituencies, such as organized labor. In expressing this concern, Fraser was thoroughly correct in fulfilling his responsibilities as a corporate director by raising the question of whether the compensation was good for the company.
In the successful turnaround cases, including Chrysler Corporation in theearly 1980s, management often played exemplary roles in cost reductions.For instance, during the depression, the Packard Motor Car Company
The Turnaround Experience: Real World Lessons in Revitalizing Corporations and Organizations

reduced the total corporate officer compensation from $748,000 in 1929 to$152,000 in 1933, resulting in an average yearly compensation of about$16,000 per officer. Nash Motors similarly reduced the total compensation of its officer corps. Substantial reductions in officer pay also took place atDeere. Iacocca's salary at Chrysler was reduced to one dollar per year during the crucial stages of Chrysler's turnaround. George Romney and themanagement team at American Motors during the 1950s voluntarily tooksubstantial pay cuts during the early stages of the turnaround. Even duringprofitable periods, executives from highly successful companies such as 3Mand IBM rarely receive salaries among the nation's highest. Even within thesmall state of Minnesota, 3M's chief executive has rarely ranked among thestate's 10 highest-paid executives even though the company makes moreprofit than all of the next 10 largest companies in the state. Similarly,George Romney's golden parachute from American Motors nets him $42 permonth, while
The manner in which company executives handle costs sets the appropriatetone for the turnaround process. If management is frugal, members of theorganization are more likely to conserve resources. Similarly, if managementspends carelessly, others will too. Successful turnaround agents such as those at Deere, Buick, Maxwell, and Jeffery knew how to practice fair play andavoided many of the awkward and unnecessary disorders that impacted theunsuccessful firms.
Fair play Extended outside the Firm
Fairness is as essential in the external affairs of the company as it is insidethe organization. In some cases, the presence or absence of fair play inexternal matters can have even a more immediate effect on the outcome ofthe turnaround attempt than some internal affairs. Those who have activelyparticipated in actual turnaround attempts understand that there are a greatmany matters beyond the turnaround agent's control, such as creditorcommittees, environmental matters, regulatory matters, and the privatebehavior of key lenders, suppliers, and customers.
Responsible turnaround agents will work productively with each of thesegroups but do not control them. The cooperation of one or more externalstakeholders is almost always a necessary condition to a firm's turnaroundsuccess. Most of the time, these external stakeholders are being asked forsomething they would prefer not to give. The request may be for extendedterms from a major supplier or perhaps a partial write-down from creditorsor the option to pay them much later without interest. Other requests mightbe the shipment of goods well beyond normal credit limits or the conversion of debt into speculative stock. Rarely are any of these ideas popular with the people involved, and usually these people have the freedom to cooperate ornot as they see fit.
Some observers representing the rational perspective might argue thatexternal stakeholders will opt to pursue their own best interests. My
240
experience suggests that the rational perspective is a gross oversimplification. Much depends upon whether fairness is, or is not, perceived. Often externalstakeholders have granted concessions in the past but have never receivedwhat was promised them in return. Or, they may be sick of the entiresituation and simply wish to be done with it. Their attitude toward furthercooperation may depend on whether they have set aside sufficient reservesfor an unfavorable outcome, the number of other, similar events they arefacing at the time, constraints imposed on them by their own externalstakeholders such as regulators, and whether they believe that they are being dealt with fairly by the turnaround organization.
The wise turnaround agent will recognize that there is honor amongcreditors. Most creditors make mistakes at some time during their career, and some of these mistakes are the result of incomplete knowledge of a situation. But, creditors are busy people, and few of them have the time available tojudge every situation with the expertise they could apply if they had to. Tosupplement their own thin resources, creditors often rely on informalnetworks to gain information and make decisions. Thus, rationality may beonly part of the picture. If creditors perceive a company's unfairness asserious enough, they may decide to put the company permanently out ofbusiness so that the people involved will not bother them any more.Creditors may fail to cooperate — even if it results in a personal loss. Whatmatters in critical dealings with external stakeholders is this vague, highlysubjective, and highly individualized perception of fairness.
Fairness is a concept so universal and so precious that it impacts executivesand workers alike. Walter Chrysler ultimately left General Motors in partbecause he felt that a competent supplier was being unfairly treated by theGM chief at the time, Billy Durant. Similarly, key executives left companieslike Bendix, First Bank Systems, Control Data, and other companies because of their belief that fair play was not in evidence. When fair play is perceived as being absent, while others are asked for sacrifice, the situation affects theesprit de corps of fellow executives, middle managers, and factory workersalike.
Practical Lessons in Fair play
· Successful companies operate with consistent and exemplary standards offairness in their dealings with employees, creditors, suppliers, andcustomers. Unsuccessful companies often have reputations of unfairness.
· If fairness is not present, it does not matter who is the victim. People viethe treatment of others as an index of how they will be treated.
· Unsuccessful companies attempt to use suppliers as sources of cash (bylengthening out payables) and as sources for new processes and concepts(often developed at supplier expense in anticipation of future business).Successful companies value suppliers as extensions of their ownorganizations and rarely become involved in opportunistic transactionswith them.
The Turnaround Experience: Real World Lessons in Revitalizing Corporations and Organizations

· The wise turnaround agent will recognize that there is honor amongcreditors. Noble creditors may refuse to cooperate with the ignobletroubled company even if it means greater personal loss.
· Successful turnaround leaders set an example for the organization duringtimes of misfortune by accepting less pay as the first step in costreductions and by handling the affairs of their office in a frugal manner.
· Successful turnaround leaders value the economic and social stability ofthe company associates and attempt, as best they can, to minimizedisruption.
242

Case History
During the great depression, Deere had suffered a revenue decline of morethan 90 percent from its peak of 1929. The economy was in terriblecondition, and on top of that, Deere products were not meeting the needs ofthe marketplace. From 1931 to 1933, company losses were nearly 40 percent of company revenues. Deere was only one-eighth the size of InternationalHarvester, which dominated the industry at the time and Deere stock hadtumbled from $690 per share to $3.50. As things looked their bleakest,Deere officers, owners, and managers personally sacrificed in a manner thatillustrates the role of fair play during the turnaround process.
Case 16 — Midwestern Ethic at DeereBy 1932, Deere & Co. was 95 years old. The company was known for its close attention to customer needs and its steady supply of quality farm equipment.The traditions and values of the original John Deere had been passed onthrough family members who, individually, had run the various operating unitsof the company since its inception in 1837. “You can't sell plows to a hatter,”William Butterworth would say. He and the other members of the Deere family were always in touch with what the farmer needed. In order to ensure thatthese important perceptions were not lost, many members of the Deeremanagement team engaged in farming themselves.
The ever-present attention to the customer served Deere well through the years. The company had become a significant number-two producer in its industry. Itwas, however, still well behind the huge International Harvester, which wasseveral times the size of Deere. Deere was highly profitable during someperiods but experienced difficult times shortly after World War I. Receivableproblems, problems with the local economies in large overseas markets, and the general economic conditions at home combined to cause Deere an 80 percentrevenue decline in the years following the war. During 1920 and 1921, morethan 150 Deere dealers went bankrupt, and the company was in a precariousfinancial position. The later years of the 1920s were not as robust for theagricultural sector as they were for other segments of the economy, but Deeredid recover, and by the late 1920s profits were once again healthy as revenuesreached $80 million.
By 1932, however, the situation had dramatically changed again, resulting in the company's worst crisis ever. Not only did the bottom drop out of the farmeconomy, but the usually attentive and customer-oriented management of Deerefailed to match one of its key products to the marketplace. For most of thecompany's history, each Deere plant enjoyed considerable autonomy indeveloping, marketing, and producing products for particular markets ( 1984).Each Deere plant served its own particular market, and the staff at each
The Turnaround Experience: Real World Lessons in Revitalizing Corporations and Organizations
specialized plant maintained a high degree of contact with their respectivecustomers. Key decisions were made at the plant level. This informal structureserved the company well, and Deere was normally highly responsive to itsmarkets. The one exception was with the general purpose (GP) tractor, one ofthe few Deere products developed by the central research and developmentdepartment. Unfortunately, this centralized department failed to develop aproduct adequately matched to its market, a product which served Deerepoorly.
Prior to 1924, most tractors were powerful, built low to the ground, andcumbersome. They had little crop clearance and were hard to maneuver. Theywere not bad for plowing, but they were not designed for cultivating, planting,and other fieldwork. During this era, the Fordson tractor, with its low cost and basic operation, accounted for more than 70 percent of total tractor sales and76 percent in 1923 (Broehl 1984, 478). During the early 1920s, InternationalHarvester designed a tractor which was far more maneuverable and far betteradapted to a much wider variety of general farm work. The tractor had greatercrop clearance, was of moderate size, showed better economy, and was of thefour-row tricycle type for better maneuverability. It was called the “Farmall.”The International Harvester Farmall sold very well and soon displaced theFordson as the leading tractor in a much larger and more rapidly expandingmarket. By 1928, International Harvester had garnered 68 percent of the tractor market (Fortune 1933).
In the meantime, Deere attempted to field a general-purpose tractor of its own, and the GP project was eagerly taken on by the central research anddevelopment department. The result was a product inappropriate to themarketplace. The GP tractor was a three-row model, not a four-row, and not as maneuverable or productive in terms of either fuel or time. It failed to develop the horsepower it was rated, and other important 7details were overlooked.During a time when tractor sales were increasing and the economy was sound,Deere was left with a suboptimal product (Broehl 1984). Fortunately, otherDeere products sold well during the 1920s, and Deere had enough other people who understood what the market needed so that the company was stillprosperous. But, some valuable time had been lost, and by the time thedepression arrived, the company had been weakened by not offering a bettergeneral--purpose tractor to the marketplace.
To make matters worse, the quality of the competition had improved. A seriesof mergers and other consolidations had enabled Oliver, Minneapolis-Moline,and Massey-Harris to become larger and stronger competitors. The innovativeand well-equipped Allis-Chalmers Corporation announced its owngeneral-purpose tractor called the “All-Crop.” Under experienced management,the well-known J. I. Case Company emerged as an efficient producer of newproducts. The number of tractor manufacturers shrank from 186 in 1921 to 38
244
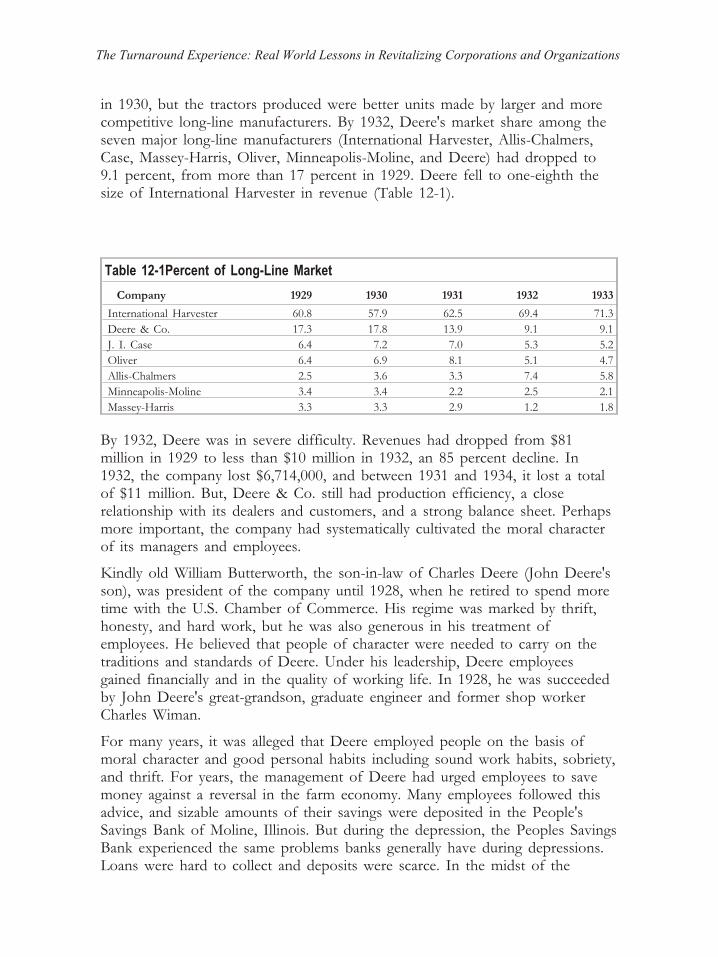
in 1930, but the tractors produced were better units made by larger and morecompetitive long-line manufacturers. By 1932, Deere's market share among theseven major long-line manufacturers (International Harvester, Allis-Chalmers,Case, Massey-Harris, Oliver, Minneapolis-Moline, and Deere) had dropped to9.1 percent, from more than 17 percent in 1929. Deere fell to one-eighth thesize of International Harvester in revenue (Table 12-1).
Table 12-1Percent of Long-Line Market
Company 1929 1930 1931 1932 1933
International Harvester 60.8 57.9 62.5 69.4 71.3
Deere & Co. 17.3 17.8 13.9 9.1 9.1
J. I. Case 6.4 7.2 7.0 5.3 5.2
Oliver 6.4 6.9 8.1 5.1 4.7
Allis-Chalmers 2.5 3.6 3.3 7.4 5.8
Minneapolis-Moline 3.4 3.4 2.2 2.5 2.1
Massey-Harris 3.3 3.3 2.9 1.2 1.8
By 1932, Deere was in severe difficulty. Revenues had dropped from $81million in 1929 to less than $10 million in 1932, an 85 percent decline. In1932, the company lost $6,714,000, and between 1931 and 1934, it lost a totalof $11 million. But, Deere & Co. still had production efficiency, a closerelationship with its dealers and customers, and a strong balance sheet. Perhapsmore important, the company had systematically cultivated the moral characterof its managers and employees.
Kindly old William Butterworth, the son-in-law of Charles Deere (John Deere'sson), was president of the company until 1928, when he retired to spend moretime with the U.S. Chamber of Commerce. His regime was marked by thrift,honesty, and hard work, but he was also generous in his treatment ofemployees. He believed that people of character were needed to carry on thetraditions and standards of Deere. Under his leadership, Deere employeesgained financially and in the quality of working life. In 1928, he was succeededby John Deere's great-grandson, graduate engineer and former shop workerCharles Wiman.
For many years, it was alleged that Deere employed people on the basis ofmoral character and good personal habits including sound work habits, sobriety, and thrift. For years, the management of Deere had urged employees to savemoney against a reversal in the farm economy. Many employees followed thisadvice, and sizable amounts of their savings were deposited in the People'sSavings Bank of Moline, Illinois. But during the depression, the Peoples Savings Bank experienced the same problems banks generally have during depressions.Loans were hard to collect and deposits were scarce. In the midst of the
The Turnaround Experience: Real World Lessons in Revitalizing Corporations and Organizations

depression, in 1932, the People's Savings Bank was hit by a disgracefulembezzlement of $1.25 million. The bank seemed destined to fail — and withthe failure, much of the savings of the Deere employees would vanish.
Wiman and Butterworth both felt that it would be a travesty if the Deereemployees lost the savings that the company had encouraged them toaccumulate. So, they gathered together the members of the Deere family andthe company and bank directors (some individuals served on both boards).Collectively it was decided that an assessment should be levied on each of these people individually. Then the money was put into the bank to preserve it andthe savings of the community.
Of course, during the great depression, Deere & Co. was suffering on its own.In response to its huge losses (67 percent of revenue in 1932), managementhad initiated many severe cost-reduction measures. Dividends on preferredstock had been cut from $7 to 20 cents. Common dividends had beeneliminated. Deere stock had fallen from a high of $690 in 1930 to $3.50(Broehl 1984; Fortune 1936). Executive compensation was cut by 25 percent,managers' salaries were cut by 10 percent, and employees' hourly wages werecut by 4 percent. Then, elaborate schemes were worked out to give each family some work. Yet it was in this atmosphere that the management and owners ofthe company elected to use their personal resources to salvage the savings ofthe community in general and company employees in particular. The strains ofthe depression continued to work on the bank and region, but the interventionby Deere & Co. management and owners brought at least some temporaryrelief to the bank and the community and attracted the interest of the nationalpress.
The clannish nature of the Deere organization, coupled with the fact that many Deere managers were farmers, enhanced a close relationship with dealers andcustomers. Five branch managers were directors in the company, and one ofthem, C. C. Webber of Deere & Webber of Minneapolis and also a Deeregrandson, was the company's second-largest stockholder. The company was sointerested in personal contacts with its customers that it insisted that all 1.5million copies of the company magazine, The Furrow, be hand-addressed bymembers of the Deere organization (Fortune 1936).
Deere's primary distinction, however, was the efficiency of its factories. Deerefactories reflected a clear-cut strategy that emphasized quality, peak efficiency,and employment of people of good character, with each factory making its own decisions in the manner that best served a particular set of customers. In thevery early days, the company adopted the practice of producing equipment with a small number of rugged and common component parts. Deere tractors hadtwo cylinders for some very explicit engineering reasons which sales managerFrank Silloway articulated in 1918:
246

1st: A two cylinder tractor can be built cheaper than a four and price is an important factor, because the tractor business is a business that must winits economy.
2nd: The tractor, unlike the automobile, must pull hard all the time. Thebearings must be adjusted for wear. There are half as many bearings on atwo cylinder tractor and half as many valves to grind.
3rd: There are less parts to get out of order and cause delay.
4th: The bearings are more accessible on a two cylinder horizontal enginethan on a four cylinder vertical engine.
5th: Two cylinder engines will burn kerosene better than four.
6th: Four cylinders are not necessary on tractors. The fact that a tractor isgeared 50 to 1 instead of 4 to 1 eliminates all jerky motion. The engine ofa tractor can be made heavy and have a heavy fly wheel and can bemounted on a rigid strong frame. Therefore, a two cylinder tractor issatisfactory in a tractor and when it is, why go to the four cylinder type.(Broehl 1984, 405)
Deere continued with this same engineering concept for its tractors through1960. This clearly articulated philosophy continued to provide productionadvantages to Deere for those many years. The Deere tractor had approximately 1400 fewer parts than its comparably powered counterparts fromAllis-Chalmers, Case, or International Harvester.
Deere factories were efficient as well. Even during the tough years of thedepression, Deere's gross profit rates continued at levels near the top of allproducers (Table 12-2). Likewise, the Deere sales organization was efficient. In1929, selling expense was roughly comparable to that of industry leader,International Harvester, but Deere enjoyed a 12-point advantage in productioncost (Broehl 1984, 805).
Charles Wiman, a Yale engineering graduate, was very careful to preserve thecompany's new-product development effort during the harsh times of the1930s. He continued to preach caution and thrift on a daily basis and insistedthat the managers and executives of the company operate in spartansurroundings. But he actively promoted new-product development and waspersonally involved in reviewing the progress. Wiman would often drive up and down the testing fields to closely examine the performance of experimentaltractors and implements. By 1932, Deere was offering a new, more powerful,and better-engineered general-purpose tractor called the “Model A”, of which293,000 were sold during its 20-year production run. The following year Deereintroduced the Model B and sold 309,000 over a 19-year period (Broehl 1984,520 to 521). The Models A and B, with their high quality, reliability, and lowcost of operation, resulting from the ability to burn “anything you can pour
The Turnaround Experience: Real World Lessons in Revitalizing Corporations and Organizations

into the tank” (Broehl 1984), provided a winning combination for Deere.Profits and revenue began to grow.
Table 12-2 Gross Profit Rates (In Percent) of Long-Line Companies
Company 1927 1928 1929 1930 1931
Deere & Co. 41.65 41.67 43.19 40.33 34.53
J. I. Case 45.95 46.45 40.61 39.54 31.78
Oliver 34.75 31.03 28.49
International 27.39 30.62 30.96 28.85 24.52
Massey-Harris 25.58 22.67 23.40 18.39 23.74
Allis-Chalmers 21.28 28.13 16.51 19.87 21.62
Minneapolis-Moline 28.62 29.01 13.77
Sources. Federal Trade Commission 1938; Moody’s Industrials Manual, 1932.
In parallel with Deere's progress in product development and manufacturingefficiency, the firm adopted a strategy of very technical and factual advertising.The advertising stressed the technical virtues of Deere products in terms ofsimplicity, reliability, operator convenience, and cost of operation.
By 1937, sales had climbed back to more than $100 million, and after-taxprofits rose to $14.9 million — still below 1929 levels but far better than thesevere losses of 1932 and 1933. By 1941, the company was earning before-taxprofits of $25 million on sales of $125 million, but taxes had increased to keepafter-tax earnings at the $15 million level.
The engineering accomplishments associated with the Models A and B, together with many other technical achievements, established Deere as a dependable and practical supplier of quality and innovative products to the agricultural industry.
The Deere turnaround was in reality a long process of readjustment followingthe problems experienced after World War I. The turnaround was successful,and the company went on to improve profits and gain market share. By 1971,the company had overtaken International Harvester in profits. By 1982, it waslarger in terms of revenue. Today, the company survives as a respectedworldwide producer of agricultural machinery, with a roughly 60 percent market share in North America. Its former, much larger competitor InternationalHarvester, which at one time was eight times the size of Deere, has departedthe business.
The themes of the Deere turnaround come as no surprise: familiarity withmarkets, innovative products, low-cost operation, spartan surroundings, a focuson operations, and the selection of employees on the basis of work ethics andcharacter traits. But perhaps the most significant characteristic of the Deereturnaround was the presence of fair play during a time of deprivation. It is one thing for managers and owners to give from their surplus; it is entirely another
248

matter to make sacrifices for the benefit of others when there is less to give.Strong character traits among leaders, the cultivation of traditional values among both managers and workers, and a sense of managerial responsibility are theattributes that helped to make the Deere turnaround successful.
Deere Survived Because…
· Top management exhibited fair play.
· Operational efficiency was very high.
· Product quality problems were quickly corrected, and quality becameexcellent.
· Top management had extensive experience in the industry being served.
· Top management had technical experience.
· Product features and benefits were distinctive.
· Continuity was preserved with historical markets.
1951 John Deere B Owned by the author
The Turnaround Experience: Real World Lessons in Revitalizing Corporations and Organizations

Part 5
The Turnaround
Experience Looking Ahead
The world economy is being ravaged by collective rapacity and institutionalneglect. For 40 years, we have shifted resources from industrial companiesthat historically have provided jobs for much of the population to otherprograms, some meritorious. But, as the industrial economy shrinks and asresources are dissipated on activities unrelated to tangible production, theAmerican standard of living is slipping from our grasp, sustained withdifficulty only by huge borrowings from other countries. The approach ofemphasizing the service economy and the activities of government is doomed to failure because it is neither practical nor without risk. In order to surviveas a nation, and to avoid the social and economic problems oftwentieth-century Germany or eighteenth-century France, we will have toproduce.
Yet, much of our productive capacity is in disarray. As problems with theworld economy deepen, as layoffs multiply, as financial markets becomeincreasingly volatile, and as more and more people and companies file forbankruptcy, it is clear that we need new, more specific approaches toeconomic revitalization. General, economy-wide approaches involving fiscal,monetary, tax, and regulatory policies have potential, but they are hard toorganize. The problem with macro-level policies is that they are allcoordinated through ungainly governments which often drift aimlessly inresponse to cumulative political considerations and fail to do what needs tobe done. In a manner consistent with the case studies reviewed here,revitalization demands character, technical competence, and fair play, alongwith small incremental steps oriented to increasing the competitive edge ofindividual firms participating in key strategic industries. Millions ofindividually helpful actions to improve the performance of individualcompanies have more likelihood of happening than any conceivable colossalact of government, however desirable it may be.
Developed economies can regain their strength and vitality only if we learnto fix some of the large industrial enterprises that played such a major rolein the initial building of national economies. It is simply too costly, both inmoney terms and in people terms, to allow the productive sectors of oursocieties to continually drift toward oblivion. We are not prepared for thesocial upheaval and political consequences that will result. Remedial skills,
The Turnaround Experience: Real World Lessons in Revitalizing Corporations and Organizations

the skills to repair, to resurrect, and to enlist the cooperation of diverseinterests, are in demand.
The chapters in Part 5 briefly summarize some of the strategic aspects ofturnaround management and then look ahead to the future of turnarounds askey ingredients to restorative action in our modern society. The discussion of the strategic profiles of successful companies in Chapter 13 should behelpful to managers, investors, workers, and other stakeholders. Chapter 14examines the intricate connections between corporate revitalization andindustrial renewal at the national level. Chapter 15 offers somerecommendations for the future.
252
Chapter 13 — The Strategic Profilesof Turnaround Cases
Companies successful in turnarounds achieve both the attributes of low-costproduction and product differentiation through the enlightened leadership oftop management. These attributes are crucial to turnaround success; however, the sequence of movements toward these objectives is also of interest assuccessful companies appear first to become efficient, low-cost producers and then to progress toward product differentiation. Though there are exceptions,this sequence of low-cost production followed by product differentiation isthe most common path toward an improved strategic position.
Foreign producers have often employed the same sequence in enteringmarkets in the United States. Sony television sets and Toyota automobilesfirst appeared as low-cost products. Later, after many investments in productcharacteristics made possible by internal efficiencies, the offerings of thesesame manufacturers were broadly perceived as high-quality differentiatedproducts. The same could be said of Japanese bearings and machine toolsand other foreign products as well. We see this same sequence employed byAmerican producers such as Nucor, Loctite, Maytag, 3M, and Autodesk.
Successful Turnaround Profiles
The successful turnarounds in our sample also followed the strategicsequence of low-cost production followed by product differentiation, although the combinations of low cost and differentiation certainly varied. During theturnaround process, most successful companies initially moved upward andthen diagonally to the right (Figure 13-1). Note that this is really a two-stepprocess. Charles Nash had the clearest perception: become highly efficient at manufacturing and then use some of the savings to differentiate the productby adding quality and differentiating features. Cadillac moved from aninefficient producer of modest undifferentiated cars to a highly efficientproducer of one of the most prestigious marques in the world. Cadillacmoved from box 9 to box 1 in what was probably the most dramatic shift(Figure 13-2).
The Turnaround Experience: Real World Lessons in Revitalizing Corporations and Organizations

Strategic Positioning for Survival
Figure 13-1 Strategic positioning for survival. Survival is most likelywhen a company is a low-cost provider of differentiated products orservices and least likely when undifferentiated products areexpensively produced. A firm’s survival position is enhanced if eitherproduct differentiation or low-cost operation is present, but bothattributes seem to be necessary to ensure turnaround success.
254
Marginal
Survival
Position
(3)
Poor
Survival
Position
(6)
Worst
Survival
Position
(9)
Poor
Survival
Position
(8)
Best
Survival
Position
(1)
Good
Survival
Position
(4)
Good
Survival
Position
(2)
Marginal
Survival
Position
(7)
Possible
Survival
Position
(5)
Low HighMedium
LOW
HIGH
MEDIUM
COST
OF
OPERATION
PRODUCT DIFFERENTIATION

Buick automobiles sold well and possessed some differentiation. What wasneeded was to organize production so that it could be accomplished at alower cost. By consolidating product lines and improving efficiency, Buickmoved upward along the low cost of production axis from box 5 to box 2.To some degree, Deere's situation was perpendicular to that of Buick's.Deere was always a low-cost producer. With the advent of the Models A &B tractors and other product improvements, Deere moved laterally along theproduct differentiation axis from box 3 to box 1.
The early Thomas B. Jeffery Company ranked medium in terms of bothdifferentiation and production cost. With the arrival of Charles Nash, thecompany became one of the lowest-cost producers in the industry whilesimultaneously improving product differentiation. The new Nash Motorsmoved to the very top position in box 2. During the low point of its periodof crisis, when bankruptcy was imminent, Maxwell-Chalmers was a high-cost producer of negatively differentiated products. Efficiency was low, andMaxwell products had earned a poor reputation in the marketplace. With thearrival of Chrysler, Zeder, Skelton, Breer, Mason, and Hutchinson, thecompany began to make substantial progress on both production cost andproduct differentiation. The first Chrysler car marked a 20-year progressiontoward high-differentiation low-cost production, which resulted in the firm'sbecoming the nation's second-largest producer.
American Motors had achieved low-cost operation earlier in its history, butthis favorable attribute was retarded by the acquisition of Hudson. As theintense competition of the 1950s spurred the rapid development of morepowerful engines, additional convenience and performance features, andstyling innovations on the part of competitors, American Motors moved to aless favorable differentiation position. During the American Motorsturnaround from 1958 to 1963, the company greatly reduced its costs andconcentrated its product-differentiation efforts on a particular marketsegment. The resulting specialization economies, the firm's quality emphasis,and the selling of the compact car concept (as opposed to “cheap car”) allhelped the move to a more favorable position in box 2.
During the late 1970s, Chrysler Corporation was a high-cost producer with a breakeven point of 2.5 million medium-quality cars per year. Six years later,Chrysler emerged as one of the industry's most innovative producers, with abreakeven point of 1.3 million cars. Chrysler moved from near insolvency to a strongly competitive position before losing much of this advantage with the diversification program of the late 1980s. Beset by intense internationalcompetition during the same period, Ford Motor Company was also forced to radically alter both its cost structure and its processes of innovation. Usingproduct design as the main vehicle to improve quality and reduce cost, Fordmoved from box 5 to box 1 to achieve the best strategic position of anyU.S. producer.
Packard was the only one of our successful cases to move to a lower levelof product differentiation. Packard products enjoyed one of the mostprestigious positions in the industry at the start of its turnaround. Packard
The Turnaround Experience: Real World Lessons in Revitalizing Corporations and Organizations

moved into box 5 with its new medium-priced 120 and 115 models. In doing so, the company moved into a much larger market. What is important is that all the companies that executed a lasting turnaround emerged with afavorable strategic profile involving some combination of low-cost production and product differentiation (Figure 13-2).
Figure 13-2. Strategic profiles — successful cases. Successfulturnarounds often first achieve low-cost operation and then enhanceproduct differentiation in a two-step process. Charles Nash had theclearest perception: become highly efficient at manufacturing and thenuse some of the savings to differentiate the product by adding qualityand features.
Unsuccessful Turnaround Profiles
The unsuccessful firms were unable to manifest a favorable strategic profileinvolving low-cost production and product differentiation. Willys-Overlandshowed better performance temporarily because of actions initiated during the short stewardship of Walter Chrysler, but the company's lack of long-termefficiency in manufacturing precluded it from surviving during a majordownturn. The Willys-Overland turnaround began with a company that was a
256

high-cost producer of undifferentiated products. With the arrival of WalterChrysler, the company temporarily moved to a more favorable position. After his departure, the company continued to sell vast quantities of cars, butproduction costs rose and the company's numerous products were notsufficiently differentiated to sustain sales under less favorable conditions.Ultimately, Willys-Overland moved back to box 9 and entered receivership.
After a promising start, the Willys-Overland turnaround strategy put toomuch emphasis on marketing and sales and not enough on productionefficiency and product differentiation (Figure 13-3).
Figure 13-3. Strategic profiles — unsuccessful cases. Unsuccessfulfirms are seldom able to exhibit a favorable strategic profile involvinglow-cost operation and product differentiation. Costs remain high while product quality, features, and benefits remain poor. Under theseconditions, failure is an almost universal outcome.
The same was true of Studebaker-Packard Corporation during the 1950s.Studebaker (together with Packard) entered the decade selling more than340,000 cars per year. Combined market share was nearly 6 percent in 1949.
The Turnaround Experience: Real World Lessons in Revitalizing Corporations and Organizations

One decade later, Studebaker-Packard was essentially out of business.Production techniques were such that profitability could be sustained onlyduring a boom period, and even then with only third-rate results.
Within 3 years of its formation, Kaiser-Frazer became the leadingindependent producer of automobiles in the United States, a position the firm attained by offering attractive styling during a seller's market. The rest of the car had basically prewar engineering, and styling proved to have a limitedlife as a differentiating feature. When other producers restyled,Kaiser-Frazer's main competitive edge was lost. Operating costs were toohigh. In the final analysis, the company could not sustain its competitiveposition because of high costs of production and limited long-term productdifferentiation.
Hudson products had differentiating features which were both favorable andunfavorable. The full-size Hudsons produced from 1948 to 1954 were goodautomobiles produced at high cost. However, from 1929 to 1947, thecompany experienced a long period of low efficiency and medium-to-lowproduct differentiation. This important period sapped resources as thecompany lost money for 7 years out of 10 from 1931 to 1940. In only 1year, 1936, did profits exceed 4 percent of revenue. By the mid-1930s, theantiquated splash-oil systems and three main-bearing six-cylinder engineswere obsolete. The company gradually moved to a position of a high-costproducer with mixed differentiation.
Allis-Chalmers entered the 1960s as an innovative and efficient producer ofelectrical and agricultural machinery with high gross profits. But, after beinginvolved in a hostile takeover attempt during the late 1960s, the companyspent the next 15 years diverting its resources into a wide range of activities which were not related to the company's major businesses. Product cost andproduct differentiation were neglected, and by the end of the 1970s,Allis-Chalmers ceased to be competitive in its major markets. From 1981 to1986, the company lost more than $800 million. The firm entered bankruptcy in 1987.
After several decades as one of the country's largest firms, InternationalHarvester lost both efficiency and innovation as the firm's inexperiencedmanagement diverted attention from key operational matters, such as product development, efficiency, sales, and inventory management. By themid-1980s, the firm was forced to exit from the market it had dominated for much of its 150-year history. The once-mighty International Harvester wasstruggling to remain in business by producing large trucks.
The ability of the successful companies to remain efficient in themanufacture of products was the cornerstone of their turnaround success.Their ability to compete was not particularly related to exotic marketingprograms, portfolio management, the cost of local taxes, financial skills, orsales expertise. It was largely a function of managerial skills in the fields ofproduction and product differentiation along with industry and technical
258

experience and a basic sense of fairness in dealing with employees,customers, and others. No substantial differentials in production wage ratesexisted between the companies that emerged and those that did not. The fact is that people like Charles Nash, Walter Chrysler, the Lelands, and thepeople at Deere knew how to run industrial companies. The people atWillys, Hudson, Allis-Chalmers, Studebaker, and several of the rest,including International Harvester, did not know how to run such companies.International Harvester at one time was far and away the largest producer inits industry.
But efficiency and innovation may not be sufficient conditions forturnaround. Trustworthiness and fairness were factors as well. Most of thesuccessful turnaround people were from rather humble origins. They werenot interested in high salaries or fancy offices or heavy involvement in highsociety. They were people who worked hard, knew their jobs, fostered anatmosphere of trust, and generally enjoyed wholesome personal reputations.They tended to be people who appreciated the contribution of others, eventhose who may have been a part of the company when the problems began.Successful turnaround agents allowed recognition of others. It takes morethan one person to turn a company around. The successful chief turnaroundagents were people who could share center stage.
Summary of Findings
The chief findings of this research into the nature and causes of successfulturnarounds are summarized in the following sections.
Relating to the Nature and Severity of Economic Difficulties
1. Large dominant firms as well as smaller producers failed. Large size did notseem to be a factor in turnaround success.
2. During the early years of the turnaround experience, the successfulturnarounds experienced more pronounced business declines and deeper lossrates during the low points of their principal periods of crisis. This mayreinforce the Schendel and Patton (1976) hypothesis that a severe decline inprofits and/or revenue will motivate positive management action. Slowstagnation will not.
3. Improved performance on the part of the successful companies was notimmediately apparent. During the period of decline and the period of crisis,the unsuccessful companies generally looked better financially. From year 2forward, the successful companies began to emerge as much more consistentand much more profitable.
Relating to Being a Low-Cost Producer
4. The successful companies were noticeably more efficient in operations thanthe unsuccessful firms. Gross profit rates and inventory turn ratios were
The Turnaround Experience: Real World Lessons in Revitalizing Corporations and Organizations
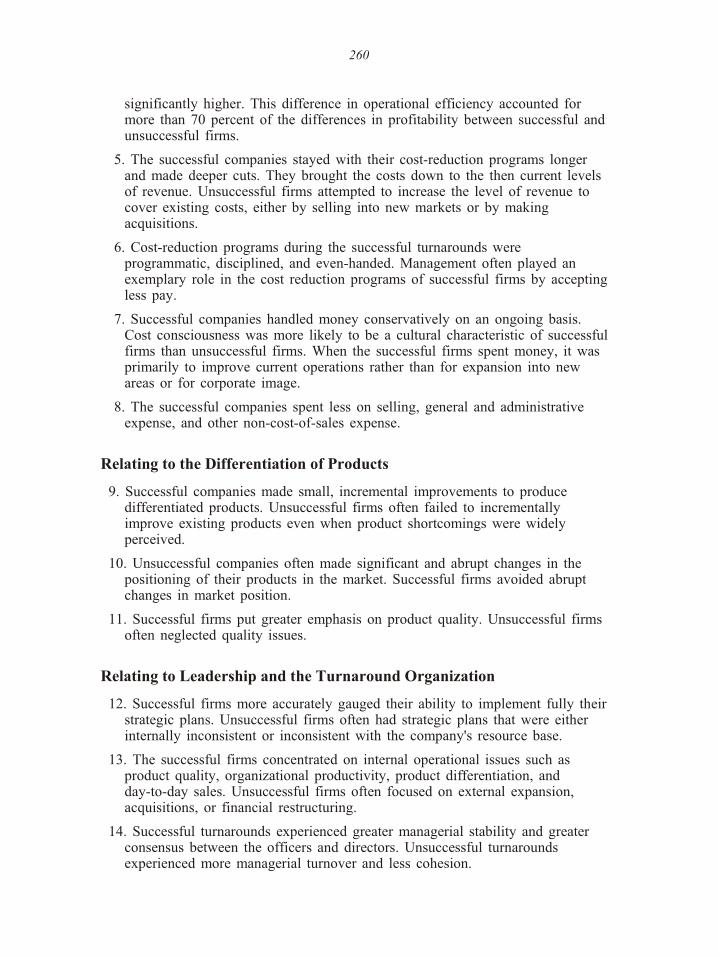
significantly higher. This difference in operational efficiency accounted formore than 70 percent of the differences in profitability between successful and unsuccessful firms.
5. The successful companies stayed with their cost-reduction programs longerand made deeper cuts. They brought the costs down to the then current levelsof revenue. Unsuccessful firms attempted to increase the level of revenue tocover existing costs, either by selling into new markets or by makingacquisitions.
6. Cost-reduction programs during the successful turnarounds wereprogrammatic, disciplined, and even-handed. Management often played anexemplary role in the cost reduction programs of successful firms by accepting less pay.
7. Successful companies handled money conservatively on an ongoing basis.Cost consciousness was more likely to be a cultural characteristic of successful firms than unsuccessful firms. When the successful firms spent money, it wasprimarily to improve current operations rather than for expansion into newareas or for corporate image.
8. The successful companies spent less on selling, general and administrativeexpense, and other non-cost-of-sales expense.
Relating to the Differentiation of Products
9. Successful companies made small, incremental improvements to producedifferentiated products. Unsuccessful firms often failed to incrementallyimprove existing products even when product shortcomings were widelyperceived.
10. Unsuccessful companies often made significant and abrupt changes in thepositioning of their products in the market. Successful firms avoided abruptchanges in market position.
11. Successful firms put greater emphasis on product quality. Unsuccessful firmsoften neglected quality issues.
Relating to Leadership and the Turnaround Organization
12. Successful firms more accurately gauged their ability to implement fully their strategic plans. Unsuccessful firms often had strategic plans that were eitherinternally inconsistent or inconsistent with the company's resource base.
13. The successful firms concentrated on internal operational issues such asproduct quality, organizational productivity, product differentiation, andday-to-day sales. Unsuccessful firms often focused on external expansion,acquisitions, or financial restructuring.
14. Successful turnarounds experienced greater managerial stability and greaterconsensus between the officers and directors. Unsuccessful turnaroundsexperienced more managerial turnover and less cohesion.
260

15. The chief turnaround agents at the successful firms had extensive industrialexperience in the particular industry or in a closely related industry. The chief turnaround agents at the unsuccessful firms had less experience in the industry being served.
16. Experience in manufacturing and/or engineering was prevalent among thechief turnaround agents in all of the successful cases. Sales or financeexperience was more prevalent among the unsuccessful cases.
17. Some subjective narrative information suggests that successful companiesembraced traditional concepts of morality and fairness. Unsuccessfulturnarounds often exhibited problems in relationships with employees,customers, or others.
18. Both successful and unsuccessful turnarounds involved doing some thingswell and some things less well. No one turnaround went perfectly in allrespects. No one firm failed in all respects. But sharp contrasts did exist inmanagerial emphasis, in the procedures used, and in the strengths and stylesof the management.
Generality of the Findings
One obvious question regarding this study is, How general are the findings?Only the automotive and agricultural equipment industries were studied here. These two industries have many similar characteristics in that they requiresimilar production equipment and skills, they have had similar financialprofiles over time, companies in both industries sell through dealers, andboth tend to be located in and to draw employees from similar geographicareas. The question is, Can conclusions regarding the turnaroundperformance of companies in these two industries be applied to distressedcompanies in other industries?
It must be remembered that one of the findings of this study was thatexperience in the industry being served was found to be a powerfuldeterminant of turnaround success. Therefore, it would not be entirelyconsistent with the findings to suggest that the recommendations areuniversal to all industries. The author has a deep appreciation for thesubtleties necessary to manage successfully in any industry. However, manyof those findings are consistent with the research work of others and shouldhave application to other situations, including service industries andtransportation and distribution companies.
Several previous studies of turnarounds (Schendel et al. 1976; Hofer 1980;Taylor 1982/1983) have indicated that cost-reduction and internal efficiencystrategies appear often among the successful turnaround cases. Other studies(Schendel and Patton 1976; Schendel, et al. 1976; Hofer 1980; O'Niell 1981, 1986; Taylor 1982/1983) found that product differentiation and market-focusstrategies appear often among successful turnaround cases. Porter (1980) hasadvanced the theory that successful companies concentrate on the three
The Turnaround Experience: Real World Lessons in Revitalizing Corporations and Organizations
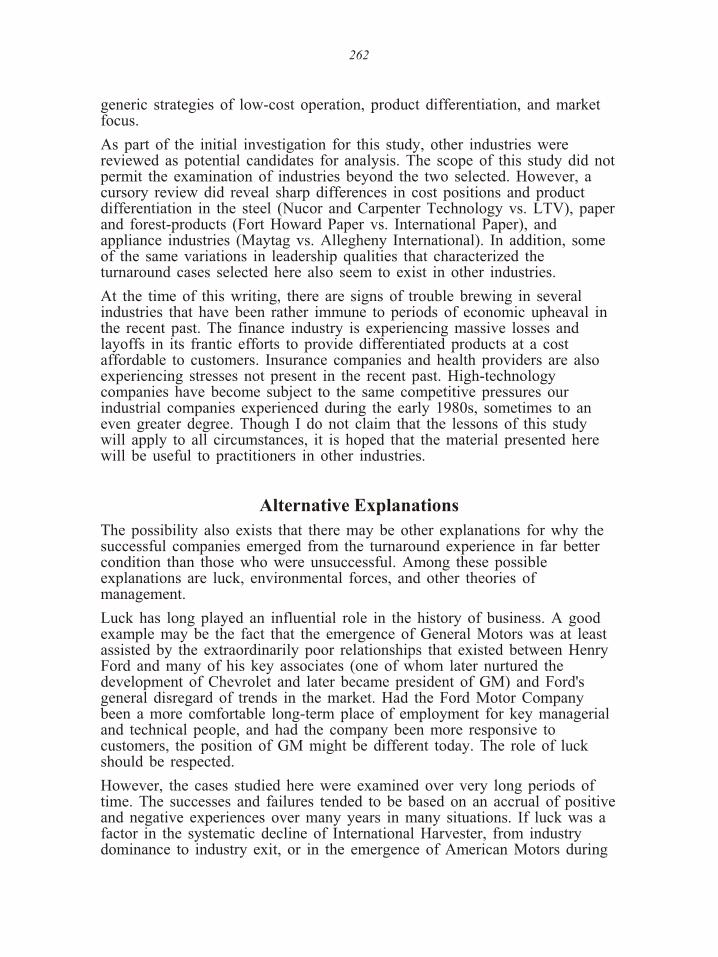
generic strategies of low-cost operation, product differentiation, and marketfocus.
As part of the initial investigation for this study, other industries werereviewed as potential candidates for analysis. The scope of this study did not permit the examination of industries beyond the two selected. However, acursory review did reveal sharp differences in cost positions and productdifferentiation in the steel (Nucor and Carpenter Technology vs. LTV), paper and forest-products (Fort Howard Paper vs. International Paper), andappliance industries (Maytag vs. Allegheny International). In addition, someof the same variations in leadership qualities that characterized theturnaround cases selected here also seem to exist in other industries.
At the time of this writing, there are signs of trouble brewing in severalindustries that have been rather immune to periods of economic upheaval inthe recent past. The finance industry is experiencing massive losses andlayoffs in its frantic efforts to provide differentiated products at a costaffordable to customers. Insurance companies and health providers are alsoexperiencing stresses not present in the recent past. High-technologycompanies have become subject to the same competitive pressures ourindustrial companies experienced during the early 1980s, sometimes to aneven greater degree. Though I do not claim that the lessons of this studywill apply to all circumstances, it is hoped that the material presented herewill be useful to practitioners in other industries.
Alternative Explanations
The possibility also exists that there may be other explanations for why thesuccessful companies emerged from the turnaround experience in far bettercondition than those who were unsuccessful. Among these possibleexplanations are luck, environmental forces, and other theories ofmanagement.
Luck has long played an influential role in the history of business. A goodexample may be the fact that the emergence of General Motors was at leastassisted by the extraordinarily poor relationships that existed between HenryFord and many of his key associates (one of whom later nurtured thedevelopment of Chevrolet and later became president of GM) and Ford'sgeneral disregard of trends in the market. Had the Ford Motor Companybeen a more comfortable long-term place of employment for key managerialand technical people, and had the company been more responsive tocustomers, the position of GM might be different today. The role of luckshould be respected.
However, the cases studied here were examined over very long periods oftime. The successes and failures tended to be based on an accrual of positive and negative experiences over many years in many situations. If luck was afactor in the systematic decline of International Harvester, from industrydominance to industry exit, or in the emergence of American Motors during
262

the highly competitive recession years of the late 1950s, there had to be alot of it.
Luck did play a role in some situations. But in every one of the unsuccessful cases there was some other company in the same industry at the same timethat was handling similar situations better. If luck does play a role, it isquite likely to be bidirectional. It seems doubtful that luck operatesconsistently in the same direction and thereby victimizes only unsuccessfulfirms. The successful firms had some good and some bad luck, as did theunsuccessful firms.
Environmental factors have been at least partly corrected for in the design of this study. The periods examined run 86 years, from 1902 to 1988. Bothsuccessful and unsuccessful cases were found in depression years, recessionyears, and prosperous years. Government policies, changes in consumertastes, and other environmental forces affected the companies studied here.But both successful and unsuccessful firms were involved. In some cases,environmental forces provided help to unsuccessful firms, but the firms didnot always take advantage of it. For instance, the Arab oil embargo pushedconsumers toward the historical market niche of AMC/Renault during the1970s, when management of the firm was pushing the firm towardunfamiliar upscale large-car markets.
Other theories of management may provide acceptable alternativeexplanations. The punctuated equilibrium model of Tushman and Romanelli(1985) may provide an interesting perspective as to why the successfulcompanies swung into action the way they did. Schendel and Patton's (1976) first hypothesis, that a radical downturn is more likely than gradual drift topromote action, is also of interest.
Many theories of management are complementary to this analysis, and noneof them should be discredited. However, what is interesting about successfulturnarounds are the technical steps taken to achieve low-cost operation andproduct differentiation. Turnaround success was not achieved solely byemploying appropriate managerial concepts but by very specific and verytechnical managerial actions. With the importance of technology thusobvious, theories of management must allow sufficiently for technology.
The branch of management theory that relates to the escalation ofcommitment may have some relevance to the examination of turnaroundsuccess. It does appear that the commitment of organization members variedwidely. All the companies studied had manufacturing plants, but some werefar more productive than others. All had product-development departments,but some of these departments were not effective, while others were able tointroduce a wide variety of new products during times of staff reductionsand expense curtailments. The allocation of resources was not the principaldecision variable. The yield on the allocated resources ranged greatly.Perhaps the research surrounding commitment can provide further insights.
The Turnaround Experience: Real World Lessons in Revitalizing Corporations and Organizations

Need for Improved Analysis of the Declining Firm
As more of our companies reach advanced age in mature or decliningmarkets, we will need to enrich our understanding of the declining firm. Wewill no doubt find, as many of the European firms have found, that thedeclining firm is too important to the nation's employment and the supply ofneeded goods to be left to drift without a methodology for correction. Wewill need to develop ways to remedy the fortunes of these crucial elementsof our society, and further research into the special questions surrounding the declining firm will be required. Fortunately, remedial management is abranch of our broader theory of management, so we will be able to relyheavily upon what has been accomplished in the past. However, there aresome circumstances unique to the declining firm, and time and resourcelimitations provide further constraints. It is hoped that the evidence providedhere will be a useful supplement to the rest of management theory, which isfully applicable to the turnaround situation.
264

The Turnaround Framework
Figure 13-4. Framework of a successful turnaround process.
The Turnaround Experience: Real World Lessons in Revitalizing Corporations and Organizations

A Final Caveat
One caveat should remain. Turnarounds are never permanent. Constantvigilance is required to remain competitive. Several companies managedhighly successful turnarounds, experienced high rates of profitability, andenjoyed renewed market presence for several years only to experience a new predicament 15, 20, or 30 years later. The same is true of companies thathave not faced crisis. Managers can never rest assured that their companiesare out of the woods.
266

Chapter 14 — Real or IllusoryLeadership?
Quality in the Managerial Process
This study of 16 turnaround cases provides both reassurance and sadness. Itis reassuring to see companies come back from disaster to become strongand healthy contributors to our industrial society. It is reassuring, also, to see how the companies turned around. The processes involved would seem to be available to most companies facing financial crisis, because the keycharacteristics of turnaround success were business strategy, managerialcompetence, technical skills, and personal character traits rather than theavailability of resources.
But this study of turnarounds is also sobering, because so many people andso many other companies and communities were affected by the failure ofthe unsuccessful companies. During their peak periods of employment, thesemajor companies directly employed more than 270,000 people (Table 14-1).Many additional people, probably several hundred thousand people, wereassociated with the dealer organizations, supplier companies, and otherbusinesses in the communities where the companies operated.
In some instances, the people employed by the unsuccessful firms wereultimately absorbed by other companies, although the numbers were probably small. The competitive positions of the unsuccessful firms had alreadyseriously deteriorated when other firms took over the remnants of theseonce-major companies. With the demise of the unsuccessful firms came theinevitable decline in the number of people gainfully employed in thecontinuation of these businesses — even under different names. Hudson'smajor plants were closed completely. The Willow Run plant of Kaiser-Frazerwas sold to General Motors for an entirely different purpose. ManyInternational Harvester plants now stand idle. The West Allis, Wisconsin,plant of Allis-Chalmers, which at one time employed more than 20,000people, is now a modest shopping center.
Some people may suggest that no special problem exists in this regard. Oldbusinesses are constantly failing as new businesses are born. Through thisongoing process of failure and rebirth, the economy strengthens itself andadapts to changing conditions and changing markets. This perspective hasvalidity for analyzing some problems, but at this time in our presenteconomy, we need answers to some fundamental questions. Is rebirth reallyhappening, or are some of our basic and essential industries in the process of failing permanently, with no suitable replacement in sight? What will oureconomy and our society be like when they are gone? We should rememberthat the once-glamorous, high-tech industries are now under feverish attackand that the service industries have proved to be poor substitutes forprofitable and vibrant basic industries in terms of providing employment.
The Turnaround Experience: Real World Lessons in Revitalizing Corporations and Organizations
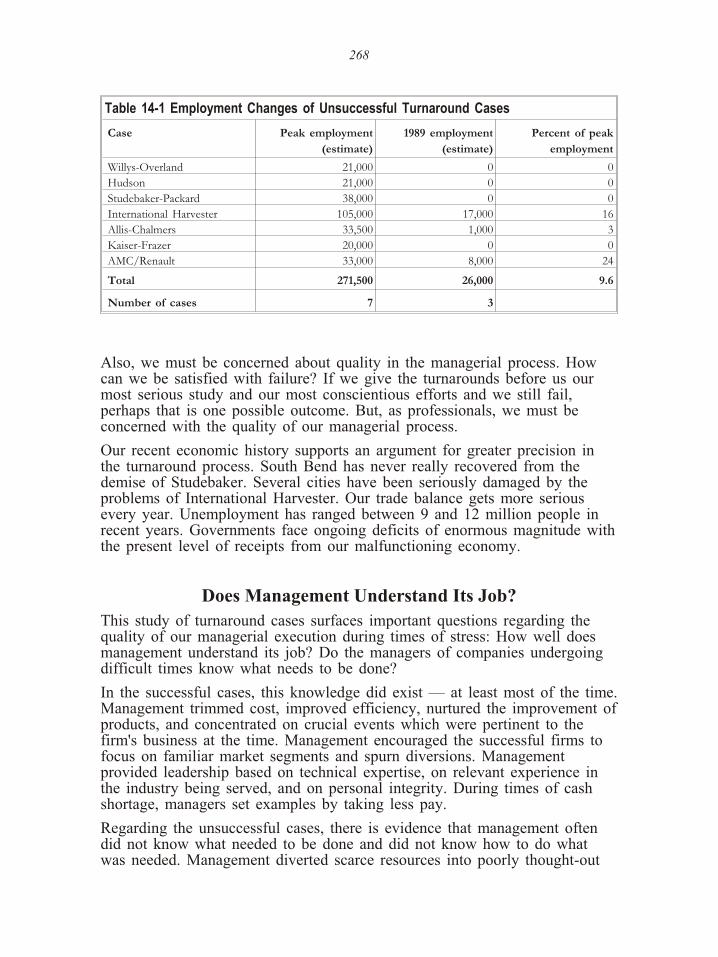
Table 14-1 Employment Changes of Unsuccessful Turnaround Cases
Case Peak employment
(estimate)
1989 employment
(estimate)
Percent of peak
employment
Willys-Overland 21,000 0 0
Hudson 21,000 0 0
Studebaker-Packard 38,000 0 0
International Harvester 105,000 17,000 16
Allis-Chalmers 33,500 1,000 3
Kaiser-Frazer 20,000 0 0
AMC/Renault 33,000 8,000 24
Total 271,500 26,000 9.6
Number of cases 7 3
Also, we must be concerned about quality in the managerial process. Howcan we be satisfied with failure? If we give the turnarounds before us ourmost serious study and our most conscientious efforts and we still fail,perhaps that is one possible outcome. But, as professionals, we must beconcerned with the quality of our managerial process.
Our recent economic history supports an argument for greater precision inthe turnaround process. South Bend has never really recovered from thedemise of Studebaker. Several cities have been seriously damaged by theproblems of International Harvester. Our trade balance gets more seriousevery year. Unemployment has ranged between 9 and 12 million people inrecent years. Governments face ongoing deficits of enormous magnitude with the present level of receipts from our malfunctioning economy.
Does Management Understand Its Job?
This study of turnaround cases surfaces important questions regarding thequality of our managerial execution during times of stress: How well doesmanagement understand its job? Do the managers of companies undergoingdifficult times know what needs to be done?
In the successful cases, this knowledge did exist — at least most of the time. Management trimmed cost, improved efficiency, nurtured the improvement of products, and concentrated on crucial events which were pertinent to thefirm's business at the time. Management encouraged the successful firms tofocus on familiar market segments and spurn diversions. Managementprovided leadership based on technical expertise, on relevant experience inthe industry being served, and on personal integrity. During times of cashshortage, managers set examples by taking less pay.
Regarding the unsuccessful cases, there is evidence that management oftendid not know what needed to be done and did not know how to do whatwas needed. Management diverted scarce resources into poorly thought-out
268

plans for expansion while critical day-to-day problems of high product costand product quality were neglected. Management allowed the unsuccessfulfirms to drift ineffectively from one market segment to another withoutsufficient proactive attention to historically important markets. Managementapproved the adoption of inconsistent strategies which were beyond theresource base of the firm. Management changed more frequently, played less of an exemplary role, and exhibited less appreciation of old values asfoundations for new beliefs.
This is a serious indictment, of course, but the problems are serious too. Allthe unsuccessful companies were, at one time, substantial components of theindustrial complex of the United States. None ranked lower than thefourth-largest firm in their industries at some point in their history, and most reached higher levels. Now, they are virtually gone. Many factors played arole in the demise of these once-substantial firms, but one of the questionsthat should arise is whether management knew what to do.
This question of whether management knew what to do should not beviewed as too simple or too basic. Consider the evidence in the cases studied here. International Harvester built up huge inventories, against the advice ofexperienced company personnel, to support out-of-date production methodsand in response to an utterly false reading of the market demand for thecompany's products. Management did not know enough about the business to structure an appropriate forecasting system or to organize a critique of itsown perceptions. The lack of good forecasting, coupled with limitedknowledge of the business, led to an enormous buildup in inventories thatseverely pinched cash and played a major role in the demise of thecompany's historical mainline business. Studebaker and Hudson bothremained high-cost producers for decades prior to the actual demise of thefirms. Allis-Chalmers, Kaiser-Frazer, and AMC/Renault (in recent years)were all high-cost producers at critical times during their attemptedturnarounds. In none of the unsuccessful cases did management displaysufficient expertise in organizing the firm's production or in managing thefirm's major business.
The inability of management to manage efficiently affected productdifferentiation as well. In several cases (IHC, Kaiser-Frazer, Studebaker, andHudson) the high cost of operations limited funding so severely thatprograms of product differentiation were either eliminated or severelycurtailed. These same companies then worsened their situations bydissipating shrinking resources on poorly planned new ventures — withdisastrous results. The successful companies were also short of funds, butthese companies had the advantage of resource savings from productionefficiencies and, in addition, found ways to develop better products withinthe framework of limited resources. Top management in the unsuccessfulcompanies lacked these skills.
There is also evidence that management of the unsuccessful companies wasnot sufficiently in touch with markets to effectively deliver well-thought-outproduct strategies. In the case of International Harvester, much of the
The Turnaround Experience: Real World Lessons in Revitalizing Corporations and Organizations

company's top management was unacquainted with to the businesses thecompany was in, and the lack of appreciation for the views of the moreexperienced Harvester executives contributed to a growing mismatch between the company's actions and the needs of the marketplace. Similar events tookplace at Studebaker, Kaiser-Frazer, and American Motors in recent years. Inother cases, such as Hudson and Willys-Overland, top management hadindustry experience (not in product development or manufacturing), but thencompounded problems by dabbling in outside affairs. The executives of these firms were not trained in the habits of efficiency. They did not know how aplant should operate. With respect to understanding the theories andpracticalities of low-cost production and product differentiation and beingable to mobilize effective competitive offerings, management was operatingoutside of its domain.
In the cases where management was operating outside of its domain, theresults were internally inconsistent strategies — strategies which did nothang together logically. Some strategies presumed that the fortunes of thecompanies would rebound with increased sales when variable costs wereclose to or above 100 percent of revenue. Some strategies involved high-cost producers offering products in the low-priced field. Some strategies involvedoffering brand-new products to new markets when the products being offered were rushed into production, were poorly tested, and were of shoddy quality. There were strategies involving actions which almost systematically alienated the firm from its historical customer base.
The successful firms operated differently. They knew the markets. They hadexperience in serving the markets. They knew how to build the products atan acceptable cost, and they knew how to differentiate the products fromcompetitive offerings. Successful companies had real leadership.
What seems to have emerged in the unsuccessful companies was notleadership but the illusion of leadership. The companies were paying forleadership. James Nance of Studebaker-Packard made more money than theentire officer corps combined at Nash Motors when that company facedtroubled times in the 1930s. The compensation of the executives ofInternational Harvester was high enough to exacerbate relations withcompany employees during a time of crisis. Roy Chapin of Hudson had oneof the largest houses in Michigan, but the company was crumbling fromwithin. Managers of the unsuccessful companies had adequate incentivesavailable to them. They just didn't know what to do.
This illusion of leadership was not an easy situation to detect initiallybecause many of the unsuccessful managers were impressive-looking andimpressive-sounding people. Roy Chapin of Hudson was impressive enoughto become secretary of commerce. John North Willys of Willys-Overlandbecame an ambassador. Several of the unsuccessful turnaround agents hadreputations for being impressive, outgoing public speakers, but there is nolong-term evidence that outwardly impressive people necessarily havesufficient depth, sufficient experience, and sufficient character and generatesufficient trust to effectively manage a turnaround. What in fact happened is
270 Chapter 14 — Real or Illusory Leadership?
that these once-noble companies were ruined as viable competitors in theirprincipal markets.
The long-term notoriety of one unsuccessful turnaround agent can bedescribed by an incident extracted from Barbara Marsh's book CorporateTragedy, which described the demise of International Harvester:
Inside the milk house, where several farmers have stopped for fresh pie,one man asks if anybody remembers the name of the executive who didn'tknow anything about tractors who ran the company into the ground.(Marsh 1985, 299)
The question being raised here is fundamental to the system of recruitingmanagers in the United States. As Hayes and Abernathy (1980) pointed out,a decline has taken place in the number of top managers who have technical and marketing backgrounds, whereas the number with legal and financebackgrounds has increased. However, the question is only partly related tothe experience of the individuals. The problem isn't as simple as having toomany people in finance, for the expertise of the finance departments variedwidely too. Some finance people, such as B. F. Hutchinson with the earlyChrysler Corporation, Red Poling with Ford, or Gerald Greenwald withChrysler in later years, were thorough, trustworthy people who understoodvery well the technical details of the business. In order to turn companiesaround, managers with meaningful technical knowledge are needed in allaspects of the business. It is important for people in the finance oraccounting departments to have an intimate understanding of what drives the costs they are measuring. Hutchinson understood what influences real cost in part because he, at one time, had been a production supervisor himself.
The successful turnaround agents understood how to design products for both low cost and product differentiation. During its 1956 to 1964 turnaround,American Motors built five basic engines, three sixes and two V8s, from one very similar set of pistons and valves. Cars of different sizes had the samedoor frames — which greatly reduced tooling expense. Right and lefttaillights, front and rear bumpers, and many other parts were often identical.These actions led to a tooling cost per unit that was substantially lower than that of any other manufacturer in the business, and the firm survived.
In contrast, when Chrysler Corporation was getting into trouble in the 1960s and 1970s, as many as eight different engines were offered with certain carmodels. Product development took too long, which often resulted in the firm being out of step with the market. When the Chrysler turnaround becamesuccessful, it was to a very large degree because of the innovative handlingof product design and manufacturing engineering. Chrysler's design teamslearned how to make a broad spectrum of product offerings from a smallerassortment of component parts. The Chrysler turnaround was not a financialrestructuring. It was a major engineering and production accomplishment,which resulted in vastly improved product differentiation at a much lowercost of production, a turnaround made possible by the accommodatingcooperation of organized labor.
The Turnaround Experience 271

The unsuccessful turnaround agents did not understand these things. Theywere busy with other matters. They were pressuring their sales organizationsto sell more without understanding that variable costs were near to or abovethe prices received for the products. They were making deals to get into new businesses or out of old businesses without any deep understanding aboutwhat was required for any of these businesses to operate profitably. Theplanning logic seemed to be, If we can't manage what we've got, we hadbetter manage something else.
The successful turnaround agents appeared to differ in character traits as well as in industry awareness and technical knowledge. The perception of fairness (or lack of it) influenced the willingness of members of the organization toput forth the extra effort necessary to mobilize a turnaround. The proxyindicators available in these cases suggest that the successful turnaroundagents exhibited honesty and trustworthiness, were not preoccupied with their own importance, and allowed others to share in the accomplishments.Further, when things were not going well, these executives first reduced their own compensation and then prevailed upon the organization to reduce costs.
Many people, not just one or two, played key roles in the successfulturnarounds. The successful turnarounds had deep managerial teams.Similarly, the blame for corporate failure cannot be laid at the door of oneor two people. Many people were involved in both the successful and theunsuccessful cases. The seeds of failure or success are sowed over longperiods of time. That is why we need longitudinal studies to examinebusiness situations.
We do need to keep in perspective the fact that no one company dideverything perfectly and no one company did everything wrong. Mistakeswere made in successful cases, and there were high points in the attemptsthat failed. But, certain patterns did emerge. Successful turnaround agentsexhibited industry knowledge, production knowledge, engineering knowledge, rapport with customers and dealers, incremental improvements, anappreciation for the company's history, honesty, humility, and a sense of fairplay. These are some of the factors that distinguished the successful firms.Of these, the most prominent were low-cost operation, productdifferentiation, and leadership. It could be that a more thorough study atanother time will find that character traits and value systems have greatuntapped potential to mobilize the organizational learning necessary for asuccessful turnaround.
272

Turnaround Management as a Skill
The economic and financial measures we have before us collectively suggest that we must greatly improve our industrial and economic performance if the citizens of the United States are to continue to enjoy the social stability thathas blessed our country in the past. We do have the capability to get someof our problems resolved, but this capability exists only in potential form.We must transfer it to the kinetic form, and that means developing the skills not only to analyze problems but to remedy them.
Our business schools, our business publications, our informal networkswithin business itself, and our government have deluded us into thinking that mere analysis of the problem is the principal skill. It is not the principalskill, though it is helpful. To cope effectively with today's problems, weneed skills that may be entirely different from those which served our nation during better times. We must develop skills that will equip us to remedytroubled situations when they occur, and at cost levels that are affordable tostockholders, employees, creditors, and communities. We must know moreabout how to accomplish more with less. We must be more efficient in ourpractice of management, more cost-effective, and more professional. In order for us to continue as a meaningful participant in the world economy, wemust modify our behavior, particularly our managerial behavior.
The evidence provided in this study should be reassuring because manyindividuals have demonstrated the remedial skills sufficient for the taskbefore us. But we need more people with remedial skills, and we need themin positions of influence. One of the more sobering aspects of this study isthat many of the individuals who have most actively demonstrated theremedial skills we so desperately need are either sick, old, or dead. LewisVeraldi passed away in the fall of 1990. Donald Petersen has retired fromFord. George Romney is in his 80s. Iacocca is nearing retirement. HansMatthias has retired for a second time. It is to be hoped that new people arebeing trained to take their places. Surely a country with the vast populationof the United States can field suitable replacements. But perhaps the earlyconditioning of these people — the deprivation of the 1930s, the hardshipsof the World War II, the long climb from immigrant status to positions ofinfluence — was in fact preparing these individuals with the remedial andsurvival skills that the country now so desperately needs.
Those of us in education may wish to believe that education is theappropriate vehicle for preparing leaders for the future. After reflecting upon the evidence gathered here, I am less sure. Indeed, there may be reasons toquestion whether education, as we presently practice it here in the UnitedStates, is a help or a hindrance to the development of remedial skills. Eventhe recipients of our most technically advanced degrees seldom receivefirst-hand experience with production as a part of their training anymore.Their knowledge of theory is excellent, but we may wonder whether we arefalling into the trap identified by Charles Kettering, one of our greatestinventors: we may be “confusing symbols for things.” Veraldi started out asan apprentice tool and die maker in 1944 and then got his engineering
The Turnaround Experience: Real World Lessons in Revitalizing Corporations and Organizations

degree in night school. By the time he ascended to the position of vicepresident of Ford, he intimately knew many of the tasks that needed to bedone at Ford, and he knew the people who could do them well. WalterChrysler, Henry Leland, B. F. Hutchinson, George Mason, Charles Nash,William Knudsen, and Charles Kettering had similar beginnings. None ofthese great industrialists were exposed to the style of education that exists in our modern world today.
Now our conditioning is different. We graduate from college and movedirectly into management without the benefit of first-hand execution of some of the tasks we are managing. Instead of learning about real management incourses like operations management, we learn the ground rules for selectingunit, batch, or mass production systems, probably a once-in-a-lifetimedecision for most companies. In courses on strategy we learn about aportfolio style of management, the implication being that management isbasically a selection process and not an accomplishment process. We learnhow to detect and analyze problems, but we learn less about how to remedythem. Even in engineering programs, we are learning less about how goodsare actually designed and produced. In our marketing programs we seldomcover how to get an order, and in our finance courses, we seldom cover how to collect money. Perhaps the remedial skills will unfold from our presenteducational system. In many ways it is a good system, and one that iscertainly capable of making corrections.
As the United States continues to struggle with its economic and industrialdifficulties, higher levels of managerial professionalism will be needed, notonly to analyze but to remedy the problems being faced. Remedialmanagement will become an increasingly precious skill. Whether it is a skillthat emanates from an elaborate formal education system or one that isnurtured and developed by thorough first-hand exposure, interspersed withperiods of deprivation, remains to be seen.
274

Chapter 15 — Recommendations forthe Future
During the late 1980s, the economy of the United States was robust andgrowing. Inflation was at an acceptable range, and unemployment haddeclined from the appalling levels of the early 1980s. On the surface, therewas prosperity. However, few would suggest that the economic system wasin equilibrium. Unprecedented consumer debt, government deficits severaltimes what we formerly regarded as astronomical, the quick transition of theUnited States from the world's largest creditor to its largest debtor, volatilecapital markets, monumental trade deficits, and a plethora of unfriendly andunder analyzed corporate takeovers all provided testimony that the U.S.economy, though prosperous, lacked equilibrium.
As we progress into the 1990s, we must develop the skills to turn companies around and restore America's competitive edge one company at a time. Thatis not easy, but it is the only practical option open to us. Industrialcompanies and productive individuals are the source of America's wealth. Ifwe want to sustain the prosperity and social stability of the United States,we must improve the performance of individual companies.
The recommendations that follow this study pertain to business, education,government, and finance. All these activities must function with greaterreliability, more creativity, and an understanding of the informal linkagesbetween the key elements of our economy. Successful resolution of theproblems before us will involve a systematic interleaving of technical,sociological, and managerial concepts. These recommendations are dividedinto four groups:
· Recommendations for businesses involved in turnarounds
· Recommendations for boards of directors
· Recommendations for business schools
· Public policy recommendations
The Turnaround Experience: Real World Lessons in Revitalizing Corporations and Organizations
Recommendations for Businesses Involved in Turnarounds
Find Managers Who Understand the Business
Don't assume that being smart is a qualifying asset in the long term.Successful management during a turnaround is partly a matter of domain.Key people should understand the business and the company's individualbusiness in particular. The most successful turnaround agents were those who had experience in the industry being served.
Be Respectful of the People Who Were Involved in the Company
People who were involved in the company when the problems developedmay have done some things very well. The turnarounds that succeed ofteninvolve an appreciation of past accomplishments. The firms that havedifficulty often run roughshod over old values and bring in too much newmanagement. Some of the best turnaround agents are from within thecompany.
Cultivate Both Formal and Informal Forecasting Techniques
Either may be wrong. In a situation as chaotic as a turnaround, thecross-checking of forecast information is critical. Ineffective cross-checks onforecasting systems often result in major strategic mistakes in inventorylevels, staffing levels, plant locations, or other factors essential to survival.Successful turnaround agents are respectful, but they gather information from more than one source.
Ensure That the Entire Organization Is Part of the Turnaround process
The process of turnaround is one of organizational learning. The entireorganization must develop together and in parallel. It is not simply the taskof selecting the appropriate leader. Though the leader is important, so are the other members of the organization. The entire organization must progress inorder to become an effective competitor in the modern industrial world.
Examine the Environment on the Basis of Essential Information
Examine the environment on the basis of information that is essential informulating the appropriate approach to organizational turnaround. Don't rely on information that is available, because it may not be enough. One of themost serious mistakes in a turnaround is to try to solve problems on thebasis of what information is available rather than what information isnecessary. There will still be a need to make decisions expeditiously duringa turnaround. The above comments apply to the information that is soughtrather than the need to obtain it quickly. One reason why turnaround agents
276
with experience in the industry do better is because they often have quickaccess to outside information.
Hire and Retain People Partly on the Basis of Character Traits
Walter Chrysler said it best: “If the spirit is not right, it is useless to look at results.” The successful turnarounds are most often headed by people whoexhibit strong preferences for character traits involving old-fashionedhonesty, morality, and hard work. A key element of the process ofturnaround sometimes boils down to retaining the most honest people whowant to work hard, who know something about the business they are in, and who want the company to succeed.
Get Efficient First — Sell Later
Efficiency is crucial to turnaround success. Rarely will higher levels ofrevenue greatly increase company prosperity if the company is inefficient.Without efficiency, incremental costs eventually consume incrementalrevenue. In order to succeed, the first priority of the troubled firm should beto improve efficiency, conserve precious resources, and use those resourcesto differentiate products. After these steps are taken, additional revenue willhelp restore corporate profits.
Use Efficiency Savings to Differentiate the Products and Improve Quality
Product differentiation must be enhanced every day through innovativeprograms of constant improvement funded and made possible by high levelsof internal efficiency. The whole organization must operate at top efficiencyand recognize that the path to higher sales is product differentiation achieved through efficiency. As Charles Nash described it, “Sales is ninety percent aproduction problem.”
Systematically Withdraw Resources to Improve Performance
Too many people and too much inventory — maybe even too much money— can get in the way of turnaround success. Most successful turnarounds do not have and do not seek excess resources that might get in the way ofefficient performance. If steps can be taken to promote broadly basedorganizational learning, improved performance with fewer resources isdistinctly possible. Beyond this, the very condition of resource scarcity canpromote organizational learning and lead to greater innovation.
The Turnaround Experience: Real World Lessons in Revitalizing Corporations and Organizations

Concentrate on the Basic Business
Don't get diverted. The track record of turning around a company byentering a new field is very poor — particularly when the company showsno capacity to manage its old field. If we cannot keep our basic businesshealthy, what shred of evidence is there to suggest that we can manageanything else?
Make Small, Incremental Improvements, Constantly
Successful companies only rarely attempt bold new initiatives intounchartered waters. They effectively work on myriads of small problemsevery day, month after month, for years and decades. Turnarounds commonly take several years to reach fruition, and the successful turnaround agentsstudied here averaged nearly 17 years in their jobs. Success involvedconstant programs of incremental improvement.
Recommendations for Boards of Directors
One cannot review the histories of these once-great companies withoutwondering what role members of the boards of directors played in thesuccesses or failures of the firms they helped direct. In some cases, the roleof certain directors was very positive. In other cases, one wonders why thedirectors did not press for earlier action as these important industrialcompanies showed signs of declining. As an experienced director who hasserved on the boards of 10 companies, I realize the practical difficulties ofwishing to support the company while exercising fiduciary responsibility.However, the information gathered in this study, coupled with theexperiences of others including the author, suggests that our present systemsof corporate directorship could be improved. The following recommendations might be helpful.
Cultivate the Acceptability of Voting Conscience and Judgment
Let management and directors feel more comfortable in proposing ideas thatare controversial. Presently, the system is similar to the Englishparliamentary system. The CEO must win every vote of confidence, andthere is much informal pressure to support management on every vote, evenon trivial issues. There seems to be some muted reasoning process thatsuggests that if a director ever votes differently from management, thedirector is not supportive of the company and perhaps should not serve. Inreality, the directors most needed are those who do have a mind of theirown and who have the courage to express their convictions, particularly attimes of crisis. This need not be a hostile situation, any more than was thecase with the often opposing votes cast by George Aiken and MikeMansfield during their years as responsible leaders of their respective parties in the U.S. Senate. The fact was that they were close personal friends who
278
usually had breakfast together, even though they often voted differently onmajor issues. Yet, in business, this informal convention of consistent support of management often leads to the curtailment of healthy expression on themajor issues facing the firm. This system is no better for the CEO than forthe directors. What we need is greater candor about where we stand andsome fresh ideas about how to improve our situation, not overly courteous,informally stifled discussion. With the loss in international market share thatwe are presently experiencing, we cannot be satisfied with the ways weconduct the corporate affairs of America.
Upgrade and Round Out the Board of Directors
Invite people on to the board who are insightful, studious, and fair and whounderstand at least something about the business the firm is in. Also, avoidreciprocity appointments or appointments in which other conflicts of interestexist. For instance, some venture capitalists suggest that a top manager ofone of their portfolio companies be appointed to sit on the board of anotherinvestment. Too many interrelationships among directors can impede thesystematic review of the situation that must take place for a firm in troubleto develop a lasting solution.
Be Alert to Strategic Conflicts of Interest
Remain skeptical of new strategic initiatives that seem to compete inresources or time with the management of the basic business. Existingbusinesses must be treated with priority, at least until new programs havebeen successfully launched, are capable of carrying the organization, and arefunctioning reliably. Too often, the desire to expand markets or enter newmarkets compromises success in present markets and causes the firm todecline. Directors must preserve the firm's historical business.
Retest the Forecasts
If the firm relies heavily on forecasts to establish its strategic direction, insist that it employ both formal and informal forecasting systems. Then, insist that both the forecasts and the assumptions are cross-checked. The best firms donot rely so heavily on forecasts, opting instead for strategies adaptable tomany conditions. When forecasts are used, they flow from knowledgeexploration, from a systematic analysis of critical questions that need to beanswered, rather than from conveniently available internal information.
Hold Board Meetings and Annual Meetings at Reasonable Places
Numerex, a quality producer of precision coordinate measuring machines,holds its annual meetings on the factory checkout floor, amid the company'sworkers and products. The best annual meetings are held in places that can
The Turnaround Experience: Real World Lessons in Revitalizing Corporations and Organizations

be easily attended by employees, creditors, suppliers, and customers. Themost inappropriate places for meetings are at expensive hotels and resorts.
Remedy Obvious Ethical Problems When They Occur
Fire people who are dishonest or unethical and do not give them anyseverance pay. There is nothing that can reduce the collective resolve of thecompany more quickly than the retention of known crooks, or alternatively,their departure under lucrative circumstances. Do not worry about thelawsuits. They will be even bigger if the company fails.
Get Realistic on Executive Compensation
Most really good executives don't care about it anyway. If the company does regain profitability (for several years running), it is reasonable for managersand others to share in the rewards. But when the company is still indifficulty, and many are being asked to sacrifice, management should leadthe way.
Become Active in Politics
People in government in the United States need to have a closer associationwith and a better appreciation of the industrial segment of our society, as isthe case in Europe and Asia. Many of the pressing problems facing industryin the United States result from inappropriate industrial policies or the lackof scientific knowledge on the part of policymakers. Some governmentofficials will help if representatives from industry can articulate the way inwhich industry is linked to the social fabric of our society. But corporationsand companies are remarkably passive. The CEO will most often be toobusy running the business to be active in the political arena, but directorscan help clarify the inner workings of an industrial economy to a politicalstructure that has been less interested than has been the case in otherindustrialized countries.
Recommendations for Business Schools
Schools of business have much to offer, but unfortunately, U.S. trade andfederal deficits have not declined as the number of business school graduates has increased. It is time for business schools to undergo an organizedcritique of their own performance. The following suggestions areconstructively offered to incrementally improve some aspects of businessschool education.
Study the Way Companies Operate over Longer Periods of Time
280

Of the cases involved in this study, the successful companies experiencedsteeper revenue decreases and deeper loss rates and emerged more slowly. In several of the unsuccessful cases, such as Willys-Overland, Allis-Chalmers,or International Harvester, the companies' true problems did not becomeapparent until several years into the turnaround attempt. During the principal periods of crisis, the best companies quite often looked worse and the worstcompanies quite often looked better. It was only after several years that thesuperior effort of the successful firms enabled them to look betterstatistically. Company performance and managerial practices must beevaluated over long periods of time. Our principles of management should be derived from longitudinal analysis.
Integrate Technical Knowledge into Business Curriculums
We must integrate technical knowledge of products, materials, productionmethods, and customer service procedures into the curriculum of businessschools. The subjects we now cover are too simplistic to prepare people forglobal competition. We have to understand, in much greater detail, what isrequired to have true performance over a lasting period of time. We mustunderstand the processes of product differentiation, low-cost production, andcustomer satisfaction in technical as well as managerial terms. Throughlong-term managerial competence we must preserve our basic industries,which are the lifeblood of our economy.
Study Specific Industries in Greater Detail
In order to compete internationally, we must study our competitors in muchgreater detail. The Harvard case method lends itself to in-depthunderstanding of some situations, and many schools use the method. Wemust understand more about the technologies, production methods, andmarketing systems, and how they operate to establish a stronger competitiveposition in important major industries. We must develop a more thoroughunderstanding of why some firms (both national and international) in aparticular industry do well, while others do poorly. Our present businessschool curriculum should be far more detailed and substantially moreindustry-specific to provide modern managers with the skills necessary toprevail in today's highly competitive global economy.
Study Companies in Decline as well as Those That Are Growing
Our society is faced with difficult structural problems relating to issues withthe environment, emerging technologies, the society, and worldwide politicalstability. Any of these can impact the growth rates of individual firms andindustries. Our primary case examples should not be only of companies thatare temporarily successful and growing. We must know more about theprocesses of decline and possible remedies. Some excellent work has been
The Turnaround Experience: Real World Lessons in Revitalizing Corporations and Organizations

performed, for instance, John Argenti's book Corporate Collapse. But weneed more.
Integrate Character Development and Managerial Education
The case for value-free managerial education can be made only if there isevidence that all values are equally effective in dealing with particularsituations. There is at least some evidence that certain values are a factor inturnaround success. These values are not that controversial. They involvebasic honesty, some minimal levels of temperance, traditional morality, and a genuine appreciation for others. Maybe these qualities are not the domain ofthe management schools, but some of us are more optimistic about whatmight be accomplished if character traits became topics of discussion.Perhaps we could turn out managers who would be more in tune with theirorganizations.
As more businesses find themselves in turnaround situations, businessschools must cultivate the skills their students will need to solve turnaroundproblems. Business schools have a great deal to offer, but they shouldexamine whether their own products are sufficiently differentiated. Intenseglobal competition and other industry stresses require greater precision in the managerial process. Executives need to study more, and business schoolsneed to provide them with current, well-researched information aboutturnarounds.
Public Policy Recommendations
Those involved with public policy may also benefit from an appreciation ofthe remedies used by the successful turnaround companies. Many localcommunities within the United States have been adversely affected by theeroding competitive edge of their major industries. In some cases, publicpolicies, though sometimes well-intentioned, have hurt local industry. Thefollowing suggestions for those involved in formulating public policy aredesigned to foster the economic revitalization of industrial communities.
Focus on Tangible production
Tangible production is the ultimate source of our entire society's standard ofliving. Without strong world-class productivity on the part of agriculture,mining, construction, and manufacturing, the rest of our society can only lose ground economically, socially, and politically. The services, government, and trade segments of our society, though important, cannot produce wealth inreal terms. Support services and educational institutions will perish in theabsence of an underlying base of competitively viable production. Programsthat focus on race tracks, lotteries, shopping centers, and office buildings are not really economic development programs but instead often become
282

long-term economic liabilities as they wither from the lack of real function.Only carefully nurtured tangible production can ultimately provide the capital accumulation needed to improve the competitive position of the UnitedStates and provide its population with a meaningful standard of living —tangible production which must be carefully nourished and encouraged tosustain our society's economic stability and standard of living. Yet, at thepresent time we devote much of our economic development resources toperipheral activities which are, in some cases, totally unrelated to lastingeconomic development. Resources should be explicitly directed away fromthese false providers of short-term employment and toward improving theregion's capability as a low-cost supplier of needed products.
There are plenty of good products that need to be produced. Modernsocieties need better and more economical pollution-control systems, moreefficient energy generation and transmission systems, more cost-effectivetransportation systems, more versatile production systems, newer materialsthat have as their main ingredient fewer strategic resources, moreenvironmentally sound packaging systems, better health-care products, and awide variety of other needed products. There is plenty for us to do, but wemust focus on doing it.
Formulate Policy on the Basis of Input/Output Economics
Modern industrial economies can best be understood and measured byemploying the principles of modern input/output economics. The underlyingconcepts of input/output economics are straightforward. The goods andservices each industry requires to produce its own products must either beproduced within the same economy or be imported and financed. Thus itbecomes important to pay attention to the supplier elements of our economyand to nurture and encourage those industries that have the maximumfavorable impact on the performance of the overall economy.
As we examine our national economy, we must ensure that the industrieswhich we encourage with our limited public resources are in fact crucial tooverall performance. Improvement in the U.S. balance of payments dependson our ability to improve the competitive positions of the individual firmsparticipating in key strategic industries. These key strategic industries employ large numbers of people in activities related to the tangible production ofgoods (and services) most integral to the development of a strong industrialinfrastructure. We cannot expect to regain prosperity by diversifying intonew areas where we have little experience. Instead, we must cultivate theskills necessary to restore the competitive edge of key strategic industriesand their supplier networks.
The strategy of concentrating on the efficiency of the supplier network doesnot work against the important economic principle of comparative advantage. Comparative advantages are built over long periods of time and involve theexpertise of supplier organizations as well as end-product companies. Yet, an input/output road map to industrial prominence is scarcely evident in our
The Turnaround Experience: Real World Lessons in Revitalizing Corporations and Organizations
industrial policymaking. Recent public initiatives place little emphasis ondeveloping the underlying capabilities for efficient tangible production. Atthe national level, changes in the U.S. 1986 tax law shifted taxes fromindirect service industries to industrial companies and to capital formation,exactly the opposite of what we should do if we are concerned witheconomic stability. At the local level, industrial revenue bonds and taxincrement financing seem, more frequently, to subsidize office buildings,convention sites, and shopping centers rather than to build a solid industrialbase which will provide meaningful high-value employment long into thefuture. Many states now use the proceeds of gambling (which is probablyquite harmful to both our human capital and our economy in total) to fundprojects that are either totally unrelated to an industrial economy orremarkably indirect. Although the objective of creating employment isworthwhile, it is doubtful that many of these programs will provide theunderlying industrial strength we need to regain our competitive position. Inmany cases, the programs themselves are costly and counterproductive anddivert attention from what should be done. To achieve economic stability, we must develop our industrial infrastructure one company at a time.
Improve the Competitive Edge of Present Industries
Our primary task is to improve the competitive edge of present industriesrather than to attract new industries to take their place. The individual firmis the key unit of analysis in the study of the competitive position ofdeveloped economies. One can hardly find an American TV set or anAmerican videocassette recorder, yet imported electric tools are quite rare.We know of the penetration of the Japanese auto, yet we make almost allour major appliances here. We import large amounts of textiles but not much carpet. When we examine the production processes employed in themanufacture of these various products, we see similarities among bothimported and domestically produced goods. The same sort of stampings, diecastings, plastic-injection moldings, wires, switches, transmissions, actuators,and finishings used in the manufacture of major appliances, where we havealmost no imports, are used in automobiles, where competition from importsis extensive. We make small electric tools with some of the same materialsand some of the same processes as consumer electronics; yet we make mostof our electric tools and import most of our small appliances. Clearly, theUnited States has the engineering and scientific capability to produceproducts at favorable costs in markets where we are presently not doingwell, but we must focus our efforts.
Yet, because of our narrow perspective, we have not always focused onimproving the effectiveness of our present industries. In response to thestrains on our present economy, industrial communities have adoptedvigorous programs to attract new industries to replace industrial jobs lostthrough plant closings or staff reductions. These programs are unlikely to besuccessful because little significant industrial movement occurs during asingle year and the approach does not build on the strengths of the local
284

community. It also takes too long. For practical reasons, present industries,not other industries, must be competitive for a developed economy toflourish.
Improve Everybody's Quality and Productivity
Tangible production can be advanced by improving the work quality andproductivity of those involved in tangible production and of those whoprovide goods and services. Improving the productivity of education, lawenforcement, accounting, finance, and social services is as important asimproving the effectiveness of manufacturers. In dollar terms, it is moreimportant because, at this time, only about 10 to 15 percent of the GNP ofthe United States is for the labor associated with tangible production.
Programs oriented to improving the nation's competitive position have largely ignored the productivity of the nation's infrastructure. Yet, it is in theindirect segments of our economy that improvements are most urgentlyneeded. We cannot allow the indirect segments of our economy to continueto siphon money from our industrial sector and expect that sector to remaincompetitive in world markets. We must objectively appraise our position and then make innovative improvements in these indirect segments of oureconomy. The quality and productivity improvements instituted at Deere,Chrysler, Ford, and 3M provide worthwhile examples for governments,financial institutions, insurance companies, educational institutions, andsuppliers of needed services. Economic development programs should berestructured to expect and achieve significant improvements in quality andproductivity on the part of all of us.
Push for Similar Benefits, Reasonable Compensation Levels, and MoreWork
The work-time requirements, fringe benefits, and compensation for variousoccupations and participants within our society should bear some logicalrelationship to one another. We cannot have vast differences in place morebecause of tradition or randomness than because of merit, and still havemaximum cost effectiveness. While many firms behave responsibly, there isroom for considerable improvement. Higher executive salaries often occur atmarginally performing S&, risk-oriented financial services firms, pyramidingretailers, industrial firms where market share is slipping, or as goldenparachutes in takeovers where the company has already been lost. We allneed to review what we take from the system. Executive compensation maybe a good place to begin because it is highly visible and because moderateexecutive pay could have a highly beneficial effect on our economy bysetting an appropriate example. However, we are all part of thecompensation problem because our country consumes more than it produces.Our best interest is served when all of us do more work and exercisemoderation in the use of resources and in personal compensation. In manycases, we need realistic compensation and more work.
The Turnaround Experience: Real World Lessons in Revitalizing Corporations and Organizations

Seek Individual Solutions Not Class Solutions
No individual category of workers (production workers, lawyers,schoolteachers, etc.) is to blame for the current difficulties of the UnitedStates. Our problems exist because of quality and productivity shortfalls onthe part of people within every profession. The appropriate remedy is toaddress the quality of individual participation within each profession(occupation) rather than trying to shift wealth from one group to another.
Fortunately, most fields, including education, the services, and industry, have many highly dedicated professionals. But, we need a great deal morededication generally. The task before us is to significantly improve qualitywhile costs are simultaneously reduced. Creative solutions and new systemswill be needed to accomplish such aggressive goals. However, the challenges also mean that more must be expected from individuals. We are now forcedby economic circumstance to pay a great deal more attention to the character traits, quality of performance, and productivity of individuals as keyingredients to global economic stability.
The pursuit of individual solutions is difficult but not impossible. Althoughindividual rights are basic to our identity as a nation, these individual rightsshould not include the right to jeopardize an entire firm because of marginalperformance, to endanger the future resources of a firm by extracting absurdcompensation, or to endanger public safety, the ecology, or the workplace of fellow citizens by operating under the influence of drugs or alcohol.Problems in individual performance are too costly to ignore. We have tomore systematically evaluate individuals on the basis of contribution, notcredentials, and we as individuals must do more work.
Resist the Temptation to Solve Problems by Spending More
With respect to the nation's industrial infrastructure as well as companies, we must learn to improve both quality and productivity simultaneously. In many instances, organizations are enormous consumers of resources, even theirown resources. We must learn to do more with less. Additionalcommunications, resources, and control mechanisms pose severe burdenswhich our already stressed economy cannot afford.
Operating with fewer resources provides an important holistic advantage.Small units with focused responsibilities operate more effectively because the participants can see problems in their entirety. Organizational learningpermits the company, or the community, to achieve more with fewerresources. If we can promote broadly based organizational learning, improved performance with fewer resources is distinctly possible.
Lack of resources is not our primary problem in industrial development. The United States remains one of the wealthiest nations on earth, but we areslipping badly and we cannot afford many of the things we do. Our primaryproblems include lack of organization, low efficiency, limited realcompetence, a propensity to duplicate at public expense resources already
286

available through private institutions, and disparate work-time requirementsamong occupations. We simply cannot afford these things. We must findways to accomplish a great deal more with fewer resources.
The Turnaround Experience: Real World Lessons in Revitalizing Corporations and Organizations

Obtain an Adherence to Sound Turnaround Principles in Exchange forEconomic Assistance
Many ineffective competitors ultimately turn to the government for economic assistance in their efforts to remain viable. Because these companies oftenemploy a significant number of people from a local labor force, there isoften considerable public sympathy for some form of assistance.Unfortunately, state or local governments grant assistance without requiringthat the company adhere to sound turnaround principles. Often, the money is used to replicate the patterns of the past. Governments should insist thatspecific and tangible steps toward low-cost production, productdifferentiation, and appropriate turnaround leadership be undertaken as partof the terms of any assistance.
Set the Example by Applying Turnaround Principles to GovernmentalPerformance
Few institutions on earth currently operate with a more unfavorablerelationship between revenue and cost than some governmental units.Governments have an advantage in their extraordinary powers to unilaterallyextract revenues and to borrow money even under the most undeservingconditions. Governments are in an excellent position to provide examples toour basic industries by turning around their own performance. Manygovernmental units are blatantly irresponsible in their exercise of the publictrust. Absurd, self-interested, inappropriate actions are jeopardizing theeconomic security, social stability, and peace of the entire world.
Conclusion
Tangible production is the ultimate source of the standard of living for theentire society. Without strong world-class productivity on the part ofagriculture, mining, construction, and manufacturing, the rest of our societycan only lose ground economically, socially, and politically. The services,government, and trade segments of our society, though important, cannotproduce wealth in real terms. Only carefully nurtured tangible production can ultimately provide for the capital accumulation needed to improve thecompetitive position of the United States and provide its population with ameaningful standard of living.
Because tangible production is so integral to the economic well-being andsocial stability of our citizens, we need to develop better methodologies forthe revitalization of tangible producers experiencing decline and stagnation.We must develop the skills to turn around these crucially importantcontributors to our economy and culture.
Remedial skills will be needed also for those companies providing servicesto our industrial economy. The providers of needed services must becomemore cost-effective to obtain business from an industrial economy that is
288

becoming more discriminating as it faces its own competitive pressures. Wemust recognize that increasing efficiency on the part of service providers iscentral to the resurgence of our industrial sector.
At the same time, we should develop some basic principles to guide ourindustrial development programs and our turnarounds. We must employ more refined economic models and a more qualitative form of economics. Wemust work within a framework of ethics, morality, and self-sacrifice at every level in business and government — and personally. We must promoteindustrial development programs aimed at improving the competitive edge of our present industries — programs that are more specific, more oriented tothe production of needed tangible goods and services, and morecommonsensical. We must learn to accomplish far more at far less cost byemploying a far greater efficiency. We must develop industrial proceduresthat are more compatible with our environment.
We must formulate our public, private, and personal policies with theperspective that, in order to provide a stable economy in the future, we must alter our behavior. Our situation is serious. We must systematically appraiseour present situation and take those actions that will provide economicstability for those who follow us. We cannot continue to drift.
The Turnaround Experience: Real World Lessons in Revitalizing Corporations and Organizations

Appendix
Building the Comparative Database
Once the cases were selected, the database was restructured into a formatthat would facilitate comparisons among individual firms and between thesuccessful and unsuccessful groups of firms. This task was complicatedbecause of several factors. The different turnarounds occurred at quitedifferent times in the history of these industries. The dollars measured in the financial statements therefore possessed different relative values. Also, sincemost turnarounds occur over a period of many years, the presence ofinflation made it difficult to compare —even for different years of the sameturnaround attempt. This was a particular problem during the 1970s, whenthe inflation rate was very high. Further, firm sizes varied widely, thuscreating a problem of weighing the comparisons. A few firms consolidatedwith other companies during the periods of interest. This posed a problem of consistency from one accounting period to another. Finally, data were notalways available for a constant number of years because of several factors:
1. Some firms ceased operations before others.
2. Some turnarounds were rather recent, and fewer years had passed since theturnaround was attempted.
3. Some turnarounds were attempted many years ago, when financial reportingconventions were less developed.
4. In a few turnaround cases, financial data on the firm's performance were notpublic during the period of interest.
Several steps were taken to reduce the problems mentioned above. The firstwas to examine the data in terms of the “virtual year” of the turnaround.Financial figures were then converted into constant dollars (1988 dollars)using the implicit GNP deflator as provided by the U.S. Bureau of Economic Statistics. The next step was to normalize the data for each case so thatcomparison between cases could be made. The normalization procedure wasaccomplished by adjusting the revenue for each case to an average of $1billion per year. It was not practical to obtain information for all cases forall time periods for the reasons given. Still, for the years most proximate tothe low point, most financial data were available for all but the very earliestcases.
Obviously, it would have been better if we had been able to obtain sampledata for all time periods for all companies. However, if we consider the twoearliest cases (Buick and Cadillac) separately, the database did turn out to be reasonably complete for the years most proximate to the period of crisis.
The Turnaround Experience: Real World Lessons in Revitalizing Corporations and Organizations

After-tax earnings information was available for all remaining firms for years +1 through +7. After these years, the sample began to decline as theunsuccessful firms thinned out, or, as in the case of the Chrysler and Ford,the turnaround attempts were recent.
The earnings information for the earliest years was not available for theJeffery Company because it was a private company before the turnaroundwas attempted. However, both narrative information and unit shipmentfigures were available. Cost-of-sales data were not available for the years1917 through 1926 and were estimated for these years based on otherfinancial, production, and narrative information. A similar problem occurredfor the Maxwell-Chalmers cost-of-sales data for the year 1922, which werealso estimated. Because of some important developments in the case, data for Allis-Chalmers were collected for 23 years.
The Cadillac and Buick cases have not been included in the financialcomparisons because financial information was not available for these veryearly firms which were later incorporated into General Motors. However, agreat deal of narrative and physical units data were available for both thesecases, as was some financial information on the early history of GM.
The database and the narrative information were analyzed together in orderto reach conclusions about what happened during the turnaround attempts. In total, approximately 2000 individual quantitative data elements werecollected on these 16 companies. Additional information on the performanceof the industries and the national economy during the periods studied wasalso collected. This quantitative information, together with the narrativeinformation, provided a picture of what happened during these importantturnaround attempts.
Of the nine successful turnarounds studied, the survival time ranges from 9years (Chrysler Corporation — a relatively recent turnaround) to 85 years(Cadillac). Of the seven unsuccessful cases studied, two (Allis-Chalmers andWillys-Overland) have filed for bankruptcy. Four others (Hudson, Kaiser,Studebaker-Packard, and International Harvester) have departed what wasonce their major industry and have turned these operations over to others orclosed them. Of the unsuccessful turnarounds, only American Motors, at onetime an excellent company, remained in business in its major industry in1987. However, from 1982 to 1986, AMC/Renault lost $683 million and thefirm was absorbed by Chrysler Corporation that year.
Examining the Variables in Turnaround Success
The proposition advanced in this study is that a successful businessturnaround is primarily a function of three principal factors:
1. A business strategy that focuses primarily on improving the firm'seffectiveness as a low-cost producer.
2. A business strategy that focuses at a later stage on improving the firm'seffectiveness as a producer of increasingly differentiated products.
292

3. Leadership involving turnaround agents who possess managerial competencies, technical skills, industrial experience and value orientations, enjoy generallyfavorable personal reputations, and employ a sense of fair play in dealing with employees, creditors, suppliers, and customers.
Some comments are in order regarding the procedures employed to examinethe relevance of the three independent variables listed above.
Variable A: Low-Cost operation
The first independent variable, low cost of production, was examined as anecessary ingredient to the successful turnaround process. Amongquantitative measures examined to indicate the presence of the low cost ofproduction characteristic were the following:
· Gross profit rate (percent)
· After-tax profit rate (percent)
· Inventory turn ratio
· Inventory dollars per unit produced (for automobile producers)
· Incremental increase in cost as revenue increases (percent)
· Incremental decrease in cost as revenue decreases (percent)
· Before-tax non-cost-of-sales expense as a percent of revenue (percent)
· After-tax non-cost-of-sales expense as a percent of revenue (percent)
Narrative information was then utilized to supplement the quantitativeinformation.
Variable B: Product differentiation
The second independent variable examined, product differentiation, was more difficult to assess. However, considerable quantitative information wasavailable regarding specific product features and narrative information wasavailable on other aspects of product differentiation. To measure the presence of product differentiation, feature-by-feature comparisons of competitiveproduct offerings during the same time periods were employed. Productspecifications and narrative information from manuscripts and histories wereused to provide additional proxy indications of product quality, majorproduct features, and other differentiating characteristics. Each case was then studied to assess the firm's product differentiation as exhibited indistinguishing features, superior performance, product reliability, productquality, and customer service. Following the collection of the historical andproxy material, the degree of product differentiation was assessed. Ofnecessity, this assessment was partially subjective.
Variable C: The Turnaround Organization — Leadership
The Turnaround Experience: Real World Lessons in Revitalizing Corporations and Organizations

The third variable examined was the turnaround organization and, inparticular, its leadership. With respect to the turnaround agents and othermembers of the turnaround organization, the following characteristics wereexamined:
1. Functional background (finance, sales, engineering, production, service, etc.)of key turnaround agents (usually top managers within the firm)
2. Experience of top managers in the industry served
3. How the key turnaround agents spent their time
4. Operational emphasis and specific steps taken to improve the firm's position
5. Processes and styles of implementing change
6. Reputation for fairness (or unfairness) in dealing with employees, creditors,suppliers, and customers
In order to obtain information on these important characteristics, historicalevidence from manuscripts, documents, testimonials, and other histories were used to provide proxy indicators of their presence. Information about thecharacter traits of key executives and about the operational steps takenduring the turnaround process was obtained through reviewing the historicalworks covering these two industries and by collecting industry material. Avisit to the archives of General Motors Institute was most helpful, as wereseveral interviews with people closely associated with this major industry.
The database helped to clarify the narrative material. The availability ofinformation on such factors as gross profit rates, registrations, inventory turnratios, and incremental cost ratios helped to quantify some managerialactions described in the narrative material.
Table A-1 The Turnaround Sample
Successful Cases
Case 1 — Buick from 1906 to 1925
Case 3 — Jeffery Motors from 1911 to 1930
Case 5 — American Motors from 1951 to 1970
Case 6 — Ford Motor Company from 1975 to 1988
Case 8 — Cadillac from 1897 to 1916
Case 10 — Chrysler Corporation from 1975 to 1988
Case 12 — Maxwell-Chalmers from 1916 to 1935
Case 14 — Packard 1929 to 1948
Case 16 — Deere & company from 1927 to 1946
Unsuccessful Cases
Case 2 — International Harvester from 1966 to 1985
Case 4 — Willys-Overland from 1916 to 1935
Case 7 — Kaiser-Frazer from 1944 to 1956
Case 9 — Hudson Motor Car Company from 1927 to 1946
Case 11 — American Motors/Renault from 1971 to 1987
Case 13 — Allis-Chalmers from 1963 to 1986
Case 15 — Studebaker-Packard from 1949 to 1966
294

Table A-2 Summary of Changes through Three Turnaround Periods
Successful Turnarounds
Preturnaround
situation
Period of crisis Period of
recovery
Normalized Revenue in 1988 dollars (000)*
Sample size in number of cases (N) 5 6 7
Mean (M) 849,500 499,175 1,094,134
Range ®) 767,853 to1,466,661
Physical Unit Market Share
Sample size in number of cases (N) 8 8 8
Mean (M) 10.87% 7.72% 7.15%
Range ®) 2.16 to 9.70%
After-Tax Profit Rate
Sample size in number of cases (N) 5 7 7
Mean (M) 4.85% -5.38% 6.50%
Range ®) 1.57% to16.33%
*Normalized revenue is a relative measure used to adjust the financial figures for the individual firms
to a similar size to facilitate comparisons. The term dollars is used because all financial figures were
converted to 1988 dollars, as a part of this normalization procedure to provide for greater
comparability from one time period to another.
Table A-3Summary of Changes through Three Turnaround Periods
Unsuccessful Turnarounds
Preturnaround
situation
Period of crisis Period of
recovery
Normalized Revenue in 1988 dollars (000)*
Sample size in number of cases (N) 6 6 7
Mean (M) 1,202,519 1,029,306 953,629
Range ®) 590,148 to1,176,377
Physical Unit Market Share
Sample size in number of cases (N) 5 5 5
Mean (M) 5.68% 3.90% 2.54%
Range ®) 0.78 to 4.30%
After-Tax Profit Rate
Sample size in number of cases (N) 6 6 7
Mean (M) 3.51% -1.97% -1.03%
Range ®) -4.27 to 2.56%
*Normalized revenue is a unitless measure used to adjust the financial figures for the individual firms
to a similar size to facilitate comparisons. The term dollars is used because all financial figures were
converted to 1988 dollars, as a part of this normalization procedure to provide for greater
comparability from one time period to another.
The Turnaround Experience: Real World Lessons in Revitalizing Corporations and Organizations

Table A-4 Revenue in 1988 Dollars (000)
Year -3 revenue Year 0 revenue Percent change
Successful Cases
Packard 255,735 141,788 -44.6
Deere 524,929 73,403 -86.0
American Motors I 2,831,395 1,613,062 -43.0
Chrysler 29,586,933 12,822,971 -56.7
Ford 67,009,582 51,548,055 -23.1
Unsuccessful Cases
Hudson 1,416,263 245,541 -82.7
Studebaker-Packard 2,960,349 2,498,741 -15.6
International Harvester 7,631,616 7,568,679 -0.8
Allis-Chalmers 2,382,644 2,305,472 -3.2
Kaiser-Frazer-Willys* 406,487 1,166,233 186.9
American Motors II 4,078,281 4,339,100 6.4
*Kaiser's revenue declined from $2,419,606 in 1948 to $1,166,223 in 1949 (1988 $).
Table A-5 Change in Number of Units Produced
Year -3 units
produced
Year 0 units produced Percent change
Successful Cases
Cadillac 0 3
Buick 8,820 13,389*
Jeffery 4,435 4,608 *
Maxwell-Chalmers 39,000 21,000 -46.2
Packard 16,256 6,071 -54.2
American Motors I 213,762 104,190 -51.3
Chrysler 1,236,359 638,974 -48.3
Ford 2,555,866 1,306,950 -48.9
Unsuccessful Cases
Hudson 300,962 57,550 -80.9
Willys-Overland 88,753 48,016 -45.9
Studebaker-Packard 281,589 123,507 -56.1
Kaiser-Frazer-Willys 80,317 141,309 * 75.9
American Motors II 514,046 439,524 -14.5
*Although Buick sales in year 0 were actually greater than the sales for year -3, the company did
experience a 57 percent decline from 30,525 units in 1910 to 13,389 units in 1911.
296

Table A-6 Objective Information on Low-Cost operation during the Period ofrecovery
Gross profit rate> 15% Inventory turn ratio >
8
Non-cost-of-sales
expense > 14% of
revenue
Successful Cases
Cadillac Yes N/A Likely
Buick Yes Likely Likely
Jeffery (Nash) Yes Yes Yes
Maxwell-Chalmers Yes Yes Yes
Packard Yes Yes Yes
Deere Yes No No
American Motors I Yes Yes Yes
Chrysler Yes Yes Yes
Ford Yes Yes Yes
Unsuccessful Cases
Willys-Overland No No No
Hudson No Yes Yes
Studebaker-Packard No No No
International Harvester No No No
Allis-Chalmers Yes No No
Kaiser-Frazer No Yes Yes
American Motors II No Yes No
Table A-7 Narrative Information on Low-Cost operation during the Period of recovery
Cost reduction deep
and lasting
Design for
manufacturability
Commonality of parts
Successful Cases
Cadillac N/A Yes Yes
Buick N/A N/A Yes
Jeffery (Nash) Yes Yes Yes
Maxwell-Chalmers Yes Yes Yes
Packard Yes Yes Yes
Deere Yes Yes Yes
American Motors I Yes Yes Yes
Chrysler Yes Yes Yes
Ford Yes Yes Yes
Unsuccessful Cases
Willys-Overland No No No
Hudson Fair No Yes
Studebaker-Packard No No No
International Harvester No No No
Allis-Chalmers Yes N/A No
Kaiser-Frazer Fair No Some
The Turnaround Experience: Real World Lessons in Revitalizing Corporations and Organizations
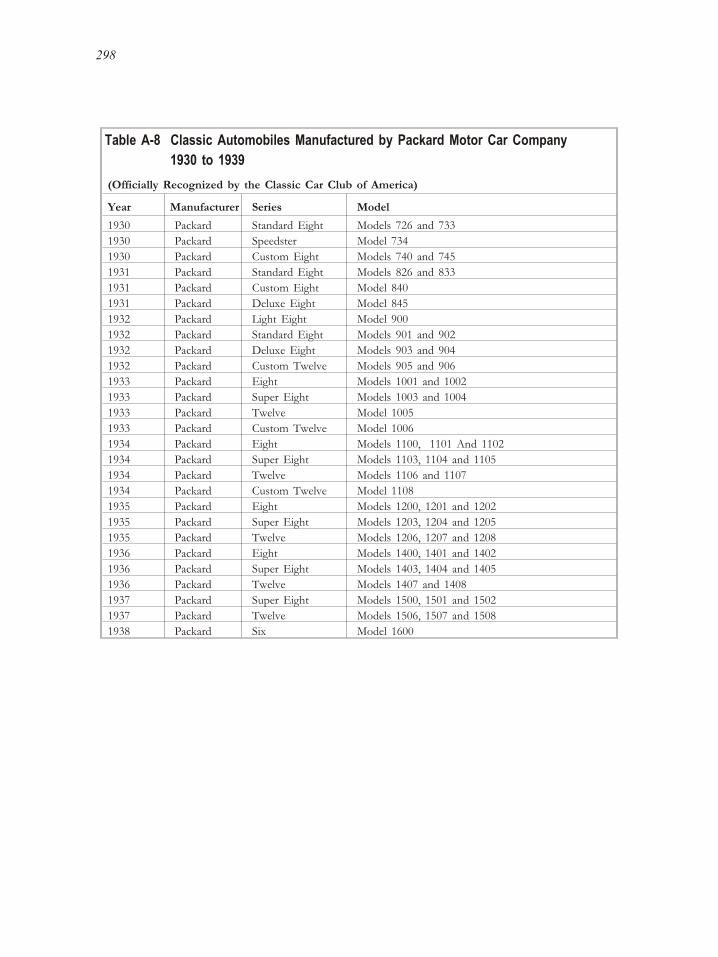
Table A-8 Classic Automobiles Manufactured by Packard Motor Car Company
1930 to 1939
(Officially Recognized by the Classic Car Club of America)
Year Manufacturer Series Model
1930 Packard Standard Eight Models 726 and 733
1930 Packard Speedster Model 734
1930 Packard Custom Eight Models 740 and 745
1931 Packard Standard Eight Models 826 and 833
1931 Packard Custom Eight Model 840
1931 Packard Deluxe Eight Model 845
1932 Packard Light Eight Model 900
1932 Packard Standard Eight Models 901 and 902
1932 Packard Deluxe Eight Models 903 and 904
1932 Packard Custom Twelve Models 905 and 906
1933 Packard Eight Models 1001 and 1002
1933 Packard Super Eight Models 1003 and 1004
1933 Packard Twelve Model 1005
1933 Packard Custom Twelve Model 1006
1934 Packard Eight Models 1100, 1101 And 1102
1934 Packard Super Eight Models 1103, 1104 and 1105
1934 Packard Twelve Models 1106 and 1107
1934 Packard Custom Twelve Model 1108
1935 Packard Eight Models 1200, 1201 and 1202
1935 Packard Super Eight Models 1203, 1204 and 1205
1935 Packard Twelve Models 1206, 1207 and 1208
1936 Packard Eight Models 1400, 1401 and 1402
1936 Packard Super Eight Models 1403, 1404 and 1405
1936 Packard Twelve Models 1407 and 1408
1937 Packard Super Eight Models 1500, 1501 and 1502
1937 Packard Twelve Models 1506, 1507 and 1508
1938 Packard Six Model 1600
298

Bibliography
Introduction
Ackoff, R. A.: Redesigning the Future, John Wiley & Sons, Inc., New York, 1974.Ackoff, R. A.: Creating the Corporate Future, John Wiley & Sons, Inc., New York, 1981.Adams, John S.: “The Regional Service Economy — A Contemporary Mirage?,” The Journal ofApplied Manufacturing Systems vol. 3, no.1, spring 1990, p. 3Bluestone, Barry, and Bennett Harrison: The Deindustrialization of American Industry, BasicBooks, New York, 1982. Botkin, J. W. et al.: No Limits To Learning: A Report to the Club of Rome, Pergamon, Oxford,1979.Chandler, Alfred D. Jr.: Scale and Scope, The Dynamics of Industrial Capitalism, HarvardBelknap Press, Cambridge, Massachusetts, 1990.Cohen, Stephen S., and John Zysman: Manufacturing Matters: The Myth of the Post-IndustrialEconomy, Basic Books, New York, 1987.Gantt, Henry L.: Industrial Leadership, Yale University Press, New Haven, Conn., 1916.Gantt, Henry L.: “The Parting of the Ways,” Classics in Management, Harwood F. Merrill, ed.,American Management Association, New York, 1960, pp. 151-160.Gantt, Henry L.: “Training Workmen in Habits of Industry and Cooperation,” Classics inManagement, Harwood F. Merrill, ed., American Management Association, New York, 1960.Gilbreth, Frank B.: “Science in Management for the One Best Way to do Work.” Classics inManagement, Harwood F. Merrill, ed., American Management Association, New York, 1960.Glasnall, William: “The World’s Top 50 Banks: Its Official — Japan Is Way Out in Front,”Business Week, no. 3058, June 27, 1988, p. 77.Hayes, Robert H., and William J. Abernathy: “Managing Our Way To Economic Decline,” Harvard Business Review, vol. 58, no. 14, July-Aug., 1980.Hayes, Robert H., and Steven C. Wheelwright: Restoring Our Competitive Edge: CompetingThrough Manufacturing, John Wiley & Sons, Inc., New York, 1984.Hayes, Robert H., Steven C. Wheelwright, and Kim B. Clark: Dynamic Manufacturing, FreePress, New York, 1988.Kilmann, R.H., and I. I. Mitroff: “Qualitative Versus Quantitative Analysis for ManagementScience: Different Forms of Psychological Types,” Interfaces, vol. 6, no. 2, Feb. 1976.Lawrence, Paul R., and Davis Dyer: Renewing American Industry, Free Press, New York, 1983. Leontief, Wassily: “The Ins and Outs of Input/Output Analysis.” Mechanical Engineering, vol. 109, no. 1, Jan. 1987, p. 29.Morgenstern, Oskar: Economic Activity Analysis, John Wiley & Sons, Inc., New York, 1954.Morgenstern, Oskar: International Financial Transactions and Business Cycles, PrincetonUniversity Press, Princeton, N.J., 1959.Thorow, Lester C.: The Zero Sum Society, Penguin, New York, 1980.U.S. Department of Commerce: Statistical Abstract of the United States 1988, U.S. GovernmentPrinting Office, Washington, D.C., 1989.
Chapter One
Whetten David A.: “Organizational Decline: A Neglected Topic in Organization Science,” Academy of Management Review, vol. 5, no. 4, 1980, pp. 577-588.
Chapter 2
Argenti, John: Corporate Collapse: Causes and Symptoms, John Wiley & Sons, New York, 1976.Bibeault, Donald B.: Corporate Turnaround: How Managers Turn Losers into Winners, McGrawHill, New York, 1982.Cooper, Arnold C. and Dan Schendel: “Strategic Responses to Technological Threats,” BusinessHorizons, Feb. 1976.Federated American Engineering Societies: Waste in Industry, McGraw Hill, New York, 1921.
The Turnaround Experience: Real World Lessons in Revitalizing Corporations and Organizations

Follett, Mary Parker: Dynamic Administration, Henry C. Metcalf and Lyndall Urwick, eds., Harper& Brothers, New York, 1941. Goodman, Stanley: How To Manage a Turnaround, Free Press, New York, 1982.Hall, William K.: “Survival Strategies in a Hostile Environment,” in Survival Strategies forAmerican Industry, John Wiley & Sons, Inc., New York, 1983.Hambrick, D. C., I. MacMillan, and D. Day: “Strategic Attributes and Performance in the BCGMatrix — a PIMS Based Analysis of Industrial Product Businesses,” Academy of ManagementJournal, vol. 25, no. 3, 1982.Hambrick, Donald C.,: “Turnaround Strategies,” Handbook of Business Strategy, W. H. Guth, ed., Warren, Gorham and Lamont, Boston, 1985.Hambrick, Donald C., and Richard A. D’Aveni: “Large Corporate Failures as Downward Spirals,”Administrative Science Quarterly, vol. 33, March 1988.Hambrick, D. C., and C. Schecter: “Turnaround Strategies for Mature Industrial ProductBusinesses,” Journal of Business Strategy, fall 1980.Hayes, Robert H.: “Strategic Planning — Forward in Reverse,” Harvard Business Review, vol. 63, no. 6, Nov.-Dec. 1985.Hofer, Charles W.: “Toward a Contingency Theory of Business Strategy.” Academy ofManagement Journal, vol. 18, no. 4, 1975.Hofer, Charles W. and Dan Schendel: Strategy Formation: Analytical Concepts, West Publishing,St. Paul, Minn., 1978.Hofer, Charles W. and M. J. Davoust: Successful Strategic Management, A.T. Kearney, Chicago, 1977, p. 138Hofer, Charles W.: “Turnaround Strategies,” Journal of Business Strategy, summer 1980, pp.19-31.Lorange, Peter and Robert T. Nelson: “How to Recognize — and Avoid — OrganizationalDecline,” Sloan Management Review, Spring 1987, pp. 41-48.Miller, Danny: “Common Syndromes of Business Failure,” Business Horizons, Nov. 1977, pp.43-53.Moody’s Industrial Manual, 1915, 1920, 1922, 1924, 1926, 1928, 1929, 1930, 1933, 1935, 1937,1938, 1939, 1942, 1946, 1948, 1952, 1953, 1954, 1955, 1958, 1961, 1964, 1968, 1972, 1975,1977, 1978, 1979, 1980, 1981, 1982, 1983, 1984, 1985, 1986.O’Niell, Hugh M.: “Turnaround and Recovery: What Strategy do You Need,” Long RangePlanning, vol. 19, no. 1, 1986.O’Niell, Hugh M.: Turnaround Strategies in the Commercial Banking Industry, UMI ResearchPress, Ann Arbor, Mich., 1981.Pettigrew, Andrew W.: An Awakening Giant: Continuity and Change in Imperial ChemicalIndustries, Basil Blackwell, New York, 1985.Richardson, Peter R.: Cost Containment: The Ultimate Advantage, Free Press, New York, 1988.Schendel, D., and G. R. Patton: “Corporate Stagnation and Turnaround,” Journal of Economicsand Business, vol. 28, no. 3, spring-summer 1976, pp. 236-241.Schendel, D., G. R. Patton, and J. Riggs: “Corporate Turnaround Strategies: A Study of ProfitDecline and Recovery,” Journal of General Management, spring 1976, p. 3-11. Starbuck, William H., Arent Greve, and Bo L.T. Hedberg: “Responding to Crisis,” Journal ofBusiness Administration, 9:p. 111-137. Taylor, Bernard: “Turnaround, Recovery and Growth: The Way Through the Crises.” Journal ofGeneral Management, winter 1982/83, p. 5-13.Zimmerman, Frederick M.: “Turnaround — A Painful Learning Process.” Long Range Planning,vol. 19, no. 4, Aug. 1986.U.S. Federal Trade Commission: Report to the Seventy Fourth Congress on the AgriculturalImplement and Machinery Industry, U.S. Government Printing Office, Washington, D.C., 1938.Zimmerman, Frederick M.: “Managing a Successful Turnaround,” Long Range Planning, vol. 22,no. 3, June 1989.
Chapter 3
Allis-Chalmers Corporation: 1984 Annual Report, Allis-Chalmers Corporation, Milwaukee, ., 1985.Allis-Chalmers Corporation: 1985 Annual Report, Allis-Chalmers Corporation, Milwaukee, Wisc.,1986.Allis-Chalmers Corporation: 1984 Form 10-K, Allis-Chalmers Corporation, Milwaukee, Wisc., 1986.
300

Allis-Chalmers Corporation: 1985 Form 10-K, Allis-Chalmers Corporation, Milwaukee, Wisc., 1986.Allis-Chalmers Corporation: 1986 Form 10-K, Allis-Chalmers Corporation, Milwaukee, Wisc., 1986.Allis-Chalmers Corporation: News Release #105-87, Allis-Chalmers Corporation, 1987.Allis-Chalmers Corporation: News Release #106-87, Allis-Chalmers Corporation, Milwaukee,Wisc., 1987.Allis-Chalmers Corporation: News Release #116-87, Allis-Chalmers Corporation, Milwaukee,Wisc., 1987.Broehl, Wayne G. Jr.: John Deere’s Company, Doubleday, New York, 1984.Chandler, Alfred D.: Giant Enterprise: Ford, General Motors and the Automobile Industry,Harcourt Brace, New York, 1964.Edwards, Charles E.: Dynamics of the United States Automobile Industry, University of SouthCarolina Press, Columbia, S.C., 1965.Harvard Business School: “Ford Motor Company (C),” #9-382-165, Harvard Business School,Boston, 1983.Harvard Business School: “Ford Motor Company (D),” #9-382-166, Harvard Business School,Boston, 1983.Heasley, Jerry: The Production Figure Book for U.S. Cars, Motorbooks International, Osceola,Wisc., 1977.Kennedy, E. D.: The Automobile Industry: The Coming of Age of Capitalism’s Favorite Child,Reynal & Hitchcock, New York, 1941.Kimes, B. R., and Henry Austin Clark, Jr.: The Standard Catalog of American Cars 1805-1942,Krause, Iola, Wisc., 1985.Kimes, B. R., and Richard M. Langworth: Packard: A History of The Motor Car and theCompany, Princeton Publishing, Princeton, N.J., 1978.Langworth, Richard M., and Jan P. Nordbye: The Complete History of Chrysler Corporation1924-1985, Publications International, Skokie, Ill., 1985.Langworth, Richard M.: The Milestone Car Number Seventeen, Dragonwyck, Hopewell, N.J.,autumn 1976.Langworth, Richard M.: Kaiser-Frazer: The Last Onslaught on Detroit, Princeton, Princeton, N.J.,1975.Moody’s Industrial Manual, 1915, 1920, 1922, 1924, 1926, 1928, 1929, 1930, 1933, 1935, 1937,1938, 1939, 1942, 1946, 1948, 1952, 1953, 1954, 1955, 1958, 1961, 1964, 1968, 1972, 1975,1977, 1978, 1979, 1980, 1981, 1982, 1983, 1984, 1985, 1986.“Packard,” Fortune Magazine, Jan. 1937, Reprinted in Packard’s International Motor Car Club,vol, 18, no. 4, winter 1981.Schendel, D., and G. R. Patton: “Corporate Stagnation and Turnaround.” Journal of Economicsand Business, vol. 28, no. 3, spring-summer 1976, pp. 236-241Seltzer, Lawrence: The Financial History of the North American Automobile Industry, HoughlinMifflin, Boston, 1928.U.S. Federal Trade Commission: Report to the Seventy Fourth Congress on the AgriculturalImplement and Machinery Industry, U.S. Government Printing Office, Washington, D.C., 1938.U.S. Federal Trade Commission: Report to the Seventy Fourth Congress on the Motor VehicleIndustry, U.S. Government Printing Office, Washington, D.C., 1938.Wards Automotive Yearbook, 1977 & 1985.
Chapter Four Automotive Quarterly Editors and Princeton Institute for Historic Research: General Motors: TheFirst 75 Years of Transportation Products, Automotive Quarterly, Princeton, N.J., 1983.Automobile Manufacturers Association: Automobiles of America, Wayne State University Press,Detroit, 1968.Chandler, Alfred D.: Giant Enterprise: Ford, General Motors and the Automobile Industry,Harcourt Brace, New York, 1964.Chandler, Alfred D.: Strategy and Structure. MIT Press, Cambridge, Mass., 1962.Chandler, Alfred D., and Stephen Salsbury: Pierre S. DuPont and the Making of the ModernCorporation, Harper & Row, New York, 1971. Chandler, Alfred D.: The Visible Hand: The Managerial Revolution in American Business, Harvard University Press, Cambridge, Mass., 1977.Chilton’s Automotive Multi-Guide Spring 1931, Chilton Book Company, Radnor, Penn., 1970.
The Turnaround Experience: Real World Lessons in Revitalizing Corporations and Organizations

Christiansen, C. Roland, Kenneth R. Andrews, Joseph L. Bower, Richard G. Hamermesh, andMichael E. Porter: Business Policy: Text and Cases, Irwin, Homewood, Ill., 1982.Chrysler, Walter P.: Life of an American Workman, Dodd, Mead & Company, New York, 1937.Coleman, Richard N., and Keith W. Burnaham: “Milestones in the Application of Power toAgricultural Machines,” An Historical Perspective of Farm Machinery, Society of AutomotiveEngineers, Milwaukee, Wisc., 1980.Crabb, Richard: Birth of a Giant: The Men and Incidents that Gave America the Motorcar,Chilton, New York, 1969.Cray, Ed: Chrome Colossus: General Motors and Its Times, McGraw Hill, New York, 1980. Dunham, Terry B., and Lawrence R. : The Buick: A Complete History, Princeton Publishing,Princeton, N.J., 1985. Dyke, A. L.: Dyke’s Automotive and Gasoline Engine Encyclopedia, A. L. Dyke, St. Louis, 1946.Fink, James J.: The Car Culture, MIT Press, Cambridge, Mass., 1975.Forbes, Bertie Charles: Automotive Giants of America, Books for Libraries Press, New York,1972.Ford, Jeffrey D.: “The Occurrence of Structural Hysteresis in Declining Organizations,” Academyof Management Review, vol. 5, no. 4, 1980, pp. 589-598Hambrick, D. C., and C. Schecter: “Turnaround Strategies for Mature Industrial ProductBusinesses,” Journal of Business Strategy, fall 1980Hamner, W. Clay: “Reinforcement Theory and Contingency Management in OrganizationalSettings,” Motivation and Work Behavior, Richard M. Steers and Lyman W. Porter, eds., McGraw Hill, New York, 1983.Hamner, W. Clay, Jerry Ross, and Barry M. Staw: “Motivation in Organizations: The Need for aNew Direction,” Motivation and Work Behavior, Richard M. Steers and Lyman W. Porter, eds.,McGraw Hill, New York, 1983.Harbison, Frederick H., and Robert Dubin: Patterns of Union-Management Relations: United Auto Workers, (CIO. * GENERAL MOTORS * STUDEBAKER.) SRA, Chicago, 1947. Hayes, Robert H., and Steven C. Wheelwright: Restoring Our Competitive Edge: CompetingThrough Manufacturing, John Wiley & Sons, New York, 1984.Hayes, Robert H., Steven C. Wheelwright, and Kim B. Clark: Dynamic Manufacturing, FreePress, New York, 1988.Heasley, Jerry: The Production Figure Book For U.S. Cars, Motorbooks International, Osceola,Wisc., 1977.Hofer, Charles W.: “Toward a Contingency Theory of Business Strategy.” Academy ofManagement Journal, vol. 18, no. 4, 1975.Hofer, Charles W.: “Turnaround Strategies,” Journal of Business Strategy, summer 1980, pp.19-31.Homans, James E.: Self Propelled Vehicles: A Practical Treatise on the Theory, Construction,Operation, Care and Management of All Forms of Automobiles, Theo. Audel & Company, NewYork, 1906.Hunt, R. Douglas: American Farm Tools from Hand Power to Steam Power, Sunflower University Press, Manhatten, Kans., 1985.“International Harvester — Supremacy.” Fortune Magazine, Aug. 1933.Jardim, Anne: “The First Henry Ford.” #9-373-308, Boston: Harvard Business School, 1973.Jelinek, Mariann, and Michael C. Burstein: “The Production Administrative Structure: A Paradigmfor Strategic Fit,” Academy of Management Review, vol. 7, no. 2, Apr. 1982, pp. 242-252.Jennings, Eugene E.: An Anatomy of Leadership, Harper & Brothers, New York, 1960.Kennedy, E. D.: The Automobile Industry: The Coming of Age of Capitalism’s Favorite Child,Reynal & Hitchcock, New York, 1941.Kimes, B. R., and Henry Austin Clark, Jr.: The Standard Catalog of American Cars 1805-1942,Krause, Iola, Wisc., 1985.Kimes, B. R., and Richard M. Langworth: Packard: A History of The Motor Car and theCompany, Princeton Publishing, Princeton, N.J., 1978.Langworth, Richard M., and Jan P. Nordbye: The Complete History of Chrysler Corporation1924-1985, Publications International, Skokie, Ill., 1985.Leland, Mrs. Wilfred C., and Minnie Dubbs Millbrook: Master of Precision — Henry M. Leland,Wayne State University Press, Detroit, 1966.Marsh, Barbara: A Corporate Tragedy: The Agony of International Harvester Company,Doubleday, Garden City, N.Y., 1985.May, George S.: A Most Unique Machine: The Michigan Origins of the American AutomobileIndustry, William B. Eerdmans Publishing, Grand Rapids, Mich., 1975.
302

Moody’s Industrial Manual, 1915, 1920, 1922, 1924, 1926, 1928, 1929, 1930, 1933, 1935, 1937,1938, 1939, 1942, 1946, 1948, 1952, 1953, 1954, 1955, 1958, 1961, 1964, 1968, 1972, 1975,1977, 1978, 1979, 1980, 1981, 1982, 1983, 1984, 1985, 1986.Morgenstern, Oskar: Economic Activity Analysis, John Wiley & Sons, New York, 1954.Morgenstern, Oskar: International Financial Transactions and Business Cycles, PrincetonUniversity Press, Princeton, N.J., 1959.Naul, G. Marshall, and R. Perry Zavitz: The Specification Book for U.S. Cars 1930-1969,Motorbooks International, Osceola, Wisc., 1980.Naylor, James C., Robert D. Pritchard, Daniel R. Illgen: A Theory of Behavior in Organizations,Academic Press, New York, 1980.Nevins, Allan: Ford: The Times, The Man, The Company, Charles Scribner’s Sons, New York,1954.O’Niell, Hugh M.: “Turnaround and Recovery: What Strategy do You Need.” Long RangePlanning, vol. 19, no. 1, 1986.O’Niell, Hugh M.: Turnaround Strategies in the Commercial Banking Industry, UMI ResearchPress, Ann Arbor, Mich., 1981.Pound, Arthur: The Turning Wheel: The Story of General Motors Through Twenty-five Years,Doubleday, Doran & Company, Garden City, N.Y., 1934.Rae, John B.: The American Automobile: A Brief History, University of Chicago Press, Chicago,1965.Rae, John B.: The American Automobile Industry, G.K. Hall, Boston, 1984.Richardson, Peter R.: Cost Containment: The Ultimate Advantage, Free Press, New York, 1988.Roberts, Peter: The History of the Automobile, Exeter, New York, 1984.Ross, Joel E., and Michael J. Kami: Corporate Management in Crisis: Why the Mighty Fall,Prentice-Hall, Englewood Cliffs, N.J., 1973.Rothberg, Robert R.: Corporate Strategy And Product Innovation, Free Press, New York, 1976.Schendel, Dan, and Charles W. Hofer: Strategic Management: A New View of Business Policyand Planning. Little Brown, Boston, 1979.Schendel, D., and G. R. Patton: “Corporate Stagnation and Turnaround.” Journal of Economicsand Business, vol. 28, no. 3, spring-summer 1976, pp. 236-241.Schendel, D., G. R. Patton, and J. Riggs: “Corporate Turnaround Strategies: A Study of ProfitDecline and Recovery.” Journal of General Management, spring 1976, pp. 3-11. Schisgall, Oscar: Eyes on Tomorrow: The Evolution of Procter & Gamble, Doubleday, New York,1981.Schnaars, Steven P.: Megamistakes: Forecasting and the Myth of Rapid Technological Change,Free Press, New York, 1989.Schoeffler, S., R. Buzzell, and D. Heany: “Impact of Strategic Planning on Profit Performance,”Harvard Business Review, vol. 52, no.2, March-April 1974.Sears, Stephen W.: The Automobile in America, American Heritage, New York, 1977.Seltzer, Lawrence: The Financial History of the North American Automobile Industry, HoughlinMifflin, Boston, 1928.Slappey, Sterling G.: Pioneers of American Business, Grosset & Dunlap, New York, 1970. Sloan, Alfred B., Jr.: My Years With General Motors, Doubleday, Garden City, N.Y., 1964. Smith, Philip H.: Wheels Within Wheels: A Short History of American Motor Car Manufacturing,Funk & Wagnalls, New York, 1968.Society of Automotive Engineers: An Historical Perspective of Farm Machinery, SAE, Warrendale, Pa., 1980.Southwick, Lawrence, Jr.: Managerial Economics, Business Publications, Plano, Texas 1985.Taylor, Bernard: “Turnaround, Recovery and Growth: The Way Through the Crises,” Journal ofGeneral Management, winter 1982/83, pp. 5-13.U.S. Federal Trade Commission: Report to the Seventy Fourth Congress on the AgriculturalImplement and Machinery Industry, U.S. Government Printing Office, Washington, D.C., 1938.U.S. Federal Trade Commission: Report to the Seventy Fourth Congress on the Motor VehicleIndustry, U.S. Government Printing Office, Washington, D.C., 1938.Wendel,C. H.: 150 Years of International Harvester, Crestline, Sarasota, Fla., 1981.White, Lawrence, J.: The Automobile Industry Since 1945, Harvard University Press, Cambridge,Mass., 1971.
The Turnaround Experience: Real World Lessons in Revitalizing Corporations and Organizations
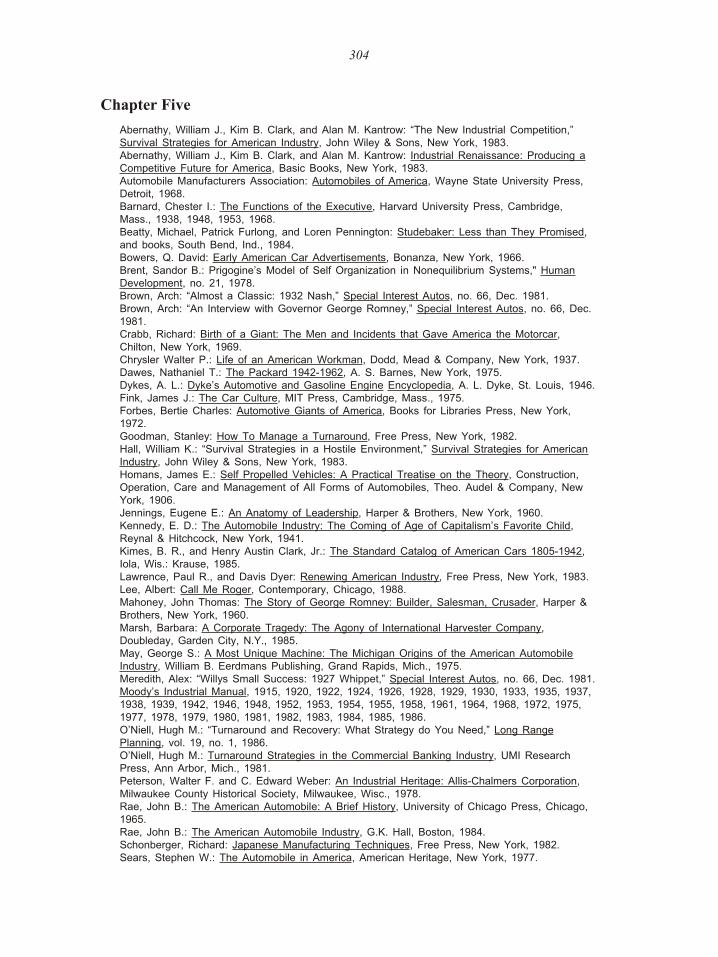
Chapter Five
Abernathy, William J., Kim B. Clark, and Alan M. Kantrow: “The New Industrial Competition,”Survival Strategies for American Industry, John Wiley & Sons, New York, 1983.Abernathy, William J., Kim B. Clark, and Alan M. Kantrow: Industrial Renaissance: Producing aCompetitive Future for America, Basic Books, New York, 1983.Automobile Manufacturers Association: Automobiles of America, Wayne State University Press,Detroit, 1968.Barnard, Chester I.: The Functions of the Executive, Harvard University Press, Cambridge,Mass., 1938, 1948, 1953, 1968.Beatty, Michael, Patrick Furlong, and Loren Pennington: Studebaker: Less than They Promised,and books, South Bend, Ind., 1984.Bowers, Q. David: Early American Car Advertisements, Bonanza, New York, 1966.Brent, Sandor B.: Prigogine’s Model of Self Organization in Nonequilibrium Systems," HumanDevelopment, no. 21, 1978.Brown, Arch: “Almost a Classic: 1932 Nash,” Special Interest Autos, no. 66, Dec. 1981.Brown, Arch: “An Interview with Governor George Romney,” Special Interest Autos, no. 66, Dec.1981.Crabb, Richard: Birth of a Giant: The Men and Incidents that Gave America the Motorcar,Chilton, New York, 1969.Chrysler Walter P.: Life of an American Workman, Dodd, Mead & Company, New York, 1937.Dawes, Nathaniel T.: The Packard 1942-1962, A. S. Barnes, New York, 1975.Dykes, A. L.: Dyke’s Automotive and Gasoline Engine Encyclopedia, A. L. Dyke, St. Louis, 1946.Fink, James J.: The Car Culture, MIT Press, Cambridge, Mass., 1975.Forbes, Bertie Charles: Automotive Giants of America, Books for Libraries Press, New York,1972.Goodman, Stanley: How To Manage a Turnaround, Free Press, New York, 1982.Hall, William K.: “Survival Strategies in a Hostile Environment,” Survival Strategies for AmericanIndustry, John Wiley & Sons, New York, 1983.Homans, James E.: Self Propelled Vehicles: A Practical Treatise on the Theory, Construction,Operation, Care and Management of All Forms of Automobiles, Theo. Audel & Company, NewYork, 1906.Jennings, Eugene E.: An Anatomy of Leadership, Harper & Brothers, New York, 1960.Kennedy, E. D.: The Automobile Industry: The Coming of Age of Capitalism’s Favorite Child,Reynal & Hitchcock, New York, 1941.Kimes, B. R., and Henry Austin Clark, Jr.: The Standard Catalog of American Cars 1805-1942,Iola, Wis.: Krause, 1985.Lawrence, Paul R., and Davis Dyer: Renewing American Industry, Free Press, New York, 1983.Lee, Albert: Call Me Roger, Contemporary, Chicago, 1988.Mahoney, John Thomas: The Story of George Romney: Builder, Salesman, Crusader, Harper &Brothers, New York, 1960. Marsh, Barbara: A Corporate Tragedy: The Agony of International Harvester Company,Doubleday, Garden City, N.Y., 1985.May, George S.: A Most Unique Machine: The Michigan Origins of the American AutomobileIndustry, William B. Eerdmans Publishing, Grand Rapids, Mich., 1975.Meredith, Alex: “Willys Small Success: 1927 Whippet,” Special Interest Autos, no. 66, Dec. 1981.Moody’s Industrial Manual, 1915, 1920, 1922, 1924, 1926, 1928, 1929, 1930, 1933, 1935, 1937,1938, 1939, 1942, 1946, 1948, 1952, 1953, 1954, 1955, 1958, 1961, 1964, 1968, 1972, 1975,1977, 1978, 1979, 1980, 1981, 1982, 1983, 1984, 1985, 1986.O’Niell, Hugh M.: “Turnaround and Recovery: What Strategy do You Need,” Long RangePlanning, vol. 19, no. 1, 1986.O’Niell, Hugh M.: Turnaround Strategies in the Commercial Banking Industry, UMI ResearchPress, Ann Arbor, Mich., 1981.Peterson, Walter F. and C. Edward Weber: An Industrial Heritage: Allis-Chalmers Corporation,Milwaukee County Historical Society, Milwaukee, Wisc., 1978.Rae, John B.: The American Automobile: A Brief History, University of Chicago Press, Chicago,1965.Rae, John B.: The American Automobile Industry, G.K. Hall, Boston, 1984.Schonberger, Richard: Japanese Manufacturing Techniques, Free Press, New York, 1982.Sears, Stephen W.: The Automobile in America, American Heritage, New York, 1977.
304

Seltzer, Lawrence: The Financial History of the North American Automobile Industry, HoughtonMifflin, Boston, 1928.Sloan, Alfred B. Jr.: My Years with General Motors, Doubleday, New York, 1964.Smith, Philip H.: Wheels Within Wheels: A Short History of American Motor Car Manufacturing,Funk & Wagnalls, New York, 1968.U.S. Federal Trade Commission: Report to the Seventy Fourth Congress on the Motor VehicleIndustry, U.S. Government Printing Office, Washington, D.C., 1938.Zimmerman, Frederick M.: “Turnaround — A Painful Learning Process,” Long Range Planning,vol. 19, no. 4, Aug., 1986.
Chapter Six
Abernathy, William J., Kim B. Clark, and Alan M. Kantrow: “The New Industrial Competition,”Survival Strategies for American Industry, John Wiley & Sons, New York, 1983.Abernathy, William J., Kim B. Clark, and Alan M. Kantrow: Industrial Renaissance: Producing aCompetitive Future for America, Basic Books, New York, 1983.Abodaher, David: Iacocca: America’s Most Dynamic Businessman. Kensington, 1985, New York.Automobile Manufacturers Association: Automobiles of America, Wayne State University Press,Detroit, 1968.Broehl, Wayne G., Jr: John Deere’s Company, Doubleday, New York, 1984.Brown, Arch: “1948-1954 Hudson: Step Up to a Step Down,” Collectible Automobile, vol. 3, no.1, June 1986, pp. 50-70.Brown, Arch: “An Interview with Governor George Romney,” Special Interest Autos, no. 66, Dec.1981.Chrysler, Walter P.: Life of an American Workman, Dodd, Mead & Company, New York, 1937.Conde, John A.: The Cars That Hudson Built, Arnold Porter Publishing, Keego Harbor, Mich.,1980.Edwards, Charles E.: Dynamics of the United States Automobile Industry, University of SouthCarolina Press, Columbia, S.C., 1965.Fink, James J.: The Car Culture, MIT Press, Cambridge, Mass., 1975.Forbes, Bertie Charles: Automotive Giants of America, Books for Libraries Press, New York,1972.Harbison, Frederick H., and Robert Dubin: Patterns of Union-Management Relations: United Auto Workers, (CIO. * GENERAL MOTORS * STUDEBAKER.) SRA, Chicago, 1947. Heasley, Jerry: The Production Figure Book for U.S. Cars, Motorbooks International, Osceola,Wisc., 1977.Hofer, Charles W.: “Turnaround Strategies.” Journal of Business Strategy, summer 1980, 19-31.Kimes, B. R., and Henry Austin Clark, Jr.: The Standard Catalog of American Cars 1805-1942,Krause, Iola, Wisc., 1985.Langworth, Richard M.: The Milestone Car Number Seventeen. Dragonwyck, Hopewell, N.J.,autumn 1976.Leland, Mrs. Wilfred C., and Minnie Dubbs Millbrook: Master of Precision — Henry M. Leland,Wayne State University Press, Detroit, 1966.Mahoney, John Thomas: The Story Of George Romney: Builder, Salesman, Crusader. Harper &Brothers, New York, 1960. May, George S.: A Most Unique Machine: The Michigan Origins of the American AutomobileIndustry, William B. Eerdmans Publishing, Grand Rapids, Mich., 1975.Mayborn, Mitch, and Ted W. Mayborn: Hudson: An Historical Account of the Hudson, Essex, And Terraplane Automobiles, Highland Enterprises, Dallas, 1975.Moody’s Industrial Manual, 1915, 1920, 1922, 1924, 1926, 1928, 1929, 1930, 1933, 1935, 1937,1938, 1939, 1942, 1946, 1948, 1952, 1953, 1954, 1955, 1958, 1961, 1964, 1968, 1972, 1975,1977, 1978, 1979, 1980, 1981, 1982, 1983, 1984, 1985, 1986.Naul, G. Marshall, and R. Perry Zavitz: The Specification Book for U.S. Cars 1930-1969,Motorbooks International, Osceola, Wisc., 1980.“Packard.” Fortune Magazine, January 1937, reprinted in Packards International Motor Car Club,vol. 18, no. 4, winter 1981.Roberts, Peter: The History of the Automobile, Exeter, New York, 1984.Schonberger, Richard: Japanese Manufacturing Techniques, Free Press, New York, 1982.Sears, Stephen W.: The Automobile in America, American Heritage, New York, 1977.
The Turnaround Experience: Real World Lessons in Revitalizing Corporations and Organizations

Wards Automotive Yearbook, 1977 & 1985.White, Lawrence, J.: The Automobile Industry Since 1945, Harvard University Press, Cambridge,Mass., 1971Zimmerman,Frederick M.: “Managing a Successful Turnaround,” Long Range Planning, vol. 22,no. 3, June 1989.
Chpater Seven
Abernathy, William J., Kim B. Clark, and Alan M. Kantrow: Industrial Renaissance: Producing aCompetitive Future for America, Basic Books, New York, 1983.Edwards, Charles E.: Dynamics of the United States Automobile Industry, University of SouthCarolina Press, Columbia, S.C., 1965.Fuller, Mark B.: “Ford Motor Company (A),” #9-382-161, Harvard Business School, Boston, 1982.Fuller, Mark B.: “Ford Motor Company (B),” #9-382-162, Harvard Business School, Boston, 1982.Harvard Business School: “Ford Motor Company (C),” #9-382-165, Harvard Business School,Boston, 1983.Harvard Business School: “Ford Motor Company (D),” #9-382-166, Harvard Business School,Boston, 1983.Heasley, Jerry: The Production Figure Book For U.S. Cars, Motorbooks International, Osceola,Wisc., 1977.Kimes, Beverley Rae “Blueprints and Balance Sheets — The Company that Charlie Built,”Automotive Quarterly, vol. XV, no. 2, Second Quarter 1977.Kimes, B. R., and Henry Austin Clark, Jr.: The Standard Catalog of American Cars 1805-1942,Krause, Iola, Wisc., 1985.Langworth, Richard M.: The Milestone Car Number Seventeen, Dragonwyck, Hopewell, N.J.,autumn 1976.Langworth, Richard M.: Kaiser-Frazer: The Last Onslaught on Detroit, Princeton, Princeton, N.J.,1975.Langworth, Richard M.: “1951-55 Kaiser: The Memorable Generation,” Collectible Automobile, vol. 1, no. 6, March 1985: p. 22.Mishne, Patricia P.: “A Passion for Perfection,” Manufacturing Engineering, Nov. 1988.Moody’s Industrial Manual, 1915, 1920, 1922, 1924, 1926, 1928, 1929, 1930, 1933, 1935, 1937,1938, 1939, 1942, 1946, 1948, 1952, 1953, 1954, 1955, 1958, 1961, 1964, 1968, 1972, 1975,1977, 1978, 1979, 1980, 1981, 1982, 1983, 1984, 1985, 1986.Naul, G. Marshall, and R. Perry Zavitz: The Specification Book for U.S. Cars 1930-1969,Motorbooks International, Osceola, Wisc., 1980.Schnaars, Steven P.: Megamistakes: Forecasting and the Myth of Rapid Technological Change,Free Press, New York, 1989.Smith, Philip H.: Wheels Within Wheels: A Short History of American Motor Car Manufacturing,Funk & Wagnalls, New York, 1968.Wards Automotive Yearbook, 1977 & 1985.White, Lawrence, J.: The Automobile Industry Since 1945, Harvard University Press, Cambridge,Mass., 1971
Chapter Eight
Abernathy, William J., Kim B. Clark, and alan M. Kantrow. Industrial Renaissance: Producing aCompetitive Future for America, New York: Basic Books, 1983.Automotive Quarterly Editors and Princeton Institute for Historic Research: General Motors: TheFirst 75 Years of Transportation Products, Princeton, N.J.: Automotive Quarterly, 1983.Automobile Manufacturers Association: Automobiles of America, Detroit: Wayne State, 1968.Bowers, Q. David: Early American Car Advertisements, New York: Bonanza, 1966.Brown, Arch: “1948-1954 Hudson: Step Up to a Step Down,” Collectible Automobile 3, no. 1(June 1986): 50-70.Chandler, Alfred D. Giant Enterprise: Ford, General Motors and the Automobile Industry, NewYork: Harcourt Brace, 1964.Chilton’s Automotive Multi-Guide Spring 1931, Radnor, Pa.: Chilton Book Company, 1970.
306

Conde, John A. The Cars That Hudson Built, Keego Harbor, Mich.: Arnold Porter Publishing,1980.Crabb, Richard: Birth of a Giant: The Men and Incidents that Gave America the Motorcar, NewYork: Chilton, 1969.Cray, Ed: Chrome Colossus: General Motors and Its Times, New York: McGraw Hill, 1980. Dykes, A. L. Dyke’s Automotive and Gasoline Engine Encyclopedia, St. Louis: A. L. Dyke, 1946.Edwards, Charles E. Dynamics of the United States Automobile Industry, Columbia, S.C.:University of South Carolina Press, 1965.Feigenbaum, Armand V. Total Quality Control, New York: McGraw, 1983.Fink, James J. The Car Culture, Cambridge, Mass.: MIT Press, 1975.Forbes, Bertie Charles: Automotive Giants of America, New York: Books for Libraries Press,1972.Homans, James E. Self Propelled Vehicles: A Practical Treatise on the Theory, Construction,Operation, Care and Management of All Forms of Automobiles, New York: Theo. Audel &Company, 1906.Hendry, Maurice D. “Hudson, The Car Named for Jackson’s Wife’s Uncle,” Automotive Quarterly,vol. IX, no. 4, Summer 1971.Jardim, Anne: “The First Henry Ford,” #9-373-308, Boston: Harvard Business School, 1973.Juran, J. M., and Frank M. Gryna, Jr. Quality Planning and Analysis: From Product Development Through Use, New York: McGraw Hill, 1980.Kennedy, E. D. The Automobile Industry: The Coming of Age of Capitalism’s Favorite Child, New York: Reynal & Hitchcock, 1941.Kimes, B. R., and Henry Austin Clark, Jr. The Standard Catalog of American Cars 1805-1942,Iola, Wisc.: Krause, 1985.Langworth, Richard M. The Milestone Car Number Seventeen, Hopewell, N.J.: Dragonwyck,Autumn 1976.Leland, Mrs. Wilfred C., and Minnie Dubbs Millbrook: Master of Precision — Henry M. Leland,Detroit: Wayne State, 1966.May, George S. A Most Unique Machine: The Michigan Origins of the American AutomobileIndustry, Grand Rapids, Mich.: William B. Eerdmans Publishing, 1975.Mayborn, Mitch, and Ted W. Mayborn: Hudson: An Historical Account of the Hudson, Essex, And Terraplane Automobiles, Dallas: Highland Enterprises, 1975.Moody’s Industrial Manual, (1915, 1920, 1922, 1924, 1926, 1928, 1929, 1930, 1933, 1935, 1937, 1938, 1939, 1942, 1946, 1948, 1952, 1953, 1954, 1955, 1958, 1961, 1964, 1968, 1972, 1975,1977, 1978, 1979, 1980, 1981, 1982, 1983, 1984, 1985, 1986).Nevins, Allan: Ford: The Times, The Man, The Company, New York: Charles Scribner’s Sons,1954.Norwood, Edwin P. Ford:Men and Methods, Garden City, N.Y.: Doubleday Doran, 1931.Pound, Arthur: The Turning Wheel; The Story of General Motors Through Twenty-five Years,Garden City, N.Y.: Doubleday, Doran & Company, 1934.Rae, John B. The American Automobile: A Brief History, Chicago: University of Chicago Press,1965.Rae, John B. The American Automobile Industry, Boston: G.K. Hall, 1984.Roberts, Peter: The History of the Automobile, New York: Exeter, 1984.Sears, Stephen W. The Automobile in America, New York: American Heritage, 1977.Seltzer, Lawrence: The Financial History of the North American Automobile Industry, HoughlinMifflin, Boston, 1928.Slappey, Sterling G. Pioneers of American Business, New York:Grosset & Dunlap, 1970. Sloan, Alfred B., Jr. My Years With General Motors, Garden City, N.Y.: Doubleday, 1964. Smith, Philip H. Wheels Within Wheels; A Short History of American Motor Car Manufacturing,New York: Funk & Wagnalls, 1968.Weisberger, Bernard A. The Dream Maker: William C. Durant Founder of General Motors,Boston: Little Brown, 1979.White, Lawrence, J. The Automobile Industry Since 1945, Cambridge, Mass.: Harvard UniversityPress, 1971
Chapter Nine
Abodaher, David: Iacocca: America’s Most Dynamic Businessman, New York: Kensington, 1985.
The Turnaround Experience: Real World Lessons in Revitalizing Corporations and Organizations

“Chrysler’s Automated Convalescence,” Mechanical Engineering, vol. 109, no. 7, July 1987,55-59.Edwards, Charles E.: Dynamics of the United States Automobile Industry, Columbia, S.C.:University of South Carolina Press, 1965.Hambrick, D.C., and C. Schecter: “Turnaround Strategies for Mature Industrial ProductBusinesses,” Journal of Business Strategy, fall 1980.Iacocca, Lee, and William Novack: Iacocca: An Autobiography. New York: Bantam, 1984.Ingrassia, Paul and Bradley A. Stertz, “Mea Culpa, With Chrysler Ailing, Lee Iacocca ConcedesMistakes in Managing,” Wall Street Journal, September 17, 1985, page 1.Langworth, Richard M., and Jan P. Nordbye. The Complete History of Chrysler Corporation1924-1985, Skokie, Ill.: Publications International, 1985.Moody’s Industrial Manual, (1915, 1920, 1922, 1924, 1926, 1928, 1929, 1930, 1933, 1935, 1937, 1938, 1939, 1942, 1946, 1948, 1952, 1953, 1954, 1955, 1958, 1961, 1964, 1968, 1972, 1975,1977, 1978, 1979, 1980, 1981, 1982, 1983, 1984, 1985, 1986).Reich, Robert B., and John D. Donahue: New Deals: The Chrysler Revival and the AmericanSystem, New York: Times Books, 1985.Wards Automotive Yearbook, (1977 & 1985).White, Lawrence, J. The Automobile Industry Since 1945, Cambridge, Mass.: Harvard UniversityPress, 1971Zimmerman, Frederick M. “Turnaround A Painful Learning Process,” Long Range Planning 19,no. 4 (August 1986).
Chapter Ten
Abernathy, William J., Kim B. Clark, and Alan M. Kantrow: Industrial Renaissance: Producing aCompetitive Future for America, New York: Basic Books, 1983.Abodaher, David: Iacocca: America’s Most Dynamic Businessman, Kensington, New York, 1985.Allis-Chalmers Corporation: 1984 Annual Report, Allis-Chalmers Corporation, Milwaukee, Wisc.,1985.Allis-Chalmers Corporation: 1985 Annual Report, Milwaukee, Wis.: Allis-Chalmers Corporation,1986.Allis-Chalmers Corporation: 1984 Form 10-K, Milwaukee, Wis.: Allis-Chalmers Corporation, 1986.Allis-Chalmers Corporation: 1985 Form 10-K, Milwaukee, Wis.: Allis-Chalmers Corporation, 1986.Allis-Chalmers Corporation: 1986 Form 10-K, Milwaukee, Wis.: Allis-Chalmers Corporation, 1986.Allis-Chalmers Corporation: News Release #105-87, Milwaukee, Wis.: Allis-Chalmers Corporation, 1987.Allis-Chalmers Corporation: News Release #106-87, Milwaukee, Wis.: Allis-Chalmers Corporation, 1987.Allis-Chalmers Corporation: News Release #116-87, Milwaukee, Wis.: Allis-Chalmers Corporation, 1987.Argenti, John: Corporate Collapse: Causes and Symptoms, New York: Wiley, 1976.Bhattacharyya, S. K. “Allis-Chalmers Manufacturing Company.” (B) #9-170-024. Boston: HarvardBusiness School, 1969.Chilton’s Automotive Multi-Guide Spring 1931, Radnor, Pa.: Chilton Book Company, 1970.Chrysler, Walter P. Life of an American Workman, New York: Dodd, Mead & Company, 1937.Coleman, Richard N., and Keith W. Burnaham: “Milestones in the Application of Power toAgricultural Machines,” An Historical Perspective of Farm Machinery, Milwaukee, Wis.: Society ofAutomotive Engineers, 1980.Crabb, Richard: Birth of a Giant: The Men and Incidents that Gave America the Motorcar, NewYork: Chilton, 1969.Dykes, A. L. Dyke’s Automotive and Gasoline Engine Encyclopedia, St. Louis: A. L. Dyke, 1946.Fink, James J. The Car Culture, Cambridge, Mass.: MIT Press, 1975.Forbes, Bertie Charles: Automotive Giants of America, New York: Books for Libraries Press,1972.Gray, R.B. The Agricultural Tractor: 1855-1950, Saint Joseph, Mich.: American Society ofAgricultural Engineers, 1954.Heasley, Jerry: The Production Figure Book For U.S. Cars, Osceola, Wis.: MotorbooksInternational, 1977.
308

Hunt, R. Douglas: American Farm Tools from Hand Power to Steam Power, Manhattan, Kans.:Sunflower University Press, 1985.Huxley, Bill. Allis-chalmers: Agricultural Machinery, London: Osprey, 1988.Kennedy, E. D. The Automobile Industry: The Coming of Age of Capitalism’s Favorite Child, New York: Reynal & Hitchcock, 1941.Kimes, B. R., and Henry Austin Clark, Jr. The Standard Catalog of American Cars 1805-1942,Iola, Wis.: Krause, 1985.Kimes, Beverly Rae “Blueprints and Balance Sheets, The Company that Charlie Built”,Automotive Quarterly, Vomume XV, Number 2, Second Quarter, 1977Langworth, Richard M., and Jan P. Nordbye: The Complete History of Chrysler Corporation1924-1985, Skokie, Ill.: Publications International, 1985.May, George S. A Most Unique Machine: The Michigan Origins of the American AutomobileIndustry, Grand Rapids, Mich.: William B. Eerdmans Publishing, 1975.Moody’s Industrial Manual, 1915, 1920, 1922, 1924, 1926, 1928, 1929, 1930, 1933, 1935, 1937,1938, 1939, 1942, 1946, 1948, 1952, 1953, 1954, 1955, 1958, 1961, 1964, 1968, 1972, 1975,1977, 1978, 1979, 1980, 1981, 1982, 1983, 1984, 1985, 1986.Nevins, Allan: Ford: The Times, the Man, the Company, Charles Scribner’s Sons, New York,1954.Peters, Thomas J., and Robert H. Waterman: In Search of Excellence, Harper & Row, New York, 1982.Peterson, Walter F. and C. Edward Weber: An Industrial Heritage: Allis Chalmers Corporation,Milwaukee, Wis.: Milwaukee County Historical Society, 1978.Pettigrew, Andrew W. An Awakening Giant: Continuity and Change in Imperial ChemicalIndustries, New York: Basil Blackwell, 1985.Pfeffer, Jeffrey: Power in Organizations, Boston: Pittman, 1981.Quinn, James Brian: Strategies for Change: Logical Incrementalism, Irwin, Homewood, Ill., 1980.Rae, John B. The American Automobile: A Brief History, Chicago: University of Chicago Press,1965.Rae, John B. The American Automobile Industry, Boston: G.K. Hall, 1984.Roberts, Peter. The History of the Automobile, New York: Exeter, 1984.Sears, Stephen W, The Automobile in America. New York: American Heritage, 1977.Seltzer, Lawrence, The Financial History of the North American Automobile Industry,Boston:Houghlin Mifflin,1928.Slappey, Sterling G. Pioneers of American Business, New York:Grosset & Dunlap, 1970. Smith, Philip H. Wheels Within Wheels; A Short History of American Motor Car Manufacturing,New York: Funk & Wagnalls, 1968.Society of Automotive Engineers: An Historical Perspective of Farm Machinery, Warrendale, Pa.:SAE, 1980.Steers, Richard M. and Lyman W. Porter: Motivation and Work Behavior, McGraw Hill, New York, 1983.Tichy, Noel M.: Managing Strategic Change: Technical, Political and Cultural Dynamics, JohnWiley & Sons, New York, 1983.U.S. Federal Trade Commission: Report to the Seventy Fourth Congress on the AgriculturalImplement and Machinery Industry, Washington,D.C.: U.S. Government Printing Office, 1938.U.S. Federal Trade Commission: Report to the Seventy Fourth Congress on the Motor VehicleIndustry, Washington, D.C.: U.S. Government Printing Office, 1938.
Chapter Eleven
Abernathy, William J., Kim B. Clark, and Alan M. Kantrow: Industrial Renaissance: Producing aCompetitive Future for America, New York: Basic Books, 1983.Allis-Chalmers Corporation: 1984 Annual Report, Allis-Chalmers Corporation, Milwaukee, Wisc.,1985.Ansoff, I.: Corporate Strategy, McGraw Hill, New York, 1965.Argenti, John: Corporate Collapse: Causes and Symptoms, New York: Wiley, 1976.Automobile Manufacturers Association. Automobiles of America, Detroit: Wayne State, 1968.Barnard, Chester: The Functions of the Executive, Harvard University Press, Cambridge, Mass.,1953, pp. 283-284.
The Turnaround Experience: Real World Lessons in Revitalizing Corporations and Organizations
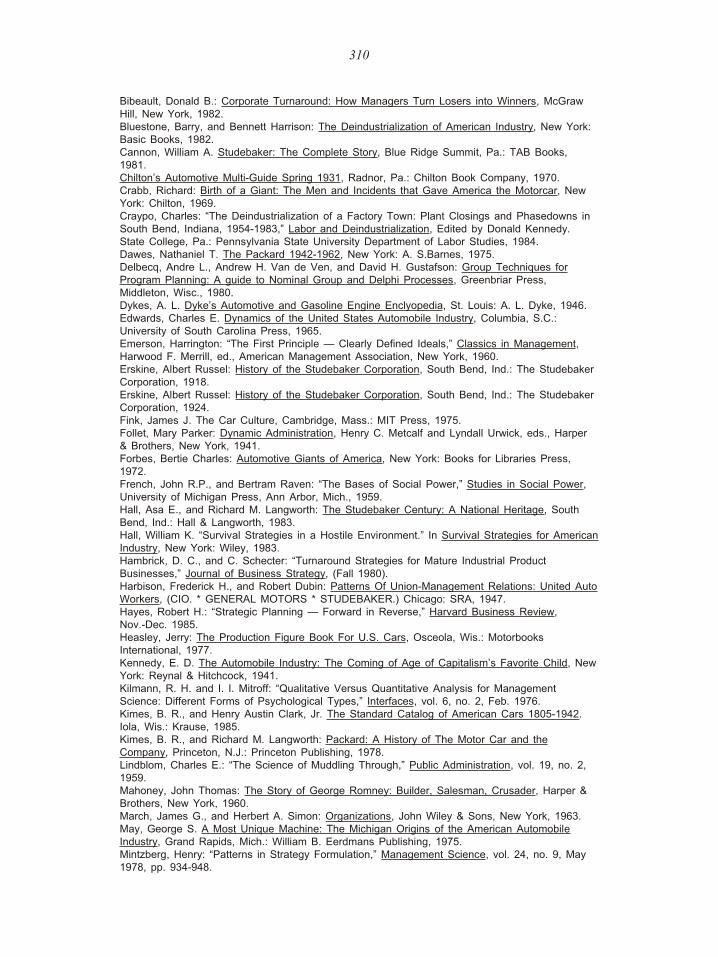
Bibeault, Donald B.: Corporate Turnaround: How Managers Turn Losers into Winners, McGrawHill, New York, 1982.Bluestone, Barry, and Bennett Harrison: The Deindustrialization of American Industry, New York:Basic Books, 1982.Cannon, William A. Studebaker: The Complete Story, Blue Ridge Summit, Pa.: TAB Books,1981.Chilton’s Automotive Multi-Guide Spring 1931, Radnor, Pa.: Chilton Book Company, 1970.Crabb, Richard: Birth of a Giant: The Men and Incidents that Gave America the Motorcar, NewYork: Chilton, 1969.Craypo, Charles: “The Deindustrialization of a Factory Town: Plant Closings and Phasedowns inSouth Bend, Indiana, 1954-1983,” Labor and Deindustrialization, Edited by Donald Kennedy.State College, Pa.: Pennsylvania State University Department of Labor Studies, 1984.Dawes, Nathaniel T. The Packard 1942-1962, New York: A. S.Barnes, 1975.Delbecq, Andre L., Andrew H. Van de Ven, and David H. Gustafson: Group Techniques forProgram Planning: A guide to Nominal Group and Delphi Processes, Greenbriar Press,Middleton, Wisc., 1980.Dykes, A. L. Dyke’s Automotive and Gasoline Engine Enclyopedia, St. Louis: A. L. Dyke, 1946.Edwards, Charles E. Dynamics of the United States Automobile Industry, Columbia, S.C.:University of South Carolina Press, 1965.Emerson, Harrington: “The First Principle — Clearly Defined Ideals,” Classics in Management,Harwood F. Merrill, ed., American Management Association, New York, 1960.Erskine, Albert Russel: History of the Studebaker Corporation, South Bend, Ind.: The StudebakerCorporation, 1918. Erskine, Albert Russel: History of the Studebaker Corporation, South Bend, Ind.: The StudebakerCorporation, 1924. Fink, James J. The Car Culture, Cambridge, Mass.: MIT Press, 1975.Follet, Mary Parker: Dynamic Administration, Henry C. Metcalf and Lyndall Urwick, eds., Harper& Brothers, New York, 1941.Forbes, Bertie Charles: Automotive Giants of America, New York: Books for Libraries Press,1972.French, John R.P., and Bertram Raven: “The Bases of Social Power,” Studies in Social Power,University of Michigan Press, Ann Arbor, Mich., 1959.Hall, Asa E., and Richard M. Langworth: The Studebaker Century: A National Heritage, SouthBend, Ind.: Hall & Langworth, 1983. Hall, William K. “Survival Strategies in a Hostile Environment.” In Survival Strategies for American Industry, New York: Wiley, 1983.Hambrick, D. C., and C. Schecter: “Turnaround Strategies for Mature Industrial ProductBusinesses,” Journal of Business Strategy, (Fall 1980).Harbison, Frederick H., and Robert Dubin: Patterns Of Union-Management Relations: United Auto Workers, (CIO. * GENERAL MOTORS * STUDEBAKER.) Chicago: SRA, 1947.Hayes, Robert H.: “Strategic Planning — Forward in Reverse,” Harvard Business Review,Nov.-Dec. 1985. Heasley, Jerry: The Production Figure Book For U.S. Cars, Osceola, Wis.: MotorbooksInternational, 1977.Kennedy, E. D. The Automobile Industry: The Coming of Age of Capitalism’s Favorite Child, New York: Reynal & Hitchcock, 1941.Kilmann, R. H. and I. I. Mitroff: “Qualitative Versus Quantitative Analysis for ManagementScience: Different Forms of Psychological Types,” Interfaces, vol. 6, no. 2, Feb. 1976.Kimes, B. R., and Henry Austin Clark, Jr. The Standard Catalog of American Cars 1805-1942.Iola, Wis.: Krause, 1985.Kimes, B. R., and Richard M. Langworth: Packard: A History of The Motor Car and theCompany, Princeton, N.J.: Princeton Publishing, 1978.Lindblom, Charles E.: “The Science of Muddling Through,” Public Administration, vol. 19, no. 2,1959.Mahoney, John Thomas: The Story of George Romney: Builder, Salesman, Crusader, Harper &Brothers, New York, 1960.March, James G., and Herbert A. Simon: Organizations, John Wiley & Sons, New York, 1963.May, George S. A Most Unique Machine: The Michigan Origins of the American AutomobileIndustry, Grand Rapids, Mich.: William B. Eerdmans Publishing, 1975.Mintzberg, Henry: “Patterns in Strategy Formulation,” Management Science, vol. 24, no. 9, May1978, pp. 934-948.
310

Moody’s Industrial Manual, 1915, 1920, 1922, 1924, 1926, 1928, 1929, 1930, 1933, 1935, 1937,1938, 1939, 1942, 1946, 1948, 1952, 1953, 1954, 1955, 1958, 1961, 1964, 1968, 1972, 1975,1977, 1978, 1979, 1980, 1981, 1982, 1983, 1984, 1985, 1986.“Packard,” Fortune Magazine, January 1937, reprinted in Packards International Motor Car Club,vol. 18, no. 4, winter 1981.Pettigrew, Andrew W. An Awakening Giant: Continuity and Change in Imperial ChemicalIndustries, New York: Basil Blackwell, 1985.Pfeffer, Jeffrey. Power in Organizations, Boston: Pittman, 1981.Quinn, James Brian: Strategies for Change: Logical Incrementalism, Irwin, Homewood, Ill., 1980.Rae, John B, The American Automobile Industry. Boston: G.K. Hall, 1984.Roberts, Peter: The History of the Automobile, New York: Exeter, 1984.Schroeder, Otto A. Packard: Ask The Man Who Owns One, Arcaria,Cal.: Post ERA Books, 1974.Scott, Michael G. H. Packard: The Complete Story, Blue Ridge Summit, Pa.: TAB Books, 1985.Sears, Stephen W. The Automobile in America, New York: American Heritage, 1977.Selznick, Philip: Leadership in Administration: A Sociological Interpretation, Harper & Row, NewYork, 1957.Smallzreid, Kathleen Ann, and Dorothy James Roberts: More Than You Promise: A Business AtWork In Society, New York: Harper, 1942.Smith, Philip H. Wheels Within Wheels; A Short History of American Motor Car Manufacturing,New York: Funk & Wagnalls, 1968.Tichy, Noel M. Managing Strategic Change: Technical, Political and Cultural Dynamics, NewYork: Wiley, 1983.Tushman, Michael L., and Elaine Romanelli: “Organization Evolution: A Metamorphosis Model ofConvergence and Reorientation,” Research in Organization Behavior, L. L. Cummings and BarryM. Staw, eds., Vol 7., JAI Press, Greenwich, Conn., 1985.U.S. Federal Trade Commission: Report to the Seventy Fourth Congress on the Motor VehicleIndustry, Washington, D.C.: U.S. Government Printing Office, 1938.Wards Automotive Yearbook, (1977 & 1985).White, Lawrence, J. The Automobile Industry Since 1945, Cambridge, Mass.: Harvard UniversityPress, 1971.Zimmerman, Frederick M.: “Turnaround — A Painful Learning Process,” Long Range Planning,Aug. 1986.
Chapter Twelve
Barnard, Chester I. The Functions of the Executive. Cambridge, Mass.: Harvard University Press, 1938 & 1968.Barnard, Chester I. Organization and Management, Cambridge, Mass.: Harvard University Press,1948. Behling, O., and F. A. Starke: “The Postulates of Expectancy Theory,” Academy of ManagementJournal 16 (1973): 373-388.Broehl, Wayne G. Jr.: John Deere’s Company, New York: Doubleday, 1984.Chandler, Alfred D.: Strategy and Structure, M.I.T. Press, Cambridge, Mass., 1962.Coleman, Richard N., and Keith W. Burnaham: “Milestones in the Application of Power toAgricultural Machines,” An Historical Perspective of Farm Machinery, Milwaukee, Wis.: Society ofAutomotive Engineers, 1980.Cooper, Arnold C. and Dan Schendel: “Strategic Responses to Technological Threats,” BusinessHorizons (February 1976).“Deere & Co,” Fortune Magazine, Aug. 1936. Follett, Mary Parker: Dynamic Administration, Henry C. Metcalf and Lyndall Urwick, eds., Harper& Brothers, New York, 1941.Gantt, Henry L.Industrial Leadership, New Haven, Conn.: Yale University Press, 1916.Gantt, Henry L. “The Parting of the Ways,” Classics in Management, Edited by Harwood F.Merrill. New York: American Management Association. 1960: 151-160.Gantt, Henry L. “Training Workmen in Habits of Industry and Cooperation,” Classics inManagement, Edited by Harwood F. Merrill. New York: American Management Association, 1960.Gilbreth, Frank B. “Science in Management for the One Best Way to do Work,” Classics inManagement, Edited by Harwood F. Merrill. New York: American Management Association, 1960.Gilbreth, Lillian M. The Psychology Of Management, New York: MacMillan, 1919.
The Turnaround Experience: Real World Lessons in Revitalizing Corporations and Organizations

Gray, R.B. The Agricultural Tractor: 1855-1950, Saint Joseph, Mich.: American Society ofAgricultural Engineers, 1954.Hamner, W. Clay: “Reinforcement Theory and Contingency Management in OrganizationalSettings,” Motivation and Work Behavior, Edited by Richard M. Steers and Lyman W. Porter.New York: McGraw Hill, 1983.Hamner, W. Clay, Jerry Ross, and Barry M. Staw: “Motivation in Organizations: The Need for aNew Direction,” Motivation and Work Behavior, Edited by Richard M. Steers and Lyman W.Porter. New York: McGraw Hill, 1983.“The Hollow Corporation,” Business Week, no. 2935 (3 March1986).Latham, Gary P., and Edwin A. Locke: “Goal Setting - A Motivational Technique that Works,”Organizational Dynamics (Autumn 1979): 68-80.Locke, Edwin A. “The Ubiquity of the Technique of Goal Setting in Theories of and Approachesto Employee Motivation,” Academy of Management Review 3, no. 3 (July 1978): 594-601.Locke, E., D. B. Feren, V. M. McCaleb, K. N. Shaw, and A. T. Denny: “The RelativeEffectiveness of Four Methods of Motivating Employee Performance,” Changes in Working Life.Edited by K. D. Duncan, D. Wallis, and M.M. Gruneberg. Chichester, England: Wiley, 1980.Marsh, Barbara: A Corporate Tragedy: The Agony of International Harvester Company,Doubleday, Garden City, N.Y., 1985.Miner, John B.: Theories of Organization Behavior, The Dryden Press, Hinsdale, Ill., 1980.Moody’s Industrial Manual, (1915, 1920, 1922, 1924, 1926, 1928, 1929, 1930, 1933, 1935, 1937, 1938, 1939, 1942, 1946, 1948, 1952, 1953, 1954, 1955, 1958, 1961, 1964, 1968, 1972, 1975,1977, 1978, 1979, 1980, 1981, 1982, 1983, 1984, 1985, 1986).Mooney, James D., and Alan C. Riley. The Principles Of Organization, New York: Harper &Brothers, 1939.Naylor, James C., Robert D. Pritchard, Daniel R. Illgen. A Theory of Behavior in Organizations,New York: Academic Press, 1980.“Packard,” Fortune Magazine, June 1937, reprinted in Packards International Motor Car Club, vol. 18, no. 4, winter 1981.Selznick, Philip: Leadership in Administration: A Sociological Interpretation, New York: Harper &Row, 1957.Sheldon, Oliver; “A Professional Creed for Management,” Classics In Management, Edited byMerrill F. Harwood. New York: American Management Association, 1960.Society of Automotive Engineers. An Historical Perspective Of Farm Machinery, Warrendale, Pa.: SAE, 1980.Taylor, Frederick W. Shop Management, New York: Harper, 1919.Taylor, Frederick W. Scientific Management, New York: Harper and Brothers, 1947, 1911, 1939.Trist, Eric: “Referent Organizations and the Development of Inter-Organizational Domains,”Human Relations 36, no. 3 (1983).U.S. Federal Trade Commission: Report to the Seventy Fourth Congress on the AgriculturalImplement and Machinery Industry, Washington,D.C.: U.S. Government Printing Office, 1938.Zimmerman, Frederick M. “Turnaround A Painful Learning Process,” Long Range Planning 19,no. 4 (August 1986).Zimmerman,Frederick M. “Managing a Successful Turnaround,” Long Range Planning 22, no. 3(June 1989).
Chapter Thirteen
Abernathy, William J., Kim B. Clark, and Alan M. Kantrow: Industrial Renaissance: Producing aCompetitive Future for America, Basic Books, New York, 1983.Abodaher, David: Iacocca: America’s Most Dynamic Businessman, Kensington, New York, 1985.Broehl, Wayne G., Jr.: John Deere’s Company, Doubleday, New York, 1984.Chrysler, Walter P. Life of an American Workman, Dodd, Mead & Company, New York, 1937.Edwards, Charles E.: Dynamics of the United States Automobile Industry, University of SouthCarolina Press, Columbia, S.C., 1965.Emerson, Harrington: “The First Principle — Clearly Defined Ideals,” Classics in Management,Harwood F. Merill, ed., American Management Association, New York, 1960.Forbes, Bertie Charles: Automotive Giants of America, Books for Libraries Press, New York,1972.Gilbreth, Lillian M.: The Psychology of Management, MacMillan, New York, 1919.
312

Hall, William K.: “Survival Strategies in a Hostile Environment,” Survival Strategies for AmericanIndustry, John Wiley & Sons, New York, 1983.Hofer, C.W., “Turnaround Strategies,” Journal of Business Strategy, summer 1980.Leland, Mrs. Wilfred C. and Minnie Dubbs Millbrook: Master of Precision — Henry M. Leland,Wayne State University Press, Detroit, 1966.Miner, John B: Theories of Organization Behavior, The Dryden Press, Hinsdale, Ill., 1980.Mooney, James D., and Alan C. Riley: The Principles of Organization, Harper and Brothers, New York, 1939.O’Niell, Hugh M.: “Turnaround and Recovery: What Strategy Do You Need,” Long RangePlanning, vol. 19, no. 1, 1986.O’Niell Hugh M.: Turnaround Strategies in the Commercial Banking Industry, UMI ResearchPress, Ann Arbor, Mich., 1981.“Packard,” Fortune Magazine, June 1937, reprinted in Packards International Motor Car Club, vol. 18, no. 4, winter 1981.Porter, Michael E.: Competitive Strategy, Free Press, New York, 1980.Quinn, James Brian: Strategies for Change: Logical Incrementalism, Irwin, Homewood, Ill., 1980.Schendel, D., and G. R. Patton: “Corporate Stagnation and Turnaround,” Journal of Economicsand Business, summer 1976.Schendel, D., G. R. Patton, and J. Riggs: “Corporate Turnaround Strategies: A Study of ProfitDecline and Recovery,” Journal of General Management, spring 1976.Taylor, Bernard: “Turnaround, Recovery and Growth: The Way through the Crises,” Journal ofGeneral Management, winter 1982/83.Taylor, Frederick W.: Scientific Management, Harper and Brothers, New York, 1911, 1939, 1947. Tichy, Noel M.: Managing Strategic Change: Technical, Political and Cultural Dynamics, JohnWiley & Sons, 1983.Tushman, Michael L., and Elaine Romanelli: “Organization Evolution: A Metamorphosis Model ofConvergence and Reorientation,” Research in Organization Behavior, L. L. Cummings and BarryM. Staw, eds., vol. 7, JAI Press, Greenwich, Conn., 1985.
Chapter Fourteen
Edwards, Charles E. Dynamics of the United States Automobile Industry, Columbia, S.C.:University of South Carolina Press, 1965.Hayes, Robert H., and William J. Abernathy: “Managing Our Way To Economic Decline,” Harvard Business Review 58, no.14 (July-Aug. 1980).Kettering, Charles F. An informal recording of Ketterings speech an the 100th Anniversary of theBirth of Thomas A. EdisonMarsh, Barbara: A Corporate Tragedy: The Agony of International Harvester Company, GardenCity, N.Y.: Doubleday, 1985.
The Turnaround Experience: Real World Lessons in Revitalizing Corporations and Organizations

314