Embed Size (px)
Citation preview
Tuition & Fee ProposalTuition & Fee Proposalandand
FY 2009 Budget FY 2009 Budget
Tuition & Fee ProposalTuition & Fee Proposalandand
FY 2009 Budget FY 2009 Budget
Presentation to UTSA Staff CouncilPresentation to UTSA Staff CouncilJune 26, 2008June 26, 2008
Janet Parker, Associate Vice President,Janet Parker, Associate Vice President,Financial AffairsFinancial Affairs
Presentation to UTSA Staff CouncilPresentation to UTSA Staff CouncilJune 26, 2008June 26, 2008
Janet Parker, Associate Vice President,Janet Parker, Associate Vice President,Financial AffairsFinancial Affairs
Tuition & Fee ProposalTuition & Fee Proposal Tuition & Fee ProposalTuition & Fee Proposal Proposal to UT Board of Regents for rate Proposal to UT Board of Regents for rate
approval was due January 2008approval was due January 2008 Covers 2 Academic Years beginning Fall Covers 2 Academic Years beginning Fall
2008 and Fall 20092008 and Fall 2009 Proposal followed U. T. System GuidelinesProposal followed U. T. System Guidelines
– Principles - open & collaborative, comprehensive, Principles - open & collaborative, comprehensive, strategic, transparent and frugal.strategic, transparent and frugal.
– Board of Regents set a 4.95% capBoard of Regents set a 4.95% cap• UTSA requested cap exceptionUTSA requested cap exception
Proposal to UT Board of Regents for rate Proposal to UT Board of Regents for rate approval was due January 2008approval was due January 2008
Covers 2 Academic Years beginning Fall Covers 2 Academic Years beginning Fall 2008 and Fall 20092008 and Fall 2009
Proposal followed U. T. System GuidelinesProposal followed U. T. System Guidelines– Principles - open & collaborative, comprehensive, Principles - open & collaborative, comprehensive,
strategic, transparent and frugal.strategic, transparent and frugal.– Board of Regents set a 4.95% capBoard of Regents set a 4.95% cap
• UTSA requested cap exceptionUTSA requested cap exception
Tuition & Fee ProposalTuition & Fee Proposal Tuition & Fee ProposalTuition & Fee Proposal
Pricing StrategyPricing Strategy– Maximize designated tuition revenue Maximize designated tuition revenue – Limit increases to college and course feesLimit increases to college and course fees– Allowed only those mandatory fee changes if Allowed only those mandatory fee changes if
initiated by student referenda with one exception:initiated by student referenda with one exception:• Student health center fee – more traditional Student health center fee – more traditional
students have different expectations for servicestudents have different expectations for service
Student Life Referenda & Student Life Referenda & InitiativesInitiatives
Student Life Referenda & Student Life Referenda & InitiativesInitiatives
Campus life enhancements -important linkage to Campus life enhancements -important linkage to
student successstudent success• University Center III Expansion endorsed in Spring ‘03University Center III Expansion endorsed in Spring ‘03
– Covers debt service, maintenance & operations Covers debt service, maintenance & operations
• Athletics fee increase approved by vote in Fall ‘07Athletics fee increase approved by vote in Fall ‘07– Strengthens existing NCAA Div. I programsStrengthens existing NCAA Div. I programs
• New TransportationNew Transportation fee – student initiative approved tofee – student initiative approved to– Reduce the cost of most student parking permitsReduce the cost of most student parking permits
– Relieve parking congestion with additional shuttles from remote Relieve parking congestion with additional shuttles from remote lots and service frequencylots and service frequency
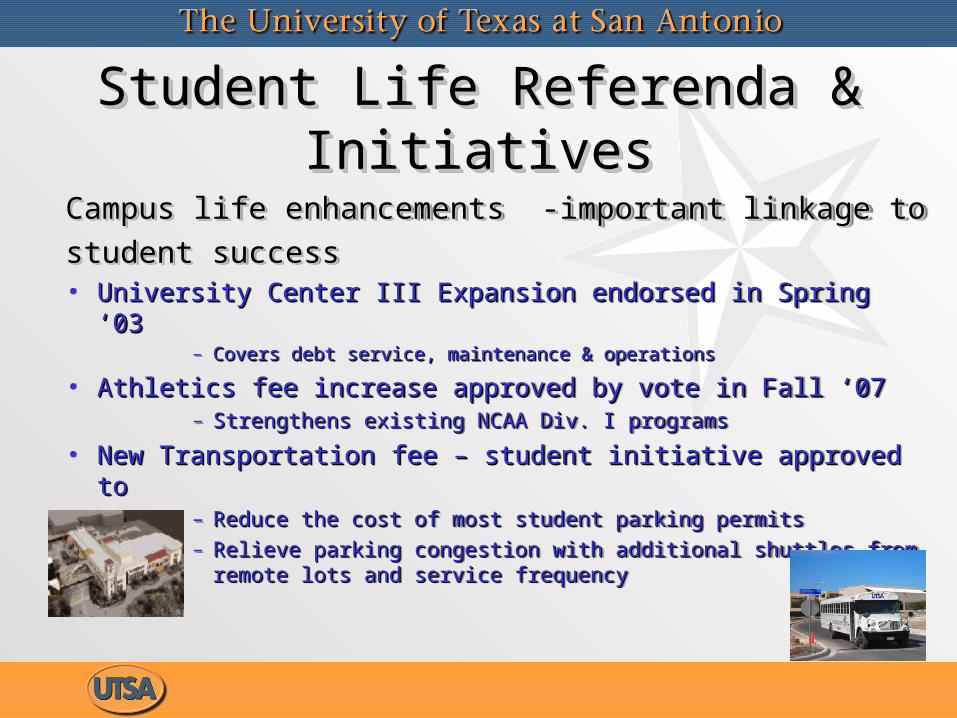
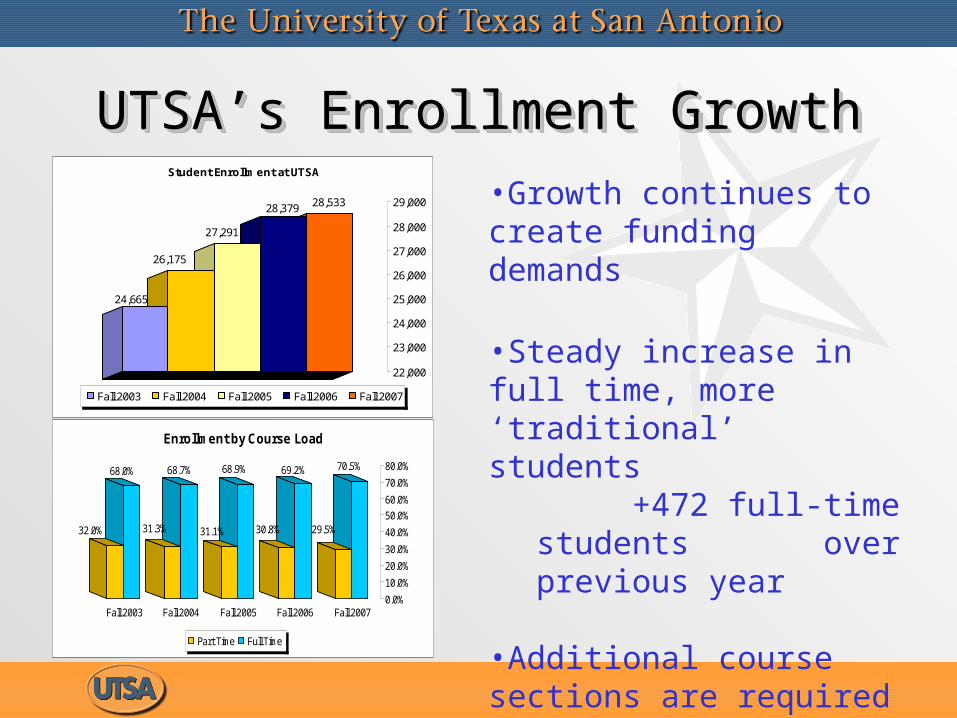
UTSA’s Enrollment GrowthUTSA’s Enrollment GrowthUTSA’s Enrollment GrowthUTSA’s Enrollment Growth
28,53328,379
27,291
26,175
24,665
22,000
23,000
24,000
25,000
26,000
27,000
28,000
29,000
Student Enrollment at UTSA
Fall 2003 Fall 2004 Fall 2005 Fall 2006 Fall 2007
70.5%
29.5%
69.2%
30.8%
68.9%
31.1%
68.7%
31.3%
68.0%
32.0%
0.0%
10.0%
20.0%
30.0%
40.0%
50.0%
60.0%
70.0%
80.0%
Fall 2003 Fall 2004 Fall 2005 Fall 2006 Fall 2007
Enrollment by Course Load
Part Time Full Time
•Growth continues to create funding demands
•Steady increase in full time, more ‘traditional’ students
+472 full-time students over previous year
•Additional course sections are required to meet demand
+3,355 in five years
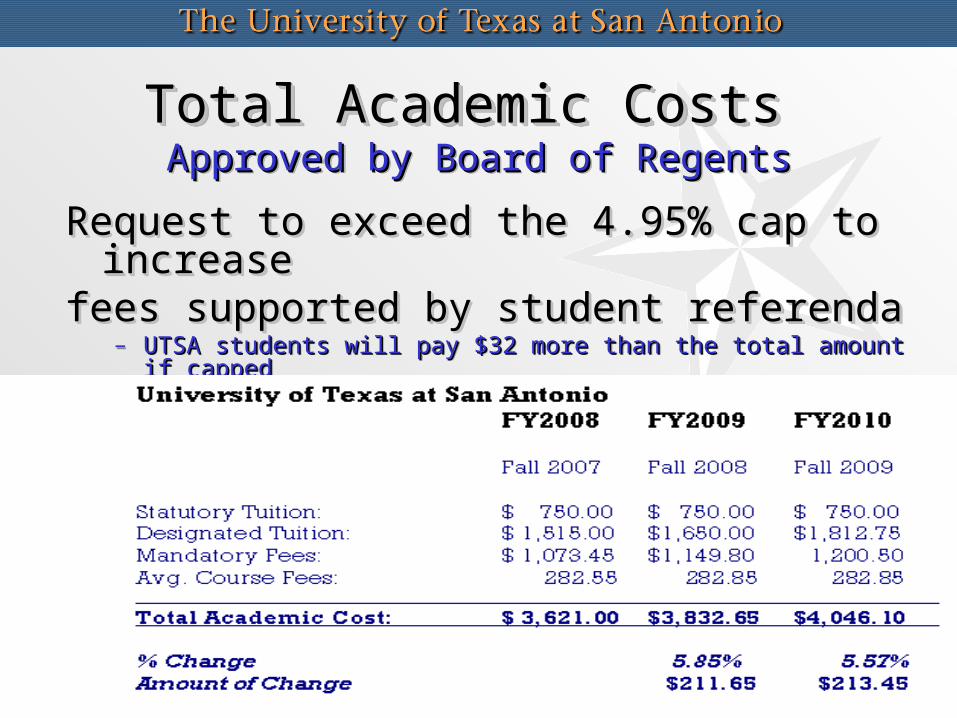
Total Academic Costs Total Academic Costs Approved by Board of RegentsApproved by Board of RegentsTotal Academic Costs Total Academic Costs Approved by Board of RegentsApproved by Board of Regents
Request to exceed the 4.95% cap to increase Request to exceed the 4.95% cap to increase fees supported by student referendafees supported by student referenda
– UTSA students will pay $32 more than the total amount if cappedUTSA students will pay $32 more than the total amount if capped
Request to exceed the 4.95% cap to increase Request to exceed the 4.95% cap to increase fees supported by student referendafees supported by student referenda
– UTSA students will pay $32 more than the total amount if cappedUTSA students will pay $32 more than the total amount if capped
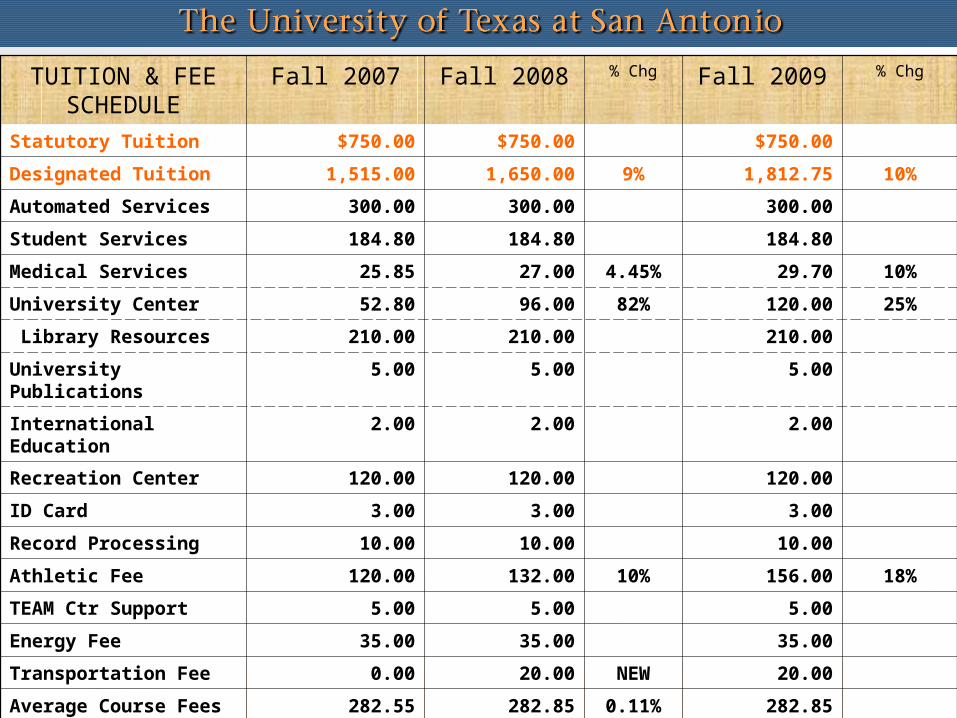
TUITION & FEE
SCHEDULEFall 2007 Fall 2008 % Chg Fall 2009 % Chg
Statutory Tuition $750.00 $750.00 $750.00
Designated Tuition 1,515.00 1,650.00 9% 1,812.75 10%
Automated Services 300.00 300.00 300.00
Student Services 184.80 184.80 184.80
Medical Services 25.85 27.00 4.45% 29.70 10%
University Center 52.80 96.00 82% 120.00 25%
Library Resources 210.00 210.00 210.00
University Publications 5.00 5.00 5.00
International Education 2.00 2.00 2.00
Recreation Center 120.00 120.00 120.00
ID Card 3.00 3.00 3.00
Record Processing 10.00 10.00 10.00
Athletic Fee 120.00 132.00 10% 156.00 18%
TEAM Ctr Support 5.00 5.00 5.00
Energy Fee 35.00 35.00 35.00
Transportation Fee 0.00 20.00 NEW 20.00
Average Course Fees 282.55 282.85 0.11% 282.85
TOTAL $3,621 $3,8333 5.85% $4,046 5.57%
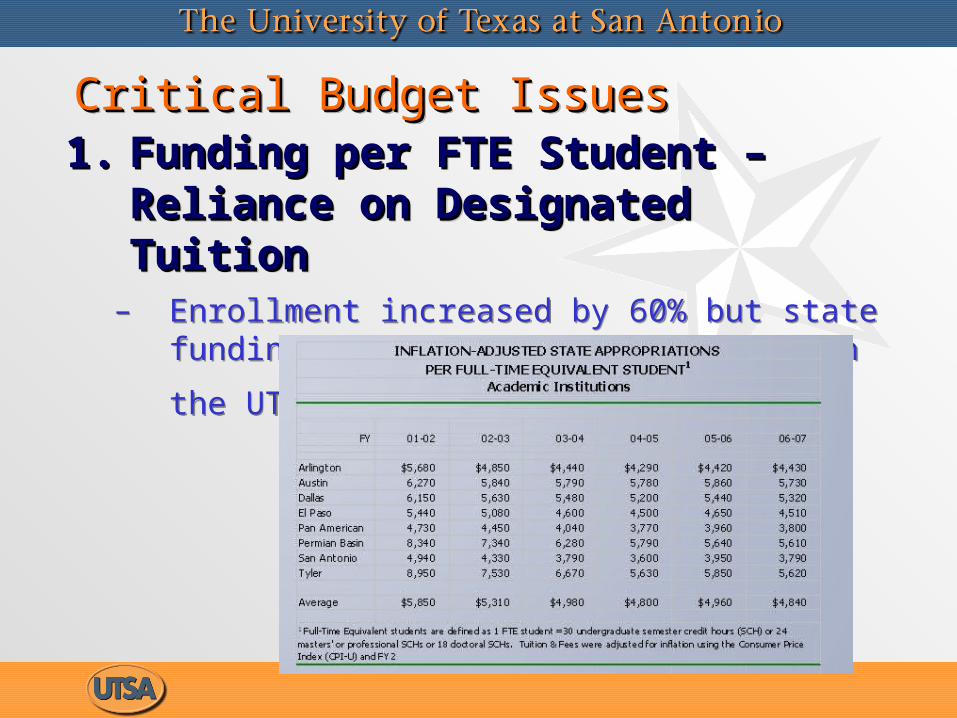
Critical Budget Issues Critical Budget Issues Critical Budget Issues Critical Budget Issues 1.1. Funding per FTE Student – Reliance Funding per FTE Student – Reliance
on Designated Tuitionon Designated Tuition– Enrollment increased by 60% but state funding per
FTE Student is lowest in the UT System
1.1. Funding per FTE Student – Reliance Funding per FTE Student – Reliance on Designated Tuitionon Designated Tuition
– Enrollment increased by 60% but state funding per
FTE Student is lowest in the UT System
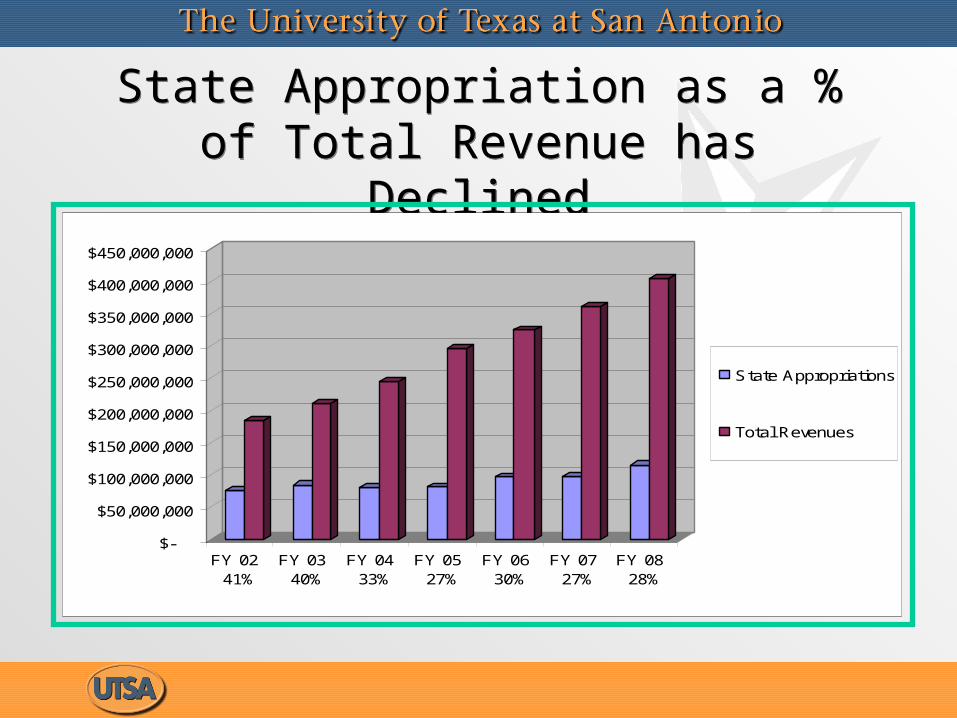
State Appropriation as a % of Total Revenue has Declined
State Appropriation as a % of Total Revenue has Declined
$-
$50,000,000
$100,000,000
$150,000,000
$200,000,000
$250,000,000
$300,000,000
$350,000,000
$400,000,000
$450,000,000
FY 02 41%
FY 03 40%
FY 04 33%
FY 05 27%
FY 06 30%
FY 07 27%
FY 08 28%
State Appropriations
Total Revenues
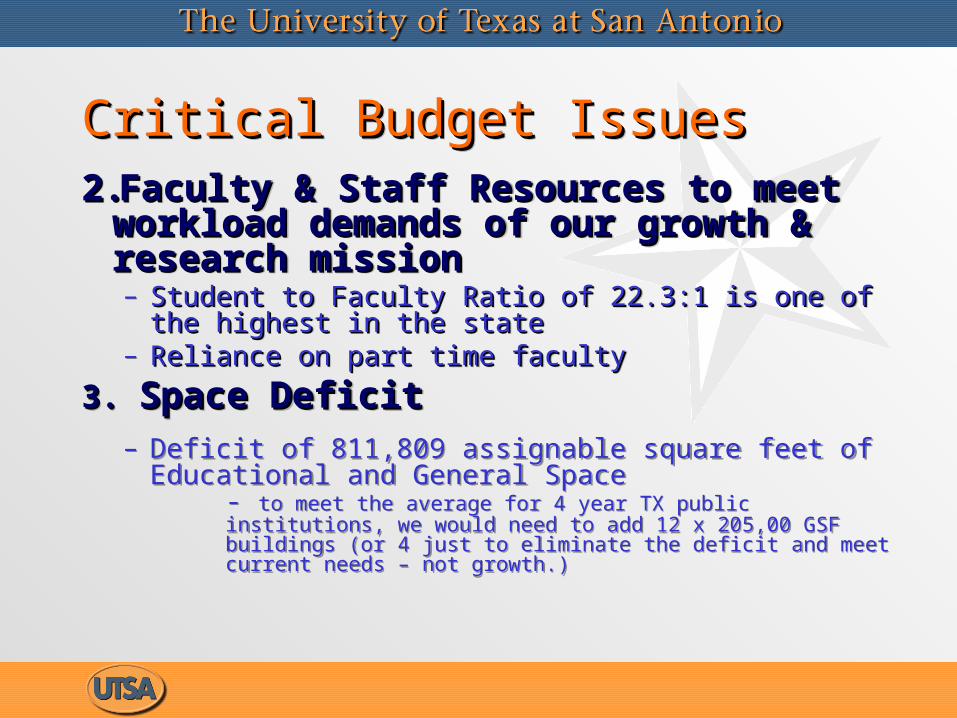
Critical Budget IssuesCritical Budget IssuesCritical Budget IssuesCritical Budget Issues2.2.Faculty & Staff Resources to meet Faculty & Staff Resources to meet
workload demands of our growth & workload demands of our growth & research missionresearch mission– Student to Faculty Ratio of 22.3:1 is one of the highest in Student to Faculty Ratio of 22.3:1 is one of the highest in
the statethe state– Reliance on part time facultyReliance on part time faculty
3. 3. Space DeficitSpace Deficit
– Deficit of 811,809 assignable square feet of Educational and General Space
- to meet the average for 4 year TX public institutions, we would need to add 12 x 205,00 GSF buildings (or 4 just to eliminate the deficit and meet current needs – not growth.)
2.2.Faculty & Staff Resources to meet Faculty & Staff Resources to meet workload demands of our growth & workload demands of our growth & research missionresearch mission– Student to Faculty Ratio of 22.3:1 is one of the highest in Student to Faculty Ratio of 22.3:1 is one of the highest in
the statethe state– Reliance on part time facultyReliance on part time faculty
3. 3. Space DeficitSpace Deficit
– Deficit of 811,809 assignable square feet of Educational and General Space
- to meet the average for 4 year TX public institutions, we would need to add 12 x 205,00 GSF buildings (or 4 just to eliminate the deficit and meet current needs – not growth.)

FY 2009 Budget FY 2009 Budget September 1, 2008 – August 31, 2009September 1, 2008 – August 31, 2009 FY 2009 Budget FY 2009 Budget September 1, 2008 – August 31, 2009September 1, 2008 – August 31, 2009
ResourcesResources Tuition RevenuesTuition Revenues
– Incremental changes due to rate increase– Incremental changes due to enrollment impacts: increase in
headcount, average unit load, mix of UG to GR; paying non-resident students- Net of Bad debt, waivers, and other unfunded liabilities
Internal Reallocations – not new fundingInternal Reallocations – not new funding- Take away $ from one area and give to anotherTake away $ from one area and give to another
Fee Revenues Fee Revenues Restricted RevenuesRestricted Revenues
– Grants & contracts; gifts and federal/state financial aid
FY 2009 Budget FY 2009 Budget September 1, 2008 – August 31, 2009September 1, 2008 – August 31, 2009 FY 2009 Budget FY 2009 Budget September 1, 2008 – August 31, 2009September 1, 2008 – August 31, 2009
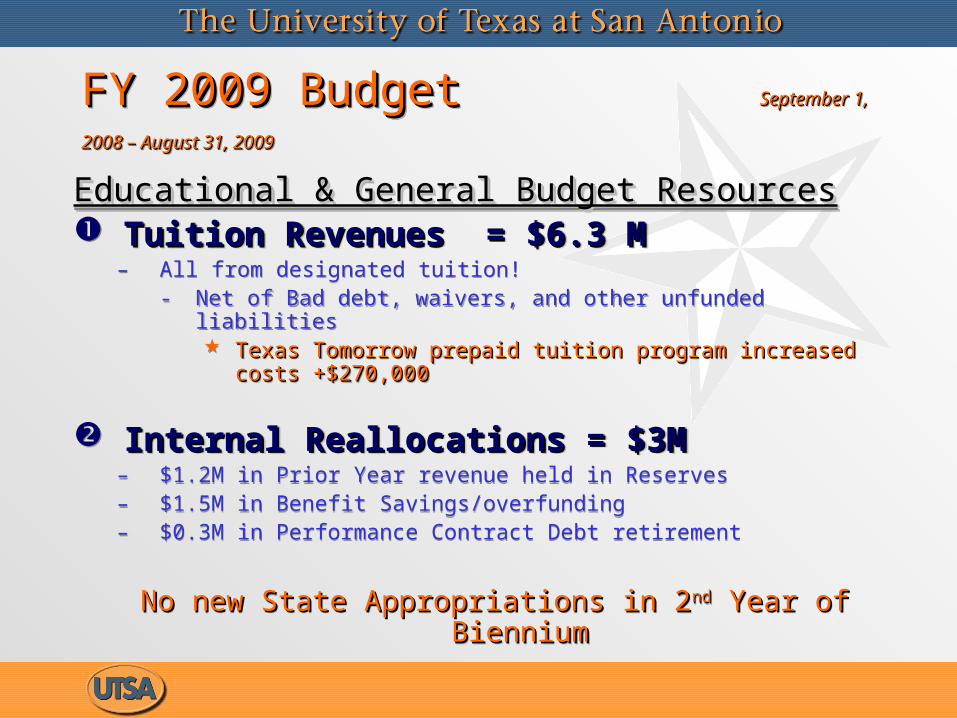
Educational & General Budget ResourcesEducational & General Budget Resources Tuition Revenues = $6.3 MTuition Revenues = $6.3 M
– All from designated tuition!- Net of Bad debt, waivers, and other unfunded liabilities
Texas Tomorrow prepaid tuition program increased costs +Texas Tomorrow prepaid tuition program increased costs +$270,000$270,000
Internal Reallocations = $3M Internal Reallocations = $3M – $1.2M in Prior Year revenue held in Reserves– $1.5M in Benefit Savings/overfunding– $0.3M in Performance Contract Debt retirement
No new State Appropriations in 2No new State Appropriations in 2ndnd Year of Biennium Year of Biennium
FY 2009 Budget FY 2009 Budget September 1, 2008 – August 31, 2009September 1, 2008 – August 31, 2009FY 2009 Budget FY 2009 Budget September 1, 2008 – August 31, 2009September 1, 2008 – August 31, 2009
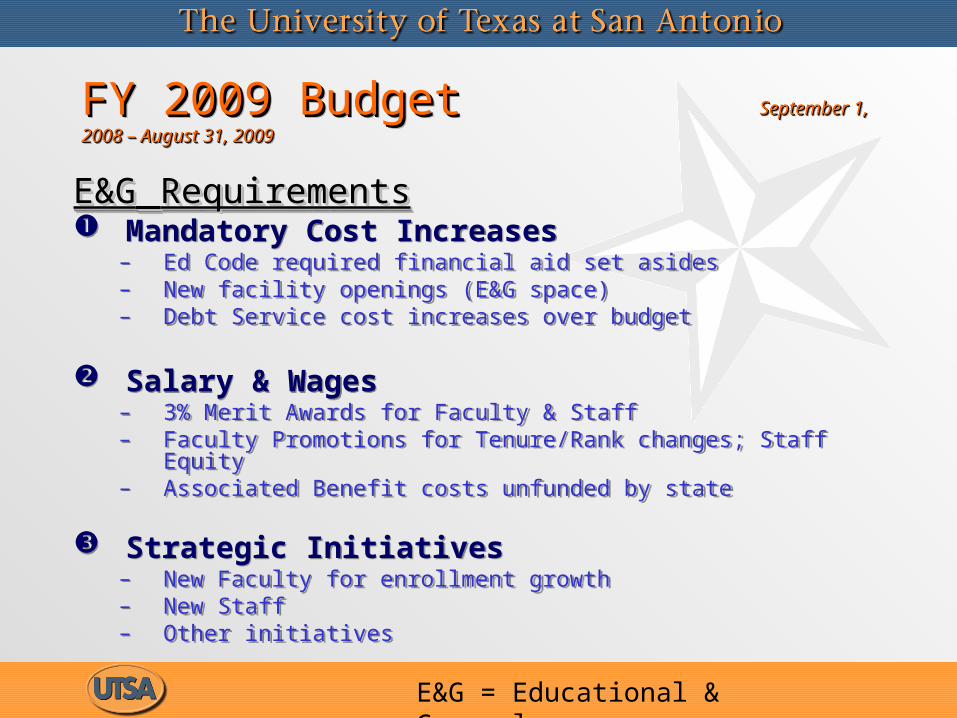
E&GE&G RequirementsRequirements Mandatory Cost Increases
– Ed Code required financial aid set asides– New facility openings (E&G space)– Debt Service cost increases over budget
Salary & Wages – 3% Merit Awards for Faculty & Staff– Faculty Promotions for Tenure/Rank changes; Staff Equity– Associated Benefit costs unfunded by state
Strategic Initiatives– New Faculty for enrollment growth– New Staff– Other initiatives
E&G = Educational & General
FY 2009 Budget FY 2009 Budget September 1, 2008 – August 31, 2009September 1, 2008 – August 31, 2009FY 2009 Budget FY 2009 Budget September 1, 2008 – August 31, 2009September 1, 2008 – August 31, 2009
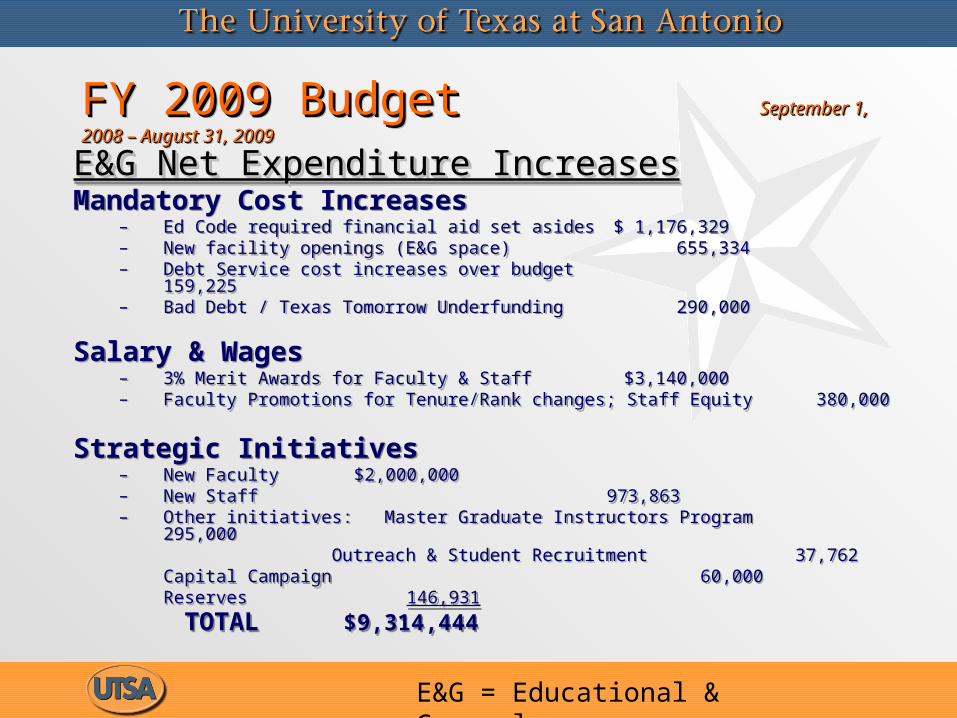
E&G Net Expenditure IncreasesE&G Net Expenditure IncreasesMandatory Cost Increases
– Ed Code required financial aid set asides $ 1,176,329– New facility openings (E&G space) 655,334– Debt Service cost increases over budget 159,225– Bad Debt / Texas Tomorrow Underfunding 290,000
Salary & Wages – 3% Merit Awards for Faculty & Staff $3,140,000– Faculty Promotions for Tenure/Rank changes; Staff Equity 380,000
Strategic Initiatives– New Faculty $2,000,000– New Staff 973,863– Other initiatives: Master Graduate Instructors Program 295,000
Outreach & Student Recruitment 37,762Capital Campaign 60,000Reserves 146,931
TOTAL $9,314,444
E&G = Educational & General
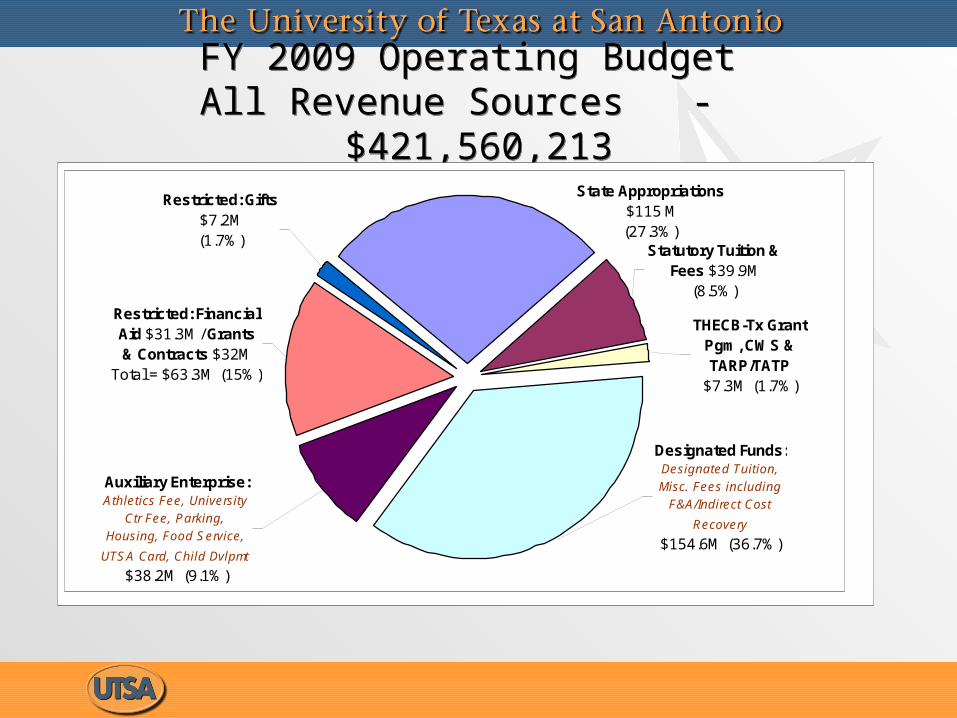
FY 2009 Operating Budget All Revenue Sources - $421,560,213
FY 2009 Operating Budget All Revenue Sources - $421,560,213
State Appropriations
$115 M (27.3%)
Designated Funds:Designated Tuition,
Misc. Fees including
F&A/Indirect Cost
Recovery
$154.6M (36.7%)
Statutory Tuition & Fees $39.9M
(8.5%)
THECB-Tx Grant Pgm, CWS & TARP/TATP
$7.3M (1.7%)
Auxiliary Enterprise:Athletics Fee, University
Ctr Fee, Parking,
Housing, Food Service,
UTSA Card, Child Dvlpmt
$38.2M (9.1%)
Restricted: Gifts $7.2M (1.7%)
Restricted: Financial Aid $31.3M / Grants & Contracts $32M
Total = $63.3M (15%)