Embed Size (px)
Citation preview
International Journal of Energy and Environmental Engineering
ISSN: 2008-9163
Vol.2 / No.1 (pp.11-22) / Winter 2011
* Corresponding author: S. Jafarmadar (e-mail:[email protected])
Three dimensional modeling of the effects of different
spray angles and number holes on the combustion
process and emission formation in a direct injection
diesel engine
S. Jafarmadar*1, R. Barzgar
2 and S. Shafe
3
1,2,3 Urmia University, Iran.
Received Date: 6 Sept.; 2010 Accepted Date: 8 Dec.; 2010
Abstract
This study presents a computational study of mixture formation, flame front movement, combustion
process and emission formation at the various spray angles and number holes in a direct injection diesel
engine. This work is carried out in a direct injection OM355 diesel engine at four and five holes with
130, 135 and 140 spray angles. The amount of fuel injected per cycle is constant at all states. The re-
sults of the model show that with an increasing spray angle, the combustion parameters such as heat re-
lease rate, in cylinder pressure and temperature because of more spray impinging decrease while with an
increasing number of holes, a slight variation take place at these parameters. From emission formation
point of view, with an increase in spray angle, NOx decreases and soot increases. Also with an increase
in the number of holes, the similar trends are observed. The results of model for baseline engine are good
agreement with the corresponding experimental data. In other cases, the results are in good agreement
with the corresponding data in the literature.
Keywords
Diesel engine, direct injection, flow field, combustion process, spray angle, hole.
1. Introduction
The internal combustion engine is by far the
most important power train for all kind of ve-
hicles today. Up to now there is no alternative to
this kinds of engine, and it is for sure that it will
keep its leading position for at least the next three
to five decades. However, it has to be conti-
nuously improved, and great efforts have to be
made in order to increase efficiency and to fulfill
future emission legislation.
One method for achieving this goal and the reduc-
tion of engine-out raw emissions is apply improved
or new mixing formation and combustion concepts
that will be one of the key measures to keep the in-
ternal combustion engine up to date. Therefore, the
exact numerical simulation and optimization of mix-
ture formation and combustion processes is nowa-
days becoming more and more important. One ad-
vantage of using simulation models is that in contrast
to the experiments, results can often be achieved
faster and cheaper. Much more important is the fact
that despite the higher uncertainty compared to the
experiments, the numerical simulation of mixture
formation and combustion processes can give much
more extensive information about complex in-
cylinder processes than the experiments could ever
provide. Using numerical simulations, it is possible
to calculate the temporal behavior of every variable
Three dimensional modeling of the effects of different spray angles …, Jafarmadar, et. al
12
of interest at any place inside the computational do-
main. This allows the attainment of a detailed know-
ledge of the relevant processes and is a prerequisite
for their improvement [1]. There are three classes of
models that can be used in numerical simulations of
in-cylinder processes. If very short calculation times
are necessary, so-called thermodynamic models are
used. These zero-dimensional models, which do not
include any spatial resolution, only describe the most
relevant processes without providing insight into
local sub-processes [1].
The second class of models are the phenome-
nological models, which consider some kind of
quasi-spatial resolution of the combustion cham-
ber and which use more detailed the sub-models
for the description of the relevant processes like
mixture formation, ignition and combustion[1].
The third class of models is the computational
fluid dynamics (CFD) models [2-7]. In CFD
codes, the most detailed sub-models are used, and
every sub-process of interest is considered. For
example, in case of mixture formation, the sub-
processes injection, break-up and evaporation of
single liquid droplets, collisions of droplets, im-
pingement of droplets on the wall etc. are mod-
eled and calculated for every individual droplet,
dependent on its position inside the three-
dimensional combustion chamber. Thus, this
class of models is the most expensive regarding
the consumption of computational power and
time.
The CFD codes are especially suited for the in-
vestigation of three-dimensional effects on the in-
cylinder processes, like the effect of tumble and
swirl, the influence of combustion chamber geo-
metry, position of injection nozzle, spray angle,
number of holes, etc.
Therefore, at present work, the simultaneously
effects of different spray angles and number of
holes on the combustion process and emission
formation are studied by CFD code.
2. Model Specification
The numerical method is used at present work,
which is based on Fire CFD code .the engine
considered is heavy duty OM-355 diesel engine.
The engine specifications are given in table (1).
The calculations are carried out for 1400 rev/min
at full load state, in which the emission formation
reaches its maximum values. Calculations are
carried out on a closed system from IVC at -
118°CA to EVO at 120°CA. For baseline engine,
injector is centric with four holes at baseline en-
gine which is fixed at 3mm below cylinder head
and spray cone angle is equal to 130°CA. swirl
ratio for engine 1.1 is approximated.
Thermodynamic data for the material streams
are given in Simulations are carried out at six
cases, which are include four and five holes with
130, 135 and 140 spray angles. In all cases after
start of injection, standard WAVE model is used
for instability and spray breakup model and the
mass injected per cycle are the same. Initial fuel
injection pressure is 195bar with injection period
starting from CA18− and ending at CA0 .Total
area of the holes, start and end of injection, injec-
tion duration and injection rate modes are con-
stant in all cases. Similar temperature and pres-
sure values are chosen as initial conditions. It is
assumed that the initial fuel droplets have the
diameter of nozzle hole which is technically
called blob injection.
Table 1. OM-355 Engine specifications
Engine type Heavy duty D.I Di-
esel engine
Number of injector
holes 4
Engine speed at max
torque 1400rpm
Engine speed at max
power 2200rpm
Piston diameter*stroke 150*128mm
Cylinder volume 11.58lit
Injection pressure 195 bar
Max out put power 240 hp
Max outlet torque 824N.m
Number of cylinders 6,vertical type
Compression ratio 16.1:1
Turbulence Kinetic
Energy 18 m2/s2
Turbulence Length
Scale 0.0075 m
International Journal of Energy and Environmental Engineering (IJEEE), Vol.2, No.1, 2011, 11-22
13
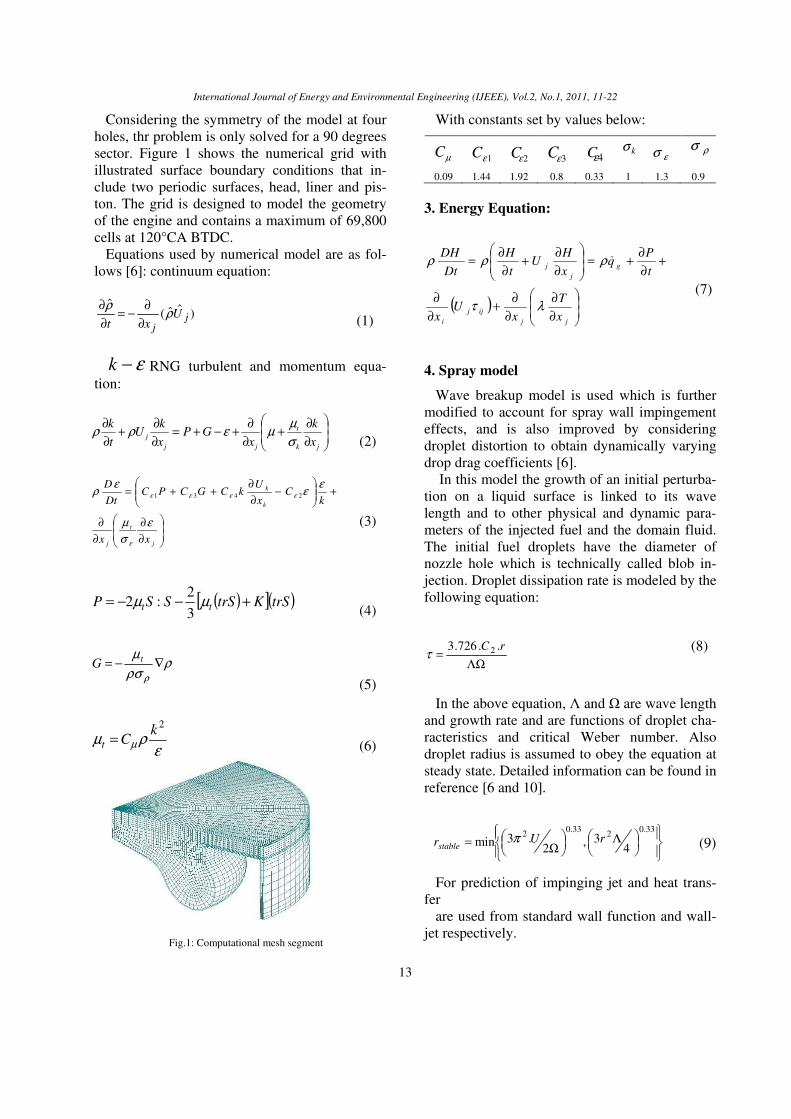
Considering the symmetry of the model at four
holes, thr problem is only solved for a 90 degrees
sector. Figure 1 shows the numerical grid with
illustrated surface boundary conditions that in-
clude two periodic surfaces, head, liner and pis-
ton. The grid is designed to model the geometry
of the engine and contains a maximum of 69,800
cells at 120°CA BTDC.
Equations used by numerical model are as fol-
lows [6]: continuum equation:
(1) )ˆˆ(
ˆj
j
Uxt
ρρ
∂
∂−=
∂
∂
ε−k RNG turbulent and momentum equa-
tion:
(2)
∂
∂+
∂
∂+−+=
∂
∂+
∂
∂
jk
t
jj
jx
k
xGP
x
kU
t
k
σ
µµερρ
(3)
∂
∂
∂
∂
+
−
∂
∂++=
j
t
j
k
k
xx
kC
x
UkCGCPC
Dt
D
ε
σ
µ
εε
ερ
ε
εεεε 2431
(4) ( )[ ]( )trSKtrSSSP tt +−−= µµ
3
2:2
(5)
ρρσ
µ
ρ
∇−= tG
(6) ερµ µ
2k
Ct =
Fig.1: Computational mesh segment
With constants set by values below:
µC 3εC 4εC kσ
εσ ρσ
0.09 1.44 1.92 0.8 0.33 1 1.3 0.9
3. Energy Equation:
(7) ( )
∂
∂
∂
∂+
∂
∂
+∂
∂+=
∂
∂+
∂
∂=
jj
ijj
i
g
j
j
x
T
xU
x
t
Pq
x
HU
t
H
Dt
DH
λτ
ρρρ
4. Spray model
Wave breakup model is used which is further
modified to account for spray wall impingement
effects, and is also improved by considering
droplet distortion to obtain dynamically varying
drop drag coefficients [6].
In this model the growth of an initial perturba-
tion on a liquid surface is linked to its wave
length and to other physical and dynamic para-
meters of the injected fuel and the domain fluid.
The initial fuel droplets have the diameter of
nozzle hole which is technically called blob in-
jection. Droplet dissipation rate is modeled by the
following equation:
(8)
ΛΩ
=rC ..726.3 2τ
In the above equation, and are wave length
and growth rate and are functions of droplet cha-
racteristics and critical Weber number. Also
droplet radius is assumed to obey the equation at
steady state. Detailed information can be found in
reference [6 and 10].
(9)
Λ
Ω=
33.02
33.02
43,
2.3min rUrstable
π
For prediction of impinging jet and heat trans-
fer
are used from standard wall function and wall-
jet respectively.
1εC 2εC
Three dimensional modeling of the effects of different spray angles …, Jafarmadar, et. al
14
5. Combustion rate EQUATION (combustion
model)
This model assumes that in premixed turbulent
flames, the reactants (fuel and oxygen) are con-
tained in the same eddies and are separated from
eddies containing hot combustion products. The
rate of dissipation of these eddies determines the
rate of combustion [6].
+=
S
yC
S
yy
Cr
prproxfu
R
fu
fu1
.,,minρ
τρ (10)
The first two terms of the “minimum value of”
operator determine whether fuel or oxygen is
present in limiting quantity, and the third term is
a reaction probability, which ensures that the
flame is not spread in the absence of hot prod-
ucts. Cfu and Cpr are empirical coefficients and
pry is product mass fraction that which is in-
cludes intermediate species, CO2 and H2O. The
value of Cfu requires adjustment with respect to
the experimental combustion data for the case
under investigation. fuC varies from 3 to 25 in
diesel engines. An optimum amount of 8 for fuC
was selected according to the experimental data.
Rτ is the characteristic time for reaction turbu-
lent mixing and is defined as below:
(11) ε
τk
R =
This specifies the combustible mixture con-
sumption rate.
emission model
The thermal NOx formation mechanism is ex-
pressed in terms of the extended Zeldovich me-
chanism [11]:
NNOON +→←+2 (12)
ONOON +→←+ 2 (13)
HNOOHN +→←+ (14)
Formation rate parameter for NOx formation is
selected according to experimental data (as
shown in figure 3).
The Hiroyasu and Magnussen [12] mechanism
for soot formation rate is modeled as the differ-
ence between soot formation and soot oxidation:
t
oxid
t
form
t
soot
d
dm
d
dm
d
dm−= (15)
−=
RT
EpmA
d
dma
fvft
formexp5.0
with fA as the pre exponential factor, fvm is
the fuel vapor mass, P is the pressure and aE is
the activation energy.
tots
ss
c
t
oxid Rmd
M
d
dm
ρ
6= (16)
where cM is the carbon molecular weight,
sρ is the soot density, sd is the average soot
diameter, Ms is the soot mass and totR is the
net reaction rate.
Formation and oxidation rate parameter for
soot emission are selected as those of defaulted
in the software and according to experimental
data (as shown in figure 4).
6. Ignition model
The Shell auto-ignition model was used for
modeling of the auto ignition of diesel fuel [13].
In this generic mechanism, 6 generic species for
hydrocarbon fuel, oxidizer, total radical pool,
branching agent, intermediate species and prod-
ucts were involved. In addition the important
stages of auto ignition such as initiation, propaga-
tion, branching and termination were presented
by generalized reactions, described in [13].
7. Results and discussions
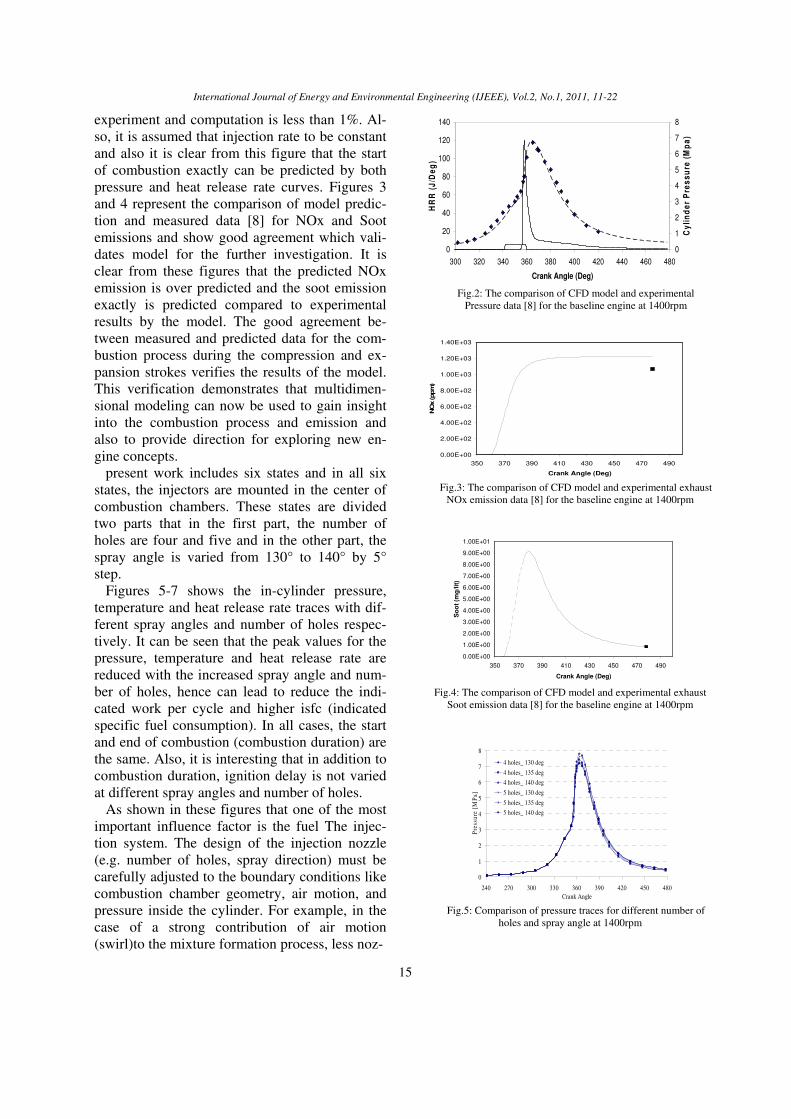
Figure 2 shows the comparison of predicted
and experimental in-cylinder pressure for base-
line engine with spray angle 135°CA and four
holes at full load state with1400rpm. The results
presented in the figures are global (cylinder aver-
aged) quantities as a function of time (crank an-
gle). The peak pressures discrepancy between
International Journal of Energy and Environmental Engineering (IJEEE), Vol.2, No.1, 2011, 11-22
15
0.00E+00
2.00E+02
4.00E+02
6.00E+02
8.00E+02
1.00E+03
1.20E+03
1.40E+03
350 370 390 410 430 450 470 490
Crank Angle (Deg)
NO
x (ppm
)
experiment and computation is less than 1%. Al-
so, it is assumed that injection rate to be constant
and also it is clear from this figure that the start
of combustion exactly can be predicted by both
pressure and heat release rate curves. Figures 3
and 4 represent the comparison of model predic-
tion and measured data [8] for NOx and Soot
emissions and show good agreement which vali-
dates model for the further investigation. It is
clear from these figures that the predicted NOx
emission is over predicted and the soot emission
exactly is predicted compared to experimental
results by the model. The good agreement be-
tween measured and predicted data for the com-
bustion process during the compression and ex-
pansion strokes verifies the results of the model.
This verification demonstrates that multidimen-
sional modeling can now be used to gain insight
into the combustion process and emission and
also to provide direction for exploring new en-
gine concepts.
present work includes six states and in all six
states, the injectors are mounted in the center of
combustion chambers. These states are divided
two parts that in the first part, the number of
holes are four and five and in the other part, the
spray angle is varied from 130° to 140° by 5°
step.
Figures 5-7 shows the in-cylinder pressure,
temperature and heat release rate traces with dif-
ferent spray angles and number of holes respec-
tively. It can be seen that the peak values for the
pressure, temperature and heat release rate are
reduced with the increased spray angle and num-
ber of holes, hence can lead to reduce the indi-
cated work per cycle and higher isfc (indicated
specific fuel consumption). In all cases, the start
and end of combustion (combustion duration) are
the same. Also, it is interesting that in addition to
combustion duration, ignition delay is not varied
at different spray angles and number of holes.
As shown in these figures that one of the most
important influence factor is the fuel The injec-
tion system. The design of the injection nozzle
(e.g. number of holes, spray direction) must be
carefully adjusted to the boundary conditions like
combustion chamber geometry, air motion, and
pressure inside the cylinder. For example, in the
case of a strong contribution of air motion
(swirl)to the mixture formation process, less noz-
Fig.2: The comparison of CFD model and experimental
Pressure data [8] for the baseline engine at 1400rpm
Fig.3: The comparison of CFD model and experimental exhaust
NOx emission data [8] for the baseline engine at 1400rpm
Fig.4: The comparison of CFD model and experimental exhaust
Soot emission data [8] for the baseline engine at 1400rpm
Fig.5: Comparison of pressure traces for different number of
holes and spray angle at 1400rpm
0
1
2
3
4
5
6
7
8
240 270 300 330 360 390 420 450 480
Crank Angle
Pre
ssu
re [
MP
a]
4 holes_ 130 deg
4 holes_ 135 deg
4 holes_ 140 deg
5 holes_ 130 deg
5 holes_ 135 deg
5 holes_ 140 deg
0
20
40
60
80
100
120
140
300 320 340 360 380 400 420 440 460 480
Crank Angle (Deg)
HR
R (
J/D
eg
)
0
1
2
3
4
5
6
7
8
Cy
lin
de
r P
res
su
re (
Mp
a)
0.00E+00
1.00E+00
2.00E+00
3.00E+00
4.00E+00
5.00E+00
6.00E+00
7.00E+00
8.00E+00
9.00E+00
1.00E+01
350 370 390 410 430 450 470 490
Crank Angle (Deg)
So
ot
(mg
/lit
)
Three dimensional modeling of the effects of different spray angles …, Jafarmadar, et. al
16
zle holes and lower injection pressures are neces-
sary than in the case of low-swirl combustion
concepts[9].
The generation of strong swirl increases the
pressure losses in the intake system and tends to
increase fuel consumption. Further on, ignition
delay and premixed peak are usually increased. If
too many nozzle holes are used, the burning
spray plumes may be displaced by the air motion
in a way that fuel is injected in the burnt gases of
the neighbor plume. This strongly increases soot
formation. Today, low-swirl combustion con-
cepts are often used, and the energy for mixture
formation is more or less solely provided by the
spray. For this reason, injection pressures and
number of holes are increased, and wide piston
bowls, which allow the necessary spray penetra-
tion in order to include the complete cylinder
charge in the combustion process, are in use.
Therefore, similar trends at these figures show
that similar mixture formation may be assumed in
all cases.
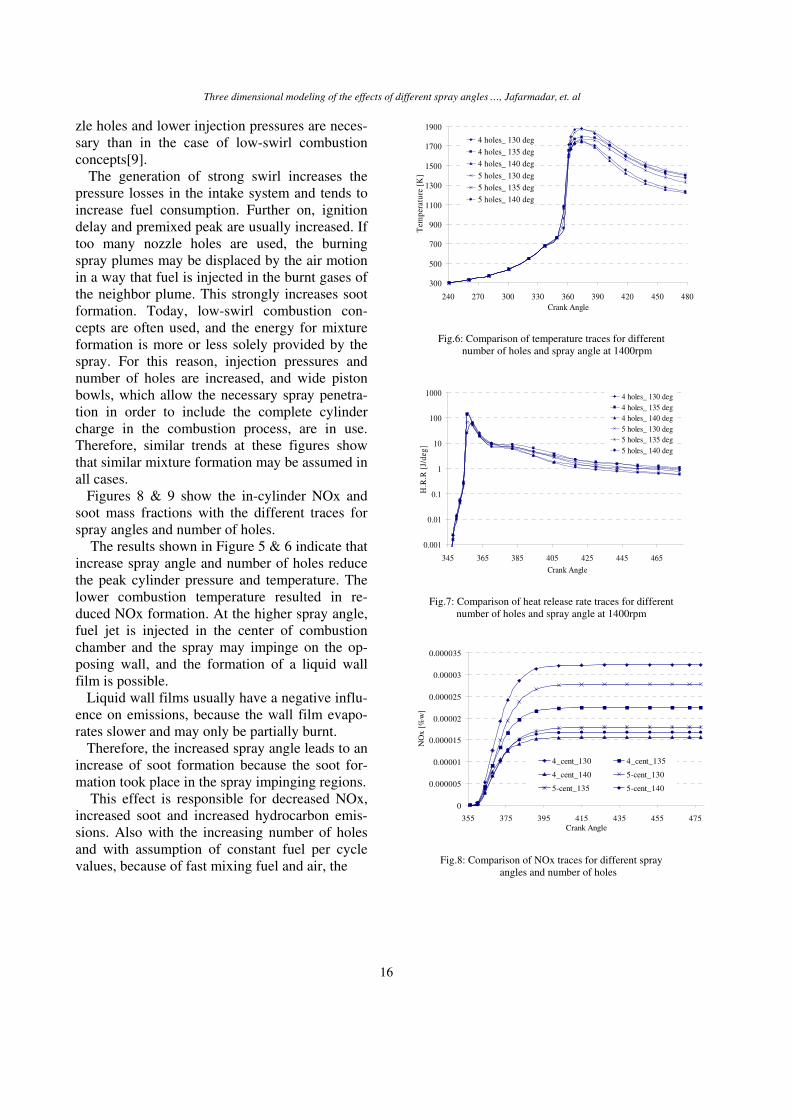
Figures 8 & 9 show the in-cylinder NOx and
soot mass fractions with the different traces for
spray angles and number of holes.
The results shown in Figure 5 & 6 indicate that
increase spray angle and number of holes reduce
the peak cylinder pressure and temperature. The
lower combustion temperature resulted in re-
duced NOx formation. At the higher spray angle,
fuel jet is injected in the center of combustion
chamber and the spray may impinge on the op-
posing wall, and the formation of a liquid wall
film is possible.
Liquid wall films usually have a negative influ-
ence on emissions, because the wall film evapo-
rates slower and may only be partially burnt.
Therefore, the increased spray angle leads to an
increase of soot formation because the soot for-
mation took place in the spray impinging regions.
This effect is responsible for decreased NOx,
increased soot and increased hydrocarbon emis-
sions. Also with the increasing number of holes
and with assumption of constant fuel per cycle
values, because of fast mixing fuel and air, the
Fig.6: Comparison of temperature traces for different number of holes and spray angle at 1400rpm
Fig.7: Comparison of heat release rate traces for different
number of holes and spray angle at 1400rpm
Fig.8: Comparison of NOx traces for different spray angles and number of holes
300
500
700
900
1100
1300
1500
1700
1900
240 270 300 330 360 390 420 450 480
Crank Angle
Tem
per
atu
re [
K]
4 holes_ 130 deg
4 holes_ 135 deg
4 holes_ 140 deg
5 holes_ 130 deg
5 holes_ 135 deg
5 holes_ 140 deg
0.001
0.01
0.1
1
10
100
1000
345 365 385 405 425 445 465
Crank Angle
H.R
.R [
J/d
eg]
4 holes_ 130 deg
4 holes_ 135 deg
4 holes_ 140 deg
5 holes_ 130 deg
5 holes_ 135 deg
5 holes_ 140 deg
0
0.000005
0.00001
0.000015
0.00002
0.000025
0.00003
0.000035
355 375 395 415 435 455 475
Crank Angle
NO
x [
%w
]
4_cent_130 4_cent_135
4_cent_140 5-cent_130
5-cent_135 5-cent_140
International Journal of Energy and Environmental Engineering (IJEEE), Vol.2, No.1, 2011, 11-22
17
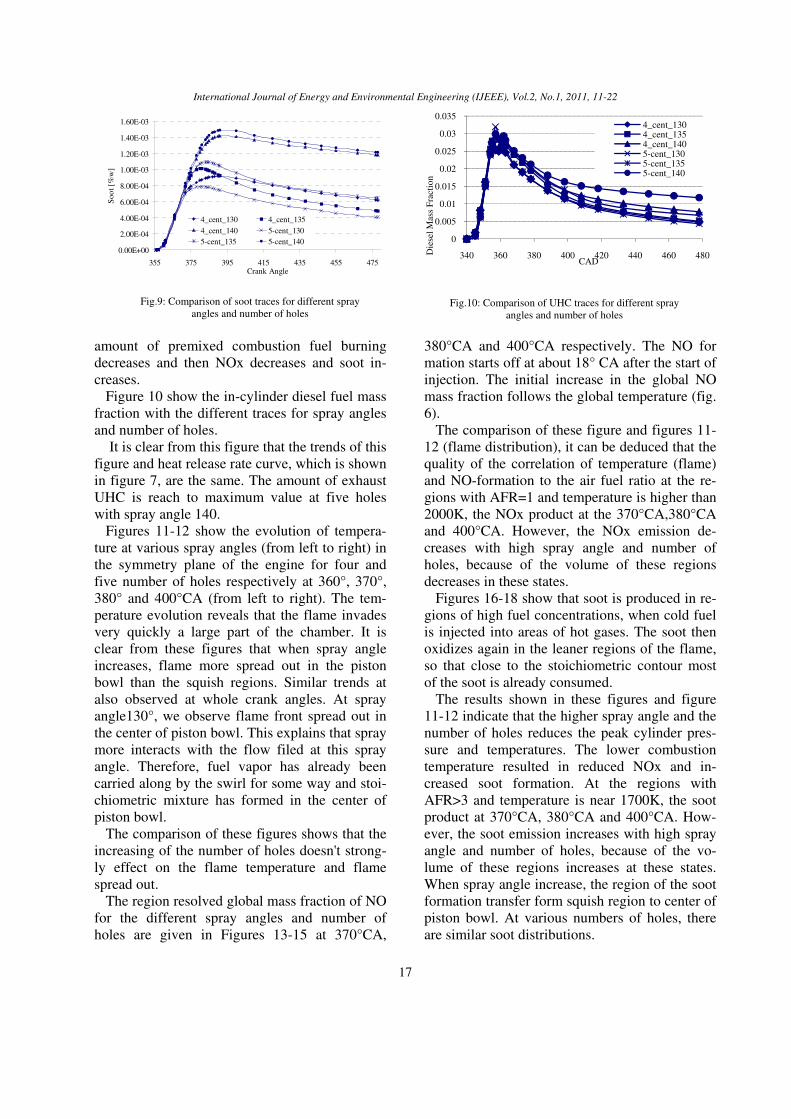
Fig.9: Comparison of soot traces for different spray
angles and number of holes
Fig.10: Comparison of UHC traces for different spray
angles and number of holes
amount of premixed combustion fuel burning
decreases and then NOx decreases and soot in-
creases.
Figure 10 show the in-cylinder diesel fuel mass
fraction with the different traces for spray angles
and number of holes.
It is clear from this figure that the trends of this
figure and heat release rate curve, which is shown
in figure 7, are the same. The amount of exhaust
UHC is reach to maximum value at five holes
with spray angle 140.
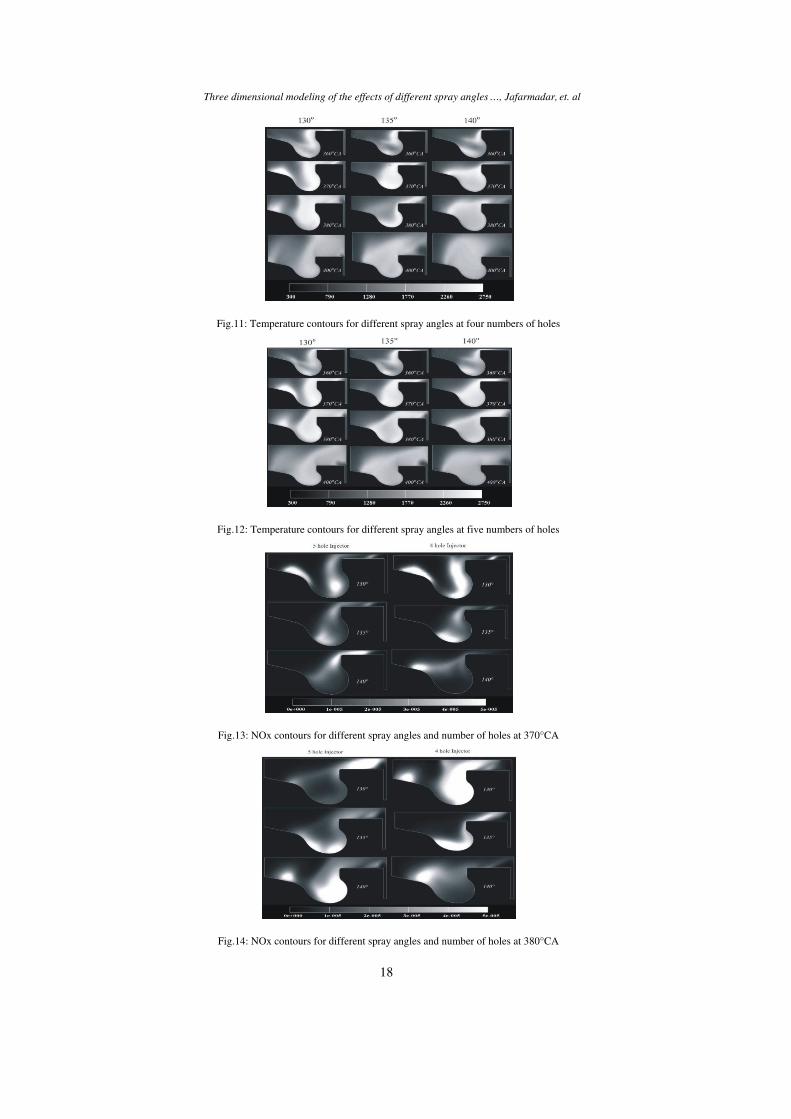
Figures 11-12 show the evolution of tempera-
ture at various spray angles (from left to right) in
the symmetry plane of the engine for four and
five number of holes respectively at 360°, 370°,
380° and 400°CA (from left to right). The tem-
perature evolution reveals that the flame invades
very quickly a large part of the chamber. It is
clear from these figures that when spray angle
increases, flame more spread out in the piston
bowl than the squish regions. Similar trends at
also observed at whole crank angles. At spray
angle130°, we observe flame front spread out in
the center of piston bowl. This explains that spray
more interacts with the flow filed at this spray
angle. Therefore, fuel vapor has already been
carried along by the swirl for some way and stoi-
chiometric mixture has formed in the center of
piston bowl.
The comparison of these figures shows that the
increasing of the number of holes doesn't strong-
ly effect on the flame temperature and flame
spread out.
The region resolved global mass fraction of NO
for the different spray angles and number of
holes are given in Figures 13-15 at 370°CA,
380°CA and 400°CA respectively. The NO for
mation starts off at about 18° CA after the start of
injection. The initial increase in the global NO
mass fraction follows the global temperature (fig.
6).
The comparison of these figure and figures 11-
12 (flame distribution), it can be deduced that the
quality of the correlation of temperature (flame)
and NO-formation to the air fuel ratio at the re-
gions with AFR=1 and temperature is higher than
2000K, the NOx product at the 370°CA,380°CA
and 400°CA. However, the NOx emission de-
creases with high spray angle and number of
holes, because of the volume of these regions
decreases in these states.
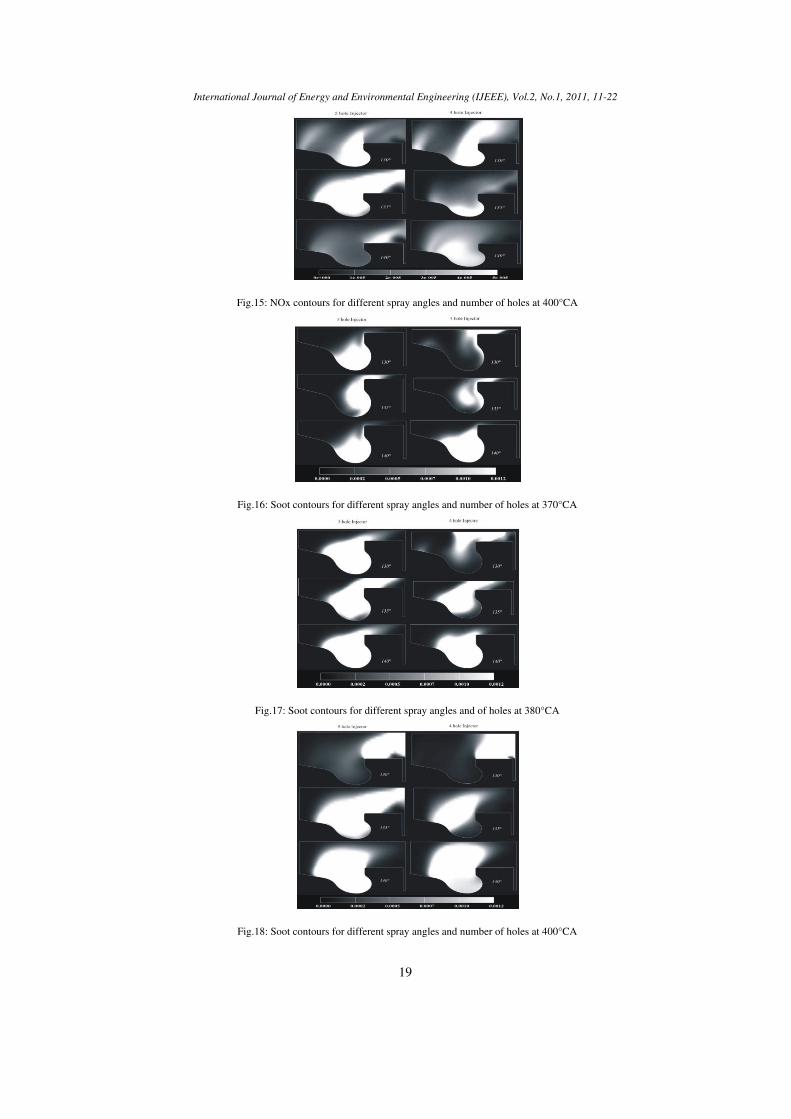
Figures 16-18 show that soot is produced in re-
gions of high fuel concentrations, when cold fuel
is injected into areas of hot gases. The soot then
oxidizes again in the leaner regions of the flame,
so that close to the stoichiometric contour most
of the soot is already consumed.
The results shown in these figures and figure
11-12 indicate that the higher spray angle and the
number of holes reduces the peak cylinder pres-
sure and temperatures. The lower combustion
temperature resulted in reduced NOx and in-
creased soot formation. At the regions with
AFR>3 and temperature is near 1700K, the soot
product at 370°CA, 380°CA and 400°CA. How-
ever, the soot emission increases with high spray
angle and number of holes, because of the vo-
lume of these regions increases at these states.
When spray angle increase, the region of the soot
formation transfer form squish region to center of
piston bowl. At various numbers of holes, there
are similar soot distributions.
0.00E+00
2.00E-04
4.00E-04
6.00E-04
8.00E-04
1.00E-03
1.20E-03
1.40E-03
1.60E-03
355 375 395 415 435 455 475Crank Angle
So
ot
[%w
]
4_cent_130 4_cent_135
4_cent_140 5-cent_130
5-cent_135 5-cent_140 0
0.005
0.01
0.015
0.02
0.025
0.03
0.035
340 360 380 400 420 440 460 480Die
sel
Mas
s F
ract
ion
CAD
4_cent_1304_cent_1354_cent_1405-cent_1305-cent_1355-cent_140
Three dimensional modeling of the effects of different spray angles …, Jafarmadar, et. al
18
Fig.11: Temperature contours for different spray angles at four numbers of holes
Fig.12: Temperature contours for different spray angles at five numbers of holes
Fig.13: NOx contours for different spray angles and number of holes at 370°CA
Fig.14: NOx contours for different spray angles and number of holes at 380°CA
International Journal of Energy and Environmental Engineering (IJEEE), Vol.2, No.1, 2011, 11-22
19
Fig.15: NOx contours for different spray angles and number of holes at 400°CA
Fig.16: Soot contours for different spray angles and number of holes at 370°CA
Fig.17: Soot contours for different spray angles and of holes at 380°CA
Fig.18: Soot contours for different spray angles and number of holes at 400°CA
Three dimensional modeling of the effects of different spray angles
Table
NOx [%w]
0.0000321
0.0000224
0.000155
0.0000277
0.0000178
0.0000167
0.
2
4
6
8
1
1
1
SO
OT
HC
Three dimensional modeling of the effects of different spray angles
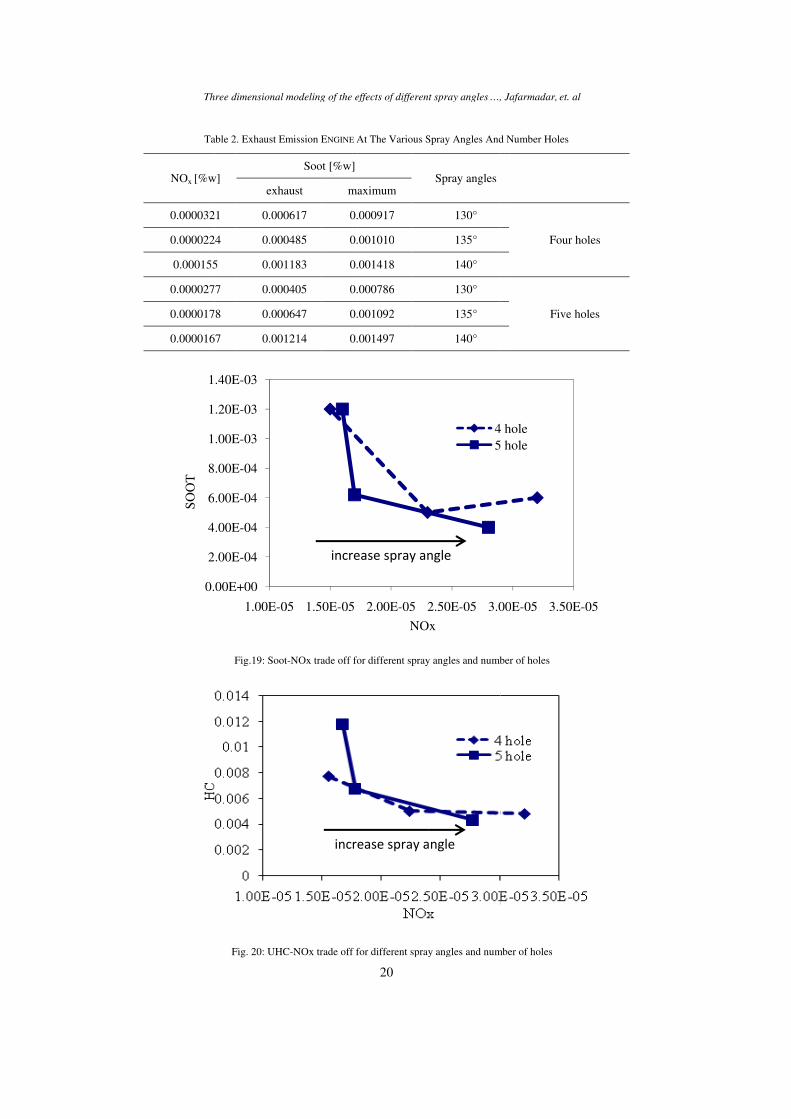
Table 2. Exhaust Emission
[%w] exhaust
0.0000321 0.000617
0.0000224 0.000485
0.000155 0.001183
0.0000277 0.000405
0.0000178 0.000647
0.0000167 0.001214
Fig.19: Soot
Fig. 20: UHC
.00E+00
2.00E-04
4.00E-04
6.00E-04
8.00E-04
1.00E-03
1.20E-03
1.40E-03
1.00E-05
E-
HC
Three dimensional modeling of the effects of different spray angles
Exhaust Emission ENGINE At The Various Spray Angles And Number Holes
Soot [%w]
exhaust maximum
0.000617 0.000917
0.000485 0.001010
0.001183 0.001418
0.000405 0.000786
0.000647 0.001092
0.001214 0.001497
Soot-NOx trade off for different spray angles and number of holes
UHC-NOx trade off for different spray angles and number of holes
05 1.50E-05
E-
Three dimensional modeling of the effects of different spray angles
20
At The Various Spray Angles And Number Holes
maximum
0.000917
0.001010
0.001418
0.000786
0.001092
0.001497
NOx trade off for different spray angles and number of holes
NOx trade off for different spray angles and number of holes
2.00E-05 2
NOx
E-NOx
Three dimensional modeling of the effects of different spray angles …,
At The Various Spray Angles And Number Holes
Spray angles
130°
135°
140°
130°
135°
140°
NOx trade off for different spray angles and number of holes
NOx trade off for different spray angles and number of holes
2.50E-05 3.00
NOx
4
5
E-ENOx
hole
, Jafarmadar, et. al
At The Various Spray Angles And Number Holes
Four holes
Five holes
NOx trade off for different spray angles and number of holes
NOx trade off for different spray angles and number of holes
00E-05 3.50
4 hole
5 hole
E-E-
hole
et. al
Four holes
Five holes
50E-05
-
International Journal of Energy and Environmental Engineering (IJEEE), Vol.2, No. 1, 2011, 11-22
21
Table 2 shows the values of computational
emission at the beginning of exhaust stroke. Ta-
ble 4 shows that the NOx emission decreased and
soot emission increased with increasing spray
angle and the number of holes simultaneously.
Figures 19 and 20 show the UHC ,NOx and
Soot, NOx trade-offs .The effect of number hole
and spray angle was investigated using three dif-
ferent spray angles 130, 135, 140 and two differ-
ent 4 and 5 number holes. It can be seen that the
similar trends is observed in these figures. Soot
and UHC decreased significantly at small spray
angle and five number holes, whereas slowly de-
creased at four number holes. It is interesting to
see that the five holes with spray angle 135 is the
best point curve for soot and NOx trade off.
8. Conclusions
In this paper, a computational study was carried
out to investigate the effects of spray angles with
the number of holes in a direct injection diesel
engine. Based on this study, the following con-
clusions are drawn:
1- With the increasing of spray angle and num-
ber of hole, peak pressure and temperature in cy-
linder decrease.
2- Minimum NOx emission for four hole injec-
tion system take place at spray angle correspond-
ing to 140° and minimum soot exhaust emission
for five hole injection system take place at spray
angle corresponding to 130°.
3- At five hole injection system with spray an-
gle corresponding to 130°, the amount of soot
can be reduce and the amount of NOx have aver-
age value at this point. Therefore spray angle cor-
responding to 130° is optimum state.
4- When spray angle increases, the flame front
and NOx formation regions and soot formation
reach to the piston bowl from squish regions.
5- Similar trends for flame front, NOx forma-
tion regions and soot formation are observed at
four and five holes.
6- Five holes with spray angle 135 because of
closer to origin coordinate is the best point for
soot and NOx trade off.
9. Nomenclature
Greek symbols
)(mΛ wave length
)/(2kmwα heat transfer coefficient
τ )(s time scale
Letters
A pre exponential factor, area
)(wQ heat flux
)(md diameter
r )/( skg fuel consumption rate
)/(22
skgmE energy
S stoichiometric; source term
)./(3
smolmK reaction constant
)(KT temperature
)/( kgJL latent heat of evaporation
)./( kmolKJR universal gas constant
)/( kmolkgM molecular weight
)(kgm mass
)( pascalp pressure
Subscripts
a activation
form formation
l liquid
s soot, surface
c carbon, critical
fu Fuel
d droplet
f forward
oxid qxidation
fv fuel vapour
R reaction
References
[1] “Internal combustion engine fundamental” 1. J.B.
Heywood, McGraw Hill Book Company,
NewYourk, 1988.
[2] “Computer modeling of flow and heat transfer in
engines, progress and prospects.” A.D. Gosman.
Imperil College of science and Technology,
London.
[3] “Modeling of the natural gas injection process in a
two-stroke diesel engine.” R. Jeske Felix, et al
,SAE Paper 920192.
Three dimensional modeling of the effects of different spray angles …, Jafarmadar, et. al
22
[4] “In-cylinder flow field analysis of a single-cylinder
DI diesel engine using PIV and CFD.” Choi
Wook, et al SAE Paper 2003-01-1846.
[5] “Complete engine modeling using CFD.” Christian
Fyhr, Olof Dahlberg, SAE Paper 2004-01-0109.
[6] AVL Fire release notes.
[7] “Numerical studying of combustion process and
emission in direct injection diesel engine by three
dimensional modeling” S.Jafarmadar, S.Shafe,
R.Barzegar,15 the International Mechanical
Engineering conference,Tehran
[8] “Prediction of major pollutants emission in direct-
injection dual-fuel diesel and natural gas engines”
Pirouzpanah V, Kashani BO. SAE Paper NO.
1999-01-0841; 1999.
[9] “Mixture Formation in Internal Combustion
Engines” Carsten Baumgarten, Springer-Verlag
Berlin Heidelberg 2006.
[10] ) “Flash Boiling Effects on the Development of
Gasoline Direct-Injection Engine Sprays.” Schmitz
I, Ipp W, Leipertz A (2002) SAE paper 2002-01-
2661.
[11] "A simulation model including intake and exhaust
systems for a single cylinder four-stroke cycle
spark ignition engine" R. S. Benson, W. J.Annand
and P. C.Baruah, Int. J. mech. Sci., 17,97-124,
1975
[12] "On mathematical modelling of turbulent
combustion with special emphasis on soot
formation and combustion" B. F.Magnussen and
B. H. Hjertager,, 16th Symposium (Int.) on
Combustion, 1976
[13] “The Auto ignition of hydrocarbon fueled at high
temperatures and pressures - fitting of a
mathematical model” Halstead M, Kirsch L, Quinn
C., Combustion Flame 30 (1977): 45-60.