Embed Size (px)
Citation preview
Abstract—Cloud Computing is a specialized form of
Distributed computing in which the resources such as storage,
processors, memory etc. are completely abstracted from the
consumer. The number of Cloud Service Providers (CSPs) who
offer computing as a service has increased in recent times and
often the customers need to interact with unknown service
providers to carry out transactions. In such an open and
anonymous environments, trust helps to build consumer
confidence and provides a reliable environment for them. A
trust based ranking system could also help them to choose
between the services as per their requirement. In this paper,
multi criteria decision making methods have been used to rank
the service providers based on their infrastructure parameters.
A combination of analytic and fuzzy method gives a better
trust estimate as compared to an analytic method alone.
Index Terms—Multiple Criteria Decision Making, Cloud
Service Provider Selection, Fuzzy.
I. INTRODUCTION
Distributed systems, or distributed computing, has
spawned many familiar technologies across the years,
including Grid Computing, Utility Computing, Cloud
Computing, application service provision
(ASP) and Web 2.0. Among these, Cloud Computing is a
specialized form in which the underlying resources, such as
storage, processors, and memory, are completely abstracted
from the consumer. It has emerged as a paradigm to provide
on demand resources to the customers, which may include
access to infrastructure/application services on a
subscription basis. Cloud Service Provider (CSP) facilitates
many types of services among which Infrastructure as a
Service (IaaS), Software as a Service (SaaS) and Platform as
a Service (PaaS) are the basic types. Consumers utilize these
services to simplify application utilization, store, and share,
protect content, and enable access from any web-connected
device. The range of computing services, thus offered helps
enterprises by reducing capital and operational expenditure
[1].
The number of CSPs who offer computing as a utility has
increased exponentially in the recent years providing more
Manuscript received June 01, 2015; revised October 28, 2015. *Supriya M is with Amrita School of Engineering, Amrita Vishwa
Vidyapeetham, Bengaluru, Karnataka, India; phone: +91 98802 35060; (e-
mail: [email protected]).
Sangeeta K is with Amrita School of Engineering, Amrita Vishwa
Vidyapeetham, Bengaluru, Karnataka, India. (e-mail:
G K Patra is with CSIR Fourth Paradigm Institute, Council of Scientific
and Industrial Research (Formerly CSIR C-MMACS), Bengaluru,
Karnataka, India. (e-mail: [email protected]).
options for the customers to choose from. This rapid growth
of public cloud offerings allows the customers to interact
with unknown service providers to carry out tasks or
transactions [2]. In such a scenario, a rating or a ranking
system could help them to choose between the services as
per their requirement. If an appropriate service provider is
not selected, serious problems such as low-quality services
and service non-fulfillment may occur. Thus, the selection
of a suitable service provider by reasoning and assessing the
possible risks in carrying out transactions is necessary for
providing a safe and trustworthy environment. A proper and
secure trust management evaluation that is in place would
help to minimize the risks posed by different malicious
agents.
Trust is the estimation of competency of a resource
provider in completing a task based on dependability,
security, ability, and availability in the context of a
distributed cloud environment. It helps to build consumer
confidence in such open and often anonymous environments
and provides a reliable atmosphere for customers or
businesses to carry out transactions with cloud providers.
This also enables them to select the best resources in the
heterogeneous cloud infrastructure. Therefore service levels
of different CSPs need to be evaluated in an objective way
to ensure quality, reliability and security of an application.
These cloud services that exist at three levels of the cloud
model, namely; IaaS, PaaS, and SaaS have to be evaluated
using an efficient trust management model.
A survey paper on trust and trust management in cloud
computing proposed by Firdhous et. al. [3] analyzes the
trust management models proposed for cloud computing
like Cuboid trust, Eigen trust, Bayesian network based trust,
etc. with special emphasis on their capability, applicability,
and implementabilty in practical heterogeneous cloud
environment and also emphasizes the need for a trust
evaluation model. Sun et. al. [4] have proposed a trust
management model to evaluate the direct and recommended
trust measurements based on fuzzy set theory; which
provides a helpful measure for the computation of direct
trust, connection of recommended trust, and incorporation
of trust chain. However, it does not completely measure the
trust degree and the model has not been tested practically.
For infrastructure as a service, Alhamad et. al. [5] developed
a Sugeno fuzzy inference model to find the trust rating for
cloud based online services using scalability, availability,
security, and usability as parameters, measures for which are
obtained from the opinions of Cloud Computing experts and
Trustworthy Cloud Service Provider Selection
using Multi Criteria Decision Making Methods
Supriya M*, Sangeeta K, G K Patra
Engineering Letters, 24:1, EL_24_1_01
(Advance online publication: 29 February 2016)
______________________________________________________________________________________
cloud users. These measures are not a direct estimation of
the available infrastructure resources.
As the data centers in the cloud computing environment
are geographically distributed and owned by different
individuals, a multi agent based quantitative trust framework
is developed, which helps the user find trustworthy service
providers in a cloud environment using the
recommendations provided by acquaintances with an
element of subjectivity [6]. Another framework named
SMICloud proposed by Garg et. al. [7], [8] allows the cloud
user to find the appropriate cloud provider based on his
essential and non-essential requirements. The Cloud Service
Measurement Initiative Consortium (CSMIC) [9]
parameters are used here to rate the Quality of CSPs using
Analytical Hierarchical Process (AHP) as a tool which
allows to translate the evaluations (both qualitative and
quantitative) made by the decision maker into a multi
criteria ranking. AHP is a Multi Criteria Decision Making
(MCDM) methodology which has been used in e-commerce,
transport problem, portfolio selection, and choice of the best
suppliers [10], [11], [12], [13].
Technique for Ordering Preference by Similarity to Ideal
Solution (TOPSIS) is another popular Multi Criteria
Decision Making method which uses the concept of shortest
distance from the positive ideal solution (PIS) and the
farthest distance from the negative ideal solution (NIS) to
determine the best alternative. Fuzzy TOPSIS has been used
to rank the web services available in the market [14]. The
Fuzzy TOPSIS method considers both the qualitative and
quantitative aspects used in the selection of an appropriate
industrial robotic system based on economic and technical
attributes [15], [16]. A review for service selection for cloud
computing using MCDM methods discussed in [17] does
not use quantitative trust estimates for ranking various
CSPs.
This study uses various MCDM methods to get a
quantitative estimate of trust for various service providers
based on the CSMIC parameters which are in turn estimated
from the measures of their defining attributes. A comparison
of the methods suggests an integration of qualitative and
quantitative decision making into one unified framework to
help customers choose service providers as per their
priorities. Problem description and the various MCDM
approaches are discussed in sections II to VIII. Performance
evaluation of MCDM methods is described in sections IX
and X. The paper is concluded in section XI.
II. PROBLEM DESCRIPTION
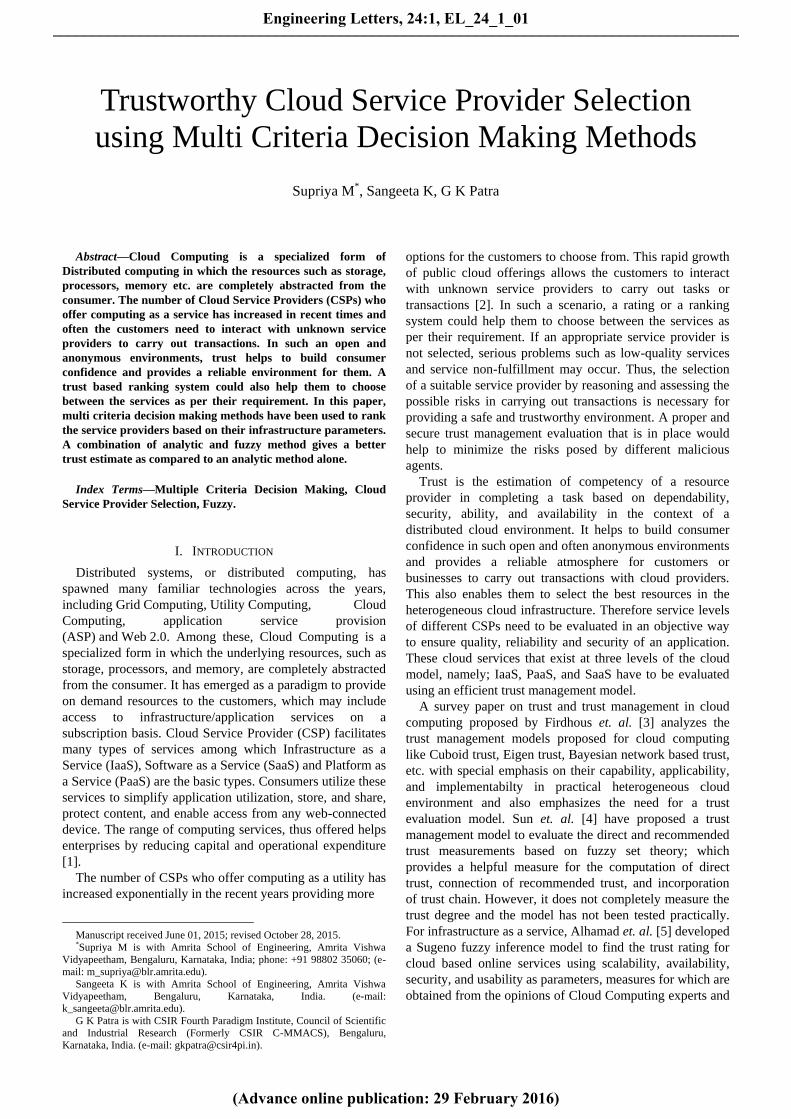
Ranking of CSPs is based on the Key Performance
Indicators suggested by CSMIC [9], [18] called Service
Measurement Index (SMI) which help the organizations
measure the cloud-related business services based on their
specific business and technology requirements. The
indicators considered in the trust estimation of CSPs are
Accountability, Agility, Assurance, Performance, Financial,
Security and Privacy, and Usability. Estimates for five of
these parameters are obtained from the infrastructure
attributes listed in Table I against the various service
providers. The non-quantifiable subjective estimates like
Security and Usability can be obtained and consolidated
from a survey. For the comparison of services, four
infrastructure CSPs were considered: Gogrid, Rackspace,
Amazon EC2 and Cloudflare. These service providers and
their various plans have been abbreviated as CSP1, CSP2,
CSP3, CSP7.
Table I shows that attributes like number of virtual
machines (VM), data centers (DC) and storage space (SS)
contribute to Agility estimation, while Finance is
determined from the VM cost, storage cost and transfer cost.
Likewise, the other CSMIC parameters are estimated from
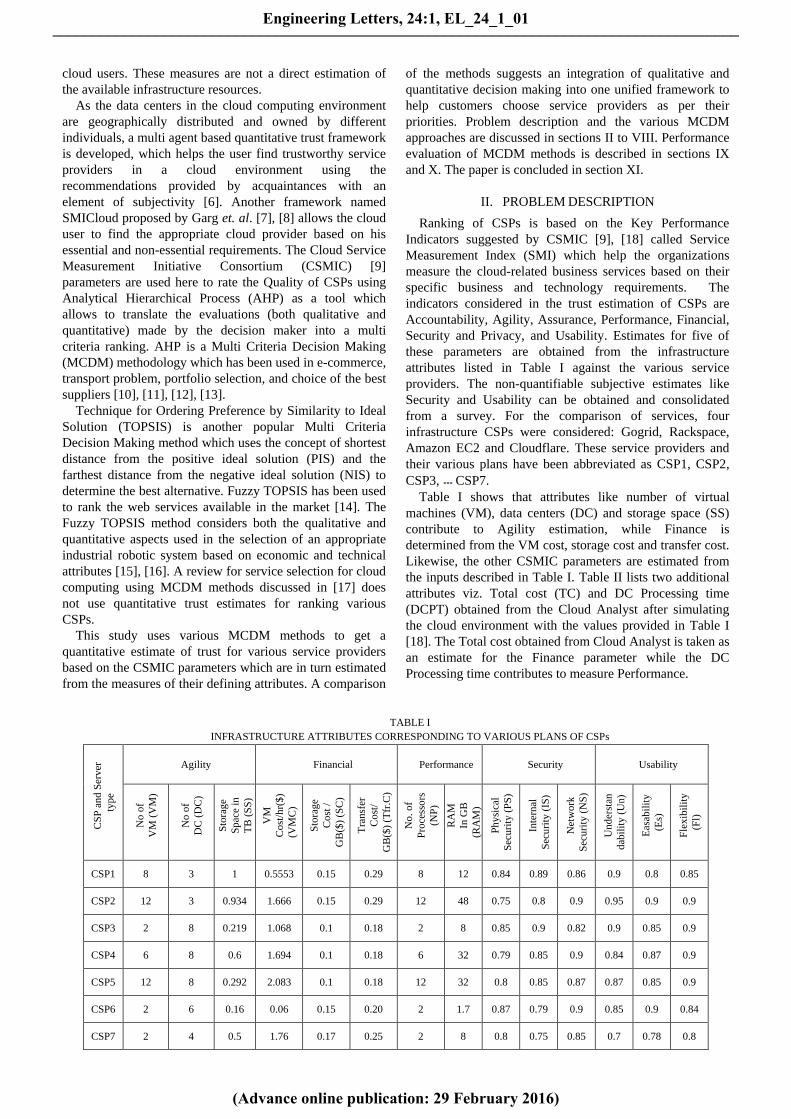
the inputs described in Table I. Table II lists two additional
attributes viz. Total cost (TC) and DC Processing time
(DCPT) obtained from the Cloud Analyst after simulating
the cloud environment with the values provided in Table I
[18]. The Total cost obtained from Cloud Analyst is taken as
an estimate for the Finance parameter while the DC
Processing time contributes to measure Performance.
TABLE I
INFRASTRUCTURE ATTRIBUTES CORRESPONDING TO VARIOUS PLANS OF CSPs
CS
P a
nd
Ser
ver
typ
e
Agility Financial Performance Security Usability
No
of
VM
(V
M)
No
of
DC
(D
C)
Sto
rag
e
Sp
ace
in
TB
(S
S)
VM
Co
st/h
r($
)
(VM
C)
Sto
rag
e
Co
st /
GB
($)
(SC
)
T
ran
sfer
Co
st/
GB
($)
(Tfr
.C)
No
. o
f
Pro
cess
ors
(NP
)
RA
M
In G
B
(RA
M)
Ph
ysi
cal
Sec
uri
ty (
PS
)
Inte
rnal
Sec
uri
ty (
IS)
Net
wo
rk
Sec
uri
ty (
NS
)
Un
der
stan
dab
ilit
y (
Un
)
Eas
abil
ity
(Es)
Fle
xib
ilit
y
(Fl)
CSP1 8 3 1 0.5553 0.15 0.29 8 12 0.84 0.89 0.86 0.9 0.8 0.85
CSP2 12 3 0.934 1.666 0.15 0.29 12 48 0.75 0.8 0.9 0.95 0.9 0.9
CSP3 2 8 0.219 1.068 0.1 0.18 2 8 0.85 0.9 0.82 0.9 0.85 0.9
CSP4 6 8 0.6 1.694 0.1 0.18 6 32 0.79 0.85 0.9 0.84 0.87 0.9
CSP5 12 8 0.292 2.083 0.1 0.18 12 32 0.8 0.85 0.87 0.87 0.85 0.9
CSP6 2 6 0.16 0.06 0.15 0.20 2 1.7 0.87 0.79 0.9 0.85 0.9 0.84
CSP7 2 4 0.5 1.76 0.17 0.25 2 8 0.8 0.75 0.85 0.7 0.78 0.8
Engineering Letters, 24:1, EL_24_1_01
(Advance online publication: 29 February 2016)
______________________________________________________________________________________
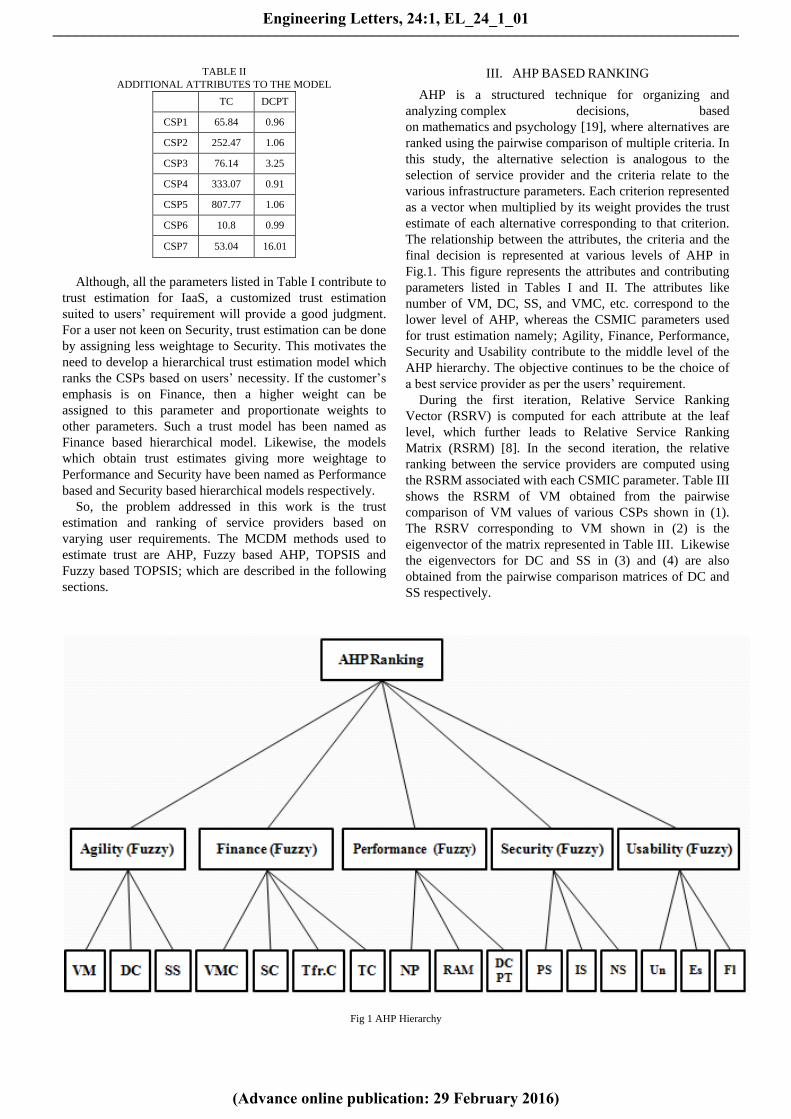
TABLE II
ADDITIONAL ATTRIBUTES TO THE MODEL
TC DCPT
CSP1 65.84 0.96
CSP2 252.47 1.06
CSP3 76.14 3.25
CSP4 333.07 0.91
CSP5 807.77 1.06
CSP6 10.8 0.99
CSP7 53.04 16.01
Although, all the parameters listed in Table I contribute to
trust estimation for IaaS, a customized trust estimation
suited to users’ requirement will provide a good judgment.
For a user not keen on Security, trust estimation can be done
by assigning less weightage to Security. This motivates the
need to develop a hierarchical trust estimation model which
ranks the CSPs based on users’ necessity. If the customer’s
emphasis is on Finance, then a higher weight can be
assigned to this parameter and proportionate weights to
other parameters. Such a trust model has been named as
Finance based hierarchical model. Likewise, the models
which obtain trust estimates giving more weightage to
Performance and Security have been named as Performance
based and Security based hierarchical models respectively.
So, the problem addressed in this work is the trust
estimation and ranking of service providers based on
varying user requirements. The MCDM methods used to
estimate trust are AHP, Fuzzy based AHP, TOPSIS and
Fuzzy based TOPSIS; which are described in the following
sections.
III. AHP BASED RANKING
AHP is a structured technique for organizing and
analyzing complex decisions, based
on mathematics and psychology [19], where alternatives are
ranked using the pairwise comparison of multiple criteria. In
this study, the alternative selection is analogous to the
selection of service provider and the criteria relate to the
various infrastructure parameters. Each criterion represented
as a vector when multiplied by its weight provides the trust
estimate of each alternative corresponding to that criterion.
The relationship between the attributes, the criteria and the
final decision is represented at various levels of AHP in
Fig.1. This figure represents the attributes and contributing
parameters listed in Tables I and II. The attributes like
number of VM, DC, SS, and VMC, etc. correspond to the
lower level of AHP, whereas the CSMIC parameters used
for trust estimation namely; Agility, Finance, Performance,
Security and Usability contribute to the middle level of the
AHP hierarchy. The objective continues to be the choice of
a best service provider as per the users’ requirement.
During the first iteration, Relative Service Ranking
Vector (RSRV) is computed for each attribute at the leaf
level, which further leads to Relative Service Ranking
Matrix (RSRM) [8]. In the second iteration, the relative
ranking between the service providers are computed using
the RSRM associated with each CSMIC parameter. Table III
shows the RSRM of VM obtained from the pairwise
comparison of VM values of various CSPs shown in (1).
The RSRV corresponding to VM shown in (2) is the
eigenvector of the matrix represented in Table III. Likewise
the eigenvectors for DC and SS in (3) and (4) are also
obtained from the pairwise comparison matrices of DC and
SS respectively.
Fig 1 AHP Hierarchy
Engineering Letters, 24:1, EL_24_1_01
(Advance online publication: 29 February 2016)
______________________________________________________________________________________
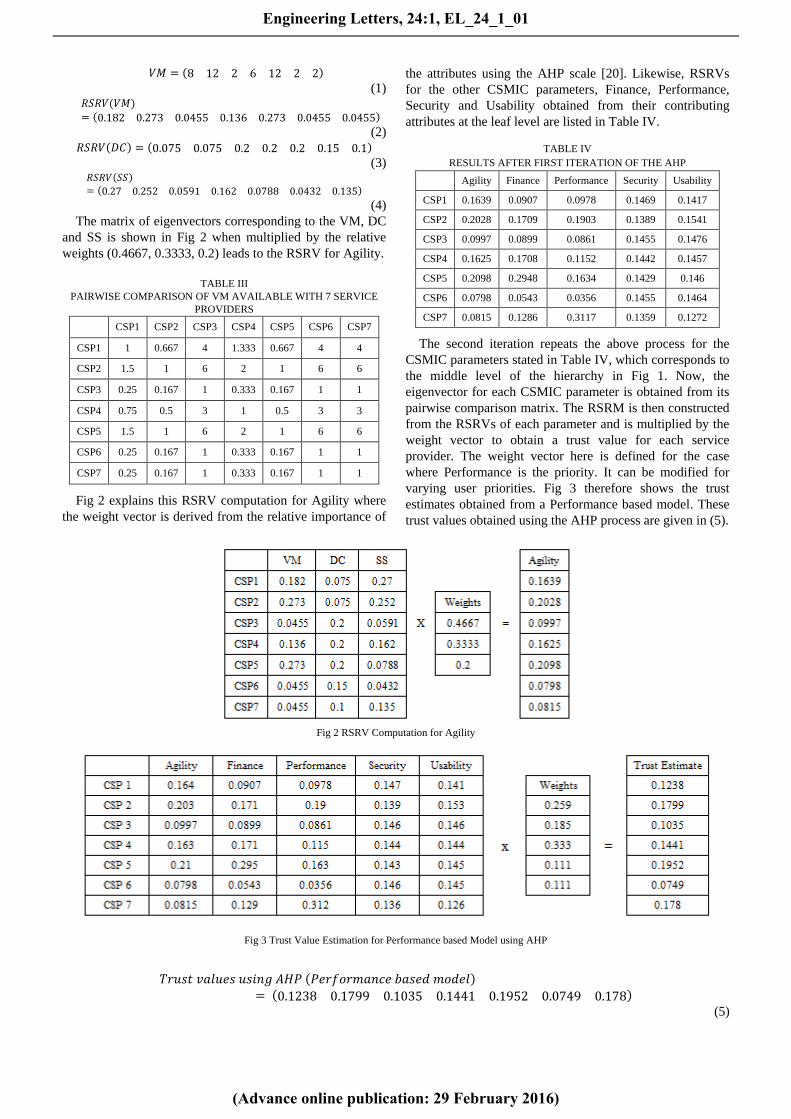
𝑉𝑀 = 8 12 2 6 12 2 2
(1) 𝑅𝑆𝑅𝑉(𝑉𝑀)= 0.182 0.273 0.0455 0.136 0.273 0.0455 0.0455
(2)
𝑅𝑆𝑅𝑉 𝐷𝐶 = 0.075 0.075 0.2 0.2 0.2 0.15 0.1
(3) 𝑅𝑆𝑅𝑉 𝑆𝑆
= 0.27 0.252 0.0591 0.162 0.0788 0.0432 0.135
(4)
The matrix of eigenvectors corresponding to the VM, DC
and SS is shown in Fig 2 when multiplied by the relative
weights (0.4667, 0.3333, 0.2) leads to the RSRV for Agility.
TABLE III
PAIRWISE COMPARISON OF VM AVAILABLE WITH 7 SERVICE
PROVIDERS
CSP1 CSP2 CSP3 CSP4 CSP5 CSP6 CSP7
CSP1 1 0.667 4 1.333 0.667 4 4
CSP2 1.5 1 6 2 1 6 6
CSP3 0.25 0.167 1 0.333 0.167 1 1
CSP4 0.75 0.5 3 1 0.5 3 3
CSP5 1.5 1 6 2 1 6 6
CSP6 0.25 0.167 1 0.333 0.167 1 1
CSP7 0.25 0.167 1 0.333 0.167 1 1
Fig 2 explains this RSRV computation for Agility where
the weight vector is derived from the relative importance of
the attributes using the AHP scale [20]. Likewise, RSRVs
for the other CSMIC parameters, Finance, Performance,
Security and Usability obtained from their contributing
attributes at the leaf level are listed in Table IV.
TABLE IV
RESULTS AFTER FIRST ITERATION OF THE AHP
Agility Finance Performance Security Usability
CSP1 0.1639 0.0907 0.0978 0.1469 0.1417
CSP2 0.2028 0.1709 0.1903 0.1389 0.1541
CSP3 0.0997 0.0899 0.0861 0.1455 0.1476
CSP4 0.1625 0.1708 0.1152 0.1442 0.1457
CSP5 0.2098 0.2948 0.1634 0.1429 0.146
CSP6 0.0798 0.0543 0.0356 0.1455 0.1464
CSP7 0.0815 0.1286 0.3117 0.1359 0.1272
The second iteration repeats the above process for the
CSMIC parameters stated in Table IV, which corresponds to
the middle level of the hierarchy in Fig 1. Now, the
eigenvector for each CSMIC parameter is obtained from its
pairwise comparison matrix. The RSRM is then constructed
from the RSRVs of each parameter and is multiplied by the
weight vector to obtain a trust value for each service
provider. The weight vector here is defined for the case
where Performance is the priority. It can be modified for
varying user priorities. Fig 3 therefore shows the trust
estimates obtained from a Performance based model. These
trust values obtained using the AHP process are given in (5).
Fig 2 RSRV Computation for Agility
Fig 3 Trust Value Estimation for Performance based Model using AHP
𝑇𝑟𝑢𝑠𝑡 𝑣𝑎𝑙𝑢𝑒𝑠 𝑢𝑠𝑖𝑛𝑔 𝐴𝐻𝑃 𝑃𝑒𝑟𝑓𝑜𝑟𝑚𝑎𝑛𝑐𝑒 𝑏𝑎𝑠𝑒𝑑 𝑚𝑜𝑑𝑒𝑙
= 0.1238 0.1799 0.1035 0.1441 0.1952 0.0749 0.178
(5)
Engineering Letters, 24:1, EL_24_1_01
(Advance online publication: 29 February 2016)
______________________________________________________________________________________
IV. FUZZY-AHP BASED RANKING
In undefined environments, the Fuzzy AHP method
provides decision makers, a systematic method for
comparing and weighting of the multiple criteria and
alternatives. This too follows a hierarchical structure similar
to Fig 1 with the difference that parameter estimation now
utilizes a range of values. Thus, in the first iteration, the
CSMIC parameters are estimated using the Sugeno Fuzzy
Inference System (FIS) [21], [22] instead of the AHP
mechanism, the results of which are shown in Table V. This
is analogous to the RSRM obtained by the AHP mechanism
in Fig 3. In the second step, trust estimates for service
providers are once again obtained using the AHP
mechanism as described in section III. For the Performance
based model, the CSMIC parameters iss assigned the
following weights:
0.259 0.185 0.333 0.111 0.111
(6)
as described in Fig 3 so that the trust estimates obtained can
be compared with those obtained using AHP.
TABLE V
RESULTS AFTER FIRST ITERATION OF THE FUZZY AHP
Agility Finance Performance Security Usability
CSP1 0.5 0.484 0.509 0.497 0.259
CSP2 0.5 0.272 0.996 0.323 0.511
CSP3 0.251 0.694 0.296 0.438 0.488
CSP4 0.525 0.473 0.644 0.489 0.486
CSP5 0.506 0.266 0.883 0.488 0.485
CSP6 0.249 0.706 0.28 0.497 0.42
CSP7 0.183 0.25 0.00285 0.297 0.00056
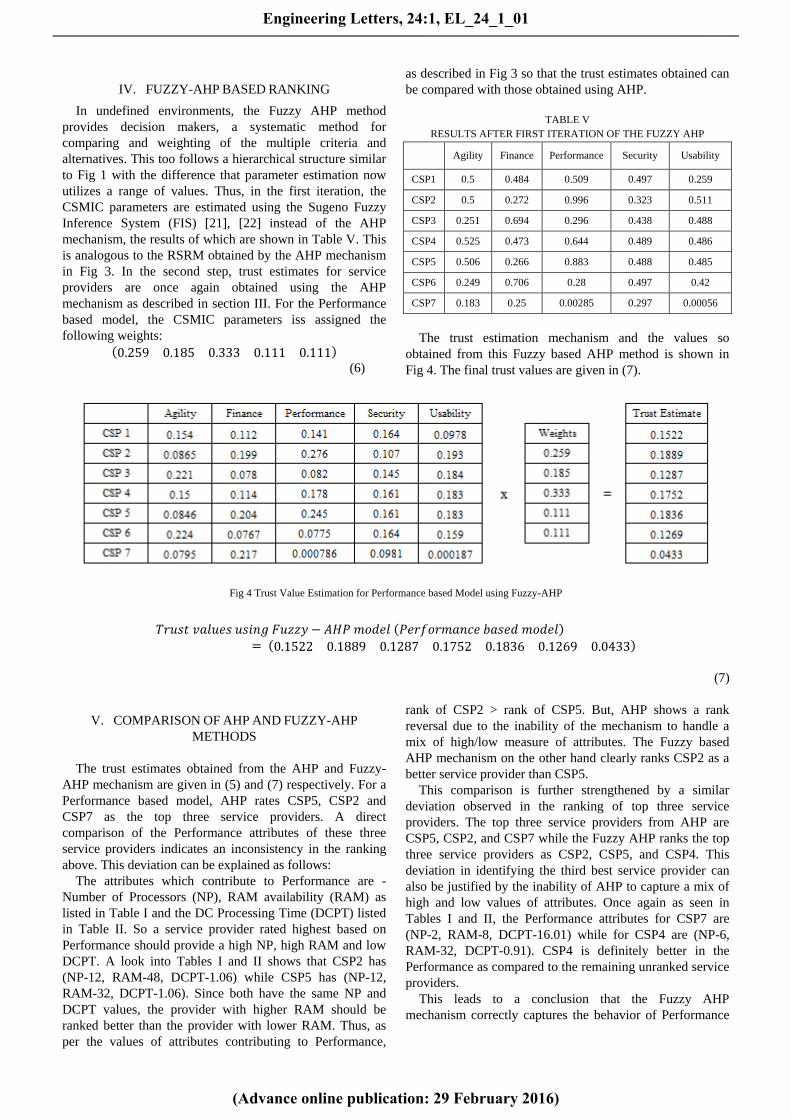
The trust estimation mechanism and the values so
obtained from this Fuzzy based AHP method is shown in
Fig 4. The final trust values are given in (7).
Fig 4 Trust Value Estimation for Performance based Model using Fuzzy-AHP
𝑇𝑟𝑢𝑠𝑡 𝑣𝑎𝑙𝑢𝑒𝑠 𝑢𝑠𝑖𝑛𝑔 𝐹𝑢𝑧𝑧𝑦 − 𝐴𝐻𝑃 𝑚𝑜𝑑𝑒𝑙 𝑃𝑒𝑟𝑓𝑜𝑟𝑚𝑎𝑛𝑐𝑒 𝑏𝑎𝑠𝑒𝑑 𝑚𝑜𝑑𝑒𝑙
= 0.1522 0.1889 0.1287 0.1752 0.1836 0.1269 0.0433
(7)
V. COMPARISON OF AHP AND FUZZY-AHP
METHODS
The trust estimates obtained from the AHP and Fuzzy-
AHP mechanism are given in (5) and (7) respectively. For a
Performance based model, AHP rates CSP5, CSP2 and
CSP7 as the top three service providers. A direct
comparison of the Performance attributes of these three
service providers indicates an inconsistency in the ranking
above. This deviation can be explained as follows:
The attributes which contribute to Performance are -
Number of Processors (NP), RAM availability (RAM) as
listed in Table I and the DC Processing Time (DCPT) listed
in Table II. So a service provider rated highest based on
Performance should provide a high NP, high RAM and low
DCPT. A look into Tables I and II shows that CSP2 has
(NP-12, RAM-48, DCPT-1.06) while CSP5 has (NP-12,
RAM-32, DCPT-1.06). Since both have the same NP and
DCPT values, the provider with higher RAM should be
ranked better than the provider with lower RAM. Thus, as
per the values of attributes contributing to Performance,
rank of CSP2 > rank of CSP5. But, AHP shows a rank
reversal due to the inability of the mechanism to handle a
mix of high/low measure of attributes. The Fuzzy based
AHP mechanism on the other hand clearly ranks CSP2 as a
better service provider than CSP5.
This comparison is further strengthened by a similar
deviation observed in the ranking of top three service
providers. The top three service providers from AHP are
CSP5, CSP2, and CSP7 while the Fuzzy AHP ranks the top
three service providers as CSP2, CSP5, and CSP4. This
deviation in identifying the third best service provider can
also be justified by the inability of AHP to capture a mix of
high and low values of attributes. Once again as seen in
Tables I and II, the Performance attributes for CSP7 are
(NP-2, RAM-8, DCPT-16.01) while for CSP4 are (NP-6,
RAM-32, DCPT-0.91). CSP4 is definitely better in the
Performance as compared to the remaining unranked service
providers.
This leads to a conclusion that the Fuzzy AHP
mechanism correctly captures the behavior of Performance
Engineering Letters, 24:1, EL_24_1_01
(Advance online publication: 29 February 2016)
______________________________________________________________________________________
attributes thus leading to correct estimates of trust values
with higher variance.
VI. TOPSIS BASED RANKING
TOPSIS developed by Hwang and Yoon in 1981 [23],
views the decision making problem with m alternatives, as a
geometric system with m points in the n-dimensional space.
The method is based on the concept that the chosen
alternative should have the shortest distance from the
positive-ideal solution and the longest distance from the
negative-ideal solution. TOPSIS defines an index called
similarity to the positive-ideal solution and the remoteness
from the negative-ideal solution using which the method
chooses an alternative that has a maximum similarity to the
positive-ideal solution. The structure of alternative
performance matrix in TOPSIS is shown in Table VI [23].
TABLE VI
STRUCTURE OF THE ALTERNATIVE PERFORMANCE
Criterion 1 Criterion 2 …… Criterion n
Alternative 1 x11 x12 …… x1n
Alternative 2 x21 x22 …… x2n
… … ... …… …
… … … …… …
… ... … …… …
Alternative m xm1 xm2 …… xmn
where 𝑥𝑖𝑗 is the rating of the alternative i with respect to
criterion j. The similarity indices of the attributes at leaf
level of Fig 1 are first computed. These values have been
listed in Table VII (A), where the alternatives correspond to
service providers and the criteria are VM, DC and SS. The
TOPSIS process proceeds as follows:
i) The normalized decision matrix (𝑟𝑖𝑗 ) for Agility as in
Table VII (B) is obtained from the similarity indices
using
𝑟𝑖𝑗 = 𝑥𝑖𝑗
𝛴(𝑥𝑖𝑗 )2 𝑓𝑜𝑟 𝑖 = 1 𝑡𝑜 𝑚 𝑎𝑛𝑑 𝑗 = 1 𝑡𝑜 𝑛
(8)
where, m represents the set of service providers and n
represents the attributes/criteria used in the model.
Likewise, the normalized decision matrix is obtained
for other CSMIC parameters too.
TABLE VII (A)
INPUT TABLE FOR AGILITY
VM DC SS
CSP1 8 3 1
CSP2 12 3 0.934
CSP3 2 8 0.219
CSP4 6 8 0.6
CSP5 12 8 0.292
CSP6 2 6 0.16
CSP7 2 4 0.5
TABLE VII (B)
NORMALIZED TABLE FOR AGILITY
VM DC SS
CSP1 0.4 0.185 0.615
CSP2 0.6 0.185 0.575
CSP3 0.1 0.494 0.135
CSP4 0.3 0.494 0.369
CSP5 0.6 0.494 0.18
CSP6 0.1 0.371 0.098
CSP7 0.1 0.247 0.308
ii) A weighted normalized decision matrix 𝑣𝑖𝑗 = 𝑤𝑗 𝑟𝑖𝑗 is
obtained by multiplying the normalized matrix(𝑟𝑖𝑗 ) with
the weights(𝑤𝑗 ). Although, decision makers can define
weights directly, they can also be obtained from pairwise
comparisons of AHP mechanism. For example, the
weighted normalized decision matrix in Table VIII has
been obtained by multiplying the normalized decision
matrix for Agility shown in Table VII (B) with the
weights computed using AHP shown in Fig 2.
TABLE VIII
WEIGHTED NORMALIZED TABLE FOR AGILITY
VM DC SS
CSP1 0.187 0.061661 0.123
CSP2 0.28 0.061661 0.115
CSP3 0.047 0.16465 0.027
CSP4 0.14 0.16465 0.0738
CSP5 0.28 0.16465 0.036
CSP6 0.047 0.123654 0.0196
CSP7 0.047 0.082325 0.0616
iii) Assuming 𝐽 to be the set of favorable attributes/criteria
and 𝐽' to be the set of negative attributes/criteria, the
positive and the negative ideal solutions 𝐴∗and 𝐴′are
determined by
Positive ideal solution.
𝐴∗ = 𝑣1∗, 𝑣2
∗, … . . , 𝑣𝑛∗ where
𝑣𝑗∗ = max(𝑣𝑖𝑗 ) 𝑖𝑓 𝑗 ∈ 𝐽; min(𝑣𝑖𝑗 ) 𝑖𝑓 𝑗 ∈ 𝐽′
(9)
Negative ideal solution
𝐴′ = 𝑣1′ , 𝑣2
′ , … . . , 𝑣𝑛′ where
𝑣𝑗′ = min(𝑣𝑖𝑗 ) 𝑖𝑓 𝑗 ∈ 𝐽; max(𝑣𝑖𝑗 ) 𝑖𝑓 𝑗 ∈ 𝐽′
(10)
The positive ideal solution computed for Agility is
defined by a high value of VM, DC and SS. These
values are denoted in bold in the respective columns of
Table IX. The negative ideal solution corresponding to
the least values of attributes are denoted in italics.
Engineering Letters, 24:1, EL_24_1_01
(Advance online publication: 29 February 2016)
______________________________________________________________________________________
TABLE IX
POSITIVE AND NEGATIVE IDEAL SOLUTION COMPUTED FOR
AGILITY
VM DC SS
CSP1 0.187 0.061661 0.123
CSP2 0.28 0.061661 0.115
CSP3 0.047 0.16465 0.027
CSP4 0.14 0.16465 0.0738
CSP5 0.28 0.16465 0.036
CSP6 0.047 0.123654 0.0196
CSP7 0.047 0.082325 0.0616
iv) The separations 𝑆𝑖∗ and 𝑆𝑖
′ defined below provide an
estimate of the deviations of each 𝑣𝑖𝑗 from 𝑣𝑗∗ and 𝑣𝑗 ′
respectively and are represented in Tables X and XI.
𝑆𝑖∗ = (𝑣𝑗
∗ − 𝑣𝑖𝑗 )2 𝑤𝑒𝑟𝑒 𝑖 = 1, 2, …𝑚
(11)
𝑆𝑖′ = (𝑣𝑗
′ − 𝑣𝑖𝑗 )2 𝑤𝑒𝑟𝑒 𝑖 = 1, 2, …𝑚
(12)
TABLE X
SEPARATIONS FROM POSITIVE IDEAL SOLUTION FOR AGILITY
VM DC SS 𝑆𝑖
∗
CSP1 0.008712 0.0106069 0 0.139
CSP2 0 0.0106069 6.4E-05 0.103
CSP3 0.054452 0 0.009216 0.252
CSP4 0.019603 0 0.0024206 0.148
CSP5 0 0 0.007569 0.087
CSP6 0.054452 0.0016807 0.0106916 0.259
CSP7 0.054452 0.0067774 0.00377 0.255
TABLE XI
SEPARATIONS FROM NEGATIVE IDEAL SOLUTION FOR AGILITY
VM DC SS 𝑆𝑖
′
CSP1 0.019603 0 0.0106916 0.174
CSP2 0.054452 0 0.0091012 0.252
CSP3 0 0.0106069 5.476E-05 0.103
CSP4 0.008712 0.0106069 0.0029376 0.149
CSP5 0.054452 0.0106069 0.000269 0.256
CSP6 0 0.0038432 0 0.062
CSP7 0 0.000427 0.001764 0.047
v) The above values of 𝑆𝑖∗ and 𝑆𝑖
′ are used to compute the
similarity index 𝐶𝑖∗as follows:
𝐶𝑖∗ =
𝑆𝑖′
(𝑆𝑖∗ + 𝑆𝑖
′) 0 < 𝐶𝑖
∗ < 1
(13)
𝑆𝑖𝑚𝑖𝑙𝑎𝑟𝑖𝑡𝑦 𝐼𝑛𝑑𝑒𝑥 (𝐴𝑔𝑖𝑙𝑖𝑡𝑦)= 0.556 0.71 0.29 0.502 0.746 0.193 0.156
(14)
The higher values of 𝐶𝑖∗correspond to the service
providers rated high in Agility. Similarly, the indices are
obtained for the remaining CSMIC parameters. In iteration
two, steps (i) to (v) are repeated at the higher level of Fig 2
with the inputs listed in Table XII. The weights at this level
are considered (0.259, 0.185, 0.333, 0.111, 0.111) which are
once again taken from the AHP calculation shown in Fig 3.
TABLE XII
RESULTS AFTER FIRST ITERATION OF TOPSIS
Agility Finance Performance Security Usability
CSP1 0.556 0.849 0.74 0.765 0.566
CSP2 0.71 0.587 0.991 0.368 1
CSP3 0.29 0.792 0.596 0.692 0.723
CSP4 0.502 0.526 0.782 0.571 0.617
CSP5 0.746 0.115 0.886 0.563 0.652
CSP6 0.193 0.923 0.628 0.575 0.68
CSP7 0.156 0.692 0.047 0.257 0
The final trust values of the service providers based on
Performance are listed in (15).
𝑇𝑟𝑢𝑠𝑡 𝑣𝑎𝑙𝑢𝑒𝑠 𝑢𝑠𝑖𝑛𝑔 𝑇𝑂𝑃𝑆𝐼𝑆 𝑃𝑒𝑟𝑓𝑜𝑟𝑚𝑎𝑛𝑐𝑒 𝑏𝑎𝑠𝑒𝑑 𝑚𝑜𝑑𝑒𝑙
= 0.61 0.786 0.462 0.668 0.867 0.424 0.094
(15)
VII. FUZZY-TOPSIS BASED RANKING
In Fuzzy-TOPSIS, the iteration at first level uses the
Sugeno FIS to get an estimate of Agility, Finance,
Performance, Security, and Usability, the results of which
are shown in Table V. The second iteration starts from Table
V and repeats the steps (i) to (v) of the TOPSIS method to
get the final trust values. Results so obtained from the
Performance based model are:
𝑇𝑟𝑢𝑠𝑡 𝑣𝑎𝑙𝑢𝑒𝑠 𝑢𝑠𝑖𝑛𝑔 𝐹𝑢𝑧𝑧𝑦− 𝑇𝑂𝑃𝑆𝐼𝑆 𝑃𝑒𝑟𝑓𝑜𝑟𝑚𝑎𝑛𝑐𝑒 𝑏𝑎𝑠𝑒𝑑 𝑚𝑜𝑑𝑒𝑙
= 0.555 0.928 0.321 0.679 0.899 0.3 0.225
(16)
VIII. COMPARISON OF TOPSIS AND FUZZY TOPSIS
METHODS
The trust estimates obtained from the TOPSIS and Fuzzy-
TOPSIS methods are given in (15) and (16) respectively.
For a Performance based model, TOPSIS rates CSP5, CSP2
and CSP4 as the top three service providers, while the
ranking obtained using the Fuzzy-TOPSIS method is
CSP2>CSP5>CSP4. A direct comparison of the
Performance attributes of all the service providers from
Tables I and II indicates the same as in the above ranking.
Though, top three ranking of the service providers is
preserved in both the methods, there is a deviation observed
between the ranking of CSP2 and CSP5. TOPSIS ranks
CSP5 better than CSP2, but as in case of AHP and Fuzzy-
Engineering Letters, 24:1, EL_24_1_01
(Advance online publication: 29 February 2016)
______________________________________________________________________________________
AHP, a closer look at the Performance related attributes
clarifies that the ranking of CSP2 should have been better
than CSP5, which is captured by the Fuzzy-TOPSIS
method.
IX. PERFORMANCE EVALUATION OF MCDM
METHODS
The trust estimates for the Performance based model
listed in Table XIII, obtained from the four MCDM
methods, namely; AHP, Fuzzy-AHP, TOPSIS, and Fuzzy-
TOPSIS are now analyzed for their consistency, sensitivity,
complexity and reduction in dimension of service providers
[20].
TABLE XIII
RESULTS OF PERFORMANCE BASED MODEL
AHP Fuzzy-AHP TOPSIS Fuzzy-TOPSIS
CSP1 0.1238 0.1522 0.61 0.555
CSP2 0.1799 0.1889 0.786 0.928
CSP3 0.1035 0.1287 0.462 0.321
CSP4 0.1441 0.1752 0.668 0.679
CSP5 0.1952 0.1836 0.867 0.899
CSP6 0.0749 0.1269 0.424 0.3
CSP7 0.178 0.0433 0.094 0.225
Consistency: Consistency, in our context, means
obtaining a trust estimate for infrastructure facilities
which is inline with the input parameters listed in
Tables I and II. As per the attribute values listed in the
above tables, CSP2 should have a larger trust value than
CSP5 for Performance based trust estimation. This
ranking is captured precisely by the Fuzzy AHP and
Fuzzy TOPSIS methods as seen in Table XIII whereas
in the other two methods, rank reversal is observed.
Thus, combining Fuzzy inference with MCDM helps to
achieve consistency.
Sensitivity: Sensitivity is analyzed by observing the
change in trust value brought out by a small change in
the Performance attributes in Table I. This is achieved
by changing the Number of Processors (NP) of CSP4
from 6 to 9. The modified trust estimates for various
CSPs are now listed in Table XIV.
TABLE XIV
SENSITIVITY OF PERFORMANCE BASED MODEL
AHP Fuzzy-AHP TOPSIS Fuzzy-TOPSIS
CSP1 0.1225 0.1508 0.609 0.556
CSP2 0.1779 0.1862 0.784 0.927
CSP3 0.1032 0.1279 0.463 0.323
CSP4 0.1504 0.1825 0.693 0.75
CSP5 0.1935 0.1813 0.866 0.901
CSP6 0.0745 0.1262 0.426 0.302
CSP7 0.1776 0.0433 0.095 0.229
The trust values of CSP4 here show a nominal increase
from its trust values listed in Table XIII. This increase
in the trust value substantially modifies the trust values
of the competing CSPs. Thus, all the methods respond
well to small changes in input.
Complexity: The AHP mechanism uses the power
iteration for computation of eigenvalues which is of
order O(n3), where n is the number of service providers.
Computation cost here increases with the number of
service providers as also the number of attributes.
Another disadvantage of this method is that, addition or
removal of any attribute, calls for repetition of the entire
computation from the leaf level.
The Fuzzy-AHP method brings down the complexity of
AHP by replacing the iteration at leaf level with the
FIS. The FIS considered here uses a maximum of 125
rules, for each parameter estimation, which takes linear
time compared to the AHP computation at leaf level.
TOPSIS updates the matrix entries and has a
computational complexity of n x p where n is the
number of service providers and p is the number of
attributes applicable to each level. Once again, Fuzzy-
TOPSIS brings down the number of computations at the
leaf level.
Thus, parameter estimation using FIS helps in
improving the computational efficiency.
Reduction in dimension of service providers: Any
decision making method is expected to preserve the
ranking when the number of alternatives is increased or
decreased. To test this, the trust estimates obtained in
Table XIII for seven providers were compared with
trust estimates for fourteen service providers [21] using
all the MCDM methods. The seven providers
considered in this study are the subset of the fourteen
providers [21]. The trust estimates for the fourteen
CSPs obtained from all MCDM methods are listed in
Table XV.
TABLE XV
RESULTS OF FOURTEEN SERVICE PROVIDERS –
PERFORMANCE BASED MODEL
AHP Fuzzy-AHP TOPSIS Fuzzy-TOPSIS
CSP1 0.0662 0.0753 0.615 0.555
CSP2 0.0997 0.0938 0.784 0.935
CSP3 0.0597 0.0634 0.459 0.321
CSP4 0.0805 0.087 0.655 0.678
CSP5 0.1112 0.091 0.871 0.898
CSP6 0.0399 0.0625 0.423 0.303
CSP7 0.1185 0.0213 0.079 0.213
CSP8 0.0494 0.061 0.469 0.436
CSP9 0.0703 0.0813 0.611 0.73
CSP10 0.0618 0.0676 0.544 0.467
CSP11 0.045 0.0708 0.456 0.386
CSP12 0.0523 0.0811 0.505 0.503
CSP13 0.0669 0.0644 0.556 0.56
CSP14 0.0523 0.0786 0.669 0.699
Engineering Letters, 24:1, EL_24_1_01
(Advance online publication: 29 February 2016)
______________________________________________________________________________________
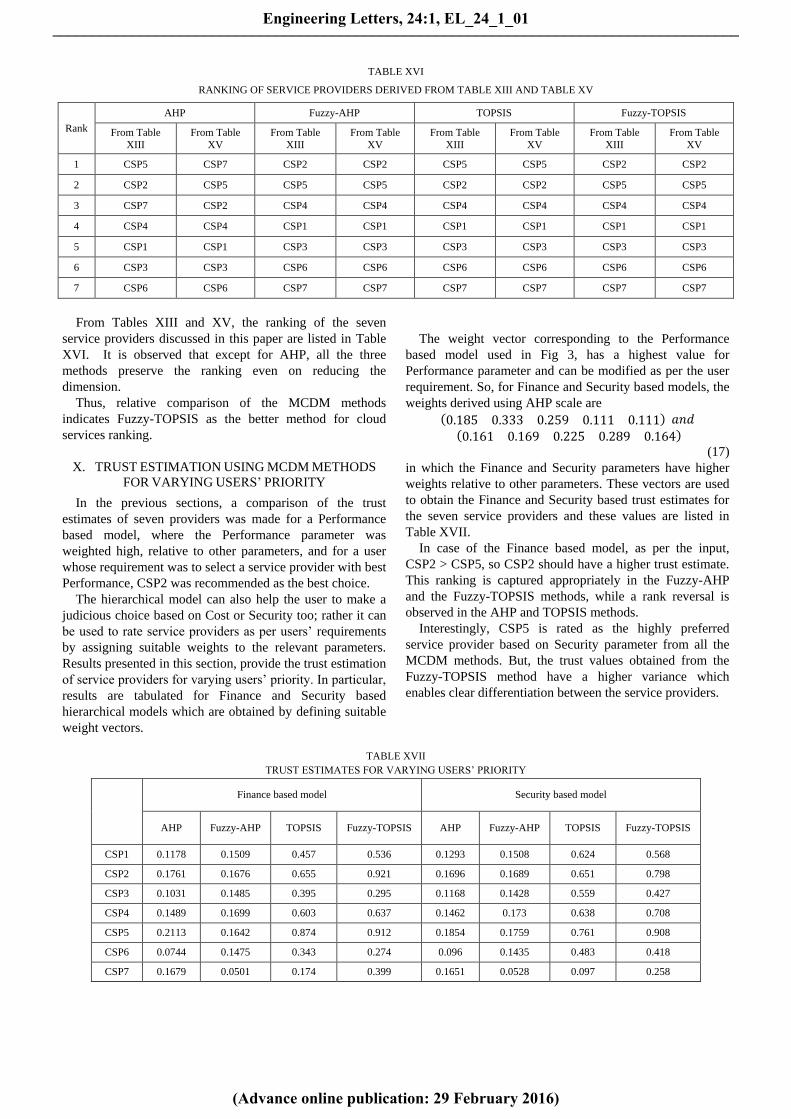
TABLE XVI
RANKING OF SERVICE PROVIDERS DERIVED FROM TABLE XIII AND TABLE XV
Rank
AHP Fuzzy-AHP TOPSIS Fuzzy-TOPSIS
From Table
XIII
From Table
XV
From Table
XIII
From Table
XV
From Table
XIII
From Table
XV
From Table
XIII
From Table
XV
1 CSP5 CSP7 CSP2 CSP2 CSP5 CSP5 CSP2 CSP2
2 CSP2 CSP5 CSP5 CSP5 CSP2 CSP2 CSP5 CSP5
3 CSP7 CSP2 CSP4 CSP4 CSP4 CSP4 CSP4 CSP4
4 CSP4 CSP4 CSP1 CSP1 CSP1 CSP1 CSP1 CSP1
5 CSP1 CSP1 CSP3 CSP3 CSP3 CSP3 CSP3 CSP3
6 CSP3 CSP3 CSP6 CSP6 CSP6 CSP6 CSP6 CSP6
7 CSP6 CSP6 CSP7 CSP7 CSP7 CSP7 CSP7 CSP7
From Tables XIII and XV, the ranking of the seven
service providers discussed in this paper are listed in Table
XVI. It is observed that except for AHP, all the three
methods preserve the ranking even on reducing the
dimension.
Thus, relative comparison of the MCDM methods
indicates Fuzzy-TOPSIS as the better method for cloud
services ranking.
X. TRUST ESTIMATION USING MCDM METHODS
FOR VARYING USERS’ PRIORITY
In the previous sections, a comparison of the trust
estimates of seven providers was made for a Performance
based model, where the Performance parameter was
weighted high, relative to other parameters, and for a user
whose requirement was to select a service provider with best
Performance, CSP2 was recommended as the best choice.
The hierarchical model can also help the user to make a
judicious choice based on Cost or Security too; rather it can
be used to rate service providers as per users’ requirements
by assigning suitable weights to the relevant parameters.
Results presented in this section, provide the trust estimation
of service providers for varying users’ priority. In particular,
results are tabulated for Finance and Security based
hierarchical models which are obtained by defining suitable
weight vectors.
The weight vector corresponding to the Performance
based model used in Fig 3, has a highest value for
Performance parameter and can be modified as per the user
requirement. So, for Finance and Security based models, the
weights derived using AHP scale are
0.185 0.333 0.259 0.111 0.111 𝑎𝑛𝑑
0.161 0.169 0.225 0.289 0.164
(17)
in which the Finance and Security parameters have higher
weights relative to other parameters. These vectors are used
to obtain the Finance and Security based trust estimates for
the seven service providers and these values are listed in
Table XVII.
In case of the Finance based model, as per the input,
CSP2 > CSP5, so CSP2 should have a higher trust estimate.
This ranking is captured appropriately in the Fuzzy-AHP
and the Fuzzy-TOPSIS methods, while a rank reversal is
observed in the AHP and TOPSIS methods.
Interestingly, CSP5 is rated as the highly preferred
service provider based on Security parameter from all the
MCDM methods. But, the trust values obtained from the
Fuzzy-TOPSIS method have a higher variance which
enables clear differentiation between the service providers.
TABLE XVII
TRUST ESTIMATES FOR VARYING USERS’ PRIORITY
Finance based model Security based model
AHP Fuzzy-AHP TOPSIS Fuzzy-TOPSIS AHP Fuzzy-AHP TOPSIS Fuzzy-TOPSIS
CSP1 0.1178 0.1509 0.457 0.536 0.1293 0.1508 0.624 0.568
CSP2 0.1761 0.1676 0.655 0.921 0.1696 0.1689 0.651 0.798
CSP3 0.1031 0.1485 0.395 0.295 0.1168 0.1428 0.559 0.427
CSP4 0.1489 0.1699 0.603 0.637 0.1462 0.173 0.638 0.708
CSP5 0.2113 0.1642 0.874 0.912 0.1854 0.1759 0.761 0.908
CSP6 0.0744 0.1475 0.343 0.274 0.096 0.1435 0.483 0.418
CSP7 0.1679 0.0501 0.174 0.399 0.1651 0.0528 0.097 0.258
Engineering Letters, 24:1, EL_24_1_01
(Advance online publication: 29 February 2016)
______________________________________________________________________________________
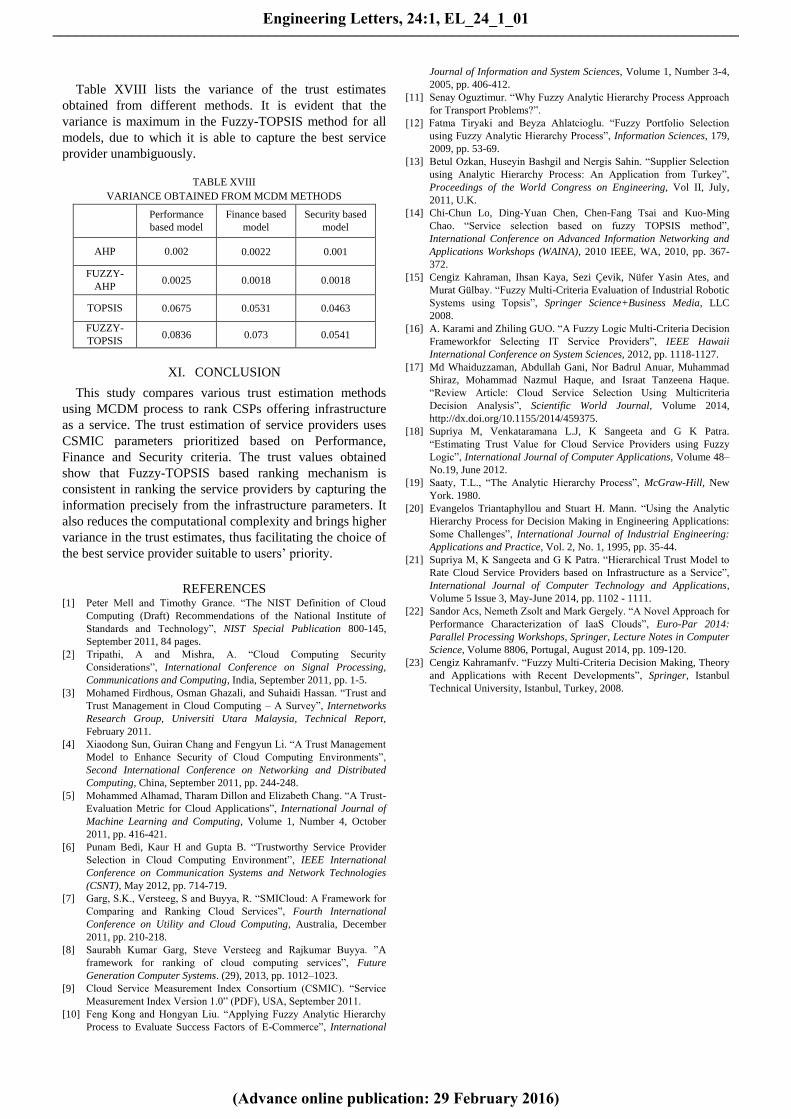
Table XVIII lists the variance of the trust estimates
obtained from different methods. It is evident that the
variance is maximum in the Fuzzy-TOPSIS method for all
models, due to which it is able to capture the best service
provider unambiguously.
TABLE XVIII
VARIANCE OBTAINED FROM MCDM METHODS
Performance
based model
Finance based
model
Security based
model
AHP 0.002 0.0022 0.001
FUZZY-
AHP 0.0025 0.0018 0.0018
TOPSIS 0.0675 0.0531 0.0463
FUZZY-
TOPSIS 0.0836 0.073 0.0541
XI. CONCLUSION
This study compares various trust estimation methods
using MCDM process to rank CSPs offering infrastructure
as a service. The trust estimation of service providers uses
CSMIC parameters prioritized based on Performance,
Finance and Security criteria. The trust values obtained
show that Fuzzy-TOPSIS based ranking mechanism is
consistent in ranking the service providers by capturing the
information precisely from the infrastructure parameters. It
also reduces the computational complexity and brings higher
variance in the trust estimates, thus facilitating the choice of
the best service provider suitable to users’ priority.
REFERENCES
[1] Peter Mell and Timothy Grance. “The NIST Definition of Cloud
Computing (Draft) Recommendations of the National Institute of
Standards and Technology”, NIST Special Publication 800-145,
September 2011, 84 pages.
[2] Tripathi, A and Mishra, A. “Cloud Computing Security
Considerations”, International Conference on Signal Processing,
Communications and Computing, India, September 2011, pp. 1-5.
[3] Mohamed Firdhous, Osman Ghazali, and Suhaidi Hassan. “Trust and
Trust Management in Cloud Computing – A Survey”, Internetworks
Research Group, Universiti Utara Malaysia, Technical Report,
February 2011.
[4] Xiaodong Sun, Guiran Chang and Fengyun Li. “A Trust Management
Model to Enhance Security of Cloud Computing Environments”,
Second International Conference on Networking and Distributed
Computing, China, September 2011, pp. 244-248.
[5] Mohammed Alhamad, Tharam Dillon and Elizabeth Chang. “A Trust-
Evaluation Metric for Cloud Applications”, International Journal of
Machine Learning and Computing, Volume 1, Number 4, October
2011, pp. 416-421.
[6] Punam Bedi, Kaur H and Gupta B. “Trustworthy Service Provider
Selection in Cloud Computing Environment”, IEEE International
Conference on Communication Systems and Network Technologies
(CSNT), May 2012, pp. 714-719.
[7] Garg, S.K., Versteeg, S and Buyya, R. “SMICloud: A Framework for
Comparing and Ranking Cloud Services”, Fourth International
Conference on Utility and Cloud Computing, Australia, December
2011, pp. 210-218.
[8] Saurabh Kumar Garg, Steve Versteeg and Rajkumar Buyya. ”A
framework for ranking of cloud computing services”, Future
Generation Computer Systems. (29), 2013, pp. 1012–1023.
[9] Cloud Service Measurement Index Consortium (CSMIC). “Service
Measurement Index Version 1.0” (PDF), USA, September 2011.
[10] Feng Kong and Hongyan Liu. “Applying Fuzzy Analytic Hierarchy
Process to Evaluate Success Factors of E-Commerce”, International
Journal of Information and System Sciences, Volume 1, Number 3-4,
2005, pp. 406-412.
[11] Senay Oguztimur. “Why Fuzzy Analytic Hierarchy Process Approach
for Transport Problems?”.
[12] Fatma Tiryaki and Beyza Ahlatcioglu. “Fuzzy Portfolio Selection
using Fuzzy Analytic Hierarchy Process”, Information Sciences, 179,
2009, pp. 53-69.
[13] Betul Ozkan, Huseyin Bashgil and Nergis Sahin. “Supplier Selection
using Analytic Hierarchy Process: An Application from Turkey”,
Proceedings of the World Congress on Engineering, Vol II, July,
2011, U.K.
[14] Chi-Chun Lo, Ding-Yuan Chen, Chen-Fang Tsai and Kuo-Ming
Chao. “Service selection based on fuzzy TOPSIS method”,
International Conference on Advanced Information Networking and
Applications Workshops (WAINA), 2010 IEEE, WA, 2010, pp. 367-
372.
[15] Cengiz Kahraman, Ihsan Kaya, Sezi Çevik, Nüfer Yasin Ates, and
Murat Gülbay. “Fuzzy Multi-Criteria Evaluation of Industrial Robotic
Systems using Topsis”, Springer Science+Business Media, LLC
2008.
[16] A. Karami and Zhiling GUO. “A Fuzzy Logic Multi-Criteria Decision
Frameworkfor Selecting IT Service Providers”, IEEE Hawaii
International Conference on System Sciences, 2012, pp. 1118-1127.
[17] Md Whaiduzzaman, Abdullah Gani, Nor Badrul Anuar, Muhammad
Shiraz, Mohammad Nazmul Haque, and Israat Tanzeena Haque.
“Review Article: Cloud Service Selection Using Multicriteria
Decision Analysis”, Scientific World Journal, Volume 2014,
http://dx.doi.org/10.1155/2014/459375.
[18] Supriya M, Venkataramana L.J, K Sangeeta and G K Patra.
“Estimating Trust Value for Cloud Service Providers using Fuzzy
Logic”, International Journal of Computer Applications, Volume 48–
No.19, June 2012.
[19] Saaty, T.L., “The Analytic Hierarchy Process”, McGraw-Hill, New
York. 1980.
[20] Evangelos Triantaphyllou and Stuart H. Mann. “Using the Analytic
Hierarchy Process for Decision Making in Engineering Applications:
Some Challenges”, International Journal of Industrial Engineering:
Applications and Practice, Vol. 2, No. 1, 1995, pp. 35-44.
[21] Supriya M, K Sangeeta and G K Patra. “Hierarchical Trust Model to
Rate Cloud Service Providers based on Infrastructure as a Service”,
International Journal of Computer Technology and Applications,
Volume 5 Issue 3, May-June 2014, pp. 1102 - 1111.
[22] Sandor Acs, Nemeth Zsolt and Mark Gergely. “A Novel Approach for
Performance Characterization of IaaS Clouds”, Euro-Par 2014:
Parallel Processing Workshops, Springer, Lecture Notes in Computer
Science, Volume 8806, Portugal, August 2014, pp. 109-120.
[23] Cengiz Kahramanfv. “Fuzzy Multi-Criteria Decision Making, Theory
and Applications with Recent Developments”, Springer, Istanbul
Technical University, Istanbul, Turkey, 2008.
Engineering Letters, 24:1, EL_24_1_01
(Advance online publication: 29 February 2016)
______________________________________________________________________________________