Embed Size (px)
Citation preview
TROPHIC INTERACTIONS ASSOCIATED WITH INTRODUCTION
OF THE INVASIVE QUAGGA MUSSEL
IN LAKE MEAD, NEVADA
by
Eric Michael Loomis
Bachelor of Arts University of Nevada, Las Vegas
2003
A thesis submitted in partial fulfillment of the requirements for the
Master of Public Health Degree in the School of Community Health Sciences Department of Environmental and Occupational Health
School of Community Health Sciences
Graduate College University of Nevada, Las Vegas
May 2009
ABSTRACT
Trophic Interactions Associated with Introduction of the Invasive Quagga Mussel
in Lake Mead, Nevada
by
Eric Michael Loomis
Dr. Shawn Gerstenberger, Examination Committee Chair Chair and Associate Professor of Public Health
University of Nevada, Las Vegas
The ecology of Lake Mead is experiencing an uncertain future since the documented
arrival of the invasive quagga mussel. Interactions among constituents of the food web
will undoubtedly be altered over time, adversely affecting the popular sport fishery. This
study is the first in Lake Mead to present historic trends in lower trophic interactions
among threadfin shad and zooplankton before, and shortly after, the arrival of quagga
mussels. Shad stomach content analysis revealed cladocerans and copepods were the
dominant identifiable food items in Las Vegas Bay and Overton Arm of Lake Mead.
Baseline energetics data through the use of stable isotope analysis showed little variation
in δ13C among larval and adult shad since quaggas were discovered. Fluctuations in δ15N
were more variable over the same span, with 2008 showing highest nitrogen
measurements. Historic relative shad abundance and zooplankton biomass data were
gathered from multiple agencies for the purpose of comparative analysis. This project
was funded by the National Park Service and is part of a long-term monitoring plan in
response to quagga mussel influences in the Lake Mead watershed over time.
iii
TABLE OF CONTENTS
ABSTRACT....................................................................................................................... iii
LIST OF FIGURES ............................................................................................................ v
ACKNOWLEDGMENTS ................................................................................................. vi
CHAPTER 1 INTRODUCTION ..................................................................................... 1 Purpose of the Study ..................................................................................................... 3 Research Questions....................................................................................................... 3 Significance of the Study .............................................................................................. 4
CHAPTER 2 REVIEW OF RELATED LITERATURE................................................. 5 Quagga Mussels ............................................................................................................ 5 Lake Mead Energetics................................................................................................. 11 Threadfin Shad............................................................................................................ 17 Hypotheses.................................................................................................................. 19 CHAPTER 3 METHODOLOGY .................................................................................. 21 Collection of Data ....................................................................................................... 21 Treatment of Data ....................................................................................................... 26 CHAPTER 4 RESULTS................................................................................................ 28 Stomach Contents Analysis ........................................................................................ 28 Stable Isotope Analysis............................................................................................... 31 Trend Analysis ............................................................................................................ 34 CHAPTER 5 SUMMARY, CONCLUSIONS, AND RECOMMENDATIONS .......... 39 Discussion of Results.................................................................................................. 39 Public Health Considerations...................................................................................... 42 Conclusions and Recommendations for Further Study .............................................. 43
REFERENCES ................................................................................................................. 50
VITA................................................................................................................................. 56
iv
LIST OF FIGURES
Figure 1 Boulder Basin, Lake Mead .............................................................................. 8 Figure 2 Zooplankton Density in Boulder Basin, Lake Mead (LVB6.7), April 2000 to October 2007................................................................................................... 12 Figure 3 Zooplankton and Quagga Veliger Densities, January 2007 to October 2007 13 Figure 4 Zooplankton and Veliger Abundance on Eastern Side of Boulder Basin, Lake Mead (CR351.7) Colorado River Inflow, June 2004 to October, 2007.......... 14 Figure 5 NDOW Shad Trawl Sampling Locations in Las Vegas Bay and Overton Arm, Lake Mead since 1988 .................................................................................... 23 Figure 6 δ13C and δ15N comparative means for adult threadfin shad sampled from Las Vegas Bay, 2007-2009............................................................................. 31 Figure 7 δ13C and δ15N comparative means for adult threadfin shad sampled from Overton Arm, 2007-2009................................................................................ 32 Figure 8 Mean Shad/100m3 from Las Vegas Bay Trawls, 1988-2008 ......................... 34 Figure 9 Mean Shad/100m3 from Overton Arm Trawls, 1988-2008............................ 35 Figure 10 Percentage Biomass Comparison with Annual June Shad Trawls, Inner Las Vegas Bay, 2000-2008.................................................................................... 36 Figure 11 Percentage Biomass Comparison with Annual June Shad Trawls, Boulder Basin, Las Vegas Bay, 2000-2008.................................................................. 37
v

vi
ACKNOWLEDGMENTS
This research was funded by the Great Basin Cooperative Ecosystem Studies Unit,
Task Agreement No. J8360080237 National Park Service in cooperation with the
University of Nevada, Las Vegas and supported by multiple agencies including Nevada
Department of Wildlife and the Southern Nevada Water Authority. Without the help of
these agencies, this project would not have been possible. I would also like to thank
individually those who aided in data collection and making my job much easier.
Nicholas Rice, Alan Sims, Todd Tietjen, and Warren Turkett from the Southern Nevada
Water Authority; Jon Sjöberg, Mike Burrell, and Mark Beckstrand from the Nevada
Department of Wildlife; Ron Kegerries from Bio-West, Inc., Logan, Utah; and Dr. John
Beaver, BSA Environmental Services, Inc., Beachwood, Ohio. Stable isotope analysis
could not have been performed without help from Dr. Sudeep Chandra and John Umek
from the University of Nevada, Reno. Finally, I would like to thank my committee
members from the University of Nevada, Las Vegas—Shawn Gerstenberger, David
Wong, Chad Cross, and Helen Neill for their invaluable guidance and feedback. Last but
not least, I would like to posthumously thank Dr. James F. LaBounty, who I credit with
inspiring this research and for his enthusiasm in seeing it carried on in the future.
CHAPTER 1
INTRODUCTION
The Lake Mead watershed has long provided valuable resources for not only the ever-
growing population of the Las Vegas metropolitan area, but also to regions throughout
the western United States. As the primary drinking water source for millions of people
and a popular recreational area, Lake Mead is integral for a wide variety of human needs.
It has been well documented that Lake Mead in the past decade has experienced the
adverse affects of drought enveloping the Mojave Desert. Lake levels have dropped
dramatically, threatening the water supply to a burgeoning human population. Moreover,
the immense cost associated with constructing new delivery systems and the search for
alternate drinking water resources puts a strain on the region’s economy.
In addition to its value to the human population, Lake Mead has historically exhibited
an aquatic ecological community conducive to supporting a world-class striped bass
(Morone saxatilis) fishery. Vital to the success of any fishery is the complex interactions
among various species in the aquatic ecosystem. Food chain dynamics are an essential
element when considering the overall health of the fishery. A significant ecological
disturbance has the potential to reduce resiliency in the system, leading to detrimental and
irreversible damage to the aquatic environment.
The recent discovery of the invasive quagga mussel (Dreissena bugensis) has
provided a new challenge to scientific research in the Lake Mead watershed. First
1
discovered in January 2007 in Boulder Basin of Lake Mead, quagga mussels have
established in great numbers over a short time period (LaBounty & Roefer, 2007).
Suspected to have reached Lake Mead from the Great Lakes from recreational boats over
land, LaBounty & Roefer (2007) conclude the main invasion probably occurred in 2004
or possibly 2003.
The biological mechanisms of quaggas alter the food web in a number of ways. They
are highly efficient water filterers, removing substantial amounts of phytoplankton, which
in turn decrease the food source for zooplankton (Claxton et al., 1998). The potential
impacts quagga mussels pose to the Lake Mead fishery are largely unknown at the
present time. An implication of the potential decline in the zooplankton community
which drives energetics is a growing concern. Extensive research in the Great Lakes
region where both quaggas and the closely related zebra mussel has affected trophic
dynamics may not adequately address the unique limnology of the arid southwest in
relation to genetic adaptation. The quagga’s ability to adapt to warmer climates and
differences in food availability may prove irrelevant in relation to the Great Lakes.
In addition to changes in food webs, Snyder et al. (1997) found that the closely
related zebra mussel (Dreissena polymorpha) produce a by-product known as
pseudofeces that when decomposed create a threat to water quality at exponential levels
relative to size. Moreover, organic pollutants created by pseudofeces can be readily
passed up the food chain and consequently into wildlife communities. The question of
pollutants and contaminants being introduced in Lake Mead due to the exotic quagga has
the potential to adversely affect human health. The ability for these mussels to
2

biomagnify pollutants through the food web and the possibility of undesirable algal
blooms should be a concern for recreation in areas where quaggas are abundant.
Purpose of the Study
The purpose of this study is to determine a possible shift in food preference among
lower trophic level species of fish, specifically threadfin shad (Dorosoma petenense),
since the introduction of the invasive quagga mussel into Lake Mead. Since the
introduction of quaggas is a relatively recent phenomenon, it is important to distinguish a
potential alteration in diet caused by this highly invasive species of bivalve. Due to the
lack of published historical count data from Lake Mead regarding threadfin shad in the
scientific literature, this study will also attempt to document past trends with more recent
data since the arrival of quaggas in the watershed.
The objectives of this study are to identify the foraging habits of threadfin shad in
sampled locations in Lake Mead since the introduction of quagga mussels. Moreover,
this paper evaluates population parameters of threadfin shad in specific areas of Lake
Mead to determine if quaggas are a significant influence. Finally, this project serves as a
baseline for further study into trophic energetics associated with the quagga mussel and
attempts to glean insight into the sustainability of the Lake Mead fishery.
Research Questions
With the introduction of any exotic species into an ecosystem, uncertainty abounds.
Questions this research attempts to answer include: Are threadfin shad utilizing quagga
veligers as part of their diet and if so; are they a viable food source? By examining
3

stomach contents of the primary forage fish in Lake Mead, the question of what food
items are available since quagga mussels arrived will attempt to be answered. Since this
study examines larval, as well as adult threadfin shad, identifying if there is a particular
size-class of shad that forages more effectively on quagga veligers is analyzed. Are their
seasonal or water quality components involved in abundance of veligers causing adverse
food web dynamics? The ecological conditions present in Lake Mead appear to be
markedly different than from other water bodies where quagga mussels have been known
to disrupt aquatic food webs. By analyzing original data gathered over the past several
years, fisheries managers will hopefully be able to answer the question of whether quagga
mussels have had an adverse affect on the sport fishery throughout portions of Lake
Mead.
Significance of the Study
If the primary food source supplying game fish is compromised—threadfin shad, the
potential for mitigation measures may need to be addressed to sustain this valuable
resource. A decline in zooplankton over time could result in a crash of shad populations
where quagga mussels are ubiquitous. Such changes are of concern due to food web
perturbations which could diminish equilibrium in the aquatic community. In addition,
not only is the sport fishery in peril of exotic introductions. The impact to the
endangered razorback sucker (Xyrauchan texanus) is of concern due to its specific habitat
requirements in this ecosystem.
4
CHAPTER 2
REVIEW OF RELATED LITERATURE
Quagga Mussels
The quagga mussel (Dreissena bugensis) and its close relative zebra mussel
(Dreissena polymorpha) are native to the Dnieper River drainage in the Ukraine (Mills et
al., 1996). Subtle morphological differences characterize D. bugensis from D.
polymorpha in both larval and adult stages, most notably in the degree of roundness in
shell shape, size, and color patterns (Mills et al., 1993). Extensive research has revealed
that the genus Dreissena is highly polymorphic and is capable of producing millions of
larvae (veligers). Furthermore, after a few generations rare alleles may increase greatly
in frequency, leading to the adaptation to new environmental conditions after several
generations (Mills et al., 1996). Ecological investigation concluded that quagga and
zebra mussels rarely, if ever, overlap completely in the aquatic environment, owing to
differences in life history parameters and explaining why the two species have different
ranges (May & Marsden, 1992).
Spatial distribution in the water column varies greatly depending on geographic
variability. Shevtsova (1968) observed in the Dnieper River drainage that with
increasing water temperatures from north to south there was a higher occurrence of D.
bugensis. In contrast, quaggas were initially found in deeper, colder waters of the Great
Lakes (Mills et al., 1993). Based on contrast in temperature tolerance, it was later
5

hypothesized that D. bugensis was not limited to deep water habitats and could inhabit a
wider range of depths in North American waters (Mills et al., 1996).
Invasive Status
Great Lakes. Although difficult to determine with certainty, it is suspected that the
quagga mussel first arrived in September 1989 in Lake Erie from ship ballast water
originating from Eastern Europe. Among settled Dreissena species at this site, the
quagga mussel population gradually increased from 2.3% during 1990 to 6.6% by
October 1992 (Mills et al., 1993). Other researchers have speculated that the zebra
mussel pre-dated quagga in the Great Lakes region based on its limited distribution upon
arrival (May & Marsden, 1992). Genetic analysis confirmed that D. bugensis has two
distinct phenotypes in the Great Lakes which suggests there is considerable plasticity in
morphology and physiology within the species (Spidle et al., 1994). Verification that
there is more than one extant species increases the taxonomic resolution of the genus, as
concluded by Spidle et al. (1994).
There has been ongoing controversy among the scientific community surrounding the
ecological impact dreissenid mussels have had since their introduction into the Great
Lakes. It was postulated by Mills et al. (1993) that colonization by quaggas could
provide a viable food source from the pseudofeces they produce. Moreover, the refugia
provided amongst mussel colonies for macroinvertebrates such as Mysis and Diporei
would facilitate important food sources for planktiverous fish like alewife (Alosa
pseudoharengus), which in turn are significant food items for salmonids. This
prognostication has been partially supported by a study conducted by Pothoven & Nalepa
(2006) which found that large Lake Huron whitefish (Coregonus clupeaformis) prey
6
heavily on quaggas, accounting for 54% of the diet. The consequences of this diet shift
may be cyclical in nature. In the short-term, however, commercial success of the lake
whitefish fishery appears to be thriving. More recently, the Great Lakes Science Center
has concluded that dreissenids have had a positive impact on parts of the Great Lakes
ecosystem, providing native wildlife ample zebra mussels to prey upon (USGS, 2008).
Due to the quagga’s highly efficient ability to filter water in mass quantities, it has been
intentionally stocked in lakes in the Netherlands as a management tool to remedy poor
water quality (Reeders & Bij de Vaate, 1990).
In contrast to the apparent benefits the introduced dreissenids provide in the Great
Lakes ecosystem are potential human health ramifications. The ability of the zebra
mussel to biomagnify metal and organochlorine contaminants may serve as an efficient
method to transfer contaminants to higher trophic levels (Mersch & Pihan, 1993). In
addition, cyanobacteria blooms in Great Lakes basins supporting large mussel
populations have been reported, further placing the public at risk in recreational areas
(MacIsaac, 1996). Researchers admitting to benefits from dreissenid presence in some
situations also realize the potential deleterious effects in regards to the suppression of
zooplankton, a vital food source throughout the trophic ladder (Dermott & Munawar,
1993; MacIsaac, 1996; Mills et al., 1996; Mills et al., 1993).
The amount of uncertainty exhibited by the presence of D. bugensis and D.
polymorpha in the Great Lakes is complex. Invasion success in this region has been
thoroughly scrutinized with debate as to the apparent costs and benefits the mussels
contribute to the ecosystem as a whole. How does research conducted in the Great Lakes
7
apply to the recent invasion of quaggas to Lake Mead and what amount of variability
exists between these distinct watersheds?
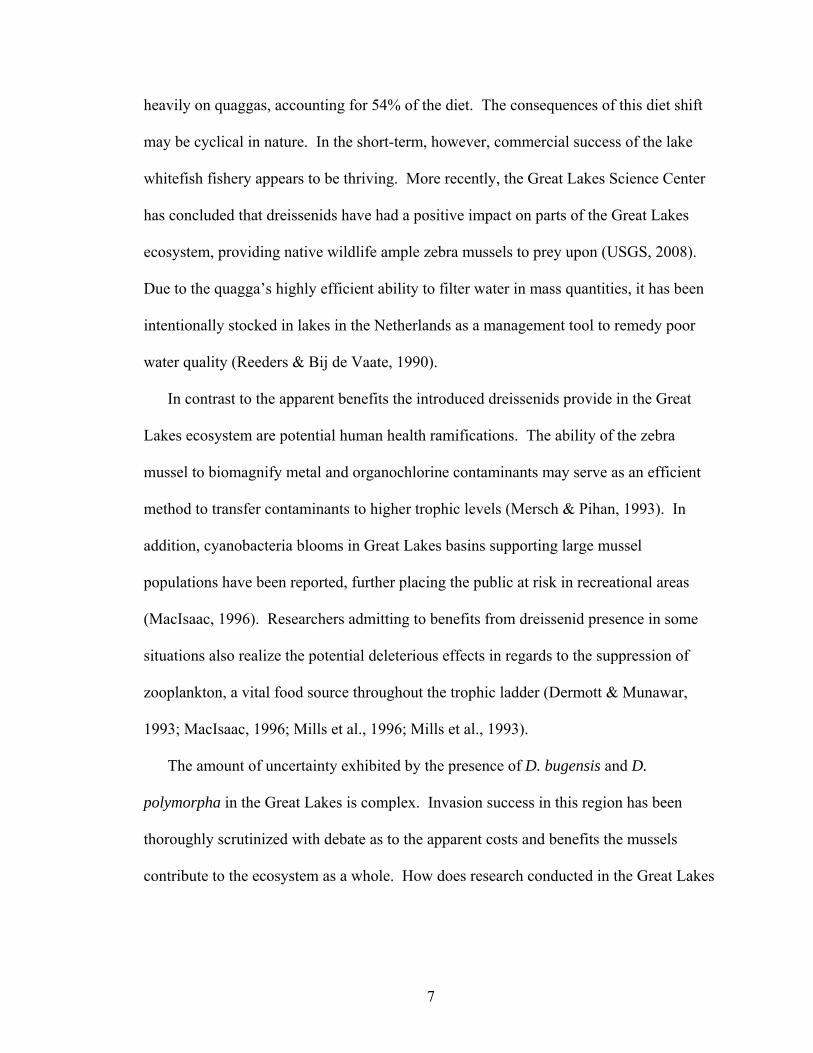
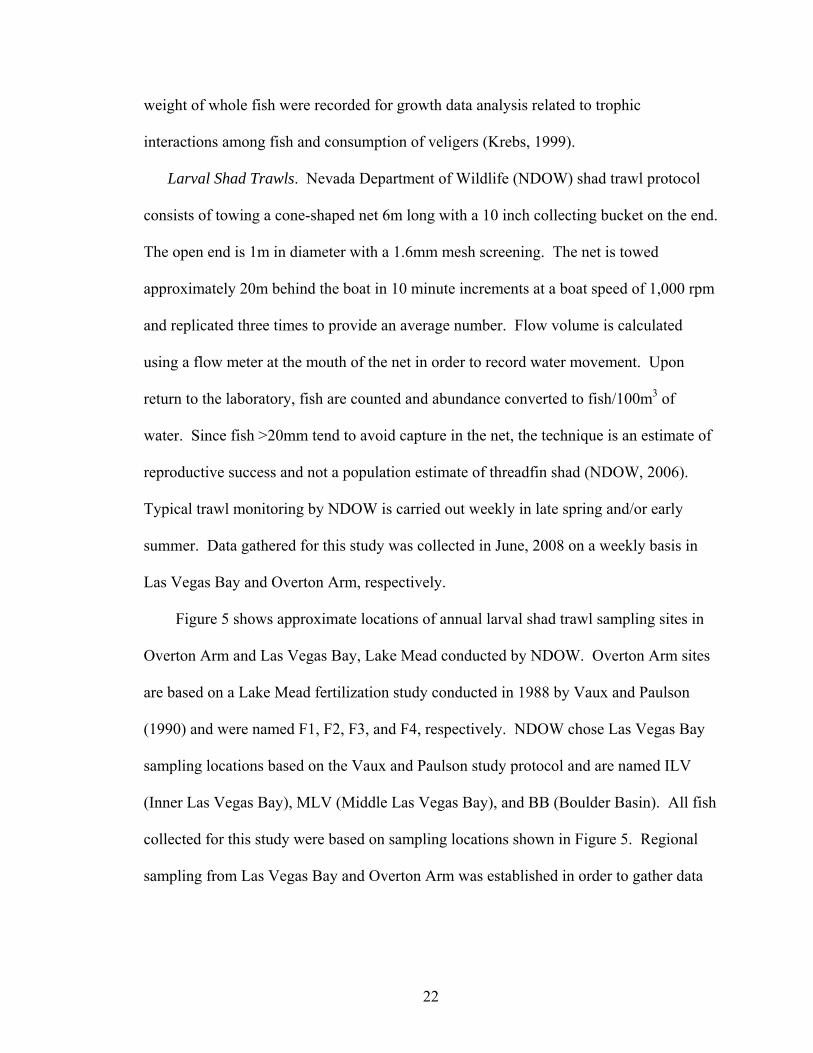
Lake Mead. The first documented discovery of quagga mussels in the western United
States occurred in January 2007 in Boulder Basin, Lake Mead (Figure 1), presumably
from recreational boats brought overland from the Great Lakes (LaBounty & Roefer,
2007). Since the invasion sometime during 2003 or 2004 into Callville Bay (Dr.
Figure1. Boulder Basin, Lake Mead.
James LaBounty, personal communication) quagga larvae, or veligers, have multiplied
exponentially based on preliminary water quality data analyzed by the Southern Nevada
Water Authority (SNWA). At present very little data exists as to the impact quaggas
8

have had in and around the Lake Mead watershed, especially in regards to ecological
impacts associated with trophic level dynamics.
Concentrations of quagga mussel veligers in Boulder Basin increased dramatically
from 0.6/L from late February to late March to 126/L by July near Hoover Dam
(LaBounty & Roefer, 2007). Water sample data collected as late as fall 2007 showed that
veligers made up nearly 40% of zooplankton in the upper 5m of Boulder Basin. Prior to
March 2007, no veligers were found in zooplankton samples taken from this location
(John Beaver, BSA Environmental Services, Inc., Beachwood, Ohio).
Since the initial arrival of quaggas to Lake Mead, they have spread to various aquatic
ecosystems throughout the southwest. In the Hoover Dam area of Black Canyon,
quaggas reached highest densities in July 2007 (LaBounty & Roefer, 2007). Depth
distribution ranged from the surface to >150 ft, with the highest densites observed at 25-
35 ft. The dynamic distribution of quaggas in Lake Mead and their propensity to thrive
in a new environment poses a challenge to researchers in attempting to control the
invasion.
Veliger Characteristics and Life Cycle
Nichols & Black (1994) found that separating veligers of zebra mussels from those of
quaggas is difficult and not always possible. Preshell larvae are virtually identical, owing
to either hybridization or geographical variation among the two dreissenids. There are
four types of shelled veligers: straight-hinged, umbonal, pediveliger, and plantigrade
(Nichols & Black, 1994). Categories are defined based on hinge development, shell size,
and the presence or absence of a foot and velum. In laboratory studies, Nichols & Black
(1994) observed shell formation on the third day after fertilization at 22°C. Table 1
9
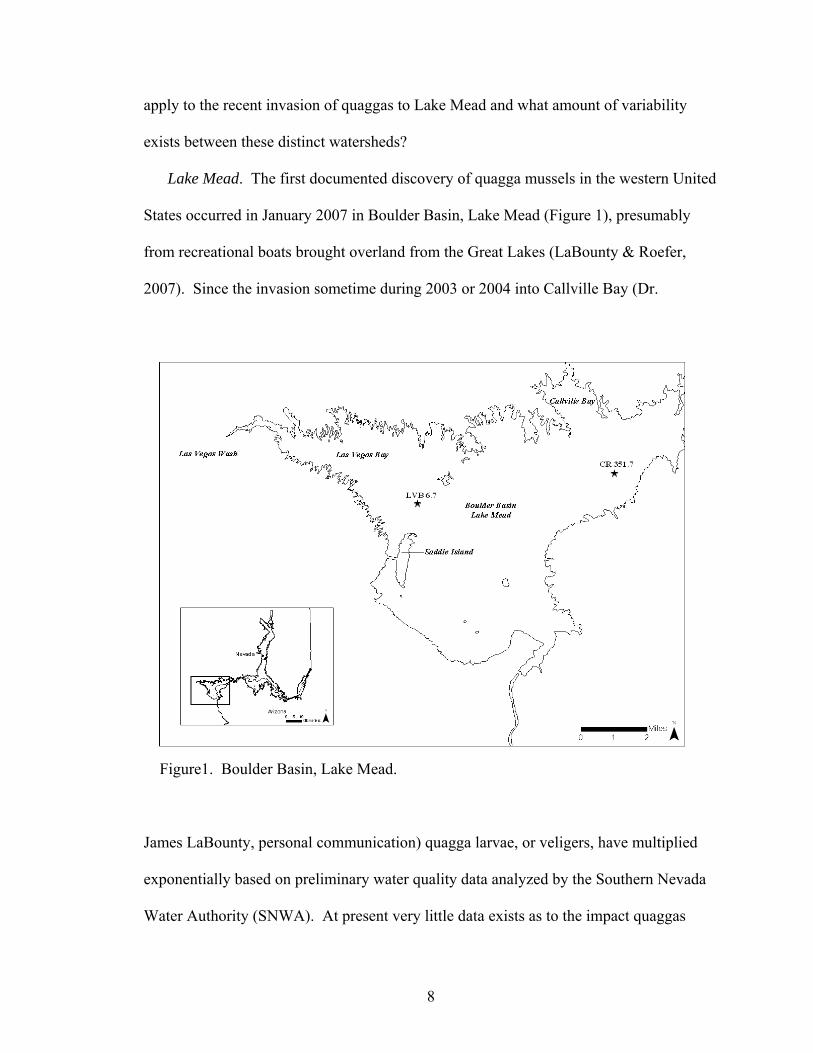
depicts approximate measurements of common Lake Mead plankton and quagga veligers
during the developmental larval stages.
Table 1
Common plankton and developing quagga veligers present in Lake Mead depicting size comparisons ________________________________________________________________________ Category Approximate Measurement of Organism Quagga Mussel
Straight-hinged larvae 39-71µm Early umbonal larvae 39-71µm Older umbonal larvae 120-221µm Pediveligers 150-228µm Plantigrade veligers 222-410µm Diatoms
Golden-brown algae 10-100µm Rotifers 0.15-1mm Crustaceans
Cladocerans 0.4-1.5mm
Copepods 2mm
Ostracods 2-3mm The straight-hinged shell is the first type developed and is characterized by a D-
shape, appearing translucent under the microscope and a foot or velum may or may not
be present. The length at this D-shelled stage measured between 39 µm and 71 µm,
10
respectively (Nichols & Black, 1994). As the veliger matures to the late plantigrade
stage, it will typically measure between 222-410 µm. An important distinction to make is
that larval size is subject to local variation due to differences in brood-stock condition
(Bayne et al., 1975). As the veliger metamorphoses, it gradually resembles an adult
bivalve mussel.
Lake Mead Energetics
Trophic Interactions
Prior to the introduction of quaggas into the Lake Mead watershed, zooplankton
abundance exhibited ideal ecological dynamics among taxa in Boulder Basin during the
study period 2001-2004 (LaBounty & Burns, 2005). Data revealed that during 2003
zooplankton abundance were twice that of any other year in the investigation.
Concentrations of copepods and cladocerans both peaked in the spring of 2003. The
significance of high zooplankton occurrence relates to success at higher trophic levels.
As a primary food source for threadfin shad (Dorosoma petenense), abundance of
zooplankton during this time period in Boulder Basin provided the sport fishery with a
boom-cycle of striped bass (Morone saxatilis) (LaBounty et al., 2004). The authors
came to the conclusion that the presence of larger game fish is evidence that the food
chain is healthy in an aquatic ecosystem.
Selected SNWA water quality sample sites in Boulder Basin include LVB6.7 and
CR351.7 as shown in Figure 1. Zooplankton abundance (#/L) from April 2000 to
October 2007 is shown in Figure 2 for weekly collection site LVB6.7. Taxa included in
the data set were ostracods, rotifers, copepods, cladocerans, and veligers. The 2001 to
11

spring 2003 peak in copepods and cladocerans is an example of a desirable ecological
balance because every phase in the trophic ladder was timed perfectly to coincide with
growing season progression (LaBounty & Burns, 2005). The subsequent crash in
zooplankton populations seen in June 2003, as depicted in Figure 2, is an expected
natural event due to predation by shad—a healthy trophic level boom-bust cycle in the
ecosystem (LaBounty & Burns, 2005).
Population modeling of zebra mussels in the Hudson River drainage suggests
Zooplankton LVB6.7
0
20
40
60
80
100
120
140
160
180
200
Apr-0
0
Jul-0
0
Oct-00
Jan-
01
Apr-0
1
Jul-0
1
Oct-01
Jan-
02
Apr-02
Jul-0
2
Oct-02
Jan-
03
Apr-0
3
Jul-0
3
Oct-03
Jan-
04
Apr-0
4
Jul-0
4
Oct-04
Jan-
05
Apr-0
5
Jul-0
5
Oct-05
Jan-
06
Apr-06
Jul-0
6
Oct-06
Jan-
07
Apr-0
7
Jul-0
7
Oct-07
Jan-
08
No./L
Ostracods
Veligers
Rotifers
Copepods
Cladocerans
Figure 2. Zooplankton density in Boulder Basin, Lake Mead (LVB6.7), April 2000 to October 2007. Source: SNWA.
uncertain variability when a new invasion has occurred (Strayer & Malcom, 2006).
Different populations of zebra mussels appear to follow different long-term trajectories
including boom-bust cycling, stability, and irregular fluctuations (Strayer & Malcom,
2006). The consequences of quaggas exhibiting these uncertain population dynamics in
12
Lake Mead may rely on multiple factors—most notably temperature and biological
adaptation over the long-term. Relatively predictable trophic interactions prior to the
arrival of quaggas into this ecosystem could be significantly altered if quaggas show no
distinct pattern in abundance spatially or temporally.
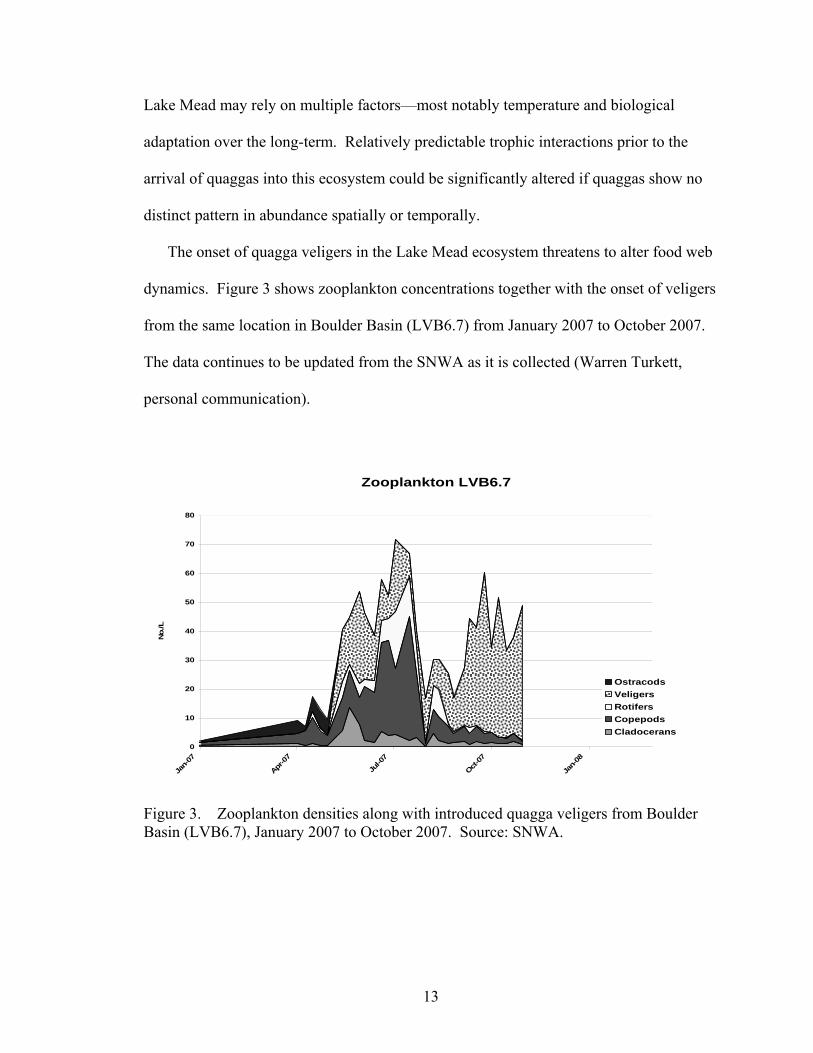
The onset of quagga veligers in the Lake Mead ecosystem threatens to alter food web
dynamics. Figure 3 shows zooplankton concentrations together with the onset of veligers
from the same location in Boulder Basin (LVB6.7) from January 2007 to October 2007.
The data continues to be updated from the SNWA as it is collected (Warren Turkett,
personal communication).
Zooplankton LVB6.7
0
10
20
30
40
50
60
70
80
Jan-
07
Apr
-07
Jul-0
7
Oct-07
Jan-
08
No./L
Ostracods
Veligers
Rotifers
Copepods
Cladocerans
Figure 3. Zooplankton densities along with introduced quagga veligers from Boulder Basin (LVB6.7), January 2007 to October 2007. Source: SNWA.
13
Zooplankton abundance shows an increase from the inflow of Las Vegas Wash when
flow from the Colorado River is below average (LaBounty et al., 2004). This is
significant in that Las Vegas Wash drains into Las Vegas Bay, which in turn drains into
Boulder Basin. As the drought and less than ideal runoff from the Colorado River
continues, the exponential growth of veligers in the watershed could threaten the cyclical
nature of the planktonic community.
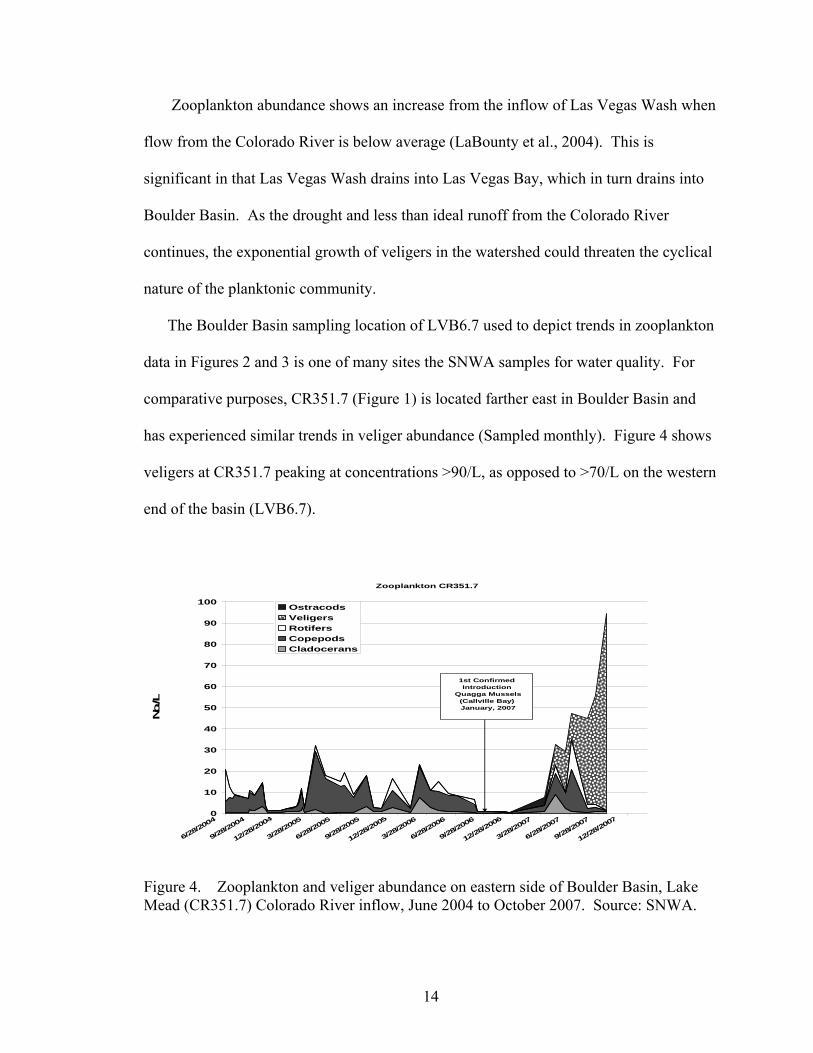
The Boulder Basin sampling location of LVB6.7 used to depict trends in zooplankton
data in Figures 2 and 3 is one of many sites the SNWA samples for water quality. For
comparative purposes, CR351.7 (Figure 1) is located farther east in Boulder Basin and
has experienced similar trends in veliger abundance (Sampled monthly). Figure 4 shows
veligers at CR351.7 peaking at concentrations >90/L, as opposed to >70/L on the western
end of the basin (LVB6.7).
Zooplankton CR351.7
0
10
20
30
40
50
60
70
80
90
100
6/28
/200
4
9/28
/200
4
12/28
/200
4
3/28
/200
5
6/28
/200
5
9/28
/200
5
12/28
/200
5
3/28
/200
6
6/28
/200
6
9/28
/200
6
12/28
/200
6
3/28
/200
7
6/28
/200
7
9/28
/200
7
12/28
/200
7
No./L
Ostracods
Veligers
Rotifers
Copepods
Cladocerans
1st Confirmed Introduction
Quagga Mussels (Callville Bay) January, 2007
Figure 4. Zooplankton and veliger abundance on eastern side of Boulder Basin, Lake Mead (CR351.7) Colorado River inflow, June 2004 to October 2007. Source: SNWA.
14
The suspected initial invasion of quaggas found in Callville Bay (Figure 1) in
January, 2007 is depicted to show proximity to the CR351.7 sampling site and planktonic
dynamics pre and post introduction. Trends in these two data sets
may suggest variance in trophic energetics caused by differing inflow parameters—
LasVegas Bay inflow as opposed to Colorado River inflow, respectively.
Stable Isotope Analysis
Since carbon isotopic compositions of animals correspond closely to their food
sources, carbon isotopic ratio is expressed by the following equation:
δ13C(‰) = [(13C/12C)sample/(13C/12C)standard – 1] * 1000
where ‰ is parts per thousand and 13C/12C are atomic ratios of the number of atoms in
the sample or standard (Mitchell et al., 1996). Due to the difficulties involved with
observational data when interpreting diet and trophic interactions, useful insights can be
gleaned from the stable isotopes of C and N in the feeding relationships of fish within a
given food web (Mitchell et al., 1996; Gu et al., 1994). Current feeding by threadfin shad
and young-of-the-year striped bass in Lake Mead will provide basic ecological
information that may be used by fisheries managers since the introduction of quagga
mussels in the watershed. Stable isotopes δ13C and δ15N, analyzed together; serve as a
valuable tool in determining energy sources contributing to trophic position in fish
species (Vander Zanden et al., 1999; Gu et al., 1994).
As alluded to previously, stable isotopic composition of N also plays an important
function between diet and trophic position. Preferential catabolism and excretion of the
lighter form of 14N results in increased δ15N values for each trophic transfer along a food
15
chain (Peterson & Fry, 1987; Cabana & Rasmussen, 1994). Utilizing the properties for N
discussed, isotopic analysis of nitrogen is expressed by the formula:
δ15N(‰) = [(15N/14C)sample/(15N/14N)standard – 1] * 1000
as with the equation for determining δ13C, the atomic ratios are expressed based on
international standards for C and N in the Earth’s atmosphere and PeeDee Belemnite,
respectively (Mitchell et al., 1996).
Seasonal Variation
Historical zooplankton density in Boulder Basin of Lake Mead has fluctuated in part
by epilimnion temperature shifts on a seasonal basis. Background water temperatures
revealed that the 10-year average was about 20°C from 1994-2004 (LaBounty & Burns,
2005). The average high water temperature for this data set was greatest at 28.5°C in
1998 and lowest at 27.5°C in 1999. LaBounty et al., (2004) reported highest population
densities of zooplankton in the inner bay during April and May during the 1990-95 data
set.
Trends in abundance were similar for the inner and outer bays, regardless of the
April-May densities. Peaks in zooplankton in the outer bay occurred in both the May-
June and September-October time periods (LaBounty et al., 2004). During the warmest
months of July and August, the data showed a shift of zooplankton to deeper
thermoclines, presumably due to high water temperatures near the surface.
Data on quagga mussel tolerance to warmer climates of North America is lacking.
Zebra mussel densities studies by the Army Corps of Engineers in El Dorado Lake,
Oklahoma from 1998 to 2005 showed veliger spikes in June and October. It was
observed that temperature was a key variable in monitoring of veligers in this region. In
16
the past two years of monitoring, however, zebra mussel densities have been dramatically
reduced, possibly due to hot, dry summers in the El Dorado Lake area. It has been
suggested that zebra mussels may spawn throughout the summer months if water
temperatures remain <30°C and may acclimate to temperatures >30°C over time (Laney,
2008).
From the 2001-04 data sets for Boulder Basin, copepods, cladocerans, ostracods, and
rotifers for the most part peaked in spring and exhibited similar transitions to deeper
water from July-August (LaBounty & Burns, 2005). The explosion in zooplankton
populations during the spring of 2003 (see section on Trophic Interactions) greatly
influenced the analysis during the four year study (LaBounty & Burns, 2005). The crash
of zooplankton observed in June 2003 and lasting the rest of the summer months
correlates with high predation rates by threadfin shad, especially in areas of the lake
where shad densities are high (Pelle, 1989).
Background limnology of Boulder Basin preceding the introduction of quaggas to the
ecosystem serves two functions for this study. First, the data provides an insight as to
how primary producers like zooplankton have affected the food chain prior to the quagga
arrival and second, the data will provide the ability to compare pre and post mussel
invasion in regards to trophic level interactions.
Threadfin Shad
It has been documented that threadfin shad (Dorosoma petenense (Gunther)) are a
crucial element to the food web in Boulder Basin of Lake Mead (LaBounty et al., 2004).
They constitute the primary food source for piscivorous game fishes such as largemouth
17
bass (Micropterus salmoides) and striped bass (Morone saxatalis), which are the most
abundant game fish in the Lake Mead watershed (Miller, 1950; Haskell, 1959; Miller,
1961; Deacon et al., 1972; LaBounty et al., 2004).
Shad were first introduced into Lake Mead, Mojave, and Havasu in 1954-55 and were
found throughout the lower Colorado River system by 1956 (LaRivers, 1962). Their
rapid dispersal in a short time can be partially attributed to high fecundity rates (Pelle,
1989). Threadfin shad generally occupy the pelagic zone, or open water, of freshwater
lakes and are native to the southeastern U.S. (Moyle & Cech, 1982). Pelle (1989)
observed in the Overton Arm, Lake Mead that > 75% of shad occupied the top 1m of the
water column with an exponential decrease in abundance with depth, as well as size
range.
Threadfin shad are known to remain in constantly congregated schools, which explain
a regularity of food types in multiple samples (Haskell, 1959). Under controlled
conditions, threadfin shad were observed to both filter feed and particulate feed with
vision not being a factor except in particulate prey selection (Holanov & Tash, 1978). In
addition, it has been noted that shad can be attracted to and sometimes make filter feeding
movements near water devoid of suspended matter, but previously inhabited by
zooplankton (Holanov & Tash, 1978).
Diet Preferences. In the past, researchers familiar with Lake Mead have considered
zooplankton and phytoplankton as the primary forage of threadfin shad (Deacon et al.,
1972). Moreover, the observation was made in Lake Mead that when preferred plankton
was unavailable, shad selected alternate forage with less nutritional value, such as plant
debris, sand or detritus (see also Haskell, 1959 for similar findings in shad from central
18

Arizona lakes). Generally, diet composition of juveniles or adults was more dependent
on availability of forage types (Minckley, 1973).
Reports of dramatic declines in zooplankton abundance have been observed in parts
of Lake Mead where there are high shad densities (Wilde, 1984). This in part explains
fluctuations in shad populations in Boulder Basin over approximate 5-yr boom/bust
cycles directly associated with zooplankton abundance (LaBounty & Burns, 2005). The
occurrence of periodic algal blooms, like the one in 2003, aid in returning the predator-
prey relationship back into equilibrium. The relative balance once observed in foraging
activities among threadfin shad in Lake Mead before the introduction of quagga mussels
is potentially under threat of permanent alteration due to the voracious invasiveness of
this species.
Stomach Anatomy and Function. Internal anatomy of the threadfin shad is
characterized by a stomach that is an enlargement of the alimentary tract. The stomach is
short and muscular and resembles the gizzard of a fowl (Miller, 1950). Often
unidentified organic material found during analysis is attributable to the supposed
grinding action of the alimentary organ (Haskell, 1959).
Hypotheses
This study attempts to answer several questions regarding changes in the Lake Mead
watershed related to the introduction of quagga mussels. The first hypothesis under
investigation is to conduct a visual estimation of stomach contents of threadfin shad to
determine if they eat quagga mussel veligers. If it is observed that a significant
proportion of veligers are present in stomach contents, do they serve as a viable food
19
source? A second question that will attempt to be answered is where shad are feeding in
Las Vegas Bay and Overton Arm since the arrival of quagga mussels? It is hypothesized
that changes in zooplankton assemblages, as observed in other invaded waterways, will
cause an energetics shift in patterns of shad foraging behavior since the discovery of
quagga mussels in Lake Mead. Therefore, stable isotope analysis will reveal that, over
time, food sources for threadfin shad have shifted from a predictable, pelagic feeding
strategy, to a deep water benthic signal, owing to a consequent reduction in available
food items due to quagga mussel impacts. A third hypothesis is that trends in historic
larval shad trawl data have declined as a result of the presence of quagga mussels in the
Lake Mead ecosystem. Finally, with the addition of quagga mussel veligers to the
system, the composition and abundance of zooplankton has been reduced as veligers have
increased, adversely affecting primary production dynamics.
20
CHAPTER 3
METHODOLOGY
Collection of Data
Field Collection Methods
Adult Threadfin Shad. In an attempt to examine the foraging habits of lower trophic
level fish, a total of 197 adult threadfin shad were collected between April 2008 and
February 2009 with the assistance of the Nevada Department of Wildlife (NDOW) and
Bio-West, Inc. Of the total number of fish collected, 170 came from Las Vegas Bay and
a representative sample of 27 were collected from Overton Arm, where quagga veliger
numbers have yet to establish in large numbers.
Standard methods entailed setting gill or trammel nets overnight and returning next
day for collection of larger fish. All nets were of variable mesh size, characterized by 3
inch at one end, down to 1-1.5 inch at the other. Dates for gill or trammel netting
collections were dependent on the availability of NDOW and Bio-West resources. Fish
collected through standard protocols were immediately fixed in 10% CaroSafe™ in the
field in a container large enough to preserve multiple samples (ASTM, 1995; Haskell,
1959; Pelle, 1989).
Upon completion of field collection, samples were immediately transported to the
laboratory for the purpose of measuring physical characteristics of each specimen and
maintaining the integrity of the stomach contents. Standard length, total length, and
21
weight of whole fish were recorded for growth data analysis related to trophic
interactions among fish and consumption of veligers (Krebs, 1999).
Larval Shad Trawls. Nevada Department of Wildlife (NDOW) shad trawl protocol
consists of towing a cone-shaped net 6m long with a 10 inch collecting bucket on the end.
The open end is 1m in diameter with a 1.6mm mesh screening. The net is towed
approximately 20m behind the boat in 10 minute increments at a boat speed of 1,000 rpm
and replicated three times to provide an average number. Flow volume is calculated
using a flow meter at the mouth of the net in order to record water movement. Upon
return to the laboratory, fish are counted and abundance converted to fish/100m3 of
water. Since fish >20mm tend to avoid capture in the net, the technique is an estimate of
reproductive success and not a population estimate of threadfin shad (NDOW, 2006).
Typical trawl monitoring by NDOW is carried out weekly in late spring and/or early
summer. Data gathered for this study was collected in June, 2008 on a weekly basis in
Las Vegas Bay and Overton Arm, respectively.
Figure 5 shows approximate locations of annual larval shad trawl sampling sites in
Overton Arm and Las Vegas Bay, Lake Mead conducted by NDOW. Overton Arm sites
are based on a Lake Mead fertilization study conducted in 1988 by Vaux and Paulson
(1990) and were named F1, F2, F3, and F4, respectively. NDOW chose Las Vegas Bay
sampling locations based on the Vaux and Paulson study protocol and are named ILV
(Inner Las Vegas Bay), MLV (Middle Las Vegas Bay), and BB (Boulder Basin). All fish
collected for this study were based on sampling locations shown in Figure 5. Regional
sampling from Las Vegas Bay and Overton Arm was established in order to gather data
22
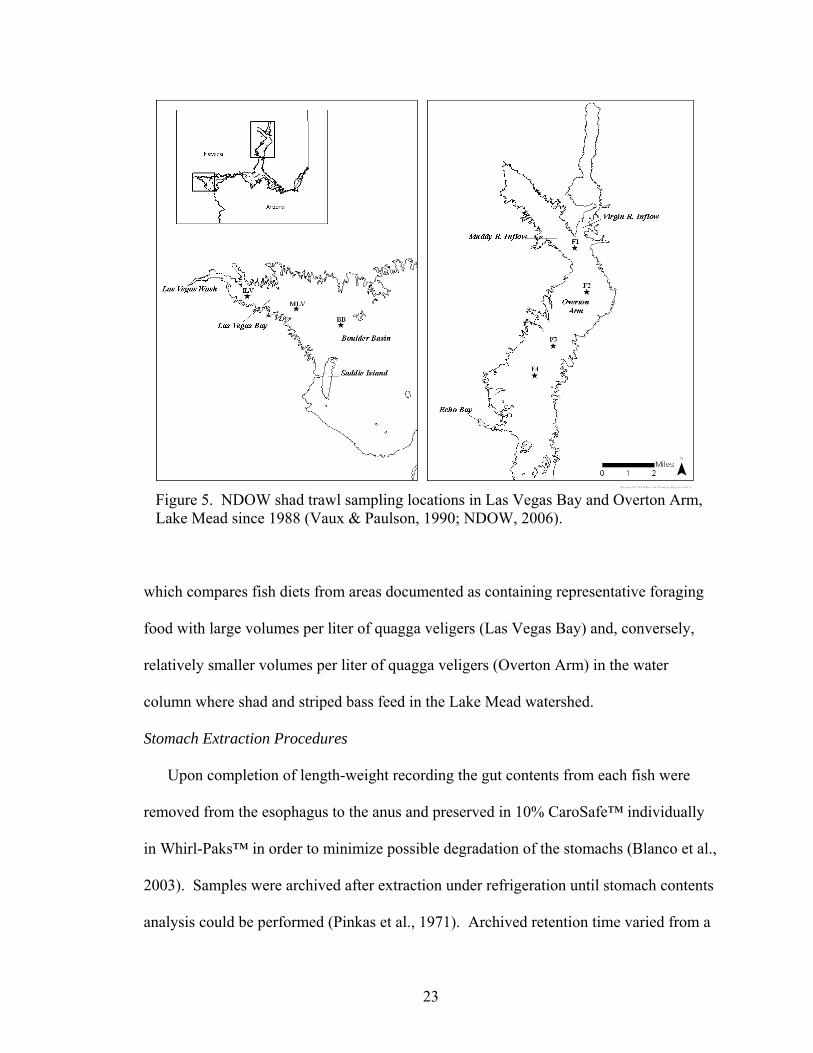
Figure 5. NDOW shad trawl sampling locations in Las Vegas Bay and Overton Arm, Lake Mead since 1988 (Vaux & Paulson, 1990; NDOW, 2006).
which compares fish diets from areas documented as containing representative foraging
food with large volumes per liter of quagga veligers (Las Vegas Bay) and, conversely,
relatively smaller volumes per liter of quagga veligers (Overton Arm) in the water
column where shad and striped bass feed in the Lake Mead watershed.
Stomach Extraction Procedures
Upon completion of length-weight recording the gut contents from each fish were
removed from the esophagus to the anus and preserved in 10% CaroSafe™ individually
in Whirl-Paks™ in order to minimize possible degradation of the stomachs (Blanco et al.,
2003). Samples were archived after extraction under refrigeration until stomach contents
analysis could be performed (Pinkas et al., 1971). Archived retention time varied from a
23
maximum of ten months from collections gathered in April, 2008 to as little as three
weeks in the case of samples collected in February, 2009. Each stomach extracted was
coded with date, location, and size of whole fish for later statistical analysis.
Stomach Contents Analysis
Microscopic Analysis. Stomach contents were examined individually upon
completion of each sampling event (Hyslop, 1980). Each stomach was dissected
vertically and the contents placed in a sedgwick-rafter cell with grid lines and suspended
in 1ml distilled water (ASTM, 1995). Grid lines on the sedgwick-rafter provide
efficiency of counts under the microscope and avoidance of over-estimating prey items.
This methodology has been employed for water sample analysis conducted by the U.S.
Bureau of Reclamation and the SNWA, respectively (G. Chris Holdren and Alan Sims,
personal communication). A semi-quantitative visual estimation of abundance of dietary
components for each stomach was recorded using a scale from 1-5. Empty stomachs
were assigned a value of 1(0%) with a value of 5 indicating high abundance (100%)
(Blanco et al., 2003; Karjalainen et al., 1999; Collares-Pereira et al., 1996). Stomach
abundance from this method was incorporated into the statistical analysis.
Frequency of occurrence of three major taxons of zooplankton representative of Lake
Mead and quagga veligers were recorded under a stereo dissecting microscope (Carl
Zeiss SteREO Discovery.V8, Toronto, ON, Canada) fitted with a cross-polarized light
(CPL) source at magnification suitable for positive identification (Johnson, 1995). The
utilization of CPL aids in accuracy in counts of veligers due to the birefringent crystalline
structure of the calcite in the larval shell (Johnson, 1995).
24

Stable Isotope Analysis
Larval threadfin shad samples from June, 2008 annual trawls were donated by
NDOW for the purpose of being subjected to stable isotope analysis. Young-of-the-year
(YOY) shad were collected from Las Vegas Bay and Overton Arm along pre-existing
trawl locations established in 1988 (Figure 5). Two tows from each location were
performed in Las Vegas Bay and three tows in Overton Arm, respectively. Collection
dates for Las Vegas Bay were conducted weekly for three consecutive weeks in June and
Overton Arm collections took place over two consecutive weeks during the same month
in 2008.
Five adult threadfin shad were collected from Overton Arm on 12 February 2009 and
21 adults were collected from Las Vegas Bay on 13 February 2009. The mean total
length for all samples was 189 mm and mean total wet weight was 59.9 g, respectively.
A sample of dorsal muscle from each fish was filleted and placed in a standard
microcentrifuge tube and prepared for analysis.
Size-class for isotopic analysis was carried out by separating and measuring the
length (mm) of each YOY fish of similar size, with a target number of ten specimens
measured for each location and tow (Mitchell et al., 1996). In the case of adult samples,
all fish were prepared individually for analysis. All samples were dried at 70°C for at
least 24 h and ground into a fine powder using a mortar and pestle. Subsequent dried
samples were weighed out between 1.0-1.2 mg and packaged into 5mm x 9mm tin cups.
Replicate samples were taken from larval trawl samples and standard reference fish
material was included every 20 samples for quality control (Vander Zanden et al., 2006).
25
Stable isotope analysis was performed using a NA2000 elemental analyzer (EA) at
the Las Vegas Isotope Science Laboratory and interfaced to a Delta V Plus mass
spectrometer through the Conflo III system. Elemental analysis was carried out using a
flash combustion/chromatographic separation technique. The furnace temperature was
kept at 1000˚C; while the reduction oven was 650˚C. Generated gas from consumption
of the samples is carried in a helium stream into a GC column held at 60˚C. Gases are
then separated before being diluted in the Conflo III and passed to the mass spectrometer
for analysis. Isotope ratios of δ13C are expressed in per mil (‰) notation relative to the
VPDB scale, whereas δ15N values (‰) are reported relative to air-N2. Three in-house
standards (ACET, CABG, and CORN) were directly calibrated against six international
standards of Graphite (USGS24), Caffine (IAEA-600), Oil (NBS-22), and ammonium
sulfate (IAEA-N-1, USGS25, USGS26) in order to create a three-point calibration curve
to correct the raw data.
Treatment of Data
A frequency of occurrence method was employed to analyze stomach contents for the
determination of diet composition as described by Hyslop (1980):
%Fi = (Ni / N) x 100
where Fi = percent frequency of prey type i, Ni = number of predators with prey i in the
stomach, and N is total number of shad with stomach contents. Numerical counts of food
items were recorded at the division level and included cladocerans, copepods, veligers, or
rotifers. Percentage occurrence and percentage abundance of prey items was determined
through modification of the Costello method for interpreting stomach contents data
26
(Amundsen et al., 1996). Prey-specific abundance is represented by the following
equation:
Pi = (ΣSi / ΣSti) x 100
Proportional statistics were performed to test whether larger shad are utilizing
selected prey items in the diet more than smaller shad in sampling locations in Lake
Mead. Condition factor (K-factor) analysis was calculated to test for health in the
samples collected (Blanco et al., 2003; Olsen & Ringø, 1999).
K-Factor = W/L3, where W = fish weight (g) and L = standard length (cm)
27
CHAPTER 4
RESULTS
Stomach Contents Analysis
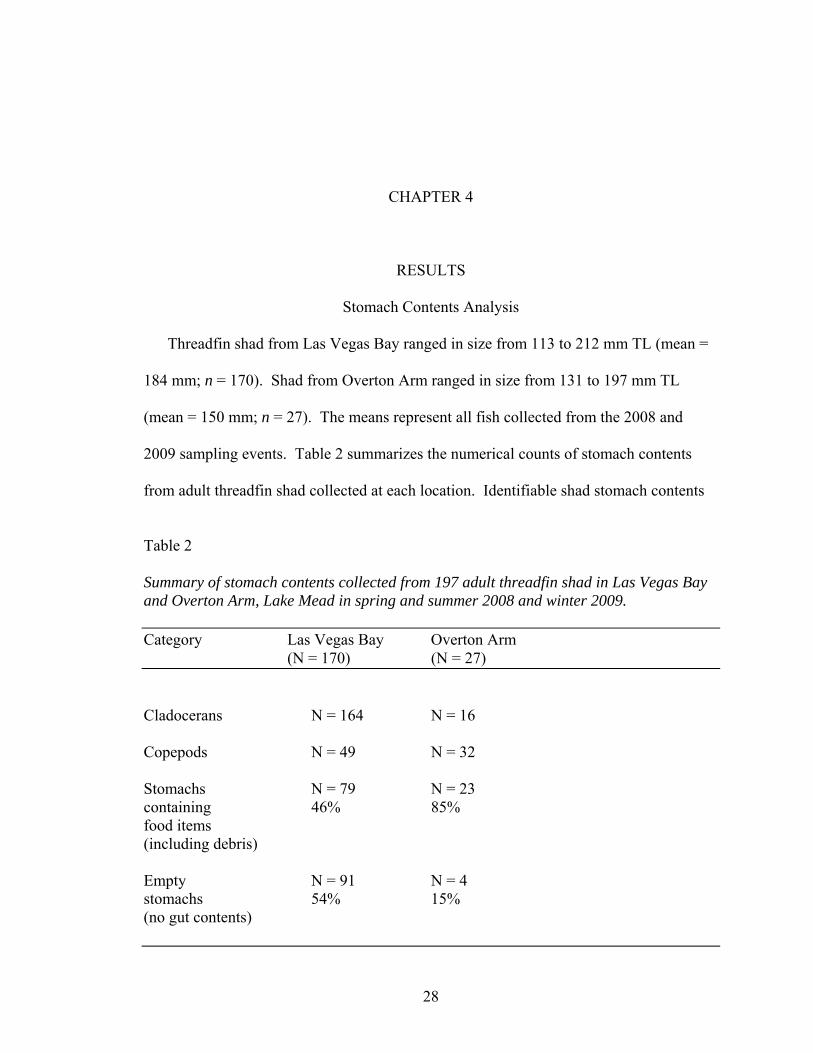
Threadfin shad from Las Vegas Bay ranged in size from 113 to 212 mm TL (mean =
184 mm; n = 170). Shad from Overton Arm ranged in size from 131 to 197 mm TL
(mean = 150 mm; n = 27). The means represent all fish collected from the 2008 and
2009 sampling events. Table 2 summarizes the numerical counts of stomach contents
from adult threadfin shad collected at each location. Identifiable shad stomach contents
Table 2 Summary of stomach contents collected from 197 adult threadfin shad in Las Vegas Bay and Overton Arm, Lake Mead in spring and summer 2008 and winter 2009. Category Las Vegas Bay Overton Arm (N = 170) (N = 27)
Cladocerans N = 164 N = 16 Copepods N = 49 N = 32 Stomachs N = 79 N = 23 containing 46% 85% food items (including debris) Empty N = 91 N = 4 stomachs 54% 15% (no gut contents)
28
contained primarily cladocerans and copepods. Amorphous debris also contributed a
significant portion to the total diet. No quagga mussel veligers were observed under
cross-polarizing microscopy. Likewise, no rotifers were observed as food items
identified at the division level in Las Vegas Bay or Overton Arm. Visual estimation of
abundance revealed that 46% and 85% of stomachs contained either food or other
ingested contents. A large proportion contained unidentified food items or other debris
such as rocks, sand, and plant material. Those stomachs examined from Overton Arm
exhibited more debris than those from Las Vegas Bay.
Frequency of occurrence and prey-specific abundance of stomachs which had
identifiable cladocerans and copepods are depicted in Table 3. The proportional analysis
shown includes only those stomach contents which contained either cladocerans and/or
copepods, respectively. Testing among seasons revealed there was no significant
difference in the proportion of cladocerans to copepods in shad stomachs for either spring
(z = 0.70, P = 0.484) or winter (z = -0.91, P = 0.362) from comparative sampling events
in Las Vegas Bay. Testing for seasonality was not performed for Overton Arm owing to
a lack of comparison data.
Proportion of cladocerans differed significantly between spring and winter in Las
Vegas Bay (z = 2.64, P = 0.008), whereas proportion of copepods counted in Las Vegas
Bay stomach contents did not show statistically relevant difference for seasonality (z =
0.58, P = 0.562). Overall, frequency of occurrence in prey types taking seasonality into
account is inconclusive at this time.
29

Table 3 Frequency of occurrence and prey-specific abundance percentages of cladocerans and copepods in the stomach contents of adult threadfin shad in Las Vegas Bay and Overton Arm, Lake Mead. Prey-specific abundance is a modification of the Costello method (Amundsen et al., 1996). Location Frequency of Occurrence Las Vegas Bay % Fcladoceran = (38cladoceran/79) x 100 = 48.1% % Fcopepod = (24copepod/79) x 100 = 30.4% Overton Arm % Fcladoceran = (9cladoceran/23) x 100 = 39.1% % Fcopepod = (10copepod/23) x 100 = 43.5% Location Prey-Specific Abundance Las Vegas Bay Pcladoceran = (Σ 164/ Σ 208) x 100 = 78.9% Pcopepod = (Σ 49/ Σ 150) x 100 = 32.7% Overton Arm Pcladoceran = (Σ 16/ Σ 38) x 100 = 42.1% Pcopepod = (Σ 32/ Σ 43) x 100 = 74.4%
Taking prey-specific abundance into account by food type, a significant difference in
proportion of cladocerans was observed among shad stomachs from Las Vegas Bay as
opposed to Overton Arm (z = 4.32, P = <0.001). Similarly, copepod abundance also
exhibited differing proportions between the two regions, with Overton Arm showing
higher abundance (z = -5.44, P = <0.001). Of the prey items counted, cladocerans were
more prevalent in stomachs of shad collected in Las Vegas Bay while copepods were
more abundant in Overton Arm.
A comparison in prey-specific abundance by site was also analyzed. For Las Vegas
Bay, cladocerans were significantly more abundant than copepods (z = 9.70, P = <0.001).
An inverse relationship was observed in Overton Arm, where copepods were more
30
prevalent compared with cladocerans (z = -3.10, P = 0.002). These observations suggest
the dominant food source for threadfin shad differs by location in Lake Mead.
Stable Isotope Analysis
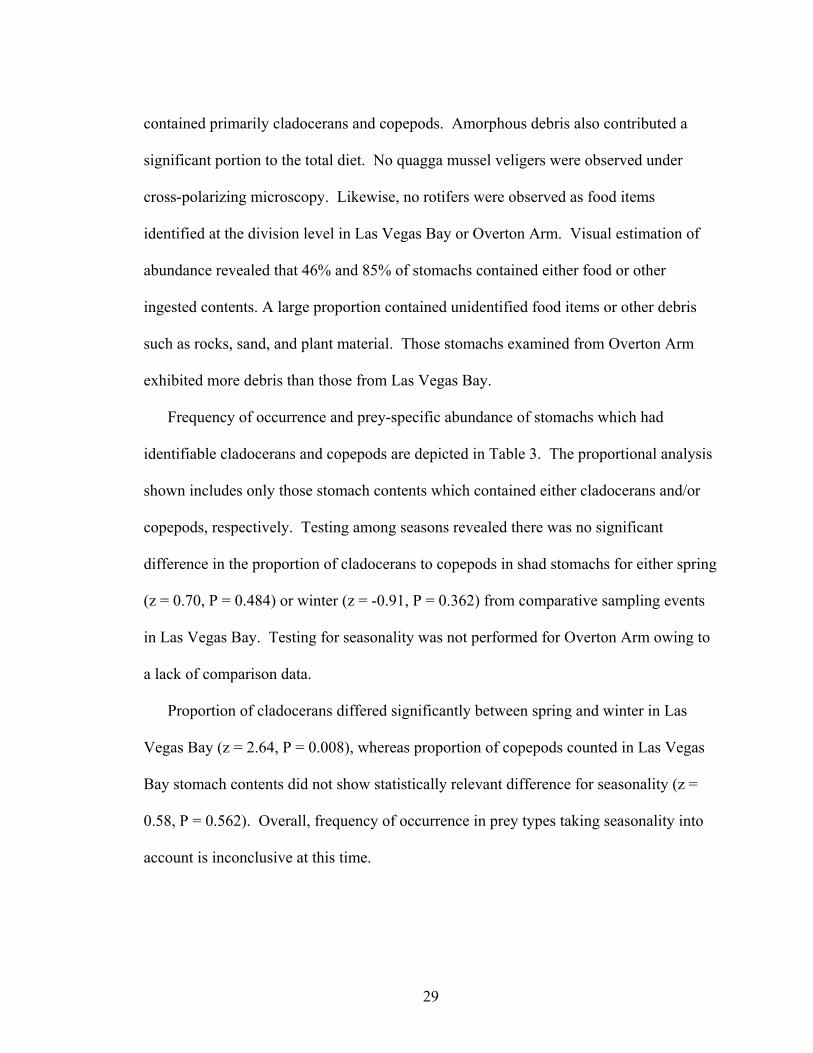
Results from bioenergetics analysis in adult threadfin shad revealed little variation in
δ13C values in Las Vegas Bay for each of the years 2007-2009. Values ranged between
-24.6‰ and -25.9‰, as shown in Figure 6. Values for δ15N differed in 2009 (11.7‰)
from trends observed from the 2007 (15.2‰) and 2008 (15.9‰) data provided by Umek
et al.(in press). Stable isotopic analysis suggests that from 2007-2009 threadfin shad in
Las Vegas Bay
10.0
12.0
14.0
16.0
18.0
-31.0 -28.0 -25.0 -22.0 -19.0 -16.0
d13C
d15N
Zooplankton
Threadfin Shad (2007)
Threadfin Shad (2008)
Largemouth Bass
Striped Bass
Benthic Invertebrates
Threadfin Shad (2009)open water
signalbottom water
signal2009
2007
2008
Figure 6. δ13C and δ15N comparative means for adult threadfin shad sampled from Las Vegas Bay, 2007-2009. Mean SE also depicted. Arrows show initial shad trophic position at the time of quagga discovery in Lake Mead. Zooplankton, bass, and benthic invertebrate data is representative of 2007 only. Data from 2007-2008 were provided by Umek et al., in press.
31
Las Vegas Bay have not altered their diets significantly towards an exclusively open
water or bottom water regime shift, despite the presence of quagga mussels in the system.
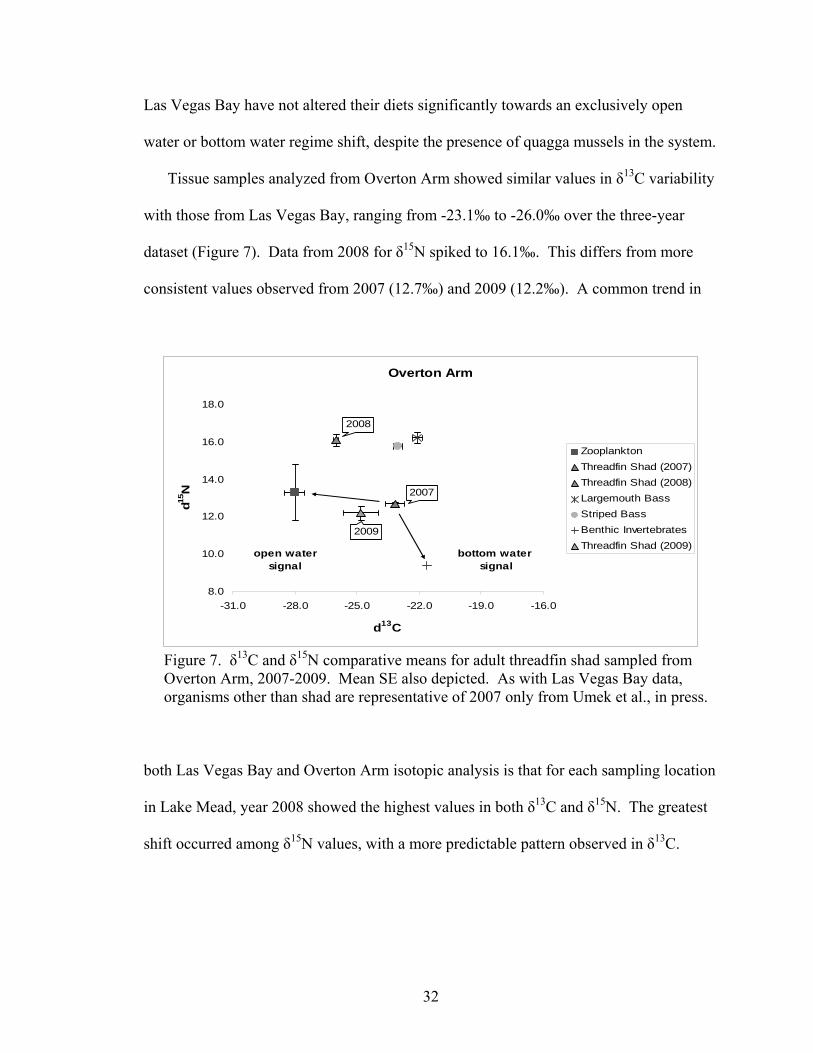
Tissue samples analyzed from Overton Arm showed similar values in δ13C variability
with those from Las Vegas Bay, ranging from -23.1‰ to -26.0‰ over the three-year
dataset (Figure 7). Data from 2008 for δ15N spiked to 16.1‰. This differs from more
consistent values observed from 2007 (12.7‰) and 2009 (12.2‰). A common trend in
Overton Arm
8.0
10.0
12.0
14.0
16.0
18.0
-31.0 -28.0 -25.0 -22.0 -19.0 -16.0
d13C
d15N
Zooplankton
Threadfin Shad (2007)
Threadfin Shad (2008)
Largemouth Bass
Striped Bass
Benthic Invertebrates
Threadfin Shad (2009)open water
signalbottom water
signal
2009
2007
2008
Figure 7. δ13C and δ15N comparative means for adult threadfin shad sampled from Overton Arm, 2007-2009. Mean SE also depicted. As with Las Vegas Bay data, organisms other than shad are representative of 2007 only from Umek et al., in press.
both Las Vegas Bay and Overton Arm isotopic analysis is that for each sampling location
in Lake Mead, year 2008 showed the highest values in both δ13C and δ15N. The greatest
shift occurred among δ15N values, with a more predictable pattern observed in δ13C.
32

Larval Shad
Results from June, 2008 NDOW larval shad trawls were compared with adult values
from the same year (Table 4). Analysis revealed a mean δ13C signature of -25.8‰ for all
trawls conducted in spring 2008 in Las Vegas Bay. This corresponds very closely with
the adult value of -25.9‰ during the same year. Comparisons among size-classes in δ15N
values, however, varied from a mean of 10.1‰ for larval and 15.9‰ for adults,
respectively. Larval isotopic means were a composite of the inner, middle, and outer
transects sampled by NDOW in Las Vegas Bay and thus represented the entire bay.
Table 4
Summarized mean stable isotope results comparing NDOW larval shad trawl samples with adult shad data collected by Umek et al., in press, for year 2008 in Las Vegas Bay and Overton Arm. (L) = Larval shad; (A) = Adult shad.
Location δ13C (L) δ13C (A) δ15N (L) δ15N (A) Las Vegas Bay -25.8 ‰ -25.9 ‰ 10.1 ‰ 15.9 ‰ N = 57 (L) SE = 0.55 SE = 0.09 SE = 0.56 SE = 0.29 N = 3 (A) Overton Arm -25.6 ‰ -26.0 ‰ 11.4 ‰ 16.1 ‰ N = 32 (L) SE = 0.67 SE = 0.11 SE = 0.49 SE = 0.31 N = 2 (A)
Similar trends were observed in Overton Arm in regards to isotopic profiles, as shown
in Table 4. As was recorded in Las Vegas Bay, δ13C assimilation in larval shad (-25.6‰)
was remarkably close to adult counterparts (-26.0‰). This indicates that for both Las
Vegas Bay and Overton Arm, important dietary sources of nutrition remain constant
regardless of size-class based on carbon isotope measurements (Peterson & Fry, 1987).
33

A difference in δ15N also was evident in Overton Arm in 2008 between larval and adult
shad. Again, larval shad exhibited a lower value in nitrogen measurement of 11.4‰, as
opposed to adults measuring 16.1‰. These results (δ15N) correlate with smaller shad
holding a different trophic position in the food web as opposed to their adult counterparts.
Trend Analysis
Annual larval threadfin shad trawl protocol conducted by NDOW has remained
consistent by location in Las Vegas Bay and Overton Arm since 1988. Figure 8 shows
mean number of fish/100m3 for all three sampling locations in Las Vegas Bay since
1988. No data is available for year 1990 and was omitted. The lowest average count
occurred in 1989 at 2.78 fish/100m3 and the highest was observed in 2007, with an
average of 445.56 fish/100m3.
Las Vegas Bay NDOW Shad Trawl Data, 1988-2008
-100
0
100
200
300
400
500
600
1988 1989 1991 1992 1993 1994 1995 1996 1997 1998 1999 2000 2001 2002 2003 2004 2005 2006 2007 2008
Year
Sh
ad/1
00m
3
Figure 8. Mean shad/100m3 from Las Vegas Bay trawls conducted by NDOW, 1988-2008 (No data available for 1990). Data is a composite of all trawling locations in Las Vegas Bay.
34
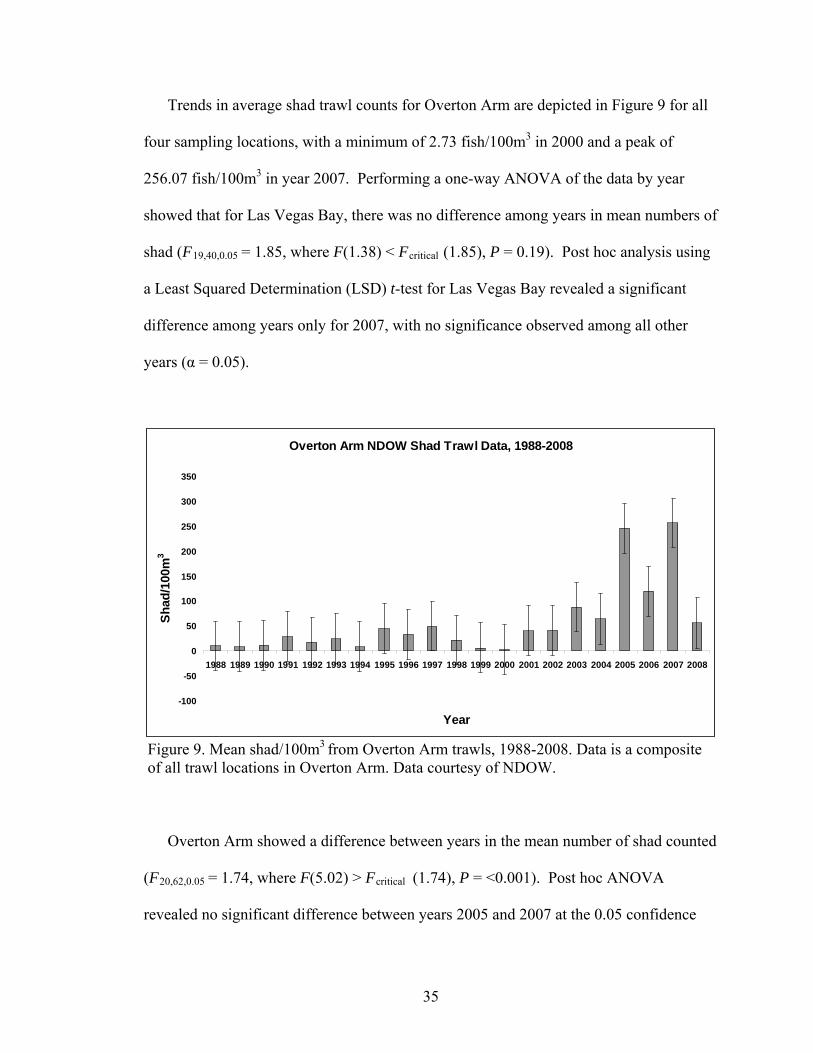
Trends in average shad trawl counts for Overton Arm are depicted in Figure 9 for all
four sampling locations, with a minimum of 2.73 fish/100m3 in 2000 and a peak of
256.07 fish/100m3 in year 2007. Performing a one-way ANOVA of the data by year
showed that for Las Vegas Bay, there was no difference among years in mean numbers of
shad (F19,40,0.05 = 1.85, where F(1.38) < Fcritical (1.85), P = 0.19). Post hoc analysis using
a Least Squared Determination (LSD) t-test for Las Vegas Bay revealed a significant
difference among years only for 2007, with no significance observed among all other
years (α = 0.05).
Overton Arm NDOW Shad Trawl Data, 1988-2008
-100
-50
0
50
100
150
200
250
300
350
1988 1989 1990 1991 1992 1993 1994 1995 1996 1997 1998 1999 2000 2001 2002 2003 2004 2005 2006 2007 2008
Year
Sh
ad/1
00m
3
Figure 9. Mean shad/100m3 from Overton Arm trawls, 1988-2008. Data is a composite of all trawl locations in Overton Arm. Data courtesy of NDOW.
Overton Arm showed a difference between years in the mean number of shad counted
(F20,62,0.05 = 1.74, where F(5.02) > Fcritical (1.74), P = <0.001). Post hoc ANOVA
revealed no significant difference between years 2005 and 2007 at the 0.05 confidence
35

interval. The post hoc analysis LSD t-test for sample years 2005 and 2007 were
however, significantly different compared with all other years in the dataset. A separate
one-way ANOVA based on trawling locations, as opposed to year, revealed no
significant difference in Las Vegas Bay (F2,57,0.05 = 3.16, where F(2.73) < Fcritical (3.16), P
= 0.07). The same was observed for each of the four trawling locations in Overton Arm
(F3,79,0.05 = 2.72, where F(0.39) < Fcritical (2.72), P = 0.76).
Trends in zooplankton biomass were compared with NDOW shad trawls, as shown in
Figure 10, for sampling location Inner Las Vegas Bay (ILV) from 2000-2008.
Inner Las Vegas Bay Zooplankton Profile, 2000-2008
0%
20%
40%
60%
80%
100%
June June June June June June June June June
2000 2001 2002 2003 2004 2005 2006 2007 2008
ILV
% B
iom
ass
0
50
100
150
200
250
Sh
ad/1
00m
3
% Veliger
% Rotifers
% Copepods
% Cladoceran
Shad/100 m3
Figure 10. Percent biomass of four divisions of zooplankton compared with annual Juneshad trawl averages from 2000-2008 in Inner Las Vegas Bay sampling location.
36
Zooplankton data provided by SNWS was not readily available prior to year 2000 and
thus was not included in the analysis. Copepod biomass was highest in 2001 comprising
over 71% of all zooplankton. Subsequently, mean shad counts peaked with copepod
availability during this time at 226.7 fish/100m3. Larval shad counts exhibited a
precipitous decline through the decade despite predictable variability in prey availability.
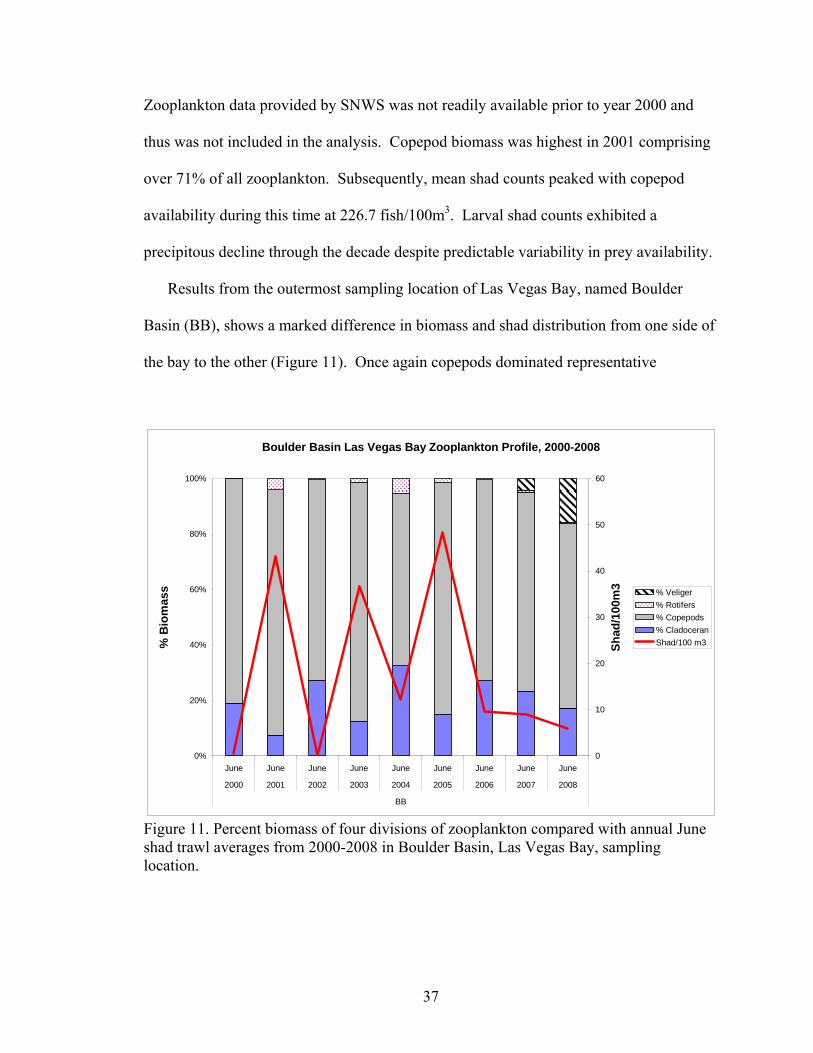
Results from the outermost sampling location of Las Vegas Bay, named Boulder
Basin (BB), shows a marked difference in biomass and shad distribution from one side of
the bay to the other (Figure 11). Once again copepods dominated representative
Boulder Basin Las Vegas Bay Zooplankton Profile, 2000-2008
0%
20%
40%
60%
80%
100%
June June June June June June June June June
2000 2001 2002 2003 2004 2005 2006 2007 2008
BB
% B
iom
ass
0
10
20
30
40
50
60
Sh
ad/1
00m
3
% Veliger
% Rotifers
% Copepods
% Cladoceran
Shad/100 m3
Figure 11. Percent biomass of four divisions of zooplankton compared with annual June shad trawl averages from 2000-2008 in Boulder Basin, Las Vegas Bay, sampling location.
37
zooplankton, comprising 76% of all zooplankton biomass over the nine-year dataset.
Concurrent with copepod abundance was a predictable boom-bust trend in shad for most
of the decade. However, from 2006-2008 shad counts/100m3 have declined as quagga
veliger biomass has increased. Cladoceran biomass in relation to shad has shown an
inverse oscillation from year-to-year which may suggest that shad gain better nutritional
value and thus be more dependant on cladocerans such as Daphnia spp. than the more
historically abundant copepods over this time-frame.
38
CHAPTER 5
SUMMARY, CONCLUSIONS, AND RECOMMENDATIONS
Discussion of Results
There continues to be a great amount of uncertainty for the future of the Lake Mead
fishery following the introduction of quagga mussel. Based on data presented in this
paper, the impact on the sport fishery in Lake Mead with the introduction of quagga
mussels has yet to be revealed. Due to the complexities involved in aquatic food web
dynamics, only time will reveal the true impact quaggas will have on Lake Mead
ecology. The discovery in 2008 of gizzard shad (Dorosoma cepedianum) in Overton
Arm may further complicate matters.
Results from stomach contents analysis of threadfin shad was largely inconclusive
based in part on small sample size, especially from Overton Arm collections (N = 27).
Moreover, method of catch in this study utilized trammel and gill nets of varying mesh
size. This factor probably allowed smaller shad to avoid capture in the two and three
inch portions of the nets, respectively. The bulk of threadfin shad were located in the
smallest one-third of nets, therefore limiting a representative sample. Moreover, results
from condition k-factor may not be reliable, considering that smaller shad were most
likely under-represented due to the aforementioned variability in mesh size.
Multiple studies have recognized the problem of rapid digestion in fish guts of soft-
bodied larval tissue due to mechanical and chemical processes (Hunter, 1981; Folkvord,
39
1993; Kim & DeVries, 2001; Schooley et al., 2008). Therefore, the ability to efficiently
quantify quagga veligers by this method has proved problematic. Although preservation
techniques used in this study were adequate for large-bodied cladocerans and copepods, it
was not practical for the delicate nature of veligers and may have explained the lack of
identifiable rotifers in gut contents of shad as well. Based on previous studies, immediate
examination of stomach contents is critical. Use of active capture methods such as
electrofishing, angling, or seining could reveal better results than the passive method of
capture conducted in this study—trammel and gill netting (Schooley et al., 2008).
Passive methods of capture most likely contribute to shad regurgitation of food contents,
which might explain the lack of small-bodied, delicate prey items. The stress induced in
threadfin shad while struggling to escape the nets could exacerbate this process.
As is evident with stomach contents analysis, available stable isotope data has yet to
reveal quantifiable trends in either trophic position or assimilated dietary items in
threadfin shad since quagga mussel invasion. Nevertheless, patterns in δ13C for both Las
Vegas Bay and Overton Arm have shown remarkably similar signatures over the three-
year dataset. This would suggest that quagga mussels may not as of yet had a deleterious
influence on quality and/or quantity of available dietary components. The remarkable
similarity in values of carbon isotope measurements between differing size-class of shad
serves to strengthen this contention.
Results from δ15N are more problematic to discern based on the infancy of this
investigation. Available nitrogen in the system may fluctuate due to a myriad of factors
unrelated to the presence of quagga, shifting trophic position based on other
environmental variables or disturbance. Inputs to Las Vegas Bay include nutrients
40
provided by the Las Vegas Wash, which differ markedly from the Muddy and Virgin
Rivers contributing to Overton Arm. Distribution of quagga mussels is not equally
representative from each region, furthering to complicate the data.
Background threadfin shad relative abundance gathered by NDOW prior to discovery
of quagga mussels is much more substantial in gleaning future impacts of the invasive
bivalve. The statistical significance in mean number of shad counted by year in Overton
Arm is indicative of fluctuations unrelated to quagga influence. If environmental
disturbance coupled with the impact caused by a highly invasive species coalesce, a
colossal crash in the food web could occur, irreversibly damaging the Lake Mead fishery.
Therefore, the ability to monitor background primary and secondary consumers over time
is an invaluable tool for future fishery management initiatives.
The quantification of zooplankton biomass in relation to shad abundance can be
compared spatially and temporally over the past decade. Although comparisons from the
1990s are lacking, valuable data is available to compare pre and post quagga invasion
from throughout Las Vegas Bay. The observation of high percentages in biomass of
copepods, for example, may change dramatically over time as quagga biomass continues
to increase, as has recently been observed in the Boulder Basin reach of Las Vegas Bay.
Threadfin shad and cladocerans have shown a clear cyclic pattern in abundance in the
years leading up to quagga mussel discovery at trawl location BB (Figure 11). This
observation suggests an important relationship in food web dynamics between threadfin
shad and cladocerans historically. The influence caused by veligers has yet to produce
quantifiable data into future perturbations in the shad/cladoceran cycle.
41
Prior to discovery of quagga mussels in Lake Mead, underestimation of rotifer counts
was probable due to standard methodology employed at that time for plankton tows.
Since quagga veliger sizes are substantially smaller in comparison with other
zooplankton species (Table 1), a reduction in net mesh size of approximately 20µm was
implemented immediately following quagga discovery in 2007. An underestimation of
rotifers prior to 2007 was likely owing to these organisms eluding capture in the larger
mesh tow nets. Caution, therefore, must be observed in assessing rotifer biomass pre-
2007.
Even though zooplankton data collection has been substantial by multiple agencies in
Lake Mead, historical Overton Arm data was not readily available to include in this
study. The acquisition of this data would be invaluable in making comparisons in food
web interactions for two distinct regions in Lake Mead. The downward trend in shad
abundance from 2000-2008 in Las Vegas Bay could be indicative of quagga influence,
but it is still uncertain until further data are collected.
Public Health Considerations
Threats to public health caused by the presence of quagga and zebra mussels have
been identified by researchers in the Great Lakes (Fields, 2005). These mussels have the
capability of bioaccumulating contaminants like polychlorinated biphenyls (PCBs) or
methylmercury at rates 10 times that of native mussels. The result is accumulation of
contaminants in sport fish which are commonly consumed by humans, leading to
exposure of harmful pollutants known to pose a threat to human health. The high
efficiency in which quagga mussels clarify water leads to promotion of increased plant
42
growth due to increased sunlight. When this new growth dies and decays, oxygen is
depleted and provides ideal conditions for the bacteria Clostridium botulinum to grow.
Similarly, zebra mussels have been linked to increases in blooms of the toxic algae
Mycrocystis. The proliferation of pseudofeces releases by mussels has provided nutrients
that feed the Mycrocystis.
Although not necessarily a direct threat to human health, the presence of unwanted
aquatic organisms like C. botulinum, Microcystis, or the proliferation of cyanobacteria
blooms do threaten water quality and promote toxins which, when bioaccumulated, pose
serious concerns for those consuming contaminated fish. If it can be determined over
time that threadfin shad utilize quagga mussels as a food source, the consequence could
be bioaccumulation of toxins which could alter the food web forever in Lake Mead. The
results observed between the round goby (Neogobius melanostomus) and quagga/zebra
mussels by Great Lakes researchers is an example of such a deleterious food web
interaction (Rutzke et al., 2000; Fields, 2005).
Conclusions and Recommendations for Further Study
The impact on the Lake Mead sport fishery owing to the quagga mussel introduction
is uncertain. Since little is known as to how quagga mussels will adapt to the desert
southwest environment, only time will tell the true impact. This study attempted to create
a baseline food web profile using threadfin shad as the key constituent in the future
viability of a popular bass fishery. Included in the analysis was the attempt to inventory
food items available to shad in two areas of Lake Mead—Las Vegas Bay and Overton
Arm.
43
Research was conducted through stomach contents analysis and supplemented by
stable isotope analysis. The goal being to identify whether shad could be utilizing
quagga mussels as a dietary item, either directly through visual estimation of gut
contents, or indirectly through the transfer of trophic energy through the aquatic
ecosystem. Although visual estimations were lacking, shad may utilize mussels as part of
the diet. Stomach contents analysis, however, may not provide an efficient or practical
means of determining this end. Finally, a comprehensive database was developed which
contains historical larval shad abundance and zooplankton biomass calculations which
can be used in the future to monitor impacts caused by quagga mussels as it relates to
fishing interests.
Results were inconclusive whether threadfin shad have the ability to assimilate
quagga mussel veligers based on stomach contents analysis. Preservation technique
remained consistent; however, the amount of time in which extracted stomachs remained
archived may have led to considerable degradation of specific food items. In some cases,
stomachs were analyzed >10 months after field collection concluded. Furthermore, the
fragile morphological features of quagga veligers probably led to advanced chemical and
mechanistic degradation even before each stomach was removed.
After performing stable isotope analysis on larval and adult threadfin shad post
quagga mussel introduction, results were more telling. Based on comparison data from
Umek et al., in press, larval and adult δ13C profiles varied very little (Table 4). This
indicates the suspected shift towards a more benthic diet has not occurred with the
coinciding presence of quagga mussels in either Las Vegas Bay or Overton Arm.
Predictably, δ15N signals differed between larval and adult stages in threadfin shad.
44

Comparing life-stage data from 2008 suggests that larval shad hold a different trophic
position than adult counterparts based on nitrogen content in the system. Overall, it
appears quagga mussels have yet to influence a shift in shad energetics away from a
pelagic, open water feeding strategy based on food availability constraints.
Results of stable isotope analysis from 2007-2009 were not uniform across seasons.
Data gathered from Umek et al. (in press) was a combined summary of adult shad
collected from March through November in both Las Vegas Bay and Overton Arm in
year 2007. Conversely, data from 2008 was gathered from March only from the two lake
regions under study. Threadfin shad samples from both areas in 2009 were collected in
February. Annual comparisons regarding stable isotope signatures in the future would be
more valuable if they were compared based on individual season, respectively. A
seasonal analysis would provide a better understanding of food web dynamics by
determining if there is an observed shift in δ13C and δ15N profiles from one season to the
next. Environmental and ecological factors such as water temperature or diel patterns
most likely fluctuate greatly depending on season, causing shad to shift feeding strategies
accordingly.
This study was the first to develop a zooplankton biomass index specifically for Lake
Mead for comparison with larval shad trawl data over time. Data was compiled from
multiple sources to show the relationship of how relative shad abundance has decreased
as a result of increasing quagga veligers. Although zooplankton data was not available
for Overton Arm, comparisons could be made from shad trawls conducted in Las Vegas
Bay from 2000-2008 (Figures 10-11). The historic record has shown a decline in mean
shad counts from Inner Las Vegas Bay (ILV) and Boulder Basin (BB) sampling locations
45
since quaggas were identified. Copepod biomass coincided with peak shad numbers
from one end of Las Vegas Bay to the other pre-quagga presence. In each of the two
years quagga mussel biomass has increased at BB, a subsequent decline in shad has been
recorded. It is too soon in the investigation; however, to conclude the decline in shad is
related to quagga mussel increases, especially since copepod biomass has remained high
throughout the decade. In summary, since abundance in quality dietary items such as
copepods and cladocerans have remained proportionally similar pre and post quagga
mussels, there is no evidence to suggest quaggas are impacting threadfin shad or
zooplankton dynamics negatively at this time.
Since quagga mussel invasion is a recent phenomenon in this region of the U.S.,
many protocols and research needs have yet to be developed. One recommendation
which should be investigated is the need to understand the assimilation of quagga veliger
once it enters the stomach of the threadfin shad. The soft-bodied, miniscule properties of
this organism make it difficult to identify. Studies related to degradation over time could
be administered in a controlled environment in an attempt to evaluate the future
plausibility of conducting gut content analysis in the targeted search for veligers.
When conducting field collections of adult shad, regardless of what hypotheses are
set forth, using the appropriate net is critical. Whenever possible, utilizing a one inch
mesh trammel or gill net maximizes total catch, enhancing sample sizes which have
frequently hindered ecological studies.
Establishment of a quagga mussel stable isotope signature would greatly enhance the
ability to recognize how the food web is structured in the context of other organisms in
the ecosystem—specifically zooplankton, shad, and bass. Similarly, a possible
46

application to veliger detection in fish would be to incorporate Polymerase Chain
Reaction (PCR) techniques employed to easily and efficiently detect the presence or
absence of veligers, which recently have been used to detect veligers in plankton samples
(Frischer et al., 2002; Livi, et al., 2006). The development of such technology would not
eliminate the need to perform tedious stomach content analysis for abundance purposes,
however. A field device that quickly identifies molecular composition and DNA
sequencing would expedite research in the field of quagga mussel ecology in Lake Mead.
As a species of concern in Lake Mead, an expansion of research on the endangered
razorback sucker habitat requirements should be considered. As quagga mussels are
voracious filter feeders, able to deplete nutrients and reduce turbidity in the water
column, an indication of sport fish health could be gleaned from razorback success or
failure. Larval survivability could decrease with increased water clarity, leading to
increased predation by species like striped bass in the short-term. Long-term
consequences might include like-wise effects on the sport fish population.
Perhaps most critical to further study into influences caused by quaggas is continued
monitoring and data collection post-invasion. Since quaggas were first discovered in
2007, very little data is available to gauge long-term impact. Larval shad trawls
conducted by NDOW, coupled with zooplankton collections by the SNWA and USBR
must continue if trends are to be determined. Ongoing stable isotope profiles in Las
Vegas Bay and Overton Arm performed in this study, as well as others, need to continue
in order gain insight into changes in energetics among primary and secondary consumers
over time.
47

Long-term monitoring goals for Lake Mead based on quagga mussel influence need
to be implemented if the sport fishery is to be sustained. Mapping spatial variability of
quagga mussel veligers in Lake Mead needs to be established to track movements. In
order to accomplish this goal, many variables need to be taken into consideration.
Monitoring efforts should be geared towards potential seasonal migrations, either to
different locations in the lake or through different zones throughout the water column.
Finding a discernable pattern in quagga mussel movements would give researchers the
much needed ability to understand the biology of quagga mussels in the arid southwest
over time and how they may be evolving to fit the Lake Mead niche.
Fortunately, several agencies have been gathering critical Lake Mead biological data
for at least a decade and even longer. Continued efforts in assessing recruitment of larval
threadfin shad by NDOW must continue in historic sampling locations if any information
is to be gleaned from quagga mussel impacts in the future. The addition of a more
comprehensive trawling program in reaches other than Las Vegas Bay and Overton Arm
should also be considered, especially in areas of Lake Mead where threadfin shad
consistently congregate based on historic NDOW knowledge. The expansion of shad
trawls would add significant data to an already comprehensive historical record into the
primary food source for valuable species of game fish such as striped bass and
largemouth bass.
Implementation of sampling stations specifically designed to monitor quagga mussel
abundance should be spread lake-wide. Monitoring quagga mussel population dynamics
is not only salient to the future of the Lake Mead fishery, but also to infrastructure and
potential public health threats. Expansion of existing water quality and plankton
48
monitoring stations carried out by agencies such as the SNWA or USBR would expedite
valuable biological information as Lake Mead learns to function in the presence of this
highly invasive organism.
49
REFERENCES
Amundsen, P.A., Gabler, H.M., & Staldvik, F.J. (1996). A new approach to graphical analysis of feeding strategy from stomach contents data—modification of the Costello (1990) method. Journal of Fish Biology, 48: 607-614. Bayne, B., Gabbott, P., & Widdows, J. (1975). Some effects of stress in the adult on
the eggs and larvae of Mytilus edulis. Journal of the Marine Biological Association U.K, 55: 675-689.
Berg, J. (1979). Discussion of methods of investigating the food of fishes, with reference
to a preliminary study of the prey of Gobiusculus flavescens (Gobiidae). Marine Biology, 50: 263-273.
Blanco, S., Romo, S., Villena, M.J., & Martinez, S. (2003). Fish communities and
food web interactions in some shallow Mediterranean lakes. Hydrobiologia, 506-509: 473-480.
Cabana, G., & Rasmussen, J.B. (1994). Modelling food chain structure and containment
bioaccumulation using stable nitrogen isotopes. Nature (London), 372: 255-257. Claxton, W.T., Wilson, A.B., Mackie, G.L., & Boulding, E.G. (1998). A genetic and morphological comparison of shallow and deep water populations of the introduced dreissenid bivalve Dreissena bugensis. Canadian Journal of
Zoology, 76: 1269-1276. Collares-Pereira, M.J., Martins, M.J., Pires, A.M., Geraldes, A.M., & Coelho, M.M.
(1996). Feeding behaviour of Barbus bocagei assessed under a spatio temporal approach. Folia Zoology, 45: 65-76.
Crow, M.E. (1982). Some statistical techniques for analyzing the stomach contents of fish. In: G.M. Cailliet & C.A. Simenstad (ed.) Gutshop ’81: Fish food habits studies; Proceedings of the Third Pacific Workshop. Washington Sea Grant Publication, Seattle. P. 8-15. Deacon, J.E., Paulson, L.J., & Minckley, C.O. (1972). Effects of Las Vegas Wash
effluents upon bass and other game fish reproduction and success. Final report: Nevada Department of Fish and Game. P. 74.
50
Dermott, R. & Munawar, M. (1993). Invasion of Lake Erie offshore sediments by Dreissena, and its ecological implications. Canadian Journal of Fisheries and Aquatic Sciences, 50: 2298-2304. Fields, S. (2005). Great Lakes Resource at risk [Electronic version]. Environmental Health Perspectives, 113: A164-A173. Folkvord, A. (1993). Prey recognition in stomachs of cannibalistic juvenile cod (Gadus morhua L.). Sarsia, 78: 97-100. Frischer, M. E., Hansen, A.S., Wyllie, J.A., Wimbush, J., Murray, J., & Nierzwicki- Bauer, S.A. (2002). Specific amplification of the 18S rRNA gene as a method to detect zebra mussel (Dreissena polymorpha) larvae in plankton samples. Hydrobiologia, 487: 33-44. Gu, B., Shell, D.M., & Alexander, V. (1994). Stable carbon and nitrogen isotopic analysis of the plankton food web in a subarctic lake. Canadian Journal of Fisheries and Aquatic Sciences, 51: 1338-1344. Haskell, W.M. (1959). Diet of the Mississippi threadfin shad, Dorosoma petenense atchafalyae, in Arizona. Copeia, 4: 298-302. Holanov, S.H. & Tash, J.C. (1978). Particulate and filter feeding in threadfin shad,
Dorosoma petenense, at different light intensities. Journal of Fisheries Biology, 13: 619-625.
Hunter, J.R. (1981). Feeding ecology and predation of marine fish larvae. In: R. Lasker (ed.) Marine fish larvae: Morphology, ecology, and relation to fisheries. Washington Sea Grant Program, Seattle. P. 33-71. Hyslop, E.J. (1980). Stomach contents analysis—A review of methods and their application. Journal of Fisheries Biology, 17: 411-429. Johnson, L.E. (1995). Enhanced early detection and enumeration of zebra mussel
(Dreissena spp.) veligers using cross-polarized light microscopy. Hydrobiologia,312: 139-146.
Karjalainen, J., Leppä, M., Rahkola, M., & Tolonen, K. (1999). The role of benthivorous
and planktivorous fish in a mesotrophic lake ecosystem. Hydrobiologia, 408-409:73-84.
Kim, G.W., & DeVries, D.R. (2001). Adult fish predation on freshwater limnetic fish larvae: A mesocosm experiment. Transactions of the American Fisheries Society, 130: 189-203.
51
Krebs, C.J. (1999). Ecological Methodology: Second Edition. Benjamin/Cummings. Menlo Park, CA. LaBounty, J.F. & Roefer, P. (2007). Quagga mussels invade Lake Mead. Lakeline, Fall:
17-22.
LaBounty, J.F.& Burns, N.M. (2005). Characterization of Boulder Basin, Lake Mead, Nevada-Arizona, USA – Based on analysis of 34 limnological parameters. Lake and Reservoir Management, 21(3): 277-307.
LaBounty, J.F., Holdren, G.C., & Horn, M.J. (2004). The limnology of Boulder Basin, Lake Mead, Arizona-Nevada: Report of Findings 1990-1998. U.S. Bureau of Reclamation Tech. Mem. No. 8220-04-10. Bur. Reclam. Tech. Svc. Ctr.
Laney, E. (2008, April). Dreissena’s in warm water. In L. Michaelson (Chair),
Quagga and zebra mussel control strategies workshop for western U.S. water facilities. Symposium sponsored by the Southern Nevada Water Authority, American Water Works Association, and Metropolitan Water District of Southern California, Las Vegas, Nevada.
LaRivers, I. (1962). Fishes and fisheries of Nevada. Nevada State Fish and Game Commission, State Printing Office, Carson City. p. 781. Livi, S., Cordisco, C., Damiani, C., Romanelli, M., & Crosetti, D. (2006). Identification of bivalve species at an early developmental stage through PCR-SSCP and sequence analysis of partial 18S rDNA. Marine Biology, 149: 1149-1161. MacIsaac, H.J. (1996). Potential abiotic and biotic impacts of zebra mussels on the inland waters of North America. American Zoologist, 36: 287-299. May, B. & Marsden, J.E. (1992). Genetic identification and implications of another
invasive species of Dreissenid mussel in the Great Lakes. Canadian Journal of Fisheries and Aquatic Sciences, 49: 1501-1506.
Mersch, J. & Pihan, J.C. (1993). Simultaneous assessment of environmental impact
on condition and trace metal availability in zebra mussels Dreissena polymorpha transplanted into the Wiltz River, Luxembourg. Comparison with the aquatic moss Fontinalis antipyretia. Archives of Environmental Contamination Toxicology, 25: 353-364.
Miller, R.R. (1950). A review of the American clupeid fishes of the genus Dorosoma. Bulletin U.S. Natural Museum, 100: 387-410. Miller, R.V. (1961). The food habits and some aspects of the biology of the threadfin shad, Dorosoma petenense (Gunther). M.S. Thesis, University of Arkansas Fayetteville. p. 46.
52
Mills, E.L., Rosenberg, G., Spidle, A.P., Ludyanskiy, M., Pligin, Y., & May, B.
(1996). A review of the biology and ecology of the quagga mussel (Dreissena bugensis), a second species of freshwater Dreissenid introduced to North America. American Zoologist, 36(3): 271-286.
Mills, E.L., Dermott, R.M., Roseman, E.F. & Dustin, D., Mellina, E, Conn, D.B., & Spidle, A.P. (1993). Colonization, ecology, and population structure of the
“quagga” mussel (Bivalvia: Dreissenidae) in the Lower Great Lakes. Canadian Journal of Fisheries and Aquatic Sciences, 50: 2305-2314.
Minckley, W.L. (1973). Fishes of Arizona. Arizona Fish and Game Department. Arizona State University, Department of Zoology and Lower Colorado River Research Laboratory. p. 293.
Mitchell, M.J., Mills, E.L., Idrisi, N., & Michener, R. (1996). Stable isotopes of
nitrogen and carbon in an aquatic food web recently invaded by Dreissena polymorpha(Pallas). Canadian Journal of Fisheries and Aquatic Sciences, 53: 1445-1450.
Moyle, P.B. & Cech, Jr., J.J. (1982). Fishes: An introduction to ichthyology. Prentice- Hall. Englewood Cliffs, NJ. Nevada Department of Wildlife Statewide Fisheries Management: Federal Aid Job Progress Reports F-20-38. 2006, Lake Mead Southern Region. P. 27. Nichols, S.J. & Black, M.G. (1994). Identification of larvae: Zebra mussel (Dreissena polymorpha), quagga mussel (Dreissena bugensis), and the Asian clam (Corbicula fluminea). Canadian Journal of Zoology, 72(3): 406-417. Olsen, R.E. & Ringø, E. (1999). Dominance hierarchy formation in Arctic charr
Salvelinus alpinus (L.): Nutrient digestibility of subordinate and dominant fish. Aquaculture Research, 30: 667-671.
Pelle, W.L. (1989). Temporal and spatial patterns of abundance of age 0 threadfin shad (Dorosoma petenense) in Overton Arm, Lake Mead. M.S. Thesis, University of Nevada, Las Vegas. p. 41.
Peterson, B.J. & Fry, B. (1987). Stable isotopes in ecosystem studies. Annual Review of Ecology and Systematics, 18: 293-320. Pinkas, L., Oliphant, M.S., & Iverson, I.L.K. (1971). Food habits of albacore, bluefin tuna, and bonito in California waters. California Fish & Game, 152: 1-105. Pothoven, S.A. & Nalepa, T.F. (2006). Feeding ecology of lake whitefish in Lake Huron. Journal of Great Lakes Research, 32: 489-501.
53
Prejs, A., Lewandowski, K., & Stanczykowska-Piotrowska, A. (1990). Size-selective predation by roach (Rutilis rutilus) on zebra mussel (Dreissena polymorpha): Field studies. Oecologia, 83: 378-384. Reeders, H.H., & Bij de Vaate, A. (1990). Zebra mussels (Dreissena polymorpha): A new perspective for water quality management. Hydrobiologia, 200/201: 437- 450. Rutzke, M.A., Gutenmann, W.H., Lisk, D.J., & Mills, E.L. (2000). Toxic and nutrient element concentrations in soft tissues of zebra and quagga mussels from Lakes Erie and Ontario. Chemosphere, 40: 1353-1356. Schooley, J.D., Karam, A.P., Kesner, B.R., Marsh, P.C., Pacey, C.A., & Thornbrugh, D.J. (2008). Detection of larval remains after consumption by fishes. Transactions of the American Fisheries Society, 137: 1044-1049. Shevtsova, L.V. (1968). Spawning and development of Dreissena in the canal
Dneiper-Krivoi Rog. Yidzobiol. Zhurual, 4: 70-72. (In Russian). Snyder, F.L., Hilgendorf, M.B., & Garton, D.W. (1997). Zebra mussels in North America: The invasion and its implications! Ohio Sea Grant, Ohio State University, Columbus, OH. URL: http://www.sg.ohio-state.edu/f-search.html Spidle, A.P., Marsden, J.E., & May, B. (1994). Identification of the Great Lakes
quagga Mussel as Dreissena bugensis from the Dnieper River, Ukraine, on the basis of allozyme variation. Canadian Journal of Fisheries and Aquatic Sciences, 51:1485-1489.
Standard Methods for the examination of water and wastewater: 19th Ed. 1995. Eaton, A.D., Clesceri, L.S., & Greenberg, A.E., Eds. Strayer, D.L. & Malcom, H.M. (2006). Long-term demography of a zebra mussel (Dreissena polymorpha) population. Freshwater Biology, 51: 117-130. Umek, J., Chandra, S., Rosen, M., Goodbred, S., & Orsak, E. (in press). The contemporary food web structure of two bays in Lake Mead. Lake and Reservoir Management. Manuscript in preparation. United States Geological Survey (USGS), Great Lakes Science Center. U.S.
Department of the Interior. Retrieved 10 March, 2008 from: http://www.glsc.usgs.gov/main.php?content=research_invasive_zebramussel& title=Invasive%20Invertebrates0&menu=research_invasive_invertebrates. Updated: 31 January, 2008.
54
Vander Zanden, M.J., Chandra, S., Park, S-K, Vadeboncoeur, Y., & Goldman, C.R. (2006). Efficiencies of benthic and pelagic trophic pathways in a subalpine lake. Canadian Journal of Fisheries and Aquatic Sciences, 63: 2608-2620. Vander Zanden, M.J., Casselman, J.M., & Rasmussen, J.B. (1999). Stable isotope evidence for the food web consequences of species invasions in lakes. Nature, 401: 464-467. Wilde, G.R. (1984). Seasonal and spatial heterogeneity in the limnetic zooplankton community of Lake Mead. M.S. Thesis, University of Nevada, Las Vegas.
55
VITA
Graduate College University of Nevada, Las Vegas
Eric Michael Loomis
Home Address: 9100 West Flamingo Road, #2069 Las Vegas, Nevada 89147 Degrees: Bachelor of Arts, Environmental Studies, 2003 University of Nevada, Las Vegas Special Honors and Awards: Completion of Undergraduate Senior Thesis I & II, with Distinction Environmental Studies Department Greenspun College of Urban Affairs University of Nevada, Las Vegas, 2003 Thesis Title: Trophic Interactions Associated with Introduction of the Invasive Quagga Mussel in Lake Mead, Nevada Thesis Examination Committee: Chairperson, Dr. Shawn Gerstenberger, Ph. D. Committee Member, Dr. David Wong, Ph. D. Committee Member, Dr. Chad Cross, Ph. D. Graduate Faculty Representative, Dr. Helen Neill, Ph. D.
56

57