Embed Size (px)
Citation preview

TRIPPTRANSPORTATION RESEARCH AND INJURY PREVENTION PROGRAMME
IND IAN INST I TUTE OF TECHNOLOGY DELH I
WHO COLLABORATING CENTRE
The Road AheadThe Road Ahead
Traffic Injuries and Fatalities in IndiaTraffic Injuries and Fatalities in India
Dinesh MohanDinesh Mohan
April 2004April 2004

The road ahead:
Traffic injuries and fatalities in India
“Too often, road safety is treated as a transportation issue, not a public health issue, and road traffic injuries are called “accidents,” though most could be prevented. As a result, many countries put far less effort into understanding and preventing road traffic injuries than they do into understanding and preventing diseases that do less harm. Every day as many as 140 000 people are injured on the world’s roads. More than 3,000 die and some 15,000 are disabled for life. Each of those people has a network of family, friends, neighbours, colleagues or classmates who are also affected, emotionally and otherwise. Families struggle with poverty when they lose a breadwinner or have the added expense of caring for disabled family members.”
Dr. LEE Jong-wook, WHO Director-General (1).
INTRODUCTION Road Traffic Injuries (RTI) are the only public health problem where society and decision
makers still accept death and disability on a large scale among young people. This human sacrifice is deemed necessary to maintain high levels of mobility and is seen as a necessary “externality” of doing business. Discussion only revolves around the number of deaths and injuries we are willing to accept.
According to official statistics 80,118 persons were killed and 342,200 injured in road traffic
crashes in India in the year 2000 (2). However, this is an underestimate, as not all injuries are reported to the police. The actual numbers are likely to have been in the region of 1,200,000 persons with injuries requiring hospital treatment and 5,600,000 persons sustaining minor injuries. The situation in India is worsening and RTI have been increasing over the past twenty years (Figure 1). This is partly due to the increase in the number of vehicles on the road and partly due to the absence of a coordinated official policy to control the problem. These data show that the number of fatalities have continued to increase at approximately the same rate of about five percent a year over the past two decades. The fatality rate per million vehicles has remained around 2 for the past few years, whereas, the rate per million population continues to increase and is around 80 at present.
0
1 0
2 0
3 0
4 0
5 0
6 0
7 0
8 0
9 0
1 9 6 1 1 9 6 6 1 9 7 1 1 9 7 6 19 8 1 1 9 8 6 1 9 9 1 1 9 9 6 2 0 0 0
Y e a r
V e h ic le s , m i l l io n
F a ta l i t ie s , t h o u s a n d s
Figure 1. Growth of motor vehicle population (registered) and road traffic fatalities in India (Source: Ministry of Road Transport and Highways)

Traffic Injuries and fatalities in India
2
India is experiencing a new phenomenon in road traffic patterns and crashes for which there is little precedence in the highly motorised countries (HMC). Here the same road space gets used by modern cars and buses, along with locally developed vehicles for public transport (three-wheeled scooter taxis), scooters and motorcycles, bicycles, rickshas, and animal and human drawn carts. The infrastructure design based on homogeneous traffic models, has failed to fulfil the mobility and safety needs of this mixed traffic.
Non-motorised transport (NMT) constitutes a significant share of the total traffic in Indian
cities and almost all of them experience a relatively high proportion of bicycle traffic (Figure 2). The share of NMT at peak hour varies from 30-70% depending on the city and the road. The proportion of trips undertaken by bicycles range between 15 and 35 per cent, the share tending to be higher in medium and small size cities (3). The patterns of NMT use change with growth in city size. In most
NMT dependent cities, bicycles are used for the entire trip (e.g., commuting, shopping). Every motorised public transport trip involves access trips by NMT at each end. Thus, NMT including walking continues to play a very important role in meeting the travel demand in Indian cities.
In HMCs a very large proportion of the
population owns motorised vehicles. These countries can also afford to have roads parallel to limited access expressways and the former are used by local traffic and by vehicles not allowed on expressways. In India, highways pass through rural areas with high-density populations where most of the people do not have access to motor vehicles. Four-lane divided highways in India do
not have parallel road links for slow and non-motorised traffic. This forces slow and non-motorised traffic to use these highways and to cross them under very hazardous conditions for all concerned. It is not surprising that a majority of the victims of road crashes on inter city highways are the vulnerable road users (Figure 3). Highway planning standards provide for services needed by motorised vehicle users, but there are no standards for providing services needed by NMT. These services mushroom along urban or intercity highways to fulfil the demands of road users; however, their existence is viewed as an "illegal encroachment" on the designed road space.
The HMCs have never experienced road
traffic that includes such a high proportion of motorcycles, buses and trucks sharing the same road space with pedestrians and bicyclists. When the present HMCs had low per capita incomes in the earlier part of the last century, motor vehicles (including motorcycles) were relatively more expensive and not capable of as high velocities and accelerations. Therefore, speeds were lower and number of vehicles using the roads was less than that seen today. In a sense, motor-vehicle technology, roadway quality and social systems were more compatible. On the other hand, in India new designs have to be developed for use of technologically advanced vehicles using relatively “less advanced” roadways and
enforcement systems. The fact that these patterns are new and that they need to be understood through careful scientific research is not realised by most policy makers. If we just depend on HMC standards and research results to solve problems in India, we may find the outcome very unsatisfactory.
Figure 2. Mixed traffic in urban areas.
Figure 3. Non-motorized traffic on four-laned divided highways.

Dinesh Mohan
3
INJURIES AND FATALITIES: NUMBERS AND PATTERNS Estimate of injuries and fatalities
According to official statistics 80,118 persons were killed and 342,200 persons injured in road traffic crashes in India in 2000 (2). However, a study done in Bangalore shows that while the number of traffic crash deaths recorded by the police is reasonably reliable, the total number of injuries is grossly underestimated (4). According to this study, deaths were underestimated by 5% and the number injured who needed treatment in hospitals by more than a factor of two. In this study, the ratio of injured people reporting to hospitals to that killed was 18:1. It is important to note that even this ratio would be an underestimate as among those injured many others would have taken treatment at home or from private medical practitioners. Another detailed study done in Haryana (India) recorded all traffic-related injuries and deaths through bi-weekly home visits to all households in 9 villages for a year (5). This study showed that the ratio between critical, serious and minor injuries was 1:29:69. In 1998 in U.S.A. 41,471 persons were reported killed and 3,192,000 injured, giving a ratio of 1:77 for recorded fatalities:injuries. Other studies from HMCs for ratios between deaths:serious-injuries:minor-injuries give statistics of 1:13:102 (6) and 1:14:80 (7).
Using the epidemiological evidence from India and other countries where better records are
available, a conservative estimate can be made that the ratios between deaths, injuries requiring hospital treatment and minor injuries to be 1:15:70 in India. If the estimate of road traffic fatalities in India in the year 2000 is taken as 80,000, then the estimate of serious injuries would be 1,200,000, and that for minor injuries 5,600,000. If we assume a 5% growth rate per year then the total number of RTI in India in 2004 may be around 95,000-100,000 fatalities, 1,500,000 serious injuries, and 7,000,000 minor injuries.
Vehicle ownership and crash rates Figure 4 shows the proportion of vehicles
registered in India and three HMCs. These data show that the car population as a proportion of total motor vehicles is much less in India than in the HMCs (13% vs 56-80%) and that the proportion of motorised two-wheelers (MTW) much higher (70% vs 5-18%).
These differences in fleet composition
affect the traffic and crash patterns enormously. Figure 5 shows that pedestrians, bicyclists and MTW riders constitute a larger proportion of road crash victims in India than in HMCs (data from (8-11)) . Pedestrians, bicyclists and MTW riders, who constitute the vulnerable road users, constitute 60-80 per cent of all traffic fatalities in India. This flows logically from the fact that this class of road users forms the majority of those on the road. In addition, because metallic or energy absorbing materials do not protect VRUs, they sustain relatively serious injuries even at low velocity crashes.
Road traffic injuries per day in India (estimate)
Deaths 270 Permanent injuries 1,000 Serious injuries 4,000 Minor injuries 18,000
0% 20% 40% 60% 80% 100%
India (2000)
Germany (2001)
U.S.A. (2001)
Japan (2001)
Two wheelers Cars, jeeps Buses, trucks, other
Figure 4. Proportion of vehicles registered in India, Germany, Japan and USA.

Traffic Injuries and fatalities in India
4
International trends Figure 6 shows the data for the total number of people killed in road traffic crashes per million
persons in different countries plotted against the per capita incomes of the respective countries in US dollars per year. The number killed per million population is a good index of the health and emotional burden imposed on the people of the country. This measure gives an overall assessment of road traffic injuries as a health burden for society. This index helps us compare the relative ranking of RTI as a health problem compared with other diseases. When this index is low, it is better for governments and individuals. If road safety policies are successful on the aggregate, then fewer people will get killed and injured as a proportion of the population.
0 10 20 30 40 50 60 70 80
Japan
USA
Germ any
Delhi
Mum bai
Indian highways*
Fatalities , percent
Pedestrians Bicylc is ts MTW Cars
Figure 5. Proportion of different types of road users killed in Delhi, Mumbai, national highwaysin India and in highly motorised countries (* Average for 14 locations, MTW – motorised two-wheelers).
100 1000 10000 100000Country per capita income per year, USD
50
100
150
200
250
300
Fata
litie
s pe
r m
illio
n po
p ula
tion
p er y
ear
ET
SL
MZ
MW
TZ
NP
UGNG
YE
ZM
KH CFBD
GHKE
VN
BJ
MNMD
NI
IN
PK
ZW
ID
AMSN
AZ
HN
UA
CN
GY
GE
LK YU
BO
PH
SY
CU
MA
KZ
AL
BA
JM
SZ
BG
EC
JO
RO
IRMK
RU
SV
PE
PY
TH
CO
CH
US
JPNO
DKSE
FI
AT
NL
DE
IE
UK
BEFR
AUCA
IT
AE
IL
ES
CY
NZ
TW
GR
PT
SI
KRAR
BHBB
UYLY
MX
CZHU
TT
CL
OM
HRPL
CR
MU
SK
EE
MY
VE
TR
BR
BYZA
BW
PA
LV
LT
BZ
NA
?
Figure 6. Fatalities per million population for different countries (position of India inside circle).

Dinesh Mohan
5
Among low income countries, India occupies a middle position at about 80 fatalities per year per million population. However, these data show that most middle-income countries have much higher fatality rates than low income and high-income countries. On the other hand, at each level of income, the ratio between the best (lowest rate) and the worst (highest rate) countries is a factor of 4-5. At present the lowest rates tend to be in the poorest countries and the highest among countries whose income levels are between USD 3,000 and 15,000 per capita GDP. For countries with incomes above USD 15,000, all values are below midrange. However, some countries do experience low per capita fatality rates at all levels of income.
At income levels below USD 1,000 the rates generally vary between 20 and 100 fatalities/m
persons. Among middle-income countries (USD 2,000 - 8,000) the rates go as high as 250-300 for some countries. At high-income levels (USD >20,000) we see that USA is at 150 fatalities/m compared with UK, Sweden, and Netherlands which are between 60 and 70 fatalities/m. All the four countries have similar knowledge bases, availability technology, and funding. Detailed studies are not available to understand these differences. It appears that as incomes increase, countries start building road infrastructure that encourages high speeds without enough attention to safety issues. When this happens, the death rates increase. An additional complicating factor is that if low-income neighbourhoods straddle these high-speed highways you get high vehicle fatalities and high pedestrian fatalities. However, most countries with high incomes set up road safety agencies and research groups that help reduce the incidence of RTI in urban areas and intercity highways by providing safer designs of vehicles, roads, roadside furniture, and more effective police enforcement.
According to a study conducted by the
World Bank, the annual number of road traffic deaths is projected to increase by 83% in the low-income and middle-income countries by 2020 (12). The lesson to be learned from these trends and international experience is that most countries experience a sharp increase in RTI as they move from low-income levels to middle-income levels if they do not arrange for giving road safety measures a high level of importance in all aspects of transportation policy. This will need concerted action based on scientific knowledge and implementation of proven measures.
Almost every one has an opinion on what could make the roads safer and this makes road
safety a highly politicized issue. Policy planners and the media use anecdotal information all too often to set priorities and thus issues are not understood as major traffic safety problems requiring scientific input. Policy decisions for effective road injury prevention need to be based on data and objective information, not on anecdotal evidence. Most of the scientific information on road safety exists piecemeal in technical periodicals and grey literature. And, because the science of traffic safety is a complex, multidisciplinary gathering together of expertise in specialized areas of study that do not normally coalesce it becomes even more difficult for policy makers to chart out effective courses of action. This is why it has been difficult for motorizing nations to be reduce the carnage on their roads. However, now much of this information has been collected in scientific reviews and texts like the World Report on Road Traffic Injury Prevention published by the World Health Organization (13) which are easily available. Policy makers did not have the benefit of such information earlier, but it should be possible for less motorized counties like India to set more effective road safety policies now.
If policy makers in India take advantage of the evidence based information of successes and
failures around the world and adapt it to conditions prevalent here, then we can hope for a safer future. In India, the vast burden of road traffic injury will continue to be borne by vulnerable road users (pedestrians, bicyclists and motorcyclists) for some time to come. If we focus on these road users and adopt effective road safety policies, then it is possible that we can escape the trend followed by other countries and follow a trend as indicated by the arrow in Figure 6.
Road traffic injuries are a huge public health and development problem, killing almost 1.2 million people a year and injuring or disabling between 20 million and 50 million more. Both WHO and World Bank data show that, without
appropriate action, these injuries will rise dramatically by the year 2020, particularly in
rapidly-motorizing countries. Not only is 90% of the current burden borne by low-income and middle-income countries, but the increase in
casualty rates will be greatest in these countries (13).

Traffic Injuries and fatalities in India
6
Traffic crashes in metropolitan cities The total number of road traffic fatalities in
metropolitan cities of India are shown in Table 1. The issues regarding traffic crashes in urban areas may be understood by the fact that at present less than one in 40 families owns a car in India and all urban roads are used by pedestrians and motorised as well as non-motorised vehicles.
Vulnerable road users
Table 2 shows the number of two-wheelers and three-wheelers as proportion of all vehicles registered in Indian cities (14). Studies from different cities also show that bicycles constitute 10% - 35% of all trips in most cities of India (3). This shows vulnerable road users constitute the vast majority on the road in Indian cities. Figure 5 shows the proportion of different road users killed in Delhi and Mumbai. In both these cities car occupants constitute less than 5% of all the fatalities and vulnerable road users more than 80%. Similar data for all cities are not available in the public domain, but considering that road user proportions are similar in most cities, we cans safely assume that fatality patterns will also be similar.
Speed
Vehicle speeds on many of the main arterials can be more than 50 km/h (for example at night) which can result in serious injuries to vulnerable road users (15;16). Data from Delhi shows that forty per cent of the fatal bicycle crashes occur during peak hours when volumes are significantly higher but speeds are lower (20 to 30 km/h). During this period there is serious conflict between the movement of non-motorised users with motorised vehicles sharing the same curbside lane (17;18).
Buses and trucks
Of the peak hour bicycle fatalities, 62% involve collisions with buses or trucks. And, of all bicycle fatalities, 73% occur at mid-block. Table 3 shows the proportion of various vehicles involved in fatal crashes in Delhi and Mumbai. Heavy vehicles are
involved in a significantly larger proportion of fatal crashes than cars. This is because heavy vehicles use the centre or the curbside lanes which are also used by vulnerable road users. The differences in speeds and masses of the conflicting road users sharing the same road space result in fatal crashes (17).
Buses and trucks are involved in a higher proportion of fatal crashes with pedestrians,
bicyclists and motorcyclists than in non-fatal crashes (11;17-20). Motorised two wheelers and cars have a higher involvement in non-fatal crashes than in fatal crashes. This is generally true for most urban and suburban areas.
Kanpur 438 Vishakhapatnam 190Delhi 1736 Chennai 671Jaipur 312 Bhopal 162Nagpur 255 Pune 316Coimbatore 157 Vadodra 148Hyderabad 445 Varanasi 103Bangalore 659 Mumbai 1361Indore 173 Patna 80Lucknow 311 Ahmedabad 223Madurai 144 Kolkata 452
Table 1. Road traffic fatalities in metropolitan cites of India in 2000 (2).
Table 2. Share of motorised two-wheelers and three-wheeled scooter taxis in Indian cities (14).
City Percent City Percent MTW TSR MTW TSR Ahmedabad 77 7 Jaipur 74 2 Bangalore 73 6 Kanpur 79 2 Kolkata 44 2 Lucknow 80 3 Delhi 66 3 Chennai 73 4 Cochin 60 13 Nagpur 78 6 Mumbai 41 12 Patna 69 5 Hyderabad 87 7 Pune 74 8
Table 3. . Proportion of motor vehicles involved in fatal crashes in Delhi and Mumbai.
Location Vehicles involved, per cent Total Truck Bus Car TSR MTW
Mumbai 52 16 24 3 5 100 Delhi 40 33 16 4 7 100 * Only those cases included where details were known, totals for these vehicles only, others not included. TSR: three-wheeld scooter rickshaw, MTW: Motorised two wheeler.

Dinesh Mohan
7
Alcohol
Data for alcohol and other drug involvement in road traffic crashes are not available for Indian cities. A study done in Delhi documented that about one third of two-wheeler riders admitted to a neuro-surgery ward admitted to driving under the influence of alcohol at the time of the crash (18). Another study done in Bangalore found that 44% of crash involved two-wheeler riders seeking medical treatment were under the influence of alcohol (21). It is clear that much more work needs to be done to understand the exact role of alcohol and other drugs in road traffic crashes in India. However, the limited information available suggests that this may be a significant risk factor.
Differences among cities
Figure 7 shows the fatality rates per million persons for Indian cities with populations greater than 1 million. These data show that most of the city rates are higher than the average for India as a whole (80 fatalities per million). Most of the cities have similar rates (100 +/- 20 fatalities/m persons) except a few that are lower than 80/m and higher than 140/m. Much of the anecdotal folklore attributes different crash rates in cities to the differences in “culture” of the residents of the respective studies. However, the rates as indicated in Figure 7 do not confirm this impression. There are cities in south India that have rates higher than those in north India and vice versa. There are no detailed studies available to come to any firm conclusions regarding the differences in crash rates in different cities. However low rates in Kolkata and Mumbai may be due to lower vehicle speeds on some of their main arteries as compared to cities like Delhi and Hyderabad where some of the main arterial roads have much more space available for vehicle speeds to be high especially during non-peak hours (11). A study done in Mumbai also shows that arterial roads permitting high speeds and mixing of heavy vehicles with vulnerable road users had higher crash rates than other roads (11). This study also showed that lack of pedestrian facilities for walking along roads and infrequent safe crossing opportunities led to high crash rates.
162
143
142
121
121
120
116
115
115
111
106
100
95
88
87
79
73
62
52
35
KanpurDelhi
JaipurNagpur
CoimbatoreHyderabadBangalore
IndoreLucknow
MaduraiVishakhapatnam
ChennaiBhopal
PuneVadodraVaranasi
MumbaiPatna
AhmedabadKolkata
Fatalities per million population
Figure 7. Fatality rates per million population in Indian cities (population > 1 m).
Around 15% of the total road traffic fatalities in India occur in 23 metros. Non-motorised transport road users consisting of pedestrians, cyclists and other slow
moving vehicles are the most vulnerable group and account for 60 to 80% of the fatalities. Motorised two-wheelers comprise approximately 70% of all vehicles and constitute 20-30%
of fatalities. Heavy vehicles like trucks and buses are associated with 50-70% of fatal road crashes in
urban areas. The issues concerning safety of non-motorised transport have not been given adequate
importance. Policies need to be developed so that these groups are included as an integral part of traffic in the planning of new highway and area planning schemes.
Crash patterns show that the self-segregation of the modes is not sufficient to ensure the safety of vulnerable bicyclists. While midblock crashes are not usually a serious concern in homogenous regimented traffic conditions, this category dominates in Indian cities.
It is essential to provide safe segregated facilities for non-motorised road users (pedestrians, bicyclists and rickshas on all major urban corridors where vehicle speeds are likely to be greater than 30 km/h.
All residential and shopping areas must implement traffic calming techniques so that no vehicles can operate at speeds greater than 30 km/h.

Traffic Injuries and fatalities in India
8
Traffic crashes on intercity roads and national highways Figure 6 shows the number
of persons killed in road traffic crashes in 2000 per million population and vehicles registered per 1,000 persons in different states of India. These are aggregate figures for the states and include data for the cities. This would tend to increase rates for crashes and vehicle registration indices for those states that have a greater share of metropolitan cities. This would happen because the average fatality rates per capita are higher for metropolitan cities than the average for the whole of India. While the fatality statistics are reasonably reliable as shown by Gururaj in Bangalore (4), the vehicle registration numbers are not. This is because private vehicles are registered once and they generally do not get removed from the records when they are no longer in use in the state. As a part of the study for the Auto Fuel Policy the investigators estimated the actual number of vehicles in use in Delhi to be to be 1.9 million, whereas the number registered was 3.5 million (22). Therefore, the vehicle registration numbers can be overestimates by 70%-80%. With such errors in place, it is impossible to make any statistical judgements on any indices that include vehicle registration statistics.
Differences among states
The fatality rates for states vary from a low of 16 per million persons for Nagaland to a high of 170 for Goa. About half the states are lower than the Indian average of 80 fatalities per million persons. In the absence of reliable data, it is impossible to determine the exact reasons for these differences. Some general observations are:
Most states with higher motorisation rates have higher fatality rates, except the hill states. This indicates that as motorisation increases it is very important to set in place conscious road safety policies that include safer road and vehicle designs. Figure 4 shows that it is possible to reduce fatality rates with increasing motorisation when scientific polices are introduced.
Hill states in general have high fatality rates compared with vehicle ownership levels except in the case of Nagland, which has a low fatality rate and high vehicle ownership rate. It is not possible to explain this in the absence of detailed data.
Haryana and Punjab, which are neighbouring states, have similar motorisation rates but the former has much higher fatality rates. It is possible that Haryana has higher rates because it is contiguous to the Union Territory of Delhi and thus experiences higher exposure to both vehicular and non-motorised traffic on intercity suburban roads.
0 50 100 150 200
NagalandBihar
AssamTripura
West BengalManipur
MeghalayOrissa
Uttar PradeshPunjab
MizoramMadhyaSikkim
J&KArunachal
KeralaRajasthan
GujaratKarnataka
MaharashtraHimachal
AndhraHaryana
Tamil NaduGoa
Vehicles/1,000 persons Fatalities/million persons
Figure 8. Road traffic fatality rates per million persons in different sates of India 2000 (2) .
Present data collection methods do not provide any reliable information in the aggregate except the total number of fatalities in road traffic crashes by state. Data regarding the distribution of fatalities by road user type, impacting vehicles, location of crashes, and alcohol involvement are not available at the national or state level.

Dinesh Mohan
9
Road user fatality patterns on national highways
Figure 9 shows the consolidated results of a detailed study done on 14 locations on national highways around the country (8). These data show that even on national highways pedestrians constitute over 30% of the fatalities and all vulnerable road users put together constitute more than 65%. Car occupants constitute about 15% and bus occupants less than 5%. These results run contrary to the popular perceptions of people reading the newspapers that bus, truck and car occupants are the majority of the victims on rural highways.
Vehicles involved
Figure 8 also indicates that in fatal crashes trucks are involved in a vast majority of cases. In the absence of detailed
multidisciplinary crash investigation data, we can only surmise that this disproportionate involvement must have to do with a higher presence of trucks on national highways and the higher mass of trucks compared with other road users. In the event of a crash, the road user with a lower mass usually suffers more severe injuries.
Highway category
Table 4 shows the crash statistics by categories of highways. It is interesting to note that there are no major differences in overturn type of crashes on 2-lane and 4-lane roads. Similarly, there are no major differences in head-on collisions on differences in different types of 2-lane roads. However, it is very surprising that on 4-lane divided roads head-on collisions comprise 19% of the crashes. Divided 4-lane roads are justified on the basis that these would eliminate the occurrence of head-on collisions. This means that many vehicles are going the wrong way on divided highways. This is probably because tractor and other vehicle owners go the wrong way when they exit from roadside businesses, farms or homes and the cut in the median is too far away in the other direction. This issue needs to be taken up seriously to develop guidelines for the placement of cuts in the median or for providing under/overpasses for vehicles at convenient locations.
Crash type in per cent Highway Type Over-turn
Head-on
Angle Rear-end
Pedest and
bicycle
Fixedobject
Other
Intermediate lane ~ 13 13 13 ~ 13 48
2 lane w/o shoulder 7 14 2 31 23 5 18
2 lane + 1.5m paved shoulder 5 11 ~ 16 45 11 16
2 lane + 2.5m paved shoulder 5 17 2 25 19 13 17
4 lane divided 4 19 7 19 35 2 13
Table 4. Road traffic crashes by categories of highways.
0
10
20
30
40
50
60
70
Truck Bus Car TSR MTW BicyclePedest
Percent
Impacting vehicle Victims
Figure 9. Proportiton of road users killed and impacting vehicles on sampled national highways (8). [TSR: three-wheeled scooter rickshaw, MTW: motorisedtwo-wheeler, Pedest: pedestrians.]

Traffic Injuries and fatalities in India
10
Rearend collisions (including collisions with parked vehicles) are high on all types of highways including 4-lane highways. This shows that although more space is available on wider roads rear-end crashes do not reduce. This would probably have to do more with the visibility of vehicles rather than the road design itself. Countermeasures would include making vehicles more visible with the provision of reflectors and roadside lighting wherever possible.
Impacts with pedestrians and bicycles
have a high rate on all roads including 4-lane divided highways. The rate seems to be lower on 2-lane highways with wider (2.5m) paved shoulders. These findings suggest that wider shoulders reduce conflicts between slow moving traffic and motor vehicles but do not eliminate them.
These aggregate data lead us to make
the following observations:
• Perceptions about crashes formed by highway users may not reflect the reality of the problem. Everyone sees damaged vehicles stranded on the highways and thus believes that these kinds of crashes would constitute the main problem (Figure 10).
• Though the motor vehicle fatalities are higher on highways than in urban areas, as would be
expected, the differences are not as high as in western countries. A vast majority (68%) of those getting killed on highways in India comprise vulnerable road users and this fact should be the guiding factor in future design considerations.
• Crash patterns on rural and urban roads are more similar than would be expected based on western experience. This is probably because there is a high density of settlements all along the highways and this probably results in the use of many sections of the highway like an urban arterial road (Figure 11). Therefore, safety would be enhanced mainly by separating local and through traffic on different roads, or by separating slow and fast traffic on the same road, and by providing convenient and safe road crossing facilities at frequent intervals to vulnerable road users.
• We need to develop standards for provision of convenient tunnels and other crossing facilities in terms of designs and frequencies. In addition, there would also be a need for provision of “service roads” along the highways for short distance trips for local traffic. At present, there are no such guidelines to help the local designer and planner.
• Collisions with fixed objects are low only on 4-lane divided highways. However, they are not absent (Figure 12). Better road markings to indicate the alignment of the road is essential. Provision of adequate run-off area without impediments is very important on highways. Both the shoulder and the median must provide adequate space for straying vehicles to recover without major damage (Figure 13). When
adequate run-off area is not available the use of guard rails to stop vehicles going off the road becomes or use of concrete Jersey Barriers becomes necessary (23).
Figure 10. Truck rollover on highways onembankments without guardrails.
Figure 11. Highway passing through semiurban areas.

Dinesh Mohan
11
Standards
All road and highway design guidelines and standards in India are issued by the Indian Roads Congress (IRC). These standards are recommendatory and not mandatory. The IRC does not have any role in overseeing whether these are followed or not in practice. The IRC constitutes many committees to determine the need for development of a new standard or revision of an old one. The responsible committee then requests its members or an outside expert to prepare a draft of the standard, which is discussed in the committee, distributed for comments and then finalised by the committee. All this work is very often voluntary in nature. This procedure needs to change.
Standards should be initiated on a
demonstrated need basis with scientific documentation of the problem that needs to be addressed. An official agency staffed by professionals with expertise in standard making needs to be established for this purpose. Establishment of future standards will need a great deal of background work, research and experimentation as many of the safety features and designs will have to be specially tailored for our needs.
The improvement of national highways in
India is being given a great deal of importance as a part of the national effort to become economically competitive globally. However, the guidelines for highway development generally follow specifications, which are not yet tailored to India-specific situations as far as road safety is concerned. This is because detailed crash data have not been available which can be used to understand the causal factors associated with road crashes and which have a bearing on road design issues.
When roads and highways are
“improved” allowing vehicles to travel at higher speeds, fatalities and injuries increase unless special steps are taken to alter designs and enforcement mechanisms. We are at the crossroads now and this is the right time to make special investments in road safety, otherwise we are likely to put in place a highway system that will exact a very heavy toll in fatalities, disabilities and injuries for decades to come.
Figure 12. Rigid obstructions and high medians can be hazardous for high speed vehicle traffic
Figure 13. Divided highway with adequate recovery area, wide shoulders, no rigid obstructions and guard rails.
• Keeping roadsides clear of trees, boulders, steel and concrete pillars and posts and similar rigid roadside objects is especially important on roads where vehicles travel at high speeds. Collapsible lighting columns and signs, mounted on shear bolts or made of yielding material and designed for electrical safety, are recommended.
• Safety barriers can be used to contain motor vehicles within lanes, preventing head-on or side collisions, and to prevent them from leaving roads. These barriers should be designed to deflect or contain vehicles while doing no serious harm to occupants.
• Transitional roads connecting higher-speed roads with lower-speed roads or moving from higher- to lower-speed stretches (such as rural roads entering villages) should have signs and other design features to encourage drivers to slow down in good time. Rumble strips, speed bumps, visual warnings in the pavement and roundabouts are possibilities.
World report on road traffic injury prevention (13)

Traffic Injuries and fatalities in India
12
COST OF ROAD TRAFFIC CRASHES One of the early studies which attempted to evaluate road accident costs was conducted for
Delhi for the year 1968 (24), and another study calculated accident costs based on insurance company data for Chennai (Madras) for the year 1978 (25). Both studies used rudimentary methods for cost analysis. The first major road user cost study (RUCS) was published in India in 1982 (26). This study, sponsored by the World Bank, included a section on “accidents as a component of road user cost”. The costs include were: medical expenses, legal fees, property damage, insurance costs, and loss of output due to death (future consumption as one-third of income and future output calculated up to the age of 55 years). The latest study on evaluation of road accident costs was sponsored by the Ministry of Surface Transport (Roads Wing, Research Scheme R-79) and conducted by M/s Tata Consultancy Services (27). A summary of the values calculated in these studies is given in Table 5.
The 1982 RUCS undertook an exercise for evaluating the costs by sampling a limited number
of crashes from insurance companies, hospitals, and the Motor Accident Claims Tribunal (26). The study used the gross output loss method for calculating costs, which gives much lower values than willingness to pay method. There were other oversights in the study:
(a) The life expectancy of Indians was assumed to be 54 years. This is a serious technical error, as this was the life expectancy at birth at that time. In India a very large proportion (approximately 40 per cent) of deaths were at ages below 4 years the life expectancy at birth was much lower than that at 10 years. If they had calculated the life expectancy of Indians at 5 years they would have found that it was in the region of 70 rather than 54 years. According to their sample only 7 per cent of the victims were under 10 years. Therefore, it is possible that they underestimated the life span by more than 20 per cent.
(b) The study did not account for the undercounting inherent in the official statistics on road crashes. As mentioned earlier in this report, fatalities in India may be underestimated by about 5 per cent, and injuries by an order of magnitude. RUCS uses road crash data which has ratios for fatality:serious-injury:minor injury of 1:1:3.4. Earlier we have suggested that in India this ratio is more likely to be 1:15:70. If these ratios had been assumed the there would have been an additional burden of approximately Rs. 1,500 crores to their total of 236 crores!
(c) The costs of medical treatment are taken from government hospitals which include a large number of hidden subsidies.
(d) There is no attempt made to understand the differentials in wages of different road users and to account for it. Since pedestrians and bicyclists are likely to belong to the poorer sections of the population they will lower the accident costs in this method of calculation as they have a higher involvement in crashes. This method therefore does not satisfy the condition of acceptability to the public.
(e) Actual costs of permanent disability, pain, etc. were not included.
Estimated average costs in Rupees for year of study Type of accident 1968 study
for Delhi (Ref 24)
1978 study for Madras city (Ref (28)5))
1978 Road user cost study for India (Ref 26)
1999 Evaluation of road accident costs
for India (Ref 27)Fatal 27,805 129,987 49,804 535,489Serious injury 7,470 35,447 29,510 106,959 – 242736*Minor injury 870 10,503 321 18,855Property damage 1,155 10,033 - -Damage to buses - - 5,467 47,100Damage to trucks - - 6,111 48,700Damage to cars - 1,200 16,200Damage to 2-wheelers - - 300 4,100Total cost as per cent of GDP 0.29 0.69* In this study two categories, serious and major injuries were used.
Table 5. Estimates of costs due to road traffic crashes in India.

Dinesh Mohan
13
The above discussion makes it clear that the
estimated costs of RTI in the 1982 RUCS study was an underestimate by a large factor and cannot be taken as representative of the actual situation on the ground. The latest study conducted by Tata Consultancy Services (27) gives a higher estimate of RTI costs (0.69 per cent of GDP of India) as it is a more thorough investigation. However, this study also makes similar mistakes as mentioned in items (a) - (d) above. This study also shies away from using the willingness to pay approach and makes no effort to use the concept of Disability Adjusted Life Years lost (29) and so its estimates will also be low. In addition, it suffers from the following factual errors:
(a) The “useful life” of an Indian is assumed to
be 62 years. However, according to The World Health Report 2000 the probability of an Indian dying before age 5 was 97 per thousand in 1999 which would give a low life expectancy at birth (30). This is why even the disability-adjusted life expectancy in India at age 60 was found to be more than 11 years. Other estimates show that even in 1992-1992 persons at age 10 could expect to live up to 68 years and those at 50 up to 73 years of age (31). Therefore, this study has also underestimated the life expectancy by more than 10 years (>15%). This is critical, because with improving health standards individuals are active and provide very useful social functions well beyond the age of 62.
(b) The major statistical error, however, is the underestimate of injuries and vehicle damage in
this latest study. For 1995 they use the figures of 68,351 for fatalities and 266,541 for injuries. This is a ratio of 1: 3.9 for fatalities:injuries. If we take the conservative ratio of 1:15:70 for fatalities:serious-injuries:minor injuries and a 5 per cent under count for fatalities we get the figures as shown in Table 6. The cost of injuries alone according to this estimate is approximately Rupees 322,000 million (Rs. 32 thousand crores) against a total estimate of Rupees 69,502 million by the TCS report. This revised estimate indicates the road accident costs to 3.2 per cent of the GDP of India in 1995.
If we take the increase in cost of living between 1995 and 2000 as 45 per cent, and an
increase in fatalities from 72,000 to 85,000, then the figure for the cost of road traffic injuries and deaths for 2000 can be extrapolated to Rupees 55,000 crores (550,000 m). The GDP of India in 2000 is estimated to be Rupees 1,772,183 crores (17,721,830 m), which gives us the cost of road crash injuries as 3 per cent of GDP. This indicates that the real cost of RTI in India is more than 2 per cent of the GDP, which is similar to the values calculated for OECD countries. It is clear to us that the social and economic costs of road traffic crashes in India (as a proportion of the GDP) would be at least of the same order of magnitude as in the OECD countries if not higher - greater than 2 per cent.
The above calculations do not include the effects of pain and suffering experienced by victims
of RTI and their families in particular and society in general. These can be substantial. A catastrophic injury can destroy a poor or lower middle class family forever. It has been documented that the process of expensive treatment and patient care puts enormous emotional, time and financial burden on families: loss of jobs, children dropping out of school, reduction in nutritional quality and perpetual indebtedness. These effects on an individual family can have ripple effects and affect societies at large.
Injury severity
Estimated number
Estimated cost 1995 Rupees
Fatalities 71,948 38,527,362,572Serious/ major
1,079,220 188,698,379,340*
Minor 5,036,360 94,960,567,800 Total 322,186,309,712
Per cent of GDP 3.2 per cent* Note: cost of serious injuries is taken as the average of serious and major injuries (Rs.174847.5) as stated in the in the TCS report
Table 6. Revised estimate of the cost of road traffic injuries in India adjusting for undercount of deaths and injuries and life expectancy.
Indian society suffers an estimated economic loss of Rupees 55,000 crores (550,000 m) per year due to road traffic crashes. This is of the same order of magnitude as all the investment in road building and maintenance. A small reduction of ~10% in RTI means savings of about Rupees 5,000 crores a year. This understanding should guide us in policy making for road safety research and safety infrastructure investments. It would be sensible to earmark a fixed percentage of road building funds for road safety activity.

Traffic Injuries and fatalities in India
14
INTERNATIONAL KNOWLEDGE BASE A stencilled outline of a body memorialises the spot on 74th Street and Central Park West in
New York City where Henry Bliss was run over by a cab on September 13, 1899, becoming the first known pedestrian fatality in North America (32). In the same year UK recorded its fist motor car driver fatality in London (33). Internationally, there are now more than a million fatalities annually, and the number is still on the rise (34). The concern with road safety has very early origins but lack of professionalism still pervades the field of traffic safety. Trinca et al make the following comment in the award winning book Reducing Traffic Injury –A Global Challenge published more than fifteen years ago (35):
“Anyone can don the mantle of ‘expert’ and many citizens are convinced they have the
‘answer’. Articulate lobbyists, not always with proper qualifications but often with the best intentions, press for measures which frequently are not well founded.”
This is partly because traffic safety has still not developed as a scientific course of study in
most countries and there are very few job openings for those who want to pursue a career as a full-time road safety professional. Because of the widespread concern with road traffic deaths in the middle of the twentieth century in North America and Western Europe, there have been major advances in vehicle safety technology, road design, traffic law enforcement techniques, and post-injury management. But, policy makers and traffic safety professionals in every country have found it very difficult to institute changes that actually result in a dramatic decrease in traffic fatalities and injuries in a short time. International experience has also shown that all individuals do not follow all the instructions given to them to promote road safety. Attempts to “educate” people regarding safety have also not always been very effective in any country and wide variations are found between people’s knowledge and their actual behaviour (36).
This experience shows that no country was very successful in controlling road traffic crashes
in the period 1900 – 1965. It is important for all of us to learn from this experience. It is significant that the policies being followed at present in most low and middle-income countries are similar to those of the high-income countries before 1960 when they were not very successful in reducing traffic crashes. The primary responsibility of promoting road safety in most successful nations now lies with the transport sector. However, it was not always so. In the first half of the twentieth century when motorisation was increasing at a rapid pace in Europe and North America, the growing concern for road safety resulted in forming broad-based safety councils. These councils were dominated by members who had little research or scientific experience and thus they also supported the prevailing view that most crashes were caused by the bad behaviour of drivers and other road users, and so were not very successful in reducing deaths and injuries due to traffic accidents. Similarly, the police departments only focussed on issues concerning breach of law and negligent behaviour (‘human error’) and in issues concerning punishment and ‘education’ of violators.
Such an attitude does not see the need for scientific approaches for problem solving and this
results in a dependence on layperson views and moral concerns, uncoordinated institutional units performing transportation functions in road building, traffic management, law enforcement and education. It is only after the mid 1960s that policy makers realised that the traditional approaches were not working. This realisation resulted in the creation of well funded traffic safety departments staffed by professionals, massive funding for road safety research and accident investigation, and a shifting of the focus from civil engineering dominated units to multi-disciplinary units. The latter included, transportation planners, mechanical engineers, statisticians, medical scientists, psychologists, etc. This is the kind of shift that is needed around the world in manning road safety research and planning.
Researchers in the successful countries have attempted to develop techniques to embed the
integration of road safety and environmental aspects into the broad concept of planning for mobility and providing access to all citizens of a city. The successes of some of these efforts in the high-income countries are not directly transferable to India without modification. The composition of traffic and crash patterns in modern India is not only different from those prevailing today in the high-income countries, but also substantially different from those prevailing there at a comparable stage of development in the past (37).

Dinesh Mohan
15
Systematic reviews of interventions In the past few years many researchers have reviewed the worldwide experience in road
safety and tried to understand the record of successes and failures. A summary of these studies is given below.
Legislation and enforcement:
a) Most attempts at enforcing road traffic legislation will not have any lasting effects, either on road-user behaviour or on crashes unless the enforcement is continuous and widespread. This level of enforcement is expensive and difficult to sustain in most situations.
b) Imposing stricter penalties (in the form of higher fines or longer prison sentences) does not affect
road-user behaviour significantly and imposing stricter penalties also reduces the level of enforcement (38)
c) Increased normal, stationary speed enforcement is in most cases cost-effective. Automatic speed
enforcement with cameras seems to be even more efficient (39;40). d) There is no evidence proving mobile traffic enforcement with patrol cars is cost-effective (41). e) Laws against drinking and driving are effective when combined with active enforcement and
support of the community (42). f) Compulsory helmet laws work and reduce injuries and fatalities for motorcycle riders in all
locations around the world (18;43-48). It has been shown that helmets do not interfere with vision or hearing capabilities of motorcycle riders in a manner that increases their crash involvement. Use of helmets is the single most effective safety measure available to motorcycle riders. Helmet use by cyclists has also shown to reduce the probability of injuries and fatalities .
Education and campaigns
a) Road safety campaigns are often aimed to improve road user behaviour by increasing the knowledge and by changing the attitudes. There is no clearly proven relationship between knowledge and attitudes on one hand and behaviour on the other hand (49). Most highway safety educational programs do not work. They do not reduce motor vehicle crash deaths and injuries. Only a few programs have ever been shown to work, and contrary to the view that education cannot do any harm some of these programs have been shown to make matters worse. Education programs by themselves usually are insufficient to change behaviour. They may increase knowledge, but increased knowledge rarely results in appropriate behaviour change (50;51).
b) There is no reason to waste money on general campaigns. Campaigns should be used to put
important questions on the agenda, and campaigns aimed at changing road user behaviour should be focused on clear defined behaviours and should by preference fortify other measures such as new legislation and/or police enforcement. Safety interventions that have relied only on education, even when well done, have often been unsuccessful. Successful strategies have been those that used a combination of education with other approaches such as legislation, regulation, or lowering barriers to implementation.
Specific campaigns
a) Seat belts: The effects of campaigns using tangible incentives (rewards) to promote safety belt usage have been evaluated by means of a meta-analytic approach. The results (weighted mean effect) show a mean short-term increase in use rates of 12.0 percentage points; the mean long-term effect was 9.6 percentage points (52). Research first from Australia, later many European countries, then Canadian provinces, and finally some U.S. states clearly shows that the only effective way to get most motorists to use safety belts and child seats is with good laws requiring their use. When laws are in place, education and/or advertising can be used to inform the public about the laws and their enforcement (53;54). In some jurisdictions where the political support for good safety belt laws is not present, however, enthusiastic advocates continue to promote expensive and ineffective advertising approaches.
Traffic Injuries and fatalities in India
16
b) Children’s education: Pedestrian safety education can result in improvement in children's
knowledge and can change observed road crossing behaviour but whether this reduces the risk of pedestrian motor vehicle collision and injury occurrence is unknown. There is evidence that changes in safety knowledge and observed behaviour decline with time suggesting that safety education must be repeated at regular intervals (51).
Licensing and driver education
a) Studies show that driver education may be necessary for beginners to learn the elementary skills for obtaining a license, but compulsory training in schools leads to early licensing (55). There is no evidence that such schemes result in reduction in road crash rates. On the other hand they may lead to increased road crash rates (56-59). While there may be a need to train professional drivers in the use of heavy vehicles, there is no evidence that formal driver education should be compulsory in schools and colleges.
b) Evaluations confirm that Graduated Driver Licensing programs reduce crashes and violations,
especially during nighttime driving restriction hours. Much of this effectiveness is due to reduced driving exposure by beginning drivers resulting from longer learner's permit holding times and from these nighttime driving restrictions for provisional licensees (60).
Vehicle safety features
a) Vehicle crashworthiness: The term 'secondary safety' refers to the protection that a vehicle provides its occupants when involved in a crash. It is estimated that improved secondary safety reduced the number of car drivers killed or seriously injured by at least 19.7% in 1998, in comparison with what might have occurred if secondary safety had remained at the level found in cars first registered in 1980. This figure relates to all cars on the road in 1998, and rises to 33%, when confined to the most modern cars - those which were first registered in 1998 (61). There is enough evidence that for car occupants, improvements in secondary safety brought about by improvements in crashworthiness of cars has been the major factor responsible for reductions in road traffic injuries and deaths in high income countries.
b) Restraints: Use of seat belts, child seats and airbag equipped cars can reduce car occupant
fatalities by over 30% (62;63). The only effective way to get most motorists to use safety belts is with good laws requiring their use (50). When laws are in place, education and/or advertising can be used to inform the public about the laws and their enforcement (53;54).
c) Lights:
i. High mounted rear brake lights reduce the incidence of rear end crashes (64). ii. A meta-analysis of 17 studies that have evaluated the effects on traffic safety of using
daytime running lights on cars shows that such use reduces the number of multi-party daytime accidents by about 10-15% for cars using daytime running lights (65). Motorcyclists have confirmed similar results for use of daytime running lights in Malaysia (66). Therefore, even in tropical countries, motorcyclists benefit by keeping their headlights on in the daytime. This action makes them more conspicuous to drivers of cars, buses and trucks.
Road and environment
Though there is no clear evidence regarding the effect of “improvements” in road infrastructure on road safety, there is adequate evidence to show that design features that limit speeds, prevent destructive impacts, and provide safer mobility to vulnerable road users do result in injury reductions. A guiding principle in this respect is that the road environment and infrastructure must be adapted to the limitations of the road user (67). Some measures for which there is reasonable evidence regarding effectiveness in promoting road safety are:
a) Traffic calming techniques, use of roundabouts and provision of bicycle facilities in urban areas
provide significant safety benefits (68;69). The meta-analysis shows that area-wide urban traffic calming schemes on the average reduce the number of injury accidents by about 15%. The largest reduction in the number of accidents is found for residential streets (about 25%).

Dinesh Mohan
17
b) Limited access highways with appropriate shoulder, median and guardrail designs provide significant safety benefits on long distance through roads. Median barriers are found to increase accident rate, but reduce accident severity. Guardrails and crash cushions are found to reduce both accident rate and accident severity. (70;71).
c) Arterial roads are generally less safe than controlled access facilities (motorways). Statistically
significant injury reduction benefits result from controlled access facilities compared to more fatalities and injuries due to arterial roads. A-roads have fatality rates 5 to 6 times higher than limited access motorways in UK, Sweden and The Netherlands, and more than 50% higher than other categories of road (72). A-roads are rural highways that are not access controlled, and hence have high fatality rates as they permit relatively high speeds without appropriate safety features.
d) Increasing the lane widths of roads is normally seen as a strategy for reducing accidents. A study
using a cross-sectional time-series database of US states shows that those arterials roads with lane widths of 9 ft (2.7 m) or less have fewer traffic injuries. Reporting these results, Noland states “These results are quite surprising as it is general practice to improve the safety of roads by increasing lane widths. One possible behavioural response is that drivers increase their speed when lanes are wider and off-set any safety benefit from increased lane space. As can be seen, it is in general, not possible to support the engineering hypotheses.”
e) Free turns on red (left turn on a red light in India) result in significantly higher pedestrian and
bicycle crashes. A study done in the USA shows that approximately 80% of all signalized intersections where motorists are allowed to turn right on red (traffic drives on the right in the USA) all right-turning crashes increase by about 23%, pedestrian crashes by about 60%, and bicyclist crashes by about 100% (73).
f) Large scale use of roundabouts in urban areas (as compared with signalised intersections) can
reduce crash risk by more than 40% and emissions by more than 20% (48).
Pre-hospital care
Recent Cochrane Reviews on pre hospial care have concluded that (74):
g) There is no evidence from randomised controlled trials to support the use of early or large volume intravenous fluid administration in uncontrolled haemorrhage.
h) The effect of pre-hospital spinal immobilisation on mortality, neurological injury, spinal stability
and adverse effects in trauma patients therefore remains uncertain. Because airway obstruction is a major cause of preventable death in trauma patients and spinal immobilisation, particularly of the cervical spine, can contribute to airway compromise, the possibility that spinal immobilisation may increase mortality and morbidity cannot be excluded.
i) In the absence of evidence of the effectiveness of advanced life support training for ambulance
crews, a strong argument could be made that it should not be promoted outside the context of a properly conceived and otherwise rigorously conducted randomised controlled trial.
j) There is no evidence to suggest that MAST/PASG application reduces mortality, length of
hospitalisation or length of ICU stay in trauma patients and it is possible that it may increase these (75).
These results show that there is a lack of clear evidence regarding the effectiveness of widely
used interventions in pre-hospital care and there is a need for conducting randomised control trials to evaluate the effectiveness of such interventions. However, these results are very useful in the Indian context because they show that effective pre-hospital care can be provided without capital intensive investments in infrastructure. The World Report on Road Traffic Injury Prevention (13) concludes that we need strengthening all links in the chain of help for road crash victims, from the crash scene to the health facility; for example, specific groups, such as commercial vehicle drivers, most likely to be first on the scene of crashes, might be provided with basic training in first aid, and health professionals might be provided with specialized training in trauma care.
Traffic Injuries and fatalities in India
18
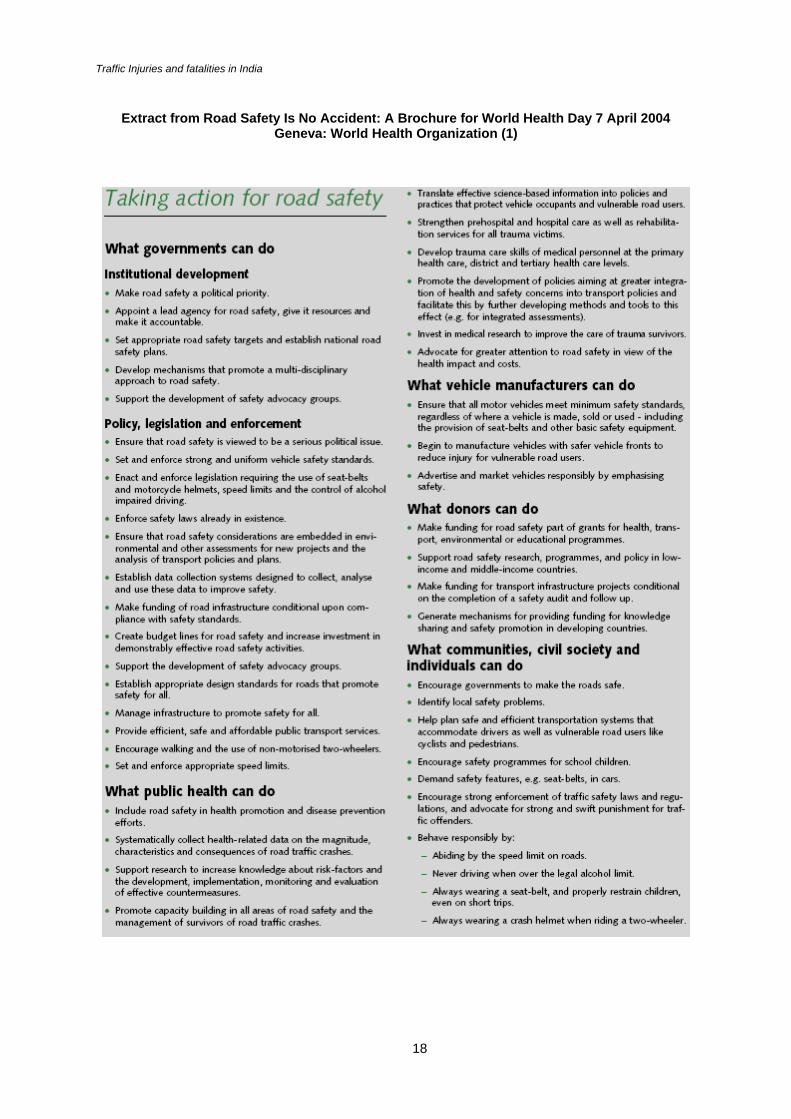
Extract from Road Safety Is No Accident: A Brochure for World Health Day 7 April 2004
Geneva: World Health Organization (1)

Dinesh Mohan
19
THE ROAD AHEAD: ROAD SAFETY POLICIES FOR INDIA The vision
In 2004 about 100,000 persons will die and more than 1,500,000 will be seriously injured on Indian roads. This is an unacceptable level of emotional trauma, personal loss, and economic hardship to be borne by the Indian people. The time has come to set a goal of halving this road toll in about 10 years and of accepting a vision that has as its underpinning a future with zero deaths on the roads of India. Britain, Sweden, the Netherlands and Norway have some of the lowest road traffic death rates in the world but they have set themselves even more ambitious goals to reduce the deaths and injuries due to road traffic crashes. Sweden’s Zero Vision strategy turns attention away from crash reduction to injury reduction.
Traditionally, safety has been seen as only one important factor in the provision of road facilities, which has been balanced with other factors such as cost, access and mobility. This is no longer acceptable and safety on the roads is a fundamental right of the people forced to use these facilities (76). Safer roads can be ensured by a concerted approach involving all the stakeholders and setting up achievable targets through the implementation of proven measures. The strategies to be developed would involve the following range of initiatives:
• Institutional reform • New systems for data collection and analysis • Safer road measures • Safer vehicle measures • Legal measures and enforcement • Community support
The strategies have to be clearly identified in terms of their effectiveness in the short term (1-
3 years) and long term (4-10 years). In addition, priorities must be identified in the Indian context for urban areas and rural highways. These priorities have to be based on the data presently available, but will need to be modified as more detailed data becomes available in the future.
In a do-nothing scenario, it is possible that India will have 120,000 – 130,000 road traffic
fatalities in the year 2008 and possibly 150,000 – 175,000 in 2015. Our vision should aim at reducing the fatalities to less than 100,000 in the short term (2008) and less than 70,000 in the long term (2015).
The Zero Vision October 1997, Road Traffic Safety Bill, Swedish Parliament
• “The scientific basis of the zero vision differs from the usual approach to safety in human-
machine systems: designing a system to minimize the number of events that cause injury. Instead, the zero vision is based on the notion of "allowing" these incidents to occur, but at a level of violence that does not threaten life or long-term health”
• “In the zero vision, the entire transport system must be designed to accommodate the individual
who has the worst protection and the lowest tolerance of violence. No event must be allowed to generate a level of violence that is so high that it represents an unacceptable loss of health for that vulnerable individual.”
• “The responsibility for every death or loss of health in the road transport system rests with the
person responsible for the design of that system. This is the ethical basis for realizing the zero vision.”

Traffic Injuries and fatalities in India
20
Issues and priorities a) Institutional: Experience across the world has shown that every country needs a lead agency on
road safety, with the authority and responsibility to make decisions, control resources and coordinate efforts by all sectors of government – including those of health, transport, education and the police. This agency should have adequate finances to use for road safety, and should be publicly accountable for its actions (13). At present, there is no institutional arrangement for such activities in India.
b) Data: An important element in dealing with road safety is ascertaining the magnitude and characteristics of the problem, as well as the policies, institutional arrangements and capacity within the country to deal with road traffic injuries (13). The data available in India are at a very rudimentary level and special attention needs to be given for establishing systems for scientific data collection and analysis.
c) Vulnerable road users: A vast majority of the people injured and killed in India comprise the vulnerable road users – pedestrians, bicyclists and motorcyclists. All strategies affecting this group need to be given a higher priority – provision of facilities, separation by modes, speed control, helmet use, etc.
d) Mixed traffic: Most roads in India experience mixed traffic. Special initiatives need to be launched for research and development in the area of road design suitable for Indian traffic conditions. This needs to be done both for urban roads and rural highways.
e) Vehicle design: Special attention necessary for designing all vehicles with less aggressive fronts so that impacts with vulnerable road users are less harmful.
f) Indigenous vehicles: Many vehicles are in use in India which are not commonly used in high income countries. They provide economic means of transport but their safety and comfort levels have not been optimised.
Institutional arrangements The road traffic crash injury and death rates in India are unacceptably high and that the total
number of annual deaths in India rank second only to China compared to all countries in the world. This situation has remained almost the same for the last two decades and unlikely to improve unless there is a radical departure from previous practices and new systems are set up to control the problem. This would have to include setting up new institutional arrangements at the central and state level, and strengthening existing institutions.
Availability of relevant data that are reliable is fundamental to science-based road safety
strategies and their evaluation. Building of a basic data collection system is a pre-requisite for evidence based innovations in road safety technology and policy. This would involve sharing responsibilities between health and transport sectors and developing public/private partnerships in specific projects and in in-depth crash investigation.
For the application of a rational, target-based strategy for road traffic injury reduction, it is
clear that responsibilities extend much further than the historical approach of the individual road user. Experience around the world shows that effective road safety policies can only evolve and be implemented when there is an official agency responsible for such activity. To achieve this, the agency responsible for road safety must have a high level of professional expertise and financial support. This agency must be able to create linkages between private and public organizations national, regional and local levels. For example, road engineering measures need to be more compatible with vehicle characteristics and vice versa. Road surface and tyre characteristics need to be compatible; vehicle design and roadside barriers need to be co-ordinated better. The ways in which road user behaviour is influenced by road design and appearance needs to be examined. The relationships between crash risk, mobility and land use are poorly understood. The role of the systems engineer in crash investigation in the context of aviation is well established, in the road environment there is a need to build a body of knowledge that will apply the similar principles to road traffic.
Therefore, a statutory National Road Safety Board (NRSB) needs to be established that is independent of the Road Building agency. In principle, the NRSB could follow the structures set up for agencies like the Central Pollution Control Board. The Planning Commission of India set up a Committee to examine this issue and a report on the subject was submitted in 2001 (77). The NRSB can have the following functions:

Dinesh Mohan
21
a) Management, coordination and commissioning of all matters regarding road safety. b) Advising the Government of India on all matters relating to road safety. c) Policy Formulation: Setting of goals and policies for road safety in the country. This will involve
targeted setting of priorities based on studies specific to India d) Coordination between different agencies of the central government, state governments, research
and academic institutions and NGOs. e) Setting of road safety research priorities and funding of projects for the same. f) Compilation and analysis of national statistics and ensuring that comprehensive data exists for
road safety planning. This would involve laying down the steps necessary for improving the data collection processes at all levels.
g) Establishment of research/teaching institutions and centres: The NRSB would establish and fund research institutions and centres specifically for road safety work.
h) Establish safety standards for roads, road infrastructure and vehicles and their maintenance, etc. i) Monitor and evaluate the effectiveness of the road safety strategies at the central and state level. j) Procure sufficient finance for road safety work and control and monitor its use.
Data and analysis It is very difficult to conduct any national or state wise road safety analysis, as the data
available do not permit any scientific analysis of road traffic rashes and the associated risk factors. Except in a few metropolitan cities, no details are available on the types of road users killed, the location of the crash, or the circumstances in which the crash took place. Discrepancies between data – for example, between police and health-related sources limit the usefulness of existing data sources. Reliable data are needed to provide a solid foundation for road safety planning and decision-making. Therefore, it is essential that steps be taken to establish road traffic injury surveillance systems that generate reliable data on road traffic crashes and injuries. Some of the essential steps are outlined below.
a) Police data collection systems need to be modified so that essential base line data become
available to policy makers and researchers for meaningful analysis. At a minimum the following information must be collected for each crash: (i) victim details: road user type (including position in vehicle), sex, age, and impacting vehicle; (ii) vehicle details: vehicle type and model; (iii) location details: urban/rural, junction/midblock, number of lanes, highway type, divided/undivided, GIS location; (iv) collision type for each vehicle: hit pedestrian, head on, hit from back, hit from side, overturn, hit fixed object, run off the road; (v) manoeuvre for each vehicle: proceeding straight, turning, reversing, overtaking, parked/stopped. It is possible for such data to be collected and with the presently available manpower with adequate training.
b) Traffic injury surveillance systems need to be established at hospitals and medical colleges around the country according to international guidelines suggested by the WHO (78). These hospital databases need to be coordinated with police data sources and a system established for coordination of data. Four such centres may be established within the next two years to represent different locations in India, and later expanded to cover all regions.
c) A highway crash data system needs to be developed to monitor the details of vehicle and road design features associated with crashes. Selected stretches of national highways can be earmarked for this purpose for continuous surveillance. These data will be useful for modification in designs suited to local conditions.
d) Multidisciplinary crash investigation data are necessary for detailed evaluation of vehicle and road
design changes and their correlations with injury patterns. Three or four research institutions should be selected in different regions of India for the establishment of multidisciplinary crash investigation teams and personnel trained for the same.
Research and training Most high-income countries have been successful in reductions in crashes and casualty
numbers over the past couple of decades by adopting a systems approach to road safety that emphasizes environment, vehicle and road user interventions, rather than solely focusing on direct approaches aimed at changing the behaviour of road users (13). All the known interventions that reduce the risk of road traffic crash and injury have resulted from scientific research and development, most of it conducted in high-income countries. We need to set up research groups to:

Traffic Injuries and fatalities in India
22
a) Analyse traffic injury and crash data to determine factors associated with crashes and to evaluate
effectiveness of road safety strategies and technologies. b) Evaluate known interventions and determine their suitability for Indian conditions. a) Develop design standards and guidelines for urban and intercity roads carrying mixed traffic. b) Develop crashworthiness standards and designs for vehicles with special reference to vulnerable
road users including safer fronts for all four-wheeled vehicles c) Develop standards for the crashworthiness of motorcycles, and for lighter, better-ventilated
helmets. d) Develop economic and effective strategies to improve post-crash management of injury victims. e) Analyse and develop effective management techniques for mixed traffic.
The above activities will require coordination among interdisciplinary teams and training of professionals in road safety research. This work will include the following professionals: engineering, medical sciences, behaviourists, human factor psychologists, social workers, education specialists, safety administrators, legal experts and enforcement officers. At present, there is a serious shortage of road safety professionals with adequate training in India. To encourage development of professionals and expertise the following policy measures are necessary; • Strengthening of existing research institutions working on road safety. • Establishment of regional specialised interdisciplinary research centres on road safety. • Training programmes for policy makers and researchers on road safety. • Organisation of an annual scientific road safety conference.
Road safety strategies – immediate future Role of education, information and publicity
Road safety policies in India have focused on education and behaviour change of road users as a mainstay of our efforts. This has not given us the reductions in injuries and fatalities that we expected and the trends indicate that the increase in death rates is likely to continue. To rverse this trend, it is necessary that we take note of the conclusions regarding the role of education, information and publicity as included in the World Report on Road Traffic Injury Prevention (13):
“Education can help to bring about a climate of concern and develop sympathetic
attitudes towards effective interventions. Consultation with road users and residents is essential in designing urban safety management schemes…when used in support of legislation and law enforcement, and information can create shared social norms for safety. However, when used in isolation, education, information and publicity do not generally deliver tangible and sustained reductions in deaths and serious injuries. Historically, considerable emphasis has been placed on efforts to reduce road user error through traffic safety education – for example, in pedestrian and cycle education for schoolchildren, and in advanced and remedial driver training schemes. Although such efforts can be effective in changing behaviour, there is no evidence that they have been effective in reducing rates of road traffic crashes.”
It is clear that for road safety interventions to be effective, community leaders, policy makers
and the road users must accept the new initiatives. To make this possible all new initiatives must be accompanied by information and publicity campaigns that explain the benefits of the new designs, legal and enforcement measures, and restrictions where necessary. Such measures will reduce the resistance to new ideas and find champions for road safety in the community.

Dinesh Mohan
23
Specific strategies for intervention
In this section, specific interventions have been selected for which international scientific evidence exists regarding their effectiveness and those that are especially suitable for traffic conditions in India. The measures selected also have a high possibility of success in implementation. Pedestrian and bicyclist safety • Free left turns must be banned at all signalised junctions. This will give a safe time for pedestrians
and bicyclists to cross the road. This measure has the potential of saving 3,000 – 5,000 lives per year in the near future.1
• Speed control in urban areas. Maximum speed limits of 50 km/h on arterial roads need to be enforced by police monitoring, and 30 km/h in residential areas and by judicious use of speed breakers, dead end streets and mini roundabouts. In the short term of three years, a target of covering 10% of the roads can be attempted. This measure has the potential of achieving a saving of 5,000 – 10,000 lives in the year 2008.
• Increasing the conspicuity of bicycles by fixing of reflectors on all sides and wheels and painting them in yellow, white or orange colours. Initially voluntary drives and encouragement, and later mandating the same can do this. This can result in a possible saving of 500 – 1,000 lives per year.
Motorcyclist safety • Notification of mandatory helmet laws by every state. The Motor Vehicles Act of India specifies
that all motorised two-wheeler riders must wear a helmet in the country. However, since transportation is a state subject, most states are not enforcing this regulation. Helmets are available, as the manufacturing capability already exists in the country. Countrywide notification and enforcement is likely to result in a saving of about 5,000 lives in 2008.
• Mandatory daytime headlights use by two-wheeler riders. Expected saving of 2,000 – 3,000 lives in 2008.
Motor vehicle occupants • Enforcement of seatbelt use laws countrywide is likely to result in a saving of about 1,000 – 2,000
live per year. A conservative estimate is taken as it will be difficult to ensure that everyone waers a seat belt on rural roads in the near future.
• Restricting travel in front seat of cars by children has the potential of reducing injuries dramatically. It is difficult to estimate the effectiveness of this measure, as we do not know the incidence of front seat children injured in crashes.
• Bus and truck occupant injuries and fatalities and injuries caused to other road users can be reduced significantly by enforcing strict observance of speed limit regulations on highways. This can be done by ensuring that bus timetables and truck movement schedules ensure that drivers can observe speed limits with ease. Random speed checking on highways would help ensure such measures. These measures can result in a reduction of 2,000 – 4,000 deaths per year.
Road measures – initiation of good practices • Traffic calming in urban areas and on rural highways passing through towns and villages. • Improvement of existing traffic circles by bringing them in accordance with modern roundabout
practices and substituting existing signalised junctions with roundabouts. • Provision of segregated bicycle lanes and disabled friendly pedestrian paths • Mandatory road safety audit for all road building and improvement projects Pre-hospital care, treatment and rehabilitation • Modern knowledge regarding prehospital care to be made available widely. • Training of specialists in trauma care.
1 All estimates of lives saved are based on: current estimates of fatalities by location and type
of road user, effectiveness of measure and extrapolation of current trends to the future. Details can be obtained from the author.

Traffic Injuries and fatalities in India
24
•
Road safety strategies – long term Traffic calming and speed control
We should aim at implementing speed control and traffic calming measures in all urban areas and appropriate locations on rural highways by altering road design, vehicle monitoring through intelligent transport systems, and vehicle design by the year 2015. This measure is likely to give us the maximum savings in terms of lives and serious injuries. The savings could be anywhere in the region of 20,000 – 40,000 lives in the year 2015.
Segregated lanes for vulnerable road users and buses in urban areas
Non-motorised transport and buses must be provided segregated lanes on all major arterial roads in urban areas. India specific designs need to be developed and phase wise implementation plans drawn up for all cities. Expected saving: 10,000 – 20,000 lives in 2015.
Safer design of 4/6 lane highways
(a) Provision of service lanes on high-speed highways for slow and non-motorized traffic. (b) Provision of at surface tunnels at frequent intervals for local traffic. Expected saving: ~ 10,000 lives in 2015
Vehicle safety
(a) All vehicles sold in India should meet international crashworthiness standards by 2010. (b) All buses and trucks should meet pedestrian impact standards by 2010. (c) All urban buses to have low floors and automatic closing doors. (d) Crashworthiness standards must be developed for all indigenous vehicles by 2008 and
implemented by 2010. (e) Use daytime running lights by all cars (f) Installation of ITS and other modern safety devices for assisting and controlling drivers. Expected saving: ~ 8,000 – 20,000 lives in 2015
Drinking under the influence of alcohol and other drugs
A long term strategy to reduce drinking and driving incidence to less than 10% of all crashes needs to be drawn up for the next 10 years. Measures could include:
(a) Sensitization of the public to the extent of the problem. (b) Institution of random roadblocks and checking on urban roads and rural highways. (c) Ignition interlock on cars. Expected saving: ~ 20,000 – 40,000 lives.
Road user based strategies
(a) Helmet use by all bicyclists. (b) Graduated driver licensing schemes to be introduced on a trial basis by 2007 and
implemented country wide by 2010. (c) Schools to identify and arrange safe routes for children walking and bicycling to school.
Prehospital care, treatment and rehabilitation
(a) Trauma care specialists to be trained and employed in all general and specialty hospitals. (b) Specialised rehabilitation centres to be set up in all regions of the country.
Easily implementable road safety measures can result in a saving of 15,000-25,000 lives per year in the near future
If all the short term and long term measures are implemented then we have a possibility of reducing the traffic injury mortality to 60,000 – 70,000 persons in the ye
r 2015. This is a conservative estimate. If there are new unforeseen developments and inventions helping road safety, we can be luckier.

Dinesh Mohan
25
SUMMARY 1. In a do-nothing scenario, it is possible that India will have 120,000 – 130,000 road traffic
fatalities in the year 2008 and possibly 150,000 – 175,000 in 2015. Our vision should aim at reducing the fatalities to less than 100,000 in the short term (2008) and less than 70,000 in the long term (2015).
2. A statutory National Road Safety Board (NRSB) needs to be established that is independent of the road building agency.
3. The police data collection systems need to be modified so that essential base line data become available to policy makers and researchers for meaningful analysis.
4. Traffic injury surveillance systems need to be established at hospitals and medical colleges around the country according to international guidelines suggested by the WHO.
5. A highway crash data system needs to be developed to monitor the details of vehicle and road design features associated with crashes.
6. Three or four research institutions should be selected in different regions of India for the establishment of multidisciplinary crash investigation teams and personnel trained for the same.
7. To encourage development of professionals and expertise the following policy measures are necessary: (a) strengthening of existing research institutions working on road safety; (b) Establishment of regional specialised interdisciplinary research centres on road safety; (c) Training programmes for policy makers and researchers on road safety.
SAFETY MEASURES FOR THE NEAR FUTURE 8. Pedestrian and bicyclist safety
• Free left turns must be banned at all signalised junctions. This will give a safe time for pedestrians and bicyclists to cross the road
• Speed control in urban areas. Maximum speed limits of 50 km/h on arterial roads need to be enforced by police monitoring, and 30 km/h in residential areas and by judicious use of speed breakers, dead end streets and mini roundabouts. In the short term of three years, a target of covering 10% of the roads can be attempted.
• Increasing the conspicuity of bicycles by fixing of reflectors on all sides and wheels and painting them in yellow, white or orange colours. Initially voluntary drives and encouragement, and later mandating the same can do this
9. Motorcyclist safety • Notification of mandatory helmet laws by every state. The Motor Vehicles Act of India
specifies that all motorised two-wheeler riders must wear a helmet in the country. However, since transportation is a state subject, most states are not enforcing this regulation. Helmets are available, as the manufacturing capability already exists in the country
• Mandatory daytime headlights use by two-wheeler riders. 10. Motor vehicle occupants
• Enforcement of seatbelt use laws countrywide • Restricting travel in front seat of cars by children has the potential of reducing injuries
dramatically. • Bus and truck occupant injuries and fatalities and injuries caused to other road users can
be reduced significantly by enforcing strict observance of speed limit regulations on highways. This can be done by ensuring that bus timetables and truck movement schedules ensure that drivers can observe speed limits with ease. Random speed checking on highways would help ensure such measures.
11. Road measures – initiation of good practices • Traffic calming in urban areas and on rural highways passing through towns and villages. • Improvement of existing traffic circles by bringing them in accordance with modern
roundabout practices and substituting existing signalised junctions with roundabouts. • Provision of segregated bicycle lanes and disabled friendly pedestrian paths. • Mandatory road safety audit for all road building and improvement projects
12. Pre-hospital care, treatment and rehabilitation • Modern knowledge regarding prehospital care to be made available widely. • Training of specialists in trauma care.

Traffic Injuries and fatalities in India
26
ROAD SAFETY STRATEGIES – LONG TERM 13. Traffic calming and speed control
• We should aim at implementing speed control and traffic calming measures in all urban areas and appropriate locations on rural highways by altering road design, vehicle monitoring through intelligent transport systems, and vehicle design by the year 2015. This measure is likely to give us the maximum savings in terms of lives and serious injuries.
14. Segregated lanes for vulnerable road users and buses in urban areas • Non-motorised transport and buses must be provided segregated lanes on all major arterial
roads in urban areas. India specific designs need to be developed and phase wise implementation plans drawn up for all cities
15. Safer design of 4/6 lane highways • Provision of service lanes on high-speed highways for slow and non-motorized traffic. • Provision of at surface tunnels at frequent intervals for local traffic.
16. Vehicle safety • All vehicles sold in India should meet international crashworthiness standards by 2010. • All buses and trucks should meet pedestrian impact standards by 2010. • All urban buses to have low floors and automatic closing doors. • Crashworthiness standards must be developed for all indigenous vehicles by 2008 and
implemented by 2010. • Use daytime running lights by all cars. • Installation of ITS and other modern safety devices for assisting and controlling drivers.
17. Drinking under the influence of alcohol and other drugs. • A long term strategy to reduce drinking and driving incidence to less than 10% of all
crashes needs to be drawn up for the next 10 years. • Sensitization of the public to the extent of the problem. • Institution of random roadblocks and checking on urban roads and rural highways. • Ignition interlock on cars.
18. Road user based strategies • Helmet use by all bicyclists. • Graduated driver licensing schemes to be introduced on a trial basis by 2007 and
implemented country wide by 2010. • Schools to identify and arrange safe routes for children walking and bicycling to school.
19. Prehospital care, treatment and rehabilitation. • Trauma care specialists to be trained and employed in all general and specialty hospitals. • Specialised rehabilitation centres to be set up in all regions of the country.
If all the short term and long term measures are implemented then we have a possibility of reducing the traffic injury mortality to 60,000 – 70,000 persons in the year 2015. This is a
conservative estimate. If there are new unforeseen developments and inventions helping road safety, we can be luckier.
Dinesh Mohan
27
REFERENCES (1) Road Safety Is No Accident: A Brochure for World Health Day 7 April 2004. 1-20. 2004. Geneva, World Health Organization.
(2) Accidental deaths and suicides in India 2000. 1-178. 2002. New Delhi, National Crime Records Bureau, Ministry of Home Afffairs.
(3) Tiwari G. Towards A Sustainable Urban Transport System: Planning For Non-Motorized Vehicles in Cities. Transport and Communications Bulletin for Asia and the Pacific 1999; 68:49-66.
(4) Gururaj G, Thomas AA, Reddi MN. Under reporting of road traffic injuries in Bangalore: Implications for road safety policies and programmes. Injury Prevention and Control, Proceedings 5th World Conference. Delhi: Macmillan India Ltd., 2000.
(5) Varghese M, Mohan D. Transportation Injuries in Rural Haryana, North India. Proceedings International Conference on Traffic Safety. New Delhi: Macmillan India Ltd., 2003: 326-329.
(6) Martinez R. Traffic safety as a health issue. In: von Holst H, Nygren A, Thord R, editors. Traffic Safety, Communication and Health. Stockholm: Temaplan AB, 1996.
(7) Evans L. Traffic Safety and the Driver. New York: Van Nostrand Reinhold, 1991.
(8) Evaluation of capacity augmentation projects of National Highways and State Highways: Final Report. 2000. New Delhi, Ministry of Surface Transport, Government of India.
(9) International Road Traffic and Accident Database (IRTAD). http://www.bast.de/htdocs/fachthemen/irtad/ . 2004. Organization for Economic Co-operation and Development.
(10) Ojha AK. Road Accidents in Delhi 2001. 1-189. 2002. New Delhi, Delhi Traffic Police.
(11) Tiwari G, Mohan D, Muskaug R. Mumbai Urban Transport Project 2: Accident Study. 1-342. 1998. New Delhi, TRIPP, Indian Institute of Technology Delhi. Final Report prepared for the World Bank.
(12) Cropper ML, Kopits E. Traffic Fatalities and Economic Growth. World Bank Policy Research Working Paper 3035, 1-42. 2003. Washington D.C., World Bank.
(13) World report on road traffic injury prevention. Peden Margie, Scurfield R, Sleet D, Mohan D, Hyder AA, Jarawan E et al., editors. 2004. Geneva, World Health Organization.
(14) Bansal A, Liu Z, Menon B, Mokashi A, Ranganathan N. Urban Transport. India's Transport Sector: The Challenges Ahead. Washington D.C.: World Bank, 2002: 78-90.
(15) Fieldwick R, Brown RJ. The effect of speed limits on road casualties. Traffic Engineering and Control 1987; 28:635-640.
(16) ETSC. Reducing traffic injuries resulting from excess and inappropriate speed. Brussels: European Transport Safety Council, 1995.
(17) Tiwari G, Mohan D, Fazio J. Conflict analysis for prediction of fatal crash locations in mixed traffic streams. Accident Analysis & Prevention 1998; 30(2):207-215.
(18) Mishra BK, Banerji AK, Mohan D. Two-wheeler injuries in Delhi, India: A study of crash victims hospitalized in a neuro-surgery ward. Accident Analysis & Prevention 1984; 16(5-6):407-416.
(19) Mohan D, Bawa PS. Analysis of road traffic fatalities in Delhi, India. Accident Analysis and Prevention 1985; 17(1):33-45.
(20) Mohan D, Kothiyal KP, Misra BK, Banerji AK. Helmet and Head Injury Study of Crash Involved Motorcyclists in Delhi. Proceedings 1984 International Conference on the Biomechanics of Impacts. Bron, France: IRCOBI, 1984: 65-77.
(21) Gururaj G. Epidemiology of road accidents and head injuries in Bangalore. 2001. Bangalore, Department Of Epidemiology, National Institute Of Mental Health & Neuro Sciences.
(22) Report of the Expert Committee on Auto Fuel Policy. 1-98. 2002. New Delhi, Government of India.
(23) McDevitt CF. Basics of concrete barriers. Public Roads 2004; 63(5).
(24) Srinivasan NS, Hingorani DV, Sharma BM. Economic Costs of Road Accidents. Journal of the Indian Roads Congress 1975; 36(2).
(25) Natarajan T. Costs of Road Accidents. Deptt. of Traffic and Urban Engineering, College of Engineering , Guindy, 1980.
(26) Road User Cost Study in India. Final Report. 1982. New Delhi, Central Road Research Institute.

Traffic Injuries and fatalities in India
28
(27) Evaluation of Road Accident Costs - Research Digest. Indian Highways 2000; 28(2):27-44.
(28) Natatrajan T. Costs of Road Accidents. Deptt. of Traffic and Urban Engineering, College of Engineering, Guindy, 1980.
(29) Murray CJL, Lopez AD. The Global Burden of Disease. Boston: Harvard University Press, 1996.
(30) The World Health Report:Health Systems - Improving Performance (2000). 2000. Geneva, World Health Organization.
(31) Bose A. India's Basic Demographic Statistics. Delhi: B.R. Publishing Corporation, 1996.
(32) Perils for Pedestrians - Episode 41. http://www.pedestrians.org/episodes/details31to60/episode41.htm . 2000. 4-19-0030.
(33) The history of road safety, traffic legislation and other important motoring events in UK. http://www.roadsafetyuk.co.uk/histall.htm . 2003. Road Safety UK. 4-17-0030.
(34) Jacobs G, Aeron-Thomas A, Astrop A. Estimating Global Road Fatalities. TRL Report 445. 2000. Crowthorne, U.K., Transport Research Laboratory.
(35) Trinca GW, Johnston IR, Campbell BJ, Haight FA, Knight PR, MacKay GM et al. Reducing Traffic Injury - A Global Challenge. Melbourne: Royal Australasian College of Surgeons, 1988.
(36) Robertson LS. Injuries: Causes, Control Strategies and Public Policy. Lexington, MA: Lexington Books, 1983.
(37) Dinesh Mohan, Geetam Tiwari. Mobility, Environment and safety in Megacities - Dealing with a Complex Future. IATSS Research 2000; 24(1):39-46.
(38) Bjornskau T, Elvik R. Can road traffic law enforcement permanently reduce the number of accidents? Accident Analysis & Prevention 1992; 24(5):507-520.
(39) Keall MD, Povey LJ, Frith WJ. Further results from a trial comparing a hidden speed camera programme with visible camera operation. Accident Analysis & Prevention 2002; 34(6):773-777.
(40) Keall MD, Povey LJ, Frith WJ. The relative effectiveness of a hidden versus a visible speed camera programme. Accident Analysis & Prevention 2001; 33(2):277-284.
(41) Carlsson G. Cost-Effectiveness of information, campaigns and enforcement and the costs and benefits of speed changes. European Seminar On Cost-Effectiveness Of Road Safety Work And Measures. Luxembourg: 1997. (42) Shults RA, Elder RW, Sleet DA, Nichols JL, Alao MO, Carande-Kulis VG et al. Reviews of evidence regarding interventions to reduce alcohol-impaired driving. American Journal of Preventive Medicine 2001; 21(1):66-88.
(43) Ichikawa M, Chadbunchachai W, Marui E. Effect of the helmet act for motorcyclists in Thailand. Accident Analysis & Prevention 2003; 35(2):183-189.
(44) Thompson DC, Rivara FP, Thompson R. Helmets for preventing head and facial injuries in bicyclists. [Issue 1]. 2003. Oxford, Update Software. The Cochrane Library.
(45) Bowman BM, Schneider LW, Mohan D, Rohr P. Simulation of Head/Neck Impact Responses for Helmeted and Unhelmeted Motorcyclists Proceedings. Proceedings 25th Stapp Car Crash Conference. Warrendale, PA: Society of Automotive Engineers, 1981.
(46) American College of Surgeons. Statement in support of motorcycle helmet laws [ST-35]. Bulletin of the American College of Surgeons 2001; 86(2).
(47) Mohan D. Study of helmet and motorized two-wheeler use patterns in Delhi. Indian Highways 1983; 11(5):8-16.
(48) Hyden C, Varhelyi A. The effects on safety, time consumption and environment of large scale use of roundabouts in an urban area: a case study. Accident Analysis & Prevention 2000; 32(1):11-23.
(49) OECD. Improving Road Safety by Attitude Modification. 1994. Paris, OECD.
(50) O'Neill B. Role of Advocacy, Education, and Training in Reducing Motor Vehicle Crash Losses. Proceedings from WHO meeting to Develop a 5-Year Strategy on Road Traffic Injury Prevention. Geneva: WHO, 2001.
(51) Duperrex O, Roberts I, Bunn F. Safety education of pedestrians for injury prevention (Cochrane Review). Issue 1. 2003. Oxford, Update Software. The Cochrane Library.

Dinesh Mohan
29
(52) Hagenzieker MP, Bijleveld FD, Davidse RJ. Effects of incentive programs to stimulate safety belt use: a meta-analysis. Accident Analysis and Prevention 1997; 29(6):759-777.
(53) Dinh-Zarr TB, Sleet DA, Shults RA, Zaza S, Elder RW, Nichols JL et al. Reviews of evidence regarding interventions to increase the use of safety belts. American Journal of Preventive Medicine 2001; 21(1):48-65.
(54) Zaza S, Sleet DA, Thompson RS, Sosin DM, Bolen JC. Reviews of evidence regarding interventions to increase use of child safety seats. American Journal of Preventive Medicine 2001; 21(1):31-47.
(55) Roberts I, Kwan I, Cochrane Injuries Group Driver Education Reviewers. School based driver education for the prevention of traffic crashes (Cochrane Review). Issue 1. 2003. Oxford, Update Software. The Cochrane Library.
(56) Williams AF, O'Neill B. On-the-road driving records of licensed race drivers :-.,1974. Accident Analysis and Prevention 1974; 6:263-270.
(57) Vernick, J.S., Guohua L, Ogaitis S, MacKenzie EJ, Baker SP et al. Effects of high school driver education on motor vehicle crashes, violations, and licensure. American Journal of Preventive Medicine 1999; 16:40-46.
(58) Mayhew DR, Simpson HM. Effectiveness and role of driver education and training in a graduated licensing system. 1-30. 1996. Ottawa, Ontario, Traffic Injury Research Foundation.
(59) Lund AK, Williams AF. A review of the literature evaluating the defensive driving course. Accident Analysis and Prevention 1985; 17:449-460.
(60) Hedlund J, Compton R. Graduated driver licensing research in 2003 and beyond. Journal of Safety Research 2004; 35(1):5-11.
(61) Broughton J. The benefits of improved car secondary safety. Accident Analysis & Prevention 2003; 35(4):527-535.
(62) Parkin S, MacKay GM, Framton RI. Effectiveness and Limitations of Current Seat Belts in Europe. Chronic Diseases in Canada 1993; 14(4 Supplement):S53-S59.
(63) O'Neill B, Lund AK. The Effectiveness of Air Bags in Preventing Driver Fatalities in the United States. Chronic Diseases in Canada 1993; 14(4, Supplement):S38-S46.
(64) ETSC. Reducing Traffic Injuries Through Vehicle Safety Improvements. 1993. Brussels, European Transport Safety Council.
(65) Elvik R. A meta-analysis of studies concerning the safety effects of daytime running lights on cars. Accident Analysis and Prevention 1996; 28(6):685-694.
(66) Radin .U.R.S., MacKay GM, Hills BL. Modelling of conspicuity-related motorcycle accidents in Seremban and Shah Alam, Malaysia. Accident Analysis & Prevention 2003; 28(3):325-332.
(67) Van Vliet P, Schermers G. Sustainable Safety: A New Approach for Road Safety in the Netherlands. 2000. Rotterdam, Traffic Research Centre, Ministry of Transport.
(68) Elvik R. Areawide urban traffic calming schemes: a metaanalysis of safety effects. Accident Analysis & Prevention 2001; 33(3):327-336.
(69) Hydén C, Várhelyi A. The effects on safety, time consumption and environment of large scale use of roundabouts in an urban area: a case study. Accident Analysis and Prevention 2000; 32(1):11-23.
(70) Elvik R. The safety value of guardrails and crash cushions: a meta-analysis of evidence from evaluation studies. Accident Analysis & Prevention 1995; 27(4):523-549.
(71) Ogden KW. The effects of paved shoulders on accidents on rural highways. Accident Analysis and Prevention 1997; 29(3):353-362.
(72) Koornstra M, Lynam D, Nilsson G, Noordzij P, Pettersson H-E, Wegman F et al. SUNflower: A comparative study of the development of road safety in Sweden, the United Kingdom, and the Netherlands. 1-147. 2002. Leidschendam, SWOV.

Traffic Injuries and fatalities in India
30
(73) Zador PL. Right-turn-on-red laws and motor vehicle crashes: A review of the literature. Accident Analysis & Prevention 1984; 16(4):241-245.
(74) Bunn F, Kwan I, Roberts I, Wentz R. Effectiveness Of Pre-Hospital Trauma Care. On behalf of the WHO Pre-hospital Care Steering Committee. 2001. Cochrane Reviews.
(75) Dickinson K, Roberts I. Medical anti-shock trousers (pneumatic anti-shock garments) for circulatory support in patients with trauma (Cochrane Review). Issue 1. 2003. Oxford, Update Software. The Cochrane Library.
(76) Mohan D. Safety as a human right. Health and Human Rights 2003; 6(2):161-167.
(77) Report of the working group on road accidents, injury prevention and control. 2001. New Delhi, Planning Commission, Government of India.
(78) Injury surveillance guidelines. Holder Y, Peden M, Krug E, Lund J, Gururaj G, Kobusingye O, editors. WHO/NMH/VIP/01.02, 1-92. 2001. Geneva, World Health Organization.