Embed Size (px)
Citation preview

Triggered MRM LC/MS/MS Method Development – Practical Considerations for MRM Optimization Using Agilent MassHunter Optimizer Software
Technical Overview
IntroductionOptimization of multiple reaction monitoring (MRM) conditions is an essential part of any liquid chromatographic-tandem mass spectrometric (LC/MS/MS) method development. A typical MRM or dynamic MRM (dMRM) method employs two MS/MS transitions per analyte: one for quantification, and the second one as a qualifier for identification purposes. In a triggered MRM (tMRM) method using Agilent 6400 Series triple quadrupole LC/MS systems, up to 10 MS/MS transitions can be acquired for each analyte, and combined into a product ion spectrum (at optimum collision energies for each product ion), which is used for library matching, and provides increased identification confidence. Using the tMRM function, some of the transitions (primary transitions) are acquired during the entire analyte acquisition window. The acquisition of the additional transitions is triggered (and performed for a defined number of scans) when one of the primary transitions exceeds the set abundance threshold [1].
Agilent MassHunter Optimizer software is a versatile tool for automated optimization of MRM conditions, including the selection of precursor and product ions and optimization of collision energies (CE) [2,3]. Using Optimizer software significantly reduces the time needed for MRM optimizations, especially for multi-analyte tMRM methods when more than two MRMs need to be optimized for multiple analytes. Optimizer software is simple to use, and provides a high degree of flexibility but, as with any tool, it should be used appropriately. This technical overview provides practical considerations for routine optimization of compounds using MassHunter Optimizer, drawing from our experience of developing a large pesticide multiresidue tMRM LC/MS/MS method [4].
Authors
Katerina Mastovska1, John Zulkoski1, and Jerry Zweigenbaum2
1 Covance Laboratories Madison, WI, USA
2 Agilent Technologies, Inc. Wilmington, DE, USA
2
MRM Optimization Using Agilent MassHunter OptimizerMassHunter Optimizer automates the selection of:
• Precursor ions using MS2 Selected Ion Monitoring (SIM)
• Optimum fragmentor voltage for each precursor ion (not done in the case of Agilent 6490 and Agilent 6495 instruments)
• Product ions using product ion scan for each precursor ion
• Optimum CE for each transition using MRM acquisition mode
Compound information (name and formula or nominal mass) and location of a vial with an appropriate standard solution can be entered directly into Optimizer, or can be imported from Microsoft Excel [3]. The latter option is convenient, especially when a larger list of compounds is being automatically optimized. Using a template method, Optimizer creates all necessary MS data acquisition methods (SIM, product ion scan, and MRM), and generates a report with the list of optimized MRM conditions. These conditions can be stored in a MassHunter database, loaded into the MassHunter Acquisition software, and exported into Microsoft Excel.
Precursor Ion SelectionOptimizer provides a highly flexible selection of potential precursor ions, including both positive and negative ions, various adducts (different options can be added manually as needed), and charge states. It is possible to conduct the optimization for the most abundant precursor ion, or set the search order based on user priorities. Certain masses or low-abundance precursor ions can be excluded from consideration.
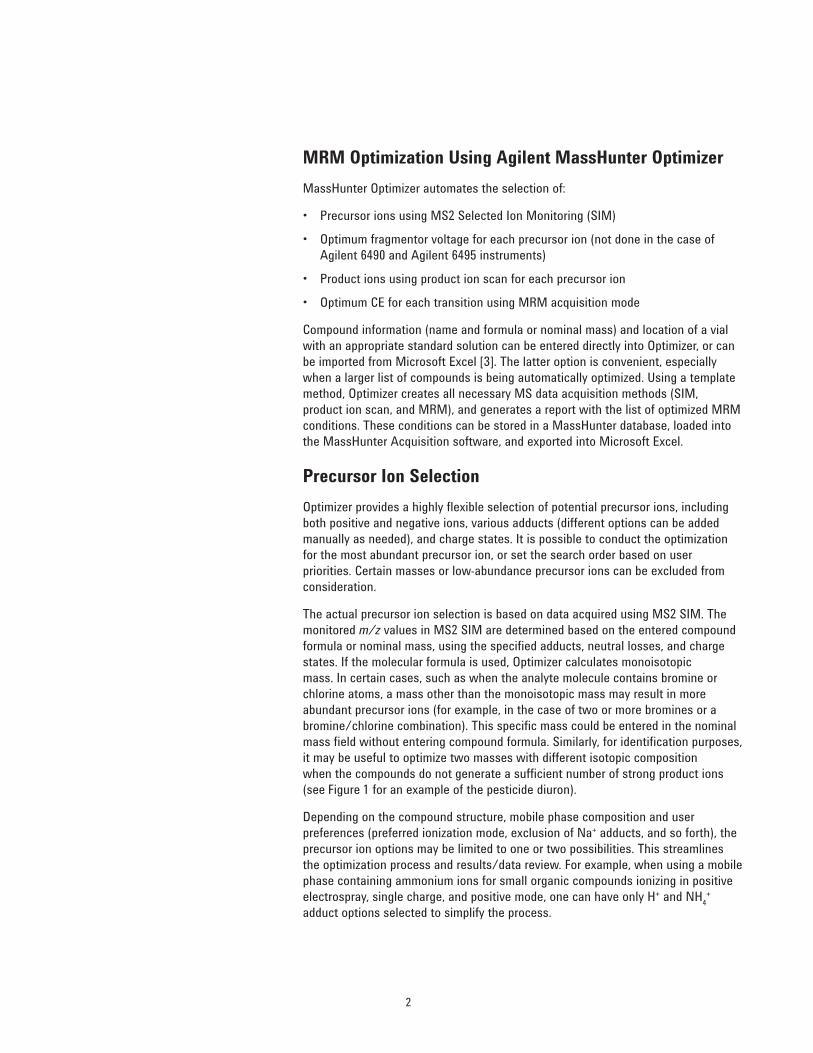
The actual precursor ion selection is based on data acquired using MS2 SIM. The monitored m/z values in MS2 SIM are determined based on the entered compound formula or nominal mass, using the specified adducts, neutral losses, and charge states. If the molecular formula is used, Optimizer calculates monoisotopic mass. In certain cases, such as when the analyte molecule contains bromine or chlorine atoms, a mass other than the monoisotopic mass may result in more abundant precursor ions (for example, in the case of two or more bromines or a bromine/chlorine combination). This specific mass could be entered in the nominal mass field without entering compound formula. Similarly, for identification purposes, it may be useful to optimize two masses with different isotopic composition when the compounds do not generate a sufficient number of strong product ions (see Figure 1 for an example of the pesticide diuron).
Depending on the compound structure, mobile phase composition and user preferences (preferred ionization mode, exclusion of Na+ adducts, and so forth), the precursor ion options may be limited to one or two possibilities. This streamlines the optimization process and results/data review. For example, when using a mobile phase containing ammonium ions for small organic compounds ionizing in positive electrospray, single charge, and positive mode, one can have only H+ and NH4
+ adduct options selected to simplify the process.
3
Product Ion SelectionProduct ions are selected as the most abundant ions in a composite product ion scan spectrum obtained for a given precursor ion at multiple CEs. Certain ions can specifically be excluded based on their m/z values, minimum abundance, neutral loss (for example, a generic loss of H2O or NH3), and by setting a low-mass cut-off. The low-mass cut-off is an important consideration. For example, if the cut-off were set at m/z 100 for the diuron example in Figure 1, sensitivity (and also selectivity) of diuron determination would be severely compromised because the most abundant product ions (m/z 46 and 72) would not be selected for MRM optimization. Similarly, if the cut-off were set at m/z 50, the second most abundant product ion (m/z 46) would not be considered. For relatively small molecules (precursor ions less than m/z 300), we recommend setting the cut-off at m/z 45.
Figure 1. Overlay of product ion spectra obtained at CEs of 0, 15, 30, 45, and 60 eV for two diuron (C9H10Cl2N2O) precursor ions (m/z 233 and 235) with different chlorine isotope composition (35Cl and 35Cl/37Cl, respectively).
×106
×106
00.51.01.52.02.53.03.54.04.55.05.5
71.9
46.3
233.2
188.0
160.1
Mass-to-charge (m/z)
Mass-to-charge (m/z)
Coun
tsCo
unts
50
A
B
70 90 110 130 150 170 190 210 230
0
0.5
1.0
1.5
2.0
2.5
3.0
72.0 46.2
234.9
190.2
162.2
60 80 100 120 140 160 180 200 220 240
Precursor ion m/z 233
Precursor ion m/z 235
4
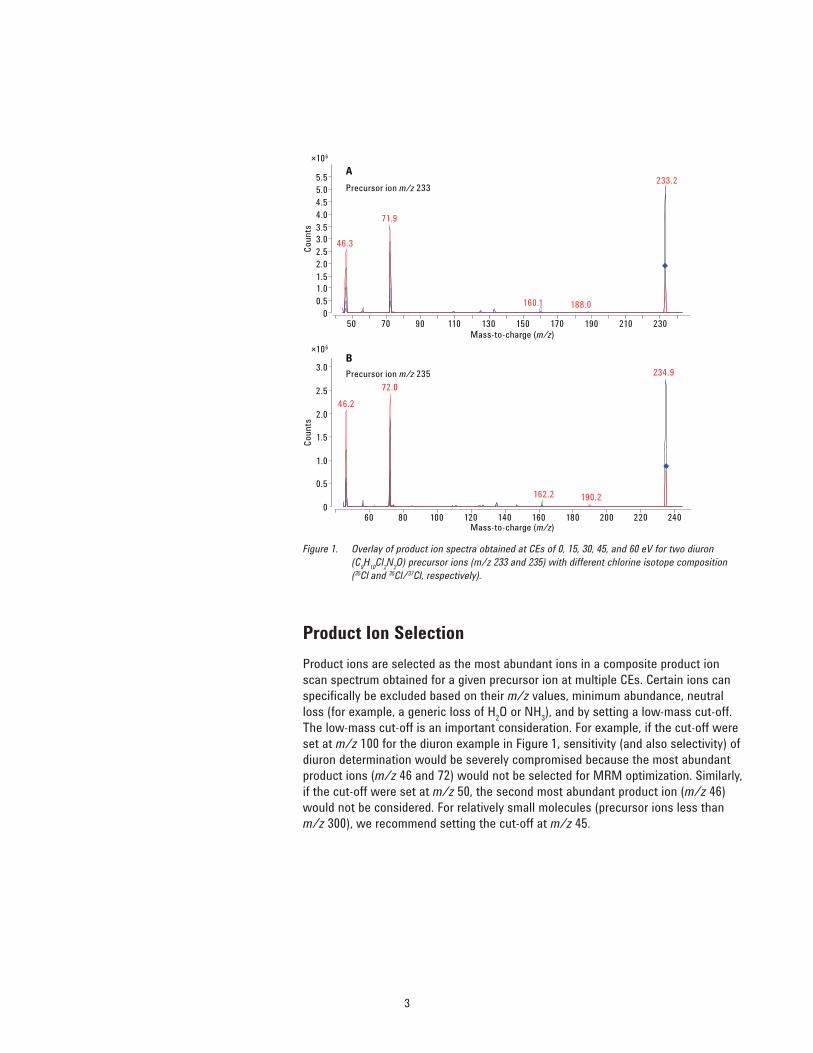
The product ion spectra are obtained at different CEs across the CE range specified by the user in the Optimizer settings. Product ion scans at 0, 15, 30, 45, and 60 eV were collected for CEs ranging from 0 to 60 eV within one analytical run (Figure 2). This range provides good generic conditions for optimization of a wide range of compounds, typically resulting in a sufficient selection of both lower- and higher-mass product ions. The precursor ions were selected from the composite product ion spectrum collected during the entire data acquisition time. This could lead to potential problems if isobaric precursor ion interferences are present, as demonstrated in Figure 2, and discussed in more detail below.
The maximum number of product ions that should be found at this stage depends on the intended application. For tMRM methods, it is recommended that up to 10 product ions are selected for MRM optimization.
0
1343.2
240.4
163.2
0
240.3
343.3
306.9 139.9
105.2
0
240.3 306.9
140.2
105.2
57.3
183.3
343.1
0
271.2
57.2 111.8
307.1
177.1
0
5 57.2 271.2
112.2
152.2
50 75 100 125 150 175 200 225 250 275 300 325 350
0
343.1
307.0
140.0
0
306.9
342.8
139.9 271.3
0
306.9
271.1
140.2 78.2
0
1 271.2 111.8
78.3 307.1
51.1
177.2
0
78.2 271.2
112.2 51.1
152.2
50 75 100 125 150 175 200 225 250 275 300 325 350
0
0.5
1.0
1.5
2.0
2.5
Acquisition time (min) Acquisition time (min)1 2 3 4 5 6 7 8 9 10 11 12
0
0.5
1.0
1.5
2.0
2.5
1 2 3 4 5 6 7 8 9 10 11 12
Precursor Product343 240.2
343 307.2
343 271.5
343 57.1
343 140.1
343 272.2
343 112.1
343 78.1
Optimizer
A B
0 eV
15 eV
30 eV
45 eV
60 eV
0 eV
15 eV
30 eV
45 eV
60 eV
×108
×105
×106
×106
×106
×106
×105
×104
×104
×103
×103
×108
Coun
ts
Coun
ts
Coun
tsCo
unts
Coun
tsCo
unts
Coun
ts
Coun
tsCo
unts
Coun
tsCo
unts
Coun
ts
Mass-to-charge (m/z) Mass-to-charge (m/z)
H
Cl
Cl
O
N
N
Figure 2. Product ion spectra obtained at CEs of 0, 15, 30, 45, and 60 eV during boscalid (formula: C18H12Cl2N2O; precursor ion: m/z 343; retention time: 5.45 minutes) optimization (A) for the entire data acquisition time (with respective Optimizer results showing product ion selection), and (B) across the boscalid peak. Product ions m/z 240 and 57 (highlighted in red) do not belong to boscalid.
5
CE OptimizationThe CE optimization involves the acquisition of each precursor-to-product ion transition at varying CEs. The CEs are varied across the selected CE range at a predefined step of 4 eV. When a CE range of 0 to 60 eV was used, 16 different CEs were tested for each transition within a single analytical run. This resulted in 160 different MRM settings when 10 transitions were optimized. Therefore, if a chromatographic separation is used for analyte optimization, it is important to set an appropriate dwell time in the Optimizer software to collect enough data points across the expected width of the analyte peak. For UHPLC separations, a dwell time of 5 ms or less is recommended for the above number of MRMs.
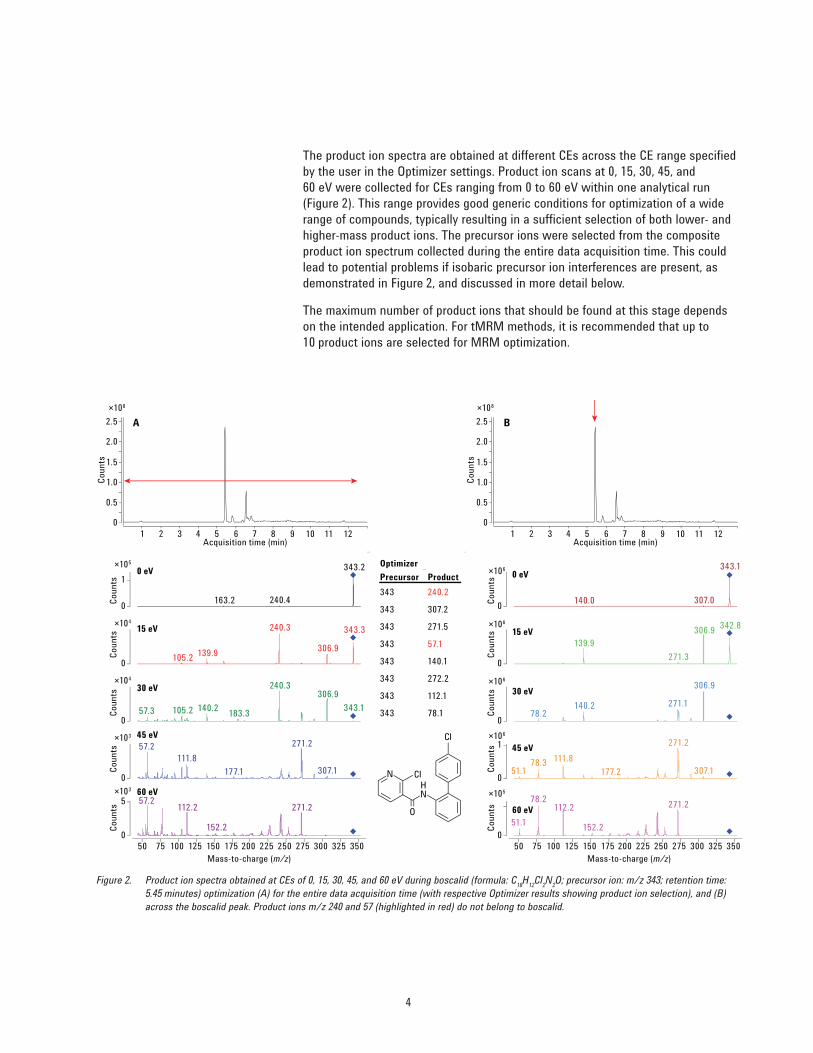
Another important consideration is the obtained analyte signal and related amount of analyte introduced into the system. For accurate CE optimization, it is important to avoid signal saturation by using an appropriate analyte concentration or injection volume. Figure 3 compares extracted ion chromatograms for three different diuron transitions obtained during the CE optimization (CE range 0 to 60 eV) in the same optimization run, and shows that if the analyte signal is saturated, it is not possible to determine the optimum CE for the given transition. The signals for the more abundant transition m/z 233 & 72 became saturated close to the optimum value (CE range of 12 to 32 eV), making the determination of the actual optimum CE value difficult. Whereas, the optimum CE values for the less abundant transitions m/z 233 & 133 and 233 & 188 were easily determined under the same conditions. Based on our experience, signal saturation might be suspected when analyte abundance exceeds approximately 5 × 10⁶ counts. If this happens, CE optimization should be repeated using an adequately reduced analyte concentration or injection volume.
If the initial optimization gives an optimum CE value at the maximum evaluated CE (such as at 60 eV in the above mentioned example), the CE optimization should be redone with a higher CE value range.
Figure 3. Overlay of extracted ion chromatograms for three different diuron transitions obtained during CE optimization (CE range 0 to 60 eV) in the same optimization run. As opposed to the less abundant transitions m/z 233 & 133 and 233 & 187, the more intense transition m/z 233 & 72 shows signal saturation without a clear CE optimum.
0
1
2
3
4
5
6
7
4.60 4.65 4.70 4.75 4.80 4.85 4.90 4.95
m/z 233 & 72 m/z 233 & 133 m/z 233 & 188CE 12–32 eV
0
0.5
1.0
1.5
2.0
2.5
3.0
3.5
4.0
4.5
4.60 4.65 4.70 4.75 4.80 4.85 4.90 4.95
OptimumCE 48 eV
0
0.2
0.4
0.6
0.8
1.0
1.2
1.4
1.6
1.8
4.60 4.65 4.70 4.75 4.80 4.85 4.90 4.95
OptimumCE 16 eV
Acquisition time (min) Acquisition time (min) Acquisition time (min)
×106 ×105 ×105
Coun
ts
Coun
ts
Coun
ts
A B C
6
LC ConditionsMassHunter Optimizer is highly flexible regarding sample introduction options into the MS system. It enables manual infusion using a syringe, automatic infusion using loop injection, and sample injection with or without a LC column. We recommend optimization using LC column separation under LC conditions as close to the final method as possible. This approach requires more time, but provides increased robustness due to a better separation from potential interferences and optimization under relevant mobile phase conditions (for adduct formation). Retention time information is collected at this stage, and can be used for faster development of the final method while minimizing potential analyte misidentification. This is a crucial aspect when combining a larger number of compounds into one dMRM or tMRM method.
For a large list of compounds, the mobile phase composition and optimization gradient should be selected using multiple representative analytes evaluated in SIM mode. The LC column and mobile phase gradient should provide adequate separation from potential interferences. The use of fast gradient and short columns (such as guard columns) provides faster run times, but the probability of a coelution with interfering components is higher. Potential interferences may originate from the optimization standard solution or from LC/MS system contamination (especially mobile phase contamination). Ideally, the optimization solution should contain only one analyte. If a mixture of analytes is used, it should be selected carefully to avoid isobaric interferences from various adducts of monoisotopic precursor ions and other isotopic contributions, especially chlorinated or brominated molecules. In-source generated fragments may also interfere. However, even single-analyte solutions may contain interfering components originating from solvent, glassware, or reference standard contamination.
As noted above, Optimizer selects precursor ions, product ions, and the optimum CE based on the most abundant signal from the entire data collection window. If we use generic data acquisition conditions for automated optimization of multiple analytes, it is possible that the optimum signal for some or all optimized conditions does not originate from the analyte of interest, as demonstrated in Figure 2. Figure 2 shows that, even though the analyte of interest (boscalid) produces the largest peak in the obtained chromatogram, the most abundant product ion (m/z 240) reported as the first choice by Optimizer comes from a later eluting, smaller interference peak. This product ion (and a less abundant m/z 57 ion) is not present in the product ion spectrum obtained by spectra extraction around the boscalid peak apex. Similarly, an incorrect precursor ion could be selected in the initial SIM analysis, or optimum CE values may originate from a different peak in the chromatogram. Therefore, it is critical to review the results and raw data (chromatograms and spectra) generated by the Optimizer program and respective data acquisition methods and, if needed, re-optimize affected analytes or individual MRMs.
7
Review of Results and Raw Data Generated by OptimizerA full Optimizer sequence includes the following runs, which are saved in separate data files in a subfolder entitled DataFiles in a respective Optimizer project folder (the file names are a combination of the compound and method name with suffixes _P1.d to _P4.d):
• _P1.d file: MS2 SIM for each precursor ion
• _P2.d file: Product ion scans for each precursor ion at multiple CEs
• _P3.d file: MRM (at CEs covering the defined range) for precursor-to-product ion transitions found in the previous step
• _P4.d file: Product ion scan using the optimal CEs, and a smaller scan range to determine m/z of the fragment ion to one decimal place. (The system assumes a good mass calibration, and Optimizer knows the m/z of the precursor to the first decimal place from the exact mass of the formula. Optimizer does not know the formula of the fragment ion, thus, this step is necessary to determine the optimum m/z for the fragment ion.)
When the optimization is complete, Optimizer generates a report, displaying the optimized MRM conditions. The export of the optimized MRM conditions into Microsoft Excel is a practical option when further re-optimization is needed because, for instance, a correction of product ion selection can easily be done in Excel, followed by import back into Optimizer.
For review of raw data, first evaluate the product ion scan results in the _P2.d file. The presence of multiple peaks in the chromatogram could lead to potential problems with product ion selection and CE optimization. For proper identification of the analyte peak, obtain as much information as possible about fragmentation pathways and precursor and product ions from reliable sources (such as peer-reviewed publications or curated spectral libraries). Known product ions can then be extracted from the chromatogram to help identify the analyte peak. If no information about potential product ions is available, then the main product ions generated for the peak or peaks in its or their product ion spectrum should be elucidated. A presence of a single peak does not guarantee that it belongs to the analyte, because it may be an interference peak, while the analyte peak may be missing due to low detection sensitivity, poor ionization efficiency, or even injection issues (interferences originating from mobile phase contamination could be present in the chromatogram even if no injection was made).
If the analyte peak could not be identified in the product ion _P2.d file, it is important to review the MS2 SIM results in the _P1.d file to evaluate the precursor ion selection. Further troubleshooting may be needed, such as new optimization at a higher concentration, or infusion in full scan to search for precursor ions and check the suitability of the used source conditions for a given analyte. In general, default source conditions are recommended for automated MRM optimization of a large number of compounds with different chemical structures and properties. For problematic analytes, source optimization may help provide better conditions for successful MRM optimization.
8
If the analyte peak is identified in the product ion _P2.d file, it is important to review the SIM results in the _P1.d file, and check the intensity of the monitored precursor ions at the analyte retention time. If more precursor options are available for a given analyte (for example, peaks present for both H+ and NH4+ species), and both their signals are saturated due to their high response in SIM, a lower analyte amount should be introduced into the system for proper precursor selection.
After the verification of the precursor ion, the presence of product ions found by Optimizer should be checked in the product ion spectra obtained (extracted) for the analyte peak (in the _P2.d file). It is possible to export the product ion spectra (preferably in the centroid format) into Excel and use Excel functions to obtain a list of most abundant product ions (a simple macro can be created in Excel for this purpose). If all or some product ions in the Optimizer report are not present in the analyte product ion spectrum (such as in the case of boscalid and m/z 57 and m/z 240 ions in Figure 2), those ions should be deleted or replaced with additional product ions in the Excel export/import format file (or directly in Optimizer), and submitted for CE optimization.
The MRM optimization _P3.d file should be reviewed carefully, even if the CE optimization was conducted for product ions originating from the analyte peak.
• It is important to check that the signal is not saturated (see Figure 3).
• It should be verified that the optimum CEs were determined using the analyte signals and not a signal of a more abundant component (with the same MRM) eluting at a different retention time.
• The peak shape and retention time of each transition should carefully be evaluated to ensure that they all belong to the analyte.
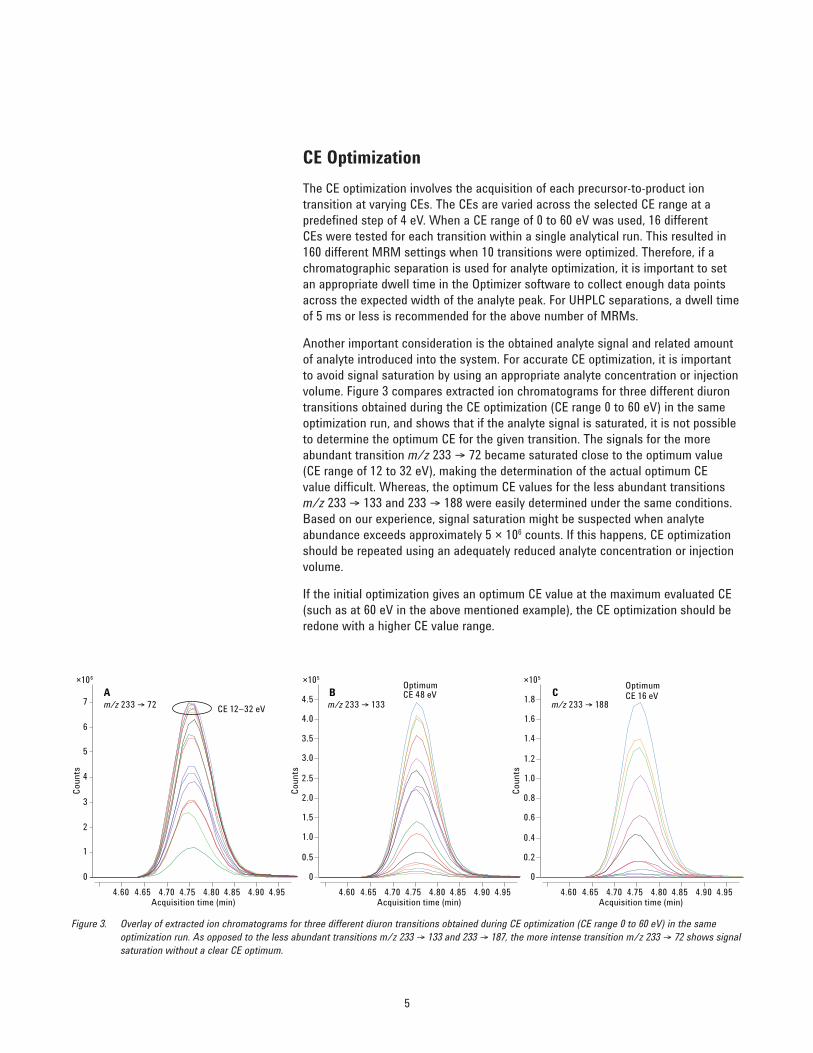
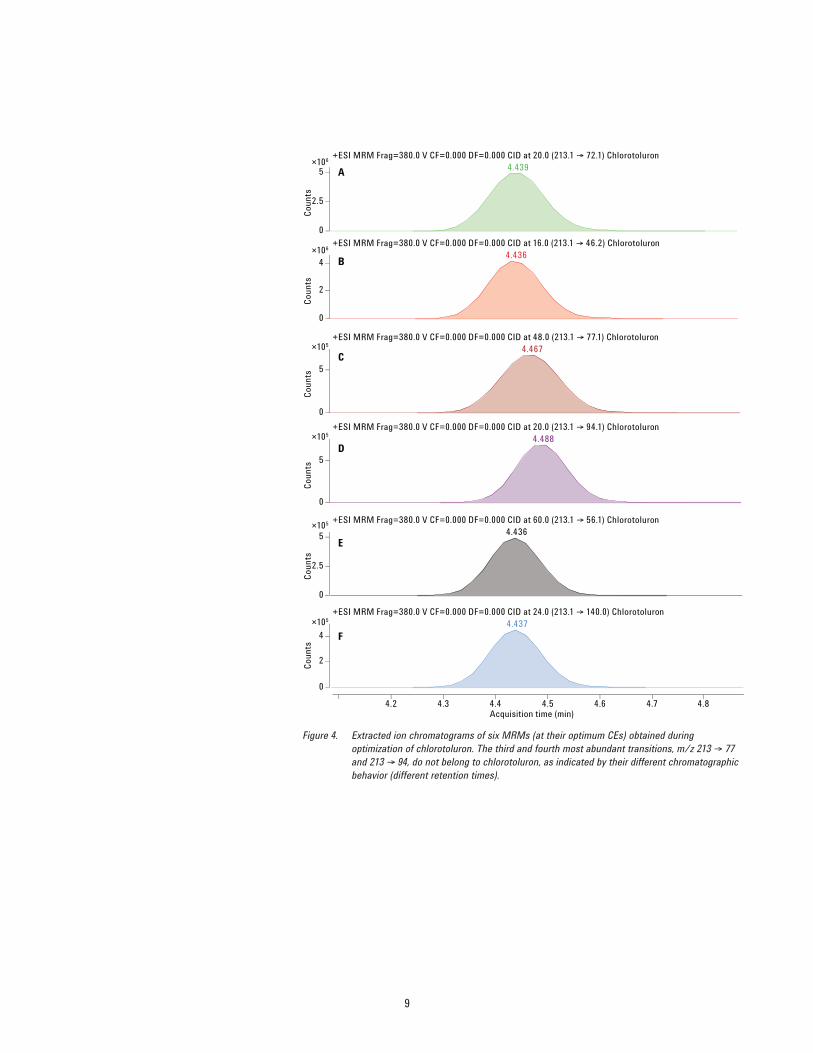
Figure 4 shows an example of six MRMs optimized for the pesticide chlorotoluron. All of the optimized product ions were clearly present in the product ion spectrum taken around the chlorotoluron peak apex, and there was only one peak in the total ion chromatogram in the respective _P3.d file. However, detailed examination of the retention times reveals that the third and fourth most abundant MRMs actually do not belong to the chlorotoluron peak because they elute at different retention times. This issue was confirmed by using a slower mobile phase gradient, which showed a more distinct separation of the chlorotoluron peak from the interference. This example demonstrates the importance of chromatographic separation in the MRM optimization and selection. In some cases, re-optimization with a narrow data acquisition window (just wide enough to capture the analyte elution) may help eliminate contribution from potential interferences outside that window. In the chlorotoluron example, however, this option would not help, and only careful review of the raw data could eliminate incorrect MRMs.
9
0
2.5
5+ESI MRM Frag=380.0 V CF=0.000 DF=0.000 CID at 20.0 (213.1 & 72.1) Chlorotoluron
4.439
0
2
4
+ESI MRM Frag=380.0 V CF=0.000 DF=0.000 CID at 16.0 (213.1 & 46.2) Chlorotoluron4.436
0
5
+ESI MRM Frag=380.0 V CF=0.000 DF=0.000 CID at 48.0 (213.1 & 77.1) Chlorotoluron4.467
0
5
+ESI MRM Frag=380.0 V CF=0.000 DF=0.000 CID at 20.0 (213.1 & 94.1) Chlorotoluron4.488
0
2.5
5+ESI MRM Frag=380.0 V CF=0.000 DF=0.000 CID at 60.0 (213.1 & 56.1) Chlorotoluron
4.436
0
2
4
+ESI MRM Frag=380.0 V CF=0.000 DF=0.000 CID at 24.0 (213.1 & 140.0) Chlorotoluron4.437
4.2 4.3 4.4 4.5 4.6 4.7 4.8Acquisition time (min)
A
B
C
D
E
F
×106
×106
×105
×105
×105
×105
Coun
tsCo
unts
Coun
tsCo
unts
Coun
tsCo
unts
Figure 4. Extracted ion chromatograms of six MRMs (at their optimum CEs) obtained during optimization of chlorotoluron. The third and fourth most abundant transitions, m/z 213 & 77 and 213 & 94, do not belong to chlorotoluron, as indicated by their different chromatographic behavior (different retention times).
10
Re-Optimization Using OptimizerIf the raw data review suggests that re-optimization of certain steps is needed, new information can easily be entered into Optimizer or imported from Excel. Optimizer then creates new methods, and collects only the required data. For example, if a different precursor ion was used for product ion selection, this information could be directly entered/imported into Optimizer. As a result, the first optimization step (MS2 SIM) is skipped, and no _P1.d file is generated. Similarly, if new product ions were selected from product ion spectra in a _P2.d file, they could be directly entered/imported into Optimizer for the CE optimization step. If the CE values are left blank, Optimizer creates a method collecting data for the entire CE optimization range (for example, 0 to 60 eV). If CE values are included in the Optimizer information (for some or all transitions), only CEs around the given value (with two steps above and two below) will be optimized for the given transitions (for example, if CE = 20 eV is entered in the Optimizer, MRM data for CEs = 12, 16, 20, 24, and 28 eV will be collected). The latter option is useful for quick verification or fine-tuning around the optimum CE value. The CE range selected is not trivial, and may have to be reiterated. Too wide a range for a fragile molecule may not produce significant product ions, and too narrow a range for more intractable molecules may not produce fragments. An input CE value that produces a maximum at the beginning or end of the range indicates that the optimal value may not have been reached.
Collision Cell Accelerator Voltage OptimizationCollision cell accelerator voltage (CAV) is another MRM-dependent parameter that should be optimized in addition to CE. The CAV setting affects the speed at which a given product ion moves out of the collision cell. It can be set to values ranging from 1 to 8 V; the lower the value, the slower the speed. For methods with many MRMs and short dwell times, avoid using 1 to 2 V settings, due to a potential risk of cross talk in the collision cell.
The Optimizer process does not include optimization of this parameter (a CAV of 4 V can be used as a generic setting in the Optimizer program), but it could easily be varied in an MRM/dMRM method (values of 3 to 8 V, step = 1 V), and evaluated using MassHunter Quantification software. For this reason, name each compound transition with a unique name (for example, compoundX_01, compoundX_02, and so on), and include them in the quantification method individually to determine the optimum CAV value for each of them.
Depending on the particular MRM, CAV optimization may or may not result in a significant improvement of the MRM signal as compared to a CAV of 4 V. We observed improvements up to approximately 50 % in certain cases.
11
MRM Sensitivity and Selectivity EvaluationThe last step in any MRM method development should be evaluation of the optimized transitions, based on their sensitivity and selectivity. Ranking of MRMs based on their sensitivity can easily be done using a solvent-based standard or a set of calibration standards to determine the lowest calibration level for each transition. This shows their suitability for routine quantitation and identification. The selectivity should be evaluated using blanks and post extraction spikes (matrix-matched standards) prepared in multiple target matrices. Ideally, more complex/challenging matrices should be chosen for this purpose. As with the CAV optimization, we prefer evaluating each MRM individually (using a unique name in the Agilent MassHunter Quantitation method). The combination of the selectivity and sensitivity results serves as a basis for selection of suitable primary and triggered MRMs for an optimized tMRM method.
ConclusionAgilent MassHunter Optimizer software is a practical and highly flexible tool for MRM optimization. It automatically generates all necessary acquisition methods, processes the data, and provides a report with MRM conditions obtained through the optimization process. It offers high productivity and ease-of-use, especially when a large number of analytes and MRMs have to be optimized for tMRM methods. Potential interferences or signal saturation issues may, however, affect the results. Therefore, it is important to review raw data (chromatograms and spectra) to evaluate the results, and make any necessary adjustments in the optimization process.
References1. Triggered MRM: Simultaneous Quantification and Confirmation Using
Agilent Triple Quadrupole LC/MS Systems, Agilent Technologies, publication number 5990-8461EN, 2013.
2. MassHunter Optimizer Software for Automated MRM Method Development Using the Agilent 6400 Series Triple Quadrupole Mass Spectrometers, Agilent Technologies, publication number 5990-5011EN, 2010.
3. Agilent MassHunter Optimizer: Automated MS Method Development Software, Agilent Technologies, publication number G3793-90008, 2014.
4. K. Mastovska, et al. Improved LC/MS/MS Pesticide Multiresidue Analysis Using Triggered MRM and Online Dilution, Agilent Technologies, publication number 5991-7193EN, 2016.
www.agilent.com/chemAgilent shall not be liable for errors contained herein or for incidental or consequential damages in connection with the furnishing, performance, or use of this material.
Information, descriptions, and specifications in this publication are subject to change without notice.
© Agilent Technologies, Inc., 2017 Printed in the USA January 9, 2017 5991-7195EN