Embed Size (px)
Citation preview

TRF1 and TRF2 use different mechanisms to findtelomeric DNA but share a novel mechanism tosearch for protein partners at telomeresJiangguo Lin1 Preston Countryman1 Noah Buncher2 Parminder Kaur1 Longjiang E3
Yiyun Zhang4 Greg Gibson5 Changjiang You6 Simon C Watkins5 Jacob Piehler6
Patricia L Opresko2 Neil M Kad7 and Hong Wang1
1Physics Department North Carolina State University Raleigh NC 27695 USA 2Department of Environmentaland Occupational Health University of Pittsburgh Graduate School of Public Health Pittsburgh PA 15219USA 3Electric and Computer Engineering Department University of North Carolina at Charlotte Charlotte NC28223 USA 4Department of Industrial and System Engineering North Carolina State University Raleigh NC27695 USA 5Department of Cell Biology Center for Biologic Imaging University of Pittsburgh GraduateSchool of Public Health Pittsburgh PA 15219 USA 6Division of Biophysics Universitat OsnabruckBarbarstrasse 11 49076 Osnabruck Germany and 7School of Biological Sciences University of EssexColchester Essex CO4 3SQ UK
Received July 19 2013 Revised October 11 2013 Accepted October 23 2013
ABSTRACT
Human telomeres are maintained by the shelterinprotein complex in which TRF1 and TRF2 binddirectly to duplex telomeric DNA How theseproteins find telomeric sequences among agenome of billions of base pairs and how they findprotein partners to form the shelterin complexremains uncertain Using single-molecule fluores-cence imaging of quantum dot-labeled TRF1 andTRF2 we study how these proteins locate TTAGGG repeats on DNA tightropes By virtue of its basicdomain TRF2 performs an extensive 1D search onnontelomeric DNA whereas TRF1rsquos 1D search islimited Unlike the stable and static associationsobserved for other proteins at specific bindingsites TRF proteins possess reduced binding stabil-ity marked by transient binding (9ndash17 s) and slow1D diffusion on specific telomeric regions Theseslow diffusion constants yield activation energybarriers to sliding 28ndash36 iBT greater than thosefor nontelomeric DNA We propose that the TRFproteins use 1D sliding to find protein partners andassemble the shelterin complex which in turnstabilizes the interaction with specific telomericDNA This lsquotag-team proofreadingrsquo represents amore general mechanism to ensure a specific setof proteins interact with each other on long
repetitive specific DNA sequences without requiringexternal energy sources
INTRODUCTION
Telomeres play a crucial role in maintaining the stabilityof linear chromosomes (12) Loss of telomere functioncan activate DNA repair processes leading to nucleolyticdegradation of natural chromosome ends and their end-to-end fusion (3) Telomere dysfunction and associatedchromosomal abnormalities have been strongly associatedwith age-related degenerative diseases and cancer (45)In a typical human somatic cell the telomeric repeatsequence TTAGGG is 2ndash15 kb in length with a 30-over-hang of 100ndash200 nt (6) This 30-overhang serves as asubstrate for the reverse transcriptase telomerase whichreplicates the telomeric sequence by using an internalRNA subunit as a template to direct the DNA synthesis(17ndash9) A specialized protein complex shelterin (ortelosome) binds to and protects the chromosome ends(210) The shelterin complex in humans consists ofsix core proteins TRF1 TRF2 POT1 TIN2 TPP1 andRAP1 (111)TRF1 and TRF2 are the only proteins in the shelterin
complex that make high-affinity contact with double-stranded telomeric DNA (1213) TRF1 negatively regu-lates telomere length and promotes telomere replication(14) Whereas TRF2 caps and protects chromosomeends (11) in addition to regulating telomere length (15)
To whom correspondence should be addressed Tel +1 919 5137203 Fax +1 919 5156538 Email hong_wangncsueduCorrespondence may also be addressed to Neil M Kad Tel +44 1206 874403 Fax +44 1206 872592 Email nkadessexacuk
Nucleic Acids Research 2013 1ndash12doi101093nargkt1132
The Author(s) 2013 Published by Oxford University PressThis is an Open Access article distributed under the terms of the Creative Commons Attribution License (httpcreativecommonsorglicensesby30) whichpermits unrestricted reuse distribution and reproduction in any medium provided the original work is properly cited
Nucleic Acids Research Advance Access published November 22 2013 at D
H H
ill Library - A
cquis S on Novem
ber 27 2013httpnaroxfordjournalsorg
Dow
nloaded from
Removal of TRF2 from the telomeres results in loss of the30-overhang covalent fusion of telomeres and inductionof ATM and p53 dependent apoptosis (1617) BothTRF1 and TRF2 contain a TRFH domain thatmediates homodimerization and a Myb type domainthat sequence-specifically binds to telomeric DNA(Figure 1A) (12) However these two proteins differ attheir N-termini where TRF1 and TRF2 are rich inacidic and basic residues respectively Previous electronmicroscopy (EM) and atomic force microscopy (AFM)studies established that both TRF1 and TRF2 playimportant architectural roles at telomeres (18ndash21) TRF1forms protein filaments on longer telomeric repeats (27repeats) and promotes parallel pairing of telomeric tracts(19) In vitro TRF2 can remodel linear telomeric DNAinto T-loops (20)A previous cell-based study of TRF1 and TRF2 using
fluorescence recovery after photobleaching and fluores-cence loss in photobleaching suggested that TRF1 andTRF2 interact with telomeres in a dynamic fashion (22)Although TRF1 and TRF2 are proposed to have extra-telomeric functions they preferentially localize to the TTAGGG repeat sequences whether these target sites are atinterstitial regions or at chromosome ends (23ndash25) Oncetelomeric sequences are located TRF1 and TRF2 mustfind protein partners to form the shelterin complex andto regulate the functions of other DNA-binding proteinsat telomeres (26ndash28) Despite recent advancements in theunderstanding of functions of TRF1 and TRF2 it is stillunclear how TRF1 and TRF2 are able to find telomericsequences and protein partners in a genome of billions ofbase pairsAccumulating evidence suggests that a protein can use
one-dimensional (1D) sliding (correlated translocation
while maintaining continuous DNA contact) jumping(noncorrelated detachment and reattachment) orhopping (correlated detachment and reattachment) tonavigate through the vast excess of nonspecific DNA se-quences in vivo (29ndash32) Investigations of DNA-bindingdynamics on nonspecific DNA at the single-moleculelevel have significantly advanced our understanding ofhow proteins with diverse functions conduct their targetDNA search (313334) However the paradoxicalrequirements of rapid search at nonspecific sites andstability at target sites have been primarily investigatedin theoretical studies (35ndash38) direct comparisons of theprotein-binding energy landscape at nonspecific sites andtarget sites from single-molecule experimental data are stilllacking
Here we used single-molecule fluorescence imaging tostudy the dynamics of quantum dot (QD)-labeled TRF1and TRF2 proteins on DNA and DNA substrates con-taining alternating regions of telomeric and nontelomericsequences TRF1 appears to bind directly to telomeric se-quences with very little 1D searching through nontelo-meric DNA whereas TRF2 possesses a significantcomponent of 1D search Using a truncation mutant welocalized this 1D searching activity to the basic domain ofTRF2 On telomeric DNA both TRF1 and TRF2 diffuseslowly due to higher energy barriers to diffusion and theypossess longer attached lifetimes at telomeric repeatscompared with nontelomeric DNA sequences Theseobservations indicate that there is preferential binding totelomeric DNA but the affinity is not high enough toprevent TRF proteins from diffusing along TTAGGGrepeats We postulate that this allows TRF1 and TRF2to find their protein partners locally and that this is amore general mechanism for coupling the energy from
Figure 1 TRF1- and TRF2-QDs retain DNA-binding activity (A) Schematic representations of the domain structures of TRF1 and TRF2A Acidic domain B Basic domain M Myb type domain (B) Schematic representations of TRF1- and TRF2-QD conjugates (left) BTtris-NTAcompound (middle) and the DNA substrate (T270) with two tandem (TTAGGG)135 repeats connected by a short linker region (right 54 kb inlength) (CndashE) Representative AFM images of DNA in the presence of (C) only QDs and BTtris-NTA compound (D) TRF1-QDs or (E) TRF2-QDsThe scale bar is 200 nm White arrows point to QDs bound to DNA The numbers in (CndashE) indicate the percent of DNA molecules bound with QDsin each condition The total numbers of complexes analyzed were 200 250 and 250 for no protein TRF1-QDs and TRF2-QDs respectively
2 Nucleic Acids Research 2013
at D H
Hill L
ibrary - Acquis S on N
ovember 27 2013
httpnaroxfordjournalsorgD
ownloaded from
multiple weak DNA-binding components to ensure highbinding specificity on long repetitive sequences
MATERIALS AND METHODS
Protein purification
Recombinant N-terminal His6-tagged TRF1 and TRF2were purified using a baculovirusinsect cell expressionsystem and an AKTA Explorer FPLC (GE Healthcare)as described previously (39) TRF2B was purified usinga bacterial expression system (40) Protein concentrationswere determined using the Bradford assay Proteins usedin this study are gt90 pure based on SDSndashPAGE andCoomassie staining Proteins are active in binding to thetelomeric DNA substrate containing three TTAGGGrepeats based on electrophoresis mobility shift assays(EMSAs)
DNA substrates
DNA was purchased from New England BioLabs OtherDNA substrates used in this study are shown in Figure 1Band Supplementary Figure S1 pSXneo(T2AG3) plasmidDNA containing 270 TTAGGG repeats was a gift fromDr Peter Lansdorp (University of British Columbia) (41)pGTK4 plasmid-derived Tel10 plasmid is 5994-bp longand contains 10 TTAGGG repeats and was prepared asdescribed previously (42) To generate DNA fragmentscontaining TTAGGG repeats for AFM imaging digestionof T270 DNA (10 mg) was carried out at 37C for 4 h usingHpaI (130 U) in Buffer 4 (New England BioLabs) ForTel10 plasmid digestions were carried out using XbaI (100U) in Buffer 4 For fluorescence imaging linearizedplasmids were ligated to generate longer DNA substratesusing a Quick LigationTM Kit (New England BioLabs)The ligation reactions were done at room temperaturefor 15min The nontelomeric DNA substrate withoutthe (TTAGGG)270 sequence was gel purified after the di-gestion of pSXneo(T2AG3) with BglII and XbaI FinalDNA substrate purification was done using an illustraGFXTM PCR DNA and Gel Band Purification Kit (GEHealthcare)
ProteinndashQD conjugation
Streptavidin-conjugated QDs (Sav-QDs) were purchasedfrom Invitrogen Biotinylated multivalent chelatortris-nitrilotriacetic acid (BTtris-NTA) was preparedaccording to the previous reports (4344) The TRFndashDNA reaction buffer contains 50mM HEPES (pH 75)and varying concentrations of NaCl (25 50 75 and100mM) The total ionic strengths are 75 125 175 and225mM respectively (45)
For single color QD labeling of His6-tagged TRF1 orTRF2 1 ml of red QD (655 nm 1 mM Invitrogen hydro-dynamic radius 115 nm) was incubated with 1 ml ofBTtris-NTA (2mM) for 20min (46) An amount of 1 ml ofproteins (2mM) were then added to the QD-NTA solutionand incubated for additional 20min For dual-color QDlabeling 1 ml of red (1mM) and green QDs (565 nm 1 mMhydrodynamic radius 95 nm) were incubated with 1 ml of
BTtris-NTA (2mM) (46) TRF1 or TRF2 (1ml 2 mM) wasadded to the solution and incubated for additional 20minFor fluorescence imaging unless otherwise specifiedproteinndashNTA-QD solutions were diluted 200-fold beforebeing drawn into the flow cell using a syringe pump(model SP260p World Precision Instruments) at 300 mlml flow rate The final protein concentration was 33 nMfor both TRF1 and TRF2 Protein concentrations andionic strengths of the buffer used in this study are com-parable to physiological conditions (Supplementary Text)For AFM imaging of TRF2-QDs in the presence ofmonoclonal TRF2 antibody (Imagenex Corporation)the AbTRF2NTAQD ratio was 1121 or 5121 andreactions were carried out at room temperature for 30minafter the addition of antibodies
AFM imaging and image analysis
All DNA and protein samples were diluted 10-fold in 1AFM buffer [25mM NaOAc 25mM HEPESndashKOH (pH75) and 10mM Mg(OAc)2] before deposition onto afreshly cleaved mica (SPI Supply) The samples werethen washed with MilliQ water and dried under a streamof nitrogen gas All images were collected in tappingmode using a MFP-3D-Bio AFM (Asylum Research)Pointprobe PPP-FMR probes (Nanosensors) withspring constants at 28Nm (nominal value) were usedAll images were captured at a scan size of 1 mm 1 mm ascan rate of 1ndash2Hz and a resolution of 512 512 pixelsThe position of TRF proteins on DNA was analyzedusing the software from Asylum Research
Fluorescence imaging and analysis of fluorescencemicroscopy data
Fluorescence imaging was carried out with an invertedmicroscope (Nikon Ti-E) equipped with an encodedmotorized stage perfect focus system (PFS) and a Ti-TIRF E motorized illuminator unit Fluorescenceimaging was performed by excitation at 488 nm using asolid-state laser (20mW Sapphire DPSS) a 100 objectivewith a numerical aperture of 149 (APO TIRF Nikon)and 15 additional magnification The laser power wascontrolled by using neutral density filters The excitationbeam was reflected into the objective through a TIRFfilter set containing zt488rdc and ET500LP filters Forsimultaneous imaging of green (565 nm) and red(655 nm) QDs a dual view simultaneous imaging system(DV2 Photometrics) was used in combination with aT605LPXR dichroic beamsplitter (Chroma) and a band-pass filter ET65540m (Chroma) The images werecaptured using an electron multiplied (EM) CCDcamera (iXon DU897 Andor Technology) operated at60C with an EM gain of 250 and a frame rate of20Hz Construction of the flow cell was carried out ac-cording to a procedure described previously (334748)Silica beads (5 mm Polysciences) were first treated withpoly-L-lysine hydrobromide (2500 mgml MWgt 300KDa Wako Chemicals) DNA or ligated DNA sub-strate (5 mgml) were stretched unless otherwise specifiedunder hydrodynamic flow at 300 mlmin flow rate using asyringe pump Extended DNA strands anchored between
Nucleic Acids Research 2013 3
at D H
Hill L
ibrary - Acquis S on N
ovember 27 2013
httpnaroxfordjournalsorgD
ownloaded from
two poly-L-lysine-coated beads formed DNA tightropesAfter introducing the proteinndashQDs into the flow cell alldata collection was performed in the absence of anyfurther buffer flow The presence of YOYO-1 on DNAsignificantly reduced the diffusion constant a-factor andthe percentage of motile proteinndashQD complexes on DNAat certain salt conditions Consequently all data analysiswas done using movies collected from using unstainedDNA tightropes (Supplementary Text)
Statistical analysis
Single-factor ANOVA and Student-t tests were used forstatistical analysis
RESULTS
TRF1- and TRF2-QD conjugates are functional inDNA binding
Fluorescent labeling of TRF1 and TRF2 was achieved byconjugating 6 histidine (His6) tagged TRF1 and TRF2to streptavidin-conjugated QDs using the biotinylatedmultivalent chelator tris-nitrilotriacetic acid (BTtris-NTA)(44) (Figure 1B see lsquoMaterials and Methodsrsquo section) Themultiple Ni-NTAs on the circular scaffold of the tris-NTAadaptor bind the His-tag with subnanomolar affinity re-sulting in a bound lifetime in the range of hours (4344)Importantly we applied a previously established methodbased on AFM imaging to characterize the stoichiometryof QDndashTRF complexes (4950) AFM imaging revealedthat using TRF2 antibody marking the presence ofTRF2 (TRF2Ab=11 or 15) among the QDs displayedTRF2-Ab complexes (24) 90 (n=39) possessed onlyone TRF2ndashAb complex (Supplementary Figure S2)
QDs alone exhibited minimal nonspecific binding toDNA as confirmed by AFM (Figure 1C) As expectedaddition of QD-labeled TRF1 or TRF2 to DNA contain-ing two stretches of (TTAGGG)135 connected by a shortlinker region (T270 DNA Figure 1B see lsquoMaterialsand Methodsrsquo section) resulted in substantial binding(Figure 1D and E) Furthermore AFM image analysisrevealed that both TRF1- and TRF2-QDs bound prefer-entially to the telomeric DNA sequences on both the T270and Tel10 DNA substrates (Supplementary Figure S3)
TRF1 and TRF2 diffuse one-dimensionally onnontelomeric DNA
To study the dynamics of individual TRF1 and TRF2 mol-ecules on DNA using oblique-angle fluorescence micros-copy we applied a DNA tightrope assay (Figure 2A)(33) DNA strands are suspended between poly-L-lysinecoated microspheres at an elongation of 90 DNAcontour length using hydrodynamic flow (47) Thisprocess isolates DNA from the surface and does notrequire continuous buffer flow for the observation ofproteinndashDNA interactions QDs did not bind to DNAtightropes alone or in the presence of TRF proteinswithout BTtris-NTA However with both BTtris-NTAand His6-tagged TRF1 or TRF2 QDs were observed onDNA throughout the visual field (Figure 2B and C) BothTRF1- (Supplementary Movie S1) and TRF2-QDs(Supplementary Movie S2) showed clear 1D diffusion onDNA which was tracked by Gaussian fitting to kymo-graphs (particle position versus time plots SupplementaryData) (3347)
To determine whether TRF1 and TRF2 slide or hop weevaluated the effect of ionic conditions on the dynamic
Figure 2 DNA tightrope assay based oblique-angle fluorescence imaging of TRF1- and TRF2-QDs on DNA tightropes (A) A schematic drawingof the DNA tightropes (green lines) bound with QD (red ball)-labeled proteins (green balls) between silica beads (large white balls) The drawing isnot to scale (B and C) Representative fluorescence images of red (655 nm) QD-conjugated His6-TRF1 (B) and His6-TRF2 (C) on DNA (stainedwith YoYo1) (D) Classification of different types of proteinndashDNA interactions observed with TRF2-QDs on DNA for attached lifetimemeasurement
4 Nucleic Acids Research 2013
at D H
Hill L
ibrary - Acquis S on N
ovember 27 2013
httpnaroxfordjournalsorgD
ownloaded from
interactions between the QD-labeled TRF proteins andDNA Increasing the salt concentration should not affectthe diffusion constants of a sliding process but shouldelevate the diffusion constants of hopping (295152) Weperformed experiments at 75 125 175 and 225mM ionicstrengths (see lsquoMaterials and Methodsrsquo section) Thefraction of motile TRF1 proteins ranged from 15 to33 (Supplementary Figure S4A) and followed a trendof decreasing diffusion constants as the ionic strengthincreased (75ndash38 102mm2s) such that the differencebetween the highest and lowest salt was statistically signifi-cant (P=0017 Supplementary Figure S4B and Table 1)In contrast TRF2 was highly motile on DNA acrossall ionic strengths and showed no significant change indiffusion constant (84ndash95 102 mm2s SupplementaryFigure S4B and Table 1) TRF2 diffused substantiallyfaster than TRF1 at all ionic strengths showing statisticalsignificance at ionic strengths between 125 and 225mM
In addition to the diffusion constant we also measuredthe diffusive exponent (a-factor Supplementary Data)An a factor of 1 indicates an unbiased random walk gt1indicates directed motion and lt1 indicates periodsof pausing in the random walk (subdiffusion) (53)TRF1 showed a slight trend toward increasing a factorfrom 065 to 089 with increasing ionic strength(Supplementary Figure S4C and Table 1) this resultsuggests pausing at low ionic strength which is abrogatedby salt For TRF2 however the a factor was consistently1 and did not show any significant variation with ionicstrength suggesting an unbiased random walk Dual-colorlabeling of the TRF proteins allowed us to assesswhether protein hopping could enable bypass of otherDNA-bound proteins that act as diffusion barriers(Supplementary Figure S5) Neither TRF1 nor TRF2could bypass differentially labeled proteins of the samespecies on DNA which is consistent with a TRF2sliding mechanism and suggests that TRF1 also navigatesDNA by sliding (Supplementary Data)
Next we measured the attached lifetimes of proteinndashQD complexes on DNA First however we classified theproteinndashDNA interactions into four types based on howthey behaved during a movie Type I protein binds andthen releases Type II proteins binds and doesnrsquot leaveType III protein is bound at the beginning of the moviebut releases Type IV protein is bound from the beginningto end of the movie (Figure 2D and Supplementary Table
S1) Reliable attached lifetime measurements couldonly be obtained from analysis of the Type I interactionsThe lifetimes of both TRF1 and TRF2 on DNAdecreased with increasing ionic strength ranging from18 s (175mM) to 03 s (225mM) for TRF1 and from10 s (75mM) to 34 s (225mM) for TRF2 (Table 1 andSupplementary Figure S4D) These results are consistentwith salt-sensitive electrostatic interactions between TRFproteins and DNA and increased probability of dissoci-ation from DNA during sliding as the ionic strengthincreases (54)In summary these results demonstrate that both TRF1
and TRF2 slide on DNA in search of their target DNA-binding sites TRF2 is a canonical slider whereas TRF1alsoappears to slidebutmayalter its conformationwith salt
TRF1 and TRF2 bind specifically to telomeric sequenceson DNA tightropes
To examine the dynamics of TRF1 and TRF2 binding totelomeric DNA sequences we ligated linearized T270DNA to generate long DNA substrates with alternating(TTAGGG)270 telomeric and nontelomeric regions(Figure 3A) The lengths of these DNA tightropes rangedfrom 21 to 22 mm consistent with ligation of 2ndash12 of54 kb T270 DNA fragments (Supplementary Figure S6A)TRF1 and TRF2 bound to the ligated T270 DNA tight-ropes with regular spacing (Figure 3B SupplementaryMovies S3 and S4) For both TRF1 and TRF2 the distri-butions of the distances between adjacent binders fit wellto the sum of two Gaussian distribution functions centeredat 16 and 32 mm (Figure 3C) These findings are consist-ent with the expected spacing of the telomeric regions(Figure 3B) In contrast on the ligated nontelomericDNA the distribution of TRF2 spacing was broad(Figure 3C) and no examples of three or more boundproteinndashQDs on individual DNA tightropes with aspacing of 16 or 32 mm were observed for either TRF1or TRF2 As an additional control the telomeric repeatswere spaced further apart using a 599-kb long DNAsubstrate containing only 10 TTAGGG repeats (Tel10Supplementary Figure S7 and Supplementary Movie S5)and as expected adjacent bound TRF2 molecules werefurther apart (19 mm95 contour length) than on T270We also examined how far single molecules of TRF1
and TRF2 could slide on the ligated nontelomeric DNA
Table 1 Summary of the diffusion constant a factor and lifetime of Sav-QD (655 nm)-labeled TRF1 and TRF2 on DNA at different ionic
strengths
IonicStrength (mM)
TRF1 TRF2
D (102mm2s) a Factor Lifetime (s) D (102mm2s) a Factor Lifetime (s)
75 75plusmn12 (51) 065plusmn004 (51) ndash 89plusmn09 (59) 094plusmn005 (59) 10plusmn01 (104)125 55plusmn14 (37) 072plusmn005 (37) ndash 84plusmn09 (54) 095plusmn006 (54) 25plusmn01 (106)175 49plusmn10 (40) 072plusmn006 (40) 18plusmn01(63) 95plusmn01 (63) 082plusmn003 (63) 46plusmn01 (107)225 38plusmn12 (33) 089plusmn007(33) 03plusmn001(128) 95plusmn01 (66) 084plusmn004 (66) 34plusmn01 (95)125- TRF2B 91plusmn18 (21) 093plusmn004 (21) ndash
The numbers in the parentheses indicate the total number of complexes analyzed Lifetime was measured for complexes showing both protein bindingand release events within the video frame (Type I Figure 2D) Data are presented as meanplusmnstandard error
Nucleic Acids Research 2013 5
at D H
Hill L
ibrary - Acquis S on N
ovember 27 2013
httpnaroxfordjournalsorgD
ownloaded from
versus ligated T270 DNA (Figure 4 SupplementaryMovies S3 and S4) On T270 DNA TRF1 displayed onemajor population with diffusion ranges centered on038mm (Figure 4D) TRF2 exhibited two distinct popu-lations centered on 05 and 12 mm at 125mM ionicstrength and on 05 and 15 mm at 225mM ionicstrength (Figure 4 and Supplementary Figure S6B) Buton nontelomeric DNA no clear peak was evident (whitebars Figure 4D) Approximately 90 (n=29) of TRF1and 73 (n=30) of TRF2 diffused in a short range(lt850 nm) The diffusion range was invariant across alltime windows (10ndash100 s Supplementary Figure S8)ruling out the possibility that the short range diffusionobserved was due to shorter video lengths Instead thisfinding suggests that once the molecules are within a telo-meric region they tend to remain there We explored thepossibility that short range diffusion was caused bymultiple proteins binding to the same telomeric regionand restricting 1D sliding However at a lower TRF2concentration the short diffusion range did not change(compare Figure 4D and Supplementary Figure S6C)Therefore the two diffusion range populations couldbe assigned to diffusion of TRF proteins over the (TTAGGG)270 telomeric regions (05 mm 90 contourlength) and the nontelomeric spacers (12 mm 90contour length) respectively (Figure 3B) For TRF2 tran-sitions were observed between telomeric and nontelomericregions or even between two adjacent T270 repeats which
were more frequent at 225mM ionic strength (whitearrows Figure 4C) These events provided the peak withdiffusion range centered at 15mm (SupplementaryFigure S6B)
Taken together the regular spacing betweenQD-labeled TRFs demonstrated that TRF1 and TRF2bind specifically to the telomeric regions on both T270and Tel10 DNA substrates These results also showedthat compared with TRF2 TRF1 undergoes a greaternumber of direct binding events from solution to the (TTAGGG)270 region forgoing a 1D search (Figure 4D)
TRF1 and TRF2 exhibit slower dynamics on telomericDNA
To quantify the diffusion constants at the (TTAGGG)270telomeric region we selectively analyzed TRF1 and TRF2on the ligated T270 DNA tightropes with at least three ormore proteinndashQDs in a row spaced at the length ofnontelomeric spacers (15ndash17 mm Figures 3 and 4)TRF1 and TRF2 diffused at 015ndash022 102 mm2s and027ndash029 102 mm2s at the (TTAGGG)270 region re-spectively These rates are 17- to 37- and 30-foldslower for TRF1 and TRF2 respectively comparedwith those on DNA at the same ionic strength(Tables 1 and 2) We noted that in many cases TRFproteins binding to telomere repeats would be confinedto diffuse within this region due to the higher affinity for
Figure 3 TRF1- and TRF2-QDs bind specifically to telomeric sequences on DNA tightropes (A) A representative fluorescence image of DNAtightropes formed using ligated linear T270 DNA containing telomeric sequences (stained with YoYo1) (B) A schematic drawing of the ligated T270DNA substrate (top) and representative fluorescence images of dual color (655 and 565 nm)-labeled TRF1- (middle) and TRF2-QDs (bottom) on theligated T270 DNA substrate (C) Measured distances between two adjacent TRF1- (n=96 top) and TRF2-QDs (bottom n=96) on the ligatedT270 substrate (blue bars) and between TRF2-QDs on the nontelomeric DNA substrate (bottom white bars n=204) The lines in the top andbottom panels are double Gaussian fits to the data which have R2 of 099 and 095 respectively
6 Nucleic Acids Research 2013
at D H
Hill L
ibrary - Acquis S on N
ovember 27 2013
httpnaroxfordjournalsorgD
ownloaded from
telomeric sequences (Figure 4 and Supplementary FigureS8) To ensure that this confinement would not artificiallyreduce the apparent diffusion constant we simulated 1Ddiffusion of proteins on a linear DNA lattice of unlimitedlength versus a 16 kb total length which mimics the (TTAGGG)270 region (Supplementary Text) These simulationsrevealed that confinement within 16 kb DNA does notsignificantly reduce the observed diffusion constant atthe (TTAGGG)270 region (Supplementary Figure S9) Inaddition camera-based time-averaging was not a majorcontributor to the observed slower diffusion constants atthe telomeric region under these experimental conditions(Supplementary Data) An alternative fitting method to
simultaneously determine the diffusion constant andconfined DNA length also provided similar results(Supplementary Data) (55) Furthermore the diffusionconstants of TRF2-QDs (031plusmn0003 102mm2sn=37) on DNA tightropes formed under a 12 slowerflow rate (25 mlmin) are not significantly different fromthose on DNA tightropes stretched at a higher flow rate(300mlmin) (Table 2) Under this condition DNA tight-ropes were under less tension with final extension to only88 of DNA contour length (Supplementary FigureS6D) These results suggest that under these conditionsdiffusion constants of TRF2 do not vary significantly withthe amount of tension on dsDNA tightropes
Figure 4 TRF1 and TRF2 show different diffusional properties over telomeric region versus nontelomeric regions (AndashC) Kymographical analysis ofdual color (655 and 565 nm)-labeled TRF1 (A 125mM ionic strength) and TRF2 (B125 and C225mM ionic strengths) on the ligated T270 DNAThe panel left to the vertical white line shows a schematic drawing of the ligated T270 substrate with telomeric (purple) and nontelomeric sequences(blue) and a fluorescence image of the DNA with proteinndashQDs The horizontal white lines indicate the estimated center of the telomeric region basedon the spacing between adjacent QDs The white arrows in (C) indicate TRF2 diffusing between two adjacent telomeric sequences (D) The diffusionrange distributions of TRF1-(top n=29) and TRF2-QDs (bottom n=28) on the ligated T270 substrate (blue bars) and TRF2-QDs on thenontelomeric DNA (bottom white bars n=77) Diffusion ranges below and beyond 850 nm are categorized into short (telomeric) and long range(nontelomeric) respectively The lines in the top and bottom panels of (D) are single and double Gaussian fits to the data respectively which haveR2 of 090 and 096 respectively
Table 2 Summary of the diffusion constant and lifetime of TRF1- and TRF2-QDs on the ligated T270 DNA substrates
DNA Ionicstrength(mM)
TRF1 TRF2
Telomeric Nontelomeric Telomeric Nontelomeric
D 102mm2s Lifetime (s) D 102mm2s Lifetime (s) D 102mm2s Lifetime (s) D 102mm2s Lifetime (s)
Tel270 125 015plusmn002 (22) 173plusmn02 (15) 10plusmn02 (8) 59plusmn02 (6) 027plusmn004 (22) 148plusmn02 (105) 30plusmn05 (8) 44plusmn01 (53)Tel270 225 022plusmn004 (21) 92plusmn02 (9) 18plusmn07 (5) 57plusmn03 (2) 029plusmn004 (34) 103plusmn06 (115) 99plusmn30 (7) 38plusmn03 (41)Tel10 125 ndash 67plusmn04 (50) ndash 33plusmn02 (51)
Proteins were labeled with equal molar amount of red (655 nm) and green (565 nm) QDs The numbers in the parentheses indicate the total numberof complexes analyzed Lifetime was measured for complexes showing both protein binding and release events within the video frame (Type IFigure 2D) Data are presented as meanplusmnstandard error
Nucleic Acids Research 2013 7
at D H
Hill L
ibrary - Acquis S on N
ovember 27 2013
httpnaroxfordjournalsorgD
ownloaded from
We observed that TRF1 and TRF2 can directly dissoci-ate from telomeric regions or through nontelomericregions (Supplementary Figure S10) Overall we foundthat the relative proportions of Type I (protein bindsand releases) and Type IV (protein is bound from thebeginning to end of the movie) proteinndashDNA interactionsobserved during the experimental time course dependedon the DNA substrate (Supplementary Table S1) ForTRF1 on T270 DNA the vast majority of moleculeswere Type IV indicating a considerably longer attach-ment Consistent with this result the average lifetime ofType I TRF1 bound to the telomeric sequences on T270DNA was 31-fold longer than that for DNA (92 sversus 03 s 225mM ionic strength Tables 1 and 2)TRF2 behaved quite differently showing a lesspronounced difference between the proportions of TypeI and Type IV complexes on DNA and T270 DNAFurthermore the attached lifetimes for Type I TRF2complexes was only 3-fold longer at the telomericregions on T270 DNA compared with DNA (103 sversus 34 s Tables 1 and 2) It is worth noting that thelifetimes of TRF proteins on DNA are longer than the QDblinking rate (56) ruling out artifacts from QD blinkingin the lifetime measurement In summary compared withbinding to nontelomeric DNA both TRF1 and TRF2possess distinctly slower detachment and diffusionaldynamics on the telomeric DNA
The basic domain is essential for the 1D search by TRF2
The basic domain at the N-terminus of TRF2 permits itsbinding to model replication forks and four-way junctionsindependent of telomere sequences (57) In addition theabsence of this domain leads to a diminished ability ofTRF2 to localize to model telomere ends and to facilitateT-loop formation (57) We created and imaged a basicdomain deletion mutant of TRF2 (TRF2B) on DNAand the ligated T270 (Supplementary Figure S11)Compared with full-length TRF2 TRF2B-QDs havehigher specificity for the telomeric sequences on T270DNA substrate and lower affinity to DNA ends (compareSupplementary Figures S11A and S3B) Furthermorerelative to the full-length TRF2 the fraction of motileproteinndashDNA complexes decreased by 15-fold forTRF2B (Supplementary Figure S11 legend)Interestingly the diffusion constant (91plusmn18102 mm2s) and a-factor (093plusmn004) of TRF2B on DNA were not significantly different from those of full-length TRF2 (Table 1) However the percentage ofcomplexes undergoing long-range diffusion (10 at125mM ionic strength) was significantly lower (P=001)than for full-length protein (27) at the same ionicstrength (Supplementary Figure S11D) On T270 DNAmajority of motile TRF2B (90) was found with adiffusing range consistent with length of the telomericregion on T270 DNA suggesting that TRF2B directlyassociates with telomeric DNA from solution and not bydiffusion from a nontelomeric region Since the frequencyof TRF2B DNA binding was lower than the full-lengthprotein (11 versus 38 moleculesbead pair) it was notpossible to restrict the analysis to those tightropes with
three adjacent bound molecules Therefore we treated allshort range diffusion (lt850 nm) by TRF2B on theligated T270 as diffusion over the telomeric region Thedynamics of TRF2B over the (TTAGGG)270 regionwere similar to those of full-length TRF2 with a similardiffusion range (047plusmn003 mm Supplementary FigureS11D) and diffusion constant (027plusmn001 102 mm2sat 125mM and 026plusmn001 102mm2s at 225mM)These observations suggest that the basic domain ofTRF2 normally facilitates its 1D search on nontelomericDNA The reduced degree of TRF2 localization to thetelomeric region due to deletion of the basic domain dem-onstrates the importance of 1D diffusion in the TRF2 telo-meric target site search (Supplementary Figure S11)
DISCUSSION
TRF1 and TRF2 are the only scaffolding shelterinproteins that bind directly to duplex telomeric DNAThe results presented here from single-molecule imagingof TRF1 and TRF2 dynamics on telomeric and nontelo-meric DNA provide for the first time a fundamentalunderstanding of the mechanisms that drive the dynamicsof shelterin assemblydisassembly at telomeres
TRF2 performs 1D searching more effectively than TRF1to find telomeric sequences
Rotational tracking along DNA during which a proteinfollows a helical track along the DNA to maintain optimalcontact has been inferred for several DNA-bindingproteins (58) The measured diffusion constants forTRF1 and TRF2 obtained using the DNA tightropeassay were consistent with rotational tracking of theDNA helix (Table 1 and Supplementary Text) althoughslightly higher than the predicted upper limit for thismotion (21 102 mm2s Supplementary Text) This dis-crepancy could be due to the flexible linkage mediated bythe His-tag and BTtris-NTA between TRF proteins andQDs (59) The measured diffusion constants togetherwith the lack of observed barrier bypass events in dualcolor experiments (Supplementary Figure S5)demonstrated that both TRF1 and TRF2 track theDNA helix to maintain optimum contact between theirDNA-binding surfaces and the DNA (Figure 5A)However the attached lifetime of Type I TRF1 at thenontelomeric region was 10-fold shorter than that ofTRF2 (03 s versus 34 s at 225mM Table 1) Theseresults are consistent with a significantly lower percentof TRF1 molecules exhibiting long range diffusioncompared with TRF2 (Figure 4) This differencebetween TRF1 and TRF2 is partly due to the sequencesat the N-termini of TRF proteins (Figure 1A) For TRF2this region contains a basic domain the deletion of which(TRF2B) led to a clear reduction in the percentage ofmotile protein complexes on DNA Importantly it wasobserved that 90 of TRF2B molecules underwentshort-range diffusion consistent with the length of thetelomeric regions (Supplementary Figure S11) Thisresult suggests that the majority of the TRF2B mol-ecules found the telomeric region directly from solution
8 Nucleic Acids Research 2013
at D H
Hill L
ibrary - Acquis S on N
ovember 27 2013
httpnaroxfordjournalsorgD
ownloaded from
forgoing the 1D component of the search (Figure 5A)These results support the notion that domain B facilitatesthe association of TRF2 to nonspecific DNA and thisresults in sliding subsequently However the diffusionconstant and a factor of TRF2B were not significantlydifferent from the full-length protein (Table 1) We specu-late that TRF2B containing the Myb-type domain hasweak DNA-binding affinity for nontelomeric DNA Onnontelomeric DNA the DNA-binding energy land-scapes are similar for full-length TRF2 and TRF2Bleading to similar diffusion constants However it isunclear whether in full-length TRF2 nonspecific DNAbinding is solely dependent of domain B or combinationof this domain and the Myb domain TRF1 behaved simi-larly to TRF2B perhaps as a consequence of alsolacking the basic domain Therefore unlike TRF1TRF2 can bind to nontelomeric sequences and use a 1Dsearch to more efficiently locate telomeric DNA
Comparing the 1D diffusion of TRF1 and TRF2 onnontelomeric and telomeric DNA
We found that in general TRF2 slides faster than TRF1at nontelomeric sequences (Supplementary Figure S4Band Table 1) The diffusive exponent was lt1 only forTRF1 at lower ionic strengths consistent with subdiffu-sive motion or pausing during diffusion (SupplementaryFigure S4C and Table 1) Together these observationsindicate that TRF2rsquos diffusion is consistent with thecanonical description of sliding However TRF1rsquos
behavior changed with salt in a manner that was incon-sistent with a solely electrostatic-mediated proteinndashDNAinteraction (60) and suggesting a possible conformationalrearrangement induced by salt at the DNA-bindinginterface This rearrangement could lead to obstacles todiffusion andor traps within the binding energy landscapeor escape time (53)The Myb type DNA-binding domain of TRF2 has a
4-fold weaker DNA-binding affinity than the Mybdomain in TRF1 (equilibrium dissociation constants Kd750 versus 200 nM respectively) (61) The diffusionconstant of TRF1 was 2-fold slower than that ofTRF2 within telomeric repeats (125mM ionic strengthTable 2) This result is equivalent to 06 kBT increasein the roughness of the DNA-binding landscape or 2-fold change in affinity While these results are consistentwith the stronger binding to the telomeric sequences byTRF1 Myb domain other domains on TRF proteinscould also indirectly influence the DNA-bindingdynamics of these two proteins over the telomericregions Furthermore the difference in the dynamics ofthe TRF proteins between telomeric DNA and nontelo-meric DNA is due to inherent sequence effects and there-fore likely represents the situation in vivo This is furthersupported by the ionic conditions used in our experimentswhich were chosen to represent those encountered in vivo(Supplementary Text)
TRF1 and TRF2 strike a balance between search andspecificity
TRF proteins face a unique challenge They must findboth their cognate sites and protein partners to form theshelterin complex and to regulate the functions of amyriad of proteins involved in telomere maintenanceand cell-cycle progression (26) For example TRF1 andTRF2 both bind to TIN2 to form a ternary complex ofTRF1 TRF2 and TIN2 (2728) Importantly TRF2 isa protein hub interacting with several DNA-bindingproteins that play important roles in DNA repair includ-ing WRN Ku70-Ku80 and ERCC1-XPF (26396263)This requires that TRF proteins retain specificity fortheir DNA target site but also the ability to slide withinthe telomeric regions to encounter protein partners toform protein complexesThe binding energy of a protein along DNA contains a
series of local energy minima separated by energy barriersProtein sliding on DNA has been modeled as a particlediffusing along a rough potential energy landscape Theroughness of the landscape reduces the diffusion constantfrom the theoretical maximum determined by solution vis-cosity We found that the diffusion of TRF1 and TRF2was 17- to 37-fold slower at telomeric regions comparedwith nontelomeric DNA corresponding to 28ndash36kBT increase in the roughness of the energy landscape(Supplementary Text and Figure 5B) Also the TRF1and TRF2 attached lifetimes within telomeric sequenceswere 31- and 3-fold longer respectively comparedwith those on DNA (225mM ionic strength Table 2)These differences correspond to an increase of 34 kBT(for TRF1) and 11kBT (for TRF2) in relative binding
Figure 5 TRF1 and TRF2 strike a balance between target search andspecificity (A) TRF1 and TRF2 can undertake a 1D search on DNAconsistent with rotation-coupled diffusion along the DNA helix Thesmall ovals represent the basic and acidic domains of TRF1 and TRF2The blue and purple lines represent nontelomeric and telomeric DNArespectively TRF1 relies more on 3D search and majority of theTRF2B molecules bind to the telomeric region directly fromsolution forgoing the 1D component of the search (B) The energylandscape along the positions at telomeric and nontelomeric sequencesThe diffusion constant and lifetime measurements are consistent with28ndash36 kBT higher energy barriers to diffusion at the telomericsequences in comparison with nontelomeric sequences (Tables 1 and2) The additional energy barrier at the nontelomeric and telomericjunction represents the activation energy needed for conformationalchangeDNA-binding domain switching on proteins to achievespecific binding
Nucleic Acids Research 2013 9
at D H
Hill L
ibrary - Acquis S on N
ovember 27 2013
httpnaroxfordjournalsorgD
ownloaded from
energy at the telomeric regions (Supplementary Data)Taken together the relative activation energy barriersbased on the diffusion constants and lifetimes are notonly consistent with each other but also close to theestimated minimal roughness of the energy landscape atspecific binding sites (66 kBT) for a genome size of3 109bp (Supplementary Data) (35)Interestingly the percentage of TRF2 arriving at the (TT
AGGG)270 region (73 125mM Figure 4D) was lowerthan the simulated equivalent situation assuming TRF2first binds to the nontelomeric spacer (98 n=500)This discrepancy is consistent with an additional activationenergy barrier between telomeric and nontelomericregions likely due to a switch within TRF2 from a non-specific binding mode to a specific recognition mode(Figure 5B) (64) Noticeably for TRF2 this energybarrier was lower at 225mM ionic strength than at125mM since more proteins arrived at telomeric regionsfrom the nontelomeric spacers (Figure 4D and Supple-mentary Figure S6B) consistent with the desolvation ofelectrostatic residues required for DNA bindingIn contrast to the metastable and dynamic nature of the
TRF protein binding to telomeric sequences (Figure 5)other systems characterized by single-molecule imagingshow long-lived stable binding to specific sequences Forexample the mismatch repair protein MutSa binds to amismatch (+ADP) with a half-life of 96plusmn15min (36)and the average lifetime of the Type III restriction enzymeEcoP15I on DNA with specific binding sites was 180 s(38) The primary differences between these systems arethe target DNA sites For TRF proteins the target is along repetitive sequence whereas for other systems targetsites consist of much shorter nonrepetitive DNA Wepropose that TRF proteins utilize the combined freeenergy of binding from the association of multiple TRFproteins in the same region to increase binding specificityand stability For example TRF1 and TRF2 linked byTIN2 would increase the total affinity for telomericsequences by summing the interaction energies of TRF1and TRF2 We postulate that in vivo the diffusionalproperties of TRF proteins at the telomeric regionsenable these proteins to search for their protein partnerssuch as another TRFndashTIN2 complex to assemble stableshelterin complexes on telomeric substrates In thisputative model of partner search we expect that longdistance searching is unlikely due to DNA-bound obs-tacles such as nucleosomes and other DNA-bindingproteins Rather 1D diffusion represents a relativelylocal search mechanism which increases the probabilityof partner encounter during the attached period In cellsthe intrinsic dynamics of TRF1 and TRF2 could poten-tially be important for regulating the assembly and disas-sembly of shelterin complexes and switching betweendifferent telomere structures (capped and uncappedstates)In summary using QD-conjugated proteins DNA
tightropes embedded with site-specific sequences AFMand fluorescence imaging we reveal that TRF1 andTRF2 use different mechanisms to find telomeric DNAbut share a novel mechanism to search for proteinpartners at telomeres Based on these results we postulate
a general mechanism for how multiprotein complexesstrike a balance between achieving specificity and targetsearch in a process we define as lsquotag-team proofreadingrsquoIn this model proteins first form weak transientcomplexes with their cognate DNA sequences and thenrely on the additive energies of binding provided bypartner proteins to generate higher specificity
SUPPLEMENTARY DATA
Supplementary Data are available at NAR Onlineincluding [65ndash73]
ACKNOWLEDGEMENTS
The authors would like to thank R Keller and MNazareth at the University of Essex Y Jin at theZhejiang University Drs K Weninger R Riehn SFLim K Daniels at the North Carolina State Universityand D Erie at the University of North Carolina at ChapelHill for providing critical comments and technicalsupport
FUNDING
The BBSRC [BBI0034601 to NMK] NationalInstitutes of Health [ES0515052 to PLO and4R00ES016758 to HW] Funding for open accesscharges National Institutes of Health [4R00ES016758]
Conflict of interest statement None declared
REFERENCES
1 CechTR (2004) Beginning to understand the end of thechromosome Cell 116 273ndash279
2 PalmW and de LangeT (2008) How shelterin protectsmammalian telomeres Annu Rev Genet 42 301ndash334
3 drsquoAdda di FagagnaF ReaperPM Clay-FarraceL FieglerHCarrP Von ZglinickiT SaretzkiG CarterNP andJacksonSP (2003) A DNA damage checkpoint response intelomere-initiated senescence Nature 426 194ndash198
4 SahinE and DePinhoRA (2012) Axis of ageing telomeres p53and mitochondria Nature reviews Mol Cell Biol 13 397ndash404
5 ArmaniosM and BlackburnEH (2012) The telomeresyndromes Nat Rev Genet 13 693ndash704
6 WrightWE TesmerVM HuffmanKE LeveneSD andShayJW (1997) Normal human chromosomes have long G-richtelomeric overhangs at one end Genes Dev 11 2801ndash2809
7 BlackburnEH (2005) Telomeres and telomerase theirmechanisms of action and the effects of altering their functionsFEBS Lett 579 859ndash862
8 NandakumarJ and CechTR (2013) Finding the endrecruitment of telomerase to telomeres Nat Rev Mol Cell Biol14 69ndash82
9 HengesbachM AkiyamaBM and StoneMD (2011)Single-molecule analysis of telomerase structure and functionCurr Opin Chem Biol 15 845ndash852
10 VerdunRE and KarlsederJ (2007) Replication and protectionof telomeres Nature 447 924ndash931
11 SfeirA and de LangeT (2012) Removal of shelterin reveals thetelomere end-protection problem Science 336 593ndash597
12 CourtR ChapmanL FairallL and RhodesD (2005) How thehuman telomeric proteins TRF1 and TRF2 recognize telomericDNA a view from high-resolution crystal structures EMBORep 6 39ndash45
10 Nucleic Acids Research 2013
at D H
Hill L
ibrary - Acquis S on N
ovember 27 2013
httpnaroxfordjournalsorgD
ownloaded from
13 WalkerJR and ZhuXD (2012) Post-translational modificationsof TRF1 and TRF2 and their roles in telomere maintenanceMech Ageing Dev 133 421ndash434
14 SfeirA KosiyatrakulST HockemeyerD MacRaeSLKarlsederJ SchildkrautCL and de LangeT (2009) Mammaliantelomeres resemble fragile sites and require TRF1 for efficientreplication Cell 138 90ndash103
15 SmogorzewskaA van SteenselB BianchiA OelmannSSchaeferMR SchnappG and de LangeT (2000) Control ofhuman telomere length by TRF1 and TRF2 Mol Cell Biol 201659ndash1668
16 van SteenselB SmogorzewskaA and de LangeT (1998) TRF2protects human telomeres from end-to-end fusions Cell 92401ndash413
17 KarlsederJ BroccoliD DaiY HardyS and de LangeT(1999) p53- and ATM-dependent apoptosis induced by telomereslacking TRF2 Science 283 1321ndash1325
18 BianchiA StanselRM FairallL GriffithJD RhodesD andde LangeT (1999) TRF1 binds a bipartite telomeric site withextreme spatial flexibility EMBO J 18 5735ndash5744
19 GriffithJ BianchiA and de LangeT (1998) TRF1 promotesparallel pairing of telomeric tracts in vitro J Mol Biol 27879ndash88
20 GriffithJD ComeauL RosenfieldS StanselRM BianchiAMossH and de LangeT (1999) Mammalian telomeres end in alarge duplex loop Cell 97 503ndash514
21 PouletA PisanoS Faivre-MoskalenkoC PeiB TauranYHaftek-TerreauZ BrunetF Le BihanYV LeduMHMontelF et al (2012) The N-terminal domains of TRF1 andTRF2 regulate their ability to condense telomeric DNANucleic Acids Res 40 2566ndash2576
22 MatternKA SwiggersSJ NiggAL LowenbergBHoutsmullerAB and ZijlmansJM (2004) Dynamics of proteinbinding to telomeres in living cells implications for telomerestructure and function Mol Cell Biol 24 5587ndash5594
23 SimonetT ZaragosiLE PhilippeC LebrigandKSchoutedenC AugereauA BauwensS YeJ SantagostinoMGiulottoE et al (2011) The human TTAGGG repeat factors 1and 2 bind to a subset of interstitial telomeric sequences andsatellite repeats Cell Res 21 1028ndash1038
24 YangD XiongY KimH HeQ LiY ChenR andSongyangZ (2011) Human telomeric proteins occupy selectiveinterstitial sites Cell Res 21 1013ndash1027
25 BoscoN and de LangeT (2012) A TRF1-controlled commonfragile site containing interstitial telomeric sequencesChromosoma 121 465ndash474
26 de LangeT (2010) Telomere biology and DNA repair enemieswith benefits FEBS Lett 584 3673ndash3674
27 HoughtalingBR CuttonaroL ChangW and SmithS (2004)A dynamic molecular link between the telomere length regulatorTRF1 and the chromosome end protector TRF2 Curr Biol 141621ndash1631
28 YeJZ DonigianJR van OverbeekM LoayzaD LuoYKrutchinskyAN ChaitBT and de LangeT (2004) TIN2 bindsTRF1 and TRF2 simultaneously and stabilizes the TRF2 complexon telomeres J Biol Chem 279 47264ndash47271
29 BergOG WinterRB and von HippelPH (1981) Diffusion-driven mechanisms of protein translocation on nucleic acids 1Models and theory Biochemistry 20 6929ndash6948
30 von HippelPH and BergOG (1989) Facilitated target locationin biological systems J Biol Chem 264 675ndash678
31 GormanJ and GreeneEC (2008) Visualizing one-dimensionaldiffusion of proteins along DNA Nat Struct Mol Biol 15768ndash774
32 TafviziA MirnyLA and van OijenAM (2011) Dancing onDNA kinetic aspects of search processes on DNAChemphyschem 12 1481ndash1489
33 KadNM WangH KennedyGG WarshawDM and VanHoutenB (2010) Collaborative dynamic DNA scanning bynucleotide excision repair proteins investigated by single- moleculeimaging of quantum-dot-labeled proteins Mol Cell 37 702ndash713
34 KadNM and Van HoutenB (2012) Dynamics of lesionprocessing by bacterial nucleotide excision repair proteinsProg Mol Biol Transl Sci 110 1ndash24
35 SlutskyM and MirnyLA (2004) Kinetics of protein-DNAinteraction facilitated target location in sequence-dependentpotential Biophys J 87 4021ndash4035
36 GormanJ WangF ReddingS PlysAJ FazioT WindSAlaniEE and GreeneEC (2012) Single-molecule imagingreveals target-search mechanisms during DNA mismatch repairProc Natl Acad Sci USA 109 E3074ndashE3083
37 LeithJS TafviziA HuangF UspalWE DoylePSFershtAR MirnyLA and van OijenAM (2012) Sequence-dependent sliding kinetics of p53 Proc Natl Acad Sci USA109 16552ndash16557
38 SchwarzFW TothJ van AelstK CuiG ClausingSSzczelkunMD and SeidelR (2013) The helicase-like domains oftype III restriction enzymes trigger long-range diffusion alongDNA Science 340 353ndash356
39 OpreskoPL von KobbeC LaineJP HarriganJ HicksonIDand BohrVA (2002) Telomere-binding protein TRF2 binds toand stimulates the Werner and Bloom syndrome helicases J BiolChem 277 41110ndash41119
40 NoraGJ BuncherNA and OpreskoPL (2010) Telomericprotein TRF2 protects Holliday junctions with telomeric armsfrom displacement by the Werner syndrome helicase NucleicAcids Res 38 3984ndash3998
41 HanishJP YanowitzJL and de LangeT (1994) Stringentsequence requirements for the formation of human telomeresProc Natl Acad Sci USA 91 8861ndash8865
42 DamerlaRR KnickelbeinKE KepchiaD JacksonAArmitageBA EckertKA and OpreskoPL (2010) Telomericrepeat mutagenicity in human somatic cells is modulated byrepeat orientation and G-quadruplex stability DNA Repair(Amst) 9 1119ndash1129
43 LataS ReichelA BrockR TampeR and PiehlerJ (2005)High-affinity adaptors for switchable recognition of histidine-tagged proteins J Am Chem Soc 127 10205ndash10215
44 ReichelA SchaibleD Al FuroukhN CohenM SchreiberGand PiehlerJ (2007) Noncovalent site-specific biotinylationof histidine-tagged proteins Anal Chem 79 8590ndash8600
45 KochaniakAB HabuchiS LoparoJJ ChangDJCimprichKA WalterJC and van OijenAM (2009)Proliferating cell nuclear antigen uses two distinct modes to movealong DNA J Biol Chem 284 17700ndash17710
46 ArnspangEC BrewerJR and LagerholmBC (2012)Multi-color single particle tracking with quantum dots PloS One7 e48521
47 DunnAR KadNM NelsonSR WarshawDM andWallaceSS (2011) Single Qdot-labeled glycosylase molecules usea wedge amino acid to probe for lesions while scanning alongDNA Nucleic Acids Res 39 7487ndash7498
48 HughesCD WangH GhodkeH SimonsM TowheedAPengY Van HoutenB and KadNM (2013) Real-timesingle-molecule imaging reveals a direct interaction betweenUvrC and UvrB on DNA tightropes Nucleic Acids Res 414901ndash4912
49 WangH TessmerI CroteauDL ErieDA and Van HoutenB(2008) Functional characterization and atomic force microscopyof a DNA repair protein conjugated to a quantum dot NanoLett 8 1631ndash1637
50 TessmerI KaurP LinJ and WangH (2013) Investigatingbioconjugation by atomic force microscopy J Nanobiotechnol11 25
51 Komazin-MeredithG MirchevR GolanDE van OijenAMand CoenDM (2008) Hopping of a processivity factor on DNArevealed by single-molecule assays of diffusion Proc Natl AcadSci USA 105 10721ndash10726
52 GormanJ PlysAJ VisnapuuML AlaniE and GreeneEC(2010) Visualizing one-dimensional diffusion of eukaryotic DNArepair factors along a chromatin lattice Nat Struct Mol Biol17 932ndash938
53 SaxtonMJ and JacobsonK (1997) Single-particle trackingapplications to membrane dynamics Annu Rev Biophys BiomolStruct 26 373ndash399
54 HalfordSE and MarkoJF (2004) How do site-specificDNA-binding proteins find their targets Nucleic Acids Res 323040ndash3052
Nucleic Acids Research 2013 11
at D H
Hill L
ibrary - Acquis S on N
ovember 27 2013
httpnaroxfordjournalsorgD
ownloaded from
55 KusumiA SakoY and YamamotoM (1993) Confined lateraldiffusion of membrane receptors as studied by single particletracking (nanovid microscopy) Effects of calcium-induceddifferentiation in cultured epithelial cells Biophys J 652021ndash2040
56 NirmalM DabbousiBO BawendiMG MacklinJJTrautmanJK HarrisTD and brusLE (1996) Fluorescenceintermittency in single cadmium selenide nanocrystals Nature383 802ndash804
57 FoucheN CesareAJ WillcoxS OzgurS ComptonSA andGriffithJD (2006) The basic domain of TRF2 directs binding toDNA junctions irrespective of the presence of TTAGGG repeatsJ Biol Chem 281 37486ndash37495
58 BlaineyPC LuoG KouSC MangelWF VerdineGLBagchiB and XieXS (2009) Nonspecifically bound proteins spinwhile diffusing along DNA Nat Struct Mol Biol 16 1224ndash1229
59 BonnetI and DesbiollesP (2011) The diffusion constant of alabeled protein sliding along DNA Eur Phys J E Soft Matter34 1ndash10
60 WinterRB BergOG and von HippelPH (1981) Diffusion-driven mechanisms of protein translocation on nucleic acids 3The Escherichia coli lac repressorndashoperator interaction kineticmeasurements and conclusions Biochemistry 20 6961ndash6977
61 HanaokaS NagadoiA and NishimuraY (2005) Comparisonbetween TRF2 and TRF1 of their telomeric DNA-boundstructures and DNA-binding activities Protein Sci 14 119ndash130
62 ZhuXD NiedernhoferL KusterB MannMHoeijmakersJH and de LangeT (2003) ERCC1XPF removesthe 30 overhang from uncapped telomeres and represses formationof telomeric DNA-containing double minute chromosomesMol Cell 12 1489ndash1498
63 KimH LeeOH XinH ChenLY QinJ ChaeHKLinSY SafariA LiuD and SongyangZ (2009) TRF2
functions as a protein hub and regulates telomere maintenanceby recognizing specific peptide motifs Nat Struct Mol Biol 16372ndash379
64 MarcovitzA and LevyY (2011) Frustration in protein-DNAbinding influences conformational switching and target searchkinetics Proc Natl Acad Sci USA 108 17957ndash17962
65 TakaiKK HooperS BlackwoodS GandhiR andde LangeT (2010) In vivo stoichiometry of shelterin componentsJ Biol Chem 285 1457ndash1467
66 ThompsonRE LarsonDR and WebbWW (2002) Precisenanometer localization analysis for individual fluorescent probesBiophys J 82 2775ndash2783
67 FairallL ChapmanL MossH de LangeT and RhodesD(2001) Structure of the TRFH dimerization domain of the humantelomeric proteins TRF1 and TRF2 Mol Cell 8 351ndash361
68 SchurrJM (1979) The one-dimensional diffusion coefficient ofproteins absorbed on DNA Hydrodynamic considerationsBiophys Chem 9 413ndash414
69 HughesBD (1995) Random Walks Vol 1 Oxford UniversityPress USA
70 DietrichC YangB FujiwaraT KusumiA and JacobsonK(2002) Relationship of lipid rafts to transient confinement zonesdetected by single particle tracking Biophys J 82 274ndash284
71 SaxtonMJ (1995) Single-particle tracking effects of corralsBiophys J 69 389ndash398
72 DestainvilleN and SalomeL (2006) Quantification andcorrection of systematic errors due to detector time-averagingin single-molecule tracking experiments Biophys J 90L17ndashL19
73 MeilhacN Le GuyaderL SalomeL and DestainvilleN (2006)Detection of confinement and jumps in single-moleculemembrane trajectories Phys Rev E Stat Nonlin Soft MatterPhys 73 011915
12 Nucleic Acids Research 2013
at D H
Hill L
ibrary - Acquis S on N
ovember 27 2013
httpnaroxfordjournalsorgD
ownloaded from
SUPPLEMENTARY INFORMATION
For manuscript
TRF1 and TRF2 use different mechanisms to find telomeric DNA but share a novel mechanism to search for protein partners at telomeres
Jiangguo Lin1 Preston Countryman1 Noah Buncher2 Parminder Kaur1 Longjiang E3 Yiyun Zhang4 Greg Gibson5 Changjiang You6 Simon C Watkins5 Jacob Piehler6 Patricia L Opresko2 Neil M Kad7 Hong Wang1
1Physics Department 4Industry and System Engineering North Carolina State University Raleigh North Carolina NC 27695 USA 2Department of Environmental and Occupational Health 5Center for Biologic Imaging University of Pittsburgh Graduate School of Public Health Pittsburgh Pennsylvania 15219 USA 3Electric and Computer Engineering University of North Carolina at Charlotte Charlotte North Carolina 28223 USA 6 Division of Biophysics Universitaumlt Osnabruumlck Barbarstrasse 11 49076 Osnabruumlck
Germany
This supplementary information contains
Supplementary Text Supplementary Legends for Movies S1ndash5 Supplementary References Supplementary Table S1 Supplementary Figures S1ndash11
SUPPLEMENTARY TEXT Comparison between in vivo and in vitro conditions Previously HeLa cell lines (volume ~ 2000 μm3) examined by Takai et al contained approximately 04 to 1 x 10⁵ molecules of TRF1 and TRF2 proteins per cell corresponding to ~32 to 83 nM concentrations inside cells (65) However given non-telomeric roles of TRF1 and TRF2 the numbers of TRF1 and TRF2 binding to the telomeric region are uncertain The final concentrations of TRF proteins in our flow cells is 33 nM which is at the upper limit of the concentration that we can use without generating too much background signal The physiological ionic strength is between 100 to 200 mM KCl or NaCl In this study we used total ionic strengths at 75 mM (with 25 mM NaCl) to 225 mM (with 100 mM NaCl) for investigating the dynamics of TRF proteins on telomeric and non-telomeric DNA Single-particle tracking The resolution of tracking of proteins on DNA was determined to be 16 nm using the data from static TRF2-QDs binding to the (TTAGGG)10 regions on ligated Tel10 DNA tightropes (Supplementary Figure S7) based on the following equation (66)
2
2322
412aNbs
N
as πσ ++
= Equation 1
where N a b and s are the numbers of photons the effective pixel size (110 nm) standard deviation of the background signal and the standard deviation of 2D Gaussian fit respectively The mean square displacement (MSD) as a function of time interval is given by Equation 2 where N is the total number of frames in the trajectory n is the number of frames for different time intervals ∆t is the time between frames and xi and yi
are the positions of the protein-QD in the frame i The 1-D diffusion constant (D) and diffusion exponent (α factor) were analyzed by a custom routine developed in LabView Software based on the following equation (53) 119872119878119863 = 2119863119905120572 Equation 3
TRF2 binding at (TTAGGG)10 sequence on the ligated Tel10 DNA substrate displayed an apparent diffusion constant of 25 (plusmn005) times10-4 μm2s (n = 10) This provides a baseline for the characterization of static complexes on DNA A protein was categorized as being motile if the diffusion constant is greater than 5 times10-4 μm2s and R2 value from data fitting using Equation 3 is greater than 08
[ ]summinus
=++ minus+minus
minus=∆
nN
iiniini yyxx
nNtnMSD
1
22 )()(1)(
For confined diffusion at the telomere sequences an alternative equation was used to fit the MSD vs ∆t to determine the diffusion constant and confined length (55)
lang1199092rang(119905) = 1198711199092
6minus 161198711199092
1205874sum 1
1198994119890119909119901 minus 1
2 (119899120587120590119909
119871119909)2119905infin
119899=1(119900119889119889) Equation 4
where Lx is the confined length and σ = 2D Data fitting using this model provides similar diffusion constants of 022 (plusmn005) times10-2 microm2s and 037 (plusmn005) times10-2 microm2s for TRF1- and TRF2-QDs respectively (combined 125 and 225 mM ionic strength data) This data fitting scheme also provides confined DNA lengths of 061 (plusmn009) and 04 (plusmn009) μm for TRF2 and TRF1 respectively The lifetime of protein attachment on DNA was determined by the length of the streak in the kymographic analysis Only streaks that began and ended in a movie (Type I Figure 2D) were analyzed which may lead to a small systematic underestimation of the attached lifetime The lifetime data were plotted as cumulative frequency (CF) histograms and fitted to
119862119865 = 119873(1 minus 119890minus119896119905)(1 minus 119890minus119896119905119898119886119909) Equation 5
where N is the number of observed points t the bin tmax the maximum bin size and k the reciprocal of the dwell time
Due to the brightness variation of QDs we were not be able to directly correlate the QD brightness and number of protein molecules on DNA
Prediction of diffusion constants and stepping rates based on Stokes-Einstein relation The hydrodynamic radii of red (655 nm) and green Sav-QDs (565 nm) are assumed to be 115 and 95 nm respectively based on recent measurements (46) The estimated radii of free TRF1 and TRF2 are 10 nm based on the crystal structures of the Myb type and dimerization domains (1267) The expected upper limit for diffusion constants for a single red QD labeled TRF1 or TRF2 sliding on DNA is 178 microm2s This is 187- to 468- fold higher than the measured diffusion constants for TRF proteins (between 38 times10-2 and 95 times10-2 microm2s Table 1) Assuming protein rotating around DNA helix the expected upper limits for diffusion constants are based on the modified version of the Stokes-Einstein relation (68)
1198631119888119886119897 = 119870119861 119879
61205871205781198861+43(2120587)2 11988634times10minus92 Equation 6
where η is viscosity of the medium 119886 the radius of the particle 119870119861 the Boltzmann constant T the temperature The stepping rate can be calculated by assuming the diffusion constant to occur as a series of steps of a single base pair using the following relationship (69)
119896 = 2119863(119897119887119901)2 Equation 7
where 119896 is the stepping rate Stepss
The expected upper limits for diffusion constants and stepping rates for TRF proteins (with one red QD) with rotation-coupled diffusion are 0021 μm2s and 365492 stepss respectively These numbers correspond to a diffusion rate of 042 μm2s and a stepping rate of 7315292 stepss without QDs Prediction of additional energy barriers at telomeric sequences The estimated minimal roughness of the energy landscape at specific binding sites is (35) σ = 119896 BT = 66 119896 BT Equation 8 for a genome size of M = 3 x 10⁹ bp The activation energy barriers (EA) to protein diffusion can be calculated from stepping rates using Arrhenius relationship
119896 = 119890minus119864119860 119896119861119879 Equation 9 119864119860 = minusln (119896) ∙ 119896119861119879 where 119896 is the stepping rate Stepss Then the additional energy barrier at the telomeric region compared with the non-telomeric region can be calculated as
119864119860119905119890119897 minus 119864119860119899119900119899119905119890119897 = minusln ( 119896119905119890119897119896119899119900119899119905119890119897
) ∙ 119896119861119879 Equation 10 In addition the relative free binding energy at the telomeric regions with respect to non-telomeric regions can be defined as
120549120549119866119887119894119899119889 = 119896119861119879119897119899 119870119905119890119897
119870119899119900119899119905119890119897 Equation 11
where 119870119905119890119897 and 119870119899119900119899119905119890119897 are equilibrium association constants at the telomeric and non-telomeric regions respectively Assuming the association constants are the same at the telomeric and non-telomeric regions Equation 11 can be expressed in terms of lifetimes of a protein on DNA (τ)
120549120549119866119887119894119899119889 = 119896119861119879119897119899 120591119905119890119897
120591119899119900119899119905119890119897 Equation 12
where τtel and τnontel are the lifetimes of a protein at the telomeric and non-telomeric
regions respectively Computer simulations of 1-D diffusion Computer simulations of 1-D diffusion of proteins were carried out using PythonTM
programming language 330 (Supplementary Figure S9) Nonspecific λ DNA was represented by a 1-D lattice without confinement Since TRF2 and TRF1 have higher affinity for the telomeric sequences we used 16 kb DNA with totally reflecting diffusion barriers at two ends to simulate TRF2 over the 16 kb (TTAGGG)270 telomeric sequence flanked by non-telomeric sequences In our simulations we treated the telomeric region as a transient confinement zone a concept developed for studying lipid rafts (70) The 1-D random walker starts at random locations inside the confined zone To approximate
Mln2
the positional averaging from the camera integration time required for imaging the simulated position was averaged for each 50 ms period
Accuracy of determining diffusion constant (D) and confinement length (L) values with camera time averaging
Camera time averaging has been a concern when trying to obtain diffusion constants for confined diffusion because a particle may diffuse a significant fraction of the corral size in time between consecutive measurements (71) However previous theoretical modeling revealed that when τ the dwell time to explore a 1-D lattice with a length of L is large compared to the exposure time ΔT (50 ms) then the estimation of τ L (confinement length) and D (diffusion constant) remain accurate (72) The accuracy of measuring diffusion constants from single-molecule experiment remains accurate for confinements with dwell times down to τ = ΔT3 (72) The dwell time to explore a linear lattice with a confinement length of L is τ = L2(π2D) (73) In the case of TRF1 and TRF2 over the telomeric region τ would be 100 s for a case with a diffusion constant of 03 times 10-2 um2s and L of 055 μm corresponding to τ = 200ΔT gt ΔT3 These parameters support the assumption that the measurement of diffusion constants in this study remains accurate even with camera time averaging
Supplementary Movie Legends 1 Movie S1 TRF1-QD on λ DNA A movie demonstrating real-time observation of
1-D sliding of a TRF1-QD on λ DNA at 75 mM ionic strength (real time 34 s)
The scale bar is 1 μm
2 Movie S2 TRF2-QD on λ DNA A movie demonstrating real-time observation of
1-D sliding of a TRF2-QD on λ DNA at 75 mM ionic strength (real time 36 s)
The scale bar is 1 μm
3 Movie S3 TRF1-QDs on the ligated T270 DNA Dual-color labeled TRF1-QDs
on the ligated T270 DNA at 125 mM ionic strength (real time 1 min 26 s) The
scale bar is 1 μm
4 Movie S4 TRF2-QDs on the ligated T270 DNA Dual-color labeled
TRF2-QDs on the ligated T270 DNA at 125 mM ionic strength (real time 1
min and 16 s) The scale bar is 1 μm
5 Movie S5 TRF2-QDs on the ligated Tel10 DNA Dual-color labeled TRF2-QDs
on the ligated Tel10 DNA at 125 mM ionic strength (real time 49 s) The scale
bar is 1 μm
SUPPLEMENTARY REFERENCES
65 Takai KK Hooper S Blackwood S Gandhi R and de Lange T (2010) In
vivo stoichiometry of shelterin components The Journal of biological chemistry
285 1457-1467
66 Thompson RE Larson DR and Webb WW (2002) Precise nanometer
localization analysis for individual fluorescent probes Biophysical journal 82
2775-2783
67 Fairall L Chapman L Moss H de Lange T and Rhodes D (2001) Structure
of the TRFH dimerization domain of the human telomeric proteins TRF1 and
TRF2 Molecular cell 8 351-361
68 Schurr JM (1979) The one-dimensional diffusion coefficient of proteins
absorbed on DNA Hydrodynamic considerations Biophysical chemistry 9 413-
414
69 Hughes BD (1995) Random Walks Oxford University Press 1
70 Dietrich C Yang B Fujiwara T Kusumi A and Jacobson K (2002)
Relationship of lipid rafts to transient confinement zones detected by single
particle tracking Biophysical journal 82 274-284
71 Saxton MJ (1995) Single-particle tracking effects of corrals Biophysical
journal 69 389-398
72 Destainville N and Salome L (2006) Quantification and correction of systematic
errors due to detector time-averaging in single-molecule tracking experiments
Biophysical journal 90 L17-19
73 Meilhac N Le Guyader L Salome L and Destainville N (2006) Detection of
confinement and jumps in single-molecule membrane trajectories Phys Rev E
Stat Nonlin Soft Matter Phys 73 011915
Table S1
Ionic Strength
DNA TRF1-QDs () TRF2-QDs ()
(mM) n I II III IV n I II III IV
75 λ DNA 179 5 22 168 76 278 374 83 165 378
125 λ DNA 63 79 16 111 794 171 62 41 152 187
175 λ DNA 210 30 48 105 547 177 604 34 136 226
225 λ DNA 291 443 17 62 478 154 617 52 117 214
125 T270 184 109 6 179 652 374 27 51 166 513
225 T270 110 45 55 273 627 216 435 32 241 292
Percentages of four types of protein-DNA interactions for TRF1 and TRF2 on λ DNA and the ligated T270 DNA substrate at different ionic strengths
Note The examples of each type of kymograph are shown in Fig 2D The total video length was 2 minutes for λ DNA and 4 mins for the ligated T270 DNA substrate Increasing the video length to 4 mins for λ DNA does not change the lifetime measurement for the Type I complexes
Figure S1 DNA substrates used for AFM and fluorescence imaging (not including λ DNA) The purple and bluegreen regions represent telomeric and non-telomeric sequences respectively Ligated DNA substrates have heterogeneous lengths
54 kb 16 kb 38 kb 16 kb 38 kb
54 kb
ligated non-telomeric DNA
linearized T270 (54 kb)
16 kb
19 kb 16 kb
(TTAGGG)135 - (TTAGGG)135
linearized Tel10 (599 kb)
16 kb 42
(TTAGGG)10
DNA substrates for AFM imaging
DNA substrates for fluorescence imaging
ligated T270
599 kb ligated Tel10
599 kb
19 kb
QD Ab
Ab
C
B
100 nm 100 nm 100 nm
nm
QD
TRF2
Antibody
A
20 nm
Figure S2 Stoichiometry of TRF2-QDs revealed by AFM imaging (A) A schematic representation of TRF2 primary antibody binding to a TRF2-QD (B) AFM images of TRF2-QDs in the presence of TRF2 primary antibody (TRF2Ab = 11) White arrows point to TRF2-QDs with a single antibody (C) Cross section analysis of a TRF2-QD complex binding to TRF2 antibody The section analysis on the right is from the path drawn in the AFM image on the left (red line)
nm
Figure S3 TRF1- and TRF2-QDs bind specifically to the telomeric sequences (A) Position distributions of TRF1-QDs (black bars n = 103) and unlabeled TRF1 (gray bars n = 83) on the T270 telomeric substrate and TRF1-QDs on the non-telomeric DNA substrate (white bars n = 13) (B) Position distributions of TRF2-QDs (black bars n = 106) unlabeled TRF2 (gray bars n = 76) on the T270 telomeric substrate and TRF2-QDs on the non-telomeric DNA substrate (white bars n = 100) The (TTAGGG)270 sequence makes up approximately 30 of the total DNA length and is located in the middle of the linearized T270 DNA (between 35 to 50 from one end) Among the protein-QDs on DNA ~406 TRF1-QD and ~526 of TRF2-QD bound to the telomeric regions (excluding complexes bound right at the end of the DNA) The small peak at 24 is consistent with the locations of previously discovered preferred TRF1 and TRF2 binding sequence (CCATTC) over the non-telomeric region (C and D) Position distributions of TRF1-QDs (C n = 67) and TRF2-QDs (D n=51) on linear Tel10 DNA substrate with (TTAGGG)10 sequence located at 42 from one DNA end
D
B A
C
A B
C
Ionic Strength
TRF1-QDs TRF2-QDs
(mM) n n
75 84 27 166 97
125 87 33 142 95
175 116 30 154 95
225 135 15 158 89
D
Percentages of motile TRF1- and TRF2-QDs on λ DNA
Figure S4 Diffusional properties of TRF1 and TRF2 on λ DNA (A) Percentages of motile TRF1- and TRF2-QDs on λ DNA n is the number of complexes analyzed TRF proteins were labeled with red QDs (655 nm) (B) Diffusion constants of TRF1- (white bars) and TRF2-QDs (black bars) at different ionic strengths (C) Alpha factors of TRF1- (white bars) and TRF2-QDs (black bars) at different ionic strengths The numbers of the complexes analyzed were 51 37 40 and 33 for TRF1-QDs and 59 54 63 and 66 for TRF2-QDs at 75 125 175 225 mM ionic strengths respectively (D) The effect of ionic strength on the lifetimes of TRF1- (white bars) and TRF2-QDs (Black bars) on λ DNA The numbers of the complexes analyzed were 63 and 128 for TRF1-QDs and 104 106 107 and 95 for TRF2-QDs with increasing ionic strengths Across all ionic strengths compared to TRF2 TRF1 showed lower affinity for nonspecific λ DNA indicated by lower average numbers of protein-QDs (11 plusmn 01 vs 133 plusmn 22) in each field of view (27 microm x 55 microm) and lower average numbers of TRF1-QDs on DNA tightrope(s) between two beads (11 plusmn 01 vs 38 plusmn 03)
A
C
D 2
microm
10 s
TRF2 + λ DNA
TRF2 + λ DNA
B
2 microm
10 s
TRF1 + λ DNA
TRF1 + λ DNA
Figure S5 Dual color labeling of TRF1 and TRF2 A representative fluorescence image (A) and kymograph (B) of dual-color labeled TRF1-QDs on λ DNA A representative ORF image (C) and kymograph (D) of dual-color labeled TRF2-QDs on λ DNA TRF1 or TRF2 was incubated with equal molar of red (655 nm) and green (565 nm) QDs The kymographs shown in (B) and (D) are from the boxed regions in (A) and (C) respectively Among the observed TRF2-QD complexes encountering another protein on DNA (n = 26) we did not observe any protein barrier bypass events for TRF2 Due to the lower binding affinity of TRF1 on DNA with non-telomeric sequences even though we did not observe bypass when TRF1-QD complexes encountered barriers posed by other proteins (n = 3 out of 87 binding events) the number of events was not sufficient to make any statistical comparisons (E) Percentages of dual color QD labeled TRF1 and TRF2
10 s
Complexes TRF1-QDs TRF2-QDs
Total number 141 43
Dual color () 19 79
Red () 41 10
Green () 39 11
E Percentages of dual color labeled TRF1 and TRF2 on λ DNA
A
Figure S6 Additional information on the length of ligated T270 DNA tightropes the diffusion range distributions and distances between two adjacent TRF2-QDs on the ligated T270 substrate (A) Measured ligated T270 DNA lengths between two anchoring silica beads (n = 163) (B) The diffusion range distribution of TRF2-QDs at 225 mM ionic strength (n = 4 1) The line in the plot is double Gaussian fit to the data with R2 of 097 and peaks centered at 05 and 15 μm (C) The diffusion range of TRF2-QDs on ligated T270 DNA at 068 nM TRF2 and 033 nM QD concentrations (n = 33) The line in the plot is single Gaussian fit to the data with R2 of 097 and the peak centered at 05 μm Individual DNA tightropes with one or two QDs (no contact during recording) were analyzed (D) The distances between adjacent TRF2-QDs on DNA tightropes formed at 25 μlml flow rate (n = 121) The line in the plot is double Gaussian fit to the data with R2 of 097 and peaks centered at 15 and 27 μm The spacing between adjacent TRF2-QDs indicate that DNA was stretched to ~88 of its contour length
225 mM ionic strength
C D
B
3 min 0 min
0 min 63 s
A
B
TRF2 + Tel10 DNA
TRF2 + Tel10 DNA
Figure S7 Dynamics of TRF2-QDs on the ligated Tel10 DNA (A) Kymographs of TRF2-QDs on the ligated Tel10 DNA On this substrate there were two populations static complexes with apparent diffusion constant of 25 (plusmn005) times10-4 microm2s (n = 10) and complexes with long diffusion range (gt850 nm white arrows) (B) Measured distance between two adjacent TRF2-QDs on ligated T10 DNA substrate (n = 35) The line in (B) is Gaussian fit to the data which has R2 of 098 Consistent with a larger spacing (599 kb) between two adjacent telomeric regions on the Tel10 DNA substrate static TRF2-QDs were spaced at longer distances (19 plusmn 0049 microm) compared to that on the ligated T270 substrate (16 plusmn 001 microm Fig 3)
125 mM 225 mM
A
C D 125 mM 225 mM
Figure S8 Short diffusion ranges of TRF1- and TRF2-QDs at (TTAGGG)270 telomeric regions are narrowly distributed independent of the video length The diffusion range over time for TRF1-QDs at 125 mM ionic strength (A) and 225 mM strength (B) and TRF2-QDs at 125 mM ionic strength (C) and 225 mM strength (D) on λ DNA (red dots) and the ligated T270 DNA (blue squares) The numbers of complexes plotted for TRF1 are 37 and 33 for λ DNA 26 and 21 for T270 DNA at 125 and 225 mM ionic strength respectively The numbers of complexes plotted for TRF2 are 48 and 66 for λ DNA 22 and 34 for T270 DNA at 125 and 225 mM ionic strength respectively On λ DNA the diffusion ranges are widely distributed between approximately 05 to 9 microm The time scale (from 10 to 120 s) is from the cropped videos used for the diffusion constant and diffusion range analysis
A B
C D
88 plusmn 33 times10-2 microm2sec (994)
A
B 027 plusmn 013 times10-2 microm2sec (1000)
027 plusmn 009 times10-2 microm2sec (1000)
48 plusmn 13 times10-2 microm2sec (433)
Figure S9 Computer simulations of diffusion by modeling random walk of proteins on a 1-D DNA lattice using PythonTM programming language The diffusion constants used for simulation were that of TRF2-QDs on λ DNA (A) and on the telomeric DNA (B) at 125 mM ionic strength A plot for MSD vs Δt obtained and an example of a trajectory of a protein (insert) are presented for (left A) DNA with unlimited length and (right A) DNA with 16 kb length at 1460436 stepss stepping rate (corresponding to TRF2-QDs on λ DNA) A plot for MSD vs Δt and an example of a trajectory of a protein (insert) are also presented for (left B) DNA with unlimited length and (right B) DNA with 16 kb length at 46713 stepss (corresponding to the rate of TRF2-QDs at the telomeric region) The fitting parameters were constructed such that only the initial linear portion of the MSD vs Δt plots was used for calculating the diffusion constant For diffusion with confinement a protein walks along a 1-DNA lattice with two totally reflecting barriers The numbers in each plot are the mean and standard deviation of the simulated data The number of particles simulated for each case is indicated in the parentheses
Unlimited DNA length
Unlimited DNA length
16 kb DNA length
16 kb DNA length
B
Figure S10 Dissociation events of TRF1 and TRF2-QDs on the ligated T270 DNA Representative kymographs of TRF1- (A) and TRF2-QDs (B) on the ligated T270 DNA at 125 mM ionic strength The scale bar is 1 μm The yellow arrows point to dissociation events either directly from the telomeric region or through the non-telomeric region The purple arrows point to the transient dissociation and rebinding at the same telomeric region
0 min 4 min
TRF2 + T270 DNA
2 min 0 min
TRF1
TRF1 + T270 DNA A
0 min
TRF2 + T270 DNA
4 min
4 min 0 min
5 min
TRF2 + T270 DNA
B
0 min 2 min
TRF2ΔB + λ DNA
D
C
0 min 3 min
TRF2ΔB + T270 DNA
Figure S11 Dynamics of TRF2ΔB-QDs on λ DNA and the ligated T270 DNA (A) Position distributions of TRF2ΔB-QDs on the linear T270 DNA substrate (n = 51) Among the protein-QDs on DNA ~66 TRF2ΔB-QDs bound to the telomeric regions (35 to 50 from DNA ends) Kymographs of TRF2ΔB-QDs on λ DNA (B) and the ligated T270 DNA (C) The scale bar is 1 μm Protein-QD-DNA reactions were carried out at 125 ionic strength (D) Diffusion range distributions of TRF2ΔB-QDs on λ DNA (white bars n = 21) and the ligated T270 DNA (stripped bars n = 30) The binding affinity of TRF2ΔB to λ DNA tightropes was significantly lower as indicated by lower average numbers of TRF2ΔB-QDs on DNA in the field of view (14 plusmn 02 vs 133 plusmn 22) and lower average numbers of protein-QDs on DNA tightropes between two beads (11 plusmn 01 vs 38 plusmn 03) Dual color QD labeling confirmed that TRF2ΔB can form dimers or higher order oligomeric species but at a significantly lower percent (14) compared with the full length protein (79) The fraction of motile protein-DNA complexes decreased from 95 for full length TRF2 to 65 (n = 40) for TRF2ΔB at 125 mM and from 89 to 74 (n = 23) at 225 mM ionic strength
A

A B
C
Ionic Strength
TRF1-QDs TRF2-QDs
(mM) n n
75 84 27 166 97
125 87 33 142 95
175 116 30 154 95
225 135 15 158 89
D
Percentages of motile TRF1- and TRF2-QDs on λ DNA
Figure S4 Diffusional properties of TRF1 and TRF2 on λ DNA (A) Percentages of motile TRF1- and TRF2-QDs on λ DNA n is the number of complexes analyzed TRF proteins were labeled with red QDs (655 nm) (B) Diffusion constants of TRF1- (white bars) and TRF2-QDs (black bars) at different ionic strengths (C) Alpha factors of TRF1- (white bars) and TRF2-QDs (black bars) at different ionic strengths The numbers of the complexes analyzed were 51 37 40 and 33 for TRF1-QDs and 59 54 63 and 66 for TRF2-QDs at 75 125 175 225 mM ionic strengths respectively (D) The effect of ionic strength on the lifetimes of TRF1- (white bars) and TRF2-QDs (Black bars) on λ DNA The numbers of the complexes analyzed were 63 and 128 for TRF1-QDs and 104 106 107 and 95 for TRF2-QDs with increasing ionic strengths Across all ionic strengths compared to TRF2 TRF1 showed lower affinity for nonspecific λ DNA indicated by lower average numbers of protein-QDs (11 plusmn 01 vs 133 plusmn 22) in each field of view (27 microm x 55 microm) and lower average numbers of TRF1-QDs on DNA tightrope(s) between two beads (11 plusmn 01 vs 38 plusmn 03)
A
C
D 2
microm
10 s
TRF2 + λ DNA
TRF2 + λ DNA
B
2 microm
10 s
TRF1 + λ DNA
TRF1 + λ DNA
Figure S5 Dual color labeling of TRF1 and TRF2 A representative fluorescence image (A) and kymograph (B) of dual-color labeled TRF1-QDs on λ DNA A representative ORF image (C) and kymograph (D) of dual-color labeled TRF2-QDs on λ DNA TRF1 or TRF2 was incubated with equal molar of red (655 nm) and green (565 nm) QDs The kymographs shown in (B) and (D) are from the boxed regions in (A) and (C) respectively Among the observed TRF2-QD complexes encountering another protein on DNA (n = 26) we did not observe any protein barrier bypass events for TRF2 Due to the lower binding affinity of TRF1 on DNA with non-telomeric sequences even though we did not observe bypass when TRF1-QD complexes encountered barriers posed by other proteins (n = 3 out of 87 binding events) the number of events was not sufficient to make any statistical comparisons (E) Percentages of dual color QD labeled TRF1 and TRF2
10 s
Complexes TRF1-QDs TRF2-QDs
Total number 141 43
Dual color () 19 79
Red () 41 10
Green () 39 11
E Percentages of dual color labeled TRF1 and TRF2 on λ DNA
A
Figure S6 Additional information on the length of ligated T270 DNA tightropes the diffusion range distributions and distances between two adjacent TRF2-QDs on the ligated T270 substrate (A) Measured ligated T270 DNA lengths between two anchoring silica beads (n = 163) (B) The diffusion range distribution of TRF2-QDs at 225 mM ionic strength (n = 4 1) The line in the plot is double Gaussian fit to the data with R2 of 097 and peaks centered at 05 and 15 μm (C) The diffusion range of TRF2-QDs on ligated T270 DNA at 068 nM TRF2 and 033 nM QD concentrations (n = 33) The line in the plot is single Gaussian fit to the data with R2 of 097 and the peak centered at 05 μm Individual DNA tightropes with one or two QDs (no contact during recording) were analyzed (D) The distances between adjacent TRF2-QDs on DNA tightropes formed at 25 μlml flow rate (n = 121) The line in the plot is double Gaussian fit to the data with R2 of 097 and peaks centered at 15 and 27 μm The spacing between adjacent TRF2-QDs indicate that DNA was stretched to ~88 of its contour length
225 mM ionic strength
C D
B
3 min 0 min
0 min 63 s
A
B
TRF2 + Tel10 DNA
TRF2 + Tel10 DNA
Figure S7 Dynamics of TRF2-QDs on the ligated Tel10 DNA (A) Kymographs of TRF2-QDs on the ligated Tel10 DNA On this substrate there were two populations static complexes with apparent diffusion constant of 25 (plusmn005) times10-4 microm2s (n = 10) and complexes with long diffusion range (gt850 nm white arrows) (B) Measured distance between two adjacent TRF2-QDs on ligated T10 DNA substrate (n = 35) The line in (B) is Gaussian fit to the data which has R2 of 098 Consistent with a larger spacing (599 kb) between two adjacent telomeric regions on the Tel10 DNA substrate static TRF2-QDs were spaced at longer distances (19 plusmn 0049 microm) compared to that on the ligated T270 substrate (16 plusmn 001 microm Fig 3)
125 mM 225 mM
A
C D 125 mM 225 mM
Figure S8 Short diffusion ranges of TRF1- and TRF2-QDs at (TTAGGG)270 telomeric regions are narrowly distributed independent of the video length The diffusion range over time for TRF1-QDs at 125 mM ionic strength (A) and 225 mM strength (B) and TRF2-QDs at 125 mM ionic strength (C) and 225 mM strength (D) on λ DNA (red dots) and the ligated T270 DNA (blue squares) The numbers of complexes plotted for TRF1 are 37 and 33 for λ DNA 26 and 21 for T270 DNA at 125 and 225 mM ionic strength respectively The numbers of complexes plotted for TRF2 are 48 and 66 for λ DNA 22 and 34 for T270 DNA at 125 and 225 mM ionic strength respectively On λ DNA the diffusion ranges are widely distributed between approximately 05 to 9 microm The time scale (from 10 to 120 s) is from the cropped videos used for the diffusion constant and diffusion range analysis
A B
C D
88 plusmn 33 times10-2 microm2sec (994)
A
B 027 plusmn 013 times10-2 microm2sec (1000)
027 plusmn 009 times10-2 microm2sec (1000)
48 plusmn 13 times10-2 microm2sec (433)
Figure S9 Computer simulations of diffusion by modeling random walk of proteins on a 1-D DNA lattice using PythonTM programming language The diffusion constants used for simulation were that of TRF2-QDs on λ DNA (A) and on the telomeric DNA (B) at 125 mM ionic strength A plot for MSD vs Δt obtained and an example of a trajectory of a protein (insert) are presented for (left A) DNA with unlimited length and (right A) DNA with 16 kb length at 1460436 stepss stepping rate (corresponding to TRF2-QDs on λ DNA) A plot for MSD vs Δt and an example of a trajectory of a protein (insert) are also presented for (left B) DNA with unlimited length and (right B) DNA with 16 kb length at 46713 stepss (corresponding to the rate of TRF2-QDs at the telomeric region) The fitting parameters were constructed such that only the initial linear portion of the MSD vs Δt plots was used for calculating the diffusion constant For diffusion with confinement a protein walks along a 1-DNA lattice with two totally reflecting barriers The numbers in each plot are the mean and standard deviation of the simulated data The number of particles simulated for each case is indicated in the parentheses
Unlimited DNA length
Unlimited DNA length
16 kb DNA length
16 kb DNA length
B
Figure S10 Dissociation events of TRF1 and TRF2-QDs on the ligated T270 DNA Representative kymographs of TRF1- (A) and TRF2-QDs (B) on the ligated T270 DNA at 125 mM ionic strength The scale bar is 1 μm The yellow arrows point to dissociation events either directly from the telomeric region or through the non-telomeric region The purple arrows point to the transient dissociation and rebinding at the same telomeric region
0 min 4 min
TRF2 + T270 DNA
2 min 0 min
TRF1
TRF1 + T270 DNA A
0 min
TRF2 + T270 DNA
4 min
4 min 0 min
5 min
TRF2 + T270 DNA
B
0 min 2 min
TRF2ΔB + λ DNA
D
C
0 min 3 min
TRF2ΔB + T270 DNA
Figure S11 Dynamics of TRF2ΔB-QDs on λ DNA and the ligated T270 DNA (A) Position distributions of TRF2ΔB-QDs on the linear T270 DNA substrate (n = 51) Among the protein-QDs on DNA ~66 TRF2ΔB-QDs bound to the telomeric regions (35 to 50 from DNA ends) Kymographs of TRF2ΔB-QDs on λ DNA (B) and the ligated T270 DNA (C) The scale bar is 1 μm Protein-QD-DNA reactions were carried out at 125 ionic strength (D) Diffusion range distributions of TRF2ΔB-QDs on λ DNA (white bars n = 21) and the ligated T270 DNA (stripped bars n = 30) The binding affinity of TRF2ΔB to λ DNA tightropes was significantly lower as indicated by lower average numbers of TRF2ΔB-QDs on DNA in the field of view (14 plusmn 02 vs 133 plusmn 22) and lower average numbers of protein-QDs on DNA tightropes between two beads (11 plusmn 01 vs 38 plusmn 03) Dual color QD labeling confirmed that TRF2ΔB can form dimers or higher order oligomeric species but at a significantly lower percent (14) compared with the full length protein (79) The fraction of motile protein-DNA complexes decreased from 95 for full length TRF2 to 65 (n = 40) for TRF2ΔB at 125 mM and from 89 to 74 (n = 23) at 225 mM ionic strength
A

A
C
D 2
microm
10 s
TRF2 + λ DNA
TRF2 + λ DNA
B
2 microm
10 s
TRF1 + λ DNA
TRF1 + λ DNA
Figure S5 Dual color labeling of TRF1 and TRF2 A representative fluorescence image (A) and kymograph (B) of dual-color labeled TRF1-QDs on λ DNA A representative ORF image (C) and kymograph (D) of dual-color labeled TRF2-QDs on λ DNA TRF1 or TRF2 was incubated with equal molar of red (655 nm) and green (565 nm) QDs The kymographs shown in (B) and (D) are from the boxed regions in (A) and (C) respectively Among the observed TRF2-QD complexes encountering another protein on DNA (n = 26) we did not observe any protein barrier bypass events for TRF2 Due to the lower binding affinity of TRF1 on DNA with non-telomeric sequences even though we did not observe bypass when TRF1-QD complexes encountered barriers posed by other proteins (n = 3 out of 87 binding events) the number of events was not sufficient to make any statistical comparisons (E) Percentages of dual color QD labeled TRF1 and TRF2
10 s
Complexes TRF1-QDs TRF2-QDs
Total number 141 43
Dual color () 19 79
Red () 41 10
Green () 39 11
E Percentages of dual color labeled TRF1 and TRF2 on λ DNA
A
Figure S6 Additional information on the length of ligated T270 DNA tightropes the diffusion range distributions and distances between two adjacent TRF2-QDs on the ligated T270 substrate (A) Measured ligated T270 DNA lengths between two anchoring silica beads (n = 163) (B) The diffusion range distribution of TRF2-QDs at 225 mM ionic strength (n = 4 1) The line in the plot is double Gaussian fit to the data with R2 of 097 and peaks centered at 05 and 15 μm (C) The diffusion range of TRF2-QDs on ligated T270 DNA at 068 nM TRF2 and 033 nM QD concentrations (n = 33) The line in the plot is single Gaussian fit to the data with R2 of 097 and the peak centered at 05 μm Individual DNA tightropes with one or two QDs (no contact during recording) were analyzed (D) The distances between adjacent TRF2-QDs on DNA tightropes formed at 25 μlml flow rate (n = 121) The line in the plot is double Gaussian fit to the data with R2 of 097 and peaks centered at 15 and 27 μm The spacing between adjacent TRF2-QDs indicate that DNA was stretched to ~88 of its contour length
225 mM ionic strength
C D
B
3 min 0 min
0 min 63 s
A
B
TRF2 + Tel10 DNA
TRF2 + Tel10 DNA
Figure S7 Dynamics of TRF2-QDs on the ligated Tel10 DNA (A) Kymographs of TRF2-QDs on the ligated Tel10 DNA On this substrate there were two populations static complexes with apparent diffusion constant of 25 (plusmn005) times10-4 microm2s (n = 10) and complexes with long diffusion range (gt850 nm white arrows) (B) Measured distance between two adjacent TRF2-QDs on ligated T10 DNA substrate (n = 35) The line in (B) is Gaussian fit to the data which has R2 of 098 Consistent with a larger spacing (599 kb) between two adjacent telomeric regions on the Tel10 DNA substrate static TRF2-QDs were spaced at longer distances (19 plusmn 0049 microm) compared to that on the ligated T270 substrate (16 plusmn 001 microm Fig 3)
125 mM 225 mM
A
C D 125 mM 225 mM
Figure S8 Short diffusion ranges of TRF1- and TRF2-QDs at (TTAGGG)270 telomeric regions are narrowly distributed independent of the video length The diffusion range over time for TRF1-QDs at 125 mM ionic strength (A) and 225 mM strength (B) and TRF2-QDs at 125 mM ionic strength (C) and 225 mM strength (D) on λ DNA (red dots) and the ligated T270 DNA (blue squares) The numbers of complexes plotted for TRF1 are 37 and 33 for λ DNA 26 and 21 for T270 DNA at 125 and 225 mM ionic strength respectively The numbers of complexes plotted for TRF2 are 48 and 66 for λ DNA 22 and 34 for T270 DNA at 125 and 225 mM ionic strength respectively On λ DNA the diffusion ranges are widely distributed between approximately 05 to 9 microm The time scale (from 10 to 120 s) is from the cropped videos used for the diffusion constant and diffusion range analysis
A B
C D
88 plusmn 33 times10-2 microm2sec (994)
A
B 027 plusmn 013 times10-2 microm2sec (1000)
027 plusmn 009 times10-2 microm2sec (1000)
48 plusmn 13 times10-2 microm2sec (433)
Figure S9 Computer simulations of diffusion by modeling random walk of proteins on a 1-D DNA lattice using PythonTM programming language The diffusion constants used for simulation were that of TRF2-QDs on λ DNA (A) and on the telomeric DNA (B) at 125 mM ionic strength A plot for MSD vs Δt obtained and an example of a trajectory of a protein (insert) are presented for (left A) DNA with unlimited length and (right A) DNA with 16 kb length at 1460436 stepss stepping rate (corresponding to TRF2-QDs on λ DNA) A plot for MSD vs Δt and an example of a trajectory of a protein (insert) are also presented for (left B) DNA with unlimited length and (right B) DNA with 16 kb length at 46713 stepss (corresponding to the rate of TRF2-QDs at the telomeric region) The fitting parameters were constructed such that only the initial linear portion of the MSD vs Δt plots was used for calculating the diffusion constant For diffusion with confinement a protein walks along a 1-DNA lattice with two totally reflecting barriers The numbers in each plot are the mean and standard deviation of the simulated data The number of particles simulated for each case is indicated in the parentheses
Unlimited DNA length
Unlimited DNA length
16 kb DNA length
16 kb DNA length
B
Figure S10 Dissociation events of TRF1 and TRF2-QDs on the ligated T270 DNA Representative kymographs of TRF1- (A) and TRF2-QDs (B) on the ligated T270 DNA at 125 mM ionic strength The scale bar is 1 μm The yellow arrows point to dissociation events either directly from the telomeric region or through the non-telomeric region The purple arrows point to the transient dissociation and rebinding at the same telomeric region
0 min 4 min
TRF2 + T270 DNA
2 min 0 min
TRF1
TRF1 + T270 DNA A
0 min
TRF2 + T270 DNA
4 min
4 min 0 min
5 min
TRF2 + T270 DNA
B
0 min 2 min
TRF2ΔB + λ DNA
D
C
0 min 3 min
TRF2ΔB + T270 DNA
Figure S11 Dynamics of TRF2ΔB-QDs on λ DNA and the ligated T270 DNA (A) Position distributions of TRF2ΔB-QDs on the linear T270 DNA substrate (n = 51) Among the protein-QDs on DNA ~66 TRF2ΔB-QDs bound to the telomeric regions (35 to 50 from DNA ends) Kymographs of TRF2ΔB-QDs on λ DNA (B) and the ligated T270 DNA (C) The scale bar is 1 μm Protein-QD-DNA reactions were carried out at 125 ionic strength (D) Diffusion range distributions of TRF2ΔB-QDs on λ DNA (white bars n = 21) and the ligated T270 DNA (stripped bars n = 30) The binding affinity of TRF2ΔB to λ DNA tightropes was significantly lower as indicated by lower average numbers of TRF2ΔB-QDs on DNA in the field of view (14 plusmn 02 vs 133 plusmn 22) and lower average numbers of protein-QDs on DNA tightropes between two beads (11 plusmn 01 vs 38 plusmn 03) Dual color QD labeling confirmed that TRF2ΔB can form dimers or higher order oligomeric species but at a significantly lower percent (14) compared with the full length protein (79) The fraction of motile protein-DNA complexes decreased from 95 for full length TRF2 to 65 (n = 40) for TRF2ΔB at 125 mM and from 89 to 74 (n = 23) at 225 mM ionic strength
A

A
Figure S6 Additional information on the length of ligated T270 DNA tightropes the diffusion range distributions and distances between two adjacent TRF2-QDs on the ligated T270 substrate (A) Measured ligated T270 DNA lengths between two anchoring silica beads (n = 163) (B) The diffusion range distribution of TRF2-QDs at 225 mM ionic strength (n = 4 1) The line in the plot is double Gaussian fit to the data with R2 of 097 and peaks centered at 05 and 15 μm (C) The diffusion range of TRF2-QDs on ligated T270 DNA at 068 nM TRF2 and 033 nM QD concentrations (n = 33) The line in the plot is single Gaussian fit to the data with R2 of 097 and the peak centered at 05 μm Individual DNA tightropes with one or two QDs (no contact during recording) were analyzed (D) The distances between adjacent TRF2-QDs on DNA tightropes formed at 25 μlml flow rate (n = 121) The line in the plot is double Gaussian fit to the data with R2 of 097 and peaks centered at 15 and 27 μm The spacing between adjacent TRF2-QDs indicate that DNA was stretched to ~88 of its contour length
225 mM ionic strength
C D
B
3 min 0 min
0 min 63 s
A
B
TRF2 + Tel10 DNA
TRF2 + Tel10 DNA
Figure S7 Dynamics of TRF2-QDs on the ligated Tel10 DNA (A) Kymographs of TRF2-QDs on the ligated Tel10 DNA On this substrate there were two populations static complexes with apparent diffusion constant of 25 (plusmn005) times10-4 microm2s (n = 10) and complexes with long diffusion range (gt850 nm white arrows) (B) Measured distance between two adjacent TRF2-QDs on ligated T10 DNA substrate (n = 35) The line in (B) is Gaussian fit to the data which has R2 of 098 Consistent with a larger spacing (599 kb) between two adjacent telomeric regions on the Tel10 DNA substrate static TRF2-QDs were spaced at longer distances (19 plusmn 0049 microm) compared to that on the ligated T270 substrate (16 plusmn 001 microm Fig 3)
125 mM 225 mM
A
C D 125 mM 225 mM
Figure S8 Short diffusion ranges of TRF1- and TRF2-QDs at (TTAGGG)270 telomeric regions are narrowly distributed independent of the video length The diffusion range over time for TRF1-QDs at 125 mM ionic strength (A) and 225 mM strength (B) and TRF2-QDs at 125 mM ionic strength (C) and 225 mM strength (D) on λ DNA (red dots) and the ligated T270 DNA (blue squares) The numbers of complexes plotted for TRF1 are 37 and 33 for λ DNA 26 and 21 for T270 DNA at 125 and 225 mM ionic strength respectively The numbers of complexes plotted for TRF2 are 48 and 66 for λ DNA 22 and 34 for T270 DNA at 125 and 225 mM ionic strength respectively On λ DNA the diffusion ranges are widely distributed between approximately 05 to 9 microm The time scale (from 10 to 120 s) is from the cropped videos used for the diffusion constant and diffusion range analysis
A B
C D
88 plusmn 33 times10-2 microm2sec (994)
A
B 027 plusmn 013 times10-2 microm2sec (1000)
027 plusmn 009 times10-2 microm2sec (1000)
48 plusmn 13 times10-2 microm2sec (433)
Figure S9 Computer simulations of diffusion by modeling random walk of proteins on a 1-D DNA lattice using PythonTM programming language The diffusion constants used for simulation were that of TRF2-QDs on λ DNA (A) and on the telomeric DNA (B) at 125 mM ionic strength A plot for MSD vs Δt obtained and an example of a trajectory of a protein (insert) are presented for (left A) DNA with unlimited length and (right A) DNA with 16 kb length at 1460436 stepss stepping rate (corresponding to TRF2-QDs on λ DNA) A plot for MSD vs Δt and an example of a trajectory of a protein (insert) are also presented for (left B) DNA with unlimited length and (right B) DNA with 16 kb length at 46713 stepss (corresponding to the rate of TRF2-QDs at the telomeric region) The fitting parameters were constructed such that only the initial linear portion of the MSD vs Δt plots was used for calculating the diffusion constant For diffusion with confinement a protein walks along a 1-DNA lattice with two totally reflecting barriers The numbers in each plot are the mean and standard deviation of the simulated data The number of particles simulated for each case is indicated in the parentheses
Unlimited DNA length
Unlimited DNA length
16 kb DNA length
16 kb DNA length
B
Figure S10 Dissociation events of TRF1 and TRF2-QDs on the ligated T270 DNA Representative kymographs of TRF1- (A) and TRF2-QDs (B) on the ligated T270 DNA at 125 mM ionic strength The scale bar is 1 μm The yellow arrows point to dissociation events either directly from the telomeric region or through the non-telomeric region The purple arrows point to the transient dissociation and rebinding at the same telomeric region
0 min 4 min
TRF2 + T270 DNA
2 min 0 min
TRF1
TRF1 + T270 DNA A
0 min
TRF2 + T270 DNA
4 min
4 min 0 min
5 min
TRF2 + T270 DNA
B
0 min 2 min
TRF2ΔB + λ DNA
D
C
0 min 3 min
TRF2ΔB + T270 DNA
Figure S11 Dynamics of TRF2ΔB-QDs on λ DNA and the ligated T270 DNA (A) Position distributions of TRF2ΔB-QDs on the linear T270 DNA substrate (n = 51) Among the protein-QDs on DNA ~66 TRF2ΔB-QDs bound to the telomeric regions (35 to 50 from DNA ends) Kymographs of TRF2ΔB-QDs on λ DNA (B) and the ligated T270 DNA (C) The scale bar is 1 μm Protein-QD-DNA reactions were carried out at 125 ionic strength (D) Diffusion range distributions of TRF2ΔB-QDs on λ DNA (white bars n = 21) and the ligated T270 DNA (stripped bars n = 30) The binding affinity of TRF2ΔB to λ DNA tightropes was significantly lower as indicated by lower average numbers of TRF2ΔB-QDs on DNA in the field of view (14 plusmn 02 vs 133 plusmn 22) and lower average numbers of protein-QDs on DNA tightropes between two beads (11 plusmn 01 vs 38 plusmn 03) Dual color QD labeling confirmed that TRF2ΔB can form dimers or higher order oligomeric species but at a significantly lower percent (14) compared with the full length protein (79) The fraction of motile protein-DNA complexes decreased from 95 for full length TRF2 to 65 (n = 40) for TRF2ΔB at 125 mM and from 89 to 74 (n = 23) at 225 mM ionic strength
A

B
Figure S10 Dissociation events of TRF1 and TRF2-QDs on the ligated T270 DNA Representative kymographs of TRF1- (A) and TRF2-QDs (B) on the ligated T270 DNA at 125 mM ionic strength The scale bar is 1 μm The yellow arrows point to dissociation events either directly from the telomeric region or through the non-telomeric region The purple arrows point to the transient dissociation and rebinding at the same telomeric region
0 min 4 min
TRF2 + T270 DNA
2 min 0 min
TRF1
TRF1 + T270 DNA A
0 min
TRF2 + T270 DNA
4 min
4 min 0 min
5 min
TRF2 + T270 DNA
B
0 min 2 min
TRF2ΔB + λ DNA
D
C
0 min 3 min
TRF2ΔB + T270 DNA
Figure S11 Dynamics of TRF2ΔB-QDs on λ DNA and the ligated T270 DNA (A) Position distributions of TRF2ΔB-QDs on the linear T270 DNA substrate (n = 51) Among the protein-QDs on DNA ~66 TRF2ΔB-QDs bound to the telomeric regions (35 to 50 from DNA ends) Kymographs of TRF2ΔB-QDs on λ DNA (B) and the ligated T270 DNA (C) The scale bar is 1 μm Protein-QD-DNA reactions were carried out at 125 ionic strength (D) Diffusion range distributions of TRF2ΔB-QDs on λ DNA (white bars n = 21) and the ligated T270 DNA (stripped bars n = 30) The binding affinity of TRF2ΔB to λ DNA tightropes was significantly lower as indicated by lower average numbers of TRF2ΔB-QDs on DNA in the field of view (14 plusmn 02 vs 133 plusmn 22) and lower average numbers of protein-QDs on DNA tightropes between two beads (11 plusmn 01 vs 38 plusmn 03) Dual color QD labeling confirmed that TRF2ΔB can form dimers or higher order oligomeric species but at a significantly lower percent (14) compared with the full length protein (79) The fraction of motile protein-DNA complexes decreased from 95 for full length TRF2 to 65 (n = 40) for TRF2ΔB at 125 mM and from 89 to 74 (n = 23) at 225 mM ionic strength
A
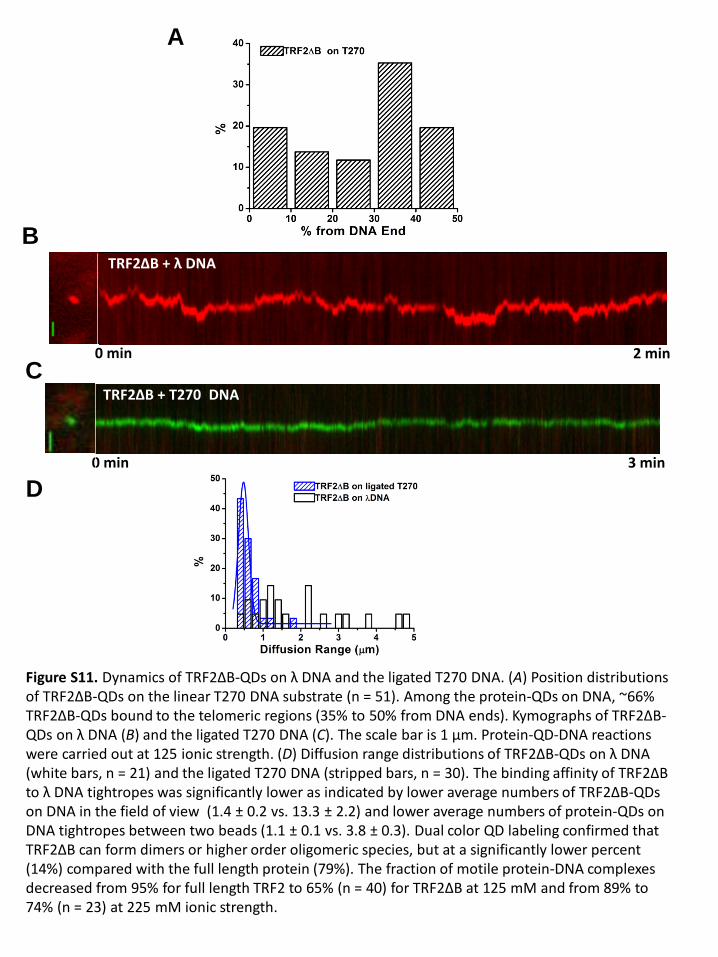
B
0 min 2 min
TRF2ΔB + λ DNA
D
C
0 min 3 min
TRF2ΔB + T270 DNA
Figure S11 Dynamics of TRF2ΔB-QDs on λ DNA and the ligated T270 DNA (A) Position distributions of TRF2ΔB-QDs on the linear T270 DNA substrate (n = 51) Among the protein-QDs on DNA ~66 TRF2ΔB-QDs bound to the telomeric regions (35 to 50 from DNA ends) Kymographs of TRF2ΔB-QDs on λ DNA (B) and the ligated T270 DNA (C) The scale bar is 1 μm Protein-QD-DNA reactions were carried out at 125 ionic strength (D) Diffusion range distributions of TRF2ΔB-QDs on λ DNA (white bars n = 21) and the ligated T270 DNA (stripped bars n = 30) The binding affinity of TRF2ΔB to λ DNA tightropes was significantly lower as indicated by lower average numbers of TRF2ΔB-QDs on DNA in the field of view (14 plusmn 02 vs 133 plusmn 22) and lower average numbers of protein-QDs on DNA tightropes between two beads (11 plusmn 01 vs 38 plusmn 03) Dual color QD labeling confirmed that TRF2ΔB can form dimers or higher order oligomeric species but at a significantly lower percent (14) compared with the full length protein (79) The fraction of motile protein-DNA complexes decreased from 95 for full length TRF2 to 65 (n = 40) for TRF2ΔB at 125 mM and from 89 to 74 (n = 23) at 225 mM ionic strength
A