Embed Size (px)
Citation preview
Trends in Total Psychiatric Inpatient and Other 24-Hour Mental Health Residential Treatment Capacity,
1970 to 2014NASMHPD Commissioners Meeting
July 31, 2017Ted Lutterman, NRI
Ron Manderscheid, Ph.D., NACBHDD
Co-authors: William Fisher, Ph.D., U.Mass
Robert Shaw, NRI
Psychiatric bed shortages are frequently in the news and a focus of courts, advocates,
providers, and states
© 2017 National Association of State Mental Health Program Directors Research Institutewww.nri-inc.org
2
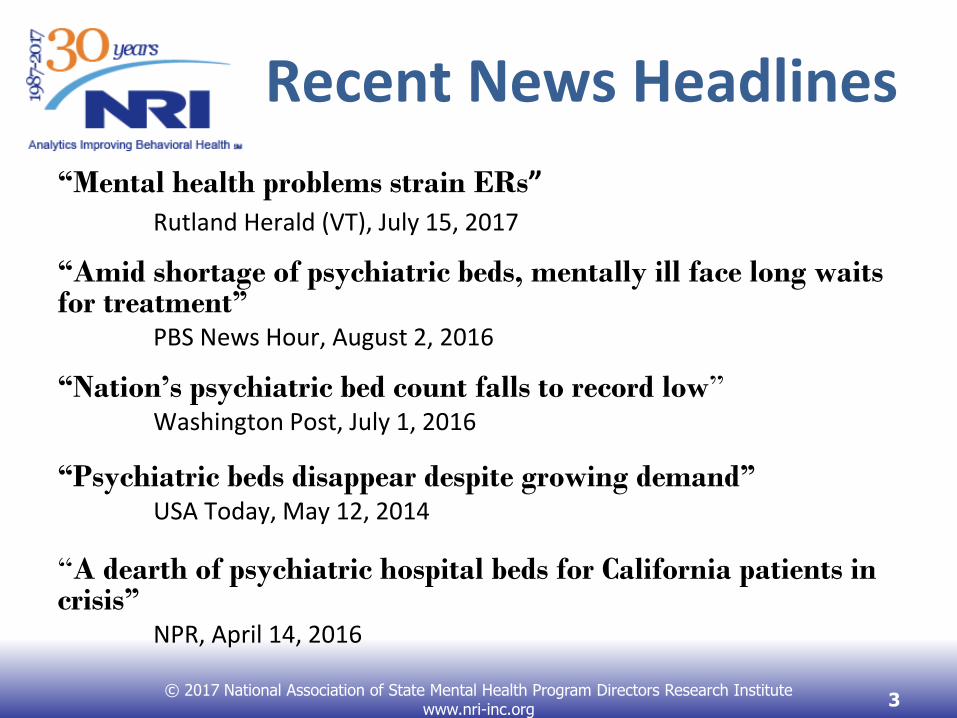
Recent News Headlines
“Mental health problems strain ERs”Rutland Herald (VT), July 15, 2017
“Amid shortage of psychiatric beds, mentally ill face long waits for treatment”
PBS News Hour, August 2, 2016
“Nation’s psychiatric bed count falls to record low”Washington Post, July 1, 2016
“Psychiatric beds disappear despite growing demand”USA Today, May 12, 2014
“A dearth of psychiatric hospital beds for California patients in crisis”
NPR, April 14, 2016
© 2017 National Association of State Mental Health Program Directors Research Institute www.nri-inc.org
3
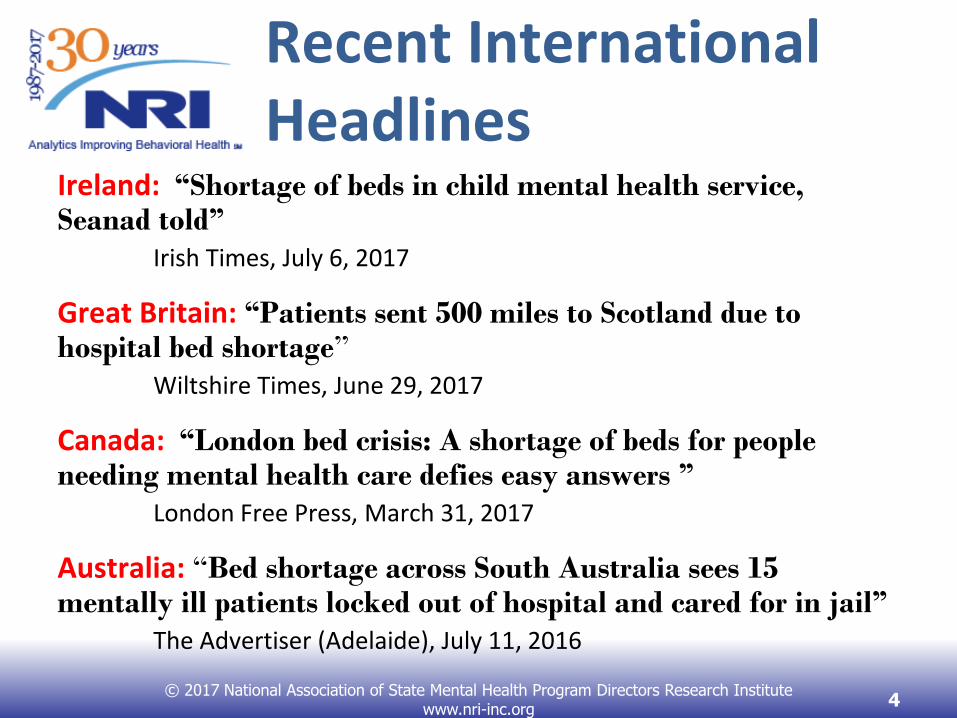
Recent International Headlines
Ireland: “Shortage of beds in child mental health service, Seanad told”
Irish Times, July 6, 2017
Great Britain: “Patients sent 500 miles to Scotland due to hospital bed shortage”
Wiltshire Times, June 29, 2017
Canada: “London bed crisis: A shortage of beds for people needing mental health care defies easy answers ”
London Free Press, March 31, 2017
Australia: “Bed shortage across South Australia sees 15 mentally ill patients locked out of hospital and cared for in jail”
The Advertiser (Adelaide), July 11, 2016
© 2017 National Association of State Mental Health Program Directors Research Institute www.nri-inc.org
4
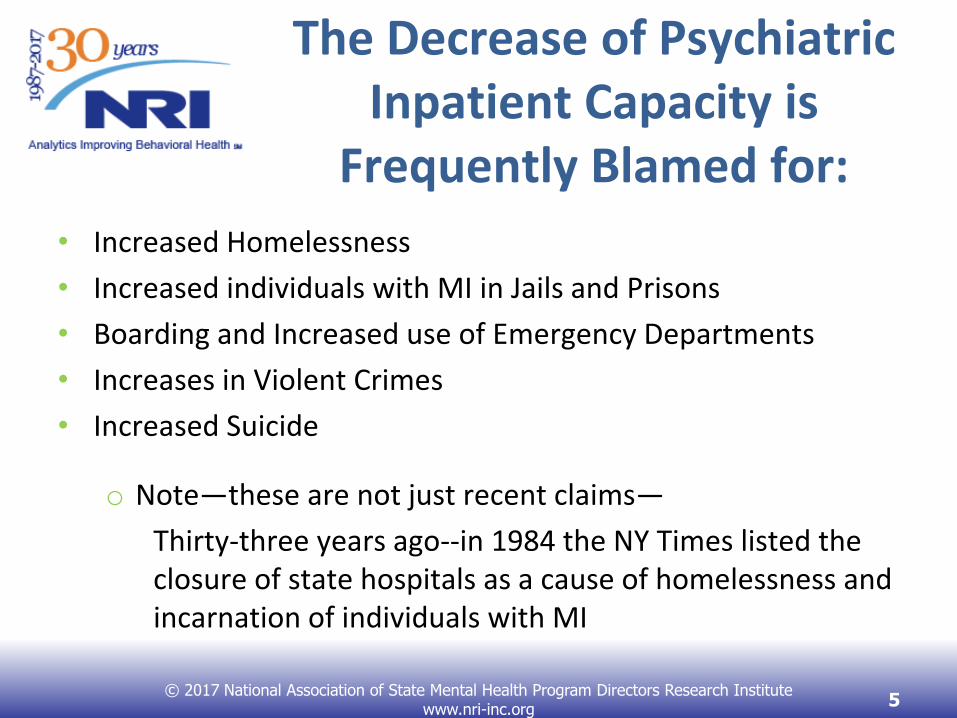
The Decrease of Psychiatric Inpatient Capacity is
Frequently Blamed for:
• Increased Homelessness
• Increased individuals with MI in Jails and Prisons
• Boarding and Increased use of Emergency Departments
• Increases in Violent Crimes
• Increased Suicide
o Note—these are not just recent claims—
Thirty-three years ago--in 1984 the NY Times listed the closure of state hospitals as a cause of homelessness and incarnation of individuals with MI
© 2017 National Association of State Mental Health Program Directors Research Institute www.nri-inc.org
5
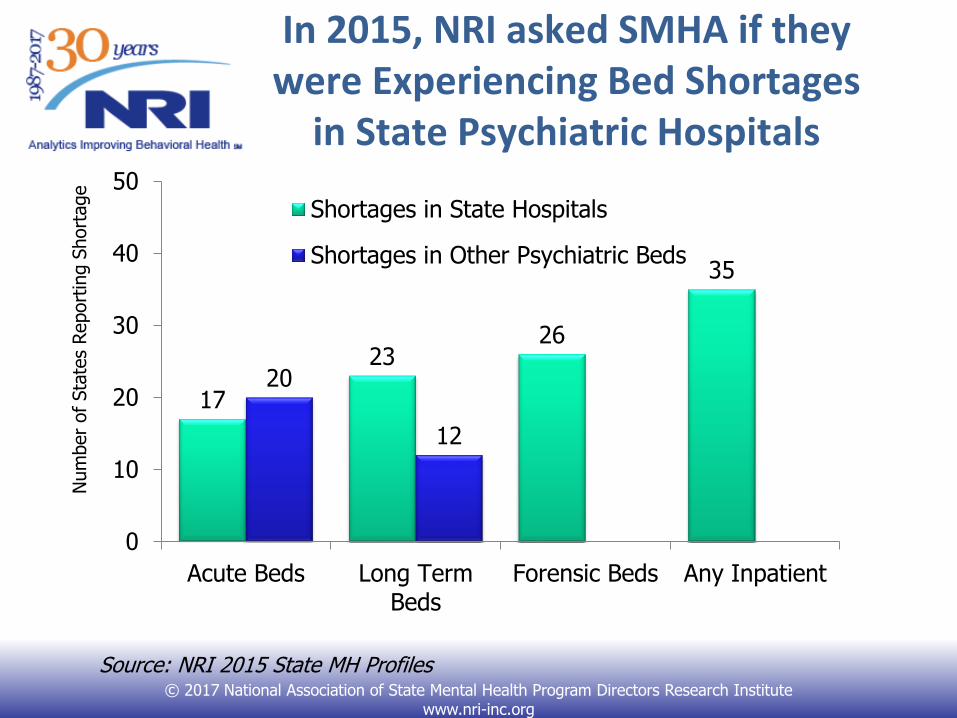
In 2015, NRI asked SMHA if they were Experiencing Bed Shortages
in State Psychiatric Hospitals
17
2326
35
20
12
0
10
20
30
40
50
Acute Beds Long TermBeds
Forensic Beds Any Inpatient
Num
ber
of Sta
tes
Report
ing S
hort
age
Shortages in State Hospitals
Shortages in Other Psychiatric Beds
© 2017 National Association of State Mental Health Program Directors Research Institute www.nri-inc.org
Source: NRI 2015 State MH Profiles
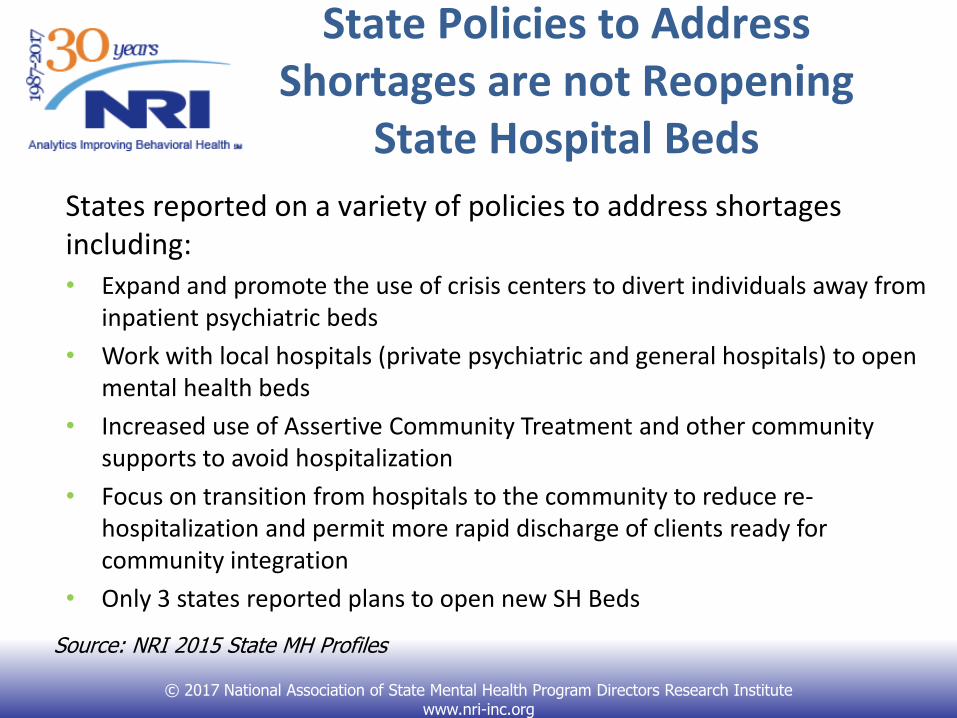
State Policies to Address Shortages are not Reopening
State Hospital Beds
States reported on a variety of policies to address shortages including:• Expand and promote the use of crisis centers to divert individuals away from
inpatient psychiatric beds
• Work with local hospitals (private psychiatric and general hospitals) to open mental health beds
• Increased use of Assertive Community Treatment and other community supports to avoid hospitalization
• Focus on transition from hospitals to the community to reduce re-hospitalization and permit more rapid discharge of clients ready for community integration
• Only 3 states reported plans to open new SH Beds
© 2017 National Association of State Mental Health Program Directors Research Institute www.nri-inc.org
Source: NRI 2015 State MH Profiles
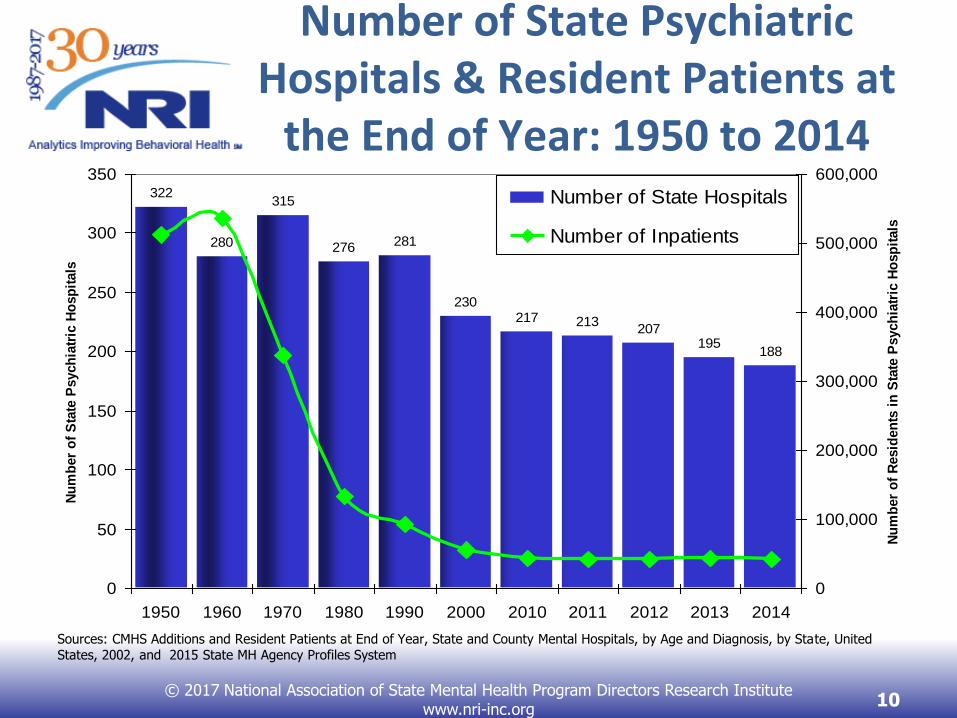
Number of State Psychiatric Hospitals & Resident Patients at
the End of Year: 1950 to 2014
© 2017 National Association of State Mental Health Program Directors Research Institute www.nri-inc.org
10
322
280
315
276 281
230217 213
207195
188
0
50
100
150
200
250
300
350
1950 1960 1970 1980 1990 2000 2010 2011 2012 2013 2014
Nu
mb
er
of
Sta
te P
sych
iatr
ic H
osp
itals
0
100,000
200,000
300,000
400,000
500,000
600,000
Nu
mb
er
of
Resid
en
ts i
n S
tate
Psych
iatr
ic H
osp
itals
Number of State Hospitals
Number of Inpatients
Sources: CMHS Additions and Resident Patients at End of Year, State and County Mental Hospitals, by Age and Diagnosis, by State, United States, 2002, and 2015 State MH Agency Profiles System

State Psychiatric Hospitals Treat Different Caseloads
than 40 Years Ago
29.3%
8.8%
0%
5%
10%
15%
20%
25%
30%
35%
Age 65 and Over
1970
201424%
9%
7%6.6%
3.8%5.1%
0%
5%
10%
15%
20%
25%
30%
35%
Organic BrainSyndrome
IDD Patients Alcohol & DrugAbuse
1970
2005
© 2017 National Association of State Mental Health Program Directors Research Institute www.nri-inc.org 11

Psychiatric Bed Capacity in 2014
Discussion of psychiatric bed capacity frequently focuses only on state psychiatric hospitals.
• The reduction of state psychiatric hospitals from over 550,000 patients in the 1950s to 40,000 patients today.
• Discussion of current inpatient capacity rarely addresses:
o all beds available from different types of organizations
o or the changed roles of state psychiatric hospitals
The paper developed for NASMHPD’s TA Coalition Project (funded by SAMHSA) estimates of total current capacity and discusses some of the changes from historical bed usage.
© 2017 National Association of State Mental Health Program Directors Research Institute www.nri-inc.org
12
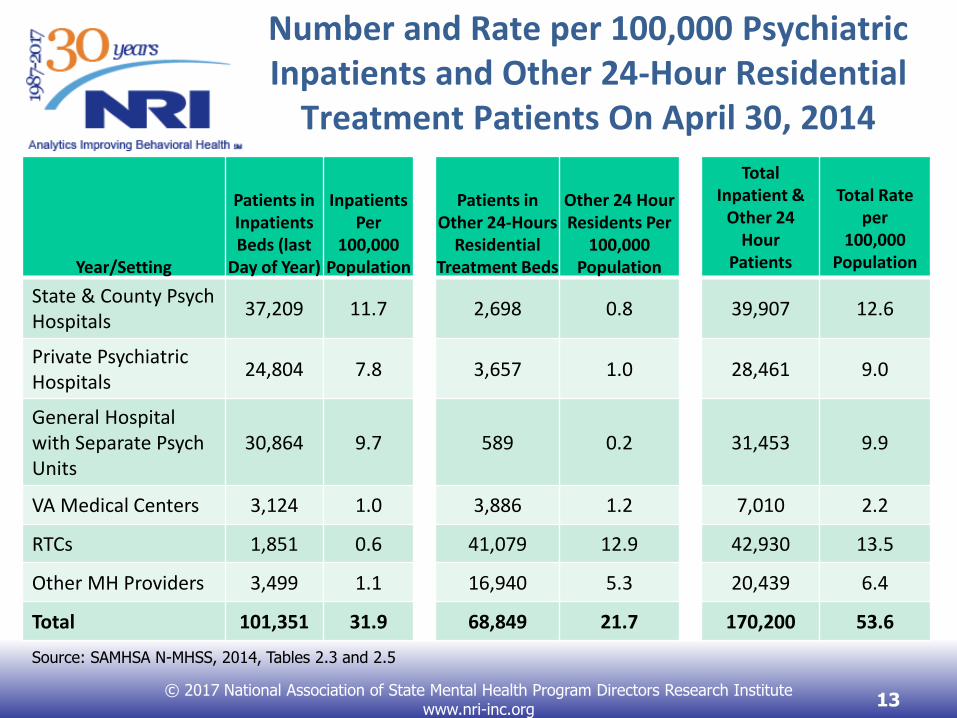
Number and Rate per 100,000 Psychiatric Inpatients and Other 24-Hour Residential
Treatment Patients On April 30, 2014
Year/Setting
Patients in Inpatients Beds (last
Day of Year)
InpatientsPer
100,000 Population
Patients in Other 24-Hours
Residential Treatment Beds
Other 24 Hour Residents Per
100,000 Population
Total Inpatient &
Other 24 Hour
Patients
Total Rate per
100,000 Population
State & County Psych Hospitals
37,209 11.7 2,698 0.8 39,907 12.6
Private Psychiatric Hospitals
24,804 7.8 3,657 1.0 28,461 9.0
General Hospital with Separate Psych Units
30,864 9.7 589 0.2 31,453 9.9
VA Medical Centers 3,124 1.0 3,886 1.2 7,010 2.2
RTCs 1,851 0.6 41,079 12.9 42,930 13.5
Other MH Providers 3,499 1.1 16,940 5.3 20,439 6.4
Total 101,351 31.9 68,849 21.7 170,200 53.6
© 2017 National Association of State Mental Health Program Directors Research Institute www.nri-inc.org
13
Source: SAMHSA N-MHSS, 2014, Tables 2.3 and 2.5
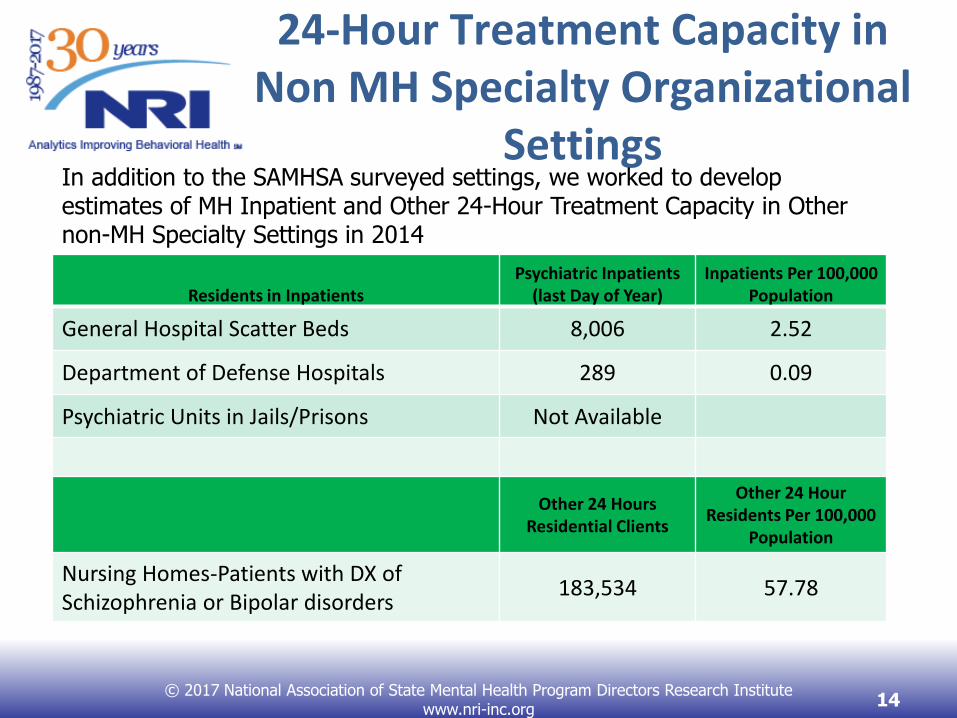
24-Hour Treatment Capacity in Non MH Specialty Organizational
Settings
Residents in InpatientsPsychiatric Inpatients
(last Day of Year)Inpatients Per 100,000
Population
General Hospital Scatter Beds 8,006 2.52
Department of Defense Hospitals 289 0.09
Psychiatric Units in Jails/Prisons Not Available
Other 24 Hours Residential Clients
Other 24 Hour Residents Per 100,000
Population
Nursing Homes-Patients with DX of Schizophrenia or Bipolar disorders
183,534 57.78
© 2017 National Association of State Mental Health Program Directors Research Institute www.nri-inc.org
14
In addition to the SAMHSA surveyed settings, we worked to develop estimates of MH Inpatient and Other 24-Hour Treatment Capacity in Other non-MH Specialty Settings in 2014
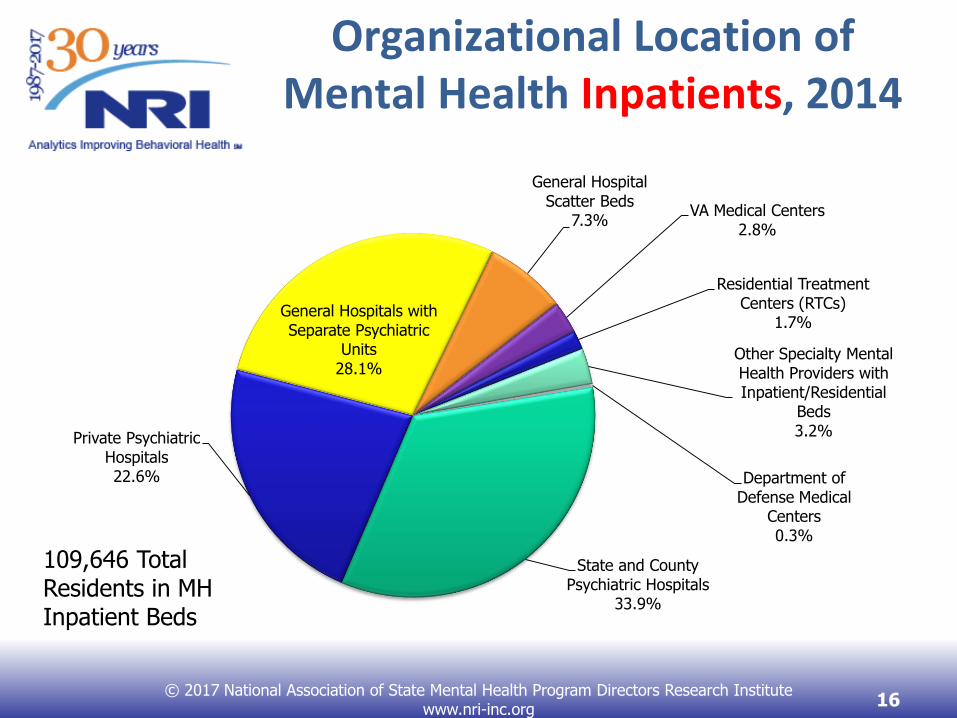
Organizational Location of Mental Health Inpatients, 2014
State and County Psychiatric Hospitals
33.9%
Private Psychiatric Hospitals22.6%
General Hospitals with Separate Psychiatric
Units28.1%
General Hospital Scatter Beds
7.3%VA Medical Centers
2.8%
Residential Treatment Centers (RTCs)
1.7%
Other Specialty Mental Health Providers with Inpatient/Residential
Beds3.2%
Department of Defense Medical
Centers0.3%
© 2017 National Association of State Mental Health Program Directors Research Institute www.nri-inc.org
16
109,646 Total Residents in MH Inpatient Beds
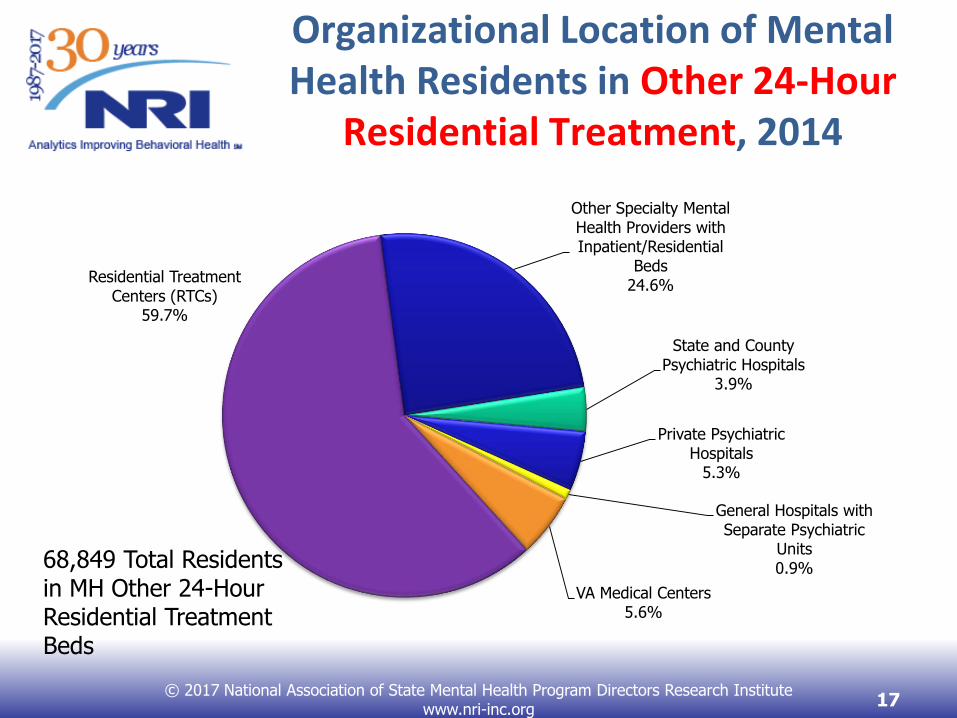
Organizational Location of Mental Health Residents in Other 24-Hour
Residential Treatment, 2014
State and County Psychiatric Hospitals
3.9%
Private Psychiatric Hospitals
5.3%
General Hospitals with Separate Psychiatric
Units0.9%
VA Medical Centers5.6%
Residential Treatment Centers (RTCs)
59.7%
Other Specialty Mental Health Providers with Inpatient/Residential
Beds24.6%
© 2017 National Association of State Mental Health Program Directors Research Institute www.nri-inc.org
17
68,849 Total Residents in MH Other 24-Hour Residential Treatment Beds

Organizational Location of Mental Health Residents in Other 24-Hour Residential Treatment, 2014—With Nursing Homes
State and County Psychiatric Hospitals
1.1%
Private Psychiatric Hospitals
1.4%
General Hospitals with Separate Psychiatric
Units0.2%
VA Medical Centers1.5%
Residential Treatment Centers (RTCs)
16.3%
Other Specialty Mental Health Providers with Inpatient/Residential
Beds6.7%
Nursing Homes-Residents with
Schizophrenia or Bipolar72.7%
© 2017 National Association of State Mental Health Program Directors Research Institute www.nri-inc.org
18
252,383 Total Residents in MH Other 24-Hour Residential Treatment and Nursing Home Beds
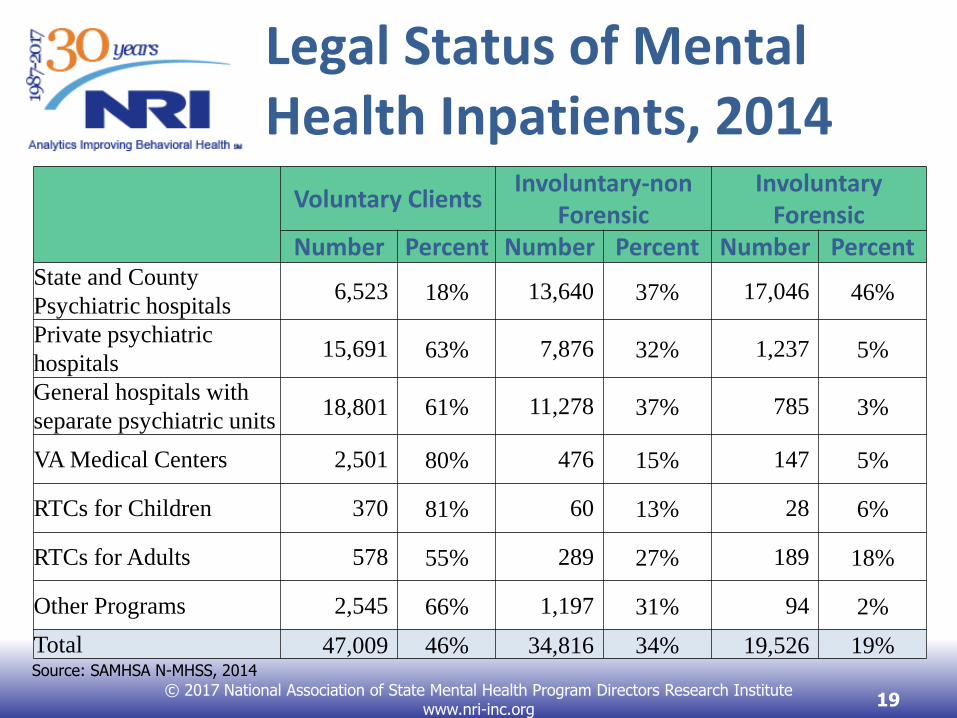
Legal Status of Mental Health Inpatients, 2014
© 2017 National Association of State Mental Health Program Directors Research Institute www.nri-inc.org
19
Voluntary ClientsInvoluntary-non
ForensicInvoluntary
ForensicNumber Percent Number Percent Number Percent
State and County
Psychiatric hospitals6,523 18% 13,640 37% 17,046 46%
Private psychiatric
hospitals15,691 63% 7,876 32% 1,237 5%
General hospitals with
separate psychiatric units18,801 61% 11,278 37% 785 3%
VA Medical Centers 2,501 80% 476 15% 147 5%
RTCs for Children 370 81% 60 13% 28 6%
RTCs for Adults 578 55% 289 27% 189 18%
Other Programs 2,545 66% 1,197 31% 94 2%
Total 47,009 46% 34,816 34% 19,526 19%Source: SAMHSA N-MHSS, 2014
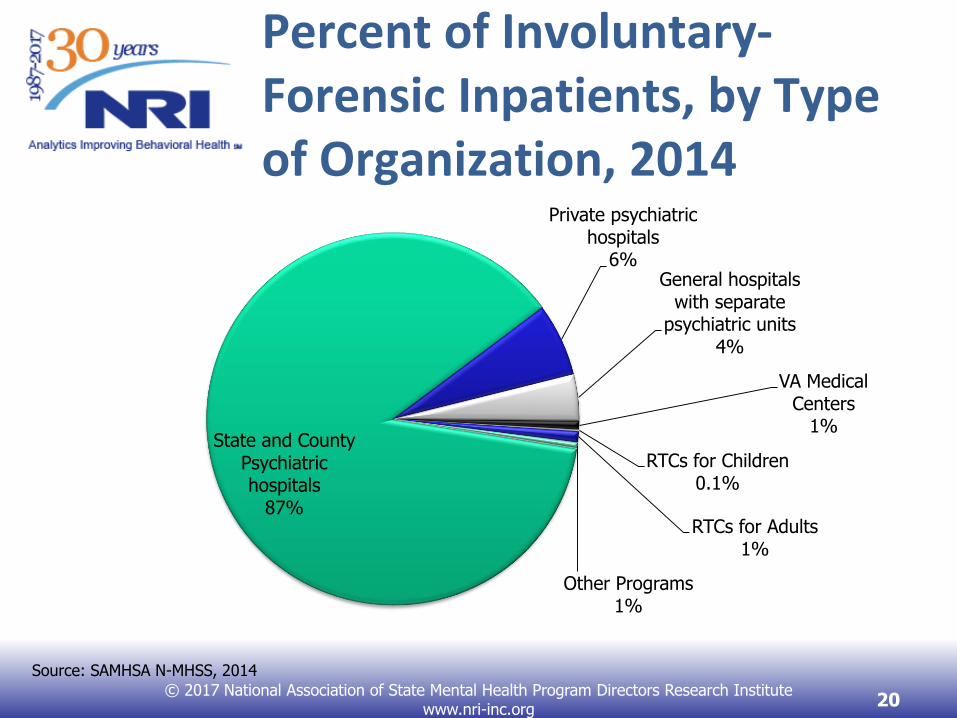
Percent of Involuntary-Forensic Inpatients, by Type of Organization, 2014
© 2017 National Association of State Mental Health Program Directors Research Institute www.nri-inc.org
20
State and County Psychiatric hospitals
87%
Private psychiatric hospitals
6%General hospitals
with separate psychiatric units
4%
VA Medical Centers
1%
RTCs for Children0.1%
RTCs for Adults1%
Other Programs1%
Source: SAMHSA N-MHSS, 2014
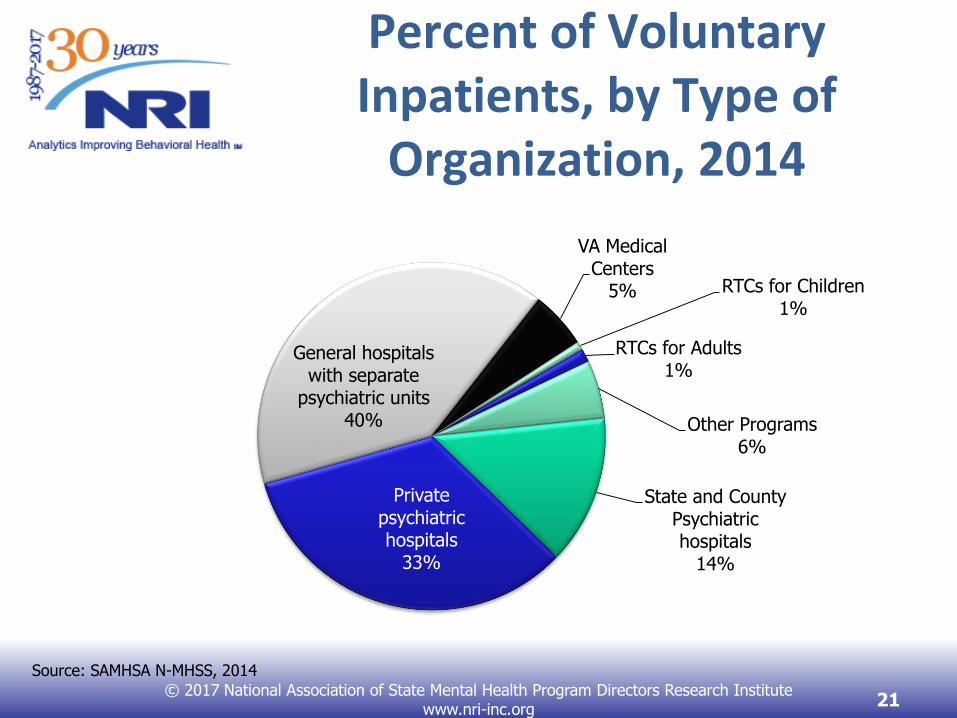
Percent of Voluntary Inpatients, by Type of
Organization, 2014
© 2017 National Association of State Mental Health Program Directors Research Institute www.nri-inc.org
21
State and County Psychiatric hospitals
14%
Private psychiatric hospitals
33%
General hospitals with separate
psychiatric units40%
VA Medical Centers
5% RTCs for Children1%
RTCs for Adults1%
Other Programs6%
Source: SAMHSA N-MHSS, 2014
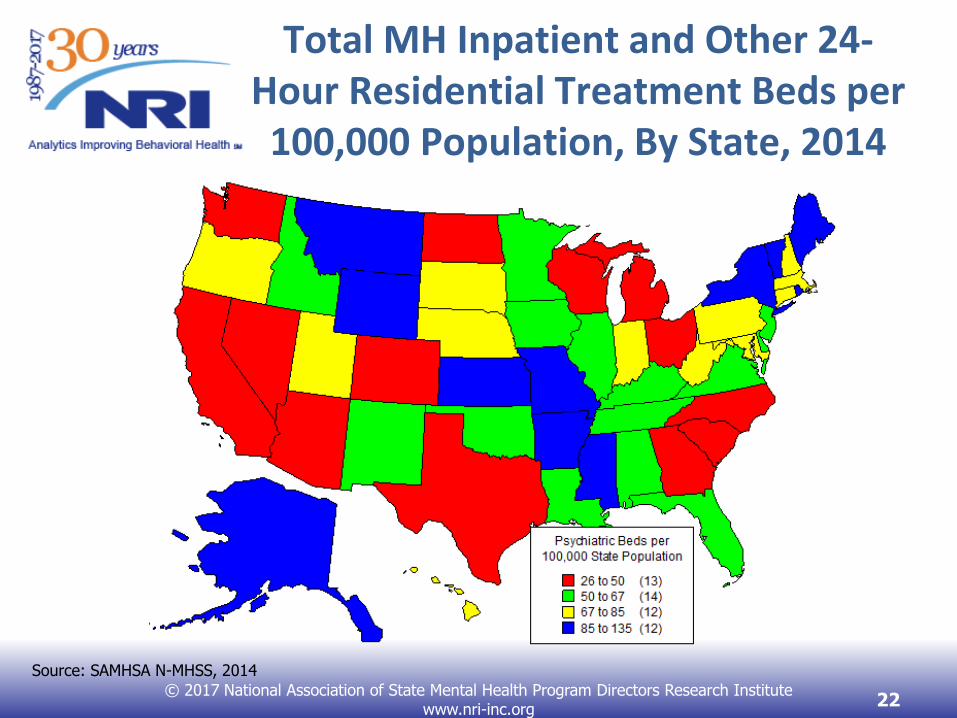
Total MH Inpatient and Other 24-Hour Residential Treatment Beds per 100,000 Population, By State, 2014
© 2017 National Association of State Mental Health Program Directors Research Institute www.nri-inc.org
22
Source: SAMHSA N-MHSS, 2014
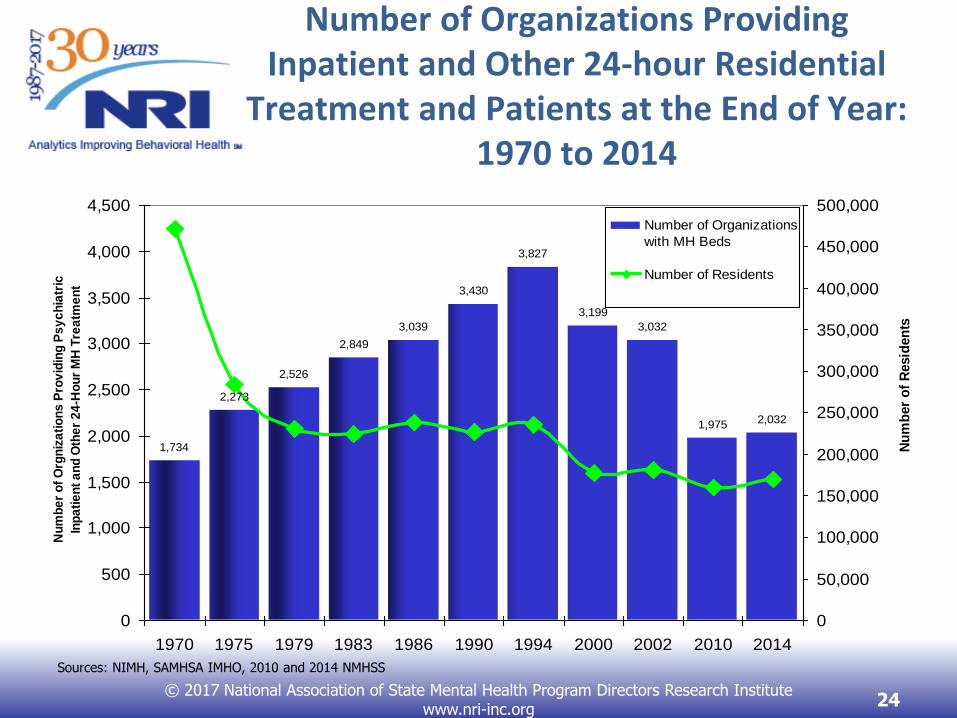
Number of Organizations Providing Inpatient and Other 24-hour Residential
Treatment and Patients at the End of Year: 1970 to 2014
24
1,734
2,273
2,526
2,849
3,039
3,430
3,827
3,199
3,032
1,975 2,032
0
500
1,000
1,500
2,000
2,500
3,000
3,500
4,000
4,500
1970 1975 1979 1983 1986 1990 1994 2000 2002 2010 2014
Nu
mb
er
of
Org
niz
ati
on
s P
rov
idin
g P
sy
ch
iatr
ic
Inp
ati
en
t a
nd
Oth
er
24
-Ho
ur
MH
Tre
atm
en
t
0
50,000
100,000
150,000
200,000
250,000
300,000
350,000
400,000
450,000
500,000
Nu
mb
er
of
Resid
en
ts
Number of Organizations
with MH Beds
Number of Residents
Sources: NIMH, SAMHSA IMHO, 2010 and 2014 NMHSS
© 2017 National Association of State Mental Health Program Directors Research Institute www.nri-inc.org
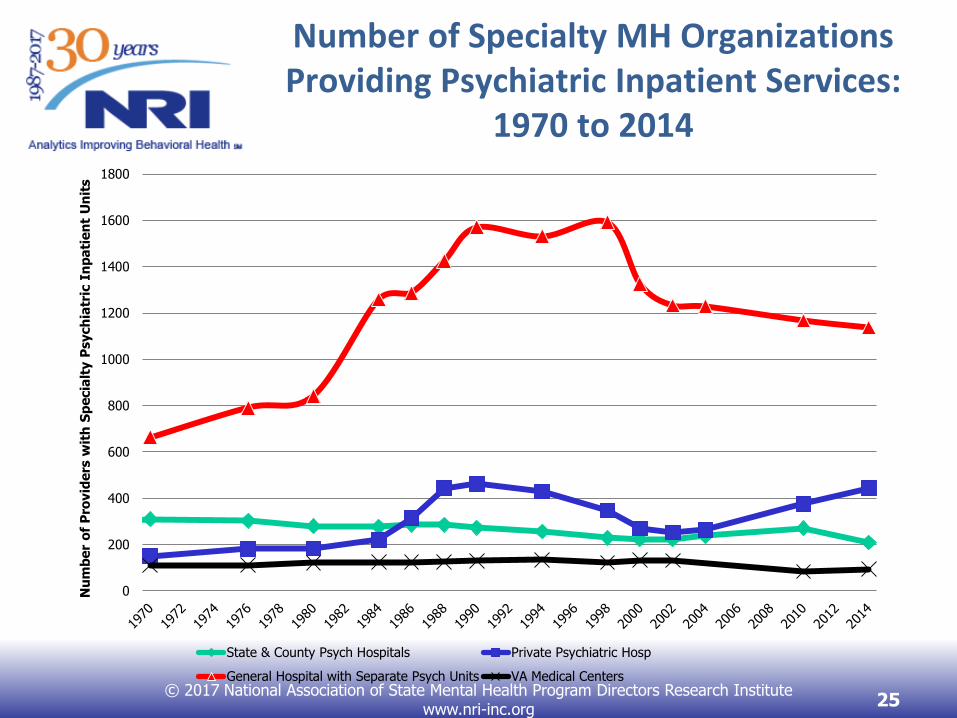
Number of Specialty MH Organizations Providing Psychiatric Inpatient Services:
1970 to 2014
0
200
400
600
800
1000
1200
1400
1600
1800
Nu
mb
er
of
Pro
vid
ers
wit
h S
pe
cia
lty P
sych
iatr
ic I
np
ati
en
t U
nit
s
State & County Psych Hospitals Private Psychiatric Hosp
General Hospital with Separate Psych Units VA Medical Centers© 2017 National Association of State Mental Health Program Directors Research Institute
www.nri-inc.org 25
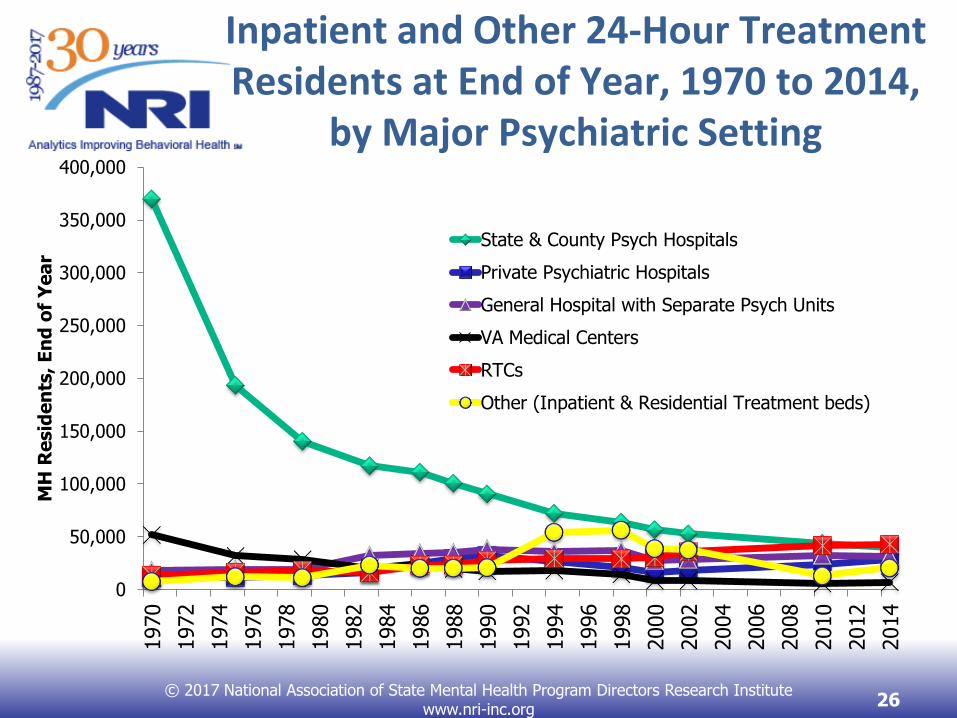
Inpatient and Other 24-Hour Treatment Residents at End of Year, 1970 to 2014,
by Major Psychiatric Setting
© 2017 National Association of State Mental Health Program Directors Research Institute www.nri-inc.org
26
0
50,000
100,000
150,000
200,000
250,000
300,000
350,000
400,0001970
1972
1974
1976
1978
1980
1982
1984
1986
1988
1990
1992
1994
1996
1998
2000
2002
2004
2006
2008
2010
2012
2014
MH
Re
sid
en
ts,
En
d o
f Y
ea
r
State & County Psych Hospitals
Private Psychiatric Hospitals
General Hospital with Separate Psych Units
VA Medical Centers
RTCs
Other (Inpatient & Residential Treatment beds)
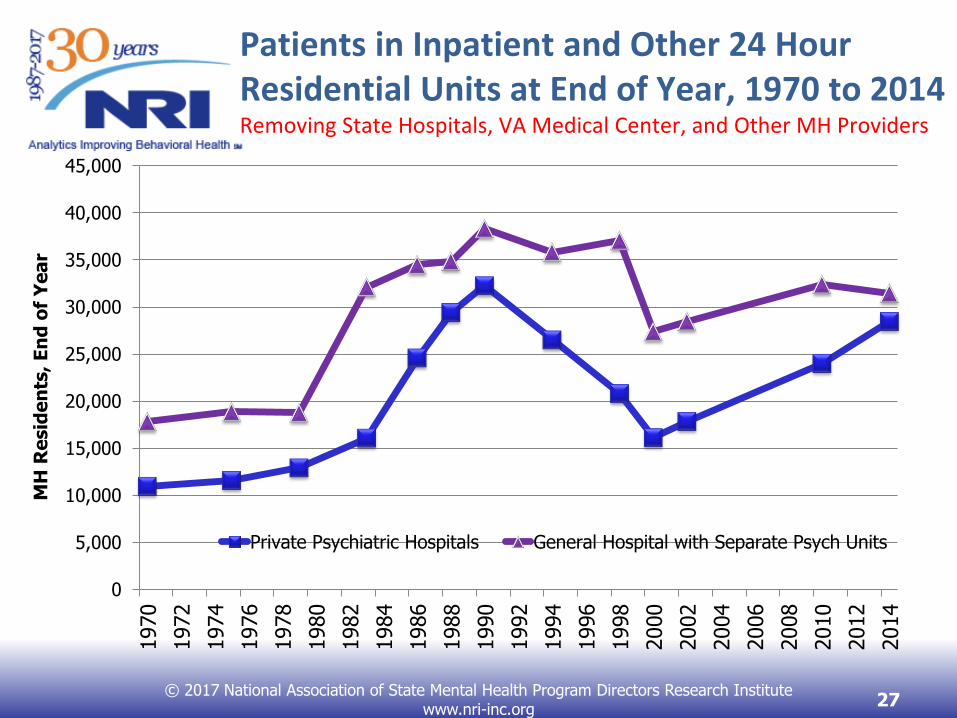
Patients in Inpatient and Other 24 Hour Residential Units at End of Year, 1970 to 2014 Removing State Hospitals, VA Medical Center, and Other MH Providers
© 2017 National Association of State Mental Health Program Directors Research Institute www.nri-inc.org
27
0
5,000
10,000
15,000
20,000
25,000
30,000
35,000
40,000
45,0001970
1972
1974
1976
1978
1980
1982
1984
1986
1988
1990
1992
1994
1996
1998
2000
2002
2004
2006
2008
2010
2012
2014
MH
Re
sid
en
ts,
En
d o
f Y
ea
r
Private Psychiatric Hospitals General Hospital with Separate Psych Units

State Psychiatric Hospital Trends in
Services and Spending• NRI maintains details available to SMHAs specific to the use
and clients of state psychiatric hospitals:
o 35 years of Expenditures (including share of overall state spending)
o 20+ years of residents, admissions, limited Length of Stay information
o State Policies on Use of SHs.
o Accreditation Status
o Patient Characteristics
© 2017 National Association of State Mental Health Program Directors Research Institute www.nri-inc.org
29
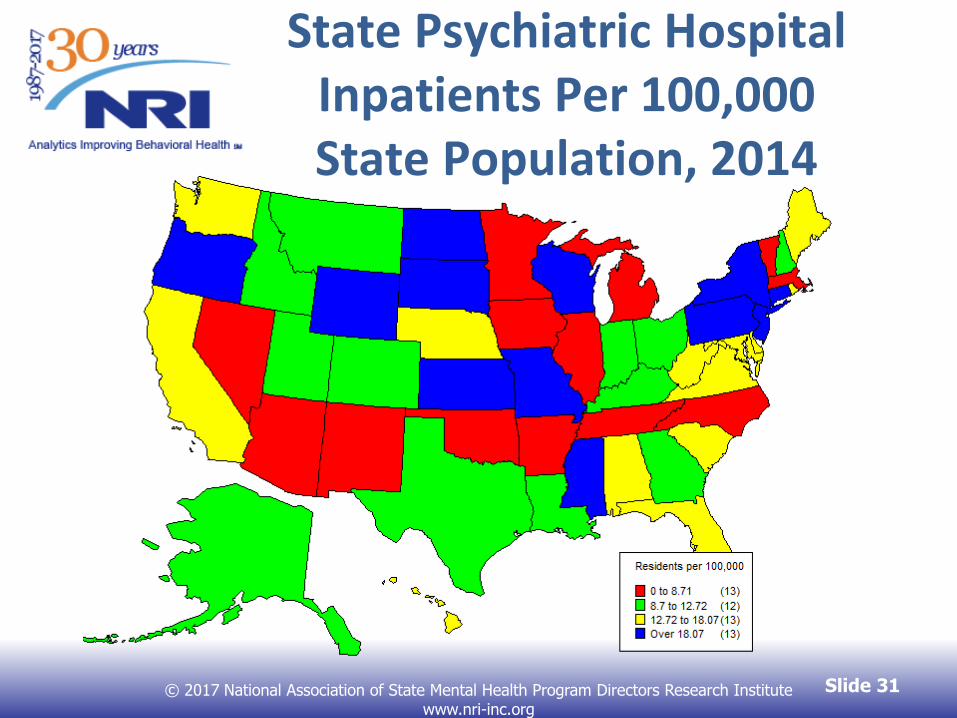
State Psychiatric Hospital Inpatients Per 100,000 State Population, 2014
Slide 31© 2017 National Association of State Mental Health Program Directors Research Institute www.nri-inc.org
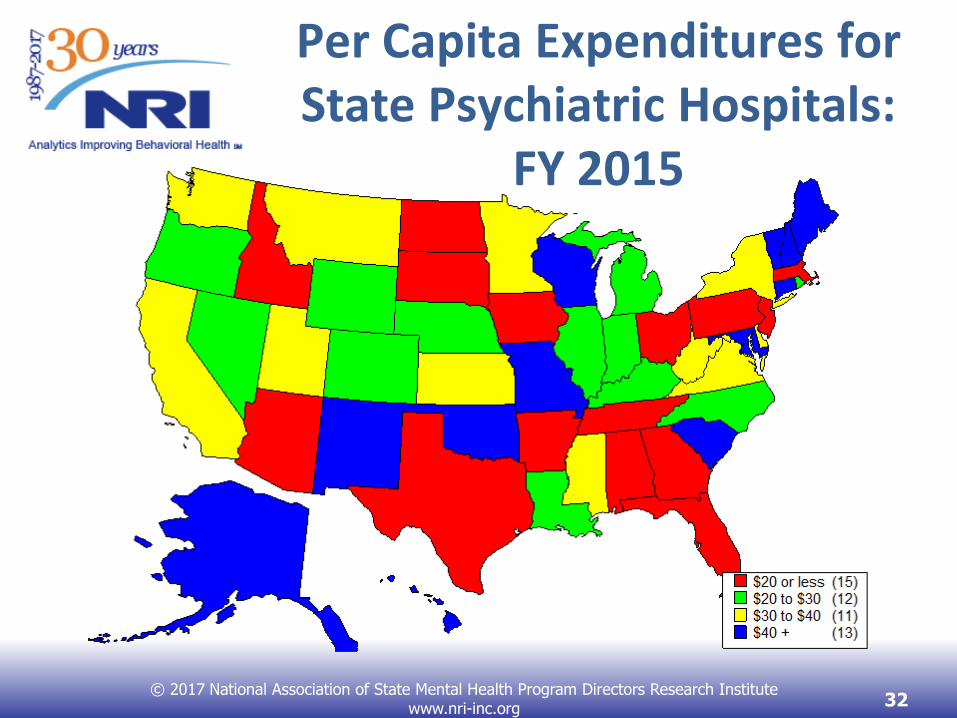
Per Capita Expenditures for State Psychiatric Hospitals:
FY 2015
© 2017 National Association of State Mental Health Program Directors Research Institute www.nri-inc.org 32
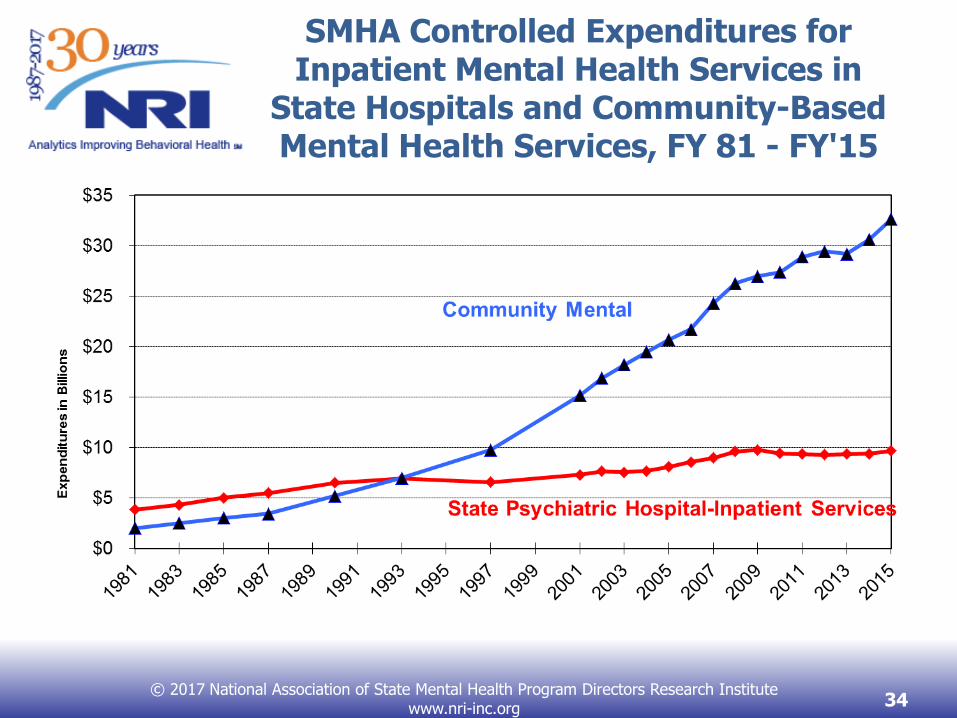
SMHA Controlled Expenditures for Inpatient Mental Health Services in
State Hospitals and Community-Based Mental Health Services, FY 81 - FY'15
© 2017 National Association of State Mental Health Program Directors Research Institute www.nri-inc.org 34
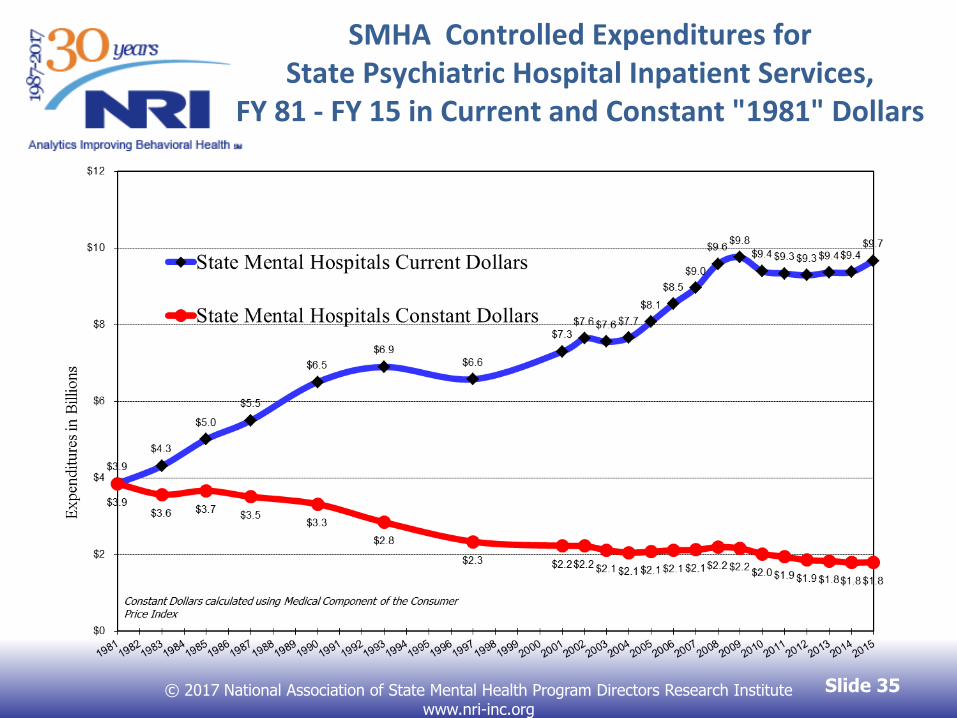
SMHA Controlled Expenditures for State Psychiatric Hospital Inpatient Services,
FY 81 - FY 15 in Current and Constant "1981" Dollars
Slide 35© 2017 National Association of State Mental Health Program Directors Research Institute www.nri-inc.org
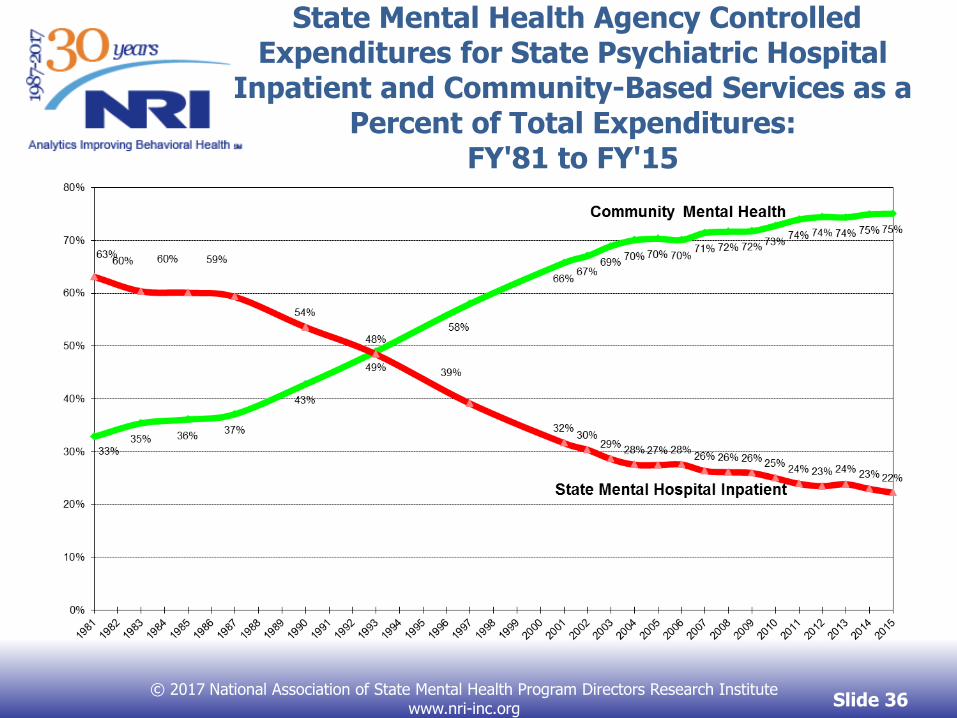
State Mental Health Agency Controlled Expenditures for State Psychiatric Hospital
Inpatient and Community-Based Services as a Percent of Total Expenditures:
FY'81 to FY'15
Slide 36© 2017 National Association of State Mental Health Program Directors Research Institute
www.nri-inc.org
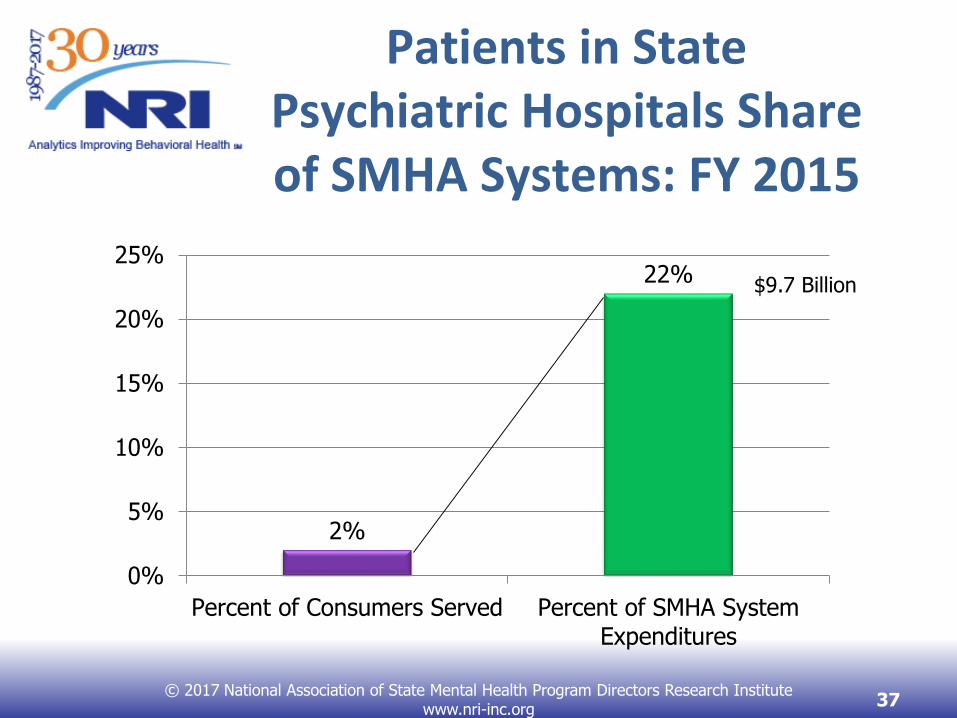
Patients in State Psychiatric Hospitals Share of SMHA Systems: FY 2015
2%
22%
0%
5%
10%
15%
20%
25%
Percent of Consumers Served Percent of SMHA SystemExpenditures
© 2017 National Association of State Mental Health Program Directors Research Institute www.nri-inc.org
37
$9.7 Billion
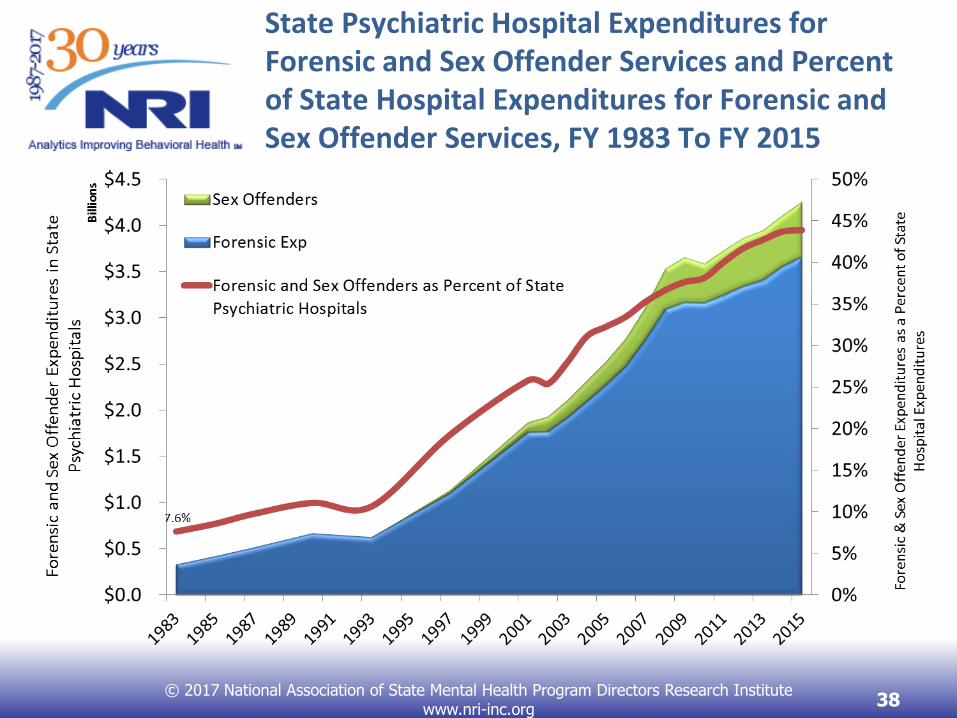
State Psychiatric Hospital Expenditures for Forensic and Sex Offender Services and Percent of State Hospital Expenditures for Forensic and Sex Offender Services, FY 1983 To FY 2015
© 2017 National Association of State Mental Health Program Directors Research Institute www.nri-inc.org
38
© 2017 National Association of State Mental Health Program Directors Research Institute www.nri-inc.org
39