Embed Size (px)
Citation preview

93
Trends in the Irish Credit and Deposits Markets: A New PresentationMartin O’Brien and Jean Goggin*
Abstract
This paper introduces the new Trends in Business Credit and Deposits and Trends in Personal Credit and Deposits statistical series first published by the Central Bank of Ireland in June 2011. An overview of the key concepts and the benefits of the new presentation are given, as well as exploring developments in the data itself from 2003 to the present. New features, such as comprehensive flows analysis, data on lending to small and medium sized enterprises, and further disaggregation of mortgage market activity, are discussed in detail.
* The authors are Economists in the Bank’s Statistics Division. The views expressed are solely the views of the authors and are not necessarily those held by the Central Bank of Ireland or the European System of Central Banks. The authors would like to acknowledge the helpful comments of Aisling Menton, Joe McNeill and Maurice McGuire.
94 Quarterly Bulletin 04 / October 11Trends in the Irish Credit and Deposits Markets: A New Presentation
Section 1: Introduction
Tracking the interaction between the banking system and the rest of the economy is an important aspect of economic analysis. A particular area of interest is the levels of bank finance being accessed by the non-financial sectors of the economy, both businesses and private households, as well as the levels of financial assets, in the form of deposits, being placed by these non-financial sectors in the resident banking system. The Central Bank of Ireland has for many years provided statistics that allow for such analysis to be undertaken1. In June 2011, two comprehensive new data series were published in this area, Trends in Business Credit and Deposits and Trends in Personal Credit and Deposits (the Trends series). The purpose of this paper is to introduce these new series, explaining the benefits of the new presentation from both a methodological and analytical perspective.
The new series adopts a number of the methodological improvements introduced by the Central Bank in 2010 for the Money and Banking Statistics (McElligott and O’Brien, 2011). These include more meaningful measures for the underlying flow of bank credit and deposits, and resulting rates of change in these instruments over time, which allow for more accurate comparison with other economic indicators.
A full overview of the coverage, concepts, and benefits of the new series are first discussed in the paper, before turning to developments in the data itself over the period covered, from 2003 to the present. In this latter context, the paper outlines how these data provide a significantly more accurate reflection of the scale of credit growth in the period from 2003 to 2009, and the subsequent decline. Particular attention is paid to developments in credit extended to the property-related sectors of the economy, given the relative share of these sectors in total outstanding credit and in the overall economy during the period covered. Furthermore, the paper discusses
in detail some of the new items covered for more recent quarters, such as lending to small and medium sized enterprises (SMEs) and more detailed analysis of the mortgage market by instrument type (tracker mortgages, standard variable rate mortgages, etc.).
Section 2: Coverage and Key Definitions Underpinning the Trends Series2
The Trends series aim to give a comprehensive overview of developments in the bank credit and deposits market in Ireland, broken down by the industry of the banks’ counterparties in these markets, i.e. the industry of the resident banking system’s customers. In moving to the publication of these series, a number of benefits and improvements have been achieved in terms of:
n Accessibility and comparability (data available for download in a workable format).
n Accuracy and market coverage (introduction of flows/transactions and incorporating credit unions in the data).
n Meeting specific data gaps (SME lending and greater mortgage market detail).
The data in the Trends series are consistent with that published on a monthly basis in Money and Banking Statistics. The data are compiled from a suite of information submitted to the Central Bank by all resident credit institutions, i.e. all banks, building societies and credit unions with a physical presence in the Republic of Ireland, irrespective of whether they are licensed by the Central Bank of Ireland or another EEA supervisory authority.
The key difference between Money and Banking Statistics and the Trends series is the definitions underpinning the sectoral breakdown of positions. Money and Banking Statistics use the institutional sector definition, which is based on the classifications provided in the European System of Accounts, 1995 (ESA 95).
1 For example, former Table C8 (All Credit Institutions: Sectoral Distribution of Advances) and Table C9 (Credit Institutions: Sectoral Distribution of Advances and Deposits) of the Statistical Appendix in the Central Bank Quarterly Bulletin.
2 The data and detailed explanatory notes for the Trends series are available at http://www.centralbank.ie/polstats/stats/cmab/Pages/HouseholdCredit.aspx and http://www.centralbank.ie/polstats/stats/cmab/Pages/BusinessCredit.aspx. (Central Bank 2011b, 2011c).
95Quarterly Bulletin 04 / October 11
Classifying counterparties on this basis depends upon the legal characteristics of the counterparty, i.e. what the counterparty is (non-financial corporation, insurance corporation, household, etc.). In contrast, the counterparty breakdown provided in the Trends series is derived from the functional NACE Rev.23 classification of economic activity, i.e. what the counterparty does (e.g. agriculture, manufacturing, construction, business services, etc.).
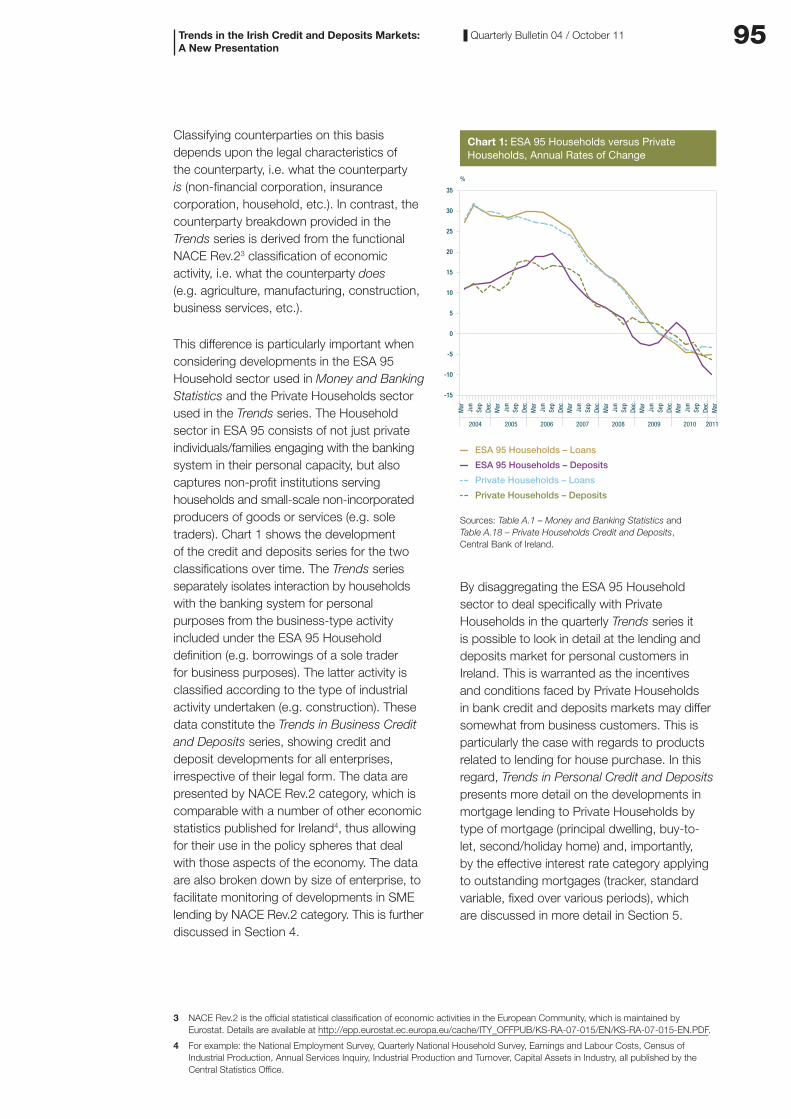
This difference is particularly important when considering developments in the ESA 95 Household sector used in Money and Banking Statistics and the Private Households sector used in the Trends series. The Household sector in ESA 95 consists of not just private individuals/families engaging with the banking system in their personal capacity, but also captures non-profit institutions serving households and small-scale non-incorporated producers of goods or services (e.g. sole traders). Chart 1 shows the development of the credit and deposits series for the two classifications over time. The Trends series separately isolates interaction by households with the banking system for personal purposes from the business-type activity included under the ESA 95 Household definition (e.g. borrowings of a sole trader for business purposes). The latter activity is classified according to the type of industrial activity undertaken (e.g. construction). These data constitute the Trends in Business Credit and Deposits series, showing credit and deposit developments for all enterprises, irrespective of their legal form. The data are presented by NACE Rev.2 category, which is comparable with a number of other economic statistics published for Ireland4, thus allowing for their use in the policy spheres that deal with those aspects of the economy. The data are also broken down by size of enterprise, to facilitate monitoring of developments in SME lending by NACE Rev.2 category. This is further discussed in Section 4.
Chart 1: ESA 95 Households versus Private Households, Annual Rates of Change
-15
-10
-5
0
5
10
15
20
25
30
35
ESA 95 Households – Loans
ESA 95 Households – Deposits
Private Households – Loans
Private Households – Deposits
20082007200620052004
Mar
Jun
Sep
Dec
Mar
Jun
Sep
Dec
Mar
Jun
Sep
Dec
Mar
Jun
Sep
Dec
Mar
Jun
Sep
Dec
Mar
Jun
Sep
Dec
Mar
Jun
Sep
Dec
Mar
2009 2010 2011
%
Sources: Table A.1 – Money and Banking Statistics and Table A.18 – Private Households Credit and Deposits, Central Bank of Ireland.
By disaggregating the ESA 95 Household sector to deal specifically with Private Households in the quarterly Trends series it is possible to look in detail at the lending and deposits market for personal customers in Ireland. This is warranted as the incentives and conditions faced by Private Households in bank credit and deposits markets may differ somewhat from business customers. This is particularly the case with regards to products related to lending for house purchase. In this regard, Trends in Personal Credit and Deposits presents more detail on the developments in mortgage lending to Private Households by type of mortgage (principal dwelling, buy-to-let, second/holiday home) and, importantly, by the effective interest rate category applying to outstanding mortgages (tracker, standard variable, fixed over various periods), which are discussed in more detail in Section 5.
Trends in the Irish Credit and Deposits Markets: A New Presentation
3 NACE Rev.2 is the official statistical classification of economic activities in the European Community, which is maintained by Eurostat. Details are available at http://epp.eurostat.ec.europa.eu/cache/ITY_OFFPUB/KS-RA-07-015/EN/KS-RA-07-015-EN.PDF.
4 For example: the National Employment Survey, Quarterly National Household Survey, Earnings and Labour Costs, Census of Industrial Production, Annual Services Inquiry, Industrial Production and Turnover, Capital Assets in Industry, all published by the Central Statistics Office.
96 Quarterly Bulletin 04 / October 11
Section 3: Conceptual and Methodological Benefits of the Trends Series
Apart from the coverage and definitional issues discussed above, the Trends series have been introduced to address a number of conceptual and methodological issues that restricted the use and meaningful interpretation of previously available data. These issues are similar to those addressed by the introduction of Money and Banking Statistics in 2010, and relate to the impact of non-transaction or underlying business related factors on the reported stock of credit and deposits from one period to another.
To understand credit and deposits market conditions within an economy, it is necessary to separate period-on-period changes in the on-balance sheet outstanding amounts as reported by credit institutions between those changes arising from underlying business transactions and those due to other factors. In particular, on-balance sheet items, for example credit (loans and securities held) and deposits, can change from quarter to quarter due to a number of factors:
n New lending/repayments (true transaction, or underlying business related events).
n Revaluation changes (write-downs/write-offs and changes in the carrying value of securities, where those securities are subject to fair-value reporting).
n Reclassifications (correcting for previous errors in the classification of loans/deposits) and changes in the reporting population.
n Securitisation and other loan transfers [e.g. transfers to the National Asset Management Agency (NAMA)].
n Exchange rate movements, which change the book value of non-euro denominated credit or deposits when reported in euro.
Developments in credit and deposits markets are best understood by examining underlying transactions (the derivation of which are described in Box 1), rather than comparing changes in outstanding amounts over time. This is especially true when examining developments in the past three to four years, when non-transaction effects are particularly
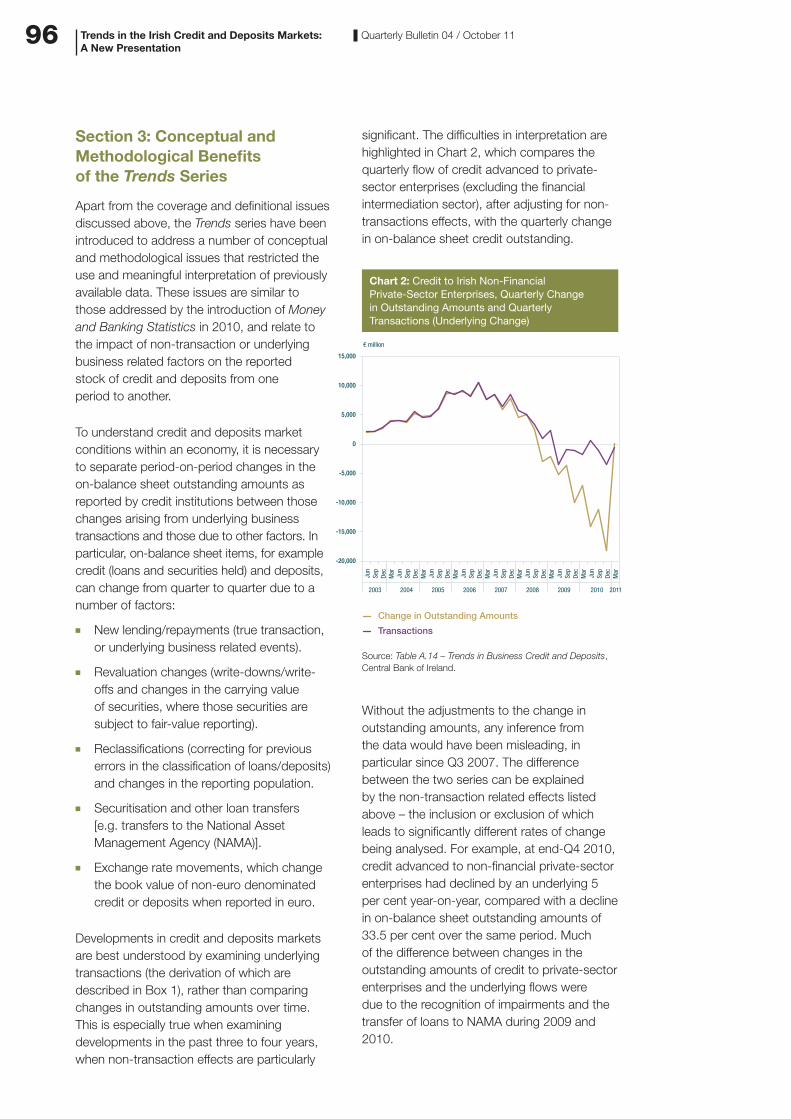
significant. The difficulties in interpretation are highlighted in Chart 2, which compares the quarterly flow of credit advanced to private-sector enterprises (excluding the financial intermediation sector), after adjusting for non-transactions effects, with the quarterly change in on-balance sheet credit outstanding.
Chart 2: Credit to Irish Non-Financial Private-Sector Enterprises, Quarterly Change in Outstanding Amounts and Quarterly Transactions (Underlying Change)
-20,000
-15,000
-10,000
-5,000
0
5,000
10,000
15,000
Change in Outstanding Amounts
Transactions
200820072006200520042003
Jun
Sep
Dec
Mar
Jun
Sep
Dec
Mar
Jun
Sep
Dec
Mar
Jun
Sep
Dec
Mar
Jun
Sep
Dec
Mar
Jun
Sep
Dec
Mar
Jun
Sep
Dec
Mar
Jun
Sep
Dec
Mar
2009 2010 2011
€ million
Source: Table A.14 – Trends in Business Credit and Deposits, Central Bank of Ireland.
Without the adjustments to the change in outstanding amounts, any inference from the data would have been misleading, in particular since Q3 2007. The difference between the two series can be explained by the non-transaction related effects listed above – the inclusion or exclusion of which leads to significantly different rates of change being analysed. For example, at end-Q4 2010, credit advanced to non-financial private-sector enterprises had declined by an underlying 5 per cent year-on-year, compared with a decline in on-balance sheet outstanding amounts of 33.5 per cent over the same period. Much of the difference between changes in the outstanding amounts of credit to private-sector enterprises and the underlying flows were due to the recognition of impairments and the transfer of loans to NAMA during 2009 and 2010.
Trends in the Irish Credit and Deposits Markets: A New Presentation
97Quarterly Bulletin 04 / October 11
Excluding the non-transaction changes is, therefore, essential to interpreting the underlying flows of credit to the real economy. Similarly, underlying trends in deposits can be distorted by reclassifications or exchange-rate movements. The presentation of data in the Trends series allows for accurate flows analysis. The tables published present underlying transactions, as well as annual rates of change in the credit and deposits series based on these transactions. The methodology and formulae used to compile the growth rates are discussed in Box 1.
Section 4: Trends in Business Credit
In this section we discuss the developments in credit advanced to, and deposits received from Irish private-sector enterprises, as published in Trends in Business Credit and Deposits. Our analysis will focus on the relative importance of developments for the non-financial sectors of the economy (i.e. excluding financial intermediation), as this allows for more definitive analysis on the impact of bank finance on the real economy. In addition to this, retained securitisations and the holdings of NAMA bonds, which are reflected in the growth of credit advanced to the financial intermediation sector, reflect to a greater extent issues related to bank funding, as opposed to financing being made available to the real economy. Even within the non-financial sectors of the economy the experience will be heterogeneous, given the diverse financing and liquidity structures across the various goods and services industries (ECB, 2010).
Trends in the Irish Credit and Deposits Markets: A New Presentation
BOX 1: Transactions and Growth Rates in the Trends Series
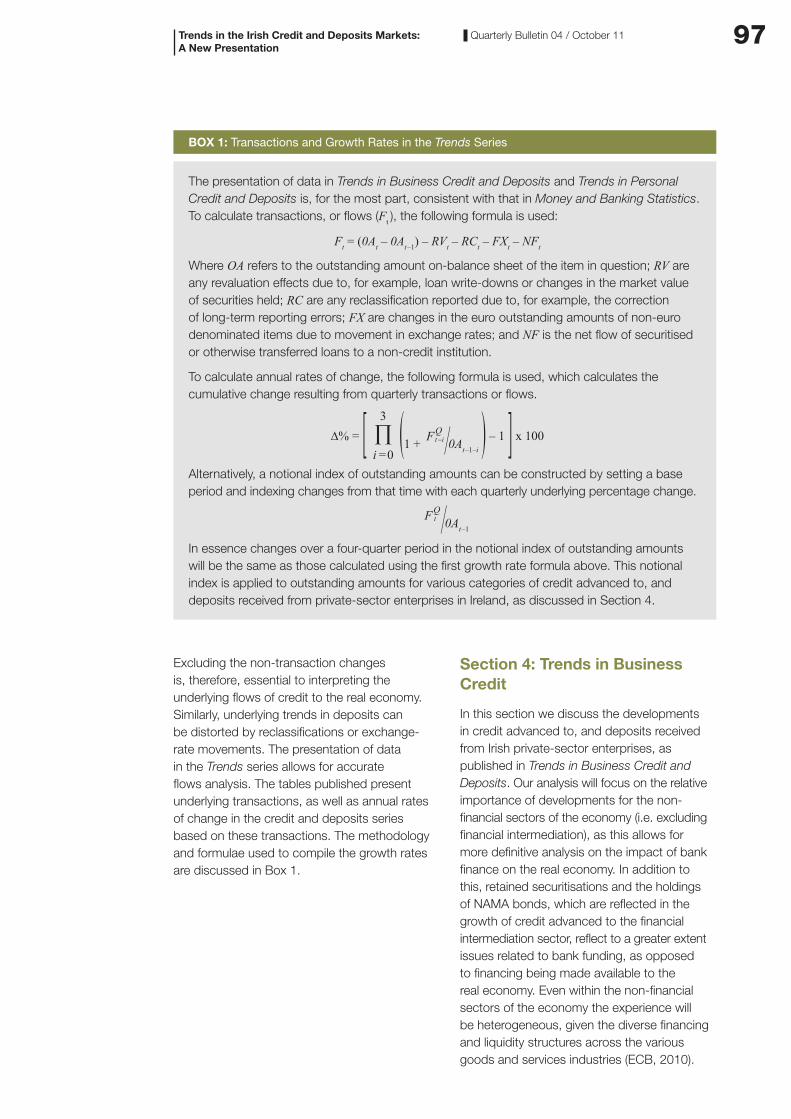
The presentation of data in Trends in Business Credit and Deposits and Trends in Personal Credit and Deposits is, for the most part, consistent with that in Money and Banking Statistics. To calculate transactions, or flows (Ft ), the following formula is used:
Ft = (0At – 0At–1) – RVt – RCt – FXt – NFt
Where OA refers to the outstanding amount on-balance sheet of the item in question; RV are any revaluation effects due to, for example, loan write-downs or changes in the market value of securities held; RC are any reclassification reported due to, for example, the correction of long-term reporting errors; FX are changes in the euro outstanding amounts of non-euro denominated items due to movement in exchange rates; and NF is the net flow of securitised or otherwise transferred loans to a non-credit institution.
To calculate annual rates of change, the following formula is used, which calculates the cumulative change resulting from quarterly transactions or flows.
∆% = [ ∏3
i =0 (1 + FQ
t –i ⁄0At–1–i ) – 1 ] x 100
Alternatively, a notional index of outstanding amounts can be constructed by setting a base period and indexing changes from that time with each quarterly underlying percentage change.
FQt ⁄0At–1
In essence changes over a four-quarter period in the notional index of outstanding amounts will be the same as those calculated using the first growth rate formula above. This notional index is applied to outstanding amounts for various categories of credit advanced to, and deposits received from private-sector enterprises in Ireland, as discussed in Section 4.
98 Quarterly Bulletin 04 / October 11
Chart 3: Credit Advanced to Non-Financial Private-Sector Enterprises, Notional Index and Annual Rates of Change
0
100
200
300
400
500
600
700
-10
0
10
20
30
40
50
60
70
Total (Index)
Non-Property Related Sectors (Index)
Property Related Sectors (Index)
Total (% Change RHS)
Non-Property Related Sectors (% Change RHS)
Property Related Sectors (% Change RHS)
Index, Mar-03=100 %
200820072006200520042003
Mar
Jun
Sep
Dec
Mar
Jun
Sep
Dec
Mar
Jun
Sep
Dec
Mar
Jun
Sep
Dec
Mar
Jun
Sep
Dec
Mar
Jun
Sep
Dec
Mar
Jun
Sep
Dec
Mar
Jun
Sep
Dec
Mar
2009 2010 2011
Source: Table A.14 – Trends in Business Credit and Deposits, Central Bank of Ireland.
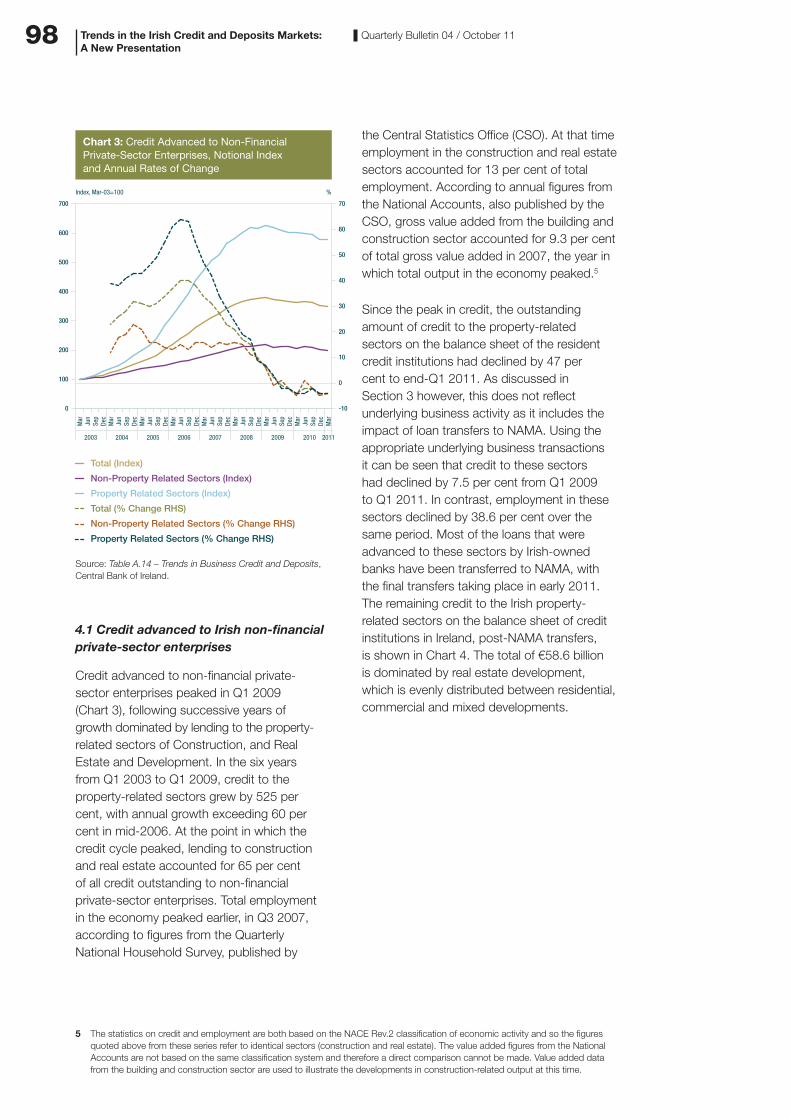
4.1 Credit advanced to Irish non-financial private-sector enterprises
Credit advanced to non-financial private- sector enterprises peaked in Q1 2009 (Chart 3), following successive years of growth dominated by lending to the property-related sectors of Construction, and Real Estate and Development. In the six years from Q1 2003 to Q1 2009, credit to the property-related sectors grew by 525 per cent, with annual growth exceeding 60 per cent in mid-2006. At the point in which the credit cycle peaked, lending to construction and real estate accounted for 65 per cent of all credit outstanding to non-financial private-sector enterprises. Total employment in the economy peaked earlier, in Q3 2007, according to figures from the Quarterly National Household Survey, published by
the Central Statistics Office (CSO). At that time employment in the construction and real estate sectors accounted for 13 per cent of total employment. According to annual figures from the National Accounts, also published by the CSO, gross value added from the building and construction sector accounted for 9.3 per cent of total gross value added in 2007, the year in which total output in the economy peaked.5
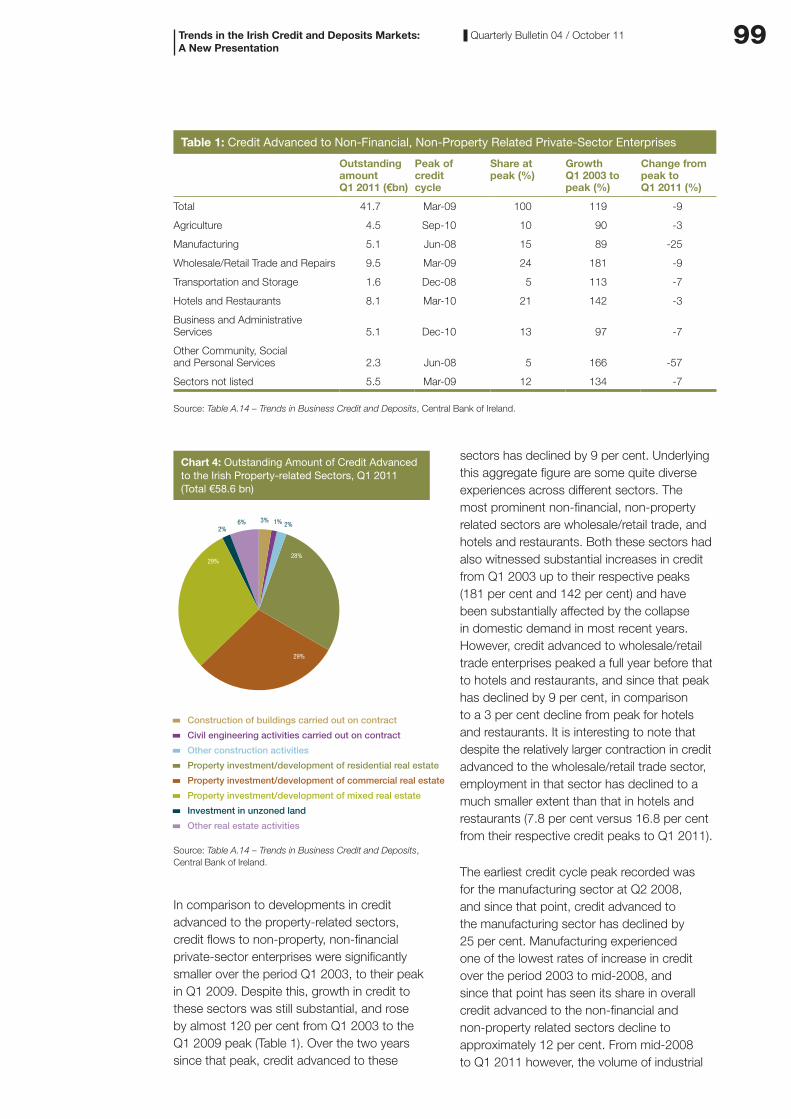
Since the peak in credit, the outstanding amount of credit to the property-related sectors on the balance sheet of the resident credit institutions had declined by 47 per cent to end-Q1 2011. As discussed in Section 3 however, this does not reflect underlying business activity as it includes the impact of loan transfers to NAMA. Using the appropriate underlying business transactions it can be seen that credit to these sectors had declined by 7.5 per cent from Q1 2009 to Q1 2011. In contrast, employment in these sectors declined by 38.6 per cent over the same period. Most of the loans that were advanced to these sectors by Irish-owned banks have been transferred to NAMA, with the final transfers taking place in early 2011. The remaining credit to the Irish property-related sectors on the balance sheet of credit institutions in Ireland, post-NAMA transfers, is shown in Chart 4. The total of €58.6 billion is dominated by real estate development, which is evenly distributed between residential, commercial and mixed developments.
Trends in the Irish Credit and Deposits Markets: A New Presentation
5 The statistics on credit and employment are both based on the NACE Rev.2 classification of economic activity and so the figures quoted above from these series refer to identical sectors (construction and real estate). The value added figures from the National Accounts are not based on the same classification system and therefore a direct comparison cannot be made. Value added data from the building and construction sector are used to illustrate the developments in construction-related output at this time.
99Quarterly Bulletin 04 / October 11
Chart 4: Outstanding Amount of Credit Advanced to the Irish Property-related Sectors, Q1 2011 (Total €58.6 bn)
Construction of buildings carried out on contract
Other construction activities
Property investment/development of residential real estate
Property investment/development of commercial real estate
Property investment/development of mixed real estate
Investment in unzoned land
Other real estate activities
Civil engineering activities carried out on contract
3%6%2%
1% 2%
28%
29%
29%
Source: Table A.14 – Trends in Business Credit and Deposits, Central Bank of Ireland.
In comparison to developments in credit advanced to the property-related sectors, credit flows to non-property, non-financial private-sector enterprises were significantly smaller over the period Q1 2003, to their peak in Q1 2009. Despite this, growth in credit to these sectors was still substantial, and rose by almost 120 per cent from Q1 2003 to the Q1 2009 peak (Table 1). Over the two years since that peak, credit advanced to these
sectors has declined by 9 per cent. Underlying this aggregate figure are some quite diverse experiences across different sectors. The most prominent non-financial, non-property related sectors are wholesale/retail trade, and hotels and restaurants. Both these sectors had also witnessed substantial increases in credit from Q1 2003 up to their respective peaks (181 per cent and 142 per cent) and have been substantially affected by the collapse in domestic demand in most recent years. However, credit advanced to wholesale/retail trade enterprises peaked a full year before that to hotels and restaurants, and since that peak has declined by 9 per cent, in comparison to a 3 per cent decline from peak for hotels and restaurants. It is interesting to note that despite the relatively larger contraction in credit advanced to the wholesale/retail trade sector, employment in that sector has declined to a much smaller extent than that in hotels and restaurants (7.8 per cent versus 16.8 per cent from their respective credit peaks to Q1 2011).
The earliest credit cycle peak recorded was for the manufacturing sector at Q2 2008, and since that point, credit advanced to the manufacturing sector has declined by 25 per cent. Manufacturing experienced one of the lowest rates of increase in credit over the period 2003 to mid-2008, and since that point has seen its share in overall credit advanced to the non-financial and non-property related sectors decline to approximately 12 per cent. From mid-2008 to Q1 2011 however, the volume of industrial
Trends in the Irish Credit and Deposits Markets: A New Presentation
Table 1: Credit Advanced to Non-Financial, Non-Property Related Private-Sector Enterprises
Outstanding amount Q1 2011 (€bn)
Peak of credit cycle
Share at peak (%)
Growth Q1 2003 to peak (%)
Change from peak to Q1 2011 (%)
Total 41.7 Mar-09 100 119 -9
Agriculture 4.5 Sep-10 10 90 -3
Manufacturing 5.1 Jun-08 15 89 -25
Wholesale/Retail Trade and Repairs 9.5 Mar-09 24 181 -9
Transportation and Storage 1.6 Dec-08 5 113 -7
Hotels and Restaurants 8.1 Mar-10 21 142 -3
Business and Administrative Services 5.1 Dec-10 13 97 -7
Other Community, Social and Personal Services 2.3 Jun-08 5 166 -57
Sectors not listed 5.5 Mar-09 12 134 -7
Source: Table A.14 – Trends in Business Credit and Deposits, Central Bank of Ireland.
100 Quarterly Bulletin 04 / October 11
production in manufacturing has increased by approximately 5 per cent, and manufacturing’s share in non-financial, non-property related employment has remained relatively stable around 18.5 per cent. The divergence between bank credit flows and the overall output of the manufacturing sector reflects, among other things, the diverse funding sources for the Irish resident manufacturing sector, which would not necessarily rely only on the banking system in Ireland for funding. This would be particularly the case for multi-national enterprises in the sector which are significant in terms of foreign direct investment and which have wider access to international financial markets. Indigenous firms, of all sectors, are more likely to be reliant on the resident banking system for financing requirements. This is particularly the case for SMEs.
4.2 Credit advanced to Irish SMEs
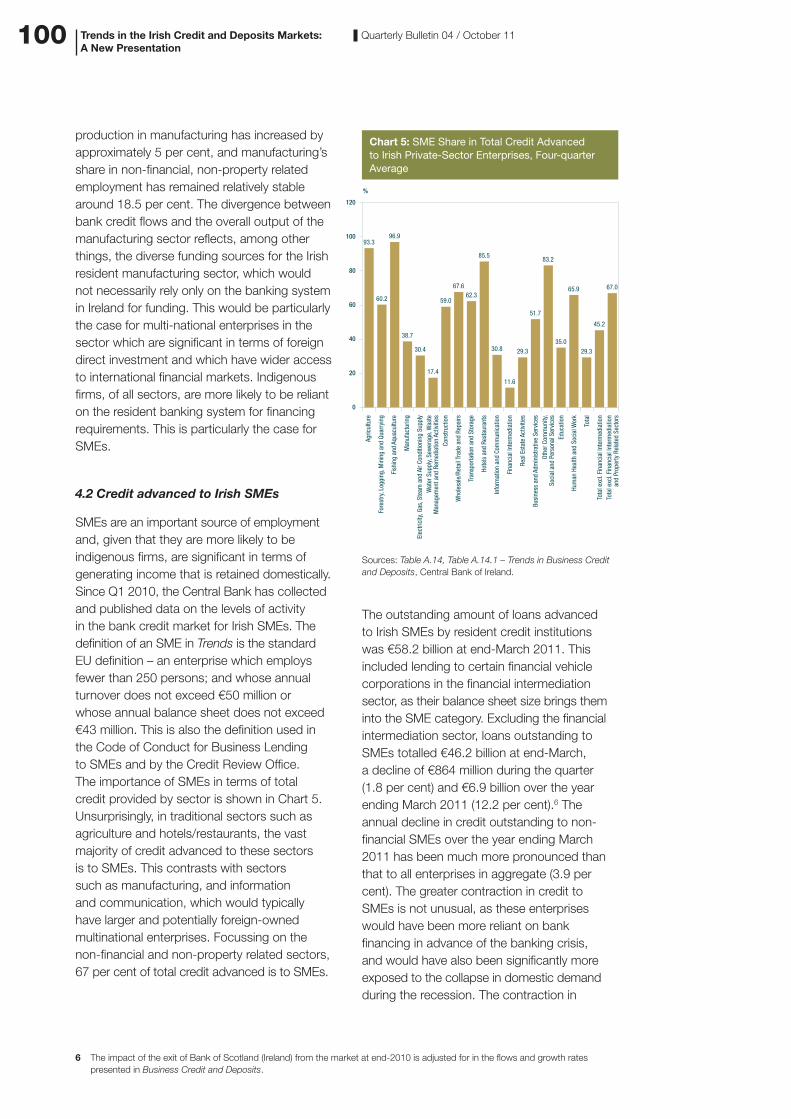
SMEs are an important source of employment and, given that they are more likely to be indigenous firms, are significant in terms of generating income that is retained domestically. Since Q1 2010, the Central Bank has collected and published data on the levels of activity in the bank credit market for Irish SMEs. The definition of an SME in Trends is the standard EU definition – an enterprise which employs fewer than 250 persons; and whose annual turnover does not exceed €50 million or whose annual balance sheet does not exceed €43 million. This is also the definition used in the Code of Conduct for Business Lending to SMEs and by the Credit Review Office. The importance of SMEs in terms of total credit provided by sector is shown in Chart 5. Unsurprisingly, in traditional sectors such as agriculture and hotels/restaurants, the vast majority of credit advanced to these sectors is to SMEs. This contrasts with sectors such as manufacturing, and information and communication, which would typically have larger and potentially foreign-owned multinational enterprises. Focussing on the non-financial and non-property related sectors, 67 per cent of total credit advanced is to SMEs.
Chart 5: SME Share in Total Credit Advanced to Irish Private-Sector Enterprises, Four-quarter Average
0
20
40
60
80
100
120
%
Agric
ultu
re
Fore
stry
, Log
ging
, Min
ing
and
Quar
ryin
g
Fish
ing
and
Aqua
cultu
re
Elec
trici
ty, G
as, S
team
and
Air
Cond
ition
ing
Supp
lyW
ater
Sup
ply,
Sew
erag
e, W
aste
Man
agem
ent a
nd R
emed
iatio
n Ac
tiviti
esCo
nstru
ctio
n
Who
lesa
le/R
etai
l Tra
de a
nd R
epai
rs
Tran
spor
tatio
n an
d St
orag
e
Hote
ls a
nd R
esta
uran
ts
Tota
l exc
l. Fi
nanc
ial I
nter
med
iatio
nan
d Pr
oper
ty R
elat
ed S
ecto
rs
Tota
l exc
l. Fi
nanc
ial I
nter
med
iatio
n
Tota
l
Hum
an H
ealth
and
Soc
ial W
ork
Educ
atio
n
Othe
r Com
mun
ity,
Soci
al a
nd P
erso
nal S
ervi
ces
Busi
ness
and
Adm
inis
trativ
e Se
rvic
es
Real
Est
ate
Activ
ities
Fina
ncia
l Int
erm
edia
tion
Info
rmat
ion
and
Com
mun
icat
ion
Man
ufac
turin
g
93.396.9
60.2
38.7
30.4
17.4
59.0
67.662.3
85.5
30.8
11.6
29.3
51.7
83.2
35.0
65.9
29.3
45.2
67.0
Sources: Table A.14, Table A.14.1 – Trends in Business Credit and Deposits, Central Bank of Ireland.
The outstanding amount of loans advanced to Irish SMEs by resident credit institutions was €58.2 billion at end-March 2011. This included lending to certain financial vehicle corporations in the financial intermediation sector, as their balance sheet size brings them into the SME category. Excluding the financial intermediation sector, loans outstanding to SMEs totalled €46.2 billion at end-March, a decline of €864 million during the quarter (1.8 per cent) and €6.9 billion over the year ending March 2011 (12.2 per cent).6 The annual decline in credit outstanding to non-financial SMEs over the year ending March 2011 has been much more pronounced than that to all enterprises in aggregate (3.9 per cent). The greater contraction in credit to SMEs is not unusual, as these enterprises would have been more reliant on bank financing in advance of the banking crisis, and would have also been significantly more exposed to the collapse in domestic demand during the recession. The contraction in
Trends in the Irish Credit and Deposits Markets: A New Presentation
6 The impact of the exit of Bank of Scotland (Ireland) from the market at end-2010 is adjusted for in the flows and growth rates presented in Business Credit and Deposits.
101Quarterly Bulletin 04 / October 11
credit reflects both demand and supply-side developments, as lenders apply tighter credit standards. From a policy perspective, it is essential that viable demand for credit from SMEs is not constrained by supply-side problems and this is among the objectives in the restructuring of the domestically-controlled banking system.
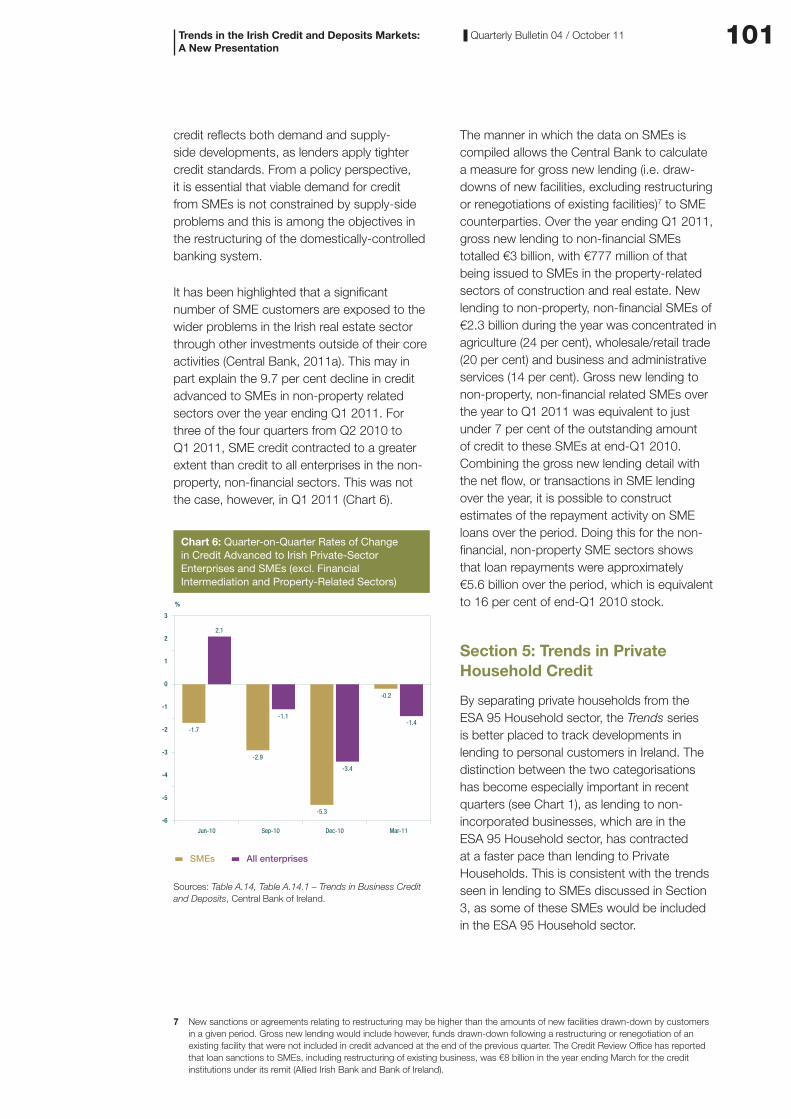
It has been highlighted that a significant number of SME customers are exposed to the wider problems in the Irish real estate sector through other investments outside of their core activities (Central Bank, 2011a). This may in part explain the 9.7 per cent decline in credit advanced to SMEs in non-property related sectors over the year ending Q1 2011. For three of the four quarters from Q2 2010 to Q1 2011, SME credit contracted to a greater extent than credit to all enterprises in the non-property, non-financial sectors. This was not the case, however, in Q1 2011 (Chart 6).
Chart 6: Quarter-on-Quarter Rates of Change in Credit Advanced to Irish Private-Sector Enterprises and SMEs (excl. Financial Intermediation and Property-Related Sectors)
-6
-5
-4
-3
-2
-1
0
1
2
3
Mar-11Dec-10Sep-10Jun-10
%
SMEs All enterprises
2.1
-1.7
-2.9
-1.1
-5.3
-3.4
-0.2
-1.4
Sources: Table A.14, Table A.14.1 – Trends in Business Credit and Deposits, Central Bank of Ireland.
The manner in which the data on SMEs is compiled allows the Central Bank to calculate a measure for gross new lending (i.e. draw-downs of new facilities, excluding restructuring or renegotiations of existing facilities)7 to SME counterparties. Over the year ending Q1 2011, gross new lending to non-financial SMEs totalled €3 billion, with €777 million of that being issued to SMEs in the property-related sectors of construction and real estate. New lending to non-property, non-financial SMEs of €2.3 billion during the year was concentrated in agriculture (24 per cent), wholesale/retail trade (20 per cent) and business and administrative services (14 per cent). Gross new lending to non-property, non-financial related SMEs over the year to Q1 2011 was equivalent to just under 7 per cent of the outstanding amount of credit to these SMEs at end-Q1 2010. Combining the gross new lending detail with the net flow, or transactions in SME lending over the year, it is possible to construct estimates of the repayment activity on SME loans over the period. Doing this for the non-financial, non-property SME sectors shows that loan repayments were approximately €5.6 billion over the period, which is equivalent to 16 per cent of end-Q1 2010 stock.
Section 5: Trends in Private Household Credit
By separating private households from the ESA 95 Household sector, the Trends series is better placed to track developments in lending to personal customers in Ireland. The distinction between the two categorisations has become especially important in recent quarters (see Chart 1), as lending to non-incorporated businesses, which are in the ESA 95 Household sector, has contracted at a faster pace than lending to Private Households. This is consistent with the trends seen in lending to SMEs discussed in Section 3, as some of these SMEs would be included in the ESA 95 Household sector.
Trends in the Irish Credit and Deposits Markets: A New Presentation
7 New sanctions or agreements relating to restructuring may be higher than the amounts of new facilities drawn-down by customers in a given period. Gross new lending would include however, funds drawn-down following a restructuring or renegotiation of an existing facility that were not included in credit advanced at the end of the previous quarter. The Credit Review Office has reported that loan sanctions to SMEs, including restructuring of existing business, was €8 billion in the year ending March for the credit institutions under its remit (Allied Irish Bank and Bank of Ireland).
102 Quarterly Bulletin 04 / October 11
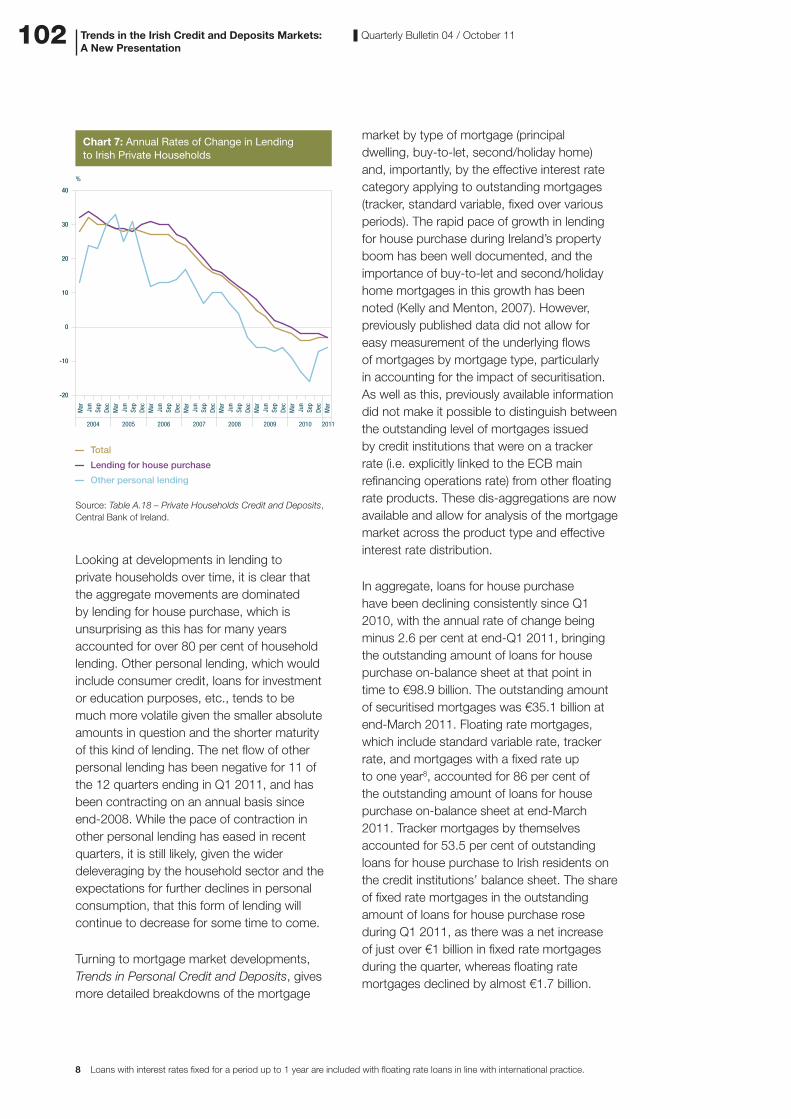
Chart 7: Annual Rates of Change in Lending to Irish Private Households
-20
-10
0
10
20
30
40
Total
Lending for house purchase
Other personal lending
%
20082007200620052004
Mar
Jun
Sep
Dec
Mar
Jun
Sep
Dec
Mar
Jun
Sep
Dec
Mar
Jun
Sep
Dec
Mar
Jun
Sep
Dec
Mar
Jun
Sep
Dec
Mar
Jun
Sep
Dec
Mar
2009 2010 2011
Source: Table A.18 – Private Households Credit and Deposits, Central Bank of Ireland.
Looking at developments in lending to private households over time, it is clear that the aggregate movements are dominated by lending for house purchase, which is unsurprising as this has for many years accounted for over 80 per cent of household lending. Other personal lending, which would include consumer credit, loans for investment or education purposes, etc., tends to be much more volatile given the smaller absolute amounts in question and the shorter maturity of this kind of lending. The net flow of other personal lending has been negative for 11 of the 12 quarters ending in Q1 2011, and has been contracting on an annual basis since end-2008. While the pace of contraction in other personal lending has eased in recent quarters, it is still likely, given the wider deleveraging by the household sector and the expectations for further declines in personal consumption, that this form of lending will continue to decrease for some time to come.
Turning to mortgage market developments, Trends in Personal Credit and Deposits, gives more detailed breakdowns of the mortgage
market by type of mortgage (principal dwelling, buy-to-let, second/holiday home) and, importantly, by the effective interest rate category applying to outstanding mortgages (tracker, standard variable, fixed over various periods). The rapid pace of growth in lending for house purchase during Ireland’s property boom has been well documented, and the importance of buy-to-let and second/holiday home mortgages in this growth has been noted (Kelly and Menton, 2007). However, previously published data did not allow for easy measurement of the underlying flows of mortgages by mortgage type, particularly in accounting for the impact of securitisation. As well as this, previously available information did not make it possible to distinguish between the outstanding level of mortgages issued by credit institutions that were on a tracker rate (i.e. explicitly linked to the ECB main refinancing operations rate) from other floating rate products. These dis-aggregations are now available and allow for analysis of the mortgage market across the product type and effective interest rate distribution.
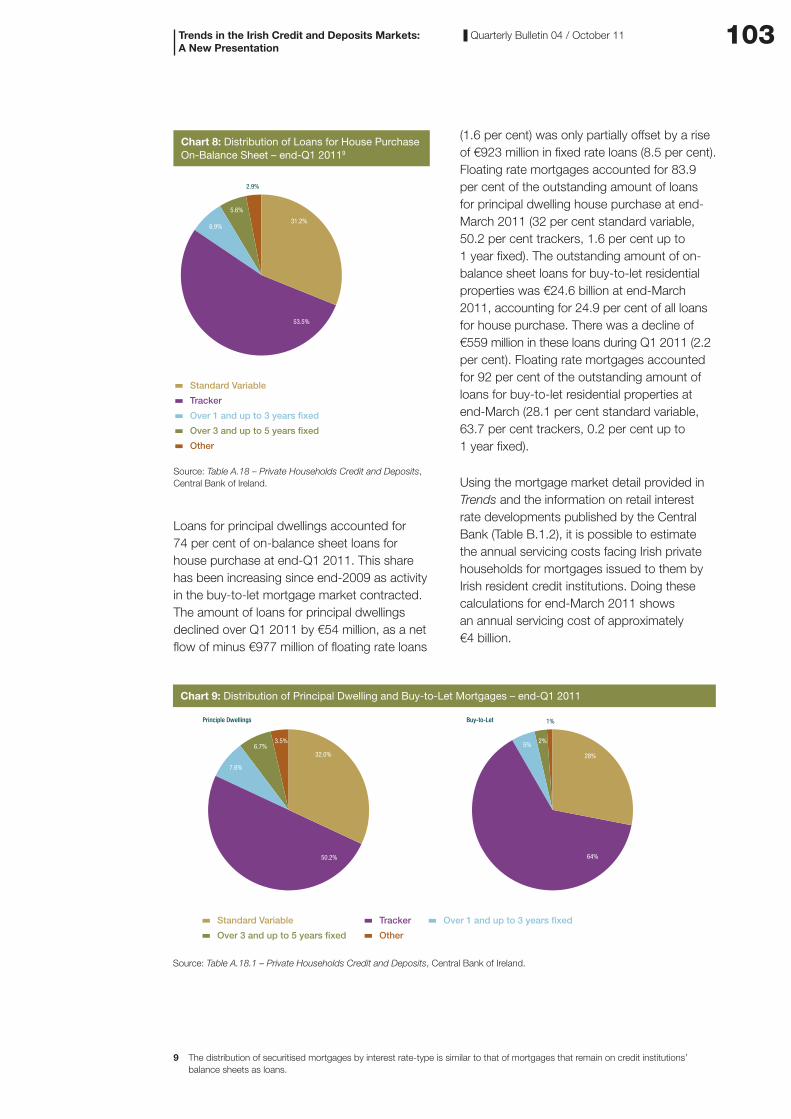
In aggregate, loans for house purchase have been declining consistently since Q1 2010, with the annual rate of change being minus 2.6 per cent at end-Q1 2011, bringing the outstanding amount of loans for house purchase on-balance sheet at that point in time to €98.9 billion. The outstanding amount of securitised mortgages was €35.1 billion at end-March 2011. Floating rate mortgages, which include standard variable rate, tracker rate, and mortgages with a fixed rate up to one year8, accounted for 86 per cent of the outstanding amount of loans for house purchase on-balance sheet at end-March 2011. Tracker mortgages by themselves accounted for 53.5 per cent of outstanding loans for house purchase to Irish residents on the credit institutions’ balance sheet. The share of fixed rate mortgages in the outstanding amount of loans for house purchase rose during Q1 2011, as there was a net increase of just over €1 billion in fixed rate mortgages during the quarter, whereas floating rate mortgages declined by almost €1.7 billion.
Trends in the Irish Credit and Deposits Markets: A New Presentation
8 Loans with interest rates fixed for a period up to 1 year are included with floating rate loans in line with international practice.
103Quarterly Bulletin 04 / October 11
Chart 8: Distribution of Loans for House Purchase On-Balance Sheet – end-Q1 20119
Standard Variable
Over 1 and up to 3 years fixed
Over 3 and up to 5 years fixed
Other
Tracker
2.9%
31.2%
53.5%
6.9%
5.6%
Source: Table A.18 – Private Households Credit and Deposits, Central Bank of Ireland.
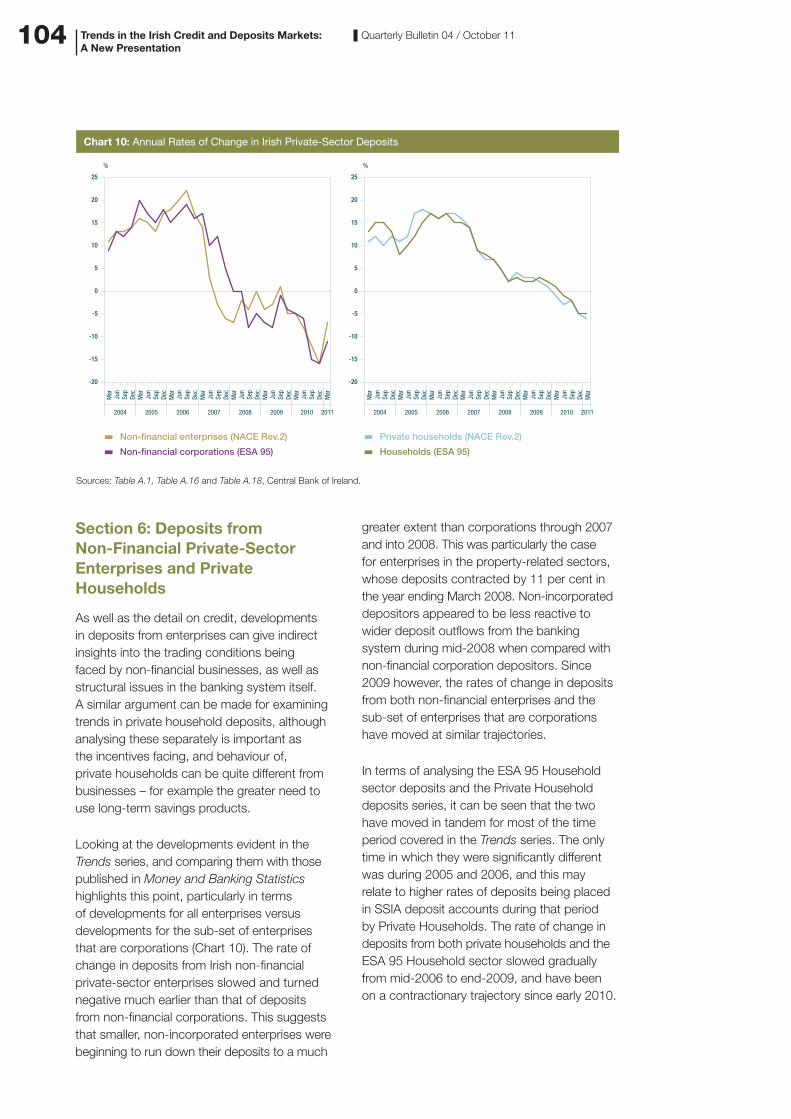
Loans for principal dwellings accounted for 74 per cent of on-balance sheet loans for house purchase at end-Q1 2011. This share has been increasing since end-2009 as activity in the buy-to-let mortgage market contracted. The amount of loans for principal dwellings declined over Q1 2011 by €54 million, as a net flow of minus €977 million of floating rate loans
(1.6 per cent) was only partially offset by a rise of €923 million in fixed rate loans (8.5 per cent). Floating rate mortgages accounted for 83.9 per cent of the outstanding amount of loans for principal dwelling house purchase at end-March 2011 (32 per cent standard variable, 50.2 per cent trackers, 1.6 per cent up to 1 year fixed). The outstanding amount of on-balance sheet loans for buy-to-let residential properties was €24.6 billion at end-March 2011, accounting for 24.9 per cent of all loans for house purchase. There was a decline of €559 million in these loans during Q1 2011 (2.2 per cent). Floating rate mortgages accounted for 92 per cent of the outstanding amount of loans for buy-to-let residential properties at end-March (28.1 per cent standard variable, 63.7 per cent trackers, 0.2 per cent up to 1 year fixed).
Using the mortgage market detail provided in Trends and the information on retail interest rate developments published by the Central Bank (Table B.1.2), it is possible to estimate the annual servicing costs facing Irish private households for mortgages issued to them by Irish resident credit institutions. Doing these calculations for end-March 2011 shows an annual servicing cost of approximately €4 billion.
Trends in the Irish Credit and Deposits Markets: A New Presentation
9 The distribution of securitised mortgages by interest rate-type is similar to that of mortgages that remain on credit institutions’ balance sheets as loans.
Chart 9: Distribution of Principal Dwelling and Buy-to-Let Mortgages – end-Q1 2011
Standard Variable Over 1 and up to 3 years fixed
Over 3 and up to 5 years fixed Other
Tracker
Principle Dwellings Buy-to-Let
32.0%
50.2%
7.6%
6.7%3.5%
1%
28%
64%
5%2%
Source: Table A.18.1 – Private Households Credit and Deposits, Central Bank of Ireland.
104 Quarterly Bulletin 04 / October 11
Section 6: Deposits from Non-Financial Private-Sector Enterprises and Private Households
As well as the detail on credit, developments in deposits from enterprises can give indirect insights into the trading conditions being faced by non-financial businesses, as well as structural issues in the banking system itself. A similar argument can be made for examining trends in private household deposits, although analysing these separately is important as the incentives facing, and behaviour of, private households can be quite different from businesses – for example the greater need to use long-term savings products.
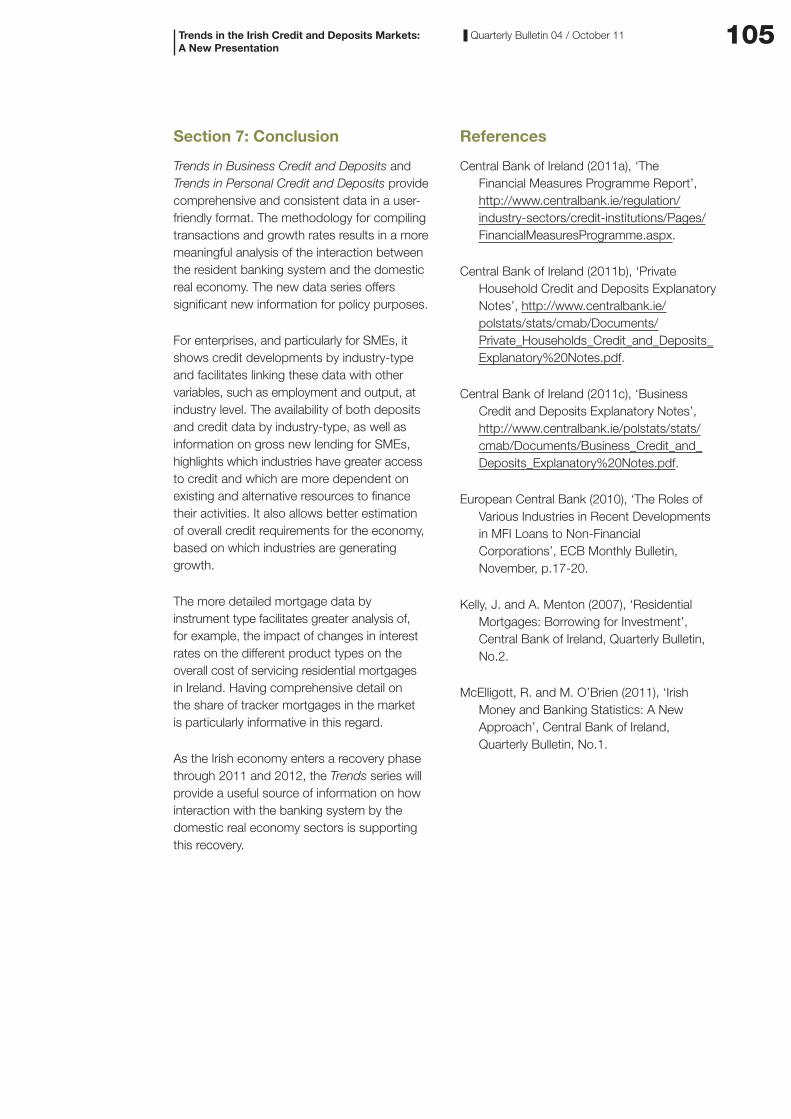
Looking at the developments evident in the Trends series, and comparing them with those published in Money and Banking Statistics highlights this point, particularly in terms of developments for all enterprises versus developments for the sub-set of enterprises that are corporations (Chart 10). The rate of change in deposits from Irish non-financial private-sector enterprises slowed and turned negative much earlier than that of deposits from non-financial corporations. This suggests that smaller, non-incorporated enterprises were beginning to run down their deposits to a much
greater extent than corporations through 2007 and into 2008. This was particularly the case for enterprises in the property-related sectors, whose deposits contracted by 11 per cent in the year ending March 2008. Non-incorporated depositors appeared to be less reactive to wider deposit outflows from the banking system during mid-2008 when compared with non-financial corporation depositors. Since 2009 however, the rates of change in deposits from both non-financial enterprises and the sub-set of enterprises that are corporations have moved at similar trajectories.
In terms of analysing the ESA 95 Household sector deposits and the Private Household deposits series, it can be seen that the two have moved in tandem for most of the time period covered in the Trends series. The only time in which they were significantly different was during 2005 and 2006, and this may relate to higher rates of deposits being placed in SSIA deposit accounts during that period by Private Households. The rate of change in deposits from both private households and the ESA 95 Household sector slowed gradually from mid-2006 to end-2009, and have been on a contractionary trajectory since early 2010.
Trends in the Irish Credit and Deposits Markets: A New Presentation
Chart 10: Annual Rates of Change in Irish Private-Sector Deposits
-20
-15
-10
-5
0
5
10
15
20
25
-20
-15
-10
-5
0
5
10
15
20
25
Non-financial enterprises (NACE Rev.2)
Non-financial corporations (ESA 95)
Private households (NACE Rev.2)
Households (ESA 95)
Mar
Jun
Sep
Dec
Mar
Jun
Sep
Dec
Mar
Jun
Sep
Dec
Mar
Jun
Sep
Dec
Mar
Jun
Sep
Dec
Mar
Jun
Sep
Dec
Mar
Jun
Sep
Dec
Mar
2004 2005 2006 2007 2008 2009 2010 2011
Mar
Jun
Sep
Dec
Mar
Jun
Sep
Dec
Mar
Jun
Sep
Dec
Mar
Jun
Sep
Dec
Mar
Jun
Sep
Dec
Mar
Jun
Sep
Dec
Mar
Jun
Sep
Dec
Mar
2004 2005 2006 2007 2008 2009 2010 2011
% %
Sources: Table A.1, Table A.16 and Table A.18, Central Bank of Ireland.
105Quarterly Bulletin 04 / October 11
Section 7: Conclusion
Trends in Business Credit and Deposits and Trends in Personal Credit and Deposits provide comprehensive and consistent data in a user-friendly format. The methodology for compiling transactions and growth rates results in a more meaningful analysis of the interaction between the resident banking system and the domestic real economy. The new data series offers significant new information for policy purposes.
For enterprises, and particularly for SMEs, it shows credit developments by industry-type and facilitates linking these data with other variables, such as employment and output, at industry level. The availability of both deposits and credit data by industry-type, as well as information on gross new lending for SMEs, highlights which industries have greater access to credit and which are more dependent on existing and alternative resources to finance their activities. It also allows better estimation of overall credit requirements for the economy, based on which industries are generating growth.
The more detailed mortgage data by instrument type facilitates greater analysis of, for example, the impact of changes in interest rates on the different product types on the overall cost of servicing residential mortgages in Ireland. Having comprehensive detail on the share of tracker mortgages in the market is particularly informative in this regard.
As the Irish economy enters a recovery phase through 2011 and 2012, the Trends series will provide a useful source of information on how interaction with the banking system by the domestic real economy sectors is supporting this recovery.
References
Central Bank of Ireland (2011a), ‘The Financial Measures Programme Report’, http://www.centralbank.ie/regulation/industry-sectors/credit-institutions/Pages/FinancialMeasuresProgramme.aspx.
Central Bank of Ireland (2011b), ‘Private Household Credit and Deposits Explanatory Notes’, http://www.centralbank.ie/polstats/stats/cmab/Documents/Private_Households_Credit_and_Deposits_Explanatory%20Notes.pdf.
Central Bank of Ireland (2011c), ‘Business Credit and Deposits Explanatory Notes’, http://www.centralbank.ie/polstats/stats/cmab/Documents/Business_Credit_and_Deposits_Explanatory%20Notes.pdf.
European Central Bank (2010), ‘The Roles of Various Industries in Recent Developments in MFI Loans to Non-Financial Corporations’, ECB Monthly Bulletin, November, p.17-20.
Kelly, J. and A. Menton (2007), ‘Residential Mortgages: Borrowing for Investment’, Central Bank of Ireland, Quarterly Bulletin, No.2.
McElligott, R. and M. O’Brien (2011), ‘Irish Money and Banking Statistics: A New Approach’, Central Bank of Ireland, Quarterly Bulletin, No.1.
Trends in the Irish Credit and Deposits Markets: A New Presentation