Embed Size (px)
Citation preview
SINGAPORE RENAL REGISTRY REPORT NO. 10
TRENDS IN CHRONIC KIDNEY FAILURE STAGE 5 IN SINGAPORE 2012 / 2013
EDITED BY CHOONG HUI LIN AND VATHSALA ANANTHARAMAN
NATIONAL REGISTRY OF DISEASES OFFICE

SINGAPORE RENAL REGISTRY REPORT NO. 10
TRENDS IN CHRONIC KIDNEY FAILURE STAGE 5 IN SINGAPORE 2012 / 2013
All rights reserved. No part of the information may be reproduced in any form and modification of the content will be a violation of the Ministry of Health’s copyright and other intellectual property rights. Application for written permission should be addressed to : Deputy Director National Registry of Diseases Office Health Promotion Board Level 5, 3 Second Hospital Avenue Singapore 168937 Fax : (65) 6536–5307 Email : [email protected] Citation to source is appreciated for content used from this publication. Suggested Source Citation Singapore Renal Registry National Registry of Diseases Office Ministry of Health, Singapore Commercial usage or sale of this work is prohibited.

iii
Foreword
The Singapore Renal Registry has been working very hard to put together data on kidney
disease in Singapore in the past years. The data fulfil a very important function in providing
insight and understanding of the trends and pattern of kidney disease in Singapore,
particular chronic kidney failure, dialysis and renal transplantation.
This report would not have been possible without the support of many people and
organisations, who have submitted, collected, analysed the data, prepared report and
provided guidance. I am grateful to those who have worked hard and long on this report.
There have been many improvements made in this report. Trends on chronic kidney
disease stage 5, mineral metabolism and nutrition have been added. I am confident that
more improvements and refinements will be made with future reports.
I am sure that the report will be invaluable to those who are involved in the care of patients
suffering from chronic kidney disease.
Assoc Prof Evan Lee
Chairman
Singapore Renal Registry
iv
SINGAPORE RENAL ADVISORY COMMITTEE Chairman A/Prof Evan Lee Jon Choon Associate Professor, National University Hospital Secretary A/Prof Lina Choong Hui Lin Senior Consultant, Singapore General Hospital Members Prof A Vathsala Senior Consultant, National University Hospital Dr Adrian Liew Senior Consultant, Tan Tock Seng Hospital
Dr Chow Khuan Yew Deputy Director, National Registry of Diseases Office, HPB
Dr Grace Lee Consultant, Grace Lee Renal & Medical Clinic
Dr Marjorie Foo Wai Yin Senior Consultant, Singapore General Hospital
Dr Terence Kee Yi Shern Senior Consultant, Singapore General Hospital
NATIONAL REGISTRY OF DISEASES OFFICE
Field Administrator Ms Lee Hailen
Registry Coordinators Ms Lynn Khor
Ms Mary Lee
Ms Maureen Ng Siew Eng
Ms Ang Ghim Sin
Dr U Win Nyunt
Ms Siti Zuraidah Bte Jappar
Biostatistician Ms Lim Gek Hsiang
Data Management Mr Augustine Ng
MINISTRY OF HEALTH
We will like to acknowledge the Ministry of Health and Dr Lim Boon Tar Raymond for kindly vetting the report.
Singapore Renal Registry Report No. 10
v
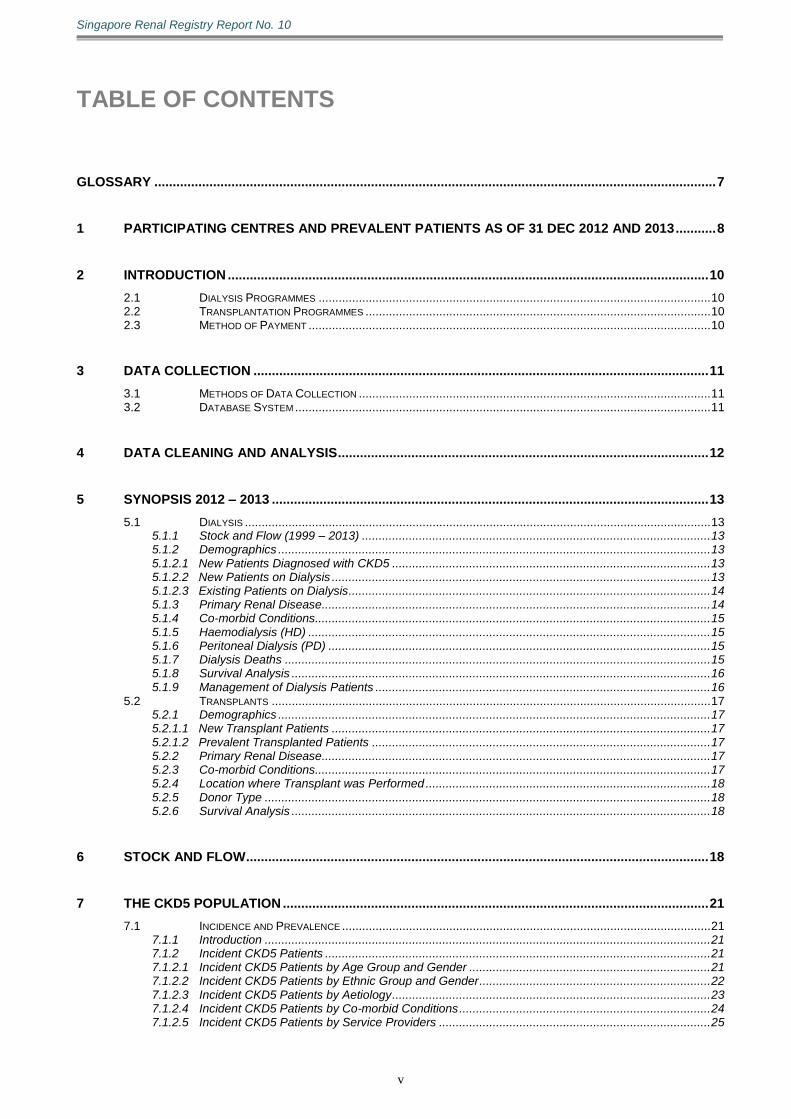
TABLE OF CONTENTS
GLOSSARY ......................................................................................................................................................... 7
1 PARTICIPATING CENTRES AND PREVALENT PATIENTS AS OF 31 DEC 2012 AND 2013 ........... 8
2 INTRODUCTION ................................................................................................................................... 10
2.1 DIALYSIS PROGRAMMES ..................................................................................................................... 10 2.2 TRANSPLANTATION PROGRAMMES ....................................................................................................... 10 2.3 METHOD OF PAYMENT ........................................................................................................................ 10
3 DATA COLLECTION ............................................................................................................................ 11
3.1 METHODS OF DATA COLLECTION ......................................................................................................... 11 3.2 DATABASE SYSTEM ............................................................................................................................ 11
4 DATA CLEANING AND ANALYSIS ..................................................................................................... 12
5 SYNOPSIS 2012 – 2013 ....................................................................................................................... 13
5.1 DIALYSIS ........................................................................................................................................... 13 5.1.1 Stock and Flow (1999 – 2013) ........................................................................................................ 13 5.1.2 Demographics ................................................................................................................................. 13 5.1.2.1 New Patients Diagnosed with CKD5 ............................................................................................... 13 5.1.2.2 New Patients on Dialysis ................................................................................................................. 13 5.1.2.3 Existing Patients on Dialysis ............................................................................................................ 14 5.1.3 Primary Renal Disease .................................................................................................................... 14 5.1.4 Co-morbid Conditions ...................................................................................................................... 15 5.1.5 Haemodialysis (HD) ........................................................................................................................ 15 5.1.6 Peritoneal Dialysis (PD) .................................................................................................................. 15 5.1.7 Dialysis Deaths ............................................................................................................................... 15 5.1.8 Survival Analysis ............................................................................................................................. 16 5.1.9 Management of Dialysis Patients .................................................................................................... 16
5.2 TRANSPLANTS ................................................................................................................................... 17 5.2.1 Demographics ................................................................................................................................. 17 5.2.1.1 New Transplant Patients ................................................................................................................. 17 5.2.1.2 Prevalent Transplanted Patients ..................................................................................................... 17 5.2.2 Primary Renal Disease .................................................................................................................... 17 5.2.3 Co-morbid Conditions ...................................................................................................................... 17 5.2.4 Location where Transplant was Performed ..................................................................................... 18 5.2.5 Donor Type ..................................................................................................................................... 18 5.2.6 Survival Analysis ............................................................................................................................. 18
6 STOCK AND FLOW .............................................................................................................................. 18
7 THE CKD5 POPULATION .................................................................................................................... 21
7.1 INCIDENCE AND PREVALENCE .............................................................................................................. 21 7.1.1 Introduction ..................................................................................................................................... 21 7.1.2 Incident CKD5 Patients ................................................................................................................... 21 7.1.2.1 Incident CKD5 Patients by Age Group and Gender ........................................................................ 21 7.1.2.2 Incident CKD5 Patients by Ethnic Group and Gender ..................................................................... 22 7.1.2.3 Incident CKD5 Patients by Aetiology ............................................................................................... 23 7.1.2.4 Incident CKD5 Patients by Co-morbid Conditions ........................................................................... 24 7.1.2.5 Incident CKD5 Patients by Service Providers ................................................................................. 25
Singapore Renal Registry Report No. 10
vi
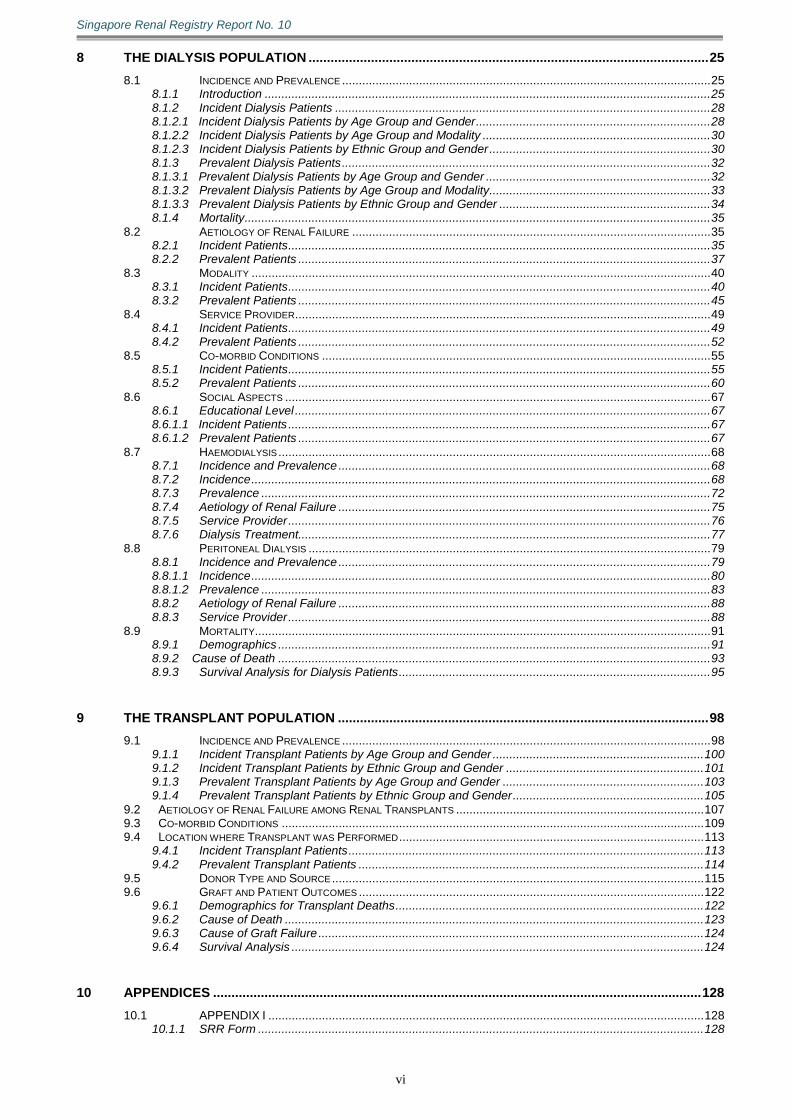
8 THE DIALYSIS POPULATION ............................................................................................................. 25
8.1 INCIDENCE AND PREVALENCE .............................................................................................................. 25 8.1.1 Introduction ..................................................................................................................................... 25 8.1.2 Incident Dialysis Patients ................................................................................................................ 28 8.1.2.1 Incident Dialysis Patients by Age Group and Gender ...................................................................... 28 8.1.2.2 Incident Dialysis Patients by Age Group and Modality .................................................................... 30 8.1.2.3 Incident Dialysis Patients by Ethnic Group and Gender .................................................................. 30 8.1.3 Prevalent Dialysis Patients .............................................................................................................. 32 8.1.3.1 Prevalent Dialysis Patients by Age Group and Gender ................................................................... 32 8.1.3.2 Prevalent Dialysis Patients by Age Group and Modality.................................................................. 33 8.1.3.3 Prevalent Dialysis Patients by Ethnic Group and Gender ............................................................... 34 8.1.4 Mortality ........................................................................................................................................... 35
8.2 AETIOLOGY OF RENAL FAILURE ........................................................................................................... 35 8.2.1 Incident Patients .............................................................................................................................. 35 8.2.2 Prevalent Patients ........................................................................................................................... 37
8.3 MODALITY ......................................................................................................................................... 40 8.3.1 Incident Patients .............................................................................................................................. 40 8.3.2 Prevalent Patients ........................................................................................................................... 45
8.4 SERVICE PROVIDER ............................................................................................................................ 49 8.4.1 Incident Patients .............................................................................................................................. 49 8.4.2 Prevalent Patients ........................................................................................................................... 52
8.5 CO-MORBID CONDITIONS .................................................................................................................... 55 8.5.1 Incident Patients .............................................................................................................................. 55 8.5.2 Prevalent Patients ........................................................................................................................... 60
8.6 SOCIAL ASPECTS ............................................................................................................................... 67 8.6.1 Educational Level ............................................................................................................................ 67 8.6.1.1 Incident Patients .............................................................................................................................. 67 8.6.1.2 Prevalent Patients ........................................................................................................................... 67
8.7 HAEMODIALYSIS ................................................................................................................................. 68 8.7.1 Incidence and Prevalence ............................................................................................................... 68 8.7.2 Incidence ......................................................................................................................................... 68 8.7.3 Prevalence ...................................................................................................................................... 72 8.7.4 Aetiology of Renal Failure ............................................................................................................... 75 8.7.5 Service Provider .............................................................................................................................. 76 8.7.6 Dialysis Treatment........................................................................................................................... 77
8.8 PERITONEAL DIALYSIS ........................................................................................................................ 79 8.8.1 Incidence and Prevalence ............................................................................................................... 79 8.8.1.1 Incidence ......................................................................................................................................... 80 8.8.1.2 Prevalence ...................................................................................................................................... 83 8.8.2 Aetiology of Renal Failure ............................................................................................................... 88 8.8.3 Service Provider .............................................................................................................................. 88
8.9 MORTALITY........................................................................................................................................ 91 8.9.1 Demographics ................................................................................................................................. 91 8.9.2 Cause of Death ................................................................................................................................. 93 8.9.3 Survival Analysis for Dialysis Patients ............................................................................................. 95
9 THE TRANSPLANT POPULATION ..................................................................................................... 98
9.1 INCIDENCE AND PREVALENCE .............................................................................................................. 98 9.1.1 Incident Transplant Patients by Age Group and Gender ............................................................... 100 9.1.2 Incident Transplant Patients by Ethnic Group and Gender ........................................................... 101 9.1.3 Prevalent Transplant Patients by Age Group and Gender ............................................................ 103 9.1.4 Prevalent Transplant Patients by Ethnic Group and Gender ......................................................... 105
9.2 AETIOLOGY OF RENAL FAILURE AMONG RENAL TRANSPLANTS .......................................................................... 107 9.3 CO-MORBID CONDITIONS .............................................................................................................................. 109 9.4 LOCATION WHERE TRANSPLANT WAS PERFORMED ........................................................................................... 113
9.4.1 Incident Transplant Patients .......................................................................................................... 113 9.4.2 Prevalent Transplant Patients ....................................................................................................... 114
9.5 DONOR TYPE AND SOURCE ............................................................................................................... 115 9.6 GRAFT AND PATIENT OUTCOMES ....................................................................................................... 122
9.6.1 Demographics for Transplant Deaths ............................................................................................ 122 9.6.2 Cause of Death ............................................................................................................................. 123 9.6.3 Cause of Graft Failure ................................................................................................................... 124 9.6.4 Survival Analysis ........................................................................................................................... 124
10 APPENDICES ..................................................................................................................................... 128
10.1 APPENDIX I .................................................................................................................................. 128 10.1.1 SRR Form ..................................................................................................................................... 128
Singapore Renal Registry Report No. 10
7
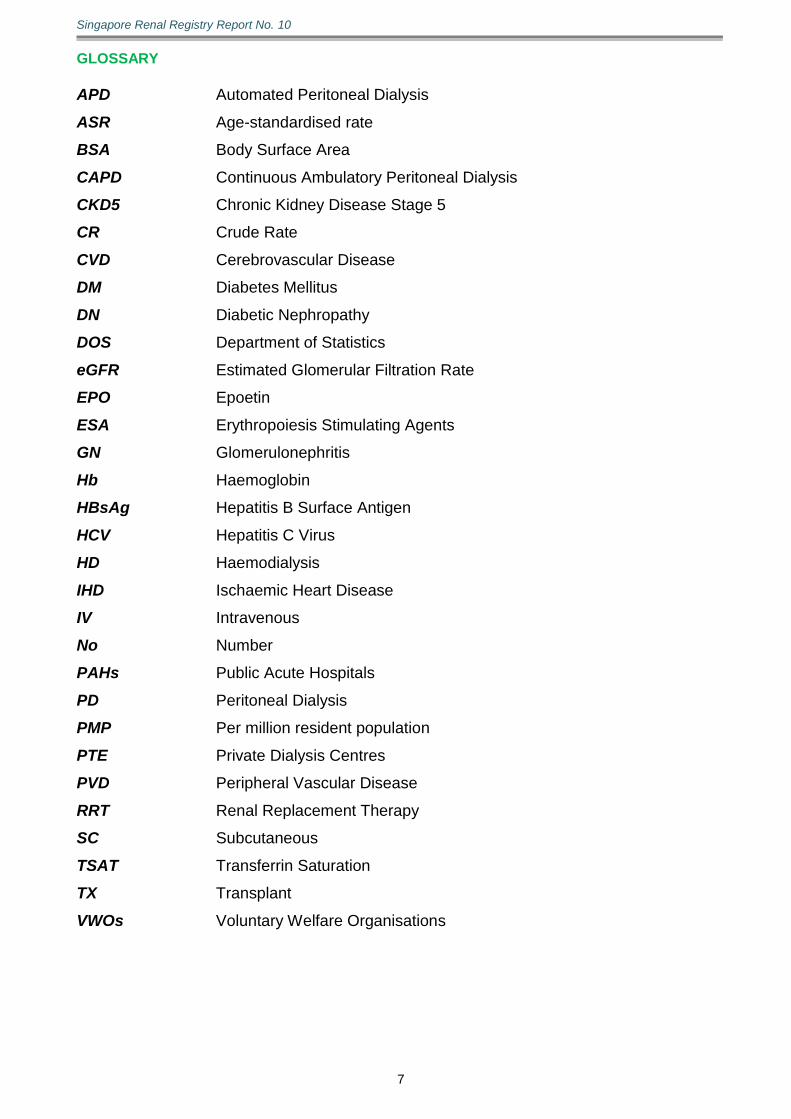
GLOSSARY
APD Automated Peritoneal Dialysis
ASR Age-standardised rate
BSA Body Surface Area
CAPD Continuous Ambulatory Peritoneal Dialysis
CKD5 Chronic Kidney Disease Stage 5
CR
CVD
Crude Rate
Cerebrovascular Disease
DM Diabetes Mellitus
DN
DOS
Diabetic Nephropathy
Department of Statistics
eGFR Estimated Glomerular Filtration Rate
EPO Epoetin
ESA Erythropoiesis Stimulating Agents
GN Glomerulonephritis
Hb
HBsAg
HCV
Haemoglobin
Hepatitis B Surface Antigen
Hepatitis C Virus
HD Haemodialysis
IHD
IV
No
Ischaemic Heart Disease
Intravenous
Number
PAHs Public Acute Hospitals
PD Peritoneal Dialysis
PMP
PTE
Per million resident population
Private Dialysis Centres
PVD
RRT
SC
Peripheral Vascular Disease
Renal Replacement Therapy
Subcutaneous
TSAT Transferrin Saturation
TX Transplant
VWOs Voluntary Welfare Organisations

Singapore Renal Registry Report No. 10
8
1 LIST OF PARTICIPATING CENTRES AND PREVALENT PATIENTS as of 31 DECEMBER 2012 and 2013 Public Acute Hospitals and Affiliated Dialysis Centres
2012 2013
HD PD TX^ HD PD TX^
Singapore General Hospital 10 307 825 8 310 831
Alexandra Hospital 0 15 0 0 23 0
Tan Tock Seng Renal Centre 3 77 15 0 91 17
Changi General Hospital 3 21 0 1 31 0
Khoo Teck Puat Hospital 0 31 0 0 45 0
National University Hospital 5 108 388 5 116 399
NUH Dialysis Centre 71 0 0 61 0 0
Nuh Renal Centre 12 0 0 9 0 0
SHAW NKF - NUH Children's Kidney Centre 4 23 37 2 22 40
Sub-total 108 582 1265 86 638 1287
Voluntary Welfare Organisations HD PD TX HD PD TX
Hong Leong - NKF Dialysis Centre (Aljunied Crescent) 102 0 0 104 0 0
IFPAS - NKF Dialysis Centre (Serangoon) 99 0 0 97 0 0
Japan Airline - NKF Dialysis Centre (Ang Mo Kio I) 106 0 0 109 0 0
Kwan Im Thong Hood Cho Temple - NKF Dialysis Centre (Simei) 135 0 0 145 0 0
Leong Hwa Chan Si Temple - NKF Dialysis Centre (Teck Whye) 107 0 0 104 0 0
New Creation Church - NKF Dialysis Centre 81 0 0 82 0 0
NKF Dialysis Centre (BLK 365 Woodlands II) 105 0 0 105 0 0
NKF Hougang Punggol Dialysis Centre 88 0 0 92 0 0
NTUC Income - NKF Dialysis Centre (Bukit Batok) 81 0 0 85 0 0
NTUC/Singapore Pools - NKF Dialysis Centre (Tampines) 112 0 0 112 0 0
Pei Hwa Foundation - NKF Dialysis Centre (Ang Mo Kio) 112 0 0 119 0 0
SAF - NKF Dialysis Centre (Clementi) 114 0 0 106 0 0
SAF - NKF Dialysis Centre (Hong Kah) 80 0 0 82 0 0
Sakyadhita -NKF Dialysis Centre (Upper Boon Keng) 93 0 0 96 0 0
Sheng Hong Temple - NKF Dialysis Centre (Jurong West) 104 0 0 112 0 0
SIA - NKF Dialysis Centre (Toa Payoh) 78 0 0 76 0 0
Singapore Buddhist Welfare Services - NKF Dialysis Centre (Hougang) 136 0 0 139 0 0
Singapore Pools - NKF Dialysis Centre (Bedok) 100 0 0 105 0 0
Tampines Chinese Temple - NKF Dialysis Centre (Pasir Ris) 68 0 0 69 0 0
Tay Choon Hye - NKF Dialysis Centre (Kim Keat) 104 0 0 107 0 0
Thong Teck Sian Tong Lian Sin SIA - NKF Dialysis Centre (Woodlands) 112 0 0 107 0 0
Toa Payoh Seu Teck Sean Tong - NKF Dialysis Centre (Yishun) 70 0 0 69 0 0
Western Digital - NKF Dialysis Centre (Ang Mo Kio) 148 0 0 148 0 0
Woh Hup - NKF Dialysis Centre (Ghim Moh) 111 0 0 113 0 0
Wong Sui Ha Edna - Nkf Dialysis Centre 68 0 0 91 0 0
KDF - Bishan Centre 105 0 0 102 0 0
KDF - Ghim Moh Centre (HD) 58 0 0 83 0 0
KDF - Ghim Moh Centre (PD) 0 42 0 0 36 0
KDF - Kreta Ayer (HD) 70 0 0 82 0 0
Peoples' Dialysis Centre 98 0 0 99 0 0
Sub-total 2845 42 0 2940 36 0
Private Dialysis Centres/Clinics HD PD TX HD PD TX
Advance Renal Care (Novena) 0 0 0 4 0 0
Advance Renal Therapy 37 0 0 30 0 0
ARC Kidney Dialysis Centre (Clementi Ave 3) Pte Ltd 44 0 0 50 0 0
Asia Kidney Dialysis Centre (Bedok) 33 0 0 42 0 0
Asia Kidney Dialysis Centre (Jurong) 0 0 0 26 0 0
Asia Kidney Dialysis Centre (TP) 41 0 0 56 0 0
Asia Kidney Dialysis Centre (TPY) 34 0 0 47 0 0
Asia Renal Care (Jurong) Pte Ltd 47 0 0 42 0 0
Asia Renal Care (Katong) Pte Ltd 43 0 0 45 0 0
Asia Renal Care (Kembangan) Pte Ltd 49 0 0 56 0 0
Asia Renal Care (Mt Elizabeth) Pte Ltd 24 1 0 24 1 0
B.Braun Avitum Dialysis Centre 37 0 0 52 0 0
Dialysis Centre - Youngberg Pte Ltd (Whampoa) 56 0 0 54 0 0
Dialysis Centre - Youngberg Pte Ltd (Kovan) 58 0 0 59 0 0
Dialysis Centre - Youngberg Pte Ltd (Serangoon) 49 0 0 46 0 0
FHC Dialysis Centre PTE LTD 22 0 0 36 0 0
Fresenius Medical Care (Teck Whye) Dialysis Clinic 0 0 0 6 0 0
Immanuel Dialysis Centre Pte Ltd (Ang Mo Kio) 38 0 0 37 0 0
Immanuel Dialysis Centre Pte Ltd (Mt Alvernia) 32 2 0 36 3 0
Immanuel Dialysis Centre Pte Ltd (Woodlands) 0 0 0 9 0 0
Immanuel Dialysis Centre Pte Ltd (Yishun) 0 0 0 12 0 0
Kidney Therapy Centre Pte Ltd (Marsiling Rd Blk136) 58 0 0 53 0 0
Kidney Therapy Centre Pte Ltd (YISHUN Blk 236) 45 0 0 48 0 0
KidneyCare Dialysis Centre @ Pasir Ris 0 0 0 20 0 0
Nephrocare GDI Pte Ltd 28 3 0 31 2 0
Nephrocare S & J Dialysis Centre (Boulvard) 42 0 0 36 0 0
Orthe Pte Ltd - (Bukit Batok) 46 0 0 38 0 0
Orthe Pte Ltd - (Orchard Rd , Lucky Plaza) 15 0 0 10 0 0
Orthe Pte Ltd ( Blk 527, Bedok North Street 3) 0 0 0 11 0 0
Orthe Pte Ltd (Jurong West) 58 0 0 52 0 0
Orthe Pte Ltd (Tampines Blk 107) 57 0 0 61 0 0
Raffles Dialysis Centre 6 0 0 11 0 0
Renal & Dialysis Clinic (S) Pte Ltd (Deport Road) 11 0 0 16 0 0
Renal Health Pte Ltd 92 0 0 54 0 0
Renal Life (Hougang) Dialysis Centre Pte Ltd 0 0 0 11 0 0
Renal Life (W) Dialysis Centre Pte Ltd (Blk 207 Bukit Batok) 10 0 0 28 0 0
Renal Life Dialysis Centre Pte Ltd (Blk 463 Jurong West) 18 0 0 29 0 0
Renal Therapy Centre Pte Ltd - (Bedok Blk 744) 73 0 0 70 0 0
Renal Therapy Centre Pte Ltd (Ang Mo Kio Blk422) 64 0 0 58 0 0
Renal Therapy Centre Pte Ltd (Hougang BLK 620) 50 0 0 46 0 0
Renal Therapy Centre Pte Ltd (Jurong East Blk 326) 52 0 0 39 0 0
Renal Therapy Centre Pte Ltd (Toa Payoh Blk 92) 62 0 0 58 0 0
Renal Therapy Services Pte Ltd (Ang Mo Kio Blk 443) 45 0 0 41 0 0
Renal Therapy Services Pte Ltd (Bukit Merah Blk 161) 43 0 0 41 0 0

Singapore Renal Registry Report No. 10
9
Private Dialysis Centres/Clinics HD PD TX HD PD TX
Renal Therapy Services Pte Ltd (Jurong East Blk 104) 91 0 0 83 0 0
Renal Therapy Services Pte Ltd (Yishun Ring Blk 236) 49 0 0 37 0 0
RenalTeam Dialysis Centre - Ang Mo Kio 0 0 0 11 0 0
RenalTeam Dialysis Centre - Bedok 1 0 0 20 0 0
RenalTeam Dialysis Centre - Jurong East 0 0 0 12 0 0
RenalTeam Dialysis Centre - Tampines 0 0 0 3 0 0
RenalTeam Dialysis Centre - Woodlands 0 0 0 17 0 0
Centre For Kidney Disease Pte Ltd (Lucky Plaza) 0 0 41 0 0 41
Grace Lee Renal And Medical Clinic Pte Ltd 0 0 12 0 0 11
Kidney & Medical Centre 0 0 5 0 0 5
Ku Kidney & Medical Centre 0 0 22 0 0 22
Raffles Hospital 0 1 4 0 1 3
Roger Kidney Clinic 0 0 3 0 0 6
SH Tan Kidney & Medical Clinic 0 0 0 0 0 2
Stephew Chew Centre for Kidney Disease and Hypertension 0 0 29 0 0 28
The Kidney Clinic Pte Ltd 0 0 2 0 0 5
The Singapore Clinic for Kidney Diseases 0 0 4 0 0 4
Wu Nephrology & Medical Clinic (Wu Medical Clinic Pte Ltd) 0 0 17 0 0 20
Overseas Transplantation 0 0 3 0 0 0
Sub-total 1660 7 142 1814 7 147
GRAND TOTAL 4613 631 1407* 4840 681 1434
^ TX refers to number of transplanted patients * Included Singapore residents who went overseas for transplantation

Singapore Renal Registry Report No. 10
10
2 INTRODUCTION
This report summarises the characteristics of dialysis and renal transplant (donor and
recipient) patients among the resident population of Singapore (citizens and permanent
residents). These are patients who were diagnosed with Chronic Kidney Failure Stage 5
(CKD5).
2.1 Dialysis Programmes
In Singapore, both haemodialysis (HD) and peritoneal dialysis (PD) are available for
patients with end-stage renal failure. While the practice of PD is almost totally confined to
the Public Acute Hospitals (PAHs), HD is practised in various settings as follows:
1. PAHs where hospital-based centres provide total care dialysis;
2. Dialysis Centres run by Voluntary Welfare Organisations (VWOs) where free-standing
centres provide total care for elderly patients and those unable to perform self-dialysis, as
well as assisted care for the more able patients;
3. Private dialysis centres (PTE) that provide total care dialysis in hospital-based as well as
free-standing centres in the private sector.
2.2 Transplantation Programmes
Both living and deceased-donor renal transplants are performed in Singapore. Transplants
from live donors are performed in both the public acute and private hospitals while
deceased-donor transplants are only performed in PAHs. In addition, patients return for
follow-up at hospitals in Singapore after having received a transplant overseas.
2.3 Method of Payment
The Ministry of Health provides subsidies to lower- and middle-income PD and HD patients.
The subsidy framework for renal dialysis was recently enhanced and subsidy coverage
extended to the middle income households. Government subsidies are also provided for
selected immunosuppressive drugs for subsidised patients in the public healthcare
institutions to assist patients with drug cost after transplantation. In addition, patients can
also use Medisave (a national medical savings scheme) and MediShield benefits (a low
cost basic medical insurance scheme) to pay for their dialysis or immunosuppressive drugs
after Government subsidies. VWOs such as the National Kidney Foundation, Kidney
Dialysis Foundation and Peoples' Dialysis Centre also provide charity assistance to dialysis
patients who need further financial assistance.
Singapore Renal Registry Report No. 10
11
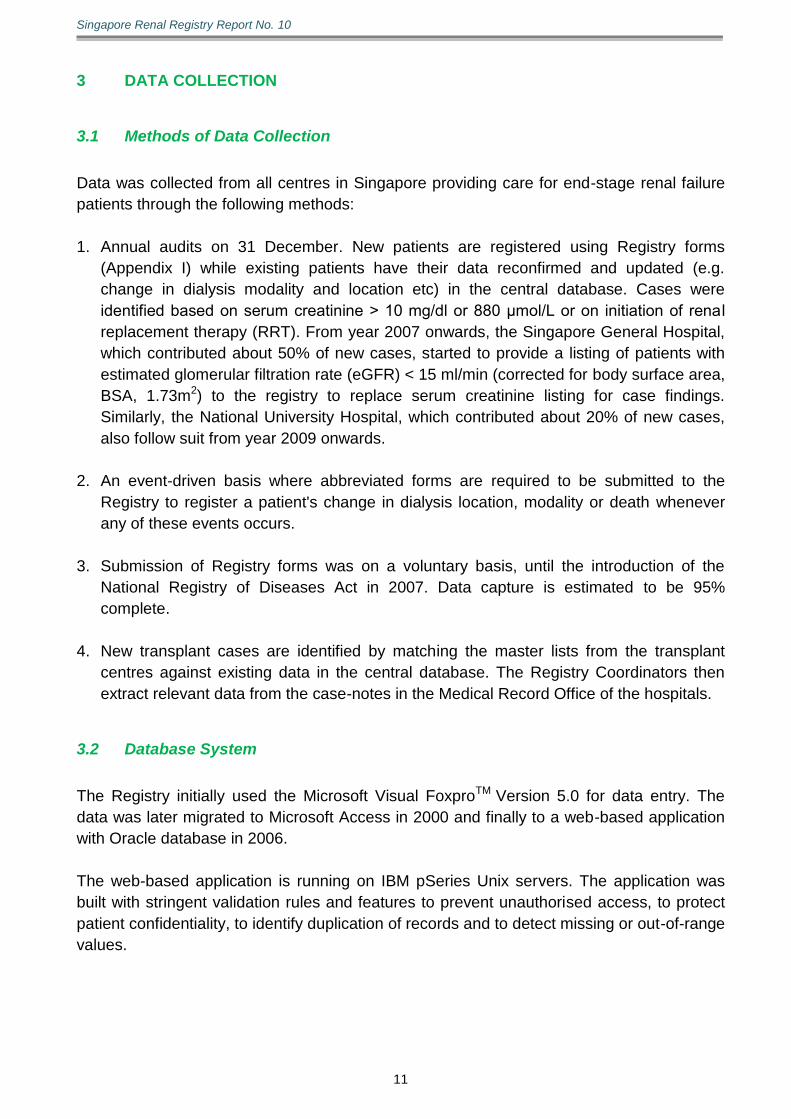
3 DATA COLLECTION
3.1 Methods of Data Collection
Data was collected from all centres in Singapore providing care for end-stage renal failure
patients through the following methods:
1. Annual audits on 31 December. New patients are registered using Registry forms
(Appendix I) while existing patients have their data reconfirmed and updated (e.g.
change in dialysis modality and location etc) in the central database. Cases were
identified based on serum creatinine > 10 mg/dl or 880 μmol/L or on initiation of renal
replacement therapy (RRT). From year 2007 onwards, the Singapore General Hospital,
which contributed about 50% of new cases, started to provide a listing of patients with
estimated glomerular filtration rate (eGFR) < 15 ml/min (corrected for body surface area,
BSA, 1.73m2) to the registry to replace serum creatinine listing for case findings.
Similarly, the National University Hospital, which contributed about 20% of new cases,
also follow suit from year 2009 onwards.
2. An event-driven basis where abbreviated forms are required to be submitted to the
Registry to register a patient's change in dialysis location, modality or death whenever
any of these events occurs.
3. Submission of Registry forms was on a voluntary basis, until the introduction of the
National Registry of Diseases Act in 2007. Data capture is estimated to be 95%
complete.
4. New transplant cases are identified by matching the master lists from the transplant
centres against existing data in the central database. The Registry Coordinators then
extract relevant data from the case-notes in the Medical Record Office of the hospitals.
3.2 Database System
The Registry initially used the Microsoft Visual FoxproTM Version 5.0 for data entry. The
data was later migrated to Microsoft Access in 2000 and finally to a web-based application
with Oracle database in 2006.
The web-based application is running on IBM pSeries Unix servers. The application was
built with stringent validation rules and features to prevent unauthorised access, to protect
patient confidentiality, to identify duplication of records and to detect missing or out-of-range
values.

Singapore Renal Registry Report No. 10
12
4 DATA CLEANING AND ANALYSIS
A snapshot of data for the years 2012 – 2013 was used to generate trends and check for
obvious errors and inconsistency. Erroneous data items were identified, extracted and
passed to the team of renal registry coordinators for verification and data cleaning.
The tables and figures in this monograph were generated based on data snapshot taken on
17th June 2013. Hence, numbers and estimates for a particular year would differ from the
previous monographs due to updating of figures in the latest dataset. Dialysis modality at
90 days after initiation was used in the computation of incidence, prevalence and survival
analysis. This methodology was first applied in the Second Report of the Singapore Renal
Registry 1998. In most instances, STATA version 10.1 was used in data analysis.
In this report, we used mid-year population estimates of Singapore residents from the
Department of Statistics (DOS), Singapore to calculate the rates. Age standardised rates
(ASR) were derived by the direct method using the UICC "World" Population. (Doll R, Muir
C, Waterhouse J (eds) Cancer Incidence in Five Continents Vol. 2, Geneva, UICC, 1970).
All rates were expressed in per million resident population (pmp).
Deaths that occurred in the year were categorised according to the modality of treatment at
the time of death.
Survival Analysis
The Kaplan-Meier method was used to calculate unadjusted survival probabilities. Deaths
were defined as events for dialysis and transplanted patients. Survival was computed till
death or till March 2013 for those who were alive.
Patients who switched modality of treatment and remained on it for at least 60 days had the
survival experience attributed to the switched modality. Patients who remained on the
switched modality for less than 60 days had their survival experience attributed to the
original modality.
Patients on dialysis were censored if they received a kidney transplant.
For analysis of graft survival for renal transplants, a graft loss event was defined as return
to dialysis or a preemptive renal transplant or death with a functioning graft. Deaths from all
other causes were also considered as events for the calculations of patient survival.
Bio-clinical indicators
Bio-clinical (e.g. haemoglobin, Hb) values were reported from 2005 onwards when the
registry started collecting these data.
In this monograph, the numbers in tables and figures were rounded to one decimal place.
In view of this, the percentages may not always add up to 100%.
Singapore Renal Registry Report No. 10
13
5 SYNOPSIS 2012 – 2013
5.1 Dialysis
5.1.1 Stock and Flow (1999 – 2013)
Intake of new dialysis patients increased from 770 in 2009 to 975 in 2013.
Prevalent dialysis patients increased from 4,382 in 2009 to 5,521 in 2013.
The number of renal transplants varied between 84 and 96 in the period 2009 – 2013.
Patients with functioning transplant increased from 1,328 in 2009 to 1,434 in 2013.
5.1.2 Demographics
5.1.2.1 New Patients Diagnosed with CKD5
Of the CKD5 patients, the proportion of males was 55.1% in 2012 and 56.8% in 2013. The
mean age was 61.2 years (median 62.6) in 2012 and 60.8 years (median 61.1) in 2013; and
the modal age group was 60 – 69 in both years.
Among the incident CKD5 patients, diabetic nephropathy, DN (64.4% in 2012, 63.5% in
2013) was the most common cause of CKD5. Primary glomerulonephritis (GN) accounted
for 13.5% in 2012 and 13.9% in 2013 while hypertension and renovascular disease as a
group accounted for 15.5% and 15.0% in 2012 and 2013 respectively.
5.1.2.2 New Patients on Dialysis
(1 January 2012 – 31 December 2012)
Of the 921 new CKD5 patients who survived 90 days after initiation of dialysis (Crude rate,
CR 241.2 pmp; Age standardised rate, ASR 169.3 pmp), 55.7% were males. 785 patients
(CR 205.6 pmp; ASR 143.0 pmp), i.e. 85.2% of those who survived 90 days after initiation
of dialysis were on HD compared with 14.8% on PD. 57.3% of the patients surviving 90
days on dialysis were aged 60 years and above.
(1 January 2013 – 31 December 2013)
Of the 975 new CKD5 patients who survived 90 days after initiation of dialysis (CR 253.6
pmp; ASR 170.4 pmp), 55.6% were males. 802 patients (CR 208.6 pmp; ASR 139.6 pmp),
i.e. 82.3% of those who survived 90 days after initiation of dialysis were on HD compared
with 17.7% on PD. 55.0% of the patients surviving 90 days on dialysis were aged 60 years
and above.
Singapore Renal Registry Report No. 10
14
5.1.2.3 Existing Patients on Dialysis
(As of 31 December 2012)
Of the 5,244 prevalent patients on dialysis (CR 1,373.6 pmp; ASR 948.7 pmp), 54.6% were
males. There were 4,613 patients (CR 1,208.3 pmp; ASR 828.8 pmp), i.e. 88.0% on HD
and 631 patients (CR 165.3 pmp; ASR 119.9 pmp), i.e. 12.0% on PD. 52.9% of them were
aged 60 years and above.
(As of 31 December 2013)
Of the 5,521 prevalent patients on dialysis (CR 1,436.1 pmp; ASR 961.3 pmp), 55.0% were
males. There were 4,840 patients (CR 1,259.0 pmp; ASR 837.5 pmp), i.e. 87.7% on HD
and 681 patients (CR 177.1 pmp; ASR 123.7 pmp), i.e. 12.3% on PD. 53.9% of them were
aged 60 years and above.
5.1.3 Primary Renal Disease
DN and primary GN were the commonest cause of CKD5 among the new patients on
dialysis at 65.6% and 15.5% respectively in 2012. 41.3% (59 out of 143) of primary GN
cases were biopsy-proven of which IgA nephropathy was the commonest at 14.7% (21 out
of 143). Secondary GN and other autoimmune diseases accounted for another 1.5% (14
out of 921) of CKD5.
Similar to year 2012, DN and primary GN were the commonest cause of CKD5 at 65.0%
and 16.0% respectively in 2013. Only 35.3% (55 out of 156) of primary GN cases were
biopsy-proven of which IgA nephropathy was the commonest at 25.0% (39 out of 156).
Secondary GN and other autoimmune diseases accounted for another 1.0% (10 out of 975)
of CKD5.
For the prevalent patients on dialysis in 2012, 29.7% (1,555 out of 5,244) and 48.3% (2,533
out of 5,244) had primary GN and DN as the cause of CKD5 respectively. Among those
who had primary GN, 28.7% of them (446 out of 1,555) were biopsy proven. Secondary GN
and other autoimmune diseases accounted for another 2.2% (116 out of 5,244) of CKD5.
Of the biopsy-proven primary GN, IgA nephropathy accounted for 53.4% (238 out of 446).
For the prevalent patients on dialysis in 2013, 28.5% (1,574 out of 5,521) and 49.7% (2,744
out of 5,521) had primary GN and DN as the cause of CKD5 respectively. Among those
who had primary GN, 30.2% of them (476 out of 1,574) were biopsy proven. Secondary GN
and other autoimmune diseases accounted for another 2.1% (114 out of 5,521) of CKD5.
Of the biopsy-proven primary GN, IgA nephropathy accounted for 55.5% (264 out of 476).

Singapore Renal Registry Report No. 10
15
5.1.4 Co-morbid Conditions
In year 2012, prevalent dialysis patients had the following co-morbidities: diabetes mellitus,
DM (56.0%), ischaemic heart disease, IHD (46.8%), cerebrovascular disease, CVD (20.2%),
peripheral vascular disease and PVD (15.5%). 3.8% of them had positive Hepatitis B
surface antigen (HBsAg).
In year 2013, prevalent dialysis patients had the following co-morbidities: DM (57.6%), IHD
(46.3%), CVD (20.5%) and PVD (15.1%). 3.4% of them had positive HBsAg.
5.1.5 Haemodialysis (HD)
In 2012, 785 incident patients survived 90 days on HD (CR 205.6 pmp; ASR 143.0 pmp).
There were 4,613 prevalent patients (CR 1,208.3 pmp; ASR 828.8 pmp) on HD with mean
age of 61.4 years. 57.1% of patients were aged 60 years and above. Majority of prevalent
patients were dialysed in centres managed by VWOs (67.1%) followed by PTE (36.0%) and
PAHs (2.3%).
In 2013, 802 incident patients survived 90 days on HD (CR 208.6 pmp; ASR 139.6 pmp).
There were 4,840 prevalent patients (CR 1,259.0 pmp; ASR 837.5 pmp) on HD with mean
age of 61.7 years. 51.4% of patients were aged 60 years and above. Majority of prevalent
patients were dialysed in centres managed by VWOs (60.7%) followed by PTE (37.5%) and
PAHs (1.8%).
5.1.6 Peritoneal Dialysis (PD)
In 2012, 136 incident patients who survived 90 days were on PD (CR 35.6 pmp; ASR 26.3
pmp). There were 631 prevalent patients (CR 165.3 pmp; ASR 119.9 pmp) on PD with
mean age of 60.2 years. 57.7% were aged 60 years and above. Majority received treatment
in PAHs (92.2%).
In 2013, 173 incident patients who survived 90 days were on PD (CR 45.0 pmp; ASR 30.8
pmp). There were 681 prevalent patients (CR 177.1 pmp; ASR 123.7 pmp) on PD with
mean age of 60.8 years. 57.6% were aged 60 years and above. Majority received treatment
in PAHs (93.7%).
5.1.7 Dialysis Deaths
In 2012, there were 653 deaths at a rate of 11.0%. The death rate for those on HD was at
10.2% and PD at 16.1%. Cardiac events and infection were the commonest cause of death
at 35.1% and 30.8% respectively; cerebrovascular death was at 6.6%.
In 2013, there were 771 deaths with a death rate of 12.1%. The death rate for those on HD
was at 11.8% and PD at 14.4%.
Singapore Renal Registry Report No. 10
16
Cardiac events and infection were the commonest cause of death at 34.8% and 31.1%
respectively; cerebrovascular death was at 4.5%.
5.1.8 Survival Analysis
Patient survival for HD was 59.7% at 5 years for the period 1999 – 2013. The
corresponding figure for PD was 35.9% at 5 years. The median survival was 6.6 years for
HD patients and 3.6 years for PD patients.
5.1.9 Management of Dialysis Patients
In year 2012, the median Hb level was 11.2 g/dl (Range: 5.1 – 18.5) among HD patients,
and 10.8 g/dl (Range: 6.5 – 17.9) among PD patients.
In year 2013, the median Hb level was 11.2 g/dl (Range: 4.8 – 18.8) among HD patients,
and 10.8 g/dl (Range: 5.5 – 18.7) among PD patients.
In 2012, the percentage of HD patients on erythropoiesis stimulating agents (ESA) with
transferrin saturation, TSAT ≥ 20% was 88.5% for patients with Hb ≥ 10 g/dl, and 75.5% for
patients with Hb < 10 g/dl. Similarly, the percentage of PD patients on ESA with TSAT ≥
20% was 84.0% for patients with Hb ≥ 10 g/dl, and 74.2% for patients with Hb < 10 g/dl.
In 2013, the percentage of HD patients on ESA with TSAT ≥ 20% was 86.8% for patients
with Hb ≥ 10 g/dl, and 74.1% for patients with Hb < 10 g/dl. Similarly, the percentage of PD
patients on ESA with TSAT ≥ 20% was 82.0% for patients with Hb ≥ 10 g/dl, and 72.7% for
patients with Hb < 10 g/dl.
Regardless of modality and level of TSAT, the median Hb level among prevalent patients
without ESA was higher than prevalent patients with ESA in the period 2005 – 2013.
The average serum albumin level among the PD patients was lower than that among the
HD patients. In year 2013, the mean serum albumin level was 38.0 g/L for the HD patients
and 34.0 g/L for the PD patients.
Among the HD and PD patients, the mean corrected calcium level among the HD and PD
patients remained constant at 2.3 mmol/L across the years in 2008 – 2013. Similarly, the
mean phosphate level was about 1.6 mmol/L across the years in 2008 – 2013.
Among the HD and PD patients, the average iPTH level was similar. It was also observed
that the iPTH values could be unusually elevated. The median iPTH level ranged from 23.9
to 38.7 pmol/L among the HD patients, and from 26.9 to 29.1 pmol/L among the PD
patients. In year 2013, the median iPTH level for HD patients was 38.7 pmol/L (Range: 0.1
– 629.8), and for PD patients was 29.1 pmol/L (Range: 0.2 – 366.0).
Singapore Renal Registry Report No. 10
17
5.2 Transplants
5.2.1 Demographics
5.2.1.1 New Transplant Patients
There were 51 (CR 13.4 pmp) new kidney transplant recipients in 2012. Of these, males
comprised 50.0%. In addition, 11 patients in 2012 (CR 2.9 pmp) received transplants
overseas.
There were 69 (CR 17.9 pmp) new kidney transplant recipients in 2013. Of these, males
comprised 58.3%. In addition, 15 patients in 2013 (CR 3.9 pmp) received transplants
overseas.
5.2.1.2 Prevalent Transplanted Patients
As of 31 December 2012
There were 1,407 prevalent transplant patients (CR 368.5 pmp, ASR 261.8 pmp) in 2012.
Of these, 53.1% were males. Mean age was 52.8 years. The prevalent transplant
population was predominately Chinese (82.4%).
As of 31 December 2013
There were 1,434 prevalent transplant patients (CR 373.0 pmp, ASR 261.0 pmp) in 2013.
Of these, 52.9% were males. Mean age was 53.2 years. The prevalent transplant
population was predominately Chinese (81.9%).
5.2.2 Primary Renal Disease
For the prevalent transplanted population, the commonest known primary renal disease
was primary GN at 70.7% in 2012 and 70.5% in 2013. DN accounted for 7.7% in 2012 and
2013 while autoimmune disease accounted for 4.3% in 2012 and 4.5% in 2013.
5.2.3 Co-morbid Conditions
Co-morbidities for prevalent transplanted patients in year 2012 included DM (26.8%), IHD
(16.1%), CVD (4.8%) and PVD (2.3%). 3.3% had positive HBsAg.
Co-morbidities for prevalent transplanted patients in year 2013 included DM (26.0%), IHD
(15.7%), CVD (5.2%) and PVD (2.3%). 3.5% had positive HBsAg.
Singapore Renal Registry Report No. 10
18
5.2.4 Location where Transplant was Performed
Among prevalent patients in 2012, the transplants performed at the Singapore General
Hospital constituted 47.6%, followed by overseas centres at 29.6% and the National
University Hospital at 17.6%.
Among prevalent patients in 2013, the transplants performed at the Singapore General
Hospital constituted 47.2%, followed by overseas centres at 28.9% and the National
University Hospital at 18.5%.
5.2.5 Donor Type
Among prevalent patients in 2012, deceased-donor transplantation constituted the highest
at 64.5% (589 local, 318 overseas). Living-donor transplant, either biologically or
emotionally related was the next most common at 29.9% (397 local, 23 overseas), while
unrelated living-donor transplant constituted 5.3%.
Among prevalent patients in 2013, deceased-donor transplantation constituted the highest
at 62.7% (591 local, 309 overseas). Living-donor transplant, either biologically or
emotionally related was the next most common at 29.6% (424 local, 24 overseas), while
unrelated living-donor transplant constituted 5.1%.
5.2.6 Survival Analysis
Transplant patient survival was 97.8% at 1 year and 92.5% at 5 years for patients
transplanted in the period 1999 to 2013. The corresponding 1 and 5-years graft survivals
were 94.8% and 89.4% respectively.
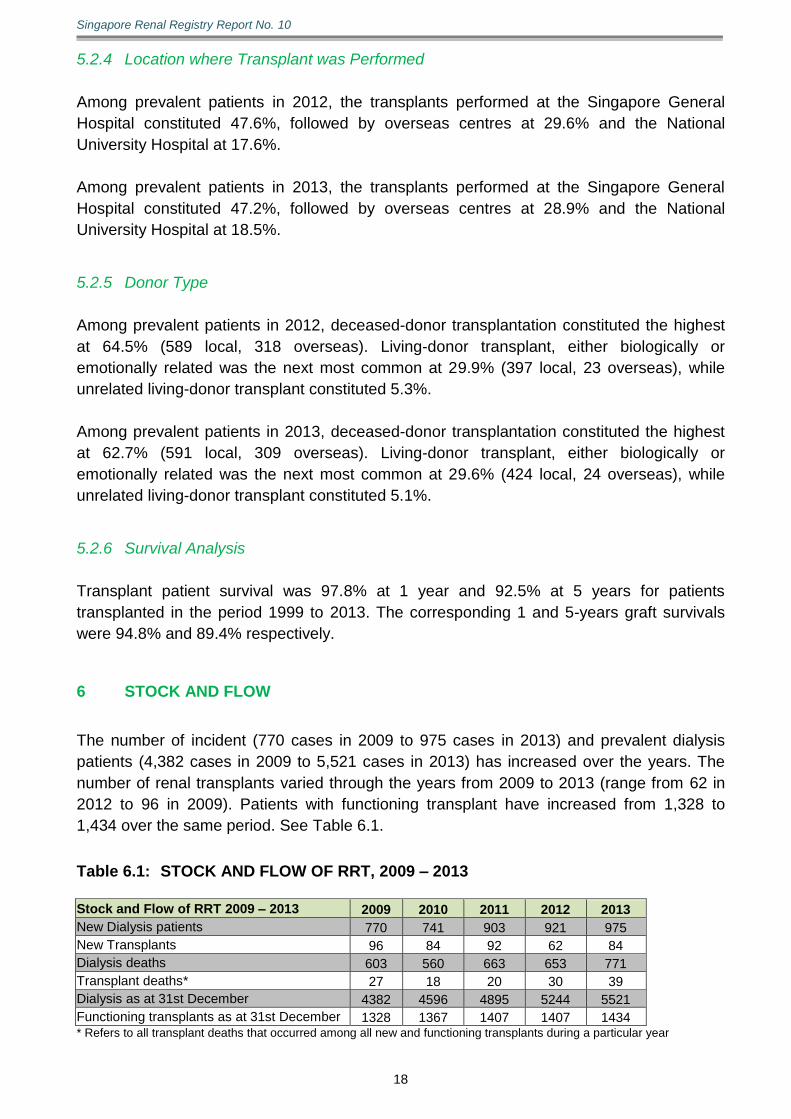
6 STOCK AND FLOW
The number of incident (770 cases in 2009 to 975 cases in 2013) and prevalent dialysis
patients (4,382 cases in 2009 to 5,521 cases in 2013) has increased over the years. The
number of renal transplants varied through the years from 2009 to 2013 (range from 62 in
2012 to 96 in 2009). Patients with functioning transplant have increased from 1,328 to
1,434 over the same period. See Table 6.1.
Table 6.1: STOCK AND FLOW OF RRT, 2009 – 2013 Stock and Flow of RRT 2009 – 2013 2009 2010 2011 2012 2013
New Dialysis patients 770 741 903 921 975
New Transplants 96 84 92 62 84
Dialysis deaths 603 560 663 653 771
Transplant deaths* 27 18 20 30 39
Dialysis as at 31st December 4382 4596 4895 5244 5521
Functioning transplants as at 31st December 1328 1367 1407 1407 1434 * Refers to all transplant deaths that occurred among all new and functioning transplants during a particular year
Singapore Renal Registry Report No. 10
19
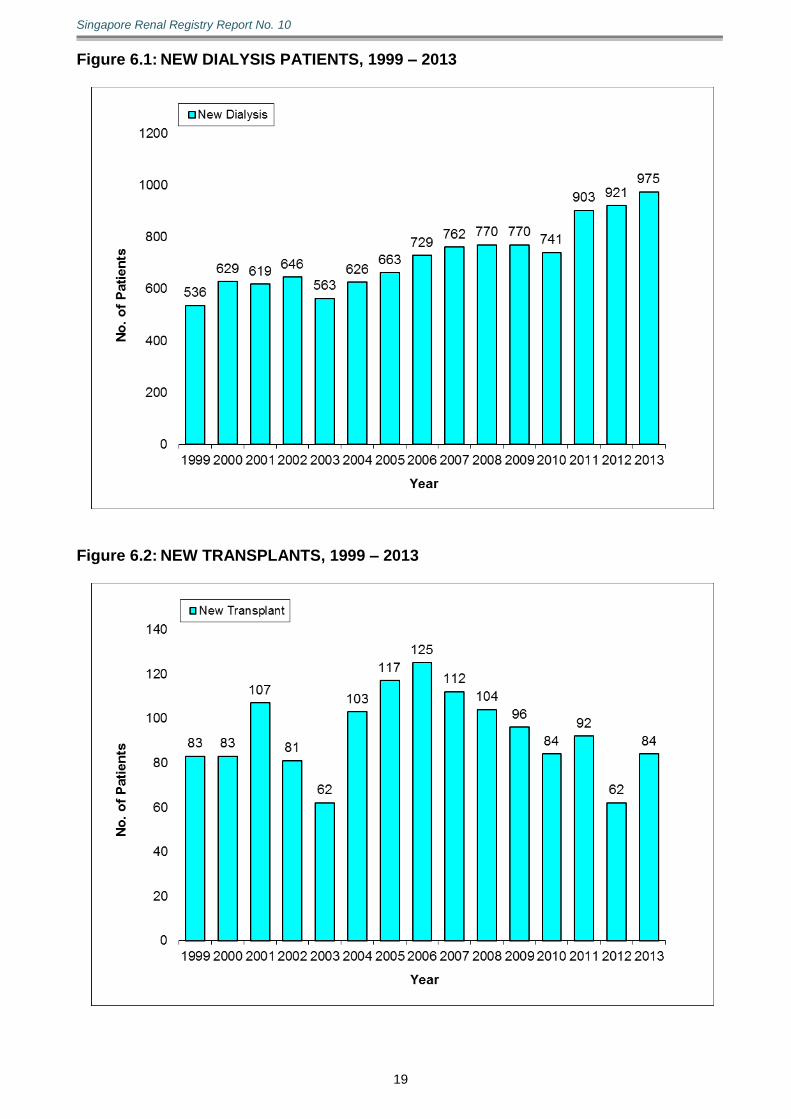
Figure 6.1: NEW DIALYSIS PATIENTS, 1999 – 2013
Figure 6.2: NEW TRANSPLANTS, 1999 – 2013

Singapore Renal Registry Report No. 10
20
Figure 6.3: PREVALENT DIALYSIS PATIENTS AS AT 31ST DECEMBER, 1999 – 2013
Figure 6.4: FUNCTIONING TRANSPLANT AS AT 31ST DECEMBER, 1999 – 2013
Singapore Renal Registry Report No. 10
21
7 THE CKD5 POPULATION
7.1 Incidence and Prevalence
7.1.1 Introduction
This section reports the incidence and prevalence of CKD5. Incidence is defined as the
number of new CKD5 patients in a year while prevalence is defined as the total number of
cases of CKD5 at a specific time point, namely, 31 December of the year in this report.
Incidence is a measure of development of renal disease in the population, whereas
prevalence describes the burden of renal disease in the population.
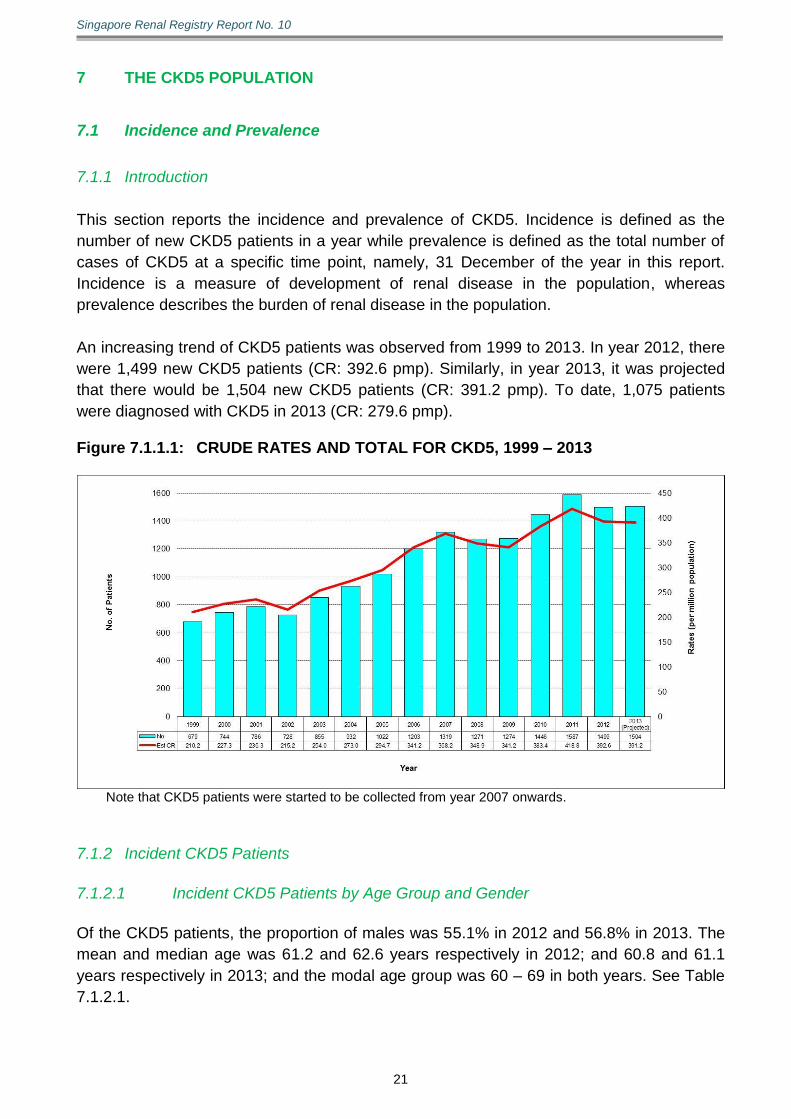
An increasing trend of CKD5 patients was observed from 1999 to 2013. In year 2012, there
were 1,499 new CKD5 patients (CR: 392.6 pmp). Similarly, in year 2013, it was projected
that there would be 1,504 new CKD5 patients (CR: 391.2 pmp). To date, 1,075 patients
were diagnosed with CKD5 in 2013 (CR: 279.6 pmp). Figure 7.1.1.1: CRUDE RATES AND TOTAL FOR CKD5, 1999 – 2013
Note that CKD5 patients were started to be collected from year 2007 onwards.
7.1.2 Incident CKD5 Patients
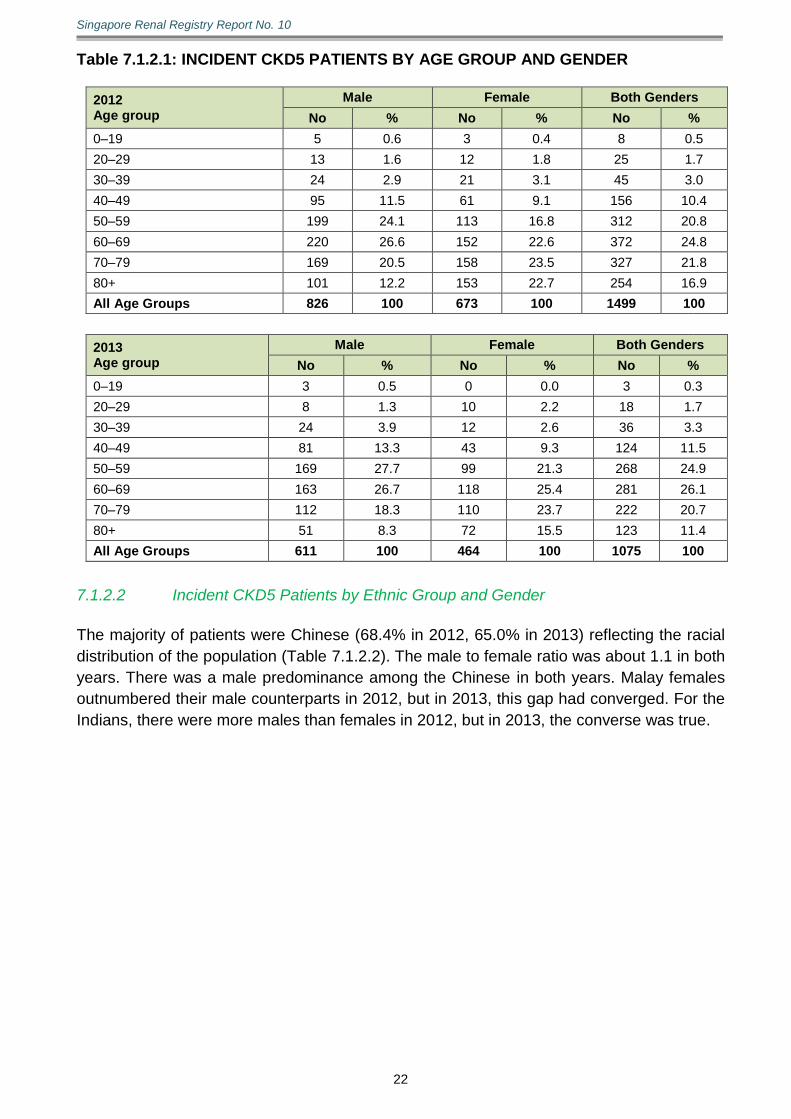
7.1.2.1 Incident CKD5 Patients by Age Group and Gender
Of the CKD5 patients, the proportion of males was 55.1% in 2012 and 56.8% in 2013. The
mean and median age was 61.2 and 62.6 years respectively in 2012; and 60.8 and 61.1
years respectively in 2013; and the modal age group was 60 – 69 in both years. See Table
7.1.2.1.
Singapore Renal Registry Report No. 10
22
Table 7.1.2.1: INCIDENT CKD5 PATIENTS BY AGE GROUP AND GENDER
2012 Age group
Male Female Both Genders
No % No % No %
0–19 5 0.6 3 0.4 8 0.5
20–29 13 1.6 12 1.8 25 1.7
30–39 24 2.9 21 3.1 45 3.0
40–49 95 11.5 61 9.1 156 10.4
50–59 199 24.1 113 16.8 312 20.8
60–69 220 26.6 152 22.6 372 24.8
70–79 169 20.5 158 23.5 327 21.8
80+ 101 12.2 153 22.7 254 16.9
All Age Groups 826 100 673 100 1499 100
2013 Age group
Male Female Both Genders
No % No % No %
0–19 3 0.5 0 0.0 3 0.3
20–29 8 1.3 10 2.2 18 1.7
30–39 24 3.9 12 2.6 36 3.3
40–49 81 13.3 43 9.3 124 11.5
50–59 169 27.7 99 21.3 268 24.9
60–69 163 26.7 118 25.4 281 26.1
70–79 112 18.3 110 23.7 222 20.7
80+ 51 8.3 72 15.5 123 11.4
All Age Groups 611 100 464 100 1075 100
7.1.2.2 Incident CKD5 Patients by Ethnic Group and Gender
The majority of patients were Chinese (68.4% in 2012, 65.0% in 2013) reflecting the racial
distribution of the population (Table 7.1.2.2). The male to female ratio was about 1.1 in both
years. There was a male predominance among the Chinese in both years. Malay females
outnumbered their male counterparts in 2012, but in 2013, this gap had converged. For the
Indians, there were more males than females in 2012, but in 2013, the converse was true.

Singapore Renal Registry Report No. 10
23
Table 7.1.2.2: INCIDENT CKD5 PATIENTS BY ETHNIC GROUP AND GENDER
2012 Ethnic group
Male Female Both Genders
No % No % No %
Chinese 603 73.0 422 62.7 1025 68.4
Malay 147 17.8 195 29.0 342 22.8
Indian 61 7.4 49 7.3 110 7.3
Others 15 1.8 7 1.0 22 1.5
All Ethnic Groups 826 100 673 100 1499 100
2013 Ethnic group
Male Female Both Genders
No % No % No %
Chinese 431 70.5 268 57.8 699 65.0
Malay 139 22.7 136 29.3 275 25.6
Indian 28 4.6 52 11.2 80 7.4
Others 13 2.1 8 1.7 21 2.0
All Ethnic Groups 611 100 464 100 1075 100
7.1.2.3 Incident CKD5 Patients by Aetiology
Among the incident CKD5 patients, DN (64.4% in 2012, 63.5% in 2013) was the most
common cause of CKD5. Primary GN accounted for 13.5% in 2012 and 13.9% in 2013
while hypertension and renovascular disease as a group accounted for 15.5% and 15.0% in
2012 and 2013 respectively (Table 7.1.2.3). Table 7.1.2.3: INCIDENT CKD5 PATIENTS BY AETIOLOGY
Cause of CKD5 2012 2013
No % No %
Diabetic Nephropathy (DN) 965 64.4 683 63.5
Primary Glomerulonephritis (GN) 202 13.5 149 13.9
Autoimmune Disease/GN with Systemic Manifestations 14 0.9 11 1.0
Hypertension and Renovascular Disease (HYP) 232 15.5 161 15.0
Polycystic Kidney Disease/Other Cystic Diseases 23 1.5 30 2.8
Vesicoureteric Reflux/Chronic Pyelonephritis 1 0.1 3 0.3
Obstruction 20 1.3 10 0.9
Stone Disease 1 0.1 2 0.2
Miscellaneous 33 2.2 24 2.2
Unknown 8 0.5 2 0.2
All Causes 1499 100 1075 100

Singapore Renal Registry Report No. 10
24
In 2012, there were 104 patients with no co-morbidity (defined as DM, IHD or CVD), 212
patients with 1 co-morbidity, 292 with 2 co-morbidities and 311 patients with more than 2
co-morbidities. In 2013, there were 135 patients with no co-morbidity, 237 patients with 1
co-morbidity, 282 patients with 2 co-morbidities and 320 patients with more than 2 co-
morbidities.
DM as a co-morbid condition occurred in 70.6% of CKD5 patients in 2012 and 69.3% in
2013. IHD was reported in 46.3% of patients in 2012 and 46.0% in 2013. CVD was reported
at 28.8% in 2012 and 25.1% in 2013. Among the CKD5 patients, there were 10.2% current
smokers in 2012 and 11.2% in 2013. Another 24.6% in 2012 and 23.5% in 2013 were
former smokers. The smoking status was unknown in 2.5% and 2.9% of patients in 2012
and 2013 respectively. See Table 7.1.2.4.
7.1.2.4 Incident CKD5 Patients by Co-morbid Conditions Table 7.1.2.4: INCIDENT CKD5 PATIENTS BY CO-MORBID CONDITIONS
Diabetic Mellitus 2012 2013
No % No %
Yes 1058 70.6 745 69.3
No 441 29.4 329 30.6
Unknown 0 0.0 1 0.1
Total 1499 100 1075 100
Ischaemic Heart Disease 2012 2013
No % No %
Yes 694 46.3 495 46.0
No 803 53.6 578 53.8
Unknown 2 0.1 2 0.2
Total 1499 100 1075 100
Cerebrovascular Disease 2012 2013
No % No %
Yes 431 28.8 270 25.1
No 1065 71.0 800 74.4
Unknown 3 0.2 5 0.5
Total 1499 100 1075 100
Smoking 2012 2013
No % No %
Current Smoker 153 10.2 120 11.2
Ex-Smoker 369 24.6 253 23.5
Non-Smoker/Never 939 62.6 671 62.4
Unknown 38 2.5 31 2.9
Total 1499 100 1075 100

Singapore Renal Registry Report No. 10
25
7.1.2.5 Incident CKD5 Patients by Service Providers
About 96% of the new CKD5 patients were managed by the PAHs, previously known as
restructured hospitals (Table 7.1.2.5).
Table 7.1.2.5: INCIDENT CKD5 PATIENTS BY SERVICE PROVIDERS
Service Provider 2012 2013
No % No %
Public Acute Hospitals 1433 95.6 1037 96.5
Voluntary Welfare Organisations 0 0.0 0 0.0
Private Centres 66 4.4 38 3.5
All Providers 1499 100 1075 100
8 THE DIALYSIS POPULATION
8.1 Incidence and Prevalence
8.1.1 Introduction
This section reports the incidence and prevalence of CKD5 treated with dialysis.
Table 8.1.1.1: INCIDENT AND PREVALENT DIALYSIS PATIENTS
2012 2013
No CR* ASR* No CR* ASR*
New CKD5 patients 1499 392.6 263.9 1075 279.6 184.6
New patients ever started on dialysis 1079 282.6 195.3 1178 306.4 204.4
– On Haemodialysis 999 261.7 180.4 1083 281.7 187.7
– On Peritoneal Dialysis 80 21.0 14.8 95 24.7 16.7
New patients for preceding one year surviving 90 days
921 241.2 169.3 975 253.6 170.4
– On Haemodialysis 785 205.6 143.0 802 208.6 139.6
– On Peritoneal Dialysis 136 35.6 26.3 173 45.0 30.8
Prevalence of patients on Dialysis 5244 1373.6 948.7 5521 1436.1 961.3
– On Haemodialysis 4613 1208.3 828.8 4840 1259.0 837.5
– On Peritoneal Dialysis 631 165.3 119.9 681 177.1 123.7
Dialysis death for preceding one year 653 171.0 115.2 771 200.6 130.4
Transplanted in Singapore 51 13.4 - 69 17.9 -
Transplanted in Overseas 11 2.9 - 15 3.9 -
Transplanted death with functioning graft 30 7.9 - 37 9.6 -
Transplanted death with graft loss 0 0.0 - 2 0.5 -
Transplanted with graft loss 32 8.4 - 18 4.7 -
Prevalent Transplant Population 1407 368.5 261.8 1434 373.0 261.0
* per million resident population
^ Note that the ASRs were not computed, as the numbers were too small for meaningful analysis.
During the period of 1 January to 31 December in 2012, 1,499 patients (CR 392.6 pmp;
ASR 263.9 pmp) were diagnosed with CKD5. See Table 8.1.1.1. In the same year, 1,079

Singapore Renal Registry Report No. 10
26
patients were started on dialysis. Of these, 921 patients (CR 241.2 pmp; ASR 169.3 pmp)
survived 90 days after initiation in 2012.
During the same period in 2013, 1,075 patients (CR 279.6 pmp; ASR 184.6 pmp) were
diagnosed with CKD5. There were 1,178 patients who started dialysis of which 975 patients
(CR 253.6 pmp; ASR 170.4 pmp) survived 90 days after initiation.
The time trend observed in patients initiating HD is different from that in patients initiating
PD. See Figure 8.1.1.1. Figure 8.1.1.1: CRUDE RATES AND TOTAL FOR EVER STARTED DIALYSIS, 1999 – 2013
Subsequent information refers to the new patients who were still on dialysis 90 days after
commencement.

Singapore Renal Registry Report No. 10
27
The number and rates of CKD5 patients who survived 90 days after initiation followed the
trends for CKD5 patients initiated on dialysis and is defined as “Definitive Dialysis”. See
Figure 8.1.1.2. Figure 8.1.1.2: CRUDE RATES AND TOTAL FOR DEFINITIVE DIALYSIS, 1999 – 2013
Singapore Renal Registry Report No. 10
28
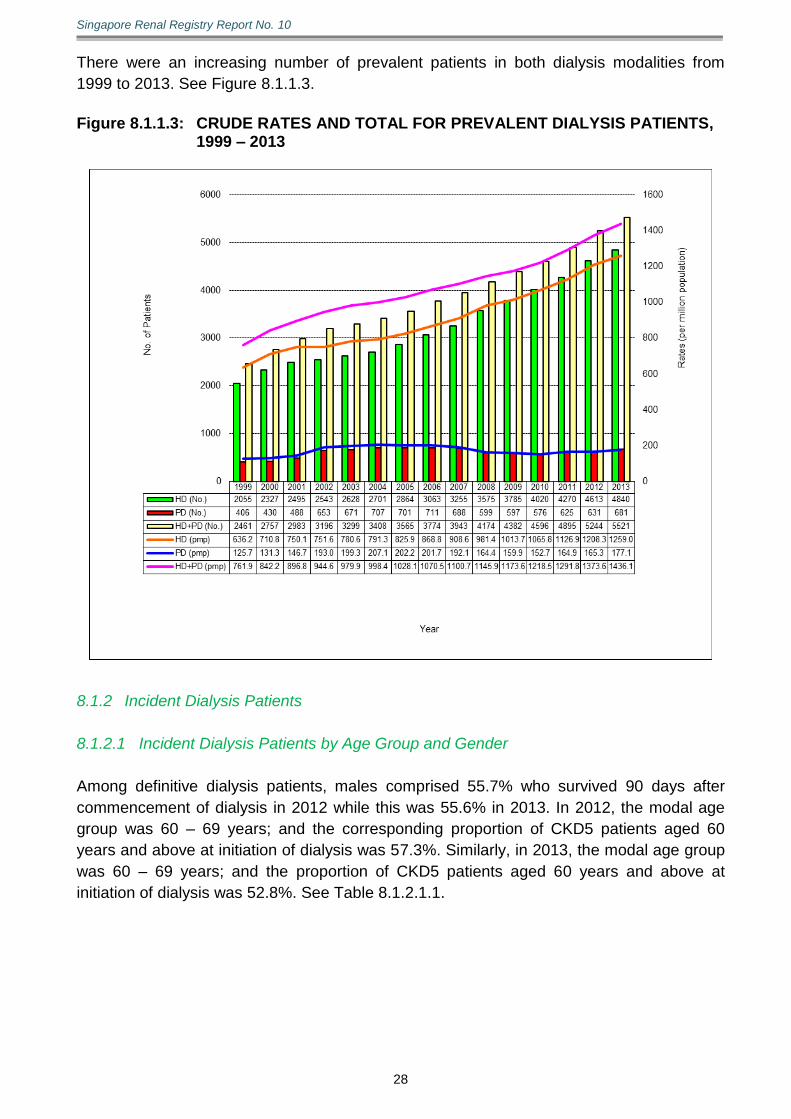
There were an increasing number of prevalent patients in both dialysis modalities from
1999 to 2013. See Figure 8.1.1.3.
Figure 8.1.1.3: CRUDE RATES AND TOTAL FOR PREVALENT DIALYSIS PATIENTS,
1999 – 2013
8.1.2 Incident Dialysis Patients
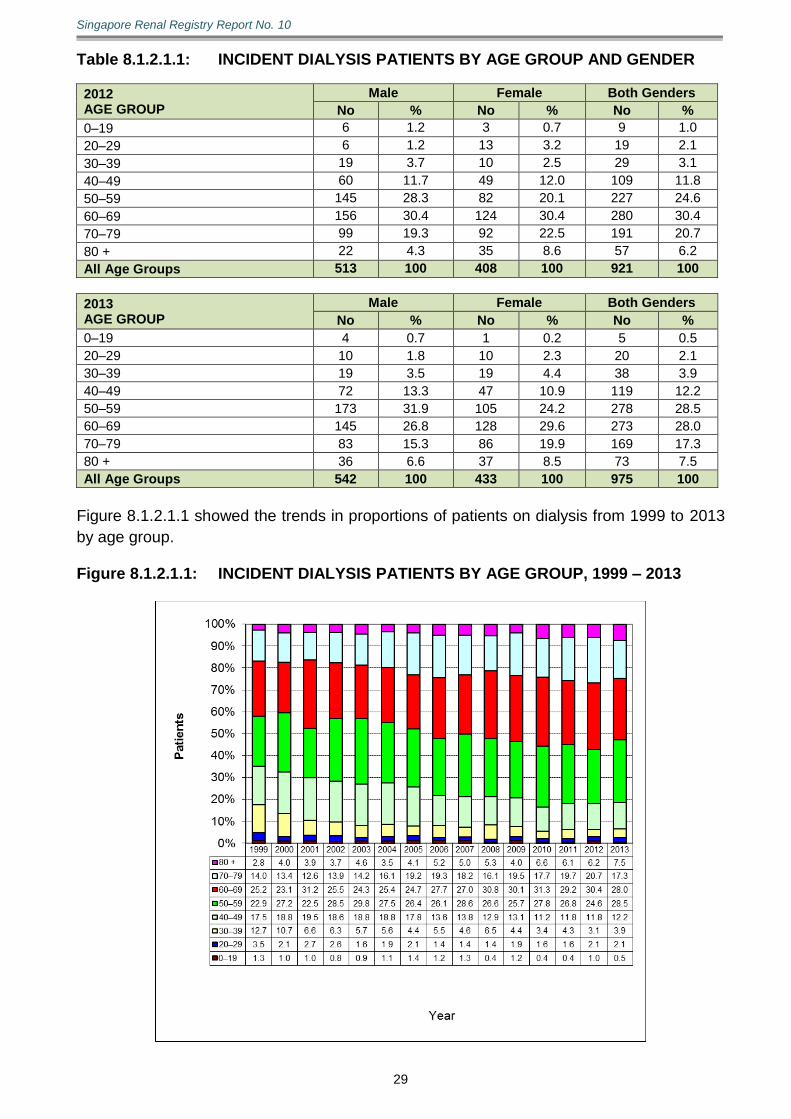
8.1.2.1 Incident Dialysis Patients by Age Group and Gender
Among definitive dialysis patients, males comprised 55.7% who survived 90 days after
commencement of dialysis in 2012 while this was 55.6% in 2013. In 2012, the modal age
group was 60 – 69 years; and the corresponding proportion of CKD5 patients aged 60
years and above at initiation of dialysis was 57.3%. Similarly, in 2013, the modal age group
was 60 – 69 years; and the proportion of CKD5 patients aged 60 years and above at
initiation of dialysis was 52.8%. See Table 8.1.2.1.1.
Singapore Renal Registry Report No. 10
29
Table 8.1.2.1.1: INCIDENT DIALYSIS PATIENTS BY AGE GROUP AND GENDER
2012 AGE GROUP
Male Female Both Genders
No % No % No %
0–19 6 1.2 3 0.7 9 1.0
20–29 6 1.2 13 3.2 19 2.1
30–39 19 3.7 10 2.5 29 3.1
40–49 60 11.7 49 12.0 109 11.8
50–59 145 28.3 82 20.1 227 24.6
60–69 156 30.4 124 30.4 280 30.4
70–79 99 19.3 92 22.5 191 20.7
80 + 22 4.3 35 8.6 57 6.2
All Age Groups 513 100 408 100 921 100
2013 AGE GROUP
Male Female Both Genders
No % No % No %
0–19 4 0.7 1 0.2 5 0.5
20–29 10 1.8 10 2.3 20 2.1
30–39 19 3.5 19 4.4 38 3.9
40–49 72 13.3 47 10.9 119 12.2
50–59 173 31.9 105 24.2 278 28.5
60–69 145 26.8 128 29.6 273 28.0
70–79 83 15.3 86 19.9 169 17.3
80 + 36 6.6 37 8.5 73 7.5
All Age Groups 542 100 433 100 975 100
Figure 8.1.2.1.1 showed the trends in proportions of patients on dialysis from 1999 to 2013
by age group. Figure 8.1.2.1.1: INCIDENT DIALYSIS PATIENTS BY AGE GROUP, 1999 – 2013
Singapore Renal Registry Report No. 10
30
8.1.2.2 Incident Dialysis Patients by Age Group and Modality
With the exception of age group 0 – 19 years, there was a comparatively greater
percentage of patients started on HD. See Table 8.1.2.2.1. Table 8.1.2.2.1: INCIDENT DIALYSIS PATIENTS BY AGE GROUP AND MODALITY 2012 AGE GROUP
HD PD HD + PD
No % No % No %
0–19 4 44.4 5 55.6 9 100
20–29 14 73.7 5 26.3 19 100
30–39 24 82.8 5 17.2 29 100
40–49 96 88.1 13 11.9 109 100
50–59 199 87.7 28 12.3 227 100
60–69 244 87.1 36 12.9 280 100
70–79 154 80.6 37 19.4 191 100
80 + 50 87.7 7 12.3 57 100
Total 785 85.2 136 14.8 921 100
2013 AGE GROUP
HD PD HD + PD
No % No % No %
0–19 1 20.0 4 80.0 5 100
20–29 16 80.0 4 20.0 20 100
30–39 31 81.6 7 18.4 38 100
40–49 108 90.8 11 9.2 119 100
50–59 234 84.2 44 15.8 278 100
60–69 225 82.4 48 17.6 273 100
70–79 133 78.7 36 21.3 169 100
80 + 54 74.0 19 26.0 73 100
Total 802 82.3 173 17.7 975 100
8.1.2.3 Incident Dialysis Patients by Ethnic Group and Gender
In both years, the racial composition was similar to the racial distribution of the population.
There was a male predominance in the Chinese but female predominance in the Malays for
both years. For the Indians, males outnumbered the females in 2012 but in 2013, the
converse was true. Table 8.1.2.3.1: INCIDENT DIALYSIS PATIENTS BY ETHNIC GROUP AND GENDER
2012 Male Female Both Genders
ETHNIC GROUP No % No % No %
Chinese 359 70.0 258 63.2 617 67.0
Malay 108 21.1 118 28.9 226 24.5
Indian 39 7.6 25 6.1 64 6.9
Others 7 1.4 7 1.7 14 1.5
All Ethnic Groups 513 100 408 100 921 100
2013 Male Female Both Genders
ETHNIC GROUP No % No % No %
Chinese 399 73.6 259 59.8 658 67.5
Malay 105 19.4 133 30.7 238 24.4
Indian 27 5.0 38 8.8 65 6.7
Others 11 2.0 3 0.7 14 1.4
All Ethnic Groups 542 100 433 100 975 100
Singapore Renal Registry Report No. 10
31
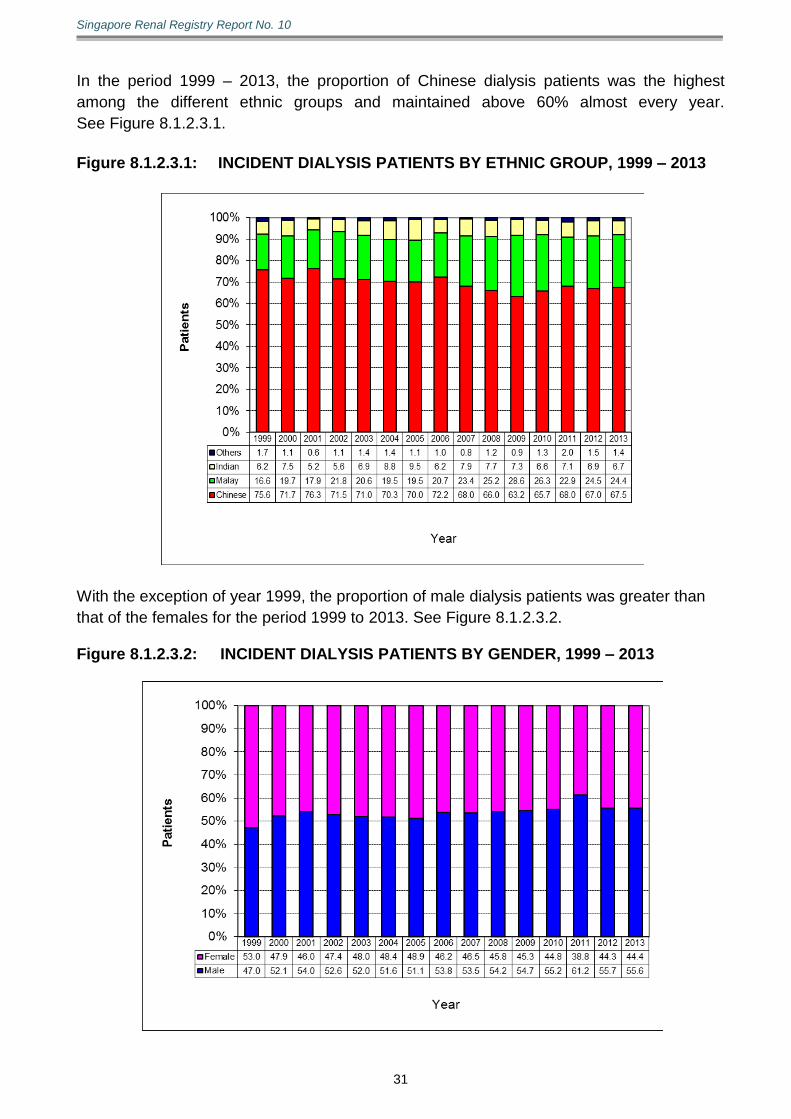
In the period 1999 – 2013, the proportion of Chinese dialysis patients was the highest
among the different ethnic groups and maintained above 60% almost every year.
See Figure 8.1.2.3.1.
Figure 8.1.2.3.1: INCIDENT DIALYSIS PATIENTS BY ETHNIC GROUP, 1999 – 2013
With the exception of year 1999, the proportion of male dialysis patients was greater than
that of the females for the period 1999 to 2013. See Figure 8.1.2.3.2.
Figure 8.1.2.3.2: INCIDENT DIALYSIS PATIENTS BY GENDER, 1999 – 2013

Singapore Renal Registry Report No. 10
32
8.1.3 Prevalent Dialysis Patients
8.1.3.1 Prevalent Dialysis Patients by Age Group and Gender
There were 5,244 prevalent dialysis patients (CR 1,373.6 pmp; ASR 948.7 pmp) at the end
of 2012 (Table 8.1.1.1). Of these, 54.6% were males. The proportion aged 60 years and
above was 55.6% (Table 8.1.3.1.1).
At the end of 2013, there were 5,521 prevalent dialysis patients (CR 1,436.1 pmp, ASR
961.3 pmp). 55.0% of them were males; proportion aged 60 years and above was 56.8%. Table 8.1.3.1.1: PREVALENT DIALYSIS PATIENTS BY AGE GROUP AND GENDER
2012 Male Female Both Genders
AGE GROUP No % No % No %
0–19 8 0.3 7 0.3 15 0.3
20–29 33 1.2 35 1.5 68 1.3
30–39 111 3.9 71 3.0 182 3.5
40–49 346 12.1 275 11.5 621 11.8
50–59 800 27.9 639 26.8 1439 27.4
60–69 938 32.8 695 29.2 1633 31.1
70–79 481 16.8 510 21.4 991 18.9
80 + 146 5.1 149 6.3 295 5.6
All Age Groups 2863 100 2381 100 5244 100
2013 Male Female Both Genders
AGE GROUP No % No % No %
0–19 6 0.2 5 0.2 11 0.2
20–29 35 1.2 38 1.5 73 1.3
30–39 124 4.1 75 3.0 199 3.6
40–49 348 11.5 263 10.6 611 11.1
50–59 844 27.8 649 26.1 1493 27.0
60–69 989 32.6 750 30.2 1739 31.5
70–79 512 16.9 533 21.5 1045 18.9
80 + 179 5.9 171 6.9 350 6.3
All Age Groups 3037 100 2484 100 5521 100
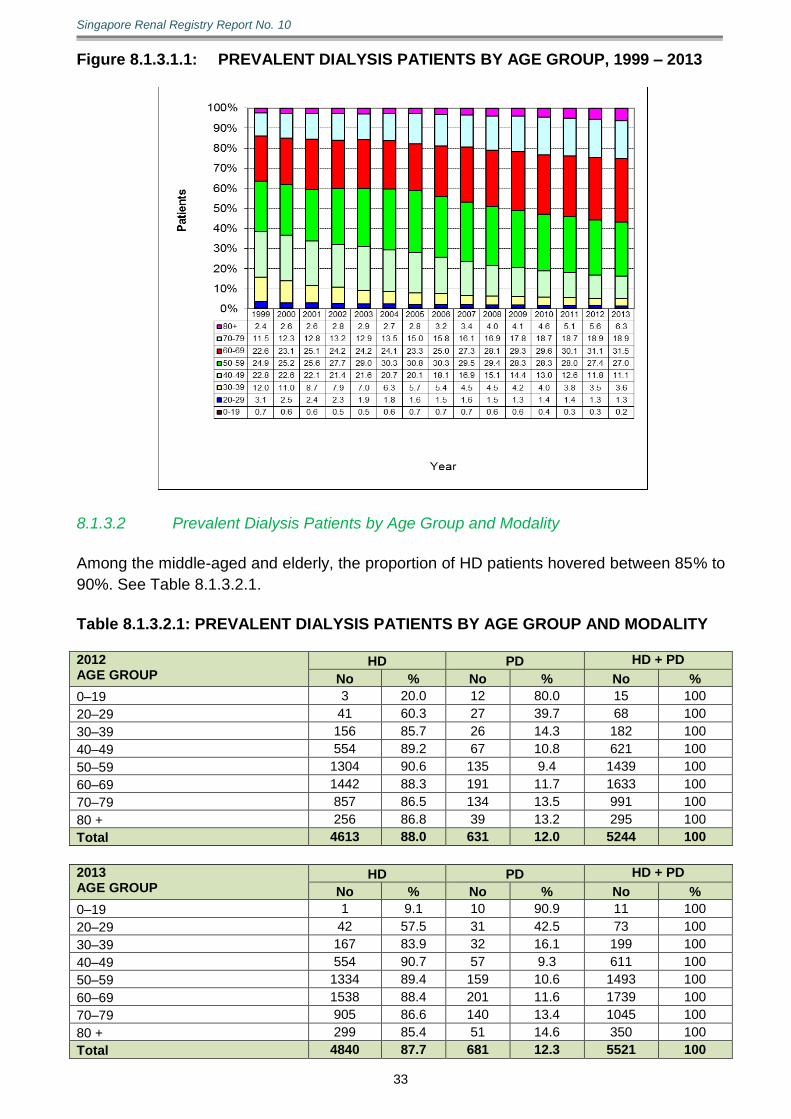
The trends in age groups are shown in Figure 8.1.3.1.1. The proportion of patients in age
groups 60 years and above increased while the remaining age groups decreased or
remained constant over the years. Notably, the proportion of dialysis patients aged 60 years
and above increased from 36.5% in 1999 to 56.8% in 2013.
Singapore Renal Registry Report No. 10
33
Figure 8.1.3.1.1: PREVALENT DIALYSIS PATIENTS BY AGE GROUP, 1999 – 2013
8.1.3.2 Prevalent Dialysis Patients by Age Group and Modality
Among the middle-aged and elderly, the proportion of HD patients hovered between 85% to
90%. See Table 8.1.3.2.1.
Table 8.1.3.2.1: PREVALENT DIALYSIS PATIENTS BY AGE GROUP AND MODALITY 2012 AGE GROUP
HD PD HD + PD
No % No % No %
0–19 3 20.0 12 80.0 15 100
20–29 41 60.3 27 39.7 68 100
30–39 156 85.7 26 14.3 182 100
40–49 554 89.2 67 10.8 621 100
50–59 1304 90.6 135 9.4 1439 100
60–69 1442 88.3 191 11.7 1633 100
70–79 857 86.5 134 13.5 991 100
80 + 256 86.8 39 13.2 295 100
Total 4613 88.0 631 12.0 5244 100
2013 AGE GROUP
HD PD HD + PD
No % No % No %
0–19 1 9.1 10 90.9 11 100
20–29 42 57.5 31 42.5 73 100
30–39 167 83.9 32 16.1 199 100
40–49 554 90.7 57 9.3 611 100
50–59 1334 89.4 159 10.6 1493 100
60–69 1538 88.4 201 11.6 1739 100
70–79 905 86.6 140 13.4 1045 100
80 + 299 85.4 51 14.6 350 100
Total 4840 87.7 681 12.3 5521 100
Singapore Renal Registry Report No. 10
34
8.1.3.3 Prevalent Dialysis Patients by Ethnic Group and Gender
In 2012 and 2013, the racial composition was similar to the racial distribution of the
population. There was a male predominance in the Chinese and the Indians but female
predominance in the Malays for both years. Table 8.1.3.3.1: PREVALENT DIALYSIS PATIENTS BY ETHNIC GROUP AND GENDER
2012 Male Female Both Genders
ETHNIC GROUP No % No % No %
Chinese 2018 70.5 1541 64.7 3559 67.9
Malay 592 20.7 668 28.1 1260 24.0
Indian 220 7.7 138 5.8 358 6.8
Others 33 1.2 34 1.4 67 1.3
All Ethnic Groups 2863 100 2381 100 5244 100
2013 Male Female Both Genders
ETHNIC GROUP No % No % No %
Chinese 2158 71.1 1583 63.7 3741 67.8
Malay 627 20.6 715 28.8 1342 24.3
Indian 216 7.1 160 6.4 376 6.8
Others 36 1.2 26 1.0 62 1.1
All Ethnic Groups 3037 100 2484 100 5521 100
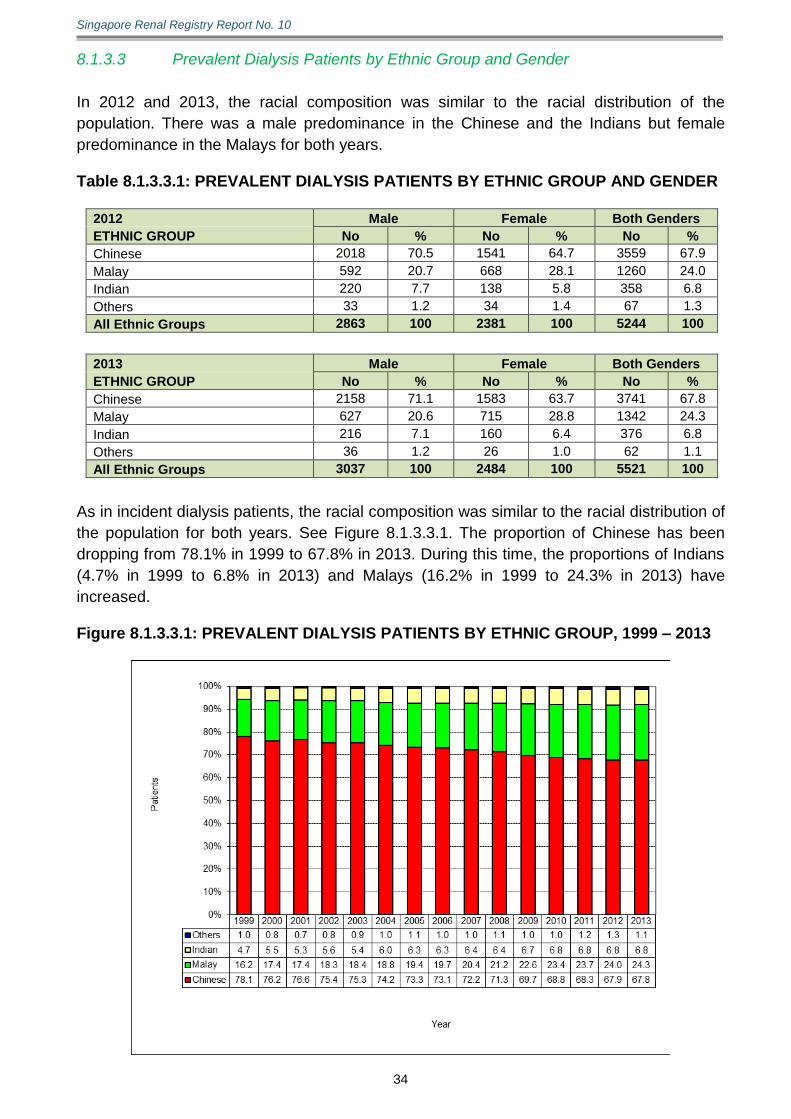
As in incident dialysis patients, the racial composition was similar to the racial distribution of
the population for both years. See Figure 8.1.3.3.1. The proportion of Chinese has been
dropping from 78.1% in 1999 to 67.8% in 2013. During this time, the proportions of Indians
(4.7% in 1999 to 6.8% in 2013) and Malays (16.2% in 1999 to 24.3% in 2013) have
increased. Figure 8.1.3.3.1: PREVALENT DIALYSIS PATIENTS BY ETHNIC GROUP, 1999 – 2013
Singapore Renal Registry Report No. 10
35
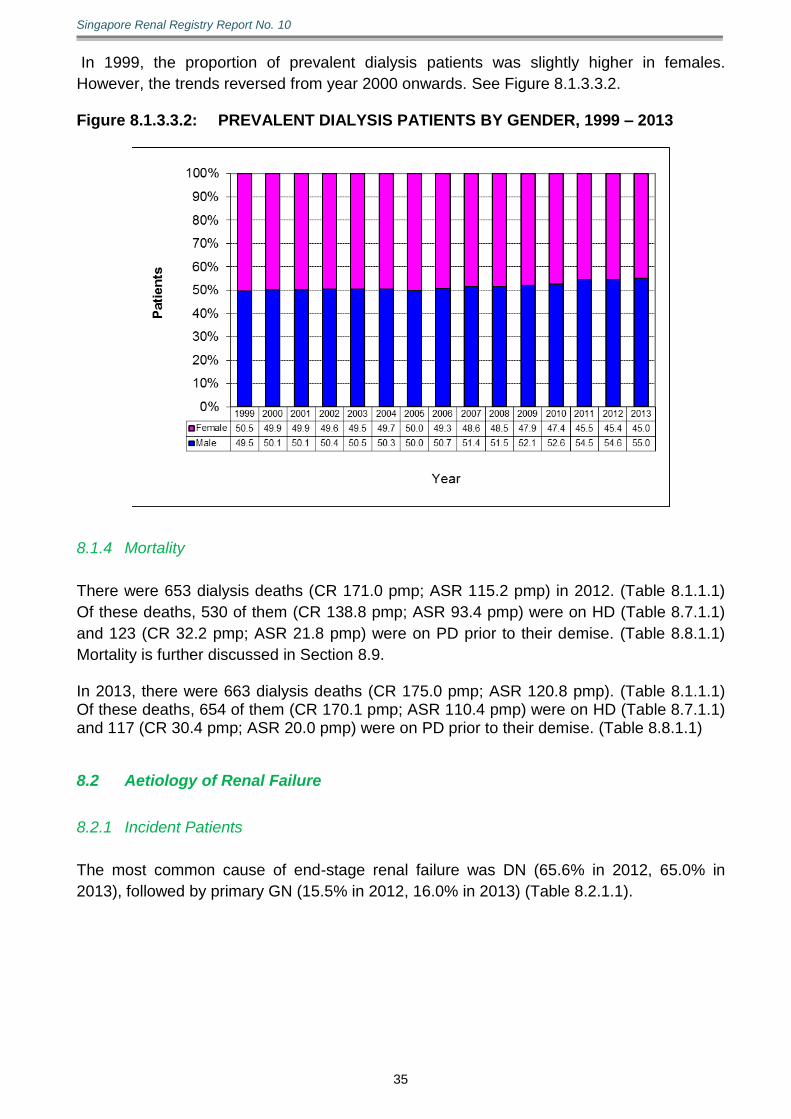
In 1999, the proportion of prevalent dialysis patients was slightly higher in females.
However, the trends reversed from year 2000 onwards. See Figure 8.1.3.3.2. Figure 8.1.3.3.2: PREVALENT DIALYSIS PATIENTS BY GENDER, 1999 – 2013
8.1.4 Mortality
There were 653 dialysis deaths (CR 171.0 pmp; ASR 115.2 pmp) in 2012. (Table 8.1.1.1)
Of these deaths, 530 of them (CR 138.8 pmp; ASR 93.4 pmp) were on HD (Table 8.7.1.1)
and 123 (CR 32.2 pmp; ASR 21.8 pmp) were on PD prior to their demise. (Table 8.8.1.1)
Mortality is further discussed in Section 8.9. In 2013, there were 663 dialysis deaths (CR 175.0 pmp; ASR 120.8 pmp). (Table 8.1.1.1) Of these deaths, 654 of them (CR 170.1 pmp; ASR 110.4 pmp) were on HD (Table 8.7.1.1) and 117 (CR 30.4 pmp; ASR 20.0 pmp) were on PD prior to their demise. (Table 8.8.1.1)
8.2 Aetiology of Renal Failure
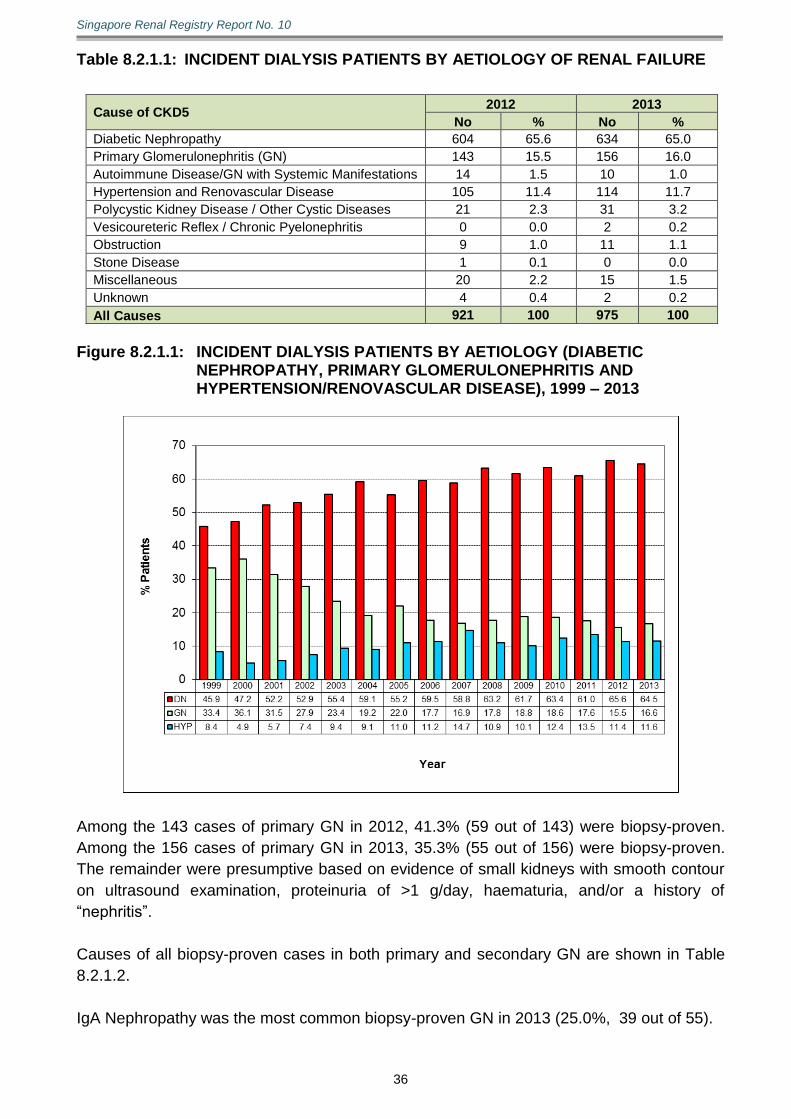
8.2.1 Incident Patients
The most common cause of end-stage renal failure was DN (65.6% in 2012, 65.0% in
2013), followed by primary GN (15.5% in 2012, 16.0% in 2013) (Table 8.2.1.1).
Singapore Renal Registry Report No. 10
36
Table 8.2.1.1: INCIDENT DIALYSIS PATIENTS BY AETIOLOGY OF RENAL FAILURE
Cause of CKD5 2012 2013
No % No %
Diabetic Nephropathy 604 65.6 634 65.0
Primary Glomerulonephritis (GN) 143 15.5 156 16.0
Autoimmune Disease/GN with Systemic Manifestations 14 1.5 10 1.0
Hypertension and Renovascular Disease 105 11.4 114 11.7
Polycystic Kidney Disease / Other Cystic Diseases 21 2.3 31 3.2
Vesicoureteric Reflex / Chronic Pyelonephritis 0 0.0 2 0.2
Obstruction 9 1.0 11 1.1
Stone Disease 1 0.1 0 0.0
Miscellaneous 20 2.2 15 1.5
Unknown 4 0.4 2 0.2
All Causes 921 100 975 100
Figure 8.2.1.1: INCIDENT DIALYSIS PATIENTS BY AETIOLOGY (DIABETIC
NEPHROPATHY, PRIMARY GLOMERULONEPHRITIS AND HYPERTENSION/RENOVASCULAR DISEASE), 1999 – 2013
Among the 143 cases of primary GN in 2012, 41.3% (59 out of 143) were biopsy-proven.
Among the 156 cases of primary GN in 2013, 35.3% (55 out of 156) were biopsy-proven.
The remainder were presumptive based on evidence of small kidneys with smooth contour
on ultrasound examination, proteinuria of >1 g/day, haematuria, and/or a history of
“nephritis”.
Causes of all biopsy-proven cases in both primary and secondary GN are shown in Table
8.2.1.2.
IgA Nephropathy was the most common biopsy-proven GN in 2013 (25.0%, 39 out of 55).
Singapore Renal Registry Report No. 10
37
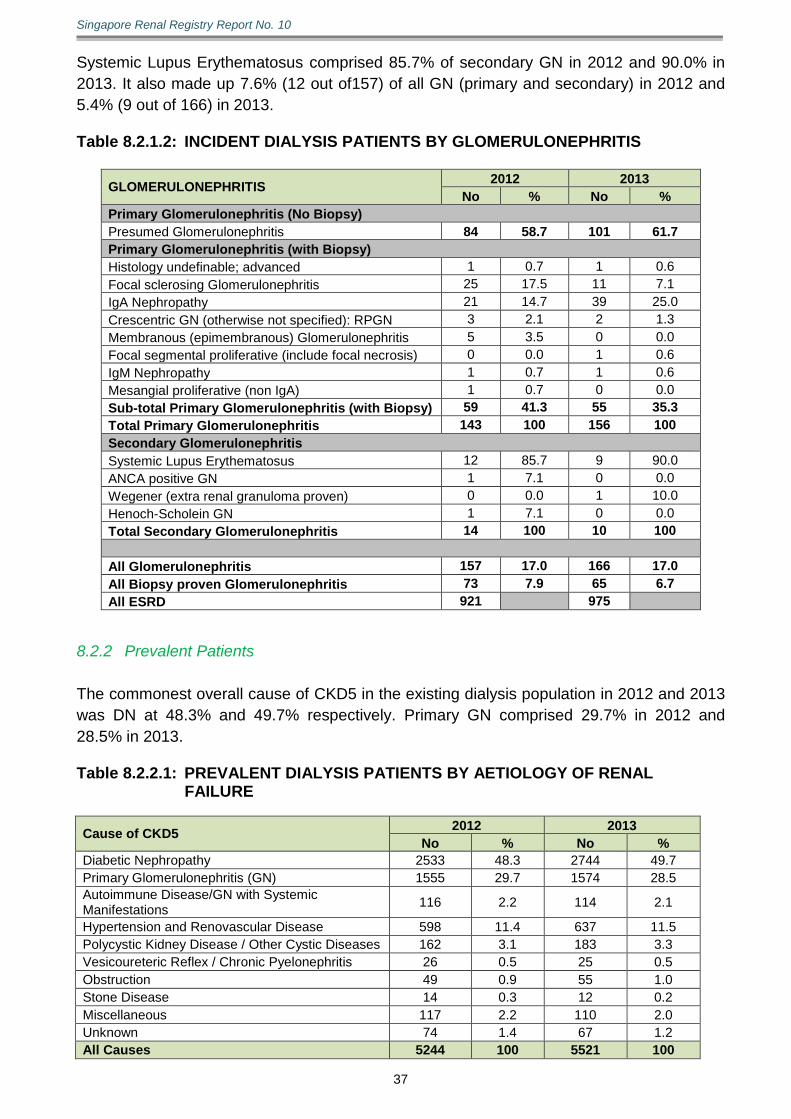
Systemic Lupus Erythematosus comprised 85.7% of secondary GN in 2012 and 90.0% in
2013. It also made up 7.6% (12 out of157) of all GN (primary and secondary) in 2012 and
5.4% (9 out of 166) in 2013. Table 8.2.1.2: INCIDENT DIALYSIS PATIENTS BY GLOMERULONEPHRITIS
GLOMERULONEPHRITIS 2012 2013
No % No %
Primary Glomerulonephritis (No Biopsy)
Presumed Glomerulonephritis 84 58.7 101 61.7
Primary Glomerulonephritis (with Biopsy)
Histology undefinable; advanced 1 0.7 1 0.6
Focal sclerosing Glomerulonephritis 25 17.5 11 7.1
IgA Nephropathy 21 14.7 39 25.0
Crescentric GN (otherwise not specified): RPGN 3 2.1 2 1.3
Membranous (epimembranous) Glomerulonephritis 5 3.5 0 0.0
Focal segmental proliferative (include focal necrosis) 0 0.0 1 0.6
IgM Nephropathy 1 0.7 1 0.6
Mesangial proliferative (non IgA) 1 0.7 0 0.0
Sub-total Primary Glomerulonephritis (with Biopsy) 59 41.3 55 35.3
Total Primary Glomerulonephritis 143 100 156 100
Secondary Glomerulonephritis
Systemic Lupus Erythematosus 12 85.7 9 90.0
ANCA positive GN 1 7.1 0 0.0
Wegener (extra renal granuloma proven) 0 0.0 1 10.0
Henoch-Scholein GN 1 7.1 0 0.0
Total Secondary Glomerulonephritis 14 100 10 100
All Glomerulonephritis 157 17.0 166 17.0
All Biopsy proven Glomerulonephritis 73 7.9 65 6.7
All ESRD 921 975
8.2.2 Prevalent Patients
The commonest overall cause of CKD5 in the existing dialysis population in 2012 and 2013
was DN at 48.3% and 49.7% respectively. Primary GN comprised 29.7% in 2012 and
28.5% in 2013. Table 8.2.2.1: PREVALENT DIALYSIS PATIENTS BY AETIOLOGY OF RENAL
FAILURE
Cause of CKD5 2012 2013
No % No %
Diabetic Nephropathy 2533 48.3 2744 49.7
Primary Glomerulonephritis (GN) 1555 29.7 1574 28.5
Autoimmune Disease/GN with Systemic Manifestations
116 2.2 114 2.1
Hypertension and Renovascular Disease 598 11.4 637 11.5
Polycystic Kidney Disease / Other Cystic Diseases 162 3.1 183 3.3
Vesicoureteric Reflex / Chronic Pyelonephritis 26 0.5 25 0.5
Obstruction 49 0.9 55 1.0
Stone Disease 14 0.3 12 0.2
Miscellaneous 117 2.2 110 2.0
Unknown 74 1.4 67 1.2
All Causes 5244 100 5521 100
Singapore Renal Registry Report No. 10
38
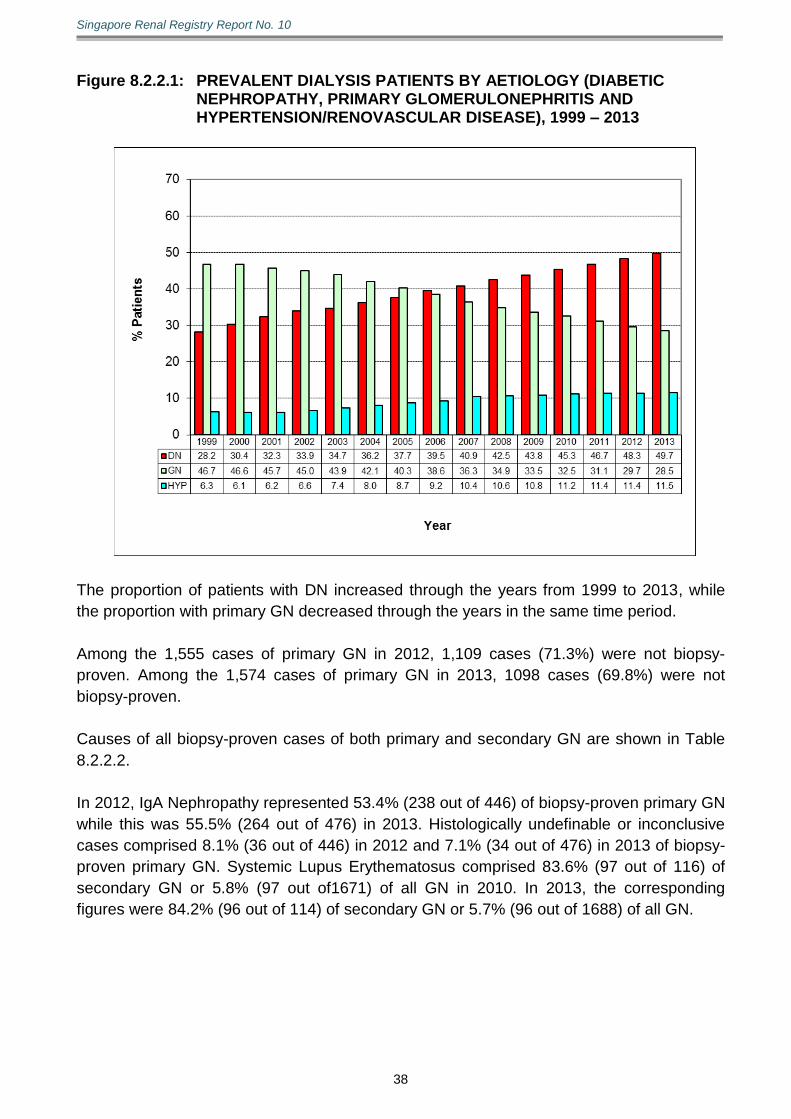
Figure 8.2.2.1: PREVALENT DIALYSIS PATIENTS BY AETIOLOGY (DIABETIC
NEPHROPATHY, PRIMARY GLOMERULONEPHRITIS AND HYPERTENSION/RENOVASCULAR DISEASE), 1999 – 2013
The proportion of patients with DN increased through the years from 1999 to 2013, while
the proportion with primary GN decreased through the years in the same time period.
Among the 1,555 cases of primary GN in 2012, 1,109 cases (71.3%) were not biopsy-
proven. Among the 1,574 cases of primary GN in 2013, 1098 cases (69.8%) were not
biopsy-proven.
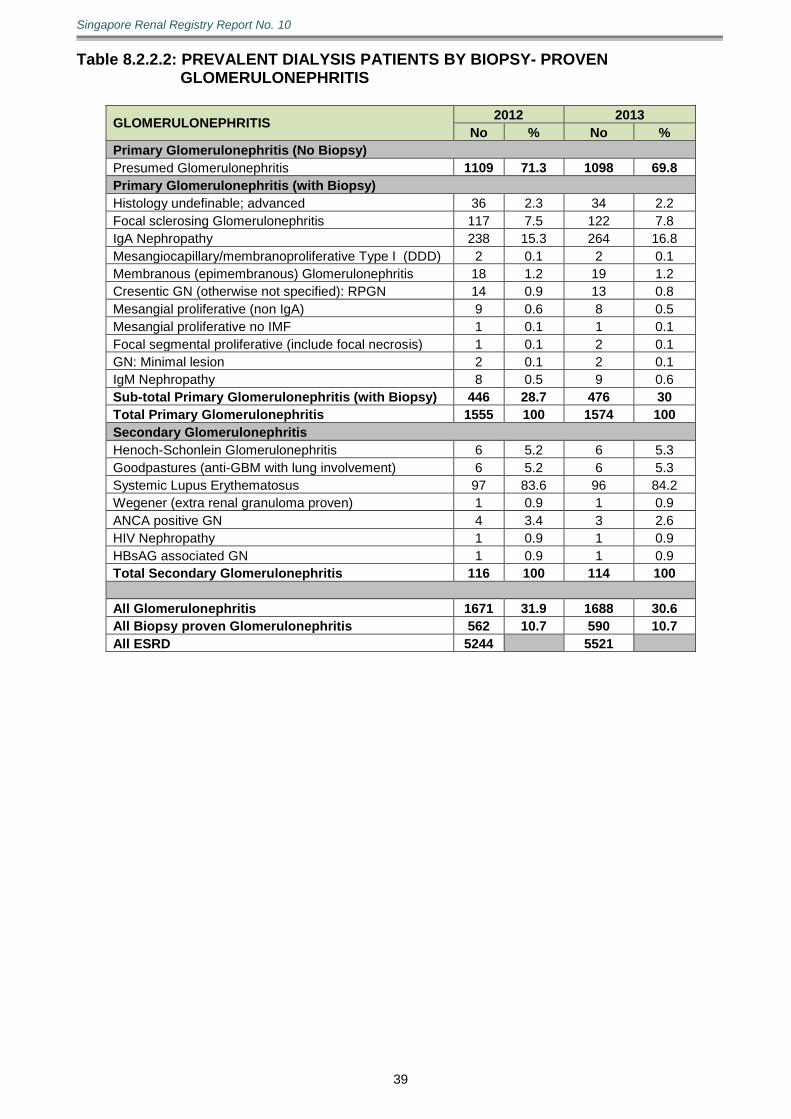
Causes of all biopsy-proven cases of both primary and secondary GN are shown in Table
8.2.2.2.
In 2012, IgA Nephropathy represented 53.4% (238 out of 446) of biopsy-proven primary GN
while this was 55.5% (264 out of 476) in 2013. Histologically undefinable or inconclusive
cases comprised 8.1% (36 out of 446) in 2012 and 7.1% (34 out of 476) in 2013 of biopsy-
proven primary GN. Systemic Lupus Erythematosus comprised 83.6% (97 out of 116) of
secondary GN or 5.8% (97 out of1671) of all GN in 2010. In 2013, the corresponding
figures were 84.2% (96 out of 114) of secondary GN or 5.7% (96 out of 1688) of all GN.
Singapore Renal Registry Report No. 10
39
Table 8.2.2.2: PREVALENT DIALYSIS PATIENTS BY BIOPSY- PROVEN GLOMERULONEPHRITIS
GLOMERULONEPHRITIS 2012 2013
No % No %
Primary Glomerulonephritis (No Biopsy)
Presumed Glomerulonephritis 1109 71.3 1098 69.8
Primary Glomerulonephritis (with Biopsy)
Histology undefinable; advanced 36 2.3 34 2.2
Focal sclerosing Glomerulonephritis 117 7.5 122 7.8
IgA Nephropathy 238 15.3 264 16.8
Mesangiocapillary/membranoproliferative Type I (DDD) 2 0.1 2 0.1
Membranous (epimembranous) Glomerulonephritis 18 1.2 19 1.2
Cresentic GN (otherwise not specified): RPGN 14 0.9 13 0.8
Mesangial proliferative (non IgA) 9 0.6 8 0.5
Mesangial proliferative no IMF 1 0.1 1 0.1
Focal segmental proliferative (include focal necrosis) 1 0.1 2 0.1
GN: Minimal lesion 2 0.1 2 0.1
IgM Nephropathy 8 0.5 9 0.6
Sub-total Primary Glomerulonephritis (with Biopsy) 446 28.7 476 30
Total Primary Glomerulonephritis 1555 100 1574 100
Secondary Glomerulonephritis
Henoch-Schonlein Glomerulonephritis 6 5.2 6 5.3
Goodpastures (anti-GBM with lung involvement) 6 5.2 6 5.3
Systemic Lupus Erythematosus 97 83.6 96 84.2
Wegener (extra renal granuloma proven) 1 0.9 1 0.9
ANCA positive GN 4 3.4 3 2.6
HIV Nephropathy 1 0.9 1 0.9
HBsAG associated GN 1 0.9 1 0.9
Total Secondary Glomerulonephritis 116 100 114 100
All Glomerulonephritis 1671 31.9 1688 30.6
All Biopsy proven Glomerulonephritis 562 10.7 590 10.7
All ESRD 5244 5521
Singapore Renal Registry Report No. 10
40
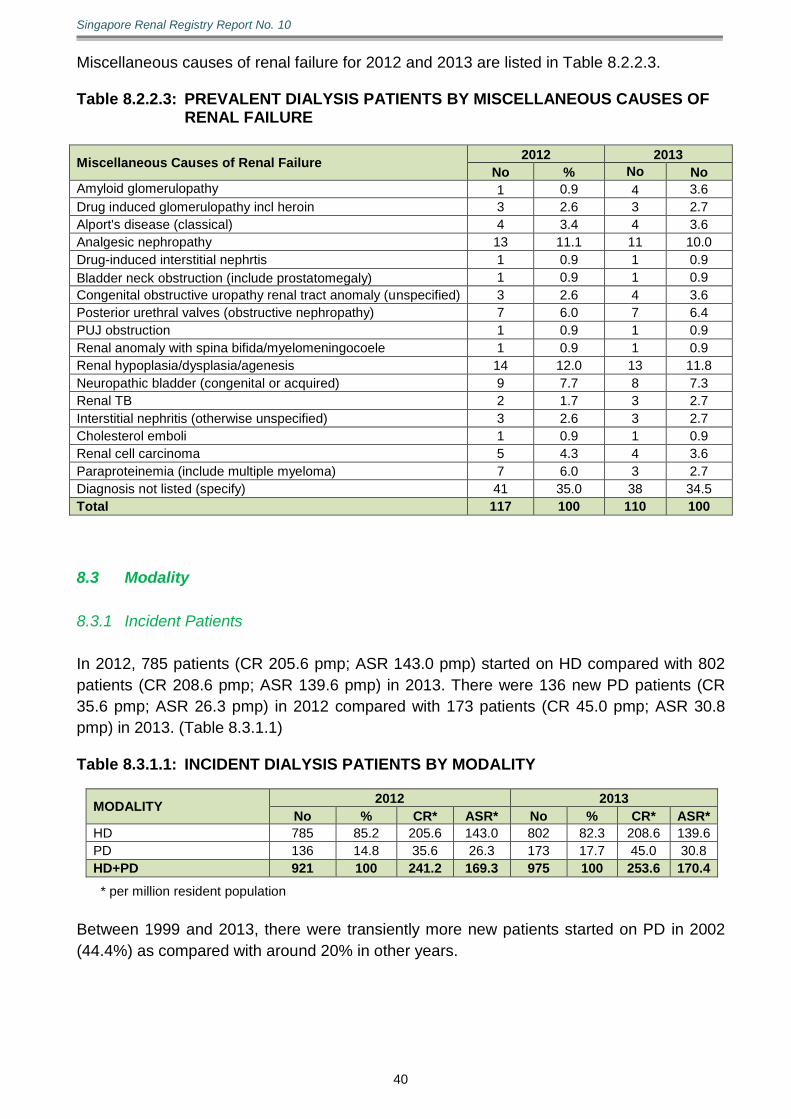
Miscellaneous causes of renal failure for 2012 and 2013 are listed in Table 8.2.2.3. Table 8.2.2.3: PREVALENT DIALYSIS PATIENTS BY MISCELLANEOUS CAUSES OF
RENAL FAILURE
Miscellaneous Causes of Renal Failure 2012 2013
No % No No
Amyloid glomerulopathy 1 0.9 4 3.6
Drug induced glomerulopathy incl heroin 3 2.6 3 2.7
Alport's disease (classical) 4 3.4 4 3.6
Analgesic nephropathy 13 11.1 11 10.0
Drug-induced interstitial nephrtis 1 0.9 1 0.9
Bladder neck obstruction (include prostatomegaly) 1 0.9 1 0.9
Congenital obstructive uropathy renal tract anomaly (unspecified) 3 2.6 4 3.6
Posterior urethral valves (obstructive nephropathy) 7 6.0 7 6.4
PUJ obstruction 1 0.9 1 0.9
Renal anomaly with spina bifida/myelomeningocoele 1 0.9 1 0.9
Renal hypoplasia/dysplasia/agenesis 14 12.0 13 11.8
Neuropathic bladder (congenital or acquired) 9 7.7 8 7.3
Renal TB 2 1.7 3 2.7
Interstitial nephritis (otherwise unspecified) 3 2.6 3 2.7
Cholesterol emboli 1 0.9 1 0.9
Renal cell carcinoma 5 4.3 4 3.6
Paraproteinemia (include multiple myeloma) 7 6.0 3 2.7
Diagnosis not listed (specify) 41 35.0 38 34.5
Total 117 100 110 100
8.3 Modality
8.3.1 Incident Patients
In 2012, 785 patients (CR 205.6 pmp; ASR 143.0 pmp) started on HD compared with 802
patients (CR 208.6 pmp; ASR 139.6 pmp) in 2013. There were 136 new PD patients (CR
35.6 pmp; ASR 26.3 pmp) in 2012 compared with 173 patients (CR 45.0 pmp; ASR 30.8
pmp) in 2013. (Table 8.3.1.1) Table 8.3.1.1: INCIDENT DIALYSIS PATIENTS BY MODALITY
MODALITY 2012 2013
No % CR* ASR* No % CR* ASR*
HD 785 85.2 205.6 143.0 802 82.3 208.6 139.6
PD 136 14.8 35.6 26.3 173 17.7 45.0 30.8
HD+PD 921 100 241.2 169.3 975 100 253.6 170.4
* per million resident population
Between 1999 and 2013, there were transiently more new patients started on PD in 2002
(44.4%) as compared with around 20% in other years.

Singapore Renal Registry Report No. 10
41
Figure 8.3.1.1: INCIDENT DIALYSIS PATIENTS BY MODALITY, 1999 – 2013
The proportion of patients aged 60 years and above was 57.1% for those on HD and 58.8%
for PD in 2012. The proportion of patients aged 60 years and above was 51.4% for those
on HD and 59.5% for PD in 2013 (Table 8.3.1.2). Table 8.3.1.2: INCIDENT DIALYSIS PATIENTS BY AGE GROUP AND MODALITY
2012 AGE GROUP
HD PD HD+PD
No % CR No % CR No % CR
0–19 4 0.5 4.5 5 3.7 5.6 9 1.0 10.2
20–29 14 1.8 27.0 5 3.7 9.6 19 2.1 36.6
30–39 24 3.1 39.4 5 3.7 8.2 29 3.1 47.6
40–49 96 12.2 152.5 13 9.6 20.6 109 11.8 173.1
50–59 199 25.4 341.8 28 20.6 48.1 227 24.6 389.9
60–69 244 31.1 711.8 36 26.5 105.0 280 30.4 816.8
70–79 154 19.6 895.3 37 27.2 215.1 191 20.7 1110.5
80 + 50 6.4 644.3 7 5.1 90.2 57 6.2 734.5
All Age Groups 785 100 205.6 136 100 35.6 921 100 241.2
2013 AGE GROUP
HD PD HD+PD
No % CR No % CR No % CR
0–19 1 0.1 1.1 4 2.3 4.6 5 0.5 5.7
20–29 16 2.0 30.6 4 2.3 7.7 20 2.1 38.3
30–39 31 3.9 51.5 7 4.0 11.6 38 3.9 63.1
40–49 108 13.5 171.8 11 6.4 17.5 119 12.2 189.2
50–59 234 29.2 394.0 44 25.4 74.1 278 28.5 468.1
60–69 225 28.1 611.2 48 27.7 130.4 273 28.0 741.6
70–79 133 16.6 755.3 36 20.8 204.4 169 17.3 959.7
80 + 54 6.7 657.7 19 11.0 231.4 73 7.5 889.2
All Age Groups 802 100 208.6 173 100 45.0 975 100 253.6
* per million resident population

Singapore Renal Registry Report No. 10
42
The proportion of patients on HD aged 60 years and above was 57.1% in 2012 and 51.4%
in 2011. The proportion of patients on PD aged 60 years and above was 58.8% in 2012 and
59.5% in 2013 (Table 8.3.1.2).
Figure 8.3.1.2: INCIDENT PATIENTS AGED 60 YEARS AND ABOVE BY MODALITY,
1999 – 2013
In 2012, the mean age of incident PD patients was 1 year younger than the incident HD
patients (60.4 (median: 64.6) years versus 61.4 (median: 62.3) years respectively). The gap
increased to 2 years in 2013 where the mean age of PD patients was 62.3 (median: 65.2)
years compared with 60.5 (median: 60.6) years in HD patients (Table 8.3.1.3). Table 8.3.1.3: AGE OF INCIDENT PATIENTS BY MODALITY
MODALITY 2012 2013
Mean Age Median Age Std Dev Mean Age Median Age Std Dev
HD 61.4 62.3 13.1 60.5 60.6 12.9
PD 60.4 64.6 16.3 62.3 65.2 15.6
HD+PD 61.2 62.6 13.6 60.8 61.1 13.4
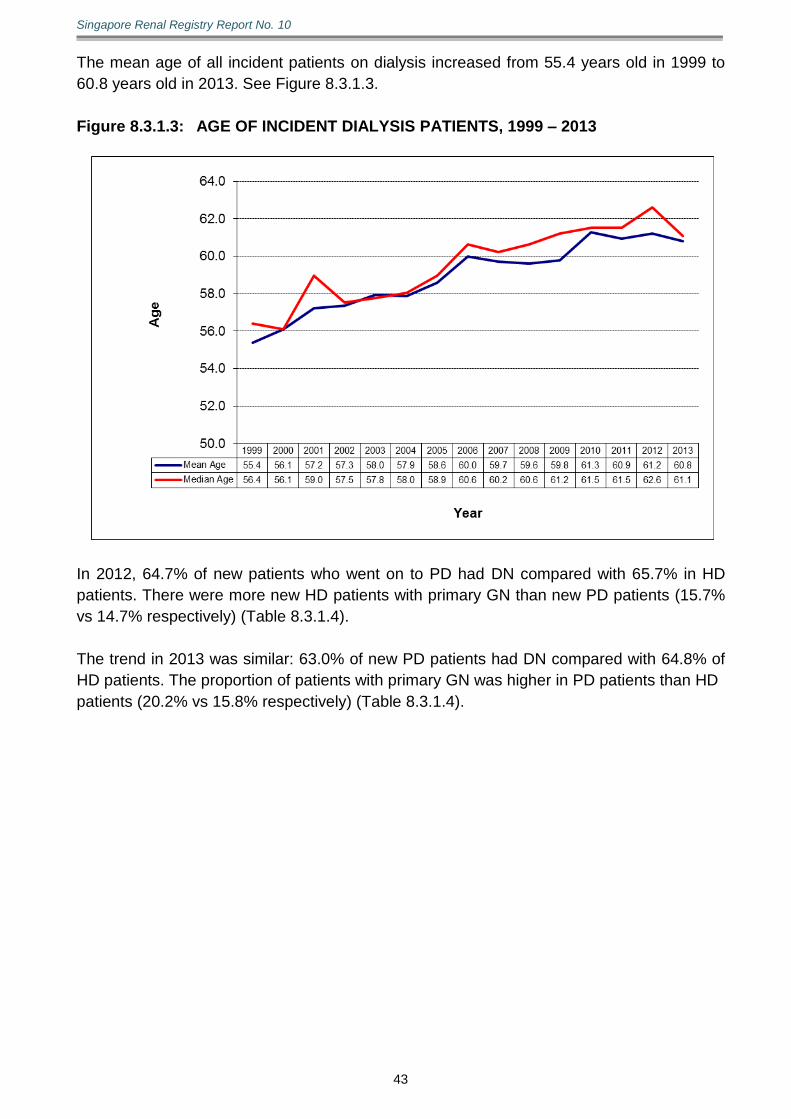
Singapore Renal Registry Report No. 10
43
The mean age of all incident patients on dialysis increased from 55.4 years old in 1999 to
60.8 years old in 2013. See Figure 8.3.1.3.
Figure 8.3.1.3: AGE OF INCIDENT DIALYSIS PATIENTS, 1999 – 2013
In 2012, 64.7% of new patients who went on to PD had DN compared with 65.7% in HD
patients. There were more new HD patients with primary GN than new PD patients (15.7%
vs 14.7% respectively) (Table 8.3.1.4).
The trend in 2013 was similar: 63.0% of new PD patients had DN compared with 64.8% of
HD patients. The proportion of patients with primary GN was higher in PD patients than HD
patients (20.2% vs 15.8% respectively) (Table 8.3.1.4).
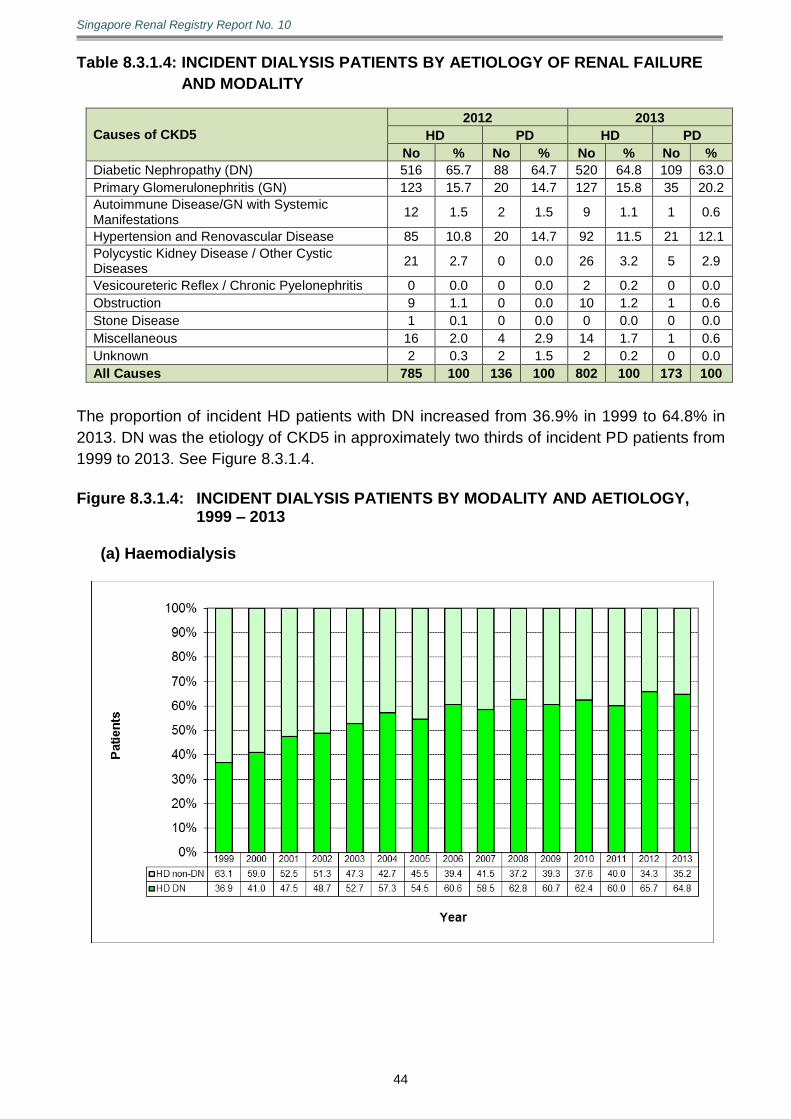
Singapore Renal Registry Report No. 10
44
Table 8.3.1.4: INCIDENT DIALYSIS PATIENTS BY AETIOLOGY OF RENAL FAILURE
AND MODALITY
Causes of CKD5
2012 2013
HD PD HD PD
No % No % No % No %
Diabetic Nephropathy (DN) 516 65.7 88 64.7 520 64.8 109 63.0
Primary Glomerulonephritis (GN) 123 15.7 20 14.7 127 15.8 35 20.2
Autoimmune Disease/GN with Systemic Manifestations
12 1.5 2 1.5 9 1.1 1 0.6
Hypertension and Renovascular Disease 85 10.8 20 14.7 92 11.5 21 12.1
Polycystic Kidney Disease / Other Cystic Diseases
21 2.7 0 0.0 26 3.2 5 2.9
Vesicoureteric Reflex / Chronic Pyelonephritis 0 0.0 0 0.0 2 0.2 0 0.0
Obstruction 9 1.1 0 0.0 10 1.2 1 0.6
Stone Disease 1 0.1 0 0.0 0 0.0 0 0.0
Miscellaneous 16 2.0 4 2.9 14 1.7 1 0.6
Unknown 2 0.3 2 1.5 2 0.2 0 0.0
All Causes 785 100 136 100 802 100 173 100
The proportion of incident HD patients with DN increased from 36.9% in 1999 to 64.8% in
2013. DN was the etiology of CKD5 in approximately two thirds of incident PD patients from
1999 to 2013. See Figure 8.3.1.4.
Figure 8.3.1.4: INCIDENT DIALYSIS PATIENTS BY MODALITY AND AETIOLOGY,
1999 – 2013
(a) Haemodialysis
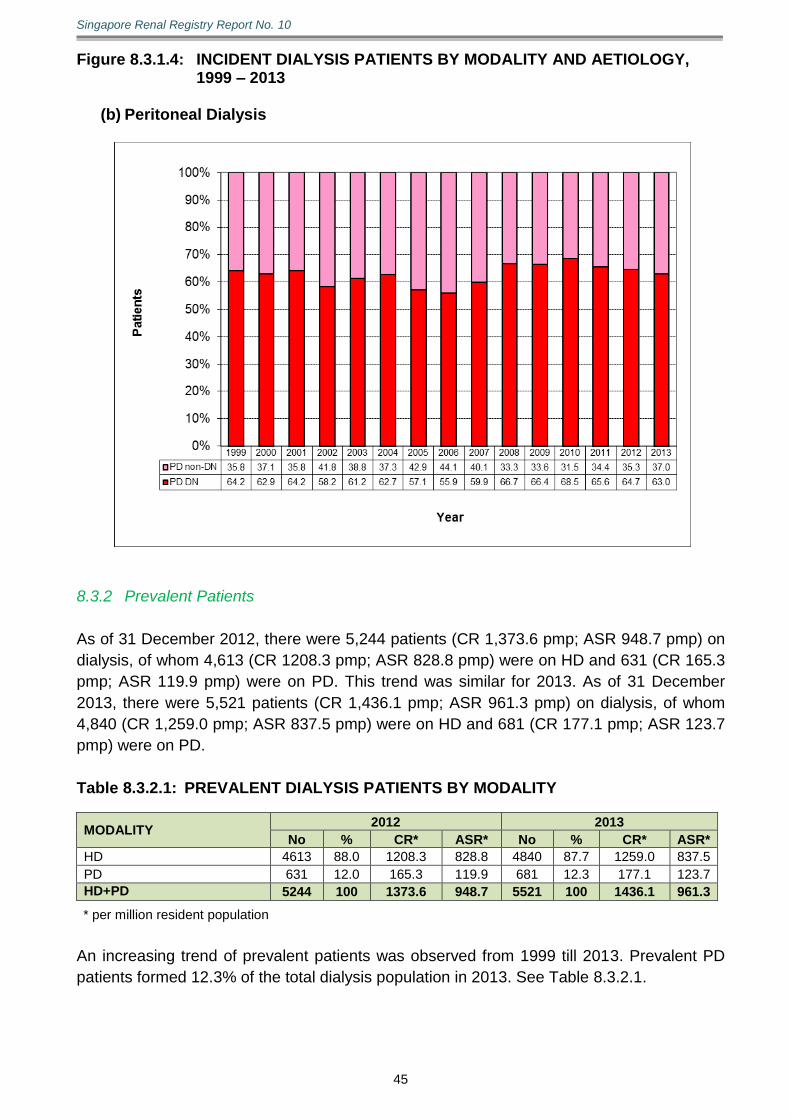
Singapore Renal Registry Report No. 10
45
Figure 8.3.1.4: INCIDENT DIALYSIS PATIENTS BY MODALITY AND AETIOLOGY, 1999 – 2013
(b) Peritoneal Dialysis
8.3.2 Prevalent Patients
As of 31 December 2012, there were 5,244 patients (CR 1,373.6 pmp; ASR 948.7 pmp) on
dialysis, of whom 4,613 (CR 1208.3 pmp; ASR 828.8 pmp) were on HD and 631 (CR 165.3
pmp; ASR 119.9 pmp) were on PD. This trend was similar for 2013. As of 31 December
2013, there were 5,521 patients (CR 1,436.1 pmp; ASR 961.3 pmp) on dialysis, of whom
4,840 (CR 1,259.0 pmp; ASR 837.5 pmp) were on HD and 681 (CR 177.1 pmp; ASR 123.7
pmp) were on PD.
Table 8.3.2.1: PREVALENT DIALYSIS PATIENTS BY MODALITY
MODALITY 2012 2013
No % CR* ASR* No % CR* ASR*
HD 4613 88.0 1208.3 828.8 4840 87.7 1259.0 837.5
PD 631 12.0 165.3 119.9 681 12.3 177.1 123.7
HD+PD 5244 100 1373.6 948.7 5521 100 1436.1 961.3
* per million resident population
An increasing trend of prevalent patients was observed from 1999 till 2013. Prevalent PD
patients formed 12.3% of the total dialysis population in 2013. See Table 8.3.2.1.

Singapore Renal Registry Report No. 10
46
Figure 8.3.2.1: PREVALENT DIALYSIS PATIENTS BY MODALITY, 1999 – 2013
The age distribution of the prevalent dialysis patients is shown in Table 8.3.2.2. Table 8.3.2.2: PREVALENT DIALYSIS PATIENTS BY AGE GROUP AND MODALITY
2012 AGE GROUP
HD PD HD+PD
No % CR* No % CR* No % CR*
0–19 3 0.1 3.4 12 1.9 13.6 15 0.3 16.9
20–29 41 0.9 79.0 27 4.3 52.0 68 1.3 131.0
30–39 156 3.4 256.1 26 4.1 42.7 182 3.5 298.8
40–49 554 12.0 879.8 67 10.6 106.4 621 11.8 986.2
50–59 1304 28.3 2239.8 135 21.4 231.9 1439 27.4 2471.7
60–69 1442 31.3 4206.5 191 30.3 557.2 1633 31.1 4763.7
70–79 857 18.6 4982.6 134 21.2 779.1 991 18.9 5761.6
80 + 256 5.5 3299.0 39 6.2 502.6 295 5.6 3801.5
All Age Groups 4613 100 1208.3 631 100 165.3 5244 100 1373.6
2013 AGE GROUP
HD PD HD+PD
No % CR* No % CR* No % CR*
0–19 1 0.0 1.1 10 1.5 11.5 11 0.2 12.6
20–29 42 0.9 80.4 31 4.6 59.3 73 1.3 139.7
30–39 167 3.5 277.2 32 4.7 53.1 199 3.6 330.3
40–49 554 11.4 881.0 57 8.4 90.6 611 11.1 971.7
50–59 1334 27.6 2246.2 159 23.3 267.7 1493 27.0 2513.9
60–69 1538 31.8 4178.2 201 29.5 546.0 1739 31.5 4724.3
70–79 905 18.7 5139.1 140 20.6 795.0 1045 18.9 5934.1
80 + 299 6.2 3641.9 51 7.5 621.2 350 6.3 4263.1
All Age Groups 4840 100 1259.0 681 100 177.1 5521 100 1436.1
* per million resident population

Singapore Renal Registry Report No. 10
47
In 2012, the proportion of patients on HD aged 60 years and above was 55.4% compared
with 57.7% for those on PD. See Table 8.3.2.2. The mean age of the patient on HD was
61.4 years (median 61.6 years) while for PD, this was 60.2 years (median 63.1 years). See
Table 8.3.2.3.
In 2013, the proportion of patients on HD aged 60 years and above was 56.7% compared
with 57.6% for those on PD. See Table 8.3.2.2. The mean age of the patient on HD was
61.7 years (median 61.9 years) while for PD, this was 60.8 years (median 63.5 years). See
Table 8.3.2.3. Table 8.3.2.3: AGE OF PREVALENT PATIENTS BY MODALITY
MODALITY 2012 2013
Mean Age Median Age Std Dev Mean Age Median Age Std Dev
HD 61.4 61.6 12.0 61.7 61.9 12.1
PD 60.2 63.1 15.5 60.8 63.5 15.6
HD+PD 61.2 61.8 12.5 61.6 62.0 12.5
The mean age of all prevalent patients on dialysis increased from 54.5 years old in 1999 to
61.6 years old in 2013. See Figure 8.3.2.2.
Figure 8.3.2.2: AGE OF PREVALENT DIALYSIS PATIENTS, 1999 – 2013
In 2012, 49.1% of the PD patients had DN as the aetiology for renal failure compared to
48.2% in HD patients. This was similar for 2013 where 50.5% of the PD patients had DN as
the aetiology for renal failure compared to 49.6% in HD patients. Primary GN was the
second most common aetiology for both HD and PD patients in 2012 and 2013. See Table
8.3.2.4.
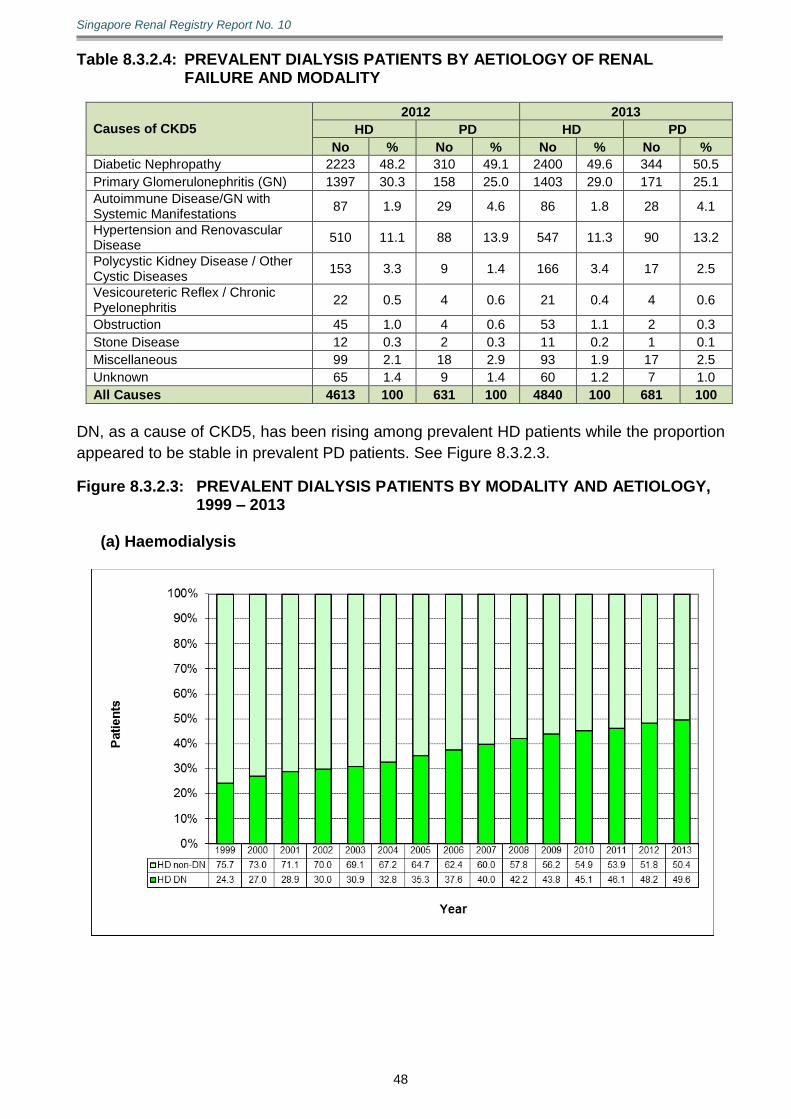
Singapore Renal Registry Report No. 10
48
Table 8.3.2.4: PREVALENT DIALYSIS PATIENTS BY AETIOLOGY OF RENAL FAILURE AND MODALITY
Causes of CKD5
2012 2013
HD PD HD PD
No % No % No % No %
Diabetic Nephropathy 2223 48.2 310 49.1 2400 49.6 344 50.5
Primary Glomerulonephritis (GN) 1397 30.3 158 25.0 1403 29.0 171 25.1
Autoimmune Disease/GN with Systemic Manifestations
87 1.9 29 4.6 86 1.8 28 4.1
Hypertension and Renovascular Disease
510 11.1 88 13.9 547 11.3 90 13.2
Polycystic Kidney Disease / Other Cystic Diseases
153 3.3 9 1.4 166 3.4 17 2.5
Vesicoureteric Reflex / Chronic Pyelonephritis
22 0.5 4 0.6 21 0.4 4 0.6
Obstruction 45 1.0 4 0.6 53 1.1 2 0.3
Stone Disease 12 0.3 2 0.3 11 0.2 1 0.1
Miscellaneous 99 2.1 18 2.9 93 1.9 17 2.5
Unknown 65 1.4 9 1.4 60 1.2 7 1.0
All Causes 4613 100 631 100 4840 100 681 100
DN, as a cause of CKD5, has been rising among prevalent HD patients while the proportion
appeared to be stable in prevalent PD patients. See Figure 8.3.2.3.
Figure 8.3.2.3: PREVALENT DIALYSIS PATIENTS BY MODALITY AND AETIOLOGY, 1999 – 2013
(a) Haemodialysis
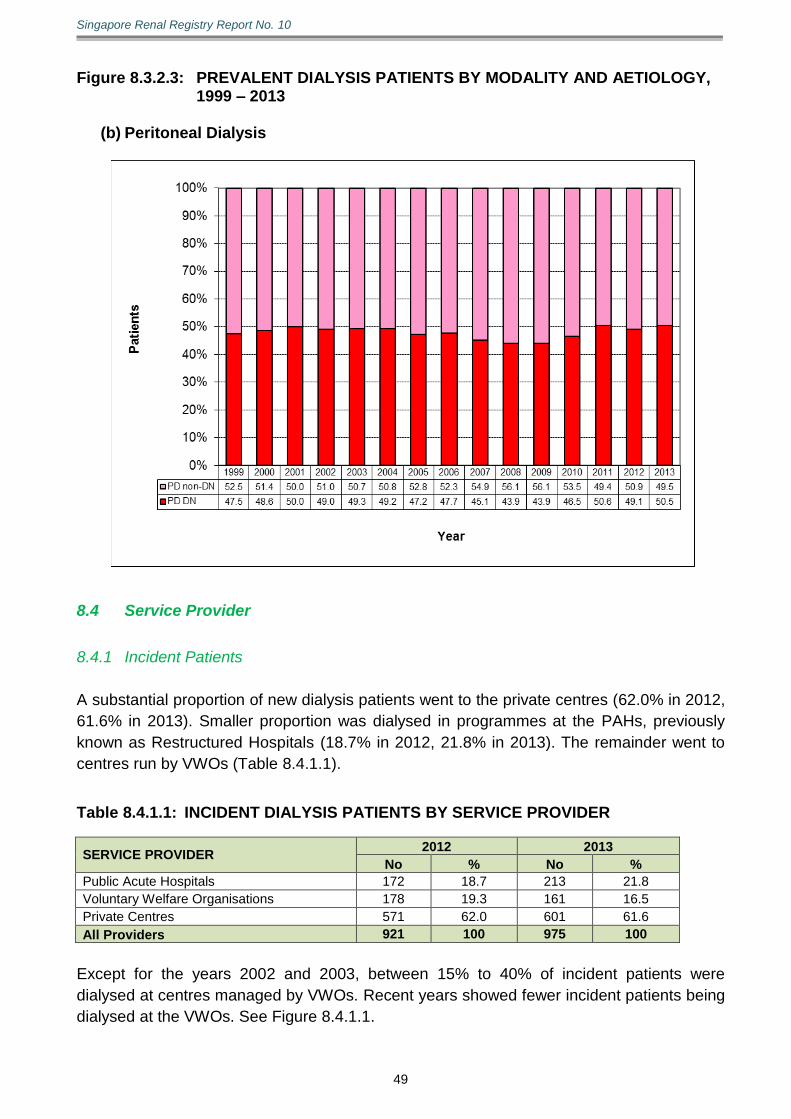
Singapore Renal Registry Report No. 10
49
Figure 8.3.2.3: PREVALENT DIALYSIS PATIENTS BY MODALITY AND AETIOLOGY,
1999 – 2013
(b) Peritoneal Dialysis
8.4 Service Provider
8.4.1 Incident Patients
A substantial proportion of new dialysis patients went to the private centres (62.0% in 2012,
61.6% in 2013). Smaller proportion was dialysed in programmes at the PAHs, previously
known as Restructured Hospitals (18.7% in 2012, 21.8% in 2013). The remainder went to
centres run by VWOs (Table 8.4.1.1).
Table 8.4.1.1: INCIDENT DIALYSIS PATIENTS BY SERVICE PROVIDER
SERVICE PROVIDER 2012 2013
No % No %
Public Acute Hospitals 172 18.7 213 21.8
Voluntary Welfare Organisations 178 19.3 161 16.5
Private Centres 571 62.0 601 61.6
All Providers 921 100 975 100
Except for the years 2002 and 2003, between 15% to 40% of incident patients were
dialysed at centres managed by VWOs. Recent years showed fewer incident patients being
dialysed at the VWOs. See Figure 8.4.1.1.
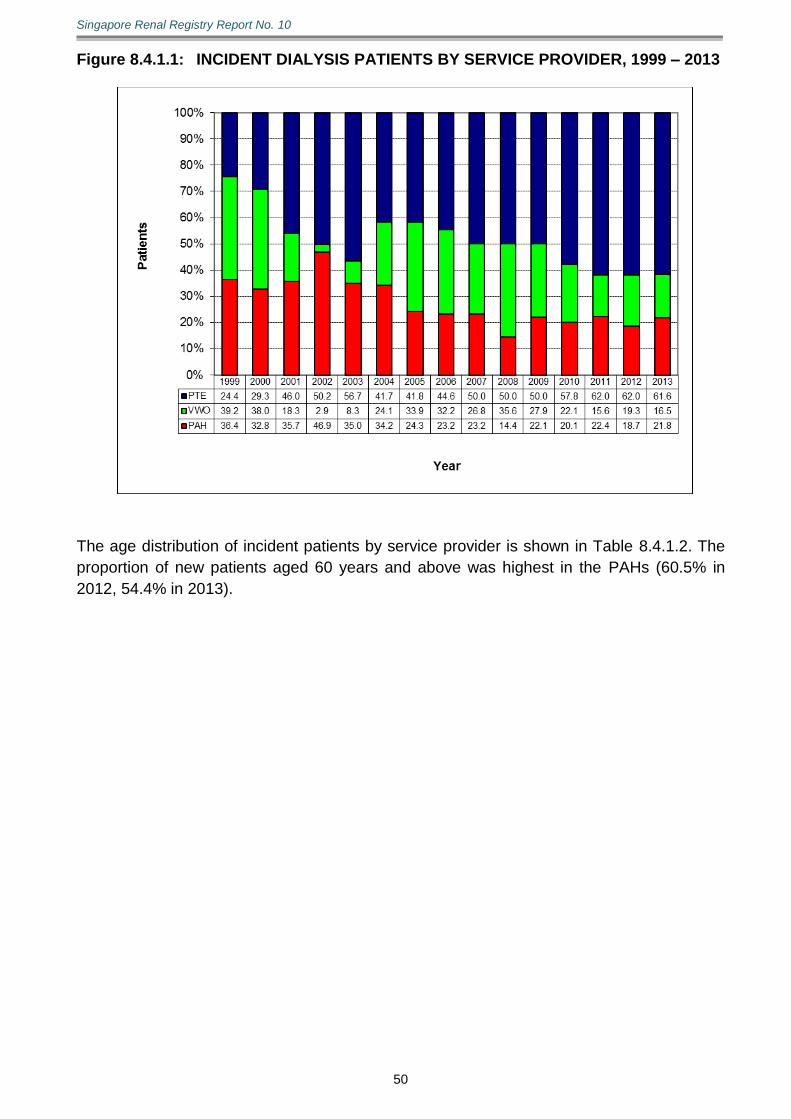
Singapore Renal Registry Report No. 10
50
Figure 8.4.1.1: INCIDENT DIALYSIS PATIENTS BY SERVICE PROVIDER, 1999 – 2013
The age distribution of incident patients by service provider is shown in Table 8.4.1.2. The
proportion of new patients aged 60 years and above was highest in the PAHs (60.5% in
2012, 54.4% in 2013).

Singapore Renal Registry Report No. 10
51
Table 8.4.1.2: INCIDENT DIALYSIS PATIENTS BY AGE GROUP AND SERVICE PROVIDER
2012 AGE GROUP
PAH VWO PTE ALL
No % No % No % No %
0–19 8 4.7 1 0.6 0 0.0 9 1.0
20–29 4 2.3 2 1.1 13 2.3 19 2.1
30–39 5 2.9 5 2.8 19 3.3 29 3.1
40–49 14 8.1 26 14.6 69 12.1 109 11.8
50–59 37 21.5 68 38.2 122 21.4 227 24.6
60–69 49 28.5 53 29.8 178 31.2 280 30.4
70–79 45 26.2 18 10.1 128 22.4 191 20.7
80 + 10 5.8 5 2.8 42 7.4 57 6.2
All Age Groups 172 100 178 100 571 100 921 100
2013 AGE GROUP
PAH VWO PTE ALL
No % No % No % No %
0–19 5 2.3 0 0.0 0 0.0 5 0.5
20–29 8 3.8 1 0.6 11 1.8 20 2.1
30–39 9 4.2 6 3.7 23 3.8 38 3.9
40–49 16 7.5 28 17.4 75 12.5 119 12.2
50–59 59 27.7 59 36.6 160 26.6 278 28.5
60–69 52 24.4 49 30.4 172 28.6 273 28.0
70–79 42 19.7 14 8.7 113 18.8 169 17.3
80 + 22 10.3 4 2.5 47 7.8 73 7.5
All Age Groups 213 100 161 100 601 100 975 100
The mean age of the patients dialysing with the VWO centres was 60.7 years in 2012 and
60.9 years in 2013. Patients in PAHs and private centres were older. See Table 8.4.1.3.
Table 8.4.1.3: AGE OF INCIDENT DIALYSIS PATIENTS BY SERVICE PROVIDER
SERVICE PROVIDER 2012 2013
Mean Age
Median Age
Std Dev*
Mean Age
Median Age
Std Dev*
Public Acute Hospitals 60.7 63.8 16.5 60.9 62.2 16.2
Voluntary Welfare Organisations
58.5 58.7 11.2 58.1 58.2 10.7
Private Centres 62.2 63.5 13.2 61.5 61.7 12.9
All Providers 61.2 62.6 13.6 60.8 61.1 13.4
* Std Dev stands for Standard Deviation
PAHs did not provide much chronic outpatient HD facilities and cared for only a small
proportion of new outpatient HD patients which was shown by the figures of 5.4% (42 out of
785) in 2012 and 5.5% (44 out of 802) in 2013. Thus, majority of HD patients (94.7% in
2012, 94.5% in 2013) were dialysed in VWOs and private centres. Majority of incident PD
patients were cared for by the PAHs; 95.6% (130 out of 136) in 2012 and 97.7% (169 out of
173) in 2013. See Table 8.4.1.4.
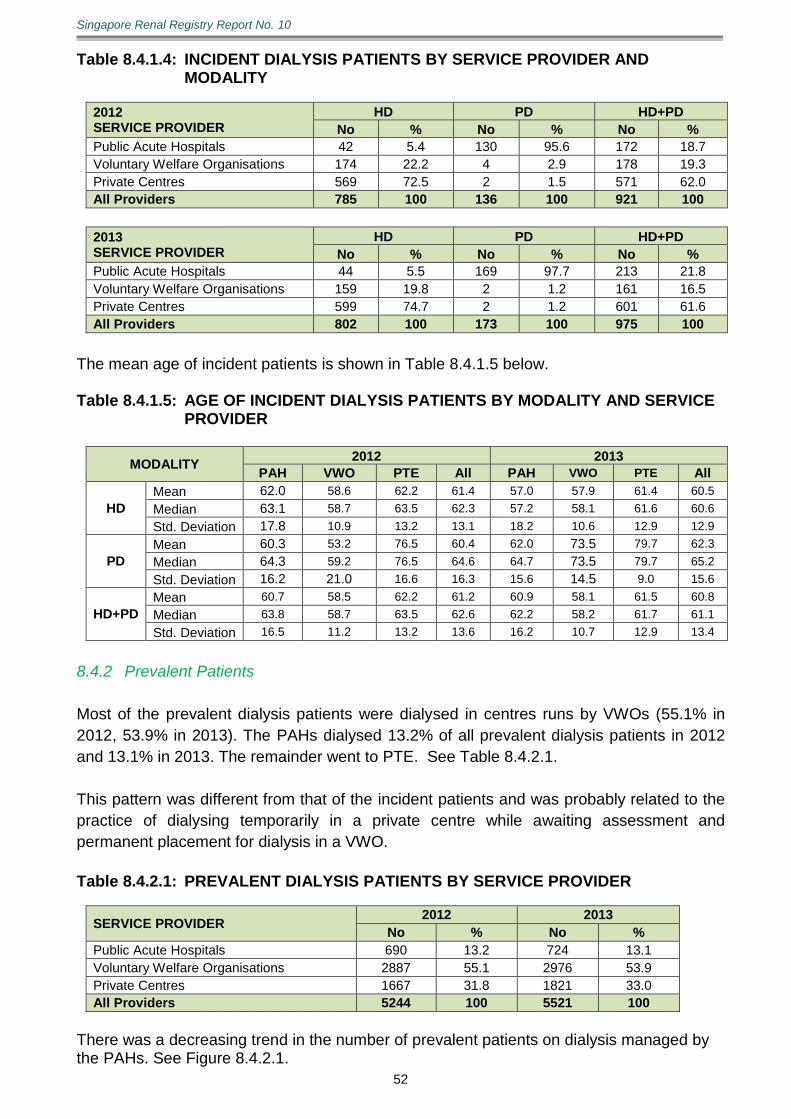
Singapore Renal Registry Report No. 10
52
Table 8.4.1.4: INCIDENT DIALYSIS PATIENTS BY SERVICE PROVIDER AND MODALITY
2012 SERVICE PROVIDER
HD PD HD+PD
No % No % No %
Public Acute Hospitals 42 5.4 130 95.6 172 18.7
Voluntary Welfare Organisations 174 22.2 4 2.9 178 19.3
Private Centres 569 72.5 2 1.5 571 62.0
All Providers 785 100 136 100 921 100
2013 SERVICE PROVIDER
HD PD HD+PD
No % No % No %
Public Acute Hospitals 44 5.5 169 97.7 213 21.8
Voluntary Welfare Organisations 159 19.8 2 1.2 161 16.5
Private Centres 599 74.7 2 1.2 601 61.6
All Providers 802 100 173 100 975 100
The mean age of incident patients is shown in Table 8.4.1.5 below. Table 8.4.1.5: AGE OF INCIDENT DIALYSIS PATIENTS BY MODALITY AND SERVICE
PROVIDER
MODALITY 2012 2013
PAH VWO PTE All PAH VWO PTE All
HD
Mean 62.0 58.6 62.2 61.4 57.0 57.9 61.4 60.5
Median 63.1 58.7 63.5 62.3 57.2 58.1 61.6 60.6
Std. Deviation 17.8 10.9 13.2 13.1 18.2 10.6 12.9 12.9
PD
Mean 60.3 53.2 76.5 60.4 62.0 73.5 79.7 62.3
Median 64.3 59.2 76.5 64.6 64.7 73.5 79.7 65.2
Std. Deviation 16.2 21.0 16.6 16.3 15.6 14.5 9.0 15.6
HD+PD
Mean 60.7 58.5 62.2 61.2 60.9 58.1 61.5 60.8
Median 63.8 58.7 63.5 62.6 62.2 58.2 61.7 61.1
Std. Deviation 16.5 11.2 13.2 13.6 16.2 10.7 12.9 13.4
8.4.2 Prevalent Patients
Most of the prevalent dialysis patients were dialysed in centres runs by VWOs (55.1% in
2012, 53.9% in 2013). The PAHs dialysed 13.2% of all prevalent dialysis patients in 2012
and 13.1% in 2013. The remainder went to PTE. See Table 8.4.2.1.
This pattern was different from that of the incident patients and was probably related to the
practice of dialysing temporarily in a private centre while awaiting assessment and
permanent placement for dialysis in a VWO.
Table 8.4.2.1: PREVALENT DIALYSIS PATIENTS BY SERVICE PROVIDER
SERVICE PROVIDER 2012 2013
No % No %
Public Acute Hospitals 690 13.2 724 13.1
Voluntary Welfare Organisations 2887 55.1 2976 53.9
Private Centres 1667 31.8 1821 33.0
All Providers 5244 100 5521 100
There was a decreasing trend in the number of prevalent patients on dialysis managed by the PAHs. See Figure 8.4.2.1.

Singapore Renal Registry Report No. 10
53
Figure 8.4.2.1: PREVALENT DIALYSIS PATIENTS BY SERVICE PROVIDER,
1999 – 2013
The age distribution of prevalent patients by service provider is shown in Table 8.4.2.2.
The proportion of patients aged 60 years and above was highest in private centres (63.2%
in 2012, 63.3% in 2013) and lowest in VWO centres (50.6% in 2012, 52.5% in 2013).
Table 8.4.2.2: DIALYSIS PATIENTS BY AGE GROUP AND SERVICE PROVIDER
2012 AGE GROUP
PAH VWO PTE ALL
No % No % No % No %
0–19 15 2.2 0 0.0 0 0.0 15 0.3
20–29 27 3.9 29 1.0 12 0.7 68 1.3
30–39 26 3.8 101 3.5 55 3.3 182 3.5
40–49 67 9.7 377 13.1 177 10.6 621 11.8
50–59 151 21.9 920 31.9 368 22.1 1439 27.4
60–69 214 31.0 915 31.7 504 30.2 1633 31.1
70–79 147 21.3 452 15.7 392 23.5 991 18.9
80 + 43 6.2 93 3.2 159 9.5 295 5.6
All Age Groups 690 100 2887 100 1667 100 5244 100
2013 AGE GROUP
PAH VWO PTE ALL
No % No % No % No %
0–19 11 1.5 0 0.0 0 0.0 11 0.2
20–29 32 4.4 30 1.0 11 0.6 73 1.3
30–39 32 4.4 101 3.4 66 3.6 199 3.6
40–49 60 8.3 362 12.2 189 10.4 611 11.1
50–59 168 23.2 923 31.0 402 22.1 1493 27.0
60–69 214 29.6 970 32.6 555 30.5 1739 31.5
70–79 151 20.9 484 16.3 410 22.5 1045 18.9
80 + 56 7.7 106 3.6 188 10.3 350 6.3
All Age Groups 724 100 2976 100 1821 100 5521 100

Singapore Renal Registry Report No. 10
54
The mean age of the prevalent patients dialysing with the VWO centres was 60.0 years in
2012 and 60.4 in 2013. Patients in private sector were the oldest (mean age 63.6 in 2012,
63.8 in 2013). See Table 8.4.2.3. Table 8.4.2.3: AGE OF PREVALENT DIALYSIS PATIENTS BY SERVICE PROVIDER
SERVICE PROVIDER 2012 2013
Mean Age
Median Age
Std Dev*
Mean Age
Median Age
Std Dev*
Public Acute Hospitals 60.5 63.3 15.5 61.1 63.9 15.6
Voluntary Welfare Organisations
60.0 60.1 11.3 60.4 60.7 11.3
Private Centres 63.6 64.3 12.7 63.8 64.0 12.8
All Providers 61.2 61.8 12.5 61.6 62.0 12.5
* Std Dev stands for Standard Deviation
As in the new patients, the majority of the patients in the PAHs did PD (84.3% in 2012,
88.1% in 2013). Almost all VWOs and private centres offered only HD in both years. See
Table 8.4.2.4.
Table 8.4.2.4: PREVALENT DIALYSIS PATIENTS BY SERVICE PROVIDER AND
MODALITY
2012 SERVICE PROVIDER
HD PD HD+PD
No % No % No %
Public Acute Hospitals 108 15.7 582 84.3 690 13.2
Voluntary Welfare Organisations 2845 98.5 42 1.5 2887 55.1
Private Centres 1660 99.6 7 0.4 1667 31.8
All Providers 4613 88.0 631 12.0 5244 100
2013 SERVICE PROVIDER
HD PD HD+PD
No % No % No %
Public Acute Hospitals 86 11.9 638 88.1 724 13.1
Voluntary Welfare Organisations 2940 98.8 36 1.2 2976 53.9
Private Centres 1814 99.6 7 0.4 1821 33.0
All Providers 4840 87.7 681 12.3 5521 100
Private sector dialysis patients tend to be relatively older in years 2012 and 2013. See
Table 8.4.2.5.
Table 8.4.2.5: AGE OF PREVALENT DIALYSIS PATIENTS BY MODALITY AND
SERVICE PROVIDER
MODALITY 2012 2013
PAH VWO PTE All PAH VWO PTE All
HD
Mean 60.9 60.0 63.6 61.4 62.3 60.4 63.8 61.7
Median 62.0 60.2 64.3 61.6 62.9 60.7 63.9 61.9
Std. Deviation 14.3 11.3 12.7 12.0 14.9 11.3 12.8 12.1
PD
Mean 60.4 56.5 63.9 60.2 60.9 57.0 68.6 60.8
Median 63.6 56.0 65.1 63.1 64.1 57.0 68.9 63.5
Std. Deviation 15.7 11.4 16.0 15.5 15.7 13.3 14.4 15.6
HD+PD
Mean 60.5 60.0 63.6 61.2 61.1 60.4 63.8 61.6
Median 63.3 60.1 64.3 61.8 63.9 60.7 64.0 62.0
Std. Deviation 15.5 11.3 12.7 12.5 15.6 11.3 12.8 12.5
Singapore Renal Registry Report No. 10
55
8.5 Co-morbid Conditions
DM is reported as a co-morbid condition, even if the cause of renal failure was not due to
DN.
8.5.1 Incident Patients
DM as a co-morbid condition occurred in 72.1% of patients newly started on dialysis in
2012 and 71.1% in 2013. See Table 8.5.1.1.
IHD was reported in 48.0% of patients in 2012 and 44.3% in 2013. This was 21.5% in 2012
and 24.2% in 2013 for CVD. PVD was reported in 15.9% of patients in 2012 and 12.6% in
2013.
There were 11.3% of patients who were current smokers in 2012. Another 22.6% were
former smokers. The status was unknown in 2.5% of patients. In 2013, 10.3% were current
smokers while 22.7% were former smokers.
In 2012, 3.3% of the patients were serologically positive for HBsAg, while in 2013 the
percentage decreased to 2.6%. Fewer patients were positive for anti-Hepatitis C Virus
(HCV) antibody (0.7% in 2012, 0.8% in 2013). Many PD patients did not have HBsAg and
anti-HCV antibody test results within the last 6 months (18.5% for PD versus 0.6% for HD in
2013).
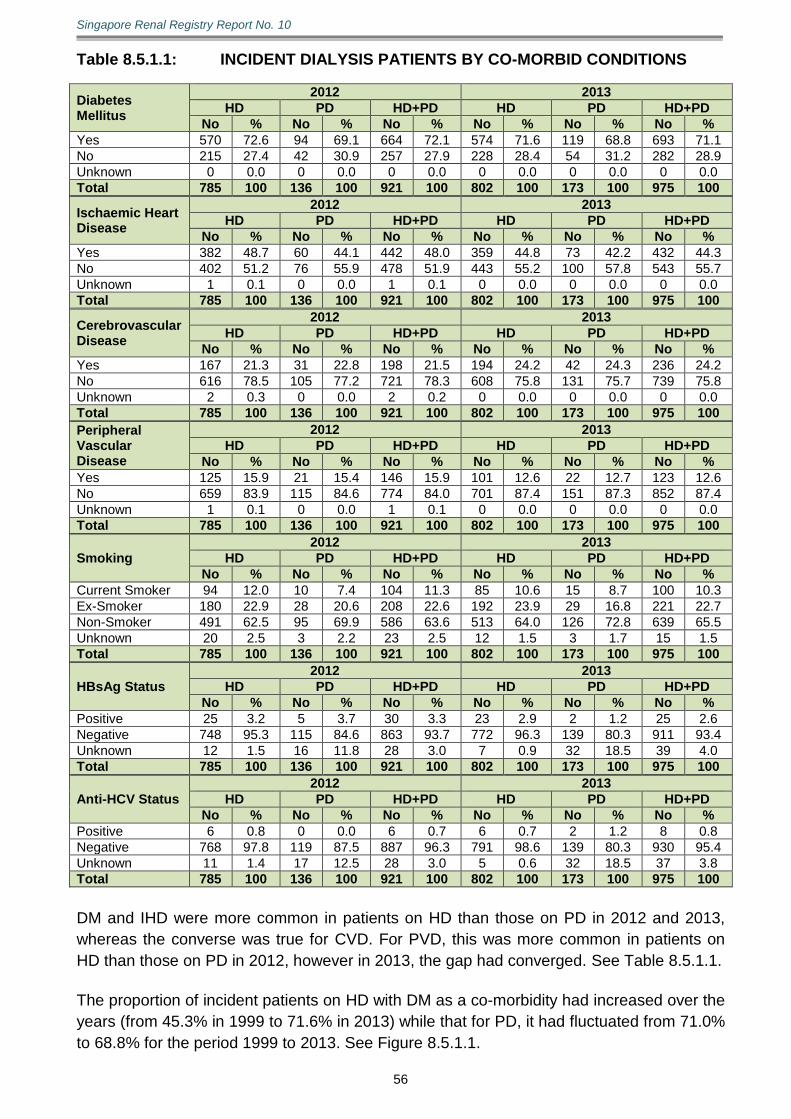
Singapore Renal Registry Report No. 10
56
Table 8.5.1.1: INCIDENT DIALYSIS PATIENTS BY CO-MORBID CONDITIONS
Diabetes Mellitus
2012 2013
HD PD HD+PD HD PD HD+PD
No % No % No % No % No % No %
Yes 570 72.6 94 69.1 664 72.1 574 71.6 119 68.8 693 71.1
No 215 27.4 42 30.9 257 27.9 228 28.4 54 31.2 282 28.9
Unknown 0 0.0 0 0.0 0 0.0 0 0.0 0 0.0 0 0.0
Total 785 100 136 100 921 100 802 100 173 100 975 100
Ischaemic Heart Disease
2012 2013
HD PD HD+PD HD PD HD+PD
No % No % No % No % No % No %
Yes 382 48.7 60 44.1 442 48.0 359 44.8 73 42.2 432 44.3
No 402 51.2 76 55.9 478 51.9 443 55.2 100 57.8 543 55.7
Unknown 1 0.1 0 0.0 1 0.1 0 0.0 0 0.0 0 0.0
Total 785 100 136 100 921 100 802 100 173 100 975 100
Cerebrovascular Disease
2012 2013
HD PD HD+PD HD PD HD+PD
No % No % No % No % No % No %
Yes 167 21.3 31 22.8 198 21.5 194 24.2 42 24.3 236 24.2
No 616 78.5 105 77.2 721 78.3 608 75.8 131 75.7 739 75.8
Unknown 2 0.3 0 0.0 2 0.2 0 0.0 0 0.0 0 0.0
Total 785 100 136 100 921 100 802 100 173 100 975 100
Peripheral Vascular Disease
2012 2013
HD PD HD+PD HD PD HD+PD
No % No % No % No % No % No %
Yes 125 15.9 21 15.4 146 15.9 101 12.6 22 12.7 123 12.6
No 659 83.9 115 84.6 774 84.0 701 87.4 151 87.3 852 87.4
Unknown 1 0.1 0 0.0 1 0.1 0 0.0 0 0.0 0 0.0
Total 785 100 136 100 921 100 802 100 173 100 975 100
Smoking
2012 2013
HD PD HD+PD HD PD HD+PD
No % No % No % No % No % No %
Current Smoker 94 12.0 10 7.4 104 11.3 85 10.6 15 8.7 100 10.3
Ex-Smoker 180 22.9 28 20.6 208 22.6 192 23.9 29 16.8 221 22.7
Non-Smoker 491 62.5 95 69.9 586 63.6 513 64.0 126 72.8 639 65.5
Unknown 20 2.5 3 2.2 23 2.5 12 1.5 3 1.7 15 1.5
Total 785 100 136 100 921 100 802 100 173 100 975 100
HBsAg Status
2012 2013
HD PD HD+PD HD PD HD+PD
No % No % No % No % No % No %
Positive 25 3.2 5 3.7 30 3.3 23 2.9 2 1.2 25 2.6
Negative 748 95.3 115 84.6 863 93.7 772 96.3 139 80.3 911 93.4
Unknown 12 1.5 16 11.8 28 3.0 7 0.9 32 18.5 39 4.0
Total 785 100 136 100 921 100 802 100 173 100 975 100
Anti-HCV Status
2012 2013
HD PD HD+PD HD PD HD+PD
No % No % No % No % No % No %
Positive 6 0.8 0 0.0 6 0.7 6 0.7 2 1.2 8 0.8
Negative 768 97.8 119 87.5 887 96.3 791 98.6 139 80.3 930 95.4
Unknown 11 1.4 17 12.5 28 3.0 5 0.6 32 18.5 37 3.8
Total 785 100 136 100 921 100 802 100 173 100 975 100
DM and IHD were more common in patients on HD than those on PD in 2012 and 2013,
whereas the converse was true for CVD. For PVD, this was more common in patients on
HD than those on PD in 2012, however in 2013, the gap had converged. See Table 8.5.1.1.
The proportion of incident patients on HD with DM as a co-morbidity had increased over the
years (from 45.3% in 1999 to 71.6% in 2013) while that for PD, it had fluctuated from 71.0%
to 68.8% for the period 1999 to 2013. See Figure 8.5.1.1.

Singapore Renal Registry Report No. 10
57
Figure 8.5.1.1: INCIDENT DIALYSIS PATIENTS BY MODALITY AND DIABETES
MELLITUS, 1999 – 2013
(a) Haemodialysis
(b) Peritoneal Dialysis
The proportion of incident dialysis patients on HD with IHD as a co-morbidity had risen
through the years (28.1% in 1999 to 44.8% in 2013). There was a decrease in the
proportion of PD patients with IHD as co-morbidity from 63.1% in 1999 to 46.0% in 2002,
thereafter the proportion hovered around at an average of 50%. See Figure 8.5.1.2.

Singapore Renal Registry Report No. 10
58
Figure 8.5.1.2: INCIDENT DIALYSIS PATIENTS BY MODALITY AND ISCHAEMIC HEART DISEASE, 1999 – 2013
(a) Haemodialysis
(b) Peritoneal Dialysis
The proportion of incident dialysis patients on HD with CVD as a co-morbidity fluctuated
between 10.3% to 24.5% for the period 1999 to 2013; while this was between 19.1% to
31.5% for those on PD. See Figure 8.5.1.3.

Singapore Renal Registry Report No. 10
59
Figure 8.5.1.3: INCIDENT DIALYSIS PATIENTS BY MODALITY AND CEREBROVASCULAR DISEASE, 1999 – 2013
(a) Haemodialysis
(b) Peritoneal Dialysis
PVD as a co-morbidity increased from 6.9% in 1999 to 12.6% in 2013 for incident HD
patients while that for PD, it fluctuated between 8.1% to 19.8% for the same time period.
See Figure 8.5.1.4.
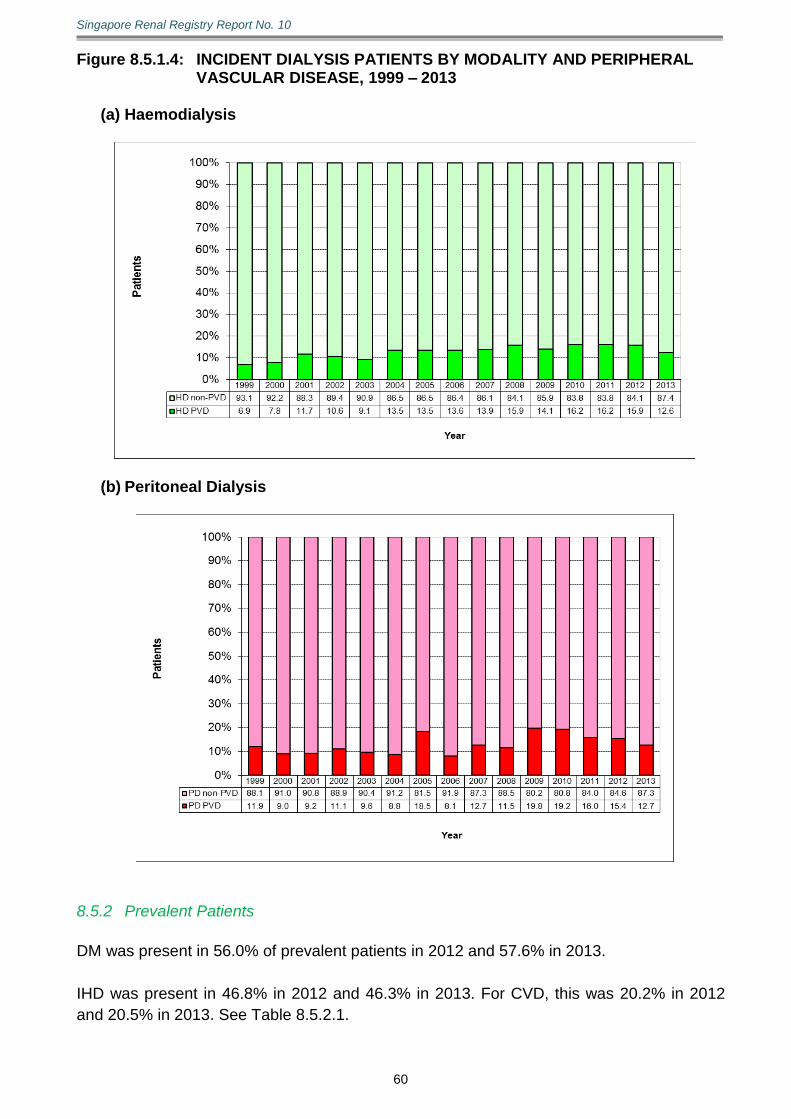
Singapore Renal Registry Report No. 10
60
Figure 8.5.1.4: INCIDENT DIALYSIS PATIENTS BY MODALITY AND PERIPHERAL VASCULAR DISEASE, 1999 – 2013
(a) Haemodialysis
(b) Peritoneal Dialysis
8.5.2 Prevalent Patients
DM was present in 56.0% of prevalent patients in 2012 and 57.6% in 2013.
IHD was present in 46.8% in 2012 and 46.3% in 2013. For CVD, this was 20.2% in 2012
and 20.5% in 2013. See Table 8.5.2.1.

Singapore Renal Registry Report No. 10
61
There were 9.7% of patients who were current smokers in 2012 and 9.9% in 2013. Former
smokers were 23.5% in 2012 and 22.8% in 2013.
HBsAg positivity was found in 3.8% of patients in 2012 and 3.4% in 2013. Anti-HCV
antibody positive status was present in 3.7% of patients in 2012 and 3.4% in 2013.
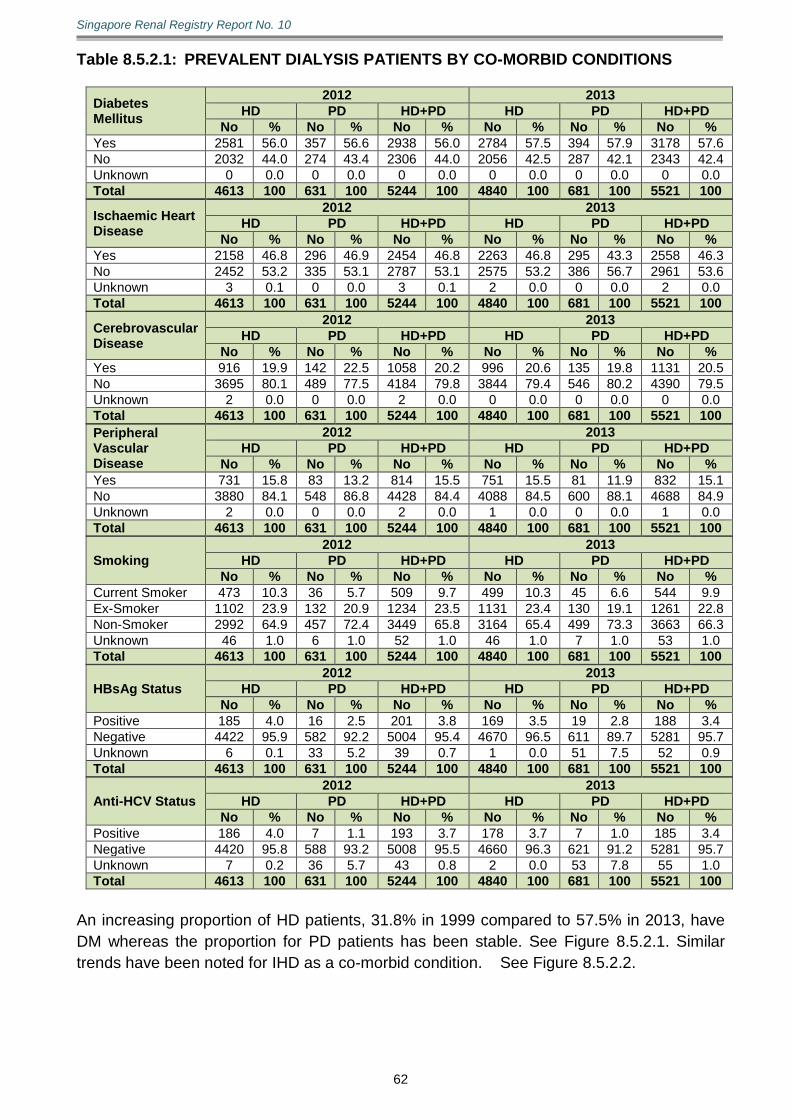
Singapore Renal Registry Report No. 10
62
Table 8.5.2.1: PREVALENT DIALYSIS PATIENTS BY CO-MORBID CONDITIONS
Diabetes Mellitus
2012 2013
HD PD HD+PD HD PD HD+PD
No % No % No % No % No % No %
Yes 2581 56.0 357 56.6 2938 56.0 2784 57.5 394 57.9 3178 57.6
No 2032 44.0 274 43.4 2306 44.0 2056 42.5 287 42.1 2343 42.4
Unknown 0 0.0 0 0.0 0 0.0 0 0.0 0 0.0 0 0.0
Total 4613 100 631 100 5244 100 4840 100 681 100 5521 100
Ischaemic Heart Disease
2012 2013
HD PD HD+PD HD PD HD+PD
No % No % No % No % No % No %
Yes 2158 46.8 296 46.9 2454 46.8 2263 46.8 295 43.3 2558 46.3
No 2452 53.2 335 53.1 2787 53.1 2575 53.2 386 56.7 2961 53.6
Unknown 3 0.1 0 0.0 3 0.1 2 0.0 0 0.0 2 0.0
Total 4613 100 631 100 5244 100 4840 100 681 100 5521 100
Cerebrovascular Disease
2012 2013
HD PD HD+PD HD PD HD+PD
No % No % No % No % No % No %
Yes 916 19.9 142 22.5 1058 20.2 996 20.6 135 19.8 1131 20.5
No 3695 80.1 489 77.5 4184 79.8 3844 79.4 546 80.2 4390 79.5
Unknown 2 0.0 0 0.0 2 0.0 0 0.0 0 0.0 0 0.0
Total 4613 100 631 100 5244 100 4840 100 681 100 5521 100
Peripheral Vascular Disease
2012 2013
HD PD HD+PD HD PD HD+PD
No % No % No % No % No % No %
Yes 731 15.8 83 13.2 814 15.5 751 15.5 81 11.9 832 15.1
No 3880 84.1 548 86.8 4428 84.4 4088 84.5 600 88.1 4688 84.9
Unknown 2 0.0 0 0.0 2 0.0 1 0.0 0 0.0 1 0.0
Total 4613 100 631 100 5244 100 4840 100 681 100 5521 100
Smoking
2012 2013
HD PD HD+PD HD PD HD+PD
No % No % No % No % No % No %
Current Smoker 473 10.3 36 5.7 509 9.7 499 10.3 45 6.6 544 9.9
Ex-Smoker 1102 23.9 132 20.9 1234 23.5 1131 23.4 130 19.1 1261 22.8
Non-Smoker 2992 64.9 457 72.4 3449 65.8 3164 65.4 499 73.3 3663 66.3
Unknown 46 1.0 6 1.0 52 1.0 46 1.0 7 1.0 53 1.0
Total 4613 100 631 100 5244 100 4840 100 681 100 5521 100
HBsAg Status
2012 2013
HD PD HD+PD HD PD HD+PD
No % No % No % No % No % No %
Positive 185 4.0 16 2.5 201 3.8 169 3.5 19 2.8 188 3.4
Negative 4422 95.9 582 92.2 5004 95.4 4670 96.5 611 89.7 5281 95.7
Unknown 6 0.1 33 5.2 39 0.7 1 0.0 51 7.5 52 0.9
Total 4613 100 631 100 5244 100 4840 100 681 100 5521 100
Anti-HCV Status
2012 2013
HD PD HD+PD HD PD HD+PD
No % No % No % No % No % No %
Positive 186 4.0 7 1.1 193 3.7 178 3.7 7 1.0 185 3.4
Negative 4420 95.8 588 93.2 5008 95.5 4660 96.3 621 91.2 5281 95.7
Unknown 7 0.2 36 5.7 43 0.8 2 0.0 53 7.8 55 1.0
Total 4613 100 631 100 5244 100 4840 100 681 100 5521 100
An increasing proportion of HD patients, 31.8% in 1999 compared to 57.5% in 2013, have
DM whereas the proportion for PD patients has been stable. See Figure 8.5.2.1. Similar
trends have been noted for IHD as a co-morbid condition. See Figure 8.5.2.2.
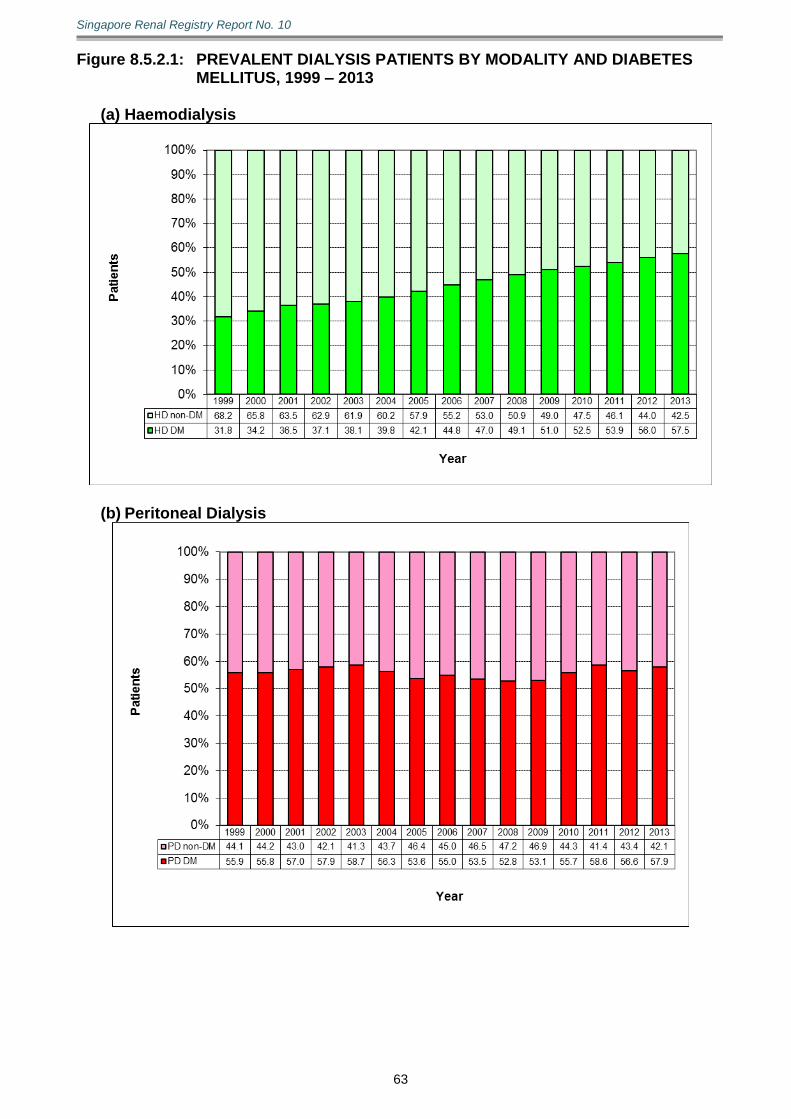
Singapore Renal Registry Report No. 10
63
Figure 8.5.2.1: PREVALENT DIALYSIS PATIENTS BY MODALITY AND DIABETES MELLITUS, 1999 – 2013
(a) Haemodialysis
(b) Peritoneal Dialysis
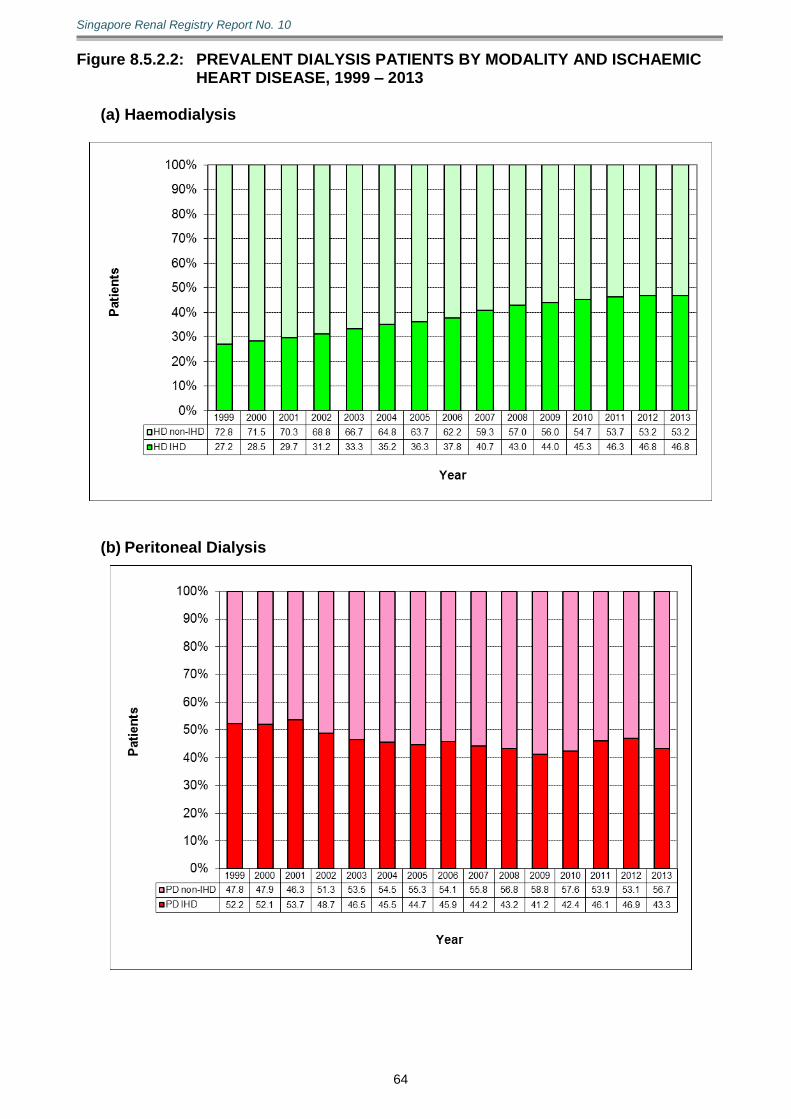
Singapore Renal Registry Report No. 10
64
Figure 8.5.2.2: PREVALENT DIALYSIS PATIENTS BY MODALITY AND ISCHAEMIC HEART DISEASE, 1999 – 2013
(a) Haemodialysis
(b) Peritoneal Dialysis
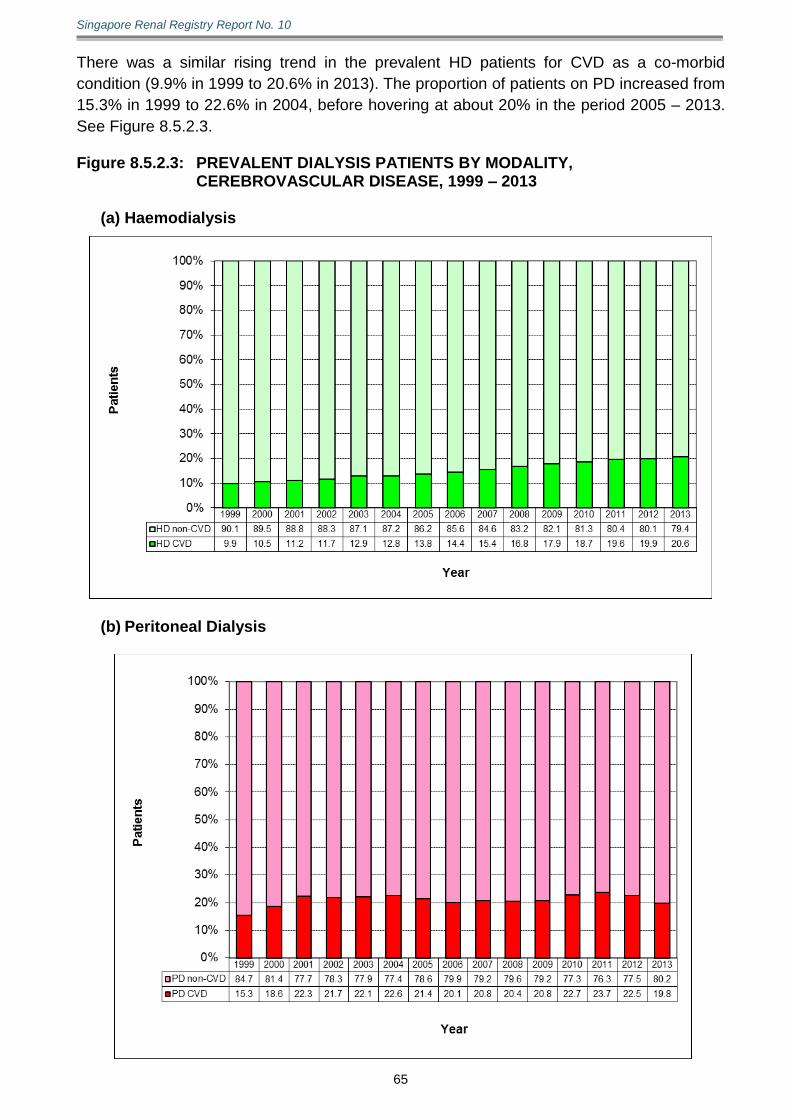
Singapore Renal Registry Report No. 10
65
There was a similar rising trend in the prevalent HD patients for CVD as a co-morbid
condition (9.9% in 1999 to 20.6% in 2013). The proportion of patients on PD increased from
15.3% in 1999 to 22.6% in 2004, before hovering at about 20% in the period 2005 – 2013.
See Figure 8.5.2.3. Figure 8.5.2.3: PREVALENT DIALYSIS PATIENTS BY MODALITY,
CEREBROVASCULAR DISEASE, 1999 – 2013
(a) Haemodialysis
(b) Peritoneal Dialysis

Singapore Renal Registry Report No. 10
66
The proportion of prevalent patients on HD having PVD as a co-morbid condition increased
gradually from 7.2% in 1999 to 15.5% in2013. For patients on PD, this fluctuated between
9.0% to 13.9% for the same time period. See Figure 8.5.2.4. Figure 8.5.2.4: PREVALENT DIALYSIS PATIENTS BY MODALITY AND PERIPHERAL
VASCULAR DISEASE, 1999 – 2013
(a) Haemodialysis
(b) Peritoneal Dialysis
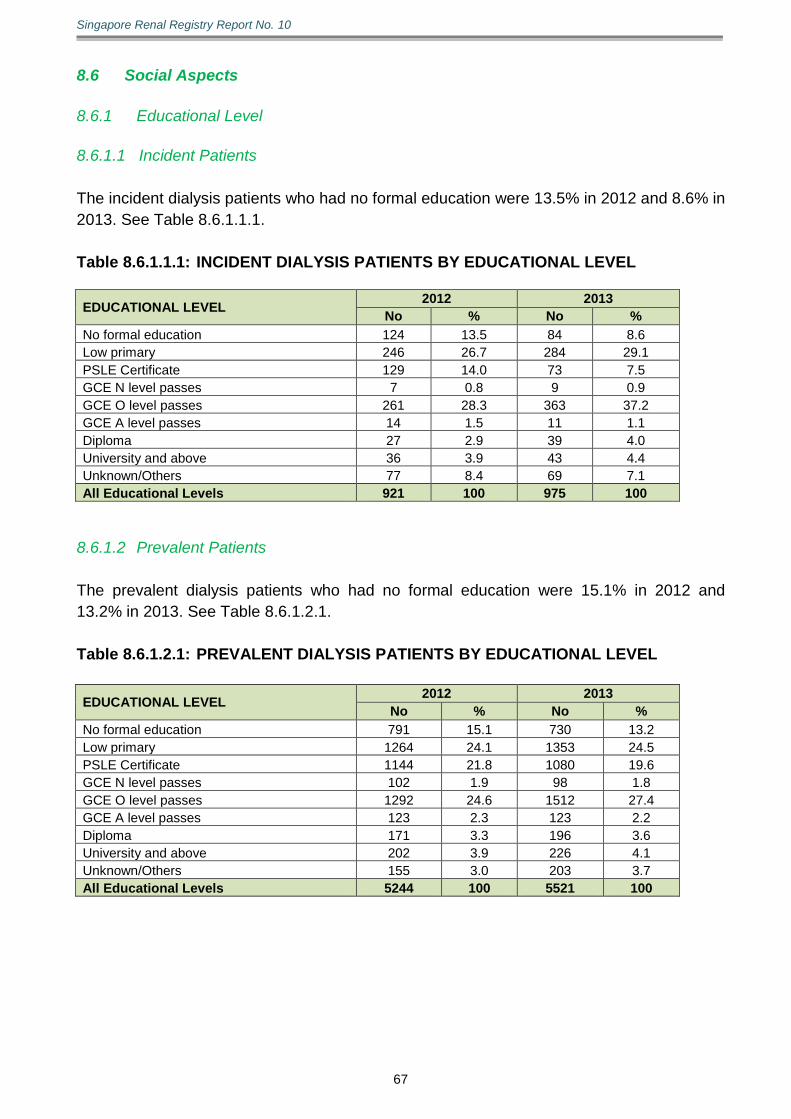
Singapore Renal Registry Report No. 10
67
8.6 Social Aspects
8.6.1 Educational Level
8.6.1.1 Incident Patients
The incident dialysis patients who had no formal education were 13.5% in 2012 and 8.6% in
2013. See Table 8.6.1.1.1.
Table 8.6.1.1.1: INCIDENT DIALYSIS PATIENTS BY EDUCATIONAL LEVEL
EDUCATIONAL LEVEL 2012 2013
No % No %
No formal education 124 13.5 84 8.6
Low primary 246 26.7 284 29.1
PSLE Certificate 129 14.0 73 7.5
GCE N level passes 7 0.8 9 0.9
GCE O level passes 261 28.3 363 37.2
GCE A level passes 14 1.5 11 1.1
Diploma 27 2.9 39 4.0
University and above 36 3.9 43 4.4
Unknown/Others 77 8.4 69 7.1
All Educational Levels 921 100 975 100
8.6.1.2 Prevalent Patients
The prevalent dialysis patients who had no formal education were 15.1% in 2012 and
13.2% in 2013. See Table 8.6.1.2.1.
Table 8.6.1.2.1: PREVALENT DIALYSIS PATIENTS BY EDUCATIONAL LEVEL
EDUCATIONAL LEVEL 2012 2013
No % No %
No formal education 791 15.1 730 13.2
Low primary 1264 24.1 1353 24.5
PSLE Certificate 1144 21.8 1080 19.6
GCE N level passes 102 1.9 98 1.8
GCE O level passes 1292 24.6 1512 27.4
GCE A level passes 123 2.3 123 2.2
Diploma 171 3.3 196 3.6
University and above 202 3.9 226 4.1
Unknown/Others 155 3.0 203 3.7
All Educational Levels 5244 100 5521 100
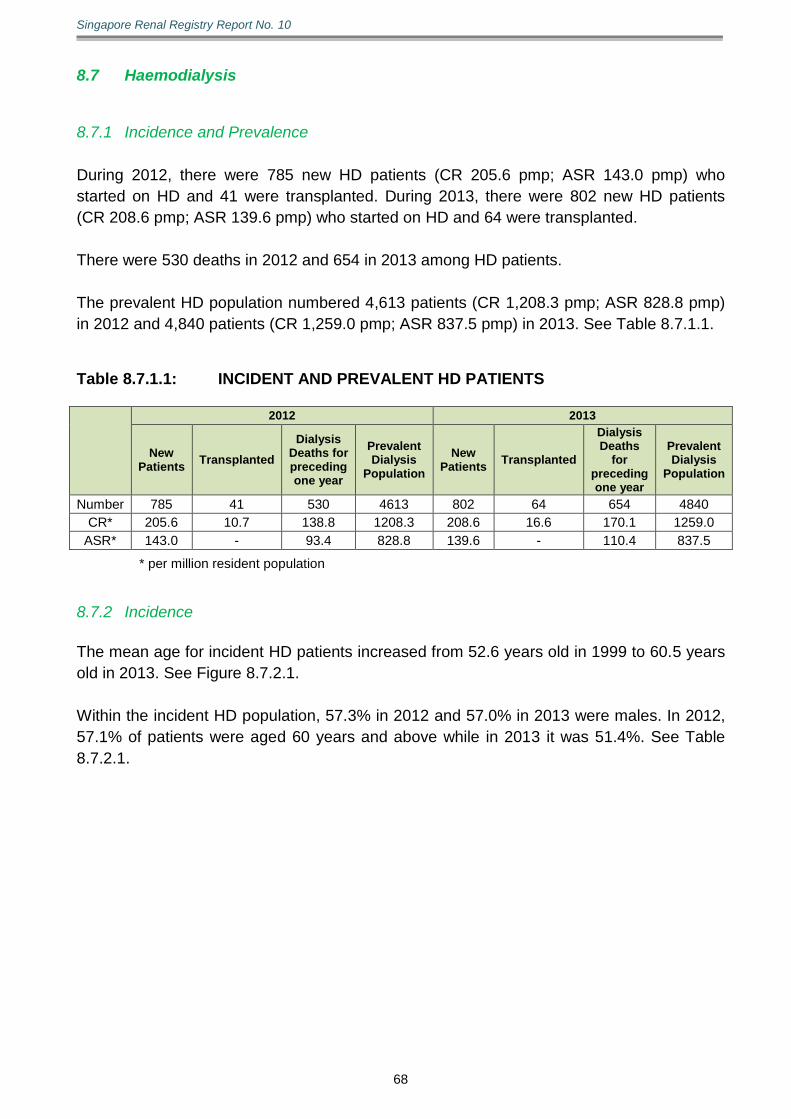
Singapore Renal Registry Report No. 10
68
8.7 Haemodialysis
8.7.1 Incidence and Prevalence
During 2012, there were 785 new HD patients (CR 205.6 pmp; ASR 143.0 pmp) who
started on HD and 41 were transplanted. During 2013, there were 802 new HD patients
(CR 208.6 pmp; ASR 139.6 pmp) who started on HD and 64 were transplanted.
There were 530 deaths in 2012 and 654 in 2013 among HD patients.
The prevalent HD population numbered 4,613 patients (CR 1,208.3 pmp; ASR 828.8 pmp)
in 2012 and 4,840 patients (CR 1,259.0 pmp; ASR 837.5 pmp) in 2013. See Table 8.7.1.1. Table 8.7.1.1: INCIDENT AND PREVALENT HD PATIENTS
2012 2013
New Patients
Transplanted
Dialysis Deaths for preceding one year
Prevalent Dialysis
Population
New Patients
Transplanted
Dialysis Deaths
for preceding one year
Prevalent Dialysis
Population
Number 785 41 530 4613 802 64 654 4840
CR* 205.6 10.7 138.8 1208.3 208.6 16.6 170.1 1259.0
ASR* 143.0 - 93.4 828.8 139.6 - 110.4 837.5
* per million resident population
8.7.2 Incidence
The mean age for incident HD patients increased from 52.6 years old in 1999 to 60.5 years
old in 2013. See Figure 8.7.2.1.
Within the incident HD population, 57.3% in 2012 and 57.0% in 2013 were males. In 2012,
57.1% of patients were aged 60 years and above while in 2013 it was 51.4%. See Table
8.7.2.1.

Singapore Renal Registry Report No. 10
69
Figure 8.7.2.1: MEAN AGE OF INCIDENT HD PATIENTS, 1999 – 2013
Table 8.7.2.1: INCIDENT HD PATIENTS BY AGE GROUP AND GENDER
2012 AGE GROUP
Male Female Both Genders
No % No % No %
0–19 2 0.4 2 0.6 4 0.5
20–29 4 0.9 10 3.0 14 1.8
30–39 15 3.3 9 2.7 24 3.1
40–49 53 11.8 43 12.8 96 12.2
50–59 129 28.7 70 20.9 199 25.4
60–69 140 31.1 104 31.0 244 31.1
70–79 85 18.9 69 20.6 154 19.6
80 + 22 4.9 28 8.4 50 6.4
All Age Groups 450 100 335 100 785 100
2013 AGE GROUP
Male Female Both Genders
No % No % No %
0–19 1 0.2 0 0.0 1 0.1
20–29 8 1.8 8 2.3 16 2.0
30–39 16 3.5 15 4.3 31 3.9
40–49 67 14.7 41 11.9 108 13.5
50–59 153 33.5 81 23.5 234 29.2
60–69 120 26.3 105 30.4 225 28.1
70–79 66 14.4 67 19.4 133 16.6
80 + 26 5.7 28 8.1 54 6.7
All Age Groups 457 100 345 100 802 100
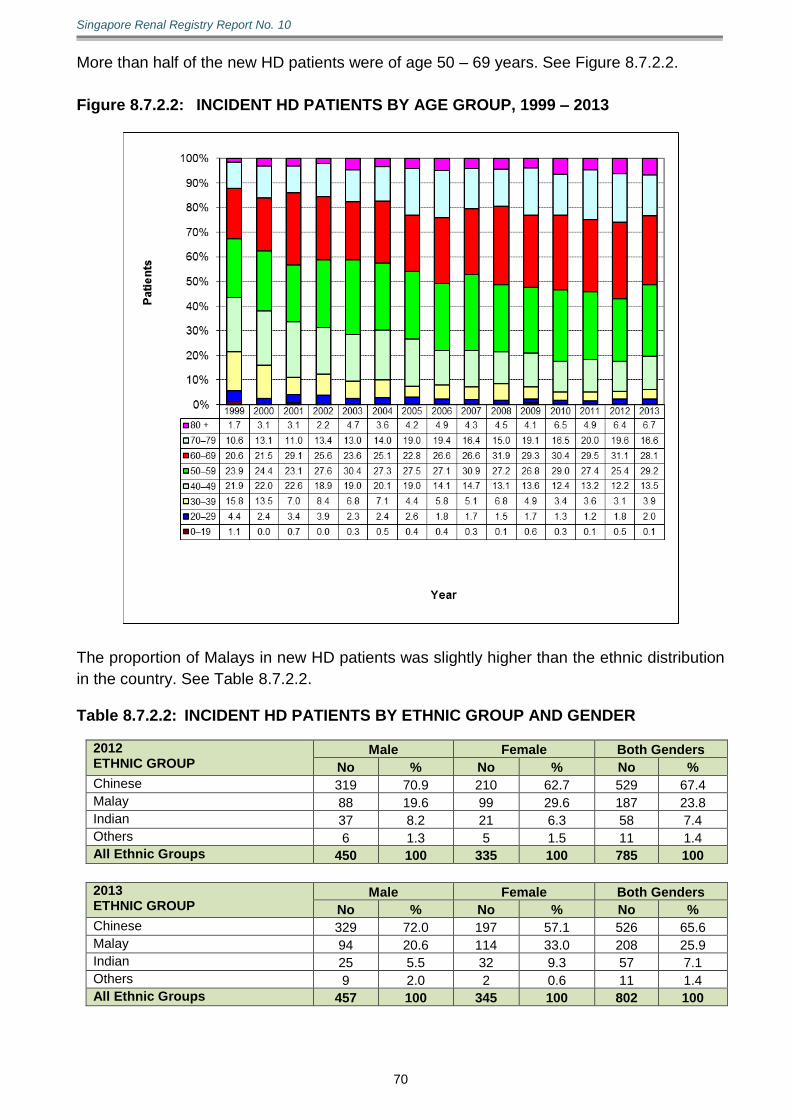
Singapore Renal Registry Report No. 10
70
More than half of the new HD patients were of age 50 – 69 years. See Figure 8.7.2.2.
Figure 8.7.2.2: INCIDENT HD PATIENTS BY AGE GROUP, 1999 – 2013
The proportion of Malays in new HD patients was slightly higher than the ethnic distribution
in the country. See Table 8.7.2.2. Table 8.7.2.2: INCIDENT HD PATIENTS BY ETHNIC GROUP AND GENDER
2012 ETHNIC GROUP
Male Female Both Genders
No % No % No %
Chinese 319 70.9 210 62.7 529 67.4
Malay 88 19.6 99 29.6 187 23.8
Indian 37 8.2 21 6.3 58 7.4
Others 6 1.3 5 1.5 11 1.4
All Ethnic Groups 450 100 335 100 785 100
2013 ETHNIC GROUP
Male Female Both Genders
No % No % No %
Chinese 329 72.0 197 57.1 526 65.6
Malay 94 20.6 114 33.0 208 25.9
Indian 25 5.5 32 9.3 57 7.1
Others 9 2.0 2 0.6 11 1.4
All Ethnic Groups 457 100 345 100 802 100

Singapore Renal Registry Report No. 10
71
As in the general population, the majority of new HD patients were Chinese. See Figure
8.7.2.3.
Figure 8.7.2.3: INCIDENT HD PATIENTS BY ETHNIC GROUP, 1999 – 2013
Male incident HD patients outnumbered females in the period 2000 – 2013. See Table
8.7.2.3.
Table 8.7.2.3: INCIDENT HD PATIENTS BY GENDER, 1999 – 2013
YEAR Male Female
No % No %
1999 174 48.3 186 51.7
2000 227 50.3 224 49.7
2001 260 58.3 186 41.7
2002 203 56.5 156 43.5
2003 206 53.5 179 46.5
2004 226 53.6 196 46.4
2005 262 52.9 233 47.1
2006 310 54.6 258 45.4
2007 330 54.5 275 45.5
2008 379 56.2 295 43.8
2009 357 55.9 282 44.1
2010 351 57.4 260 42.6
2011 470 63.5 270 36.5
2012 450 57.3 335 42.7
2013 457 57.0 345 43.0

Singapore Renal Registry Report No. 10
72
8.7.3 Prevalence
The mean age for prevalent HD patients has increased from a mean of 53.7 years old in
1999 to 61.7 years old in 2013. See Figure 8.7.3.1.
Males made up 55.9% in 2012 and 56.2% in 2013. 55.4% were aged 60 years or above in
2012 and 56.7% in 2013. See Table 8.7.3.1.
Figure 8.7.3.1: AGE OF PREVALENT HD PATIENTS, 1999 – 2013
Table 8.7.3.1: PREVALENT HD PATIENTS BY AGE GROUP AND GENDER
2012 AGE GROUP
Male Female Both Genders
No % No % No %
0–19 1 0.0 2 0.1 3 0.1
20–29 23 0.9 18 0.9 41 0.9
30–39 98 3.8 58 2.8 156 3.4
40–49 320 12.4 234 11.5 554 12.0
50–59 736 28.6 568 27.9 1304 28.3
60–69 842 32.7 600 29.5 1442 31.3
70–79 426 16.5 431 21.2 857 18.6
80 + 131 5.1 125 6.1 256 5.5
All Age Groups 2577 100 2036 100 4613 100

Singapore Renal Registry Report No. 10
73
Table 8.7.3.1: PREVALENT HD PATIENTS BY AGE GROUP AND GENDER
2013 AGE GROUP
Male Female Both Genders
No % No % No %
0–19 1 0.0 0 0.0 1 0.0
20–29 22 0.8 20 0.9 42 0.9
30–39 107 3.9 60 2.8 167 3.5
40–49 325 11.9 229 10.8 554 11.4
50–59 779 28.6 555 26.2 1334 27.6
60–69 885 32.5 653 30.8 1538 31.8
70–79 445 16.4 460 21.7 905 18.7
80 + 156 5.7 143 6.7 299 6.2
All Age Groups 2720 100 2120 100 4840 100
The proportion of existing HD patients were highest in the age groups 50 – 59 and 60 – 69 while the younger age groups showed a decreasing trend through the years from 1999 to 2013. See Figure 8.7.3.2. Figure 8.7.3.2: PREVALENT HD PATIENTS BY AGE GROUP, 1999 – 2013
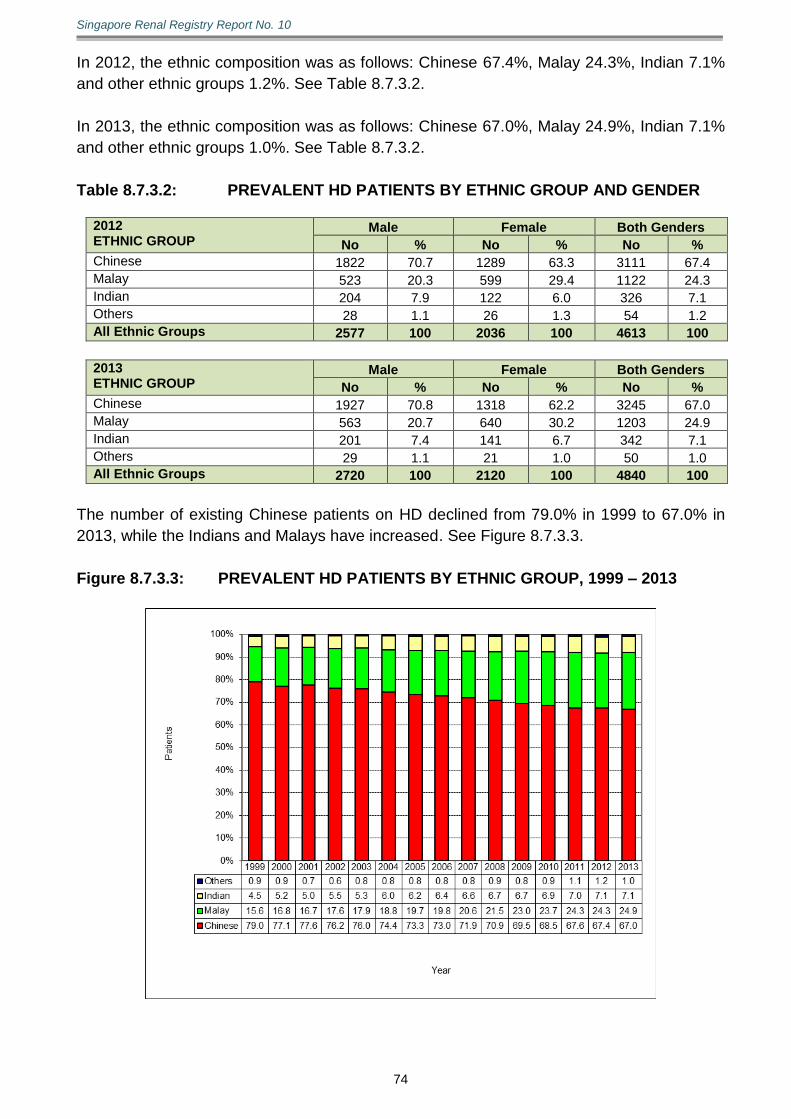
Singapore Renal Registry Report No. 10
74
In 2012, the ethnic composition was as follows: Chinese 67.4%, Malay 24.3%, Indian 7.1%
and other ethnic groups 1.2%. See Table 8.7.3.2.
In 2013, the ethnic composition was as follows: Chinese 67.0%, Malay 24.9%, Indian 7.1%
and other ethnic groups 1.0%. See Table 8.7.3.2.
Table 8.7.3.2: PREVALENT HD PATIENTS BY ETHNIC GROUP AND GENDER
2012 ETHNIC GROUP
Male Female Both Genders
No % No % No %
Chinese 1822 70.7 1289 63.3 3111 67.4
Malay 523 20.3 599 29.4 1122 24.3
Indian 204 7.9 122 6.0 326 7.1
Others 28 1.1 26 1.3 54 1.2
All Ethnic Groups 2577 100 2036 100 4613 100
2013 ETHNIC GROUP
Male Female Both Genders
No % No % No %
Chinese 1927 70.8 1318 62.2 3245 67.0
Malay 563 20.7 640 30.2 1203 24.9
Indian 201 7.4 141 6.7 342 7.1
Others 29 1.1 21 1.0 50 1.0
All Ethnic Groups 2720 100 2120 100 4840 100
The number of existing Chinese patients on HD declined from 79.0% in 1999 to 67.0% in
2013, while the Indians and Malays have increased. See Figure 8.7.3.3.
Figure 8.7.3.3: PREVALENT HD PATIENTS BY ETHNIC GROUP, 1999 – 2013

Singapore Renal Registry Report No. 10
75
The proportion of existing male HD patients was consistently higher than the females for
1999 – 2013. See Table 8.7.3.3.
Table 8.7.3.3: PREVALENT HD PATIENTS BY GENDER, 1999 – 2013
YEAR Male Female
No % No %
1999 1050 51.1 1005 48.9
2000 1179 50.7 1148 49.3
2001 1274 51.1 1221 48.9
2002 1315 51.7 1228 48.3
2003 1356 51.6 1272 48.4
2004 1389 51.4 1312 48.6
2005 1463 51.1 1401 48.9
2006 1589 51.9 1474 48.1
2007 1713 52.6 1542 47.4
2008 1884 52.7 1691 47.3
2009 2021 53.4 1764 46.6
2010 2175 54.1 1845 45.9
2011 2386 55.9 1884 44.1
2012 2577 55.9 2036 44.1
2013 2720 56.2 2120 43.8
8.7.4 Aetiology of Renal Failure
DN was the aetiology of renal failure in 65.7% of incident HD patients in 2012 and 64.8% in
2013. Primary GN was the aetiology of renal failure in 15.7% of incident HD patients in
2012 and 15.8% in 2013.
DN was the leading cause of renal failure in prevalent HD patients (48.2% in 2012, 49.6%
in 2013) followed by primary GN (30.3% in 2012, 29.0% in 2013). See Table 8.7.4.1. Table 8.7.4.1: INCIDENT AND PREVALENT HD PATIENTS BY AETIOLOGY OF RENAL
FAILURE
Causes of CKD5
2012 2013
Incident Prevalent Incident Prevalent
No % No % No % No %
Diabetic Nephropathy 516 65.7 2223 48.2 520 64.8 2400 49.6
Primary Glomerulonephritis (GN) 123 15.7 1397 30.3 127 15.8 1403 29.0
Autoimmune Disease/GN with Systemic Manifestations 12 1.5 87 1.9 9 1.1 86 1.8
Hypertension and Renovascular Disease 85 10.8 510 11.1 92 11.5 547 11.3
Polycystic Kidney Disease / Other Cystic Diseases 21 2.7 153 3.3 26 3.2 166 3.4
Vesicoureteric Reflex / Chronic Pyelonephritis 0 0.0 22 0.5 2 0.2 21 0.4
Obstruction 9 1.1 45 1.0 10 1.2 53 1.1
Stone Disease 1 0.1 12 0.3 0 0.0 11 0.2
Miscellaneous 16 2.0 99 2.1 14 1.7 93 1.9
Unknown 2 0.3 65 1.4 2 0.2 60 1.2
All Causes of ESRD 785 100 4613 100 802 100 4840 100
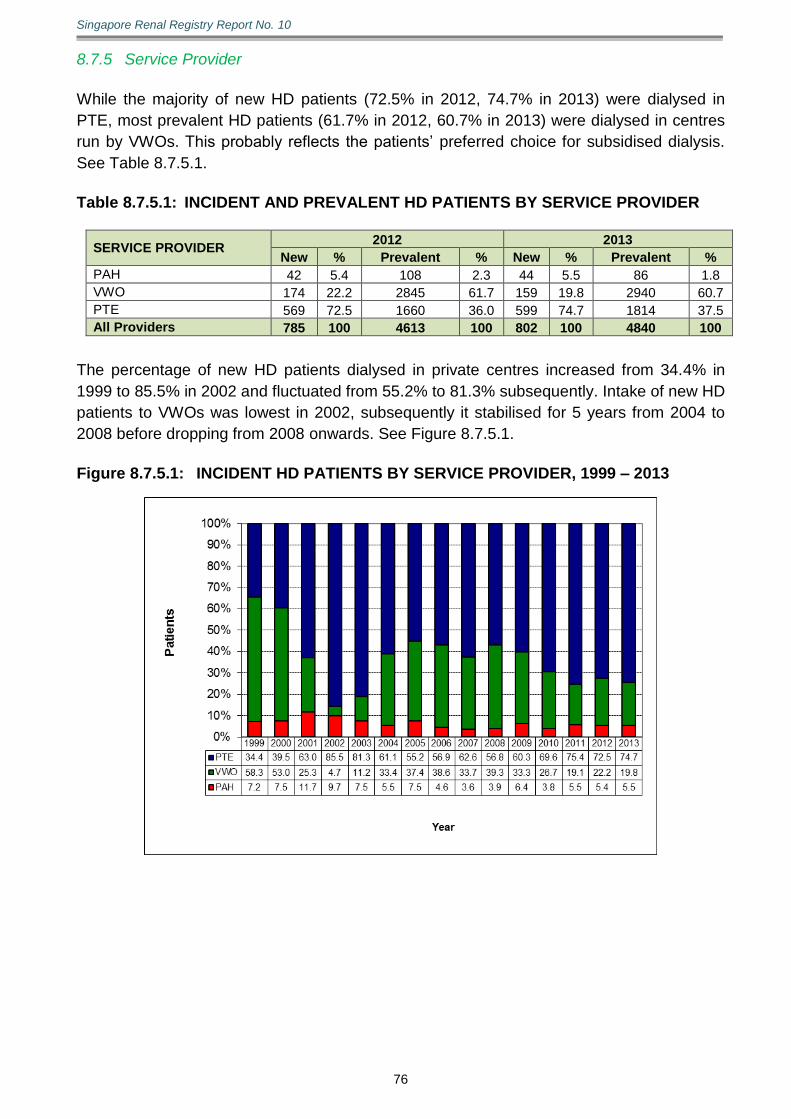
Singapore Renal Registry Report No. 10
76
8.7.5 Service Provider
While the majority of new HD patients (72.5% in 2012, 74.7% in 2013) were dialysed in
PTE, most prevalent HD patients (61.7% in 2012, 60.7% in 2013) were dialysed in centres
run by VWOs. This probably reflects the patients’ preferred choice for subsidised dialysis.
See Table 8.7.5.1.
Table 8.7.5.1: INCIDENT AND PREVALENT HD PATIENTS BY SERVICE PROVIDER
SERVICE PROVIDER 2012 2013
New % Prevalent % New % Prevalent %
PAH 42 5.4 108 2.3 44 5.5 86 1.8
VWO 174 22.2 2845 61.7 159 19.8 2940 60.7
PTE 569 72.5 1660 36.0 599 74.7 1814 37.5
All Providers 785 100 4613 100 802 100 4840 100
The percentage of new HD patients dialysed in private centres increased from 34.4% in
1999 to 85.5% in 2002 and fluctuated from 55.2% to 81.3% subsequently. Intake of new HD
patients to VWOs was lowest in 2002, subsequently it stabilised for 5 years from 2004 to
2008 before dropping from 2008 onwards. See Figure 8.7.5.1.
Figure 8.7.5.1: INCIDENT HD PATIENTS BY SERVICE PROVIDER, 1999 – 2013

Singapore Renal Registry Report No. 10
77
In the period 1999 – 2013, more than two-thirds of the prevalent HD patients were dialysed
at centres run by VWOs. See Figure 8.7.5.2. The proportion has been dropping from 2005.
Figure 8.7.5.2: PREVALENT HD PATIENTS BY SERVICE PROVIDER, 1999 – 2013
8.7.6 Dialysis Treatment
The majority of prevalent HD patients (97.4% in 2012, 97.6% in 2013) were dialysed three
times a week. The proportion of patients who were dialysed three times a week was the
highest in the VWO centres (100.0% in 2012, 99.9% in 2013) compared to the PAHs
(95.4% in 2012, 93.0% in 2013) and the PTE (93.1% in 2012, 94.2% in 2013). See Table
8.7.6.1.
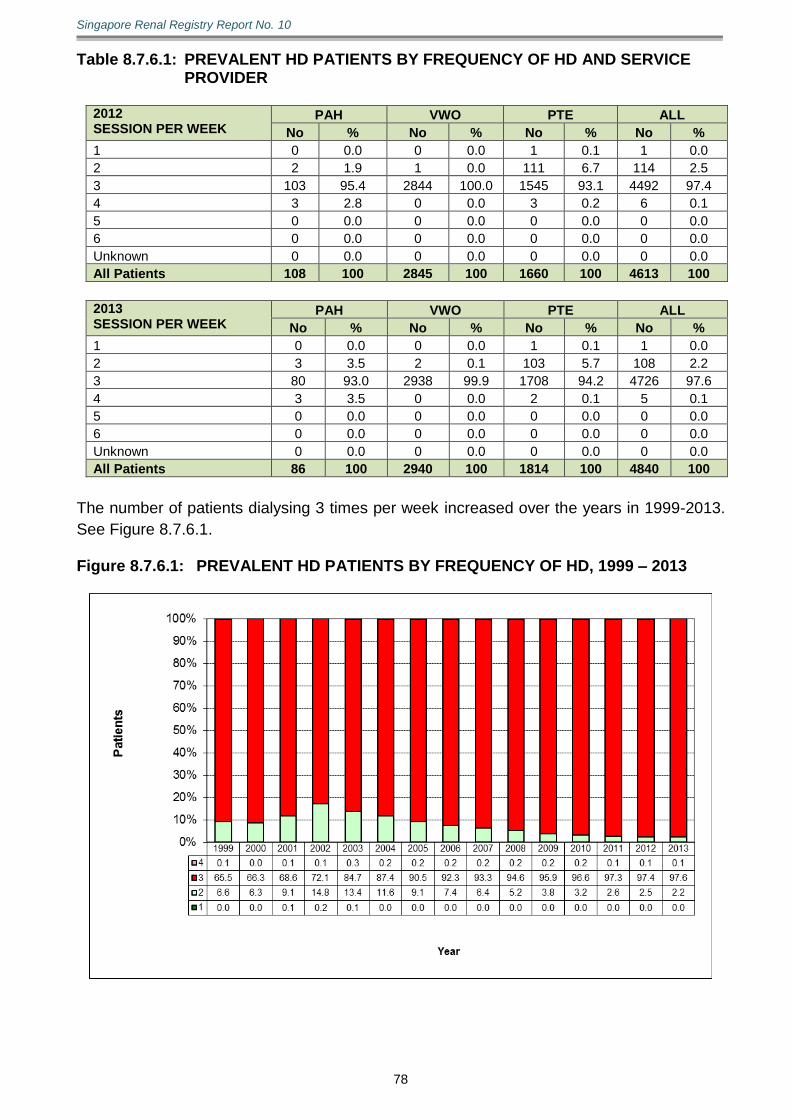
Singapore Renal Registry Report No. 10
78
Table 8.7.6.1: PREVALENT HD PATIENTS BY FREQUENCY OF HD AND SERVICE PROVIDER
2012 SESSION PER WEEK
PAH VWO PTE ALL
No % No % No % No %
1 0 0.0 0 0.0 1 0.1 1 0.0
2 2 1.9 1 0.0 111 6.7 114 2.5
3 103 95.4 2844 100.0 1545 93.1 4492 97.4
4 3 2.8 0 0.0 3 0.2 6 0.1
5 0 0.0 0 0.0 0 0.0 0 0.0
6 0 0.0 0 0.0 0 0.0 0 0.0
Unknown 0 0.0 0 0.0 0 0.0 0 0.0
All Patients 108 100 2845 100 1660 100 4613 100
2013 SESSION PER WEEK
PAH VWO PTE ALL
No % No % No % No %
1 0 0.0 0 0.0 1 0.1 1 0.0
2 3 3.5 2 0.1 103 5.7 108 2.2
3 80 93.0 2938 99.9 1708 94.2 4726 97.6
4 3 3.5 0 0.0 2 0.1 5 0.1
5 0 0.0 0 0.0 0 0.0 0 0.0
6 0 0.0 0 0.0 0 0.0 0 0.0
Unknown 0 0.0 0 0.0 0 0.0 0 0.0
All Patients 86 100 2940 100 1814 100 4840 100
The number of patients dialysing 3 times per week increased over the years in 1999-2013.
See Figure 8.7.6.1. Figure 8.7.6.1: PREVALENT HD PATIENTS BY FREQUENCY OF HD, 1999 – 2013
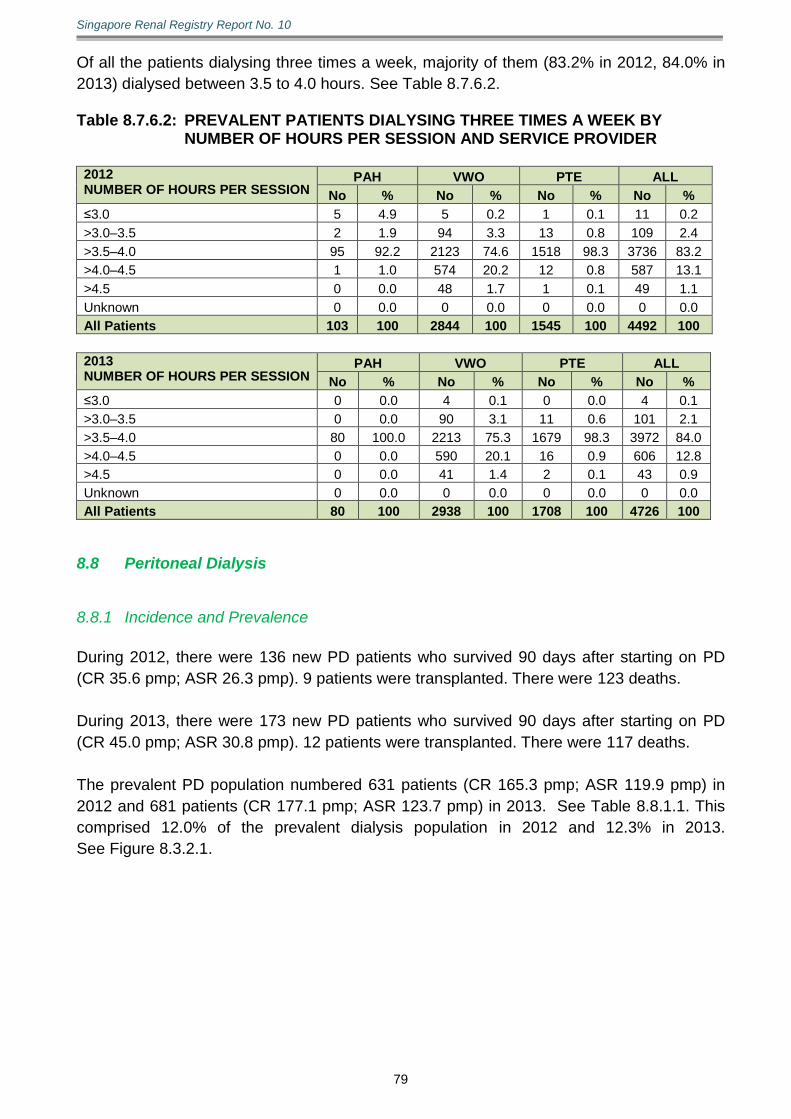
Singapore Renal Registry Report No. 10
79
Of all the patients dialysing three times a week, majority of them (83.2% in 2012, 84.0% in
2013) dialysed between 3.5 to 4.0 hours. See Table 8.7.6.2. Table 8.7.6.2: PREVALENT PATIENTS DIALYSING THREE TIMES A WEEK BY
NUMBER OF HOURS PER SESSION AND SERVICE PROVIDER 2012 NUMBER OF HOURS PER SESSION
PAH VWO PTE ALL
No % No % No % No %
≤3.0 5 4.9 5 0.2 1 0.1 11 0.2
>3.0–3.5 2 1.9 94 3.3 13 0.8 109 2.4
>3.5–4.0 95 92.2 2123 74.6 1518 98.3 3736 83.2
>4.0–4.5 1 1.0 574 20.2 12 0.8 587 13.1
>4.5 0 0.0 48 1.7 1 0.1 49 1.1
Unknown 0 0.0 0 0.0 0 0.0 0 0.0
All Patients 103 100 2844 100 1545 100 4492 100
2013 NUMBER OF HOURS PER SESSION
PAH VWO PTE ALL
No % No % No % No %
≤3.0 0 0.0 4 0.1 0 0.0 4 0.1
>3.0–3.5 0 0.0 90 3.1 11 0.6 101 2.1
>3.5–4.0 80 100.0 2213 75.3 1679 98.3 3972 84.0
>4.0–4.5 0 0.0 590 20.1 16 0.9 606 12.8
>4.5 0 0.0 41 1.4 2 0.1 43 0.9
Unknown 0 0.0 0 0.0 0 0.0 0 0.0
All Patients 80 100 2938 100 1708 100 4726 100
8.8 Peritoneal Dialysis
8.8.1 Incidence and Prevalence
During 2012, there were 136 new PD patients who survived 90 days after starting on PD
(CR 35.6 pmp; ASR 26.3 pmp). 9 patients were transplanted. There were 123 deaths.
During 2013, there were 173 new PD patients who survived 90 days after starting on PD
(CR 45.0 pmp; ASR 30.8 pmp). 12 patients were transplanted. There were 117 deaths.
The prevalent PD population numbered 631 patients (CR 165.3 pmp; ASR 119.9 pmp) in
2012 and 681 patients (CR 177.1 pmp; ASR 123.7 pmp) in 2013. See Table 8.8.1.1. This
comprised 12.0% of the prevalent dialysis population in 2012 and 12.3% in 2013.
See Figure 8.3.2.1.
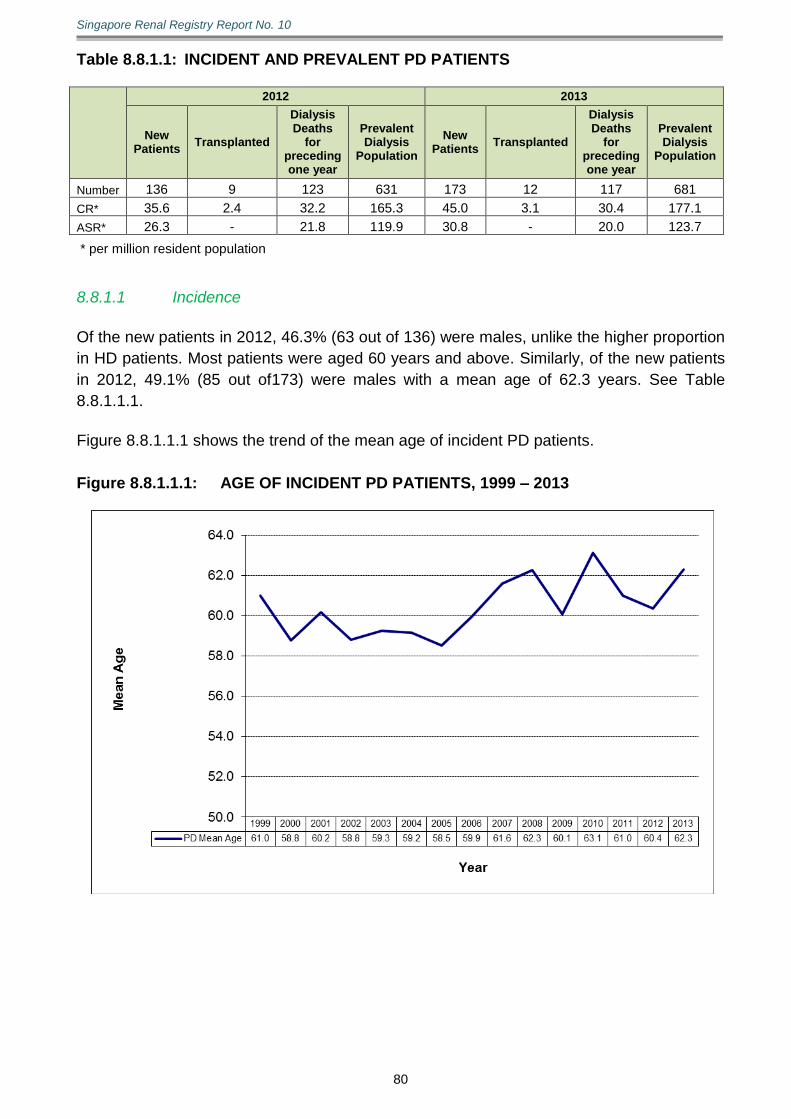
Singapore Renal Registry Report No. 10
80
Table 8.8.1.1: INCIDENT AND PREVALENT PD PATIENTS
2012 2013
New Patients
Transplanted
Dialysis Deaths
for preceding one year
Prevalent Dialysis
Population
New Patients
Transplanted
Dialysis Deaths
for preceding one year
Prevalent Dialysis
Population
Number 136 9 123 631 173 12 117 681
CR* 35.6 2.4 32.2 165.3 45.0 3.1 30.4 177.1
ASR* 26.3 - 21.8 119.9 30.8 - 20.0 123.7
* per million resident population
8.8.1.1 Incidence
Of the new patients in 2012, 46.3% (63 out of 136) were males, unlike the higher proportion
in HD patients. Most patients were aged 60 years and above. Similarly, of the new patients
in 2012, 49.1% (85 out of173) were males with a mean age of 62.3 years. See Table
8.8.1.1.1.
Figure 8.8.1.1.1 shows the trend of the mean age of incident PD patients.
Figure 8.8.1.1.1: AGE OF INCIDENT PD PATIENTS, 1999 – 2013
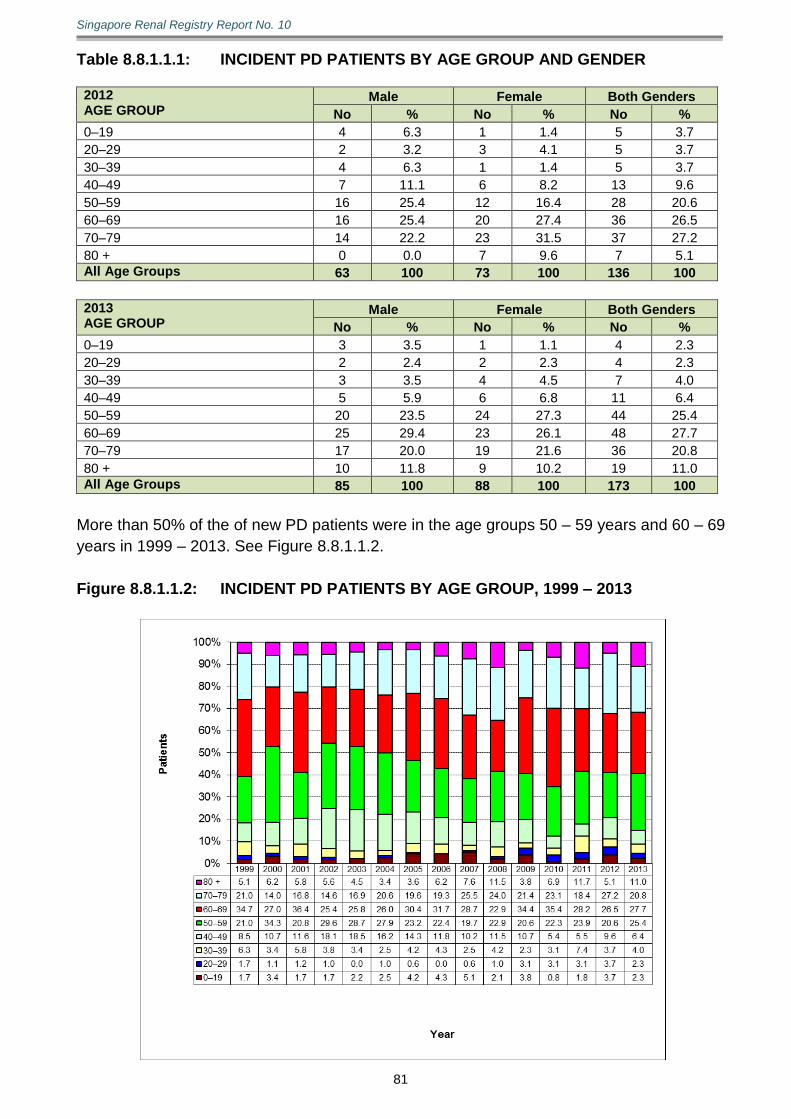
Singapore Renal Registry Report No. 10
81
Table 8.8.1.1.1: INCIDENT PD PATIENTS BY AGE GROUP AND GENDER 2012 AGE GROUP
Male Female Both Genders
No % No % No %
0–19 4 6.3 1 1.4 5 3.7
20–29 2 3.2 3 4.1 5 3.7
30–39 4 6.3 1 1.4 5 3.7
40–49 7 11.1 6 8.2 13 9.6
50–59 16 25.4 12 16.4 28 20.6
60–69 16 25.4 20 27.4 36 26.5
70–79 14 22.2 23 31.5 37 27.2
80 + 0 0.0 7 9.6 7 5.1
All Age Groups 63 100 73 100 136 100
2013 AGE GROUP
Male Female Both Genders
No % No % No %
0–19 3 3.5 1 1.1 4 2.3
20–29 2 2.4 2 2.3 4 2.3
30–39 3 3.5 4 4.5 7 4.0
40–49 5 5.9 6 6.8 11 6.4
50–59 20 23.5 24 27.3 44 25.4
60–69 25 29.4 23 26.1 48 27.7
70–79 17 20.0 19 21.6 36 20.8
80 + 10 11.8 9 10.2 19 11.0
All Age Groups 85 100 88 100 173 100
More than 50% of the of new PD patients were in the age groups 50 – 59 years and 60 – 69
years in 1999 – 2013. See Figure 8.8.1.1.2.
Figure 8.8.1.1.2: INCIDENT PD PATIENTS BY AGE GROUP, 1999 – 2013
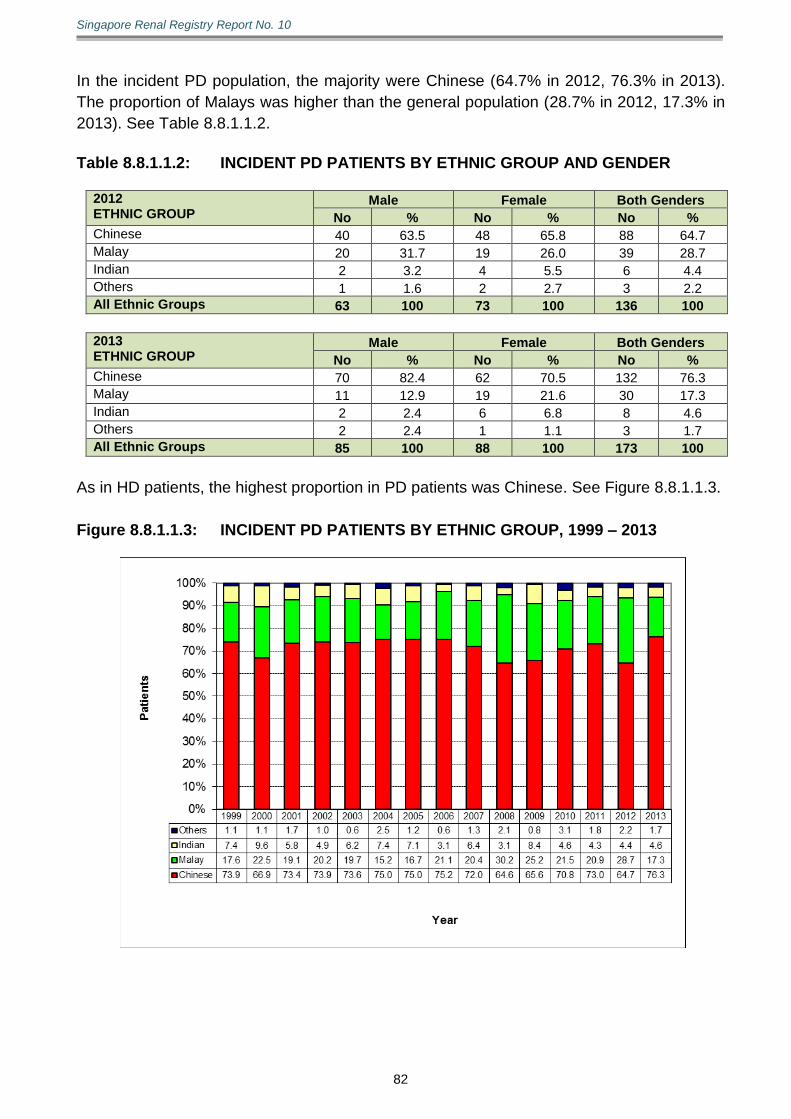
Singapore Renal Registry Report No. 10
82
In the incident PD population, the majority were Chinese (64.7% in 2012, 76.3% in 2013).
The proportion of Malays was higher than the general population (28.7% in 2012, 17.3% in
2013). See Table 8.8.1.1.2.
Table 8.8.1.1.2: INCIDENT PD PATIENTS BY ETHNIC GROUP AND GENDER
2012 ETHNIC GROUP
Male Female Both Genders
No % No % No %
Chinese 40 63.5 48 65.8 88 64.7
Malay 20 31.7 19 26.0 39 28.7
Indian 2 3.2 4 5.5 6 4.4
Others 1 1.6 2 2.7 3 2.2
All Ethnic Groups 63 100 73 100 136 100
2013 ETHNIC GROUP
Male Female Both Genders
No % No % No %
Chinese 70 82.4 62 70.5 132 76.3
Malay 11 12.9 19 21.6 30 17.3
Indian 2 2.4 6 6.8 8 4.6
Others 2 2.4 1 1.1 3 1.7
All Ethnic Groups 85 100 88 100 173 100
As in HD patients, the highest proportion in PD patients was Chinese. See Figure 8.8.1.1.3.
Figure 8.8.1.1.3: INCIDENT PD PATIENTS BY ETHNIC GROUP, 1999 – 2013

Singapore Renal Registry Report No. 10
83
Females outnumbered males among the incident PD patients in the period 1999–2013
except for the years 2000, 2006 and 2011. See Table 8.8.1.1.3. Table 8.8.1.1.3: INCIDENT PD PATIENTS BY GENDER, 1999 – 2013
YEAR Male Female
No % No %
1999 78 44.3 98 55.7
2000 101 56.7 77 43.3
2001 74 42.8 99 57.2
2002 137 47.7 150 52.3
2003 87 48.9 91 51.1
2004 97 47.5 107 52.5
2005 77 45.8 91 54.2
2006 82 50.9 79 49.1
2007 78 49.7 79 50.3
2008 38 39.6 58 60.4
2009 64 48.9 67 51.1
2010 58 44.6 72 55.4
2011 83 50.9 80 49.1
2012 63 46.3 73 53.7
2013 85 49.1 88 50.9
8.8.1.2 Prevalence
There were 631 prevalent patients (CR 165.3 pmp; ASR 119.9 pmp) on PD as of 31
December 2012. Of these, 45.3% (286 patients) were males. The mean age was 60.2
years. See Table 8.8.1.2.2
There were 681 prevalent patients (CR 177.1 pmp; ASR 123.7 pmp) on PD as of 31
December 2013. Of these, 46.5% (317 patients) were males. The mean age was 60.8
years. See Table 8.8.1.2.2
The mean age for prevalent PD patients ranged from 57.4 years old to 60.8 years old in the
period 1999 – 2013. See Figure 8.8.1.2.1.

Singapore Renal Registry Report No. 10
84
Figure 8.8.1.2.1: AGE OF PREVALENT PD PATIENTS, 1999 – 2013
About half of the prevalent PD patients were aged 60 years or above. These patients were
older than the prevalent HD patients. See Table 8.8.1.2.2.
Table 8.8.1.2.2: PREVALENT PD PATIENTS BY AGE GROUP AND GENDER
2012 AGE GROUP
Male Female Both Genders
No % No % No %
0–19 7 2.4 5 1.4 12 1.9
20–29 10 3.5 17 4.9 27 4.3
30–39 13 4.5 13 3.8 26 4.1
40–49 26 9.1 41 11.9 67 10.6
50–59 64 22.4 71 20.6 135 21.4
60–69 96 33.6 95 27.5 191 30.3
70–79 55 19.2 79 22.9 134 21.2
80 + 15 5.2 24 7.0 39 6.2
All Age Groups 286 100 345 100 631 100
2013 AGE GROUP
Male Female Both Genders
No % No % No %
0–19 5 1.6 5 1.4 10 1.5
20–29 13 4.1 18 4.9 31 4.6
30–39 17 5.4 15 4.1 32 4.7
40–49 23 7.3 34 9.3 57 8.4
50–59 65 20.5 94 25.8 159 23.3
60–69 104 32.8 97 26.6 201 29.5
70–79 67 21.1 73 20.1 140 20.6
80 + 23 7.3 28 7.7 51 7.5
All Age Groups 317 100 364 100 681 100

Singapore Renal Registry Report No. 10
85
As with incident PD patients, the highest proportion of existing PD patients was in the age
group 60 – 69 years old. See Figure 8.8.1.2.2. Figure 8.8.1.2.2: PREVALENT PD PATIENTS BY AGE GROUP, 1999 – 2013
In 2012, the majority of the patients were Chinese (71.0%), followed by Malays (21.9%),
Indians (5.1%) and other races (2.1%). See Table 8.8.1.2.3.
This was similar for 2013 where the majority of the patients were Chinese (72.8%), followed
by Malays (20.4%), Indians (5.0%) and other races (1.8%). See Table 8.8.1.2.3.

Singapore Renal Registry Report No. 10
86
Table 8.8.1.2.3: PREVALENT PD PATIENTS BY ETHNIC GROUP AND GENDER
2012 ETHNIC GROUP
Male Female Both Genders
No % No % No %
Chinese 196 68.5 252 73.0 448 71.0
Malay 69 24.1 69 20.0 138 21.9
Indian 16 5.6 16 4.6 32 5.1
Others 5 1.7 8 2.3 13 2.1
All Ethnic Groups 286 100 345 100 631 100
2013 ETHNIC GROUP
Male Female Both Genders
No % No % No %
Chinese 231 72.9 265 72.8 496 72.8
Malay 64 20.2 75 20.6 139 20.4
Indian 15 4.7 19 5.2 34 5.0
Others 7 2.2 5 1.4 12 1.8
All Ethnic Groups 317 100 364 100 681 100
For the period 1999 – 2013, more than 70% of the existing PD patients were Chinese. See
Figure 8.8.1.2.3. Figure 8.8.1.2.3: PREVALENT PD PATIENTS BY ETHNIC GROUP, 1999 – 2013
The proportion of existing female PD patients was consistently higher than their male
counterparts for 1999 – 2013. See Table 8.8.1.2.4.
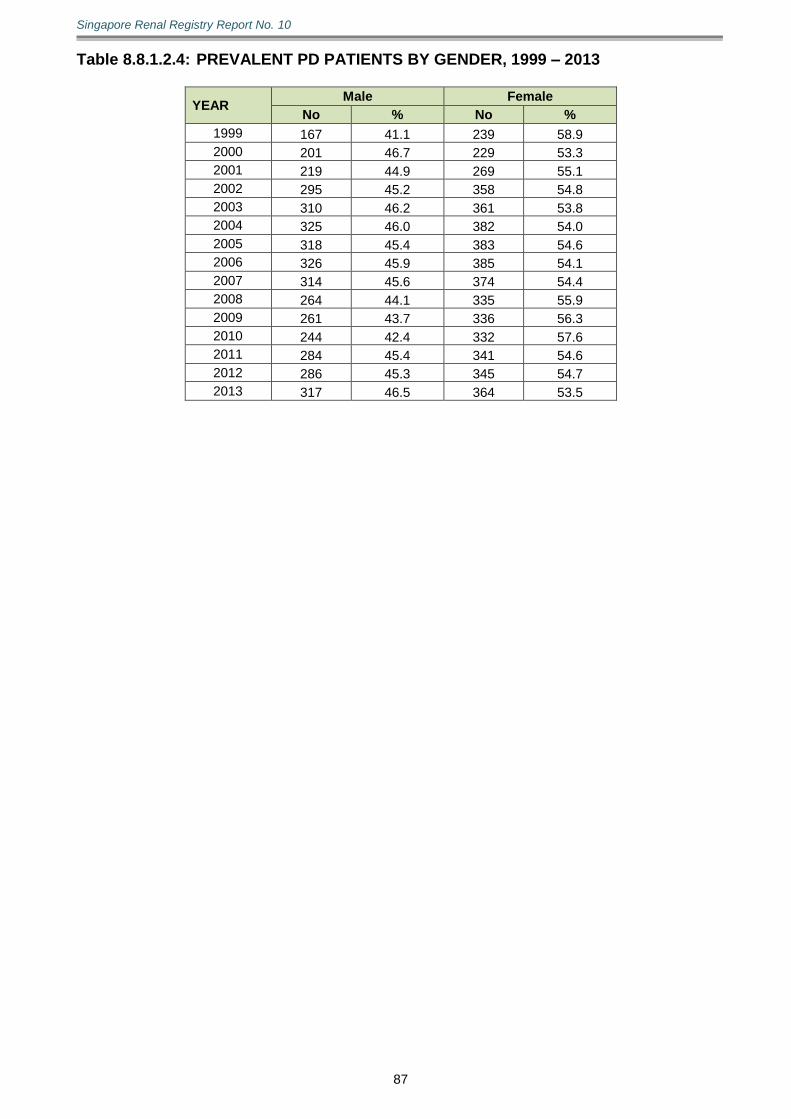
Singapore Renal Registry Report No. 10
87
Table 8.8.1.2.4: PREVALENT PD PATIENTS BY GENDER, 1999 – 2013
YEAR Male Female
No % No %
1999 167 41.1 239 58.9
2000 201 46.7 229 53.3
2001 219 44.9 269 55.1
2002 295 45.2 358 54.8
2003 310 46.2 361 53.8
2004 325 46.0 382 54.0
2005 318 45.4 383 54.6
2006 326 45.9 385 54.1
2007 314 45.6 374 54.4
2008 264 44.1 335 55.9
2009 261 43.7 336 56.3
2010 244 42.4 332 57.6
2011 284 45.4 341 54.6
2012 286 45.3 345 54.7
2013 317 46.5 364 53.5
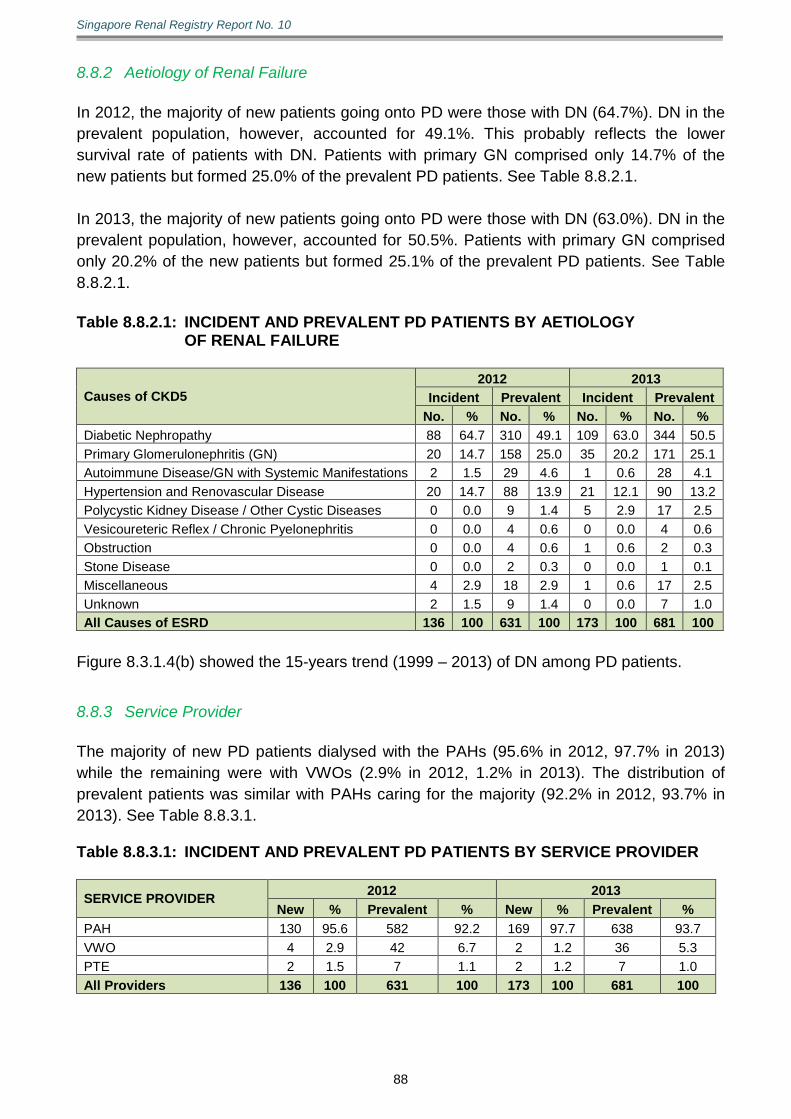
Singapore Renal Registry Report No. 10
88
8.8.2 Aetiology of Renal Failure
In 2012, the majority of new patients going onto PD were those with DN (64.7%). DN in the
prevalent population, however, accounted for 49.1%. This probably reflects the lower
survival rate of patients with DN. Patients with primary GN comprised only 14.7% of the
new patients but formed 25.0% of the prevalent PD patients. See Table 8.8.2.1.
In 2013, the majority of new patients going onto PD were those with DN (63.0%). DN in the
prevalent population, however, accounted for 50.5%. Patients with primary GN comprised
only 20.2% of the new patients but formed 25.1% of the prevalent PD patients. See Table
8.8.2.1.
Table 8.8.2.1: INCIDENT AND PREVALENT PD PATIENTS BY AETIOLOGY OF RENAL FAILURE
Causes of CKD5
2012 2013
Incident Prevalent Incident Prevalent
No. % No. % No. % No. %
Diabetic Nephropathy 88 64.7 310 49.1 109 63.0 344 50.5
Primary Glomerulonephritis (GN) 20 14.7 158 25.0 35 20.2 171 25.1
Autoimmune Disease/GN with Systemic Manifestations 2 1.5 29 4.6 1 0.6 28 4.1
Hypertension and Renovascular Disease 20 14.7 88 13.9 21 12.1 90 13.2
Polycystic Kidney Disease / Other Cystic Diseases 0 0.0 9 1.4 5 2.9 17 2.5
Vesicoureteric Reflex / Chronic Pyelonephritis 0 0.0 4 0.6 0 0.0 4 0.6
Obstruction 0 0.0 4 0.6 1 0.6 2 0.3
Stone Disease 0 0.0 2 0.3 0 0.0 1 0.1
Miscellaneous 4 2.9 18 2.9 1 0.6 17 2.5
Unknown 2 1.5 9 1.4 0 0.0 7 1.0
All Causes of ESRD 136 100 631 100 173 100 681 100
Figure 8.3.1.4(b) showed the 15-years trend (1999 – 2013) of DN among PD patients.
8.8.3 Service Provider
The majority of new PD patients dialysed with the PAHs (95.6% in 2012, 97.7% in 2013)
while the remaining were with VWOs (2.9% in 2012, 1.2% in 2013). The distribution of
prevalent patients was similar with PAHs caring for the majority (92.2% in 2012, 93.7% in
2013). See Table 8.8.3.1. Table 8.8.3.1: INCIDENT AND PREVALENT PD PATIENTS BY SERVICE PROVIDER
SERVICE PROVIDER 2012 2013
New % Prevalent % New % Prevalent %
PAH 130 95.6 582 92.2 169 97.7 638 93.7
VWO 4 2.9 42 6.7 2 1.2 36 5.3
PTE 2 1.5 7 1.1 2 1.2 7 1.0
All Providers 136 100 631 100 173 100 681 100

Singapore Renal Registry Report No. 10
89
The trends of incident and prevalent patients on PD by service provider from 1999 to 2013
are shown below. See Figures 8.8.3.1 and 8.8.3.2. Figure 8.8.3.1: INCIDENT PD PATIENTS BY SERVICE PROVIDER, 1999 – 2013
Figure 8.8.3.2: PREVALENT PD PATIENTS BY SERVICE PROVIDER, 1999 – 2013
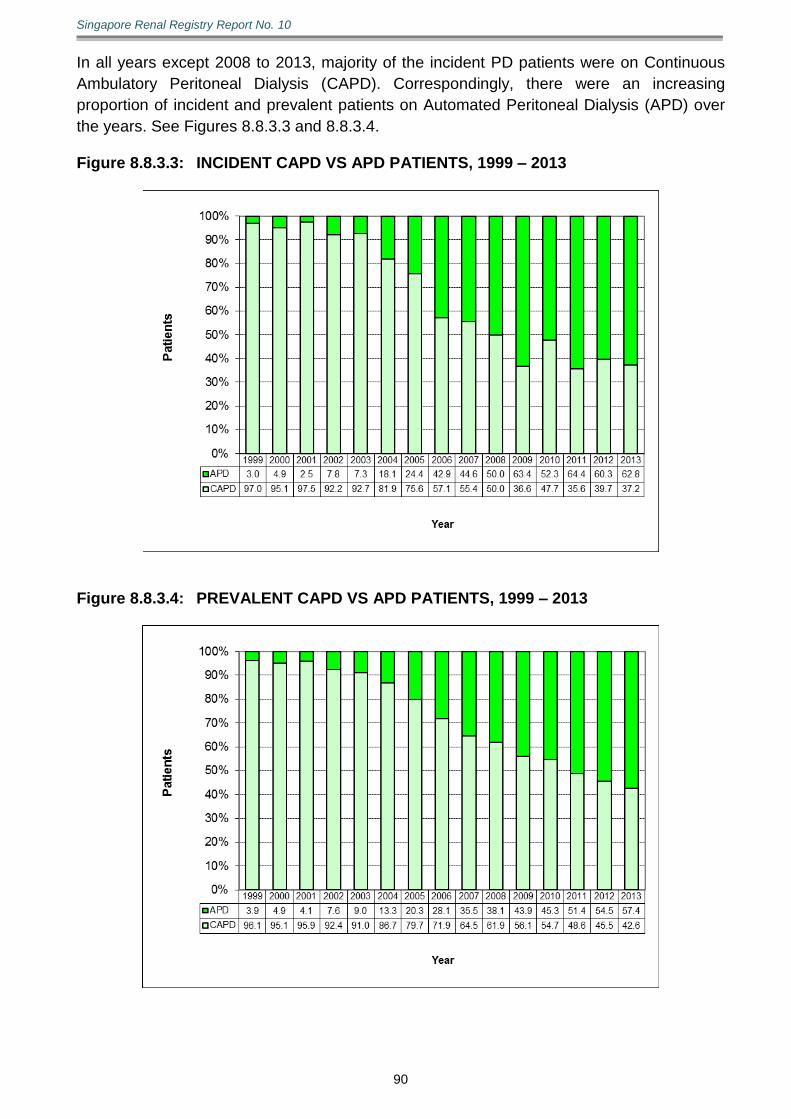
Singapore Renal Registry Report No. 10
90
In all years except 2008 to 2013, majority of the incident PD patients were on Continuous
Ambulatory Peritoneal Dialysis (CAPD). Correspondingly, there were an increasing
proportion of incident and prevalent patients on Automated Peritoneal Dialysis (APD) over
the years. See Figures 8.8.3.3 and 8.8.3.4. Figure 8.8.3.3: INCIDENT CAPD VS APD PATIENTS, 1999 – 2013
Figure 8.8.3.4: PREVALENT CAPD VS APD PATIENTS, 1999 – 2013
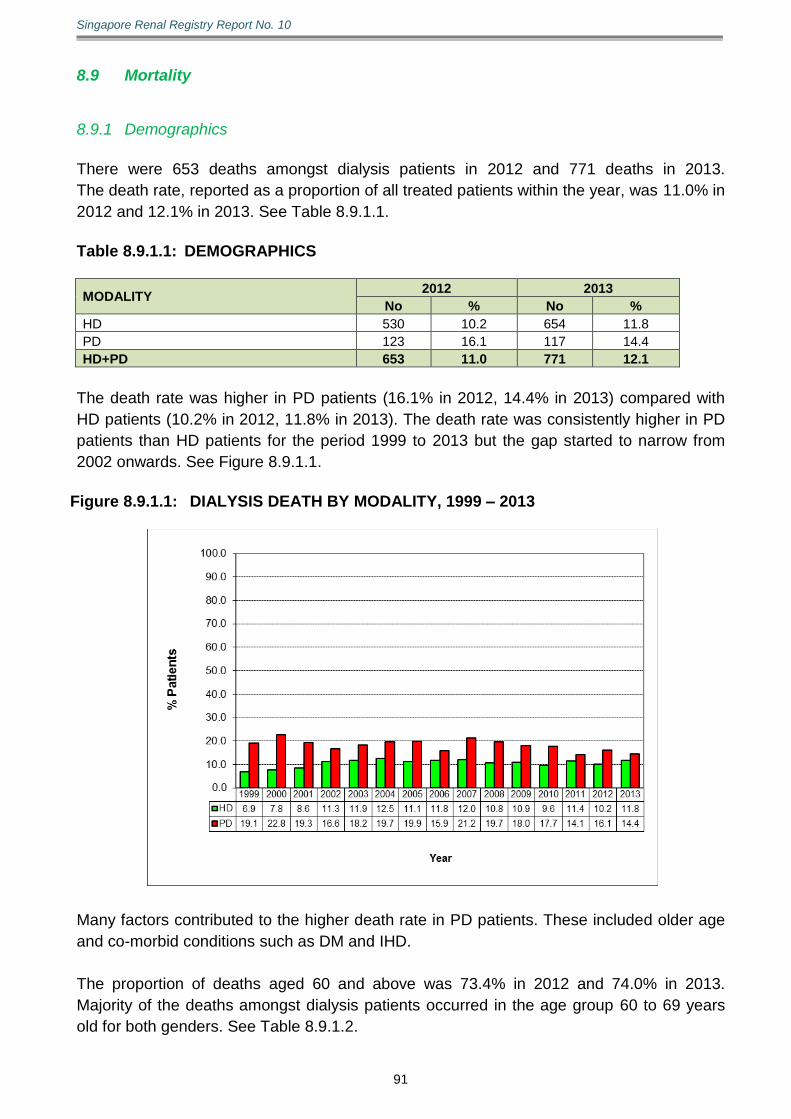
Singapore Renal Registry Report No. 10
91
8.9 Mortality
8.9.1 Demographics
There were 653 deaths amongst dialysis patients in 2012 and 771 deaths in 2013.
The death rate, reported as a proportion of all treated patients within the year, was 11.0% in
2012 and 12.1% in 2013. See Table 8.9.1.1.
Table 8.9.1.1: DEMOGRAPHICS
MODALITY 2012 2013
No % No %
HD 530 10.2 654 11.8
PD 123 16.1 117 14.4
HD+PD 653 11.0 771 12.1
The death rate was higher in PD patients (16.1% in 2012, 14.4% in 2013) compared with
HD patients (10.2% in 2012, 11.8% in 2013). The death rate was consistently higher in PD
patients than HD patients for the period 1999 to 2013 but the gap started to narrow from
2002 onwards. See Figure 8.9.1.1.
Figure 8.9.1.1: DIALYSIS DEATH BY MODALITY, 1999 – 2013
Many factors contributed to the higher death rate in PD patients. These included older age
and co-morbid conditions such as DM and IHD.
The proportion of deaths aged 60 and above was 73.4% in 2012 and 74.0% in 2013.
Majority of the deaths amongst dialysis patients occurred in the age group 60 to 69 years
old for both genders. See Table 8.9.1.2.
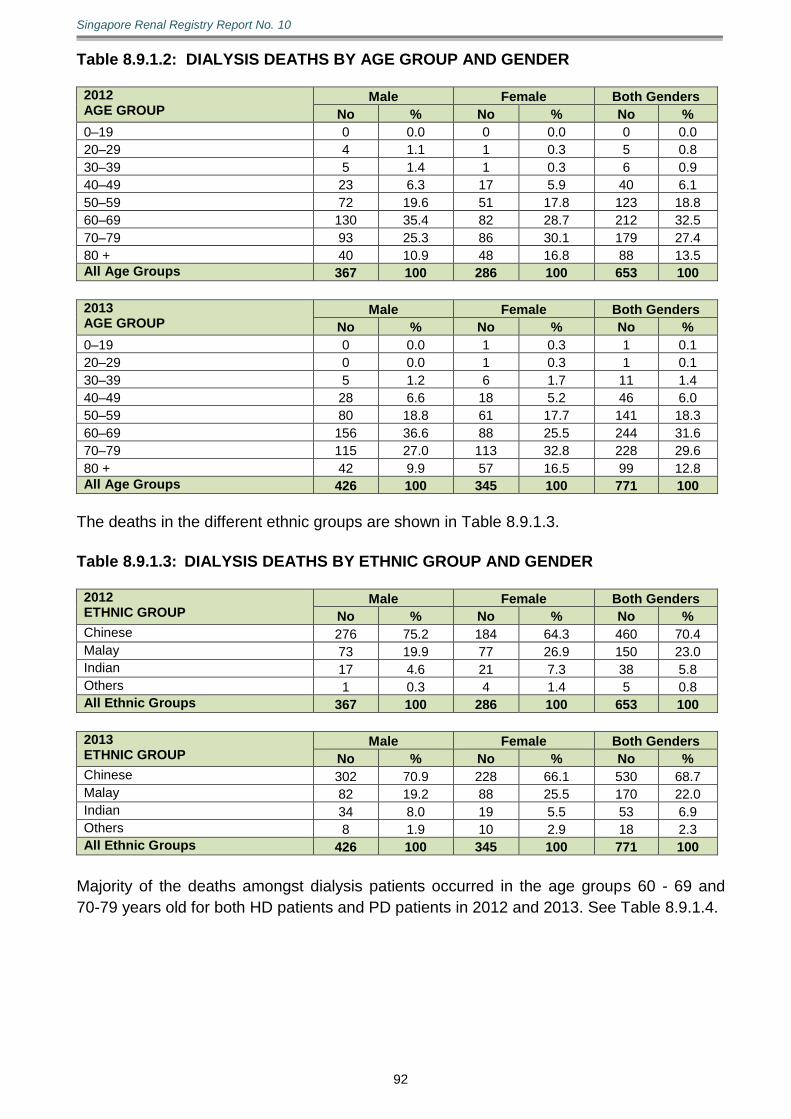
Singapore Renal Registry Report No. 10
92
Table 8.9.1.2: DIALYSIS DEATHS BY AGE GROUP AND GENDER 2012 AGE GROUP
Male Female Both Genders
No % No % No %
0–19 0 0.0 0 0.0 0 0.0
20–29 4 1.1 1 0.3 5 0.8
30–39 5 1.4 1 0.3 6 0.9
40–49 23 6.3 17 5.9 40 6.1
50–59 72 19.6 51 17.8 123 18.8
60–69 130 35.4 82 28.7 212 32.5
70–79 93 25.3 86 30.1 179 27.4
80 + 40 10.9 48 16.8 88 13.5
All Age Groups 367 100 286 100 653 100
2013 AGE GROUP
Male Female Both Genders
No % No % No %
0–19 0 0.0 1 0.3 1 0.1
20–29 0 0.0 1 0.3 1 0.1
30–39 5 1.2 6 1.7 11 1.4
40–49 28 6.6 18 5.2 46 6.0
50–59 80 18.8 61 17.7 141 18.3
60–69 156 36.6 88 25.5 244 31.6
70–79 115 27.0 113 32.8 228 29.6
80 + 42 9.9 57 16.5 99 12.8
All Age Groups 426 100 345 100 771 100
The deaths in the different ethnic groups are shown in Table 8.9.1.3.
Table 8.9.1.3: DIALYSIS DEATHS BY ETHNIC GROUP AND GENDER 2012 ETHNIC GROUP
Male Female Both Genders
No % No % No %
Chinese 276 75.2 184 64.3 460 70.4
Malay 73 19.9 77 26.9 150 23.0
Indian 17 4.6 21 7.3 38 5.8
Others 1 0.3 4 1.4 5 0.8
All Ethnic Groups 367 100 286 100 653 100
2013 ETHNIC GROUP
Male Female Both Genders
No % No % No %
Chinese 302 70.9 228 66.1 530 68.7
Malay 82 19.2 88 25.5 170 22.0
Indian 34 8.0 19 5.5 53 6.9
Others 8 1.9 10 2.9 18 2.3
All Ethnic Groups 426 100 345 100 771 100
Majority of the deaths amongst dialysis patients occurred in the age groups 60 - 69 and
70-79 years old for both HD patients and PD patients in 2012 and 2013. See Table 8.9.1.4.

Singapore Renal Registry Report No. 10
93
Table 8.9.1.4: DIALYSIS DEATHS BY AGE GROUP AND MODALITY
2012 AGE GROUP
HD PD HD+PD
No % No % No %
0–19 0 0.0 0 0.0 0 0.0
20–29 3 0.6 2 1.6 5 0.8
30–39 6 1.1 0 0.0 6 0.9
40–49 34 6.4 6 4.9 40 6.1
50–59 99 18.7 24 19.5 123 18.8
60–69 170 32.1 42 34.1 212 32.5
70–79 147 27.7 32 26.0 179 27.4
80 + 71 13.4 17 13.8 88 13.5
All Age Groups 530 100 123 100 653 100
2013 AGE GROUP
HD PD HD+PD
No % No % No %
0–19 1 0.2 0 0.0 1 0.1
20–29 0 0.0 1 0.9 1 0.1
30–39 9 1.4 2 1.7 11 1.4
40–49 39 6.0 7 6.0 46 6.0
50–59 124 19.0 17 14.5 141 18.3
60–69 207 31.7 37 31.6 244 31.6
70–79 190 29.1 38 32.5 228 29.6
80 + 84 12.8 15 12.8 99 12.8
All Age Groups 654 100 117 100 771 100
The mean age of death was also similar in both modalities (HD: 66.9 years in 2012 and
67.0 years in 2013; PD: 66.8 years in 2012 and 67.6 years in 2013). The Chinese appeared
to have a later age at death compared with the Malays or Indians. See Table 8.9.1.5. Table 8.9.1.5: AGE OF DIALYSIS DEATH BY ETHNIC GROUP
Modality 2012 2013
Chinese Malay Indian Others All Chinese Malay Indian Others All
HD
Mean 69.0 62.3 60.9 72.2 66.9 68.3 64.3 63.7 63.9 67.0
Median 69.1 64.3 60.0 73.0 67.2 69.0 63.9 65.6 60.7 67.0
Std. Dev*
11.3 11.7 10.5 16.6 11.8 11.6 10.7 11.3 11.0 11.5
PD
Mean 67.7 64.4 65.0 53.8 66.8 69.3 63.6 65.3 68.8 67.6
Median 68.5 65.9 62.9 53.8 67.2 69.9 63.8 64.8 70.9 68.1
Std. Dev 12.2 8.8 6.3 53.8 11.5 11.9 10.8 12.1 10.7 11.7
HD+PD
Mean 68.7 62.7 61.4 68.5 66.9 68.4 64.2 63.8 65.0 67.1
Median 69.0 64.4 61.3 65.9 67.2 69.2 63.9 65.4 65.7 67.4
Std. Dev 11.5 11.3 10.1 16.5 11.7 11.6 10.7 11.3 10.9 11.5
* Std. Dev stands for Standard Deviation
8.9.2 Cause of Death
Cardiac events (acute myocardial infarction, acute pulmonary oedema and other cardiac
causes) accounted for 35.1% of deaths in 2012 and 34.8% in 2013. Infections accounted
for 30.8% in 2012 and 31.1% in 2013. See Table 8.9.2.1.
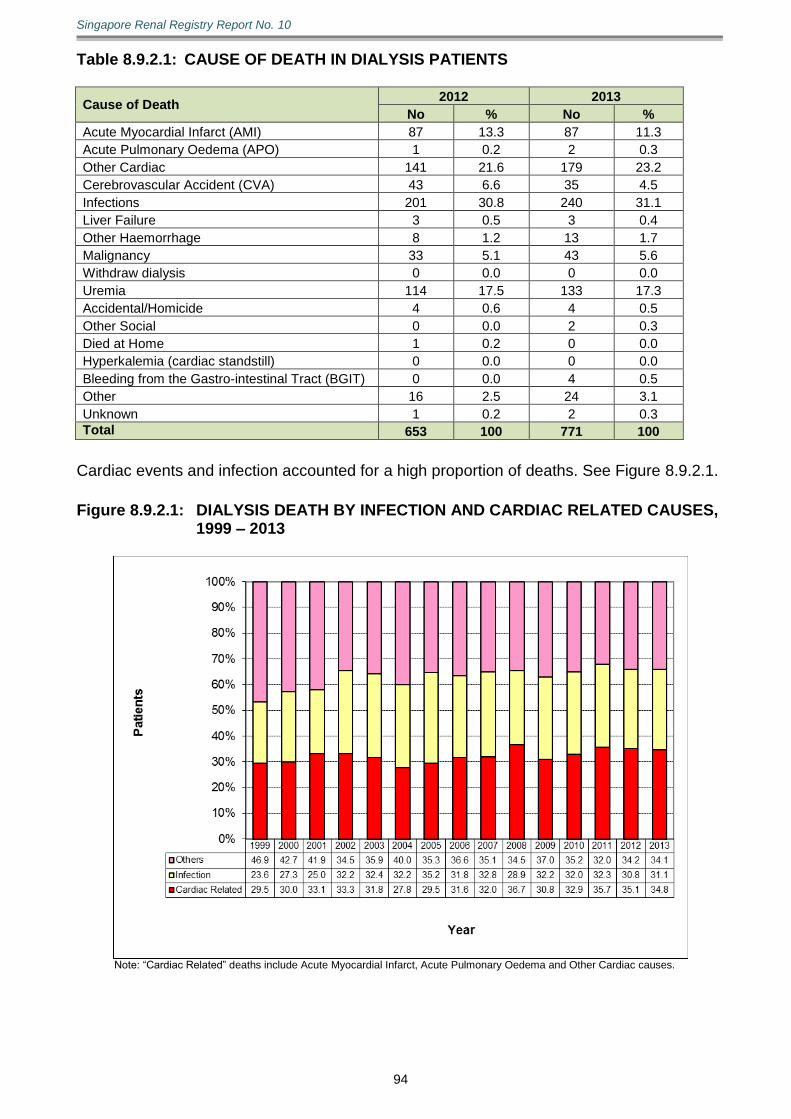
Singapore Renal Registry Report No. 10
94
Table 8.9.2.1: CAUSE OF DEATH IN DIALYSIS PATIENTS
Cause of Death 2012 2013
No % No %
Acute Myocardial Infarct (AMI) 87 13.3 87 11.3
Acute Pulmonary Oedema (APO) 1 0.2 2 0.3
Other Cardiac 141 21.6 179 23.2
Cerebrovascular Accident (CVA) 43 6.6 35 4.5
Infections 201 30.8 240 31.1
Liver Failure 3 0.5 3 0.4
Other Haemorrhage 8 1.2 13 1.7
Malignancy 33 5.1 43 5.6
Withdraw dialysis 0 0.0 0 0.0
Uremia 114 17.5 133 17.3
Accidental/Homicide 4 0.6 4 0.5
Other Social 0 0.0 2 0.3
Died at Home 1 0.2 0 0.0
Hyperkalemia (cardiac standstill) 0 0.0 0 0.0
Bleeding from the Gastro-intestinal Tract (BGIT) 0 0.0 4 0.5
Other 16 2.5 24 3.1
Unknown 1 0.2 2 0.3
Total 653 100 771 100
Cardiac events and infection accounted for a high proportion of deaths. See Figure 8.9.2.1.
Figure 8.9.2.1: DIALYSIS DEATH BY INFECTION AND CARDIAC RELATED CAUSES,
1999 – 2013
Note: “Cardiac Related” deaths include Acute Myocardial Infarct, Acute Pulmonary Oedema and Other Cardiac causes.
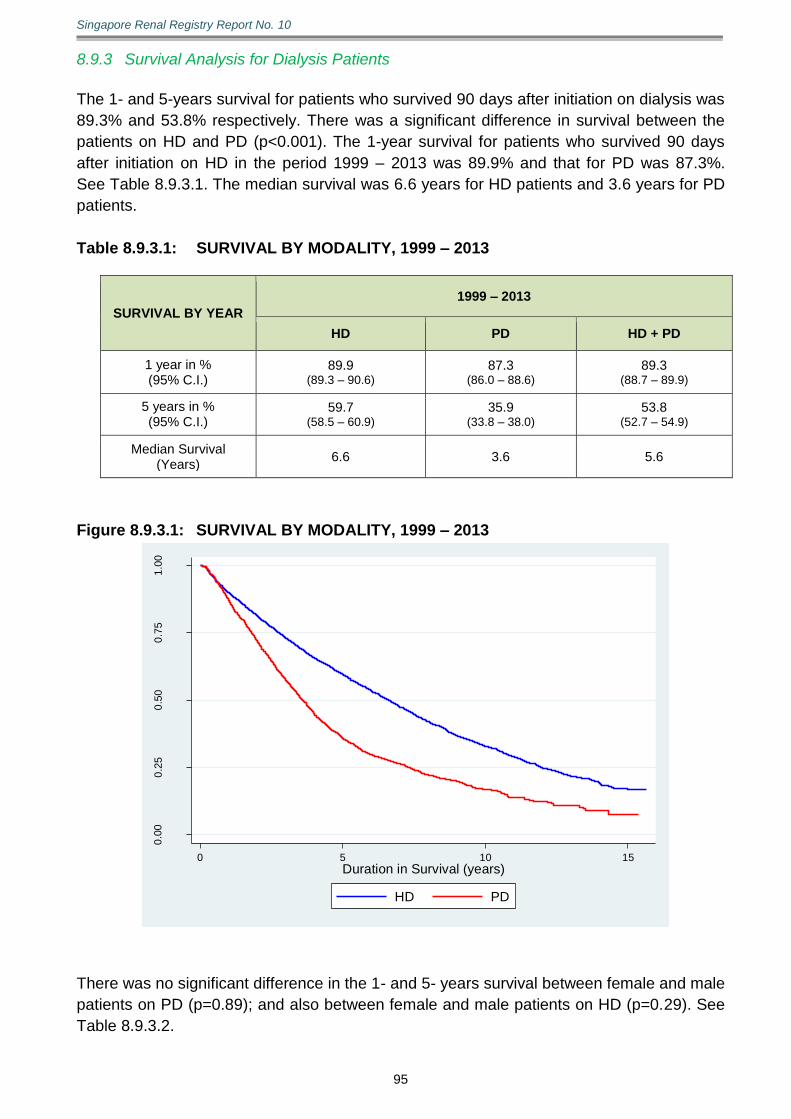
Singapore Renal Registry Report No. 10
95
8.9.3 Survival Analysis for Dialysis Patients
The 1- and 5-years survival for patients who survived 90 days after initiation on dialysis was
89.3% and 53.8% respectively. There was a significant difference in survival between the
patients on HD and PD (p<0.001). The 1-year survival for patients who survived 90 days
after initiation on HD in the period 1999 – 2013 was 89.9% and that for PD was 87.3%.
See Table 8.9.3.1. The median survival was 6.6 years for HD patients and 3.6 years for PD
patients.
Table 8.9.3.1: SURVIVAL BY MODALITY, 1999 – 2013
SURVIVAL BY YEAR
1999 – 2013
HD PD HD + PD
1 year in % (95% C.I.)
89.9 (89.3 – 90.6)
87.3 (86.0 – 88.6)
89.3 (88.7 – 89.9)
5 years in % (95% C.I.)
59.7 (58.5 – 60.9)
35.9 (33.8 – 38.0)
53.8 (52.7 – 54.9)
Median Survival (Years)
6.6 3.6 5.6
Figure 8.9.3.1: SURVIVAL BY MODALITY, 1999 – 2013
0.0
00
.25
0.5
00
.75
1.0
0
Cum
ula
tive S
urv
ival
0 5 10 15
Duration in Survival (years)
HD PD
There was no significant difference in the 1- and 5- years survival between female and male
patients on PD (p=0.89); and also between female and male patients on HD (p=0.29). See
Table 8.9.3.2.

Singapore Renal Registry Report No. 10
96
Table 8.9.3.2: SURVIVAL BY GENDER AND MODALITY, 1999 – 2013
1999 – 2013 Male Female
PD HD HD + PD PD HD HD + PD
1 year survival in % (95% C.I.)
87.3 (85.2 – 89.1)
89.9 (89.0 – 90.7)
89.4 (88.5 – 90.1)
87.4 (85.4 – 89.1)
90.0 (89.0 – 90.9)
89.3 (88.4 – 90.1)
5 years survival in %
(95% C.I.)
36.1 (33.0 – 39.2)
59.3 (57.6 – 61.0)
54.1 (52.6 – 55.6)
35.7 (32.8 – 38.6)
60.2 (58.4 – 62.0)
53.4 (51.8 – 55.0)
Median Survival (Years)
3.7 6.5 5.6 3.5 6.7 5.6
As expected, patients aged below 60 years have better survival than patients aged 60 and
above for both PD and HD (p<0.001). See Table 8.9.3.3.
Table 8.9.3.3: SURVIVAL BY AGE GROUP AND MODALITY, 1999 – 2013
1999 – 2013 Age < 60 Age ≥ 60
PD HD HD + PD PD HD HD + PD
1 year survival in % (95% C.I.)
91.2 (89.4 – 92.7)
93.1 (92.3 – 93.8)
92.7 (92.0 – 93.4)
84.2 (82.1 – 86.0)
86.7 (85.6 – 87.7)
86.0 (85.1 – 86.9)
5 years survival in %
(95% C.I.)
52.5 (49.2 – 55.7)
71.1 (69.5 – 72.6)
66.9 (65.5 – 68.4)
22.3 (19.8 – 24.8)
47.7 (45.9 – 49.5)
40.7 (39.2 – 42.2)
Median Survival (Years)
5.2 9.1 8.3 2.8 4.6 3.9
Similarly, non-diabetic patients have better survival as compared to diabetics (p<0.001).
There was a bigger gap in survival probabilities between HD and PD among the diabetics
as compared to non-diabetics. See Table 8.9.3.4 and Figure 8.9.3.2. Table 8.9.3.4: SURVIVAL BY DIABETES STATUS (PRIMARY CAUSE) AND
MODALITY, 1999 – 2013
1999–2013 DN Non-DN DN Non-DN
PD HD PD HD HD+PD HD+PD
1 year survival in % (95% C.I.)
84.9 (83.0 – 86.6)
88.2 (87.2 – 89.1)
91.3 (89.3 – 93.0)
92.4 (91.4 – 93.2)
87.4 (86.5 – 88.2)
92.1 (91.3 – 92.9)
5 years survival in % (95% C.I.)
22.7 (20.3 – 25.1)
51.1 (49.4 – 52.8)
57.7 (54.1 – 61.1)
71.2 (69.5 – 72.9)
43.5 (42.1 – 45.0)
68.2 (66.6 – 70.0)
Median Survival (Years)
2.9 5.1 6.5 9.6 4.2 8.9

Singapore Renal Registry Report No. 10
97
Figure 8.9.3.2: SURVIVAL BY DIABETES STATUS (PRIMARY CAUSE) AND
MODALITY, 1999 – 2013
0.0
00
.25
0.5
00
.75
1.0
0
Cum
ula
tive S
urv
ival
0 5 10 15
Duration in Survival (years)
Non-DN + HD Non-DN + PD
DN + HD DN + PD
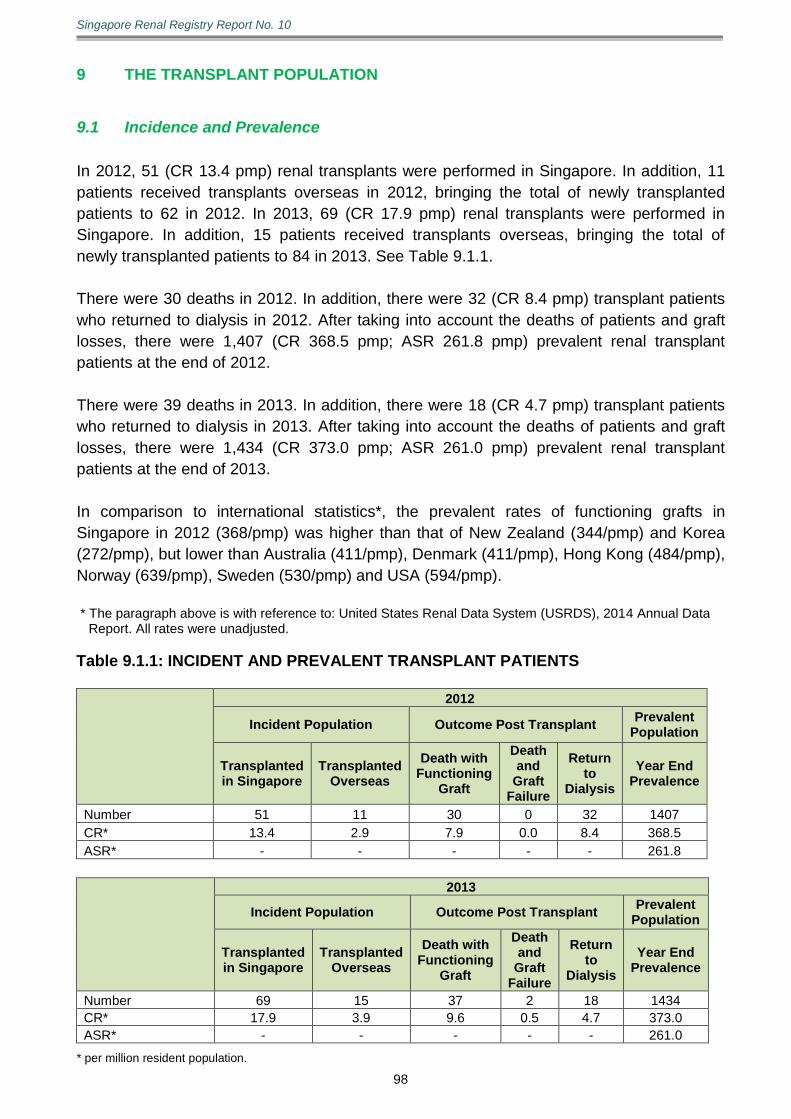
Singapore Renal Registry Report No. 10
98
9 THE TRANSPLANT POPULATION
9.1 Incidence and Prevalence
In 2012, 51 (CR 13.4 pmp) renal transplants were performed in Singapore. In addition, 11
patients received transplants overseas in 2012, bringing the total of newly transplanted
patients to 62 in 2012. In 2013, 69 (CR 17.9 pmp) renal transplants were performed in
Singapore. In addition, 15 patients received transplants overseas, bringing the total of
newly transplanted patients to 84 in 2013. See Table 9.1.1.
There were 30 deaths in 2012. In addition, there were 32 (CR 8.4 pmp) transplant patients
who returned to dialysis in 2012. After taking into account the deaths of patients and graft
losses, there were 1,407 (CR 368.5 pmp; ASR 261.8 pmp) prevalent renal transplant
patients at the end of 2012.
There were 39 deaths in 2013. In addition, there were 18 (CR 4.7 pmp) transplant patients
who returned to dialysis in 2013. After taking into account the deaths of patients and graft
losses, there were 1,434 (CR 373.0 pmp; ASR 261.0 pmp) prevalent renal transplant
patients at the end of 2013.
In comparison to international statistics*, the prevalent rates of functioning grafts in
Singapore in 2012 (368/pmp) was higher than that of New Zealand (344/pmp) and Korea
(272/pmp), but lower than Australia (411/pmp), Denmark (411/pmp), Hong Kong (484/pmp),
Norway (639/pmp), Sweden (530/pmp) and USA (594/pmp).
* The paragraph above is with reference to: United States Renal Data System (USRDS), 2014 Annual Data
Report. All rates were unadjusted.
Table 9.1.1: INCIDENT AND PREVALENT TRANSPLANT PATIENTS
2012
Incident Population Outcome Post Transplant Prevalent
Population
Transplanted in Singapore
Transplanted Overseas
Death with Functioning
Graft
Death and
Graft Failure
Return to
Dialysis
Year End Prevalence
Number 51 11 30 0 32 1407
CR* 13.4 2.9 7.9 0.0 8.4 368.5
ASR* - - - - - 261.8
2013
Incident Population Outcome Post Transplant Prevalent
Population
Transplanted in Singapore
Transplanted Overseas
Death with Functioning
Graft
Death and
Graft Failure
Return to
Dialysis
Year End Prevalence
Number 69 15 37 2 18 1434
CR* 17.9 3.9 9.6 0.5 4.7 373.0
ASR* - - - - - 261.0
* per million resident population.
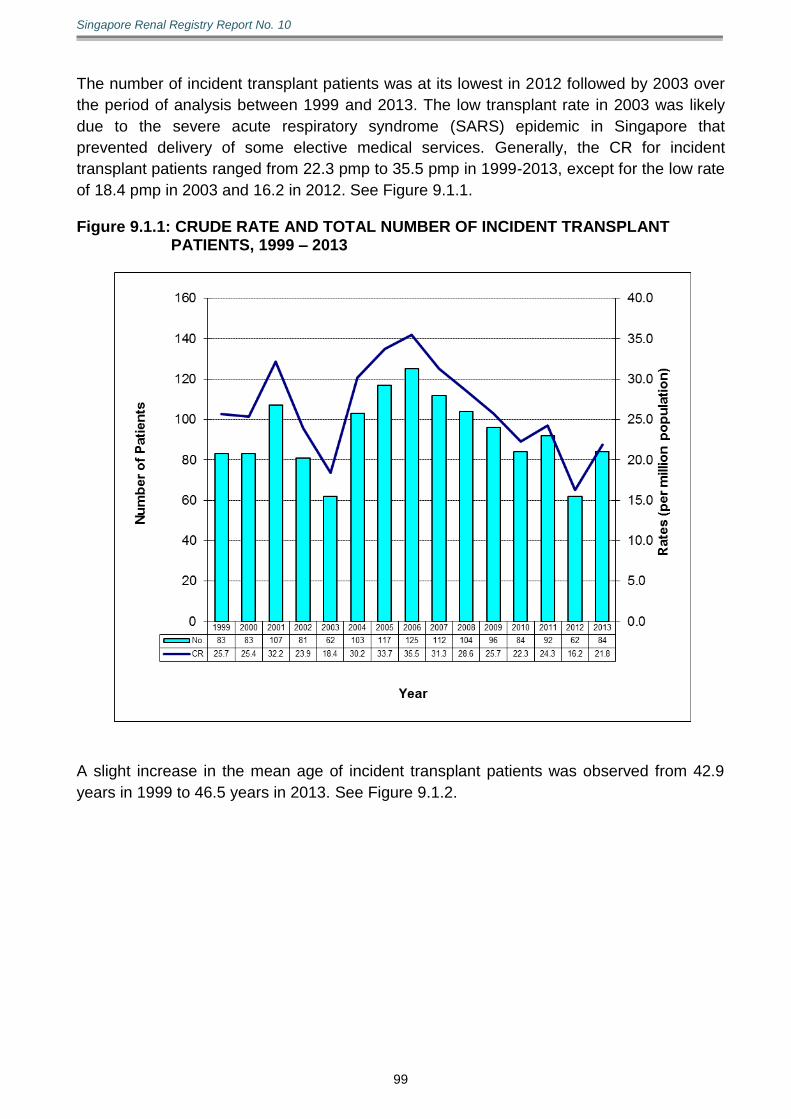
Singapore Renal Registry Report No. 10
99
The number of incident transplant patients was at its lowest in 2012 followed by 2003 over
the period of analysis between 1999 and 2013. The low transplant rate in 2003 was likely
due to the severe acute respiratory syndrome (SARS) epidemic in Singapore that
prevented delivery of some elective medical services. Generally, the CR for incident
transplant patients ranged from 22.3 pmp to 35.5 pmp in 1999-2013, except for the low rate
of 18.4 pmp in 2003 and 16.2 in 2012. See Figure 9.1.1. Figure 9.1.1: CRUDE RATE AND TOTAL NUMBER OF INCIDENT TRANSPLANT
PATIENTS, 1999 – 2013
A slight increase in the mean age of incident transplant patients was observed from 42.9
years in 1999 to 46.5 years in 2013. See Figure 9.1.2.
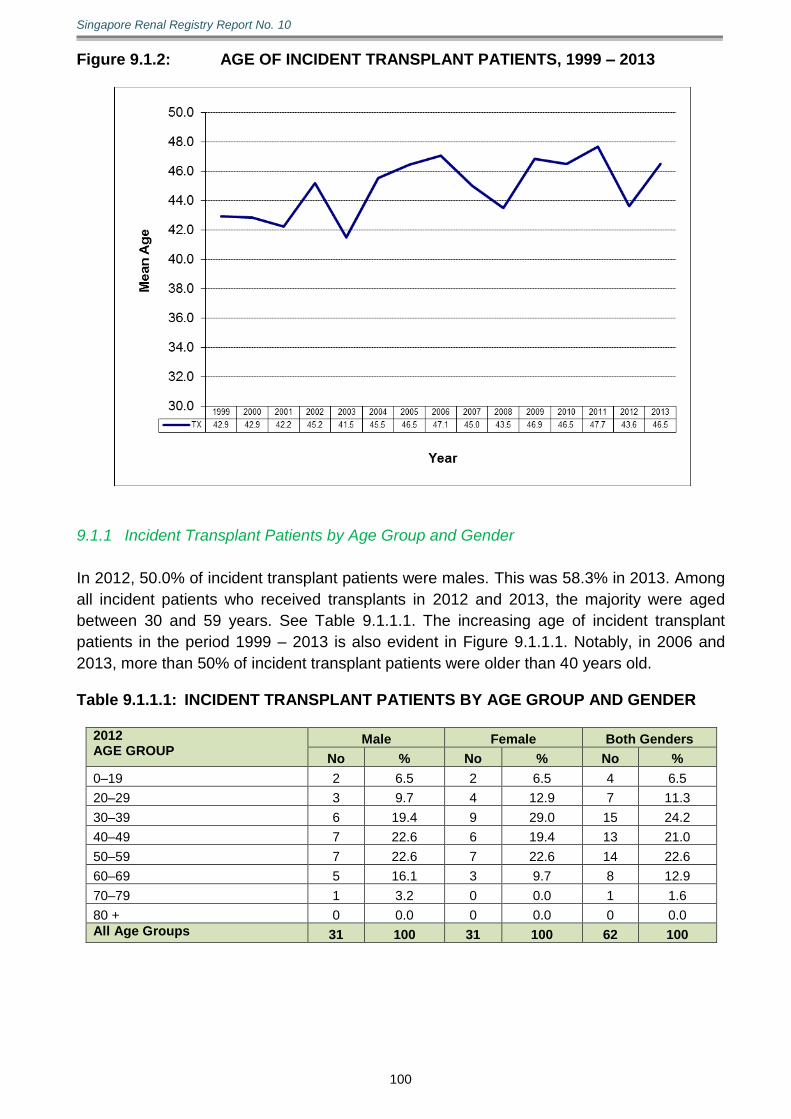
Singapore Renal Registry Report No. 10
100
Figure 9.1.2: AGE OF INCIDENT TRANSPLANT PATIENTS, 1999 – 2013
9.1.1 Incident Transplant Patients by Age Group and Gender
In 2012, 50.0% of incident transplant patients were males. This was 58.3% in 2013. Among
all incident patients who received transplants in 2012 and 2013, the majority were aged
between 30 and 59 years. See Table 9.1.1.1. The increasing age of incident transplant
patients in the period 1999 – 2013 is also evident in Figure 9.1.1.1. Notably, in 2006 and
2013, more than 50% of incident transplant patients were older than 40 years old. Table 9.1.1.1: INCIDENT TRANSPLANT PATIENTS BY AGE GROUP AND GENDER
2012 AGE GROUP
Male Female Both Genders
No % No % No %
0–19 2 6.5 2 6.5 4 6.5
20–29 3 9.7 4 12.9 7 11.3
30–39 6 19.4 9 29.0 15 24.2
40–49 7 22.6 6 19.4 13 21.0
50–59 7 22.6 7 22.6 14 22.6
60–69 5 16.1 3 9.7 8 12.9
70–79 1 3.2 0 0.0 1 1.6
80 + 0 0.0 0 0.0 0 0.0
All Age Groups 31 100 31 100 62 100
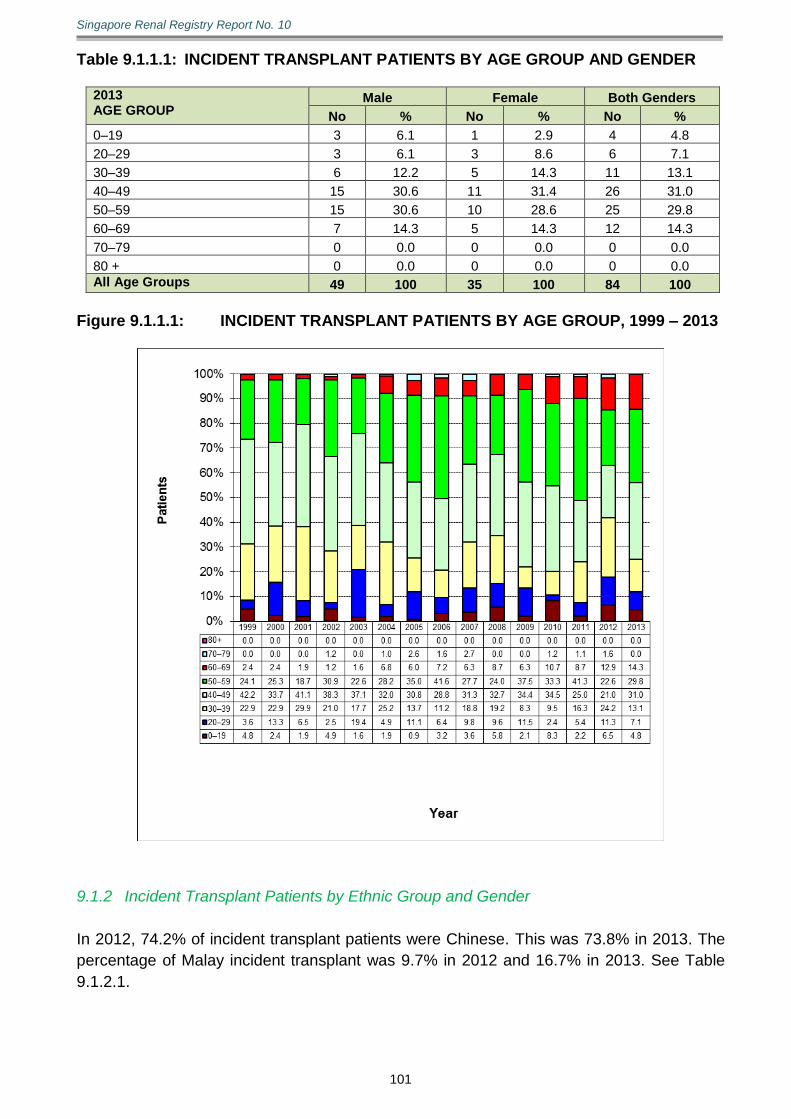
Singapore Renal Registry Report No. 10
101
Table 9.1.1.1: INCIDENT TRANSPLANT PATIENTS BY AGE GROUP AND GENDER
2013 AGE GROUP
Male Female Both Genders
No % No % No %
0–19 3 6.1 1 2.9 4 4.8
20–29 3 6.1 3 8.6 6 7.1
30–39 6 12.2 5 14.3 11 13.1
40–49 15 30.6 11 31.4 26 31.0
50–59 15 30.6 10 28.6 25 29.8
60–69 7 14.3 5 14.3 12 14.3
70–79 0 0.0 0 0.0 0 0.0
80 + 0 0.0 0 0.0 0 0.0
All Age Groups 49 100 35 100 84 100
Figure 9.1.1.1: INCIDENT TRANSPLANT PATIENTS BY AGE GROUP, 1999 – 2013
9.1.2 Incident Transplant Patients by Ethnic Group and Gender
In 2012, 74.2% of incident transplant patients were Chinese. This was 73.8% in 2013. The
percentage of Malay incident transplant was 9.7% in 2012 and 16.7% in 2013. See Table
9.1.2.1.
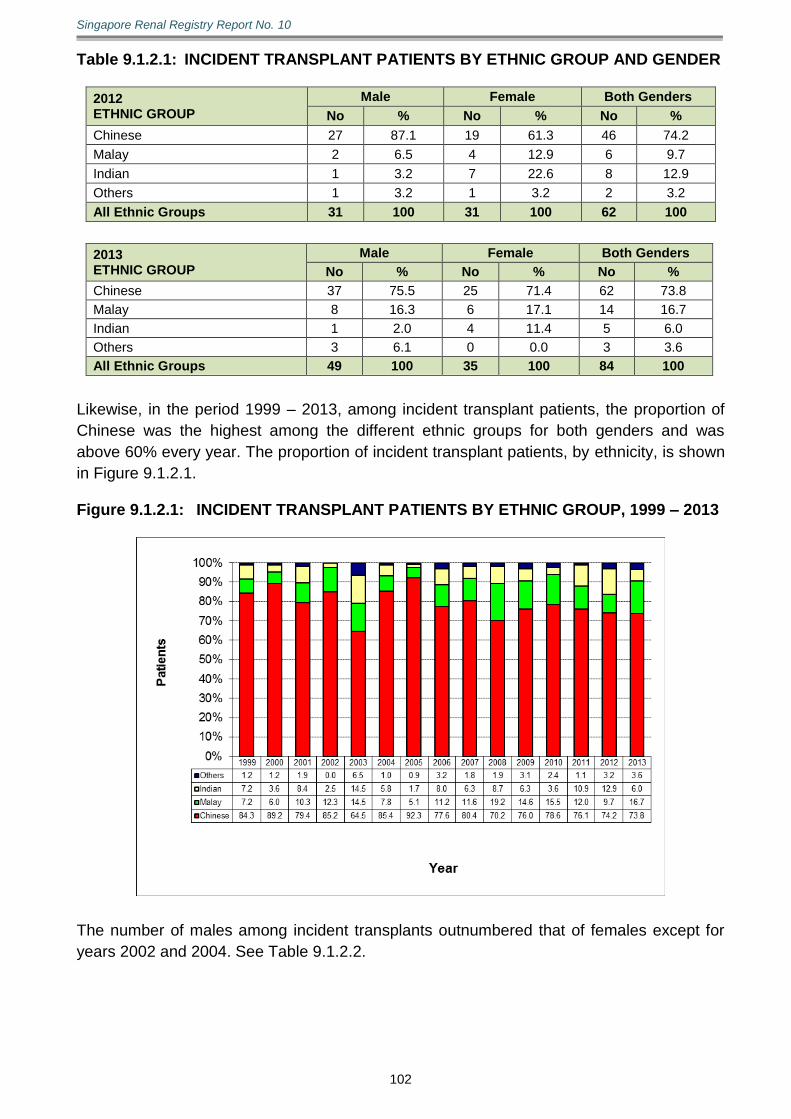
Singapore Renal Registry Report No. 10
102
Table 9.1.2.1: INCIDENT TRANSPLANT PATIENTS BY ETHNIC GROUP AND GENDER
2012 ETHNIC GROUP
Male Female Both Genders
No % No % No %
Chinese 27 87.1 19 61.3 46 74.2
Malay 2 6.5 4 12.9 6 9.7
Indian 1 3.2 7 22.6 8 12.9
Others 1 3.2 1 3.2 2 3.2
All Ethnic Groups 31 100 31 100 62 100
2013 ETHNIC GROUP
Male Female Both Genders
No % No % No %
Chinese 37 75.5 25 71.4 62 73.8
Malay 8 16.3 6 17.1 14 16.7
Indian 1 2.0 4 11.4 5 6.0
Others 3 6.1 0 0.0 3 3.6
All Ethnic Groups 49 100 35 100 84 100
Likewise, in the period 1999 – 2013, among incident transplant patients, the proportion of
Chinese was the highest among the different ethnic groups for both genders and was
above 60% every year. The proportion of incident transplant patients, by ethnicity, is shown
in Figure 9.1.2.1. Figure 9.1.2.1: INCIDENT TRANSPLANT PATIENTS BY ETHNIC GROUP, 1999 – 2013
The number of males among incident transplants outnumbered that of females except for
years 2002 and 2004. See Table 9.1.2.2.
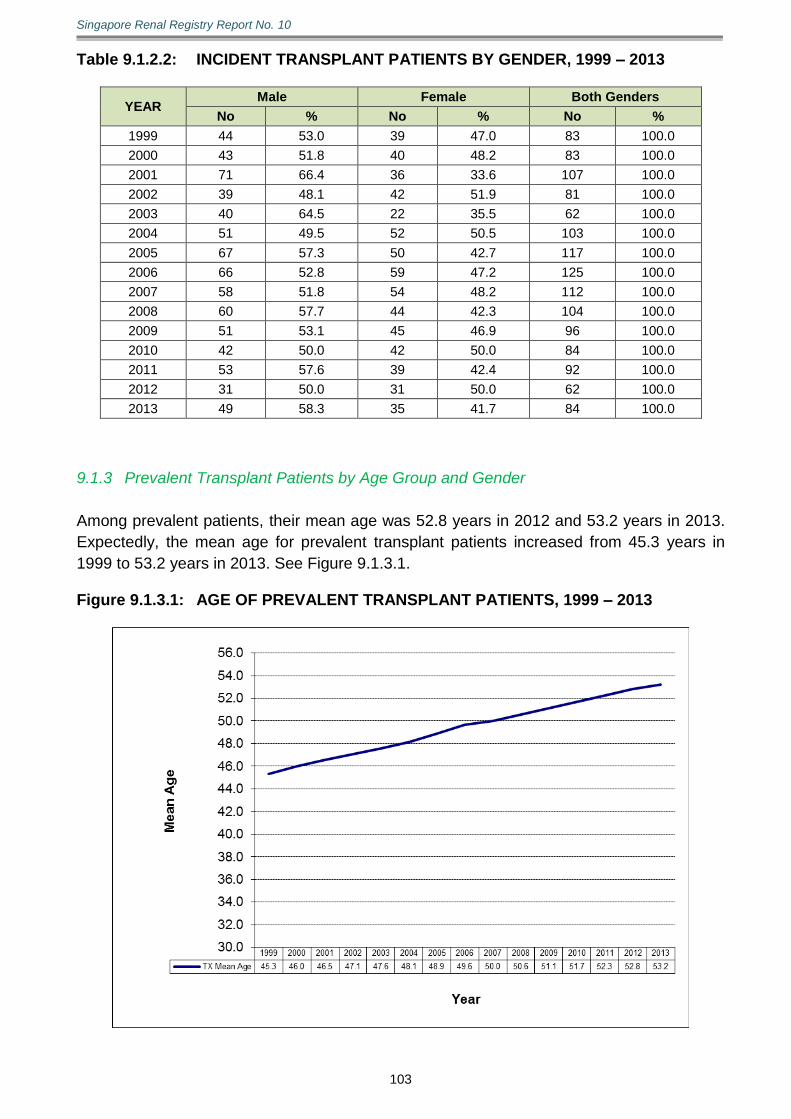
Singapore Renal Registry Report No. 10
103
Table 9.1.2.2: INCIDENT TRANSPLANT PATIENTS BY GENDER, 1999 – 2013
YEAR Male Female Both Genders
No % No % No %
1999 44 53.0 39 47.0 83 100.0
2000 43 51.8 40 48.2 83 100.0
2001 71 66.4 36 33.6 107 100.0
2002 39 48.1 42 51.9 81 100.0
2003 40 64.5 22 35.5 62 100.0
2004 51 49.5 52 50.5 103 100.0
2005 67 57.3 50 42.7 117 100.0
2006 66 52.8 59 47.2 125 100.0
2007 58 51.8 54 48.2 112 100.0
2008 60 57.7 44 42.3 104 100.0
2009 51 53.1 45 46.9 96 100.0
2010 42 50.0 42 50.0 84 100.0
2011 53 57.6 39 42.4 92 100.0
2012 31 50.0 31 50.0 62 100.0
2013 49 58.3 35 41.7 84 100.0
9.1.3 Prevalent Transplant Patients by Age Group and Gender
Among prevalent patients, their mean age was 52.8 years in 2012 and 53.2 years in 2013.
Expectedly, the mean age for prevalent transplant patients increased from 45.3 years in
1999 to 53.2 years in 2013. See Figure 9.1.3.1. Figure 9.1.3.1: AGE OF PREVALENT TRANSPLANT PATIENTS, 1999 – 2013

Singapore Renal Registry Report No. 10
104
53.1% and 52.9% of the prevalent patients were males in 2012 and 2013 respectively. The
age distribution of prevalent transplant patients is shown in Tables 9.1.3.1, where the
greatest proportion was in the age group 50-59 years.
Table 9.1.3.1: PREVALENT TRANSPLANT PATIENTS BY AGE GROUP AND GENDER
2012 AGE GROUP
Male Female Both Genders
No % No % No %
0–19 9 1.2 6 0.9 15 1.1
20–29 18 2.4 31 4.7 49 3.5
30–39 60 8.0 56 8.5 116 8.2
40–49 150 20.1 148 22.4 298 21.2
50–59 285 38.2 272 41.2 557 39.6
60–69 187 25.0 129 19.5 316 22.5
70–79 37 5.0 16 2.4 53 3.8
80 + 1 0.1 2 0.3 3 0.2
All Age Groups 747 100 660 100 1407 100
2013 AGE GROUP
Male Female Both Genders
No % No % No %
0–19 9 1.2 7 1.0 16 1.1
20–29 21 2.8 27 4.0 48 3.3
30–39 52 6.9 62 9.2 114 7.9
40–49 145 19.1 142 21.0 287 20.0
50–59 283 37.3 271 40.1 554 38.6
60–69 205 27.0 148 21.9 353 24.6
70–79 42 5.5 17 2.5 59 4.1
80 + 2 0.3 1 0.1 3 0.2
All Age Groups 759 100 675 100 1434 100
Trends in age groups are shown in Figure 9.1.3.2. Of note was the increasing age of
prevalent transplant patients.

Singapore Renal Registry Report No. 10
105
Figure 9.1.3.2: PREVALENT TRANSPLANT PATIENTS BY AGE GROUP, 1999 – 2013
9.1.4 Prevalent Transplant Patients by Ethnic Group and Gender
Among prevalent transplant patients in 2012 and 2013, the majority were Chinese.
See Table 9.1.4.1.
Table 9.1.4.1: PREVALENT TRANSPLANT PATIENTS BY ETHNIC GROUP AND
GENDER
2012 ETHNIC GROUP
Male Female Both Genders
No % No % No %
Chinese 620 83.0 539 81.7 1159 82.4
Malay 64 8.6 71 10.8 135 9.6
Indian 49 6.6 38 5.8 87 6.2
Others 14 1.9 12 1.8 26 1.8
All Ethnic Groups 747 100 660 100 1407 100
2013 ETHNIC GROUP
Male Female Both Genders
No % No % No %
Chinese 627 82.6 548 81.2 1175 81.9
Malay 70 9.2 75 11.1 145 10.1
Indian 46 6.1 40 5.9 86 6.0
Others 16 2.1 12 1.8 28 2.0
All Ethnic Groups 759 100 675 100 1434 100
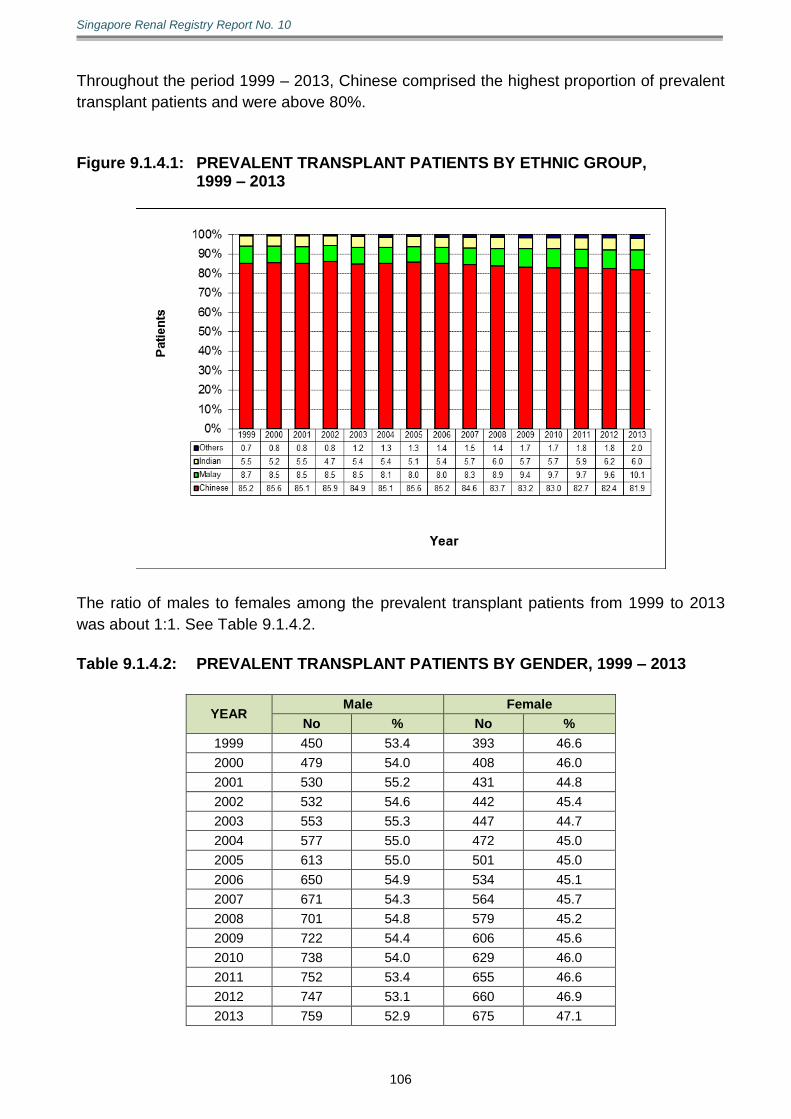
Singapore Renal Registry Report No. 10
106
Throughout the period 1999 – 2013, Chinese comprised the highest proportion of prevalent
transplant patients and were above 80%.
Figure 9.1.4.1: PREVALENT TRANSPLANT PATIENTS BY ETHNIC GROUP,
1999 – 2013
The ratio of males to females among the prevalent transplant patients from 1999 to 2013
was about 1:1. See Table 9.1.4.2.
Table 9.1.4.2: PREVALENT TRANSPLANT PATIENTS BY GENDER, 1999 – 2013
YEAR Male Female
No % No %
1999 450 53.4 393 46.6
2000 479 54.0 408 46.0
2001 530 55.2 431 44.8
2002 532 54.6 442 45.4
2003 553 55.3 447 44.7
2004 577 55.0 472 45.0
2005 613 55.0 501 45.0
2006 650 54.9 534 45.1
2007 671 54.3 564 45.7
2008 701 54.8 579 45.2
2009 722 54.4 606 45.6
2010 738 54.0 629 46.0
2011 752 53.4 655 46.6
2012 747 53.1 660 46.9
2013 759 52.9 675 47.1

Singapore Renal Registry Report No. 10
107
9.2 Aetiology of Renal Failure among Renal Transplants
Most incident renal transplant patients had GN (69.4% in 2012, 63.1% in 2013) as the
underlying aetiology of renal failure. Patients with underlying DN among incident transplants
were 14.5% in 2012 and 7.1% in 2013. The corresponding figure for hypertension
and renovascular disease as a group was 4.8% in 2012 and 10.7% in 2013. See Table
9.2.1.
Likewise, of the prevalent transplant population, the majority (70.7% in 2012, 70.5% in 2013)
had primary GN as the aetiology of renal failure while patients with DN comprised only
7.7% in 2012 and 2013. The corresponding figure for hypertension and renovascular
disease as a group was 6.0% in 2012 and 6.1% in 2013. See Table 9.2.1. This was in
sharp contrast to the dialysis population where the vast majority of patients had underlying
DN as the aetiology of renal failure. See Tables 9.2.1.1 and 9.2.2.1. Among incident
transplant patients, the proportion of DN as aetiology of renal failure increased from 4.8% in
1999 to 7.1% in 2013. Similarly, an increasing proportion of DN as aetiology of renal failure
was observed among prevalent transplant patients. See Figures 9.2.1 and 9.2.2. Table 9.2.1: AETIOLOGY OF RENAL FAILURE AMONG INCIDENT AND PREVALENT
TRANSPLANT PATIENTS
AETIOLOGY OF RENAL FAILURE
2012 2013
Incident Prevalent Incident Prevalent
No % No % No % No %
Diabetic Nephropathy 9 14.5 109 7.7 6 7.1 110 7.7
Primary Glomerulonephritis (GN) 43 69.4 995 70.7 53 63.1 1011 70.5
Autoimmune Disease/GN with Systemic Manifestations 1 1.6 61 4.3 5 6.0 64 4.5
Hypertension and Renovascular Disease 3 4.8 85 6.0 9 10.7 88 6.1
Polycystic Kidney Disease / Other Cystic Diseases 2 3.2 55 3.9 4 4.8 56 3.9
Vesicoureteric Reflex / Chronic Pyelonephritis 0 0.0 22 1.6 0 0.0 22 1.5
Obstruction 0 0.0 4 0.3 0 0.0 4 0.3
Stone Disease 0 0.0 3 0.2 0 0.0 2 0.1
Miscellaneous 3 4.8 40 2.8 4 4.8 42 2.9
Unknown 1 1.6 33 2.3 3 3.6 35 2.4
All Aetiology 62 100 1407 100 84 100 1434 100

Singapore Renal Registry Report No. 10
108
Figure 9.2.1: DIABETIC NEPHROPATHY, GLOMERULONEPHRITIS AND HYPERTENSION/RENOVASCULAR DISEASE AS AETIOLOGY OF RENAL FAILURE AMONG INCIDENT TRANSPLANT PATIENTS, 1999 – 2013
Figure 9.2.2: DIABETIC NEPHROPATHY, GLOMERULONEPHRITIS AND
HYPERTENSION/RENOVASCULAR DISEASE AS AETIOLOGY OF RENAL FAILURE AMONG PREVALENT TRANSPLANT PATIENTS, 1999 – 2013
Singapore Renal Registry Report No. 10
109
9.3 Co-morbid Conditions
DM was reported in 24.2% of newly transplanted patients in 2012 and 19.0% in 2013. See
Table 9.3.1 and Figure 9.3.1.
IHD was reported in 16.1% of patients in 2012 and 16.7% in 2013. This was 1.6% in 2012
and 4.8% in 2013for CVD. For PVD, this was 1.6% in 2012 and 0.0% in 2013.
8.1% of the patients were current smokers in 2012 and 7.1% in 2013. Former smokers
constituted 17.7% in 2012 and 21.4% in 2013.
In 2012, 3.2% of incident transplant patients were serologically positive for HBsAg while this
was 6.0% in 2013. There was no patient who was Anti-HCV positive in 2012 and there were
only 3.6% of incident transplant patients who were Anti-HCV positive. A small proportion of
patients had unknown HBsAg and Anti-HCV status.
An increase in the proportion of incident patients with co-morbidities was observed over the
period from 1999 to 2013. See Figure 9.3.1.

Singapore Renal Registry Report No. 10
110
Table 9.3.1: CO-MORBID CONDITIONS AMONG INCIDENT TRANSPLANT PATIENTS
Diabetes Mellitus 2012 2013
No % No %
Yes 15 24.2 16 19.0
No 47 75.8 68 81.0
Unknown 0 0.0 0 0.0
Total 62 100 84 100
Ischaemic Heart Disease
2012 2013
No % No %
Yes 10 16.1 14 16.7
No 52 83.9 70 83.3
Unknown 0 0.0 0 0.0
Total 62 100 84 100
Cerebrovascular Disease
2012 2013
No % No %
Yes 1 1.6 4 4.8
No 61 98.4 80 95.2
Unknown 0 0.0 0 0.0
Total 62 100 84 100
Peripheral Vascular Disease
2012 2013
No % No %
Yes 1 1.6 0 0.0
No 61 98.4 84 100.0
Unknown 0 0.0 0 0.0
Total 62 100 84 100
Smoking
2012 2013
No % No %
Current Smoker 5 8.1 6 7.1
Ex-Smoker 11 17.7 18 21.4
Non-Smoker 44 71.0 58 69.0
Unknown 2 3.2 2 2.4
Total 62 100 84 100
Hepatitis B S Ag Status
2012 2013
No % No %
Positive 2 3.2 5 6.0
Negative 55 88.7 78 92.9
Unknown 5 8.1 1 1.2
Total 62 100 84 100
Anti-HCV Status
2012 2013
No % No %
Positive 0 0.0 3 3.6
Negative 58 93.5 80 95.2
Unknown 4 6.5 1 1.2
Total 62 100 84 100
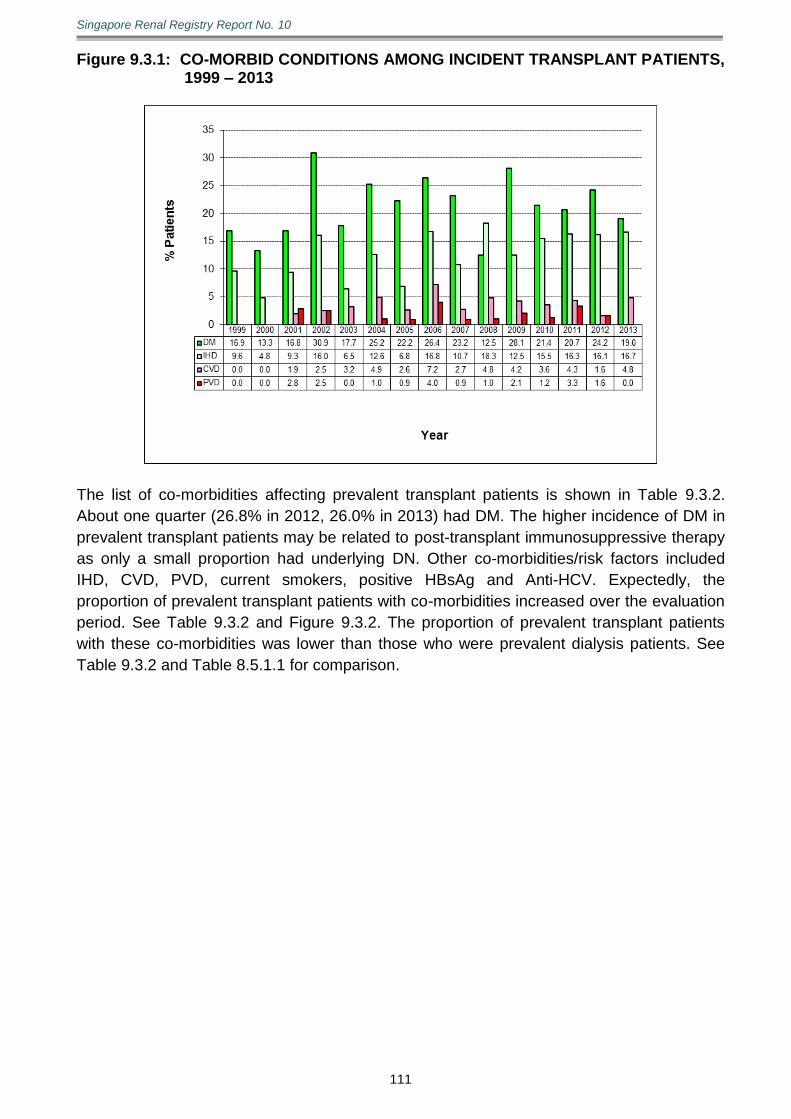
Singapore Renal Registry Report No. 10
111
Figure 9.3.1: CO-MORBID CONDITIONS AMONG INCIDENT TRANSPLANT PATIENTS, 1999 – 2013
The list of co-morbidities affecting prevalent transplant patients is shown in Table 9.3.2.
About one quarter (26.8% in 2012, 26.0% in 2013) had DM. The higher incidence of DM in
prevalent transplant patients may be related to post-transplant immunosuppressive therapy
as only a small proportion had underlying DN. Other co-morbidities/risk factors included
IHD, CVD, PVD, current smokers, positive HBsAg and Anti-HCV. Expectedly, the
proportion of prevalent transplant patients with co-morbidities increased over the evaluation
period. See Table 9.3.2 and Figure 9.3.2. The proportion of prevalent transplant patients
with these co-morbidities was lower than those who were prevalent dialysis patients. See
Table 9.3.2 and Table 8.5.1.1 for comparison.
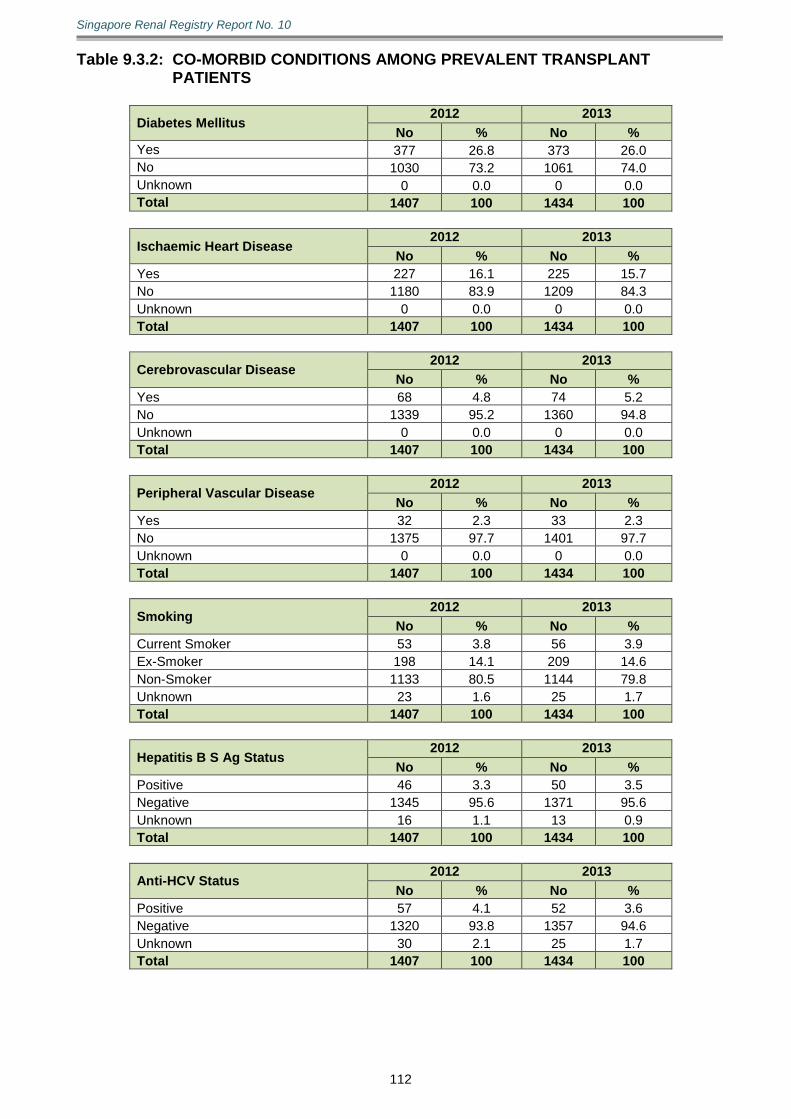
Singapore Renal Registry Report No. 10
112
Table 9.3.2: CO-MORBID CONDITIONS AMONG PREVALENT TRANSPLANT PATIENTS
Diabetes Mellitus 2012 2013
No % No %
Yes 377 26.8 373 26.0
No 1030 73.2 1061 74.0
Unknown 0 0.0 0 0.0
Total 1407 100 1434 100
Ischaemic Heart Disease
2012 2013
No % No %
Yes 227 16.1 225 15.7
No 1180 83.9 1209 84.3
Unknown 0 0.0 0 0.0
Total 1407 100 1434 100
Cerebrovascular Disease
2012 2013
No % No %
Yes 68 4.8 74 5.2
No 1339 95.2 1360 94.8
Unknown 0 0.0 0 0.0
Total 1407 100 1434 100
Peripheral Vascular Disease
2012 2013
No % No %
Yes 32 2.3 33 2.3
No 1375 97.7 1401 97.7
Unknown 0 0.0 0 0.0
Total 1407 100 1434 100
Smoking
2012 2013
No % No %
Current Smoker 53 3.8 56 3.9
Ex-Smoker 198 14.1 209 14.6
Non-Smoker 1133 80.5 1144 79.8
Unknown 23 1.6 25 1.7
Total 1407 100 1434 100
Hepatitis B S Ag Status
2012 2013
No % No %
Positive 46 3.3 50 3.5
Negative 1345 95.6 1371 95.6
Unknown 16 1.1 13 0.9
Total 1407 100 1434 100
Anti-HCV Status
2012 2013
No % No %
Positive 57 4.1 52 3.6
Negative 1320 93.8 1357 94.6
Unknown 30 2.1 25 1.7
Total 1407 100 1434 100

Singapore Renal Registry Report No. 10
113
Figure 9.3.2: CO-MORBID CONDITIONS AMONG PREVALENT TRANSPLANT PATIENTS, 1999 – 2013
9.4 Location where Transplant was Performed
9.4.1 Incident Transplant Patients
Among incident patients, the majority was performed locally, primarily at the Singapore
General Hospital (37.1% in 2012, 45.2% in 2013). However, about 18% of the transplants
were performed at overseas centres in 2012 and 2013. See Figure 9.4.1.1.
Figure 9.4.1.1: INCIDENT TRANSPLANTS BY TRANSPLANT HOSPITAL
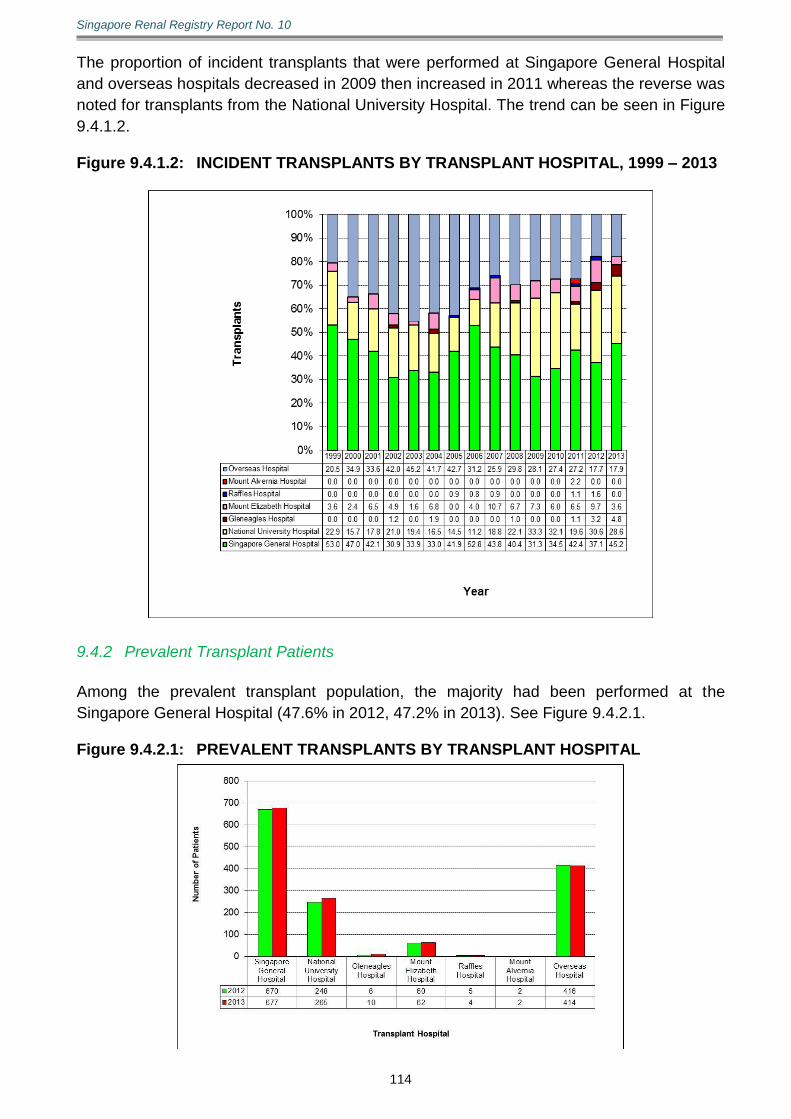
Singapore Renal Registry Report No. 10
114
The proportion of incident transplants that were performed at Singapore General Hospital
and overseas hospitals decreased in 2009 then increased in 2011 whereas the reverse was
noted for transplants from the National University Hospital. The trend can be seen in Figure
9.4.1.2. Figure 9.4.1.2: INCIDENT TRANSPLANTS BY TRANSPLANT HOSPITAL, 1999 – 2013
9.4.2 Prevalent Transplant Patients
Among the prevalent transplant population, the majority had been performed at the
Singapore General Hospital (47.6% in 2012, 47.2% in 2013). See Figure 9.4.2.1. Figure 9.4.2.1: PREVALENT TRANSPLANTS BY TRANSPLANT HOSPITAL

Singapore Renal Registry Report No. 10
115
For the period 1999 to 2013, the majority of transplants had been performed at the
Singapore General Hospital among the prevalent transplant patients. See Figure 9.4.2.2.
Figure 9.4.2.2: PREVALENT TRANSPLANTS BY TRANSPLANT HOSPITAL,
1999 – 2013
9.5 Donor Type and Source
Among incident patients transplanted locally, 28 (45.2%) in 2012 had received
deceased-donor renal transplants. At the end of year 2012, 907 of 1,407 prevalent patients
(64.4%) had received deceased-donor transplants. See Tables 9.5.1 and 9.5.3.
Among incident patients transplanted locally, 38 (45.2%) in 2013 had received
deceased-donor renal transplants. At the end of year 2013, 900 of 1,434 prevalent patients
(62.8%) had received deceased-donor transplants. See Tables 9.5.1 and 9.5.3.
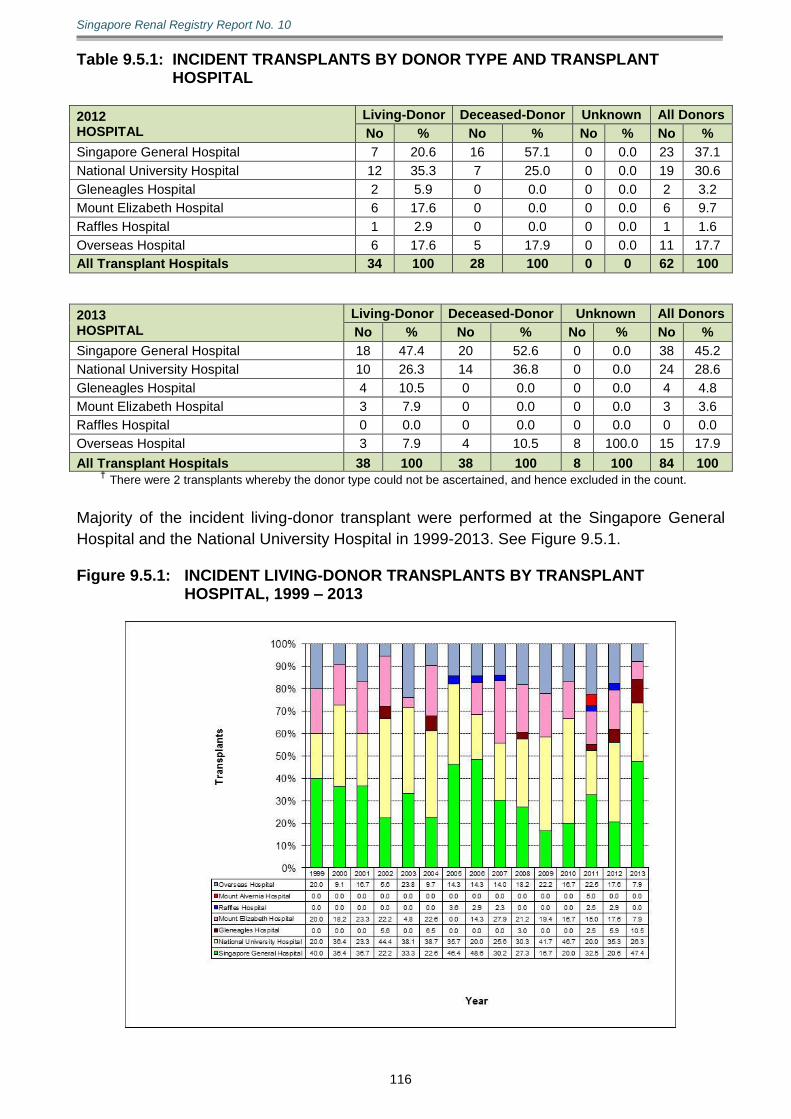
Singapore Renal Registry Report No. 10
116
Table 9.5.1: INCIDENT TRANSPLANTS BY DONOR TYPE AND TRANSPLANT HOSPITAL
2012 HOSPITAL
Living-Donor Deceased-Donor Unknown All Donors
No % No % No % No %
Singapore General Hospital 7 20.6 16 57.1 0 0.0 23 37.1
National University Hospital 12 35.3 7 25.0 0 0.0 19 30.6
Gleneagles Hospital 2 5.9 0 0.0 0 0.0 2 3.2
Mount Elizabeth Hospital 6 17.6 0 0.0 0 0.0 6 9.7
Raffles Hospital 1 2.9 0 0.0 0 0.0 1 1.6
Overseas Hospital 6 17.6 5 17.9 0 0.0 11 17.7
All Transplant Hospitals 34 100 28 100 0 0 62 100
2013 HOSPITAL
Living-Donor Deceased-Donor Unknown All Donors
No % No % No % No %
Singapore General Hospital 18 47.4 20 52.6 0 0.0 38 45.2
National University Hospital 10 26.3 14 36.8 0 0.0 24 28.6
Gleneagles Hospital 4 10.5 0 0.0 0 0.0 4 4.8
Mount Elizabeth Hospital 3 7.9 0 0.0 0 0.0 3 3.6
Raffles Hospital 0 0.0 0 0.0 0 0.0 0 0.0
Overseas Hospital 3 7.9 4 10.5 8 100.0 15 17.9
All Transplant Hospitals 38 100 38 100 8 100 84 100 † There were 2 transplants whereby the donor type could not be ascertained, and hence excluded in the count.
Majority of the incident living-donor transplant were performed at the Singapore General
Hospital and the National University Hospital in 1999-2013. See Figure 9.5.1. Figure 9.5.1: INCIDENT LIVING-DONOR TRANSPLANTS BY TRANSPLANT
HOSPITAL, 1999 – 2013
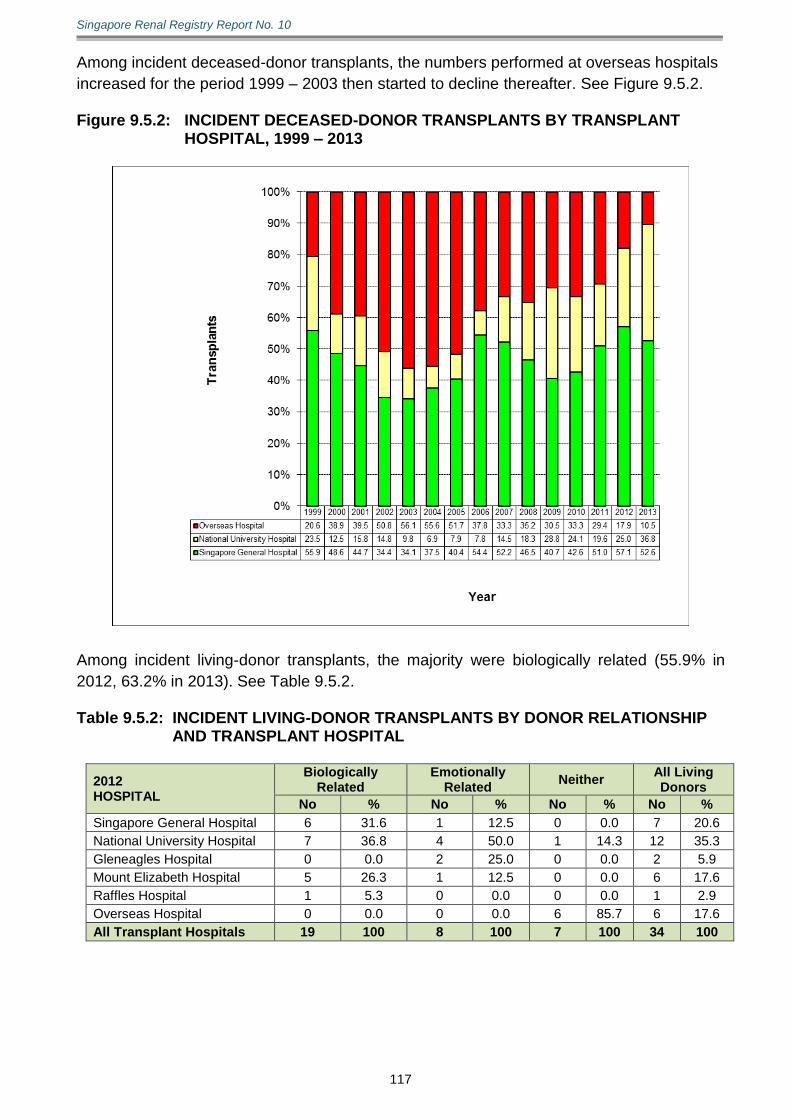
Singapore Renal Registry Report No. 10
117
Among incident deceased-donor transplants, the numbers performed at overseas hospitals
increased for the period 1999 – 2003 then started to decline thereafter. See Figure 9.5.2. Figure 9.5.2: INCIDENT DECEASED-DONOR TRANSPLANTS BY TRANSPLANT
HOSPITAL, 1999 – 2013
Among incident living-donor transplants, the majority were biologically related (55.9% in
2012, 63.2% in 2013). See Table 9.5.2. Table 9.5.2: INCIDENT LIVING-DONOR TRANSPLANTS BY DONOR RELATIONSHIP
AND TRANSPLANT HOSPITAL
2012 HOSPITAL
Biologically Related
Emotionally Related
Neither All Living Donors
No % No % No % No %
Singapore General Hospital 6 31.6 1 12.5 0 0.0 7 20.6
National University Hospital 7 36.8 4 50.0 1 14.3 12 35.3
Gleneagles Hospital 0 0.0 2 25.0 0 0.0 2 5.9
Mount Elizabeth Hospital 5 26.3 1 12.5 0 0.0 6 17.6
Raffles Hospital 1 5.3 0 0.0 0 0.0 1 2.9
Overseas Hospital 0 0.0 0 0.0 6 85.7 6 17.6
All Transplant Hospitals 19 100 8 100 7 100 34 100
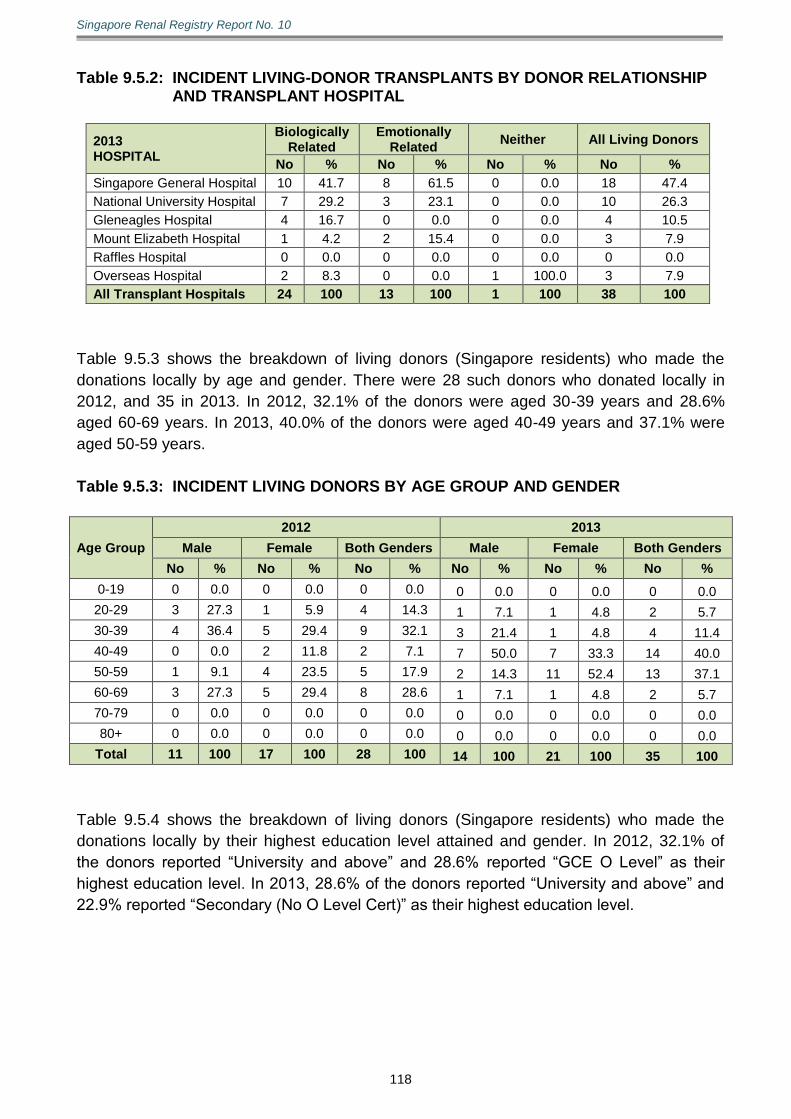
Singapore Renal Registry Report No. 10
118
Table 9.5.2: INCIDENT LIVING-DONOR TRANSPLANTS BY DONOR RELATIONSHIP AND TRANSPLANT HOSPITAL
2013 HOSPITAL
Biologically Related
Emotionally Related
Neither All Living Donors
No % No % No % No %
Singapore General Hospital 10 41.7 8 61.5 0 0.0 18 47.4
National University Hospital 7 29.2 3 23.1 0 0.0 10 26.3
Gleneagles Hospital 4 16.7 0 0.0 0 0.0 4 10.5
Mount Elizabeth Hospital 1 4.2 2 15.4 0 0.0 3 7.9
Raffles Hospital 0 0.0 0 0.0 0 0.0 0 0.0
Overseas Hospital 2 8.3 0 0.0 1 100.0 3 7.9
All Transplant Hospitals 24 100 13 100 1 100 38 100
Table 9.5.3 shows the breakdown of living donors (Singapore residents) who made the
donations locally by age and gender. There were 28 such donors who donated locally in
2012, and 35 in 2013. In 2012, 32.1% of the donors were aged 30-39 years and 28.6%
aged 60-69 years. In 2013, 40.0% of the donors were aged 40-49 years and 37.1% were
aged 50-59 years.
Table 9.5.3: INCIDENT LIVING DONORS BY AGE GROUP AND GENDER
Age Group
2012 2013
Male Female Both Genders Male Female Both Genders
No % No % No % No % No % No %
0-19 0 0.0 0 0.0 0 0.0 0 0.0 0 0.0 0 0.0
20-29 3 27.3 1 5.9 4 14.3 1 7.1 1 4.8 2 5.7
30-39 4 36.4 5 29.4 9 32.1 3 21.4 1 4.8 4 11.4
40-49 0 0.0 2 11.8 2 7.1 7 50.0 7 33.3 14 40.0
50-59 1 9.1 4 23.5 5 17.9 2 14.3 11 52.4 13 37.1
60-69 3 27.3 5 29.4 8 28.6 1 7.1 1 4.8 2 5.7
70-79 0 0.0 0 0.0 0 0.0 0 0.0 0 0.0 0 0.0
80+ 0 0.0 0 0.0 0 0.0 0 0.0 0 0.0 0 0.0
Total 11 100 17 100 28 100 14 100 21 100 35 100
Table 9.5.4 shows the breakdown of living donors (Singapore residents) who made the
donations locally by their highest education level attained and gender. In 2012, 32.1% of
the donors reported “University and above” and 28.6% reported “GCE O Level” as their
highest education level. In 2013, 28.6% of the donors reported “University and above” and
22.9% reported “Secondary (No O Level Cert)” as their highest education level.
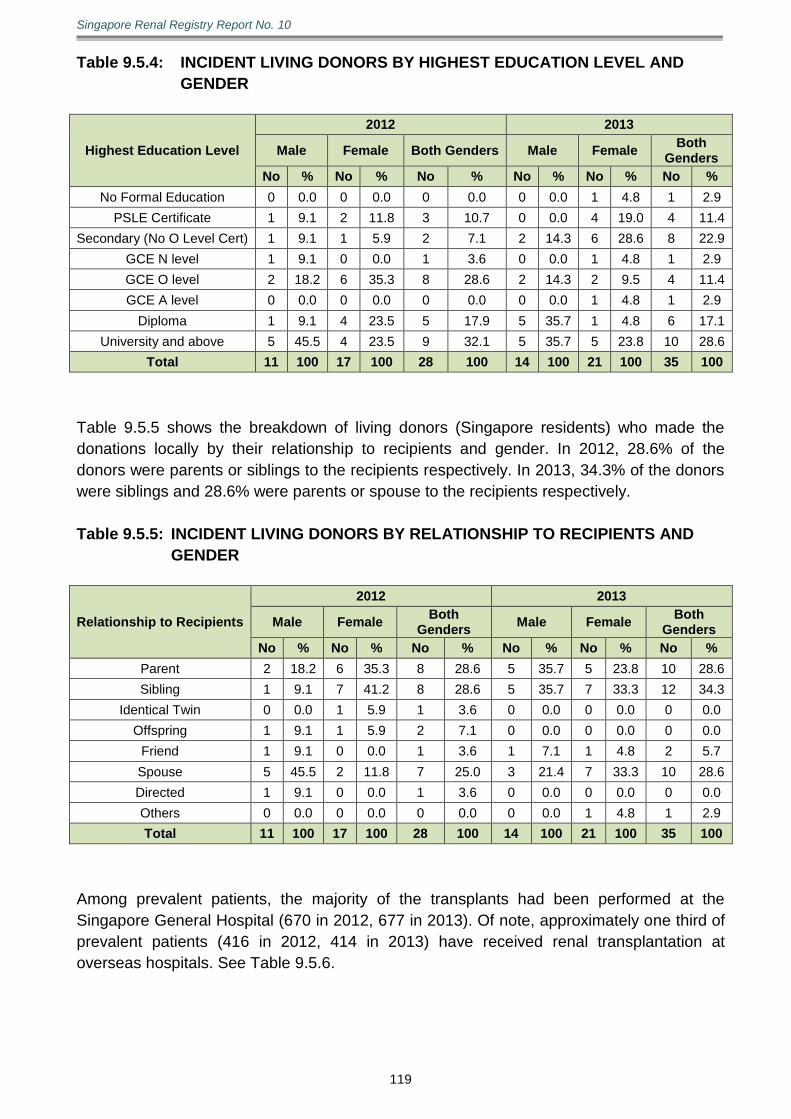
Singapore Renal Registry Report No. 10
119
Table 9.5.4: INCIDENT LIVING DONORS BY HIGHEST EDUCATION LEVEL AND
GENDER
Highest Education Level
2012 2013
Male Female Both Genders Male Female Both
Genders
No % No % No % No % No % No %
No Formal Education 0 0.0 0 0.0 0 0.0 0 0.0 1 4.8 1 2.9
PSLE Certificate 1 9.1 2 11.8 3 10.7 0 0.0 4 19.0 4 11.4
Secondary (No O Level Cert) 1 9.1 1 5.9 2 7.1 2 14.3 6 28.6 8 22.9
GCE N level 1 9.1 0 0.0 1 3.6 0 0.0 1 4.8 1 2.9
GCE O level 2 18.2 6 35.3 8 28.6 2 14.3 2 9.5 4 11.4
GCE A level 0 0.0 0 0.0 0 0.0 0 0.0 1 4.8 1 2.9
Diploma 1 9.1 4 23.5 5 17.9 5 35.7 1 4.8 6 17.1
University and above 5 45.5 4 23.5 9 32.1 5 35.7 5 23.8 10 28.6
Total 11 100 17 100 28 100 14 100 21 100 35 100
Table 9.5.5 shows the breakdown of living donors (Singapore residents) who made the
donations locally by their relationship to recipients and gender. In 2012, 28.6% of the
donors were parents or siblings to the recipients respectively. In 2013, 34.3% of the donors
were siblings and 28.6% were parents or spouse to the recipients respectively.
Table 9.5.5: INCIDENT LIVING DONORS BY RELATIONSHIP TO RECIPIENTS AND
GENDER
Relationship to Recipients
2012 2013
Male Female Both
Genders Male Female
Both Genders
No % No % No % No % No % No %
Parent 2 18.2 6 35.3 8 28.6 5 35.7 5 23.8 10 28.6
Sibling 1 9.1 7 41.2 8 28.6 5 35.7 7 33.3 12 34.3
Identical Twin 0 0.0 1 5.9 1 3.6 0 0.0 0 0.0 0 0.0
Offspring 1 9.1 1 5.9 2 7.1 0 0.0 0 0.0 0 0.0
Friend 1 9.1 0 0.0 1 3.6 1 7.1 1 4.8 2 5.7
Spouse 5 45.5 2 11.8 7 25.0 3 21.4 7 33.3 10 28.6
Directed 1 9.1 0 0.0 1 3.6 0 0.0 0 0.0 0 0.0
Others 0 0.0 0 0.0 0 0.0 0 0.0 1 4.8 1 2.9
Total 11 100 17 100 28 100 14 100 21 100 35 100
Among prevalent patients, the majority of the transplants had been performed at the
Singapore General Hospital (670 in 2012, 677 in 2013). Of note, approximately one third of
prevalent patients (416 in 2012, 414 in 2013) have received renal transplantation at
overseas hospitals. See Table 9.5.6.

Singapore Renal Registry Report No. 10
120
Table 9.5.6: PREVALENT TRANSPLANTS BY DONOR TYPE AND TRANSPLANT
HOSPITAL
2012 Living-Donor Deceased-Donor Unknown All Donors
No % No % No % No %
Singapore General Hospital 205 41.5 465 51.3 0 0.0 670 47.6
National University Hospital 124 25.1 124 13.7 0 0.0 248 17.6
Gleneagles Hospital 6 1.2 0 0.0 0 0.0 6 0.4
Mount Elizabeth Hospital 60 12.1 0 0.0 0 0.0 60 4.3
Raffles Hospital 5 1.0 0 0.0 0 0.0 5 0.4
Mount Alvernia Hospital 2 0.4 0 0.0 0 0.0 2 0.1
Overseas Hospital 92 18.6 318 35.1 6 100.0 416 29.6
All Transplant Hospitals 494 100 907 100 6 100 1407 100
2013 Living-Donor Deceased-Donor Unknown All Donors
No % No % No % No %
Singapore General Hospital 220 42.2 457 50.8 0 0.0 677 47.2
National University Hospital 131 25.1 134 14.9 0 0.0 265 18.5
Gleneagles Hospital 10 1.9 0 0.0 0 0.0 10 0.7
Mount Elizabeth Hospital 62 11.9 0 0.0 0 0.0 62 4.3
Raffles Hospital 4 0.8 0 0.0 0 0.0 4 0.3
Mount Alvernia Hospital 2 0.4 0 0.0 0 0.0 2 0.1
Overseas Hospital 92 17.7 309 34.3 13 100.0 414 28.9
All Transplant Hospitals 521 100 900 100 13 100 1434 100
Majority of the living and deceased-donor prevalent transplants had undergone
transplantation at the Singapore General Hospital for the period 1999 to 2013. Of the
prevalent living-donor transplants, 17.7% of them sought transplants overseas in 2013.
Although there was no significant trend in the numbers of incident living-donor transplants
from overseas hospitals (See Figure 9.5.1), there was a definite decreasing trend of
prevalent living-donor transplants from overseas hospitals in the evaluation period
suggesting reduced survival in the latter. See Figure 9.5.3. In contrast, an increasingly
larger proportion of prevalent decreased-donor transplants were from overseas hospitals.
See Figure 9.5.4.
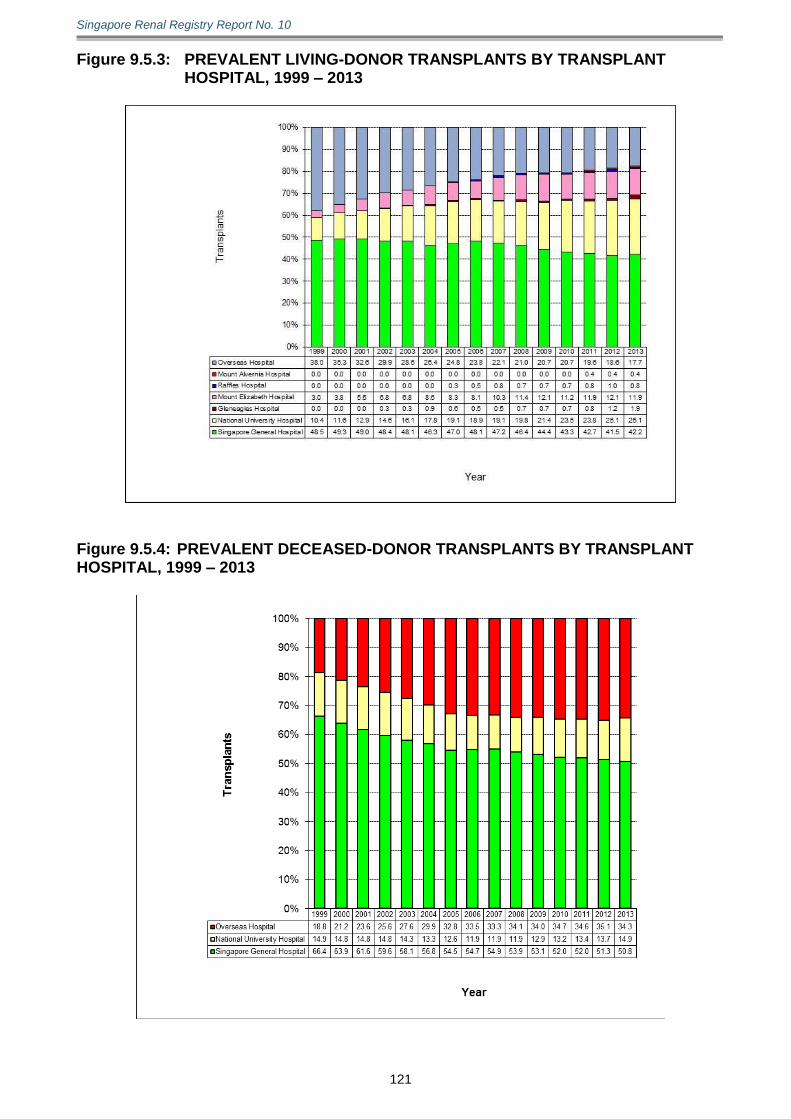
Singapore Renal Registry Report No. 10
121
Figure 9.5.3: PREVALENT LIVING-DONOR TRANSPLANTS BY TRANSPLANT HOSPITAL, 1999 – 2013
Figure 9.5.4: PREVALENT DECEASED-DONOR TRANSPLANTS BY TRANSPLANT HOSPITAL, 1999 – 2013
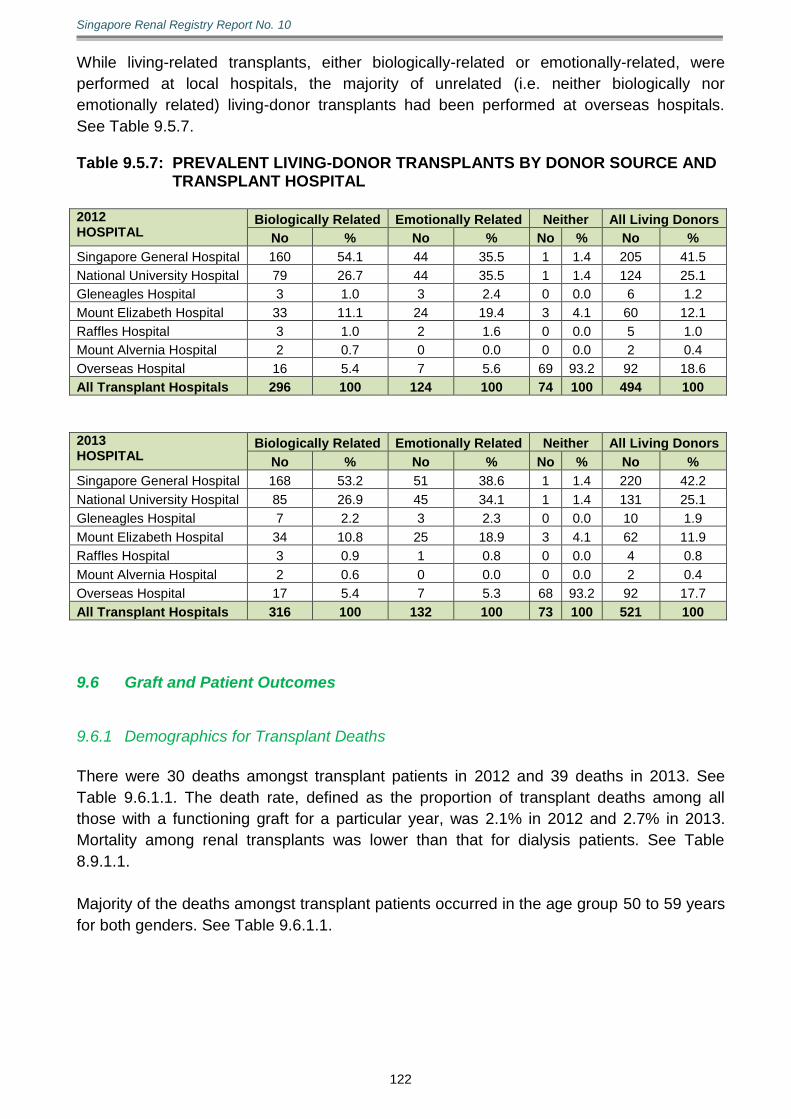
Singapore Renal Registry Report No. 10
122
While living-related transplants, either biologically-related or emotionally-related, were
performed at local hospitals, the majority of unrelated (i.e. neither biologically nor
emotionally related) living-donor transplants had been performed at overseas hospitals.
See Table 9.5.7. Table 9.5.7: PREVALENT LIVING-DONOR TRANSPLANTS BY DONOR SOURCE AND
TRANSPLANT HOSPITAL 2012 HOSPITAL
Biologically Related Emotionally Related Neither All Living Donors
No % No % No % No %
Singapore General Hospital 160 54.1 44 35.5 1 1.4 205 41.5
National University Hospital 79 26.7 44 35.5 1 1.4 124 25.1
Gleneagles Hospital 3 1.0 3 2.4 0 0.0 6 1.2
Mount Elizabeth Hospital 33 11.1 24 19.4 3 4.1 60 12.1
Raffles Hospital 3 1.0 2 1.6 0 0.0 5 1.0
Mount Alvernia Hospital 2 0.7 0 0.0 0 0.0 2 0.4
Overseas Hospital 16 5.4 7 5.6 69 93.2 92 18.6
All Transplant Hospitals 296 100 124 100 74 100 494 100
2013 HOSPITAL
Biologically Related Emotionally Related Neither All Living Donors
No % No % No % No %
Singapore General Hospital 168 53.2 51 38.6 1 1.4 220 42.2
National University Hospital 85 26.9 45 34.1 1 1.4 131 25.1
Gleneagles Hospital 7 2.2 3 2.3 0 0.0 10 1.9
Mount Elizabeth Hospital 34 10.8 25 18.9 3 4.1 62 11.9
Raffles Hospital 3 0.9 1 0.8 0 0.0 4 0.8
Mount Alvernia Hospital 2 0.6 0 0.0 0 0.0 2 0.4
Overseas Hospital 17 5.4 7 5.3 68 93.2 92 17.7
All Transplant Hospitals 316 100 132 100 73 100 521 100
9.6 Graft and Patient Outcomes
9.6.1 Demographics for Transplant Deaths
There were 30 deaths amongst transplant patients in 2012 and 39 deaths in 2013. See
Table 9.6.1.1. The death rate, defined as the proportion of transplant deaths among all
those with a functioning graft for a particular year, was 2.1% in 2012 and 2.7% in 2013.
Mortality among renal transplants was lower than that for dialysis patients. See Table
8.9.1.1.
Majority of the deaths amongst transplant patients occurred in the age group 50 to 59 years
for both genders. See Table 9.6.1.1.
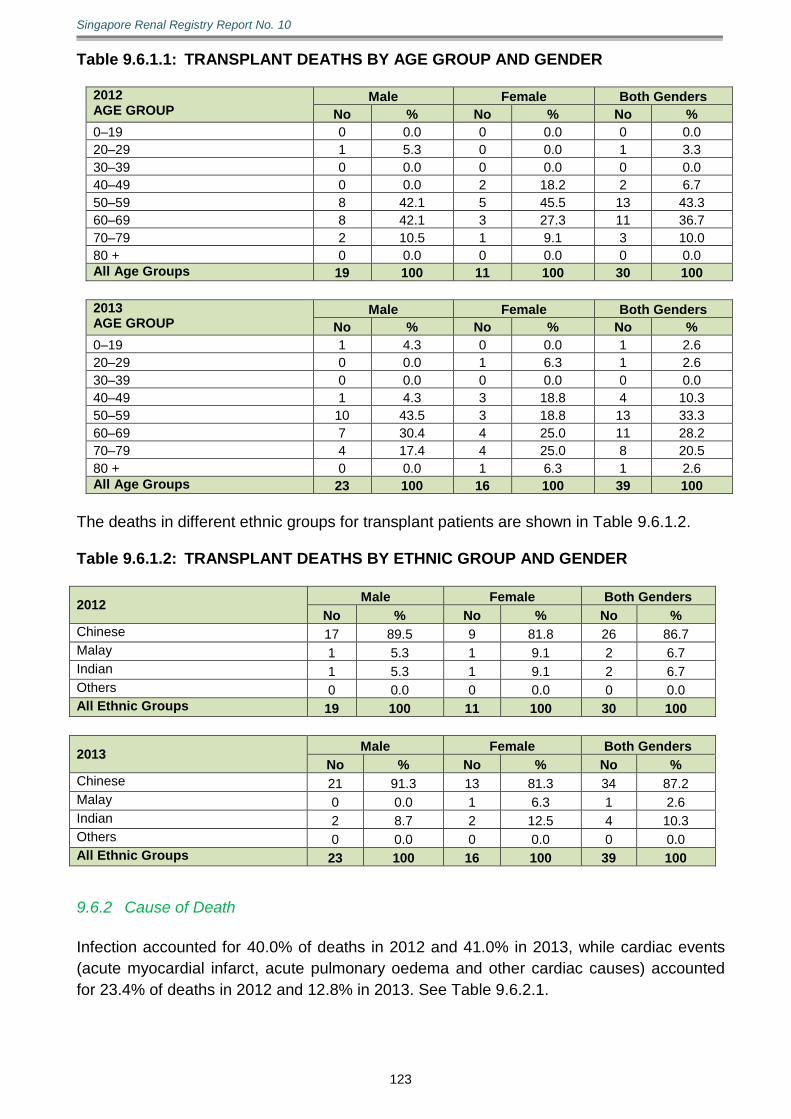
Singapore Renal Registry Report No. 10
123
Table 9.6.1.1: TRANSPLANT DEATHS BY AGE GROUP AND GENDER
2012 AGE GROUP
Male Female Both Genders
No % No % No %
0–19 0 0.0 0 0.0 0 0.0
20–29 1 5.3 0 0.0 1 3.3
30–39 0 0.0 0 0.0 0 0.0
40–49 0 0.0 2 18.2 2 6.7
50–59 8 42.1 5 45.5 13 43.3
60–69 8 42.1 3 27.3 11 36.7
70–79 2 10.5 1 9.1 3 10.0
80 + 0 0.0 0 0.0 0 0.0
All Age Groups 19 100 11 100 30 100
2013 AGE GROUP
Male Female Both Genders
No % No % No %
0–19 1 4.3 0 0.0 1 2.6
20–29 0 0.0 1 6.3 1 2.6
30–39 0 0.0 0 0.0 0 0.0
40–49 1 4.3 3 18.8 4 10.3
50–59 10 43.5 3 18.8 13 33.3
60–69 7 30.4 4 25.0 11 28.2
70–79 4 17.4 4 25.0 8 20.5
80 + 0 0.0 1 6.3 1 2.6
All Age Groups 23 100 16 100 39 100
The deaths in different ethnic groups for transplant patients are shown in Table 9.6.1.2. Table 9.6.1.2: TRANSPLANT DEATHS BY ETHNIC GROUP AND GENDER
2012 Male Female Both Genders
No % No % No %
Chinese 17 89.5 9 81.8 26 86.7
Malay 1 5.3 1 9.1 2 6.7
Indian 1 5.3 1 9.1 2 6.7
Others 0 0.0 0 0.0 0 0.0
All Ethnic Groups 19 100 11 100 30 100
2013 Male Female Both Genders
No % No % No %
Chinese 21 91.3 13 81.3 34 87.2
Malay 0 0.0 1 6.3 1 2.6
Indian 2 8.7 2 12.5 4 10.3
Others 0 0.0 0 0.0 0 0.0
All Ethnic Groups 23 100 16 100 39 100
9.6.2 Cause of Death
Infection accounted for 40.0% of deaths in 2012 and 41.0% in 2013, while cardiac events
(acute myocardial infarct, acute pulmonary oedema and other cardiac causes) accounted
for 23.4% of deaths in 2012 and 12.8% in 2013. See Table 9.6.2.1.
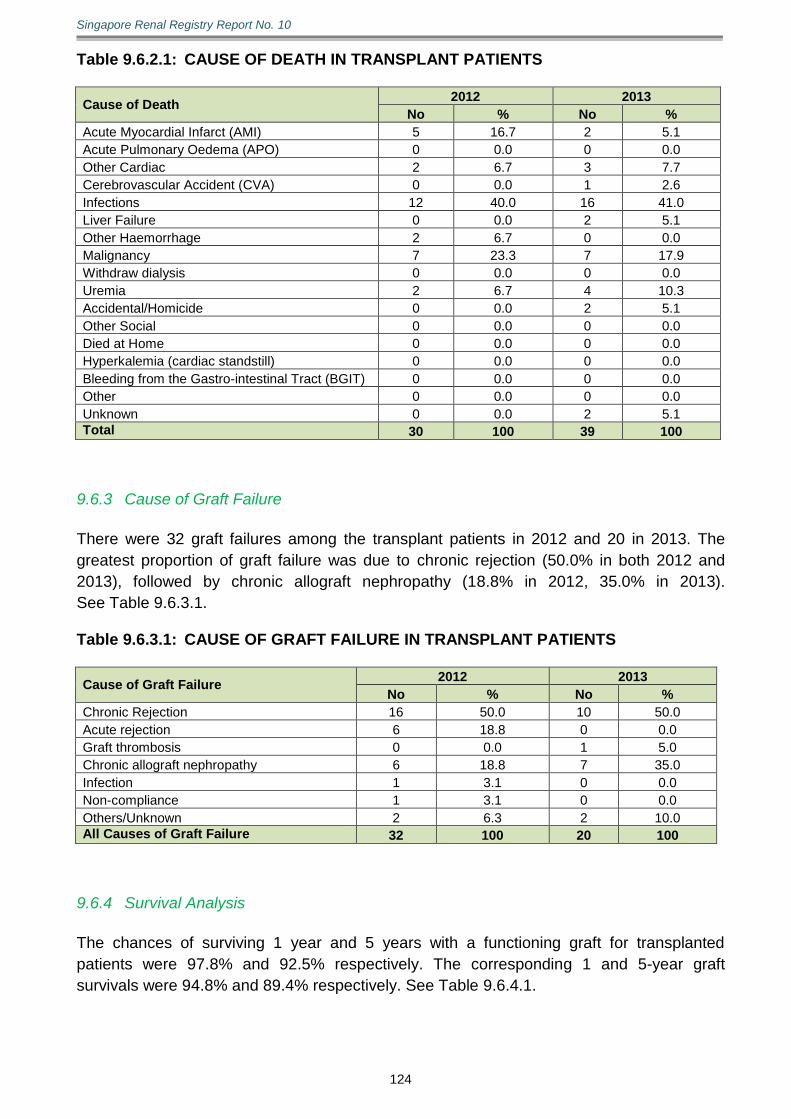
Singapore Renal Registry Report No. 10
124
Table 9.6.2.1: CAUSE OF DEATH IN TRANSPLANT PATIENTS
Cause of Death 2012 2013
No % No %
Acute Myocardial Infarct (AMI) 5 16.7 2 5.1
Acute Pulmonary Oedema (APO) 0 0.0 0 0.0
Other Cardiac 2 6.7 3 7.7
Cerebrovascular Accident (CVA) 0 0.0 1 2.6
Infections 12 40.0 16 41.0
Liver Failure 0 0.0 2 5.1
Other Haemorrhage 2 6.7 0 0.0
Malignancy 7 23.3 7 17.9
Withdraw dialysis 0 0.0 0 0.0
Uremia 2 6.7 4 10.3
Accidental/Homicide 0 0.0 2 5.1
Other Social 0 0.0 0 0.0
Died at Home 0 0.0 0 0.0
Hyperkalemia (cardiac standstill) 0 0.0 0 0.0
Bleeding from the Gastro-intestinal Tract (BGIT) 0 0.0 0 0.0
Other 0 0.0 0 0.0
Unknown 0 0.0 2 5.1
Total 30 100 39 100
9.6.3 Cause of Graft Failure
There were 32 graft failures among the transplant patients in 2012 and 20 in 2013. The
greatest proportion of graft failure was due to chronic rejection (50.0% in both 2012 and
2013), followed by chronic allograft nephropathy (18.8% in 2012, 35.0% in 2013).
See Table 9.6.3.1. Table 9.6.3.1: CAUSE OF GRAFT FAILURE IN TRANSPLANT PATIENTS
Cause of Graft Failure 2012 2013
No % No %
Chronic Rejection 16 50.0 10 50.0
Acute rejection 6 18.8 0 0.0
Graft thrombosis 0 0.0 1 5.0
Chronic allograft nephropathy 6 18.8 7 35.0
Infection 1 3.1 0 0.0
Non-compliance 1 3.1 0 0.0
Others/Unknown 2 6.3 2 10.0
All Causes of Graft Failure 32 100 20 100
9.6.4 Survival Analysis
The chances of surviving 1 year and 5 years with a functioning graft for transplanted
patients were 97.8% and 92.5% respectively. The corresponding 1 and 5-year graft
survivals were 94.8% and 89.4% respectively. See Table 9.6.4.1.
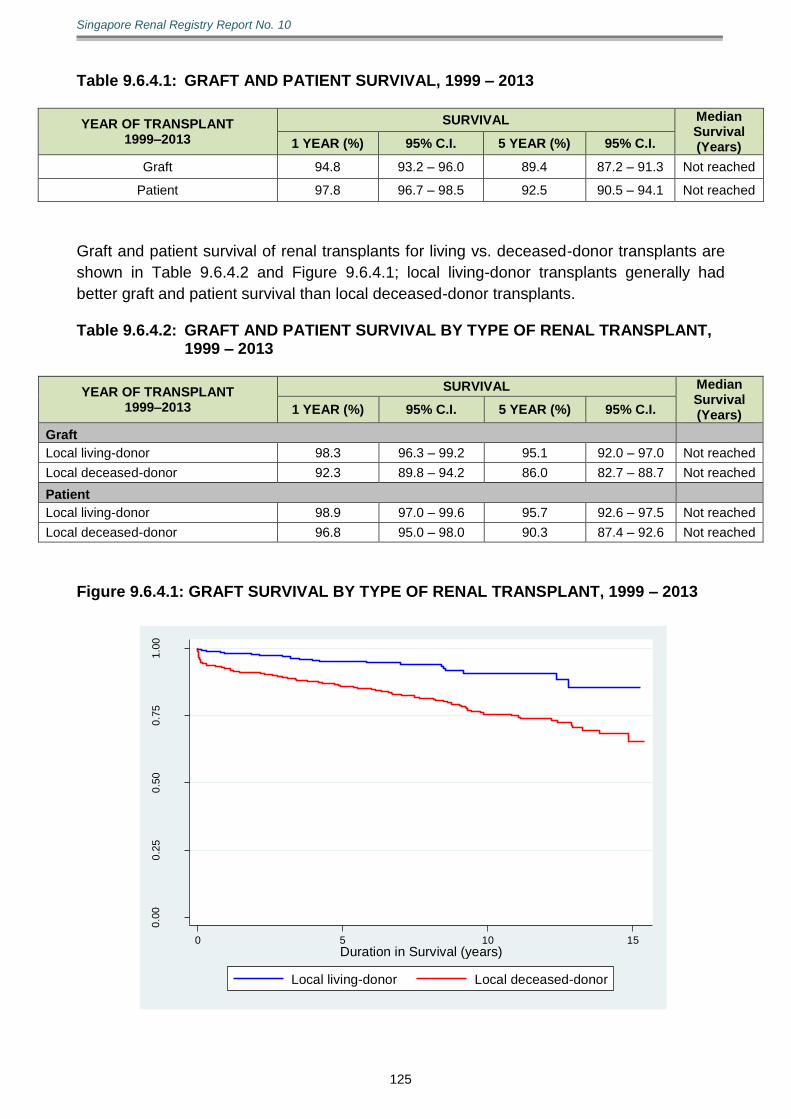
Singapore Renal Registry Report No. 10
125
Table 9.6.4.1: GRAFT AND PATIENT SURVIVAL, 1999 – 2013
YEAR OF TRANSPLANT 1999–2013
SURVIVAL Median Survival (Years) 1 YEAR (%) 95% C.I. 5 YEAR (%) 95% C.I.
Graft 94.8 93.2 – 96.0 89.4 87.2 – 91.3 Not reached
Patient 97.8 96.7 – 98.5 92.5 90.5 – 94.1 Not reached
Graft and patient survival of renal transplants for living vs. deceased-donor transplants are
shown in Table 9.6.4.2 and Figure 9.6.4.1; local living-donor transplants generally had
better graft and patient survival than local deceased-donor transplants. Table 9.6.4.2: GRAFT AND PATIENT SURVIVAL BY TYPE OF RENAL TRANSPLANT,
1999 – 2013
YEAR OF TRANSPLANT 1999–2013
SURVIVAL Median Survival (Years) 1 YEAR (%) 95% C.I. 5 YEAR (%) 95% C.I.
Graft
Local living-donor 98.3 96.3 – 99.2 95.1 92.0 – 97.0 Not reached
Local deceased-donor 92.3 89.8 – 94.2 86.0 82.7 – 88.7 Not reached
Patient
Local living-donor 98.9 97.0 – 99.6 95.7 92.6 – 97.5 Not reached
Local deceased-donor 96.8 95.0 – 98.0 90.3 87.4 – 92.6 Not reached
Figure 9.6.4.1: GRAFT SURVIVAL BY TYPE OF RENAL TRANSPLANT, 1999 – 2013
0.0
00
.25
0.5
00
.75
1.0
0
Cum
ula
tive S
urv
ival
0 5 10 15
Duration in Survival (years)
Local living-donor Local deceased-donor
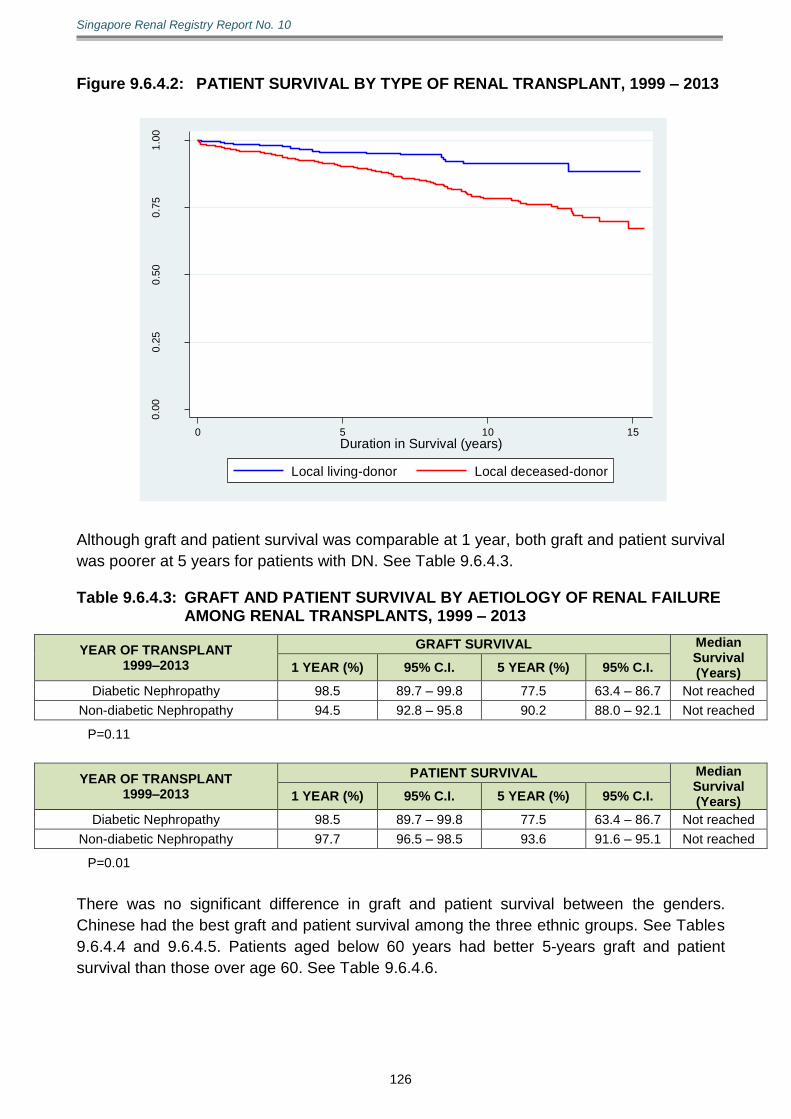
Singapore Renal Registry Report No. 10
126
Figure 9.6.4.2: PATIENT SURVIVAL BY TYPE OF RENAL TRANSPLANT, 1999 – 2013
0.0
00
.25
0.5
00
.75
1.0
0
Cum
ula
tive S
urv
ival
0 5 10 15
Duration in Survival (years)
Local living-donor Local deceased-donor
Although graft and patient survival was comparable at 1 year, both graft and patient survival
was poorer at 5 years for patients with DN. See Table 9.6.4.3. Table 9.6.4.3: GRAFT AND PATIENT SURVIVAL BY AETIOLOGY OF RENAL FAILURE
AMONG RENAL TRANSPLANTS, 1999 – 2013
YEAR OF TRANSPLANT 1999–2013
GRAFT SURVIVAL Median Survival (Years) 1 YEAR (%) 95% C.I. 5 YEAR (%) 95% C.I.
Diabetic Nephropathy 98.5 89.7 – 99.8 77.5 63.4 – 86.7 Not reached
Non-diabetic Nephropathy 94.5 92.8 – 95.8 90.2 88.0 – 92.1 Not reached
P=0.11
YEAR OF TRANSPLANT 1999–2013
PATIENT SURVIVAL Median Survival (Years) 1 YEAR (%) 95% C.I. 5 YEAR (%) 95% C.I.
Diabetic Nephropathy 98.5 89.7 – 99.8 77.5 63.4 – 86.7 Not reached
Non-diabetic Nephropathy 97.7 96.5 – 98.5 93.6 91.6 – 95.1 Not reached
P=0.01
There was no significant difference in graft and patient survival between the genders.
Chinese had the best graft and patient survival among the three ethnic groups. See Tables
9.6.4.4 and 9.6.4.5. Patients aged below 60 years had better 5-years graft and patient
survival than those over age 60. See Table 9.6.4.6.
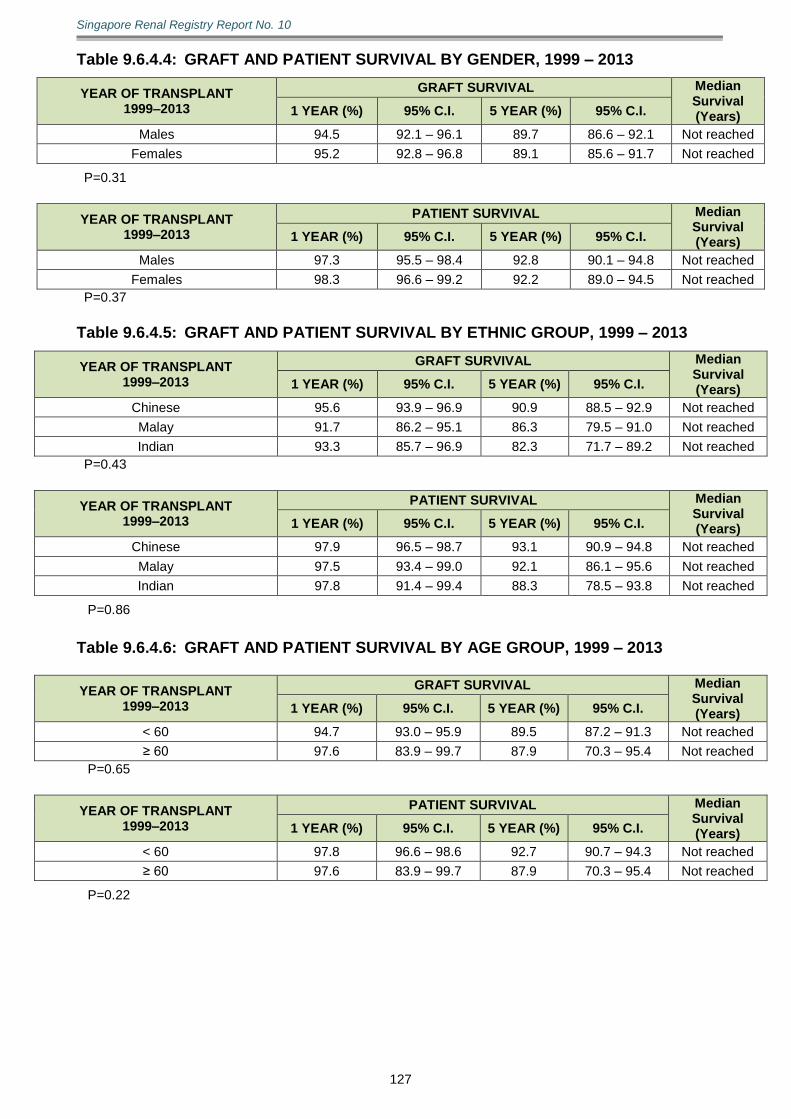
Singapore Renal Registry Report No. 10
127
Table 9.6.4.4: GRAFT AND PATIENT SURVIVAL BY GENDER, 1999 – 2013
YEAR OF TRANSPLANT 1999–2013
GRAFT SURVIVAL Median Survival (Years) 1 YEAR (%) 95% C.I. 5 YEAR (%) 95% C.I.
Males 94.5 92.1 – 96.1 89.7 86.6 – 92.1 Not reached
Females 95.2 92.8 – 96.8 89.1 85.6 – 91.7 Not reached
P=0.31
YEAR OF TRANSPLANT 1999–2013
PATIENT SURVIVAL Median Survival (Years) 1 YEAR (%) 95% C.I. 5 YEAR (%) 95% C.I.
Males 97.3 95.5 – 98.4 92.8 90.1 – 94.8 Not reached
Females 98.3 96.6 – 99.2 92.2 89.0 – 94.5 Not reached
P=0.37
Table 9.6.4.5: GRAFT AND PATIENT SURVIVAL BY ETHNIC GROUP, 1999 – 2013
YEAR OF TRANSPLANT 1999–2013
GRAFT SURVIVAL Median Survival (Years) 1 YEAR (%) 95% C.I. 5 YEAR (%) 95% C.I.
Chinese 95.6 93.9 – 96.9 90.9 88.5 – 92.9 Not reached
Malay 91.7 86.2 – 95.1 86.3 79.5 – 91.0 Not reached
Indian 93.3 85.7 – 96.9 82.3 71.7 – 89.2 Not reached
P=0.43
YEAR OF TRANSPLANT 1999–2013
PATIENT SURVIVAL Median Survival (Years) 1 YEAR (%) 95% C.I. 5 YEAR (%) 95% C.I.
Chinese 97.9 96.5 – 98.7 93.1 90.9 – 94.8 Not reached
Malay 97.5 93.4 – 99.0 92.1 86.1 – 95.6 Not reached
Indian 97.8 91.4 – 99.4 88.3 78.5 – 93.8 Not reached
P=0.86
Table 9.6.4.6: GRAFT AND PATIENT SURVIVAL BY AGE GROUP, 1999 – 2013
YEAR OF TRANSPLANT 1999–2013
GRAFT SURVIVAL Median Survival (Years) 1 YEAR (%) 95% C.I. 5 YEAR (%) 95% C.I.
< 60 94.7 93.0 – 95.9 89.5 87.2 – 91.3 Not reached
≥ 60 97.6 83.9 – 99.7 87.9 70.3 – 95.4 Not reached
P=0.65
YEAR OF TRANSPLANT 1999–2013
PATIENT SURVIVAL Median Survival (Years) 1 YEAR (%) 95% C.I. 5 YEAR (%) 95% C.I.
< 60 97.8 96.6 – 98.6 92.7 90.7 – 94.3 Not reached
≥ 60 97.6 83.9 – 99.7 87.9 70.3 – 95.4 Not reached
P=0.22

Singapore Renal Registry Report No. 10
128
10 APPENDICES
10.1 APPENDIX I
10.1.1 SRR Form
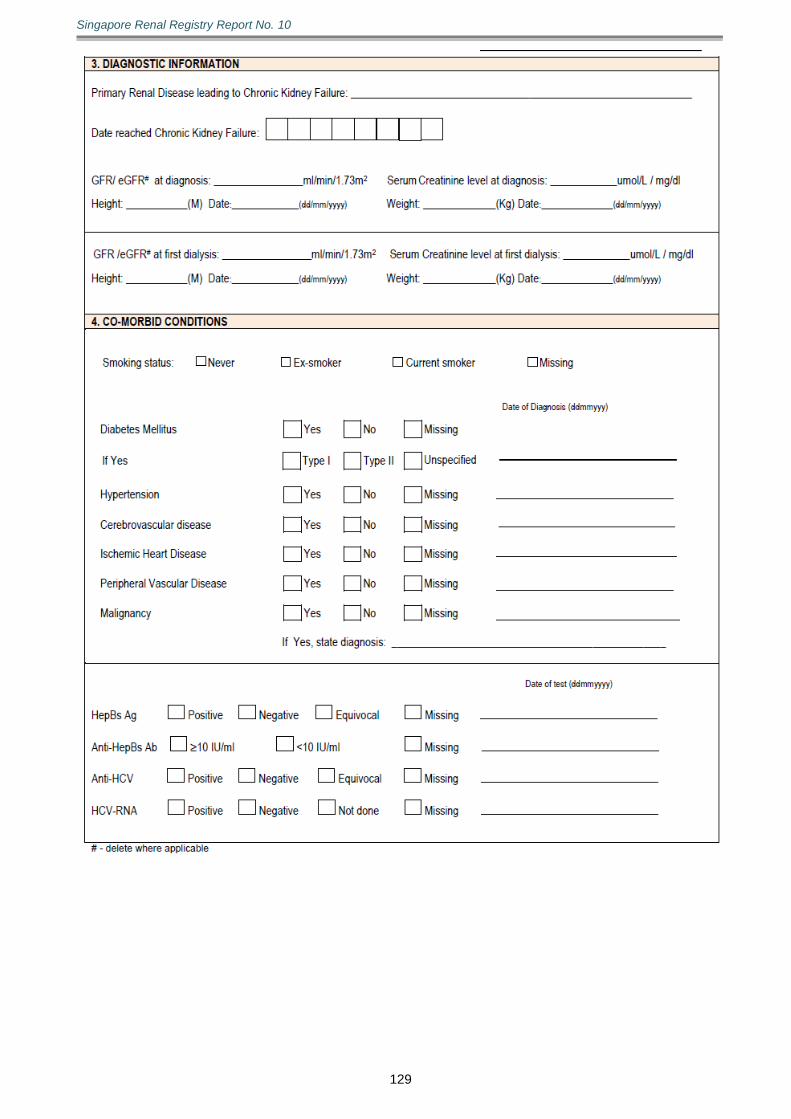
Singapore Renal Registry Report No. 10
129
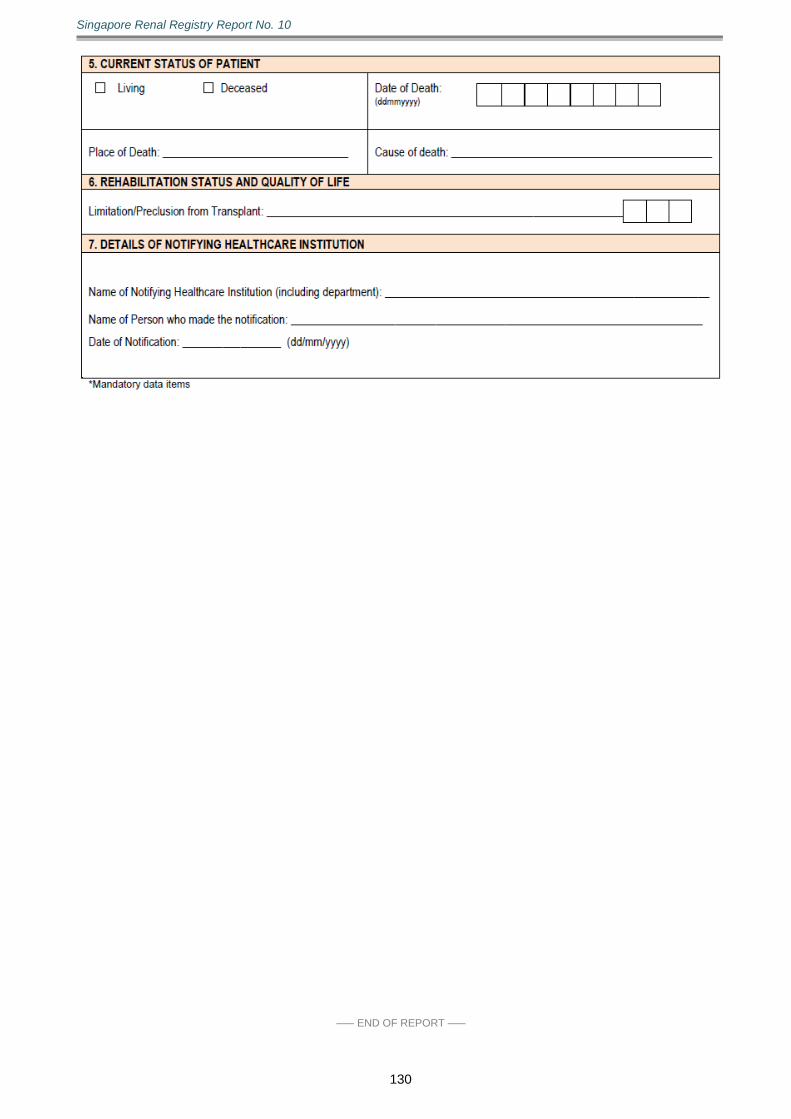
Singapore Renal Registry Report No. 10
130
––– END OF REPORT –––