Embed Size (px)
Citation preview
TRANSPORTATION UNIFORM MITIGATION FEE 2006 FEE SCHEDULE UPDATE NEXUS STUDY REPORT
Prepared for: Coachella Valley Association of Governments In Association with: City of Cathedral City City of Coachella City of Desert Hot Springs City of Indian Wells City of Indio City of La Quinta City of Palm Desert City of Palm Springs City of Rancho Mirage County of Riverside Prepared by: Parsons Brinckerhoff 685 East Carnegie Drive, Suite 210 San Bernardino, California 92408 909-888-1106 www.pbworld.com
June 27, 2006
CVAG TUMF Nexus Study Report 2006 Fee Schedule Update June 27, 2006
i
TABLE OF CONTENTS 1.0 Introduction .........................................................................................................................1
1.1. TUMF Boundary Determination ...................................................................................2 1.2. Measure A and the CVAG TUMF Program ...............................................................5 1.3. Mitigation Fee Act and Other Legal Requirements................................................6
2.0 Future Growth and the Need for TUMF...........................................................................8
2.1. Future Growth Trends ...................................................................................................8 2.2. Future Highway Traffic..................................................................................................8 2.3. The TUMF Concept......................................................................................................10
3.0 TPPS and RACE..................................................................................................................12
3.1. Cost Estimation Methodology...................................................................................12 3.2. Projects Included in the TPPS and RACE.................................................................26
4.0 Traffic Growth Attributable to New Development .....................................................28
4.1. Determining Traffic Growth .......................................................................................28 4.1.1. Background on CVATS Model ............................................................................28 4.1.2. Determining Trip Growth Forecasted by the CVATS Model ..........................29 4.1.3. Converting Model Forecasts to Project Level Forecasts ................................31
4.2. Fee Category Share of New Trips.............................................................................31 5.0 TUMF Collection Target ....................................................................................................35
5.1. Other Funding Sources...............................................................................................35 5.1.1. Measure A ..............................................................................................................36 5.1.2. State Transportation Improvement Program (STIP) .........................................37 5.1.3. Unfunded Share of RACE.....................................................................................37
5.2. Developer Dedications ..............................................................................................39 5.3. TUMF Collection Target ..............................................................................................39
6.0 Fee Calculation.................................................................................................................40 7.0 Recommendations and Conclusion .............................................................................42
7.1. Fee Adjustments and Program Updates.................................................................43 7.1.1. Annual Inflation Adjustment................................................................................43 7.1.2. Regular Program Review and Update..............................................................44
7.2. TUMF Ordinance Amendments ................................................................................45 7.2.1. Horizon Year and CVATS......................................................................................45 7.2.2. Trip Generation Rates...........................................................................................45 7.2.3. Applicability ...........................................................................................................46 7.2.4. Establishment of the Transportation Mitigation Fee........................................46 7.2.5. Share of Trips ..........................................................................................................46 7.2.6. Schedule of Fees...................................................................................................47 7.2.7. List of Projects on the Regional System .............................................................47
CVAG TUMF Nexus Study Report 2006 Fee Schedule Update June 27, 2006
ii
APPENDICES Appendix A – SCAG 2004 RTP Model Network Plots.............................................................. 48 LIST OF TABLES Table 2-1 Socio-Economic Data for CVAG TUMF Study Area (2000-2030)............................8 Table 2-2 Regional Highway System Measures of Performance for CVAG TUMF
Study Area (2000-2030) ................................................................................................9 Table 3-1 Summary of 2005 RACE Update By Project ............................................................19 Table 3-2 “Maintenance Only” Projects Included in the 2005 TPPS and RACE
Updates ........................................................................................................................27 Table 4-1 CVATS Model Trips.......................................................................................................29 Table 4-2 Distribution of CVATS Model Internal-Internal Trips................................................32 Table 4-3 CVATS Model Trip Purposes by Fee Categories.....................................................33 Table 4-4 CVATS Model Refined Trip Purposes by Fee Categories......................................33 Table 4-5 CVATS Model Trip Purposes versus Fee Categories – Reassigned......................34 Table 5-1 Measure A Revenue Estimate for Coachella Valley .............................................36 Table 5-2 STIP Funding Estimate for Coachella Valley ...........................................................37 Table 5-3 CVAG RACE Inflated Cost Estimate ........................................................................38 Table 5-4 Unfunded Share of RACE 2005 Update ..................................................................38 Table 5-5 TUMF Collection Target ..............................................................................................39 Table 6-1 CVAG TUMF Fee Calculation....................................................................................41 Table 7-1 CVAG TUMF Schedule of Fees..................................................................................42 LIST OF FIGURES Figure 1-1 CVAG TUMF Boundary ................................................................................................4 Figure 3-1 Projects in the 2005 TPPS Update ............................................................................13 Figure 4-1 CVATS Model and TUMF Collection Areas ............................................................30 Figure 7-1 Construction Cost Index Comparison ....................................................................44
CVAG TUMF Nexus Study Report 2006 Fee Schedule Update June 27, 2006
1
1.0 INTRODUCTION In July 1989, the agencies of the Coachella Valley adopted a landmark Transportation Uniform Mitigation Fee (TUMF) program to collect a uniform development impact fee to help fund construction of the regional system of roads, streets, and highways (excluding state or federal highways) needed to accommodate growth in the region. During its 15+ years of existence, the TUMF has helped to fund numerous improvement projects including arterial street construction, street widening, intersection capacity enhancements, and freeway interchange improvements. Throughout its existence the TUMF structure and policies have remained essentially unchanged. However, many roadway improvements associated with the original TUMF have been completed and plans for future development within the Coachella Valley have evolved substantially. Furthermore, the reauthorization of Measure A in Riverside County commits a significant future stream of funding to transportation improvements in the Coachella Valley. Combined with other public sources of funds, the funding mix for roadway projects in the Coachella Valley has changed substantially since the TUMF was originally adopted. To reflect the accomplishments of the original TUMF program and the continuing changes in regional growth, transportation needs and available funding, CVAG has recently completed an update of the Transportation Project Prioritization Study and the Regional Arterial Cost Estimate. The Transportation Project Prioritization Study (TPPS) and Regional Arterial Cost Estimate (RACE) each represent fundamental elements of CVAG’s Transportation Uniform Mitigation Fee (TUMF) program. The TPPS identifies the arterial roadway improvements necessary to mitigate the transportation impacts of new development on the Coachella Valley and prioritizes the implementation of these improvements. The RACE determines the cost associated with implementing the roadway system improvements identified in the TPPS and therefore provides a core variable in the formula for calculating the fee level for the TUMF program. Changes in the TPPS and RACE documents that provide the underlying basis for the TUMF program have necessitated the review and update of the TUMF program to reaffirm the nexus between projected development and needed transportation system improvements. The reevaluation of the TUMF nexus also provides the opportunity to address important policy issues including consideration of a new horizon year of 2030 (based on the latest available socio-economic forecasts from the Southern California Association of Governments) and the related traffic growth attributable to new development in the Coachella Valley, and verification of the percentage of improvement costs to be funded by other funding sources and developer dedications. This Nexus Study Report presents the evaluation of population and employment growth, future transportation needs and the availability of traditional transportation funding sources to establish updated TUMF fee levels and program revenue collection targets. This study report is intended to satisfy the requirements of California Government Code Chapter 5 Section 66000-66008 Fees for Development Projects (also known as
CVAG TUMF Nexus Study Report 2006 Fee Schedule Update June 27, 2006
2
California Assembly Bill 1600 (AB 1600) or the Mitigation Fee Act) which governs imposing development impact fees in California. Companion documents referenced in this report include the Transportation Project Prioritization Study (Katz, Okitsu and Associates, 2006), the Regional Arterial Cost Estimation (Katz, Okitsu and Associates, 2006) and the CVAG TUMF Boundary Determination (Parsons Brinckerhoff, 2005). These documents that are directly related to the 2006 Fee Schedule Update are available from CVAG. The following sub-sections provide some background information on CVAG’s TUMF program including the results of the recent boundary determination and the provisions of state legislation relating to mitigation fee programs. The remaining sections of the TUMF 2006 Fee Schedule Update Nexus Study Report present the findings of the nexus study data analysis and the revised TUMF fee schedule. 1.1. TUMF Boundary Determination In cooperation with the Western Riverside Council of Governments (WRCOG), CVAG has participated in efforts to determine an appropriate boundary between the two regions. The resultant changes in the CVAG jurisdictional boundary necessitates consideration of expanding the TUMF collection area boundary to match the new jurisdictional boundary and therefore a nexus must be established between development in this area and transportation improvements in the Coachella Valley. The CVAG TUMF Boundary Determination (Parsons Brinckerhoff, 2005) established a roughly defined area within which there exists a “reasonable relationship” between new development and traffic conditions on TUMF roadways. In short, this area includes the CVAG core, as well as outlying areas along the I-10 east, SR74 south, SR86 south, and SR111 south corridors. The roughly defined area was identified in three analysis stages. The conclusions for each analysis stage are summarized below: • Distribution of Trips:
The analysis of trip distribution based on the 1997 and 2020 origin-destination trip tables of the Coachella Valley Transportation Study Model (CVATS) model determined that areas outside the CVAG core have a relatively small contribution (<1% of all trips) to traffic in the CVATS modeling area. It also found that areas within the CVAG core were the primary contributor to trips within the core. Thus, the analysis of trip distribution found a clear nexus between areas within the CVAG core and traffic conditions on the TUMF roadways, most of which are located in the core area. It did not, however, establish a clear nexus between new development in outlying areas and traffic conditions on the TUMF roadways.
• Average Trip Length/Use of Arterial Streets:
The analysis of trip length and use of arterial streets supplemented the analysis of trip distribution. Based on uniform distance buffers around city borders, as well as
CVAG TUMF Nexus Study Report 2006 Fee Schedule Update June 27, 2006
3
selected route specific time points, a “reasonable relationship” was established between certain outlying areas and traffic conditions on TUMF roadways. Four time points located roughly at the edge of where a “reasonable relationship” could be established were identified. These four time point locations are as follows:
- Time point on the I-10 east corridor: I-10 Frontage Road ramps (near Cactus City
and the Rest Area) - Time point on the SR74 south corridor: Ribbonwood (located along SR74 near the
SR371 junction) - Time point on the SR 86 south corridor: Oasis (located on the west shore of the
Salton Sea) - Time point on the SR111 south corridor: Desert Beach (located on the east shore
of the Salton Sea) • Limitations to Development:
Largely undeveloped areas exist between the time point locations identified in the average trip length analysis stage. These areas are of limited relevance to the TUMF program since development within them is either legally prohibited, exempt from TUMF payment, or restricted by the terrain. For this reason, a more detailed analysis of these areas was not pursued.
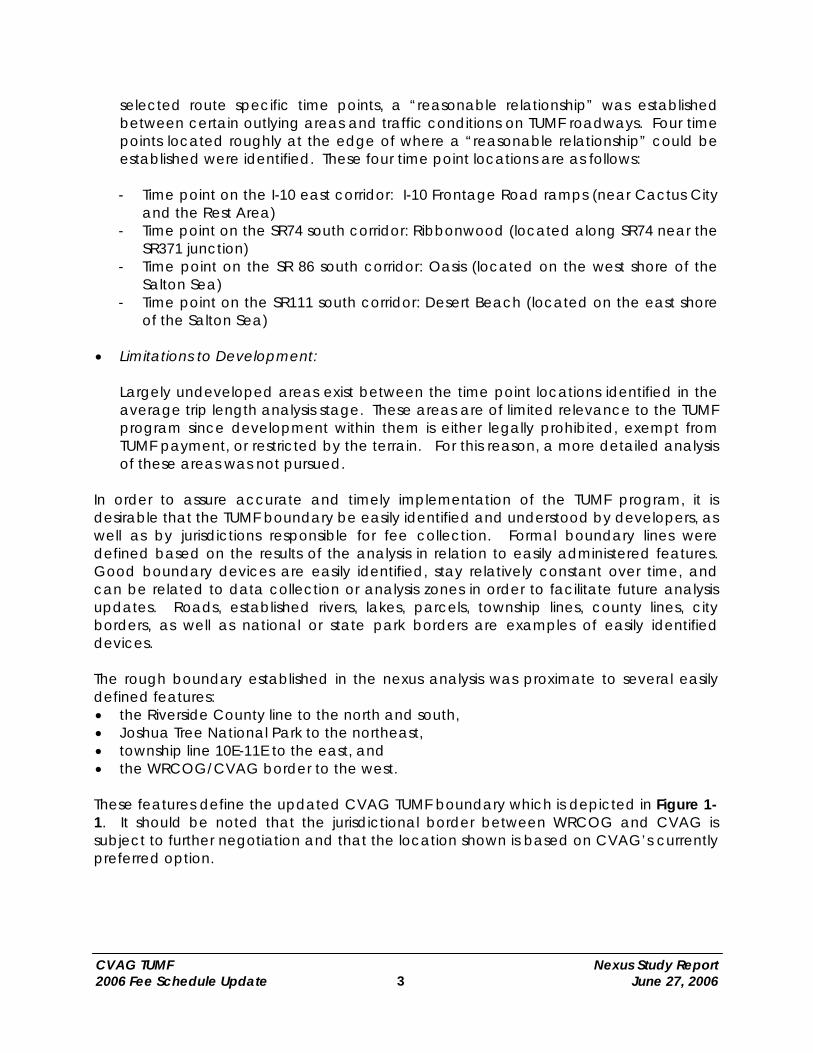
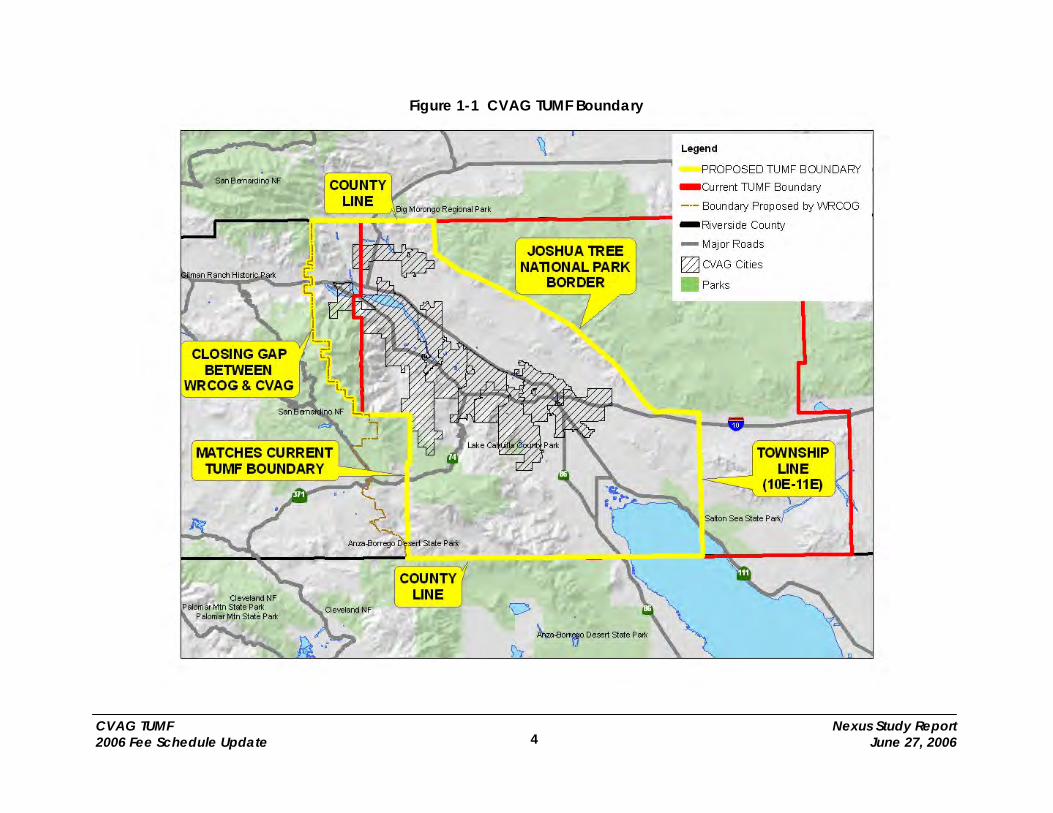
In order to assure accurate and timely implementation of the TUMF program, it is desirable that the TUMF boundary be easily identified and understood by developers, as well as by jurisdictions responsible for fee collection. Formal boundary lines were defined based on the results of the analysis in relation to easily administered features. Good boundary devices are easily identified, stay relatively constant over time, and can be related to data collection or analysis zones in order to facilitate future analysis updates. Roads, established rivers, lakes, parcels, township lines, county lines, city borders, as well as national or state park borders are examples of easily identified devices. The rough boundary established in the nexus analysis was proximate to several easily defined features: • the Riverside County line to the north and south, • Joshua Tree National Park to the northeast, • township line 10E-11E to the east, and • the WRCOG/CVAG border to the west. These features define the updated CVAG TUMF boundary which is depicted in Figure 1-1. It should be noted that the jurisdictional border between WRCOG and CVAG is subject to further negotiation and that the location shown is based on CVAG’s currently preferred option.
CVAG TUMF Nexus Study Report 2006 Fee Schedule Update June 27, 2006
4
Figure 1-1 CVAG TUMF Boundary
CVAG TUMF Nexus Study Report 2006 Fee Schedule Update June 27, 2006
5
It should also be noted that the portion of the boundary coincident with the Joshua Tree National Park border is defined as “the Joshua Tree National Park border”, rather than as a specific physical location. This section of the boundary is defined as such so that it would shift to match any future revisions to the Joshua Tree National Park borders. 1.2. Measure A and the CVAG TUMF Program The CVAG TUMF program is a component of Riverside County’s Measure A. Measure A is a one-half percent sales tax program that provides funding for a wide variety of transportation projects and services throughout Riverside County. It was approved by voters of Riverside County in November, 1988. Measure A was due to expire in 2009, but on Election Day 2002 a thirty year extension of the one-half percent sales tax for transportation was approved by 69.2 percent of Riverside County voters. Funds are allocated to the Western County, Coachella Valley, and Palo Verde Valley areas proportionate to the Measure A funds generated within those areas. The Coachella Valley area and the City of Blythe, located within the Palo Verde Valley area, are part of CVAG. The Coachella Valley area is defined by Measure A as located in the central part of Riverside County and including the cities of Cathedral City, Coachella, Desert Hot Springs, Indian Wells, Indio, La Quinta, Palm Desert, Palm Springs, and Rancho Mirage. It also includes the unincorporated areas, and the tribal lands of the Agua Caliente Band of Cahuilla Indians, the Cabazon Band of Mission Indians, and the Torres Martinez Desert Cahuilla Indians. The Palo Verde Valley area is defined by Measure A as located in the far eastern part of Riverside County and as being geographically separated from the Western and Coachella Valley areas. It contains the City of Blythe and unincorporated portions of Riverside County. Measure A requires a TUMF program be administered for the Coachella Valley area, but not for the Palo Verde Valley area. Measure A defines TUMF as a fee that is charged on new development by local governments to assist with the building and improvement of regional arterials. Cities and the county in the Coachella Valley must participate in the TUMF program to assist in the financing of the priority regional arterial system in order to receive local Measure A funds. If a city or the county chooses not to levy the TUMF, the funds they would otherwise receive from Measure A for local streets and roads is added to the Measure A funds for the Regional Arterial Program. A portion of the Measure A revenues for the Coachella Valley area is returned to the cities and the county in the Coachella Valley to assist with the funding of local street and road improvements. These funds supplement existing federal, state, and local funds. Local street improvements adjacent to new residential and business developments are typically paid for by the developers.
CVAG TUMF Nexus Study Report 2006 Fee Schedule Update June 27, 2006
6
Although Measure A has been reauthorized with expiration now extended to 2039, the evaluation for the TUMF Nexus Study uses a horizon year of 2030. The use of a 2030 horizon year for the TUMF Nexus Study is primarily linked to the availability of socio-economic and travel demand forecast data needed to support the analysis. As described in Section 2.1, the most recent forecast information available for the Coachella Valley was published by the Southern California Association of Governments (SCAG) as part of the 2004 Regional Transportation Plan (RTP) update using a horizon year of 2030. To reflect the available data and for consistency with other regional transportation planning initiatives, the 2030 horizon year was also used as the basis for the TUMF nexus determination. Where future Measure A revenues are described in Section 5.1.1, the revenue estimates have been developed for the period through 2030 to remain consistent with other elements of the TUMF analysis. Measure A revenues to be generated in the period from 2030 to 2039 were not included as part of the TUMF nexus determination for this program update. 1.3. Mitigation Fee Act and Other Legal Requirements The Mitigation Fee Act, also known as California Assembly Bill 1600 (AB 1600) or California Government Code Sections 66000 et seq., governs imposing development impact fees in California. The Mitigation Fee Act requires that all local agencies in California, including cities, counties, and special districts follow some basic principles when instituting impact fees as a condition of new development. These principles are as follows: 1. Identify the purpose of the fee. (Government Code Section 66001(a)(1)) 2. Identify the use to which the fee is to be put. (Government Code Section
66001(a)(2)) 3. Determine that there is a reasonable relationship between the fee’s use and the
type of development on which the fee is to be imposed. (Government Code Section 66001(a)(3))
4. Determine how there is a reasonable relationship between the need for the public facility and the type of development project on which the fee is to be imposed. (Government Code Section 66001(a)(4))
5. Discuss how there is a reasonable relationship between the amount of the fee and the cost of the public facility or portion of the public facility attributable to the development on which the fee is to be imposed. (Government Code Section 66001(b))
These principles closely emulate two landmark US Supreme Court rulings that each provide guidance on the application of impact fees. The first case, Nollan v. California Coastal Commission (1987) 107 S.Ct. 3141, established that local governments are not prohibited from imposing impact fees or dedications as conditions of project approval provided the local government establishes the existence of a "nexus" or link between the exaction and the state interest being advanced by that exaction. The Nollan ruling clarifies that once the adverse impacts of development have been quantified, the
CVAG TUMF Nexus Study Report 2006 Fee Schedule Update June 27, 2006
7
local government must then document the relationship between the project and the need for the conditions that mitigate those impacts. The ruling further clarifies that an exaction may be imposed on a development even if the development project itself will not benefit provided the exaction is necessitated by the project's impacts on identifiable public resources. The second case, Dolan v. City of Tigard (1994) 114S.Ct. 2309, held that in addition to the Nollan standard of an essential nexus, there must be a "rough proportionality" between proposed exactions and the project impacts that the exactions are intended to allay. As part of the Dolan ruling, the US Supreme Court advised that “a term such as 'rough proportionality' best encapsulates what we hold to be the requirements of the Fifth Amendment. No precise mathematical calculation is required, but the city (or other local government) must make some sort of individualized determination that the required dedication is related both in nature and extent to the impact of the proposed development." The combined effect of both rulings is the requirement that public exactions must be carefully documented and supported. This requirement is reiterated by the provisions of the State of California Mitigation Fee Act and subsequent rulings in the California Supreme Court (Ehrlich v. City of Culver City (1996) 12 C4th 854) and the California Court of Appeals (Loyola Marymount University v. Los Angeles Unified School District 45 (1996) Cal.App.4th 1256). This Nexus Study report is intended to satisfy the requirements of the State of California Mitigation Fee Act. Specifically, this Nexus Study report will outline the purpose and use of the TUMF, the relationship between new development and impacts on the transportation system, the estimated cost to complete necessary improvements to the arterial street system within the Coachella Valley, and the ‘rough proportionality’ or ‘fair-share’ fee for differing development types.
CVAG TUMF Nexus Study Report 2006 Fee Schedule Update June 27, 2006
8
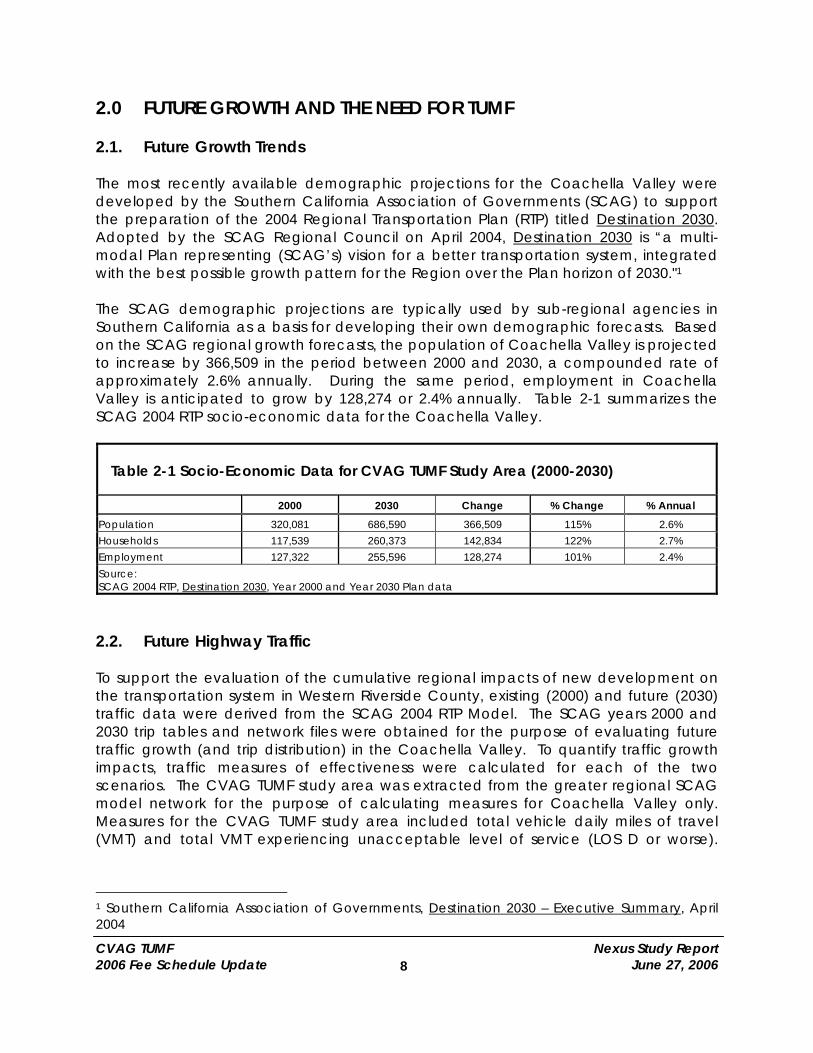
2.0 FUTURE GROWTH AND THE NEED FOR TUMF 2.1. Future Growth Trends The most recently available demographic projections for the Coachella Valley were developed by the Southern California Association of Governments (SCAG) to support the preparation of the 2004 Regional Transportation Plan (RTP) titled Destination 2030. Adopted by the SCAG Regional Council on April 2004, Destination 2030 is “a multi-modal Plan representing (SCAG’s) vision for a better transportation system, integrated with the best possible growth pattern for the Region over the Plan horizon of 2030."1 The SCAG demographic projections are typically used by sub-regional agencies in Southern California as a basis for developing their own demographic forecasts. Based on the SCAG regional growth forecasts, the population of Coachella Valley is projected to increase by 366,509 in the period between 2000 and 2030, a compounded rate of approximately 2.6% annually. During the same period, employment in Coachella Valley is anticipated to grow by 128,274 or 2.4% annually. Table 2-1 summarizes the SCAG 2004 RTP socio-economic data for the Coachella Valley.
Table 2-1 Socio-Economic Data for CVAG TUMF Study Area (2000-2030)
2000 2030 Change % Change % Annual Population 320,081 686,590 366,509 115% 2.6% Households 117,539 260,373 142,834 122% 2.7% Employment 127,322 255,596 128,274 101% 2.4% Source: SCAG 2004 RTP, Destination 2030, Year 2000 and Year 2030 Plan data
2.2. Future Highway Traffic To support the evaluation of the cumulative regional impacts of new development on the transportation system in Western Riverside County, existing (2000) and future (2030) traffic data were derived from the SCAG 2004 RTP Model. The SCAG years 2000 and 2030 trip tables and network files were obtained for the purpose of evaluating future traffic growth (and trip distribution) in the Coachella Valley. To quantify traffic growth impacts, traffic measures of effectiveness were calculated for each of the two scenarios. The CVAG TUMF study area was extracted from the greater regional SCAG model network for the purpose of calculating measures for Coachella Valley only. Measures for the CVAG TUMF study area included total vehicle daily miles of travel (VMT) and total VMT experiencing unacceptable level of service (LOS D or worse).
1 Southern California Association of Governments, Destination 2030 – Executive Summary, April 2004
CVAG TUMF Nexus Study Report 2006 Fee Schedule Update June 27, 2006
9
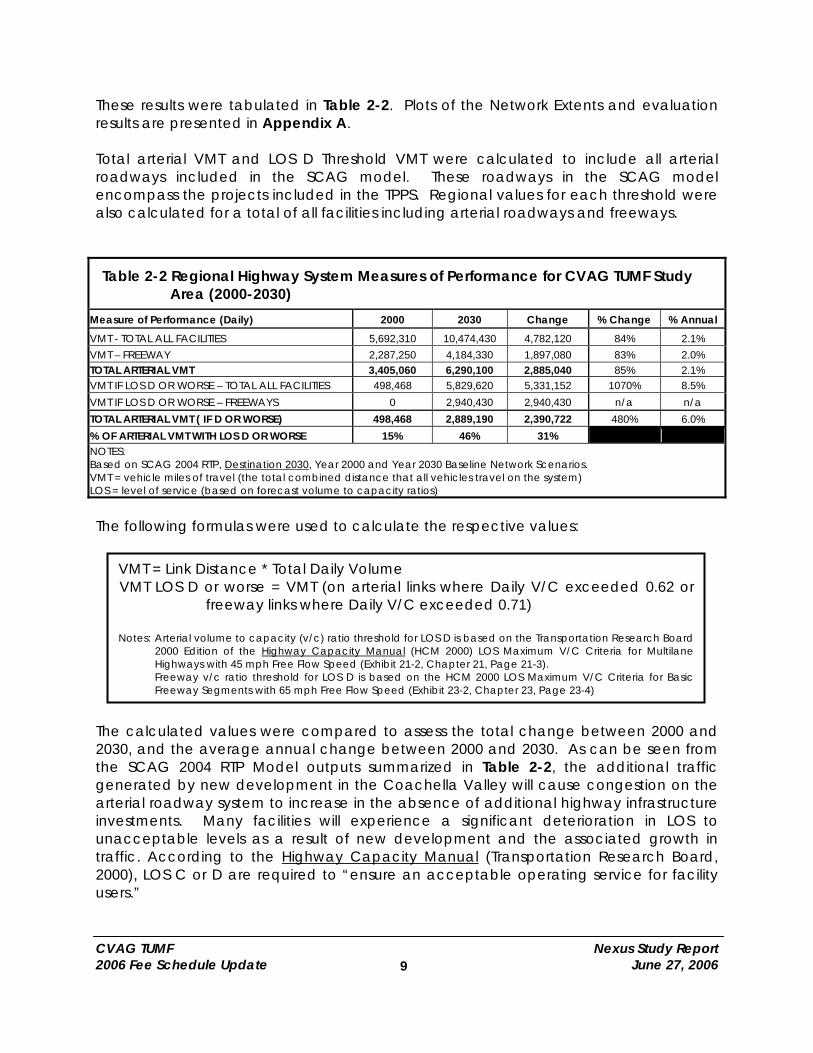
These results were tabulated in Table 2-2. Plots of the Network Extents and evaluation results are presented in Appendix A. Total arterial VMT and LOS D Threshold VMT were calculated to include all arterial roadways included in the SCAG model. These roadways in the SCAG model encompass the projects included in the TPPS. Regional values for each threshold were also calculated for a total of all facilities including arterial roadways and freeways.
Table 2-2 Regional Highway System Measures of Performance for CVAG TUMF Study Area (2000-2030)
Measure of Performance (Daily) 2000 2030 Change % Change % Annual VMT - TOTAL ALL FACILITIES 5,692,310 10,474,430 4,782,120 84% 2.1% VMT – FREEWAY 2,287,250 4,184,330 1,897,080 83% 2.0% TOTAL ARTERIAL VMT 3,405,060 6,290,100 2,885,040 85% 2.1% VMT IF LOS D OR WORSE – TOTAL ALL FACILITIES 498,468 5,829,620 5,331,152 1070% 8.5% VMT IF LOS D OR WORSE – FREEWAYS 0 2,940,430 2,940,430 n/a n/a TOTAL ARTERIAL VMT ( IF D OR WORSE) 498,468 2,889,190 2,390,722 480% 6.0% % OF ARTERIAL VMT WITH LOS D OR WORSE 15% 46% 31% NOTES: Based on SCAG 2004 RTP, Destination 2030, Year 2000 and Year 2030 Baseline Network Scenarios. VMT = vehicle miles of travel (the total combined distance that all vehicles travel on the system) LOS = level of service (based on forecast volume to capacity ratios)
The following formulas were used to calculate the respective values:
The calculated values were compared to assess the total change between 2000 and 2030, and the average annual change between 2000 and 2030. As can be seen from the SCAG 2004 RTP Model outputs summarized in Table 2-2, the additional traffic generated by new development in the Coachella Valley will cause congestion on the arterial roadway system to increase in the absence of additional highway infrastructure investments. Many facilities will experience a significant deterioration in LOS to unacceptable levels as a result of new development and the associated growth in traffic. According to the Highway Capacity Manual (Transportation Research Board, 2000), LOS C or D are required to “ensure an acceptable operating service for facility users.”
VMT = Link Distance * Total Daily Volume VMT LOS D or worse = VMT (on arterial links where Daily V/C exceeded 0.62 or
freeway links where Daily V/C exceeded 0.71) Notes: Arterial volume to capacity (v/c) ratio threshold for LOS D is based on the Transportation Research Board
2000 Edition of the Highway Capacity Manual (HCM 2000) LOS Maximum V/C Criteria for Multilane Highways with 45 mph Free Flow Speed (Exhibit 21-2, Chapter 21, Page 21-3).
Freeway v/c ratio threshold for LOS D is based on the HCM 2000 LOS Maximum V/C Criteria for Basic Freeway Segments with 65 mph Free Flow Speed (Exhibit 23-2, Chapter 23, Page 23-4)
CVAG TUMF Nexus Study Report 2006 Fee Schedule Update June 27, 2006
10
The need to mitigate the impact of new development is shown by the adverse impact that new development will have on arterial roadways in the Coachella Valley. As a result of the new development and associated growth in population and employment in the Coachella Valley, additional pressure will be placed on arterial roadways with the total vehicle miles traveled (VMT) estimated to increase by 85% or 2.1% compounded annually. As shown in Table 2-2, the VMT on arterial facilities experiencing LOS D or worse will increase by 480% or 6.0% compounded annually in the Coachella Valley in the period between 2000 and 2030. By 2030, almost one half of the total VMT on the regional arterial highway system is forecast to be traveling on facilities experiencing daily LOS D or worse without substantial improvements to the arterial street system. The combined influences of increased travel and worsened LOS that manifest themselves in congestion highlight the continuing need to complete the improvements recommended in the TPPS to mitigate the cumulative regional impact of new development. The SCAG 2004 RTP Model outputs summarized in Table 2-2 clearly demonstrate that the additional trips generated by future new development in the Coachella Valley will lead to increasing levels of traffic congestion, especially on the arterial roadways. The need to implement the TPPS to improve these roadways and relieve future congestion is therefore directly linked to the future development that generates the additional trips. 2.3. The TUMF Concept All new development has some effect on the transportation infrastructure in a community, city or county due to an increase in the total number of trips. Increasing usage of the transportation facilities leads to more traffic, progressively increasing congestion and decreasing the level of service. In order to meet the increased travel demand and keep traffic flowing, improvements to transportation facilities become necessary to sustain pre-development traffic conditions. The projected growth in Coachella Valley can be expected to increase congestion and degrade mobility if further investments are not made in the transportation infrastructure. This challenge is especially critical for arterial roadways that carry a significant number of the trips between cities, since traditional sources of transportation improvement funding (such as the gasoline tax and local general funds) will not be nearly sufficient to fund the improvements needed to serve new development. Developer dedications generally provide only a portion of the improvements with improvements confined to the area immediately adjacent to the respective development, and the broad-based county-level funding sources (i.e., Measure A) designates only partial revenues for arterial roadway improvements. The TUMF program establishes a uniform development impact fee to generate the revenues necessary to fully fund the implementation of the TPPS resulting in construction of the regional system of roads, streets, and highways (excluding state or federal
CVAG TUMF Nexus Study Report 2006 Fee Schedule Update June 27, 2006
11
highways) needed to accommodate growth in the region. Recognizing that some improvements within the Coachella Valley will be completed by developer dedications or using alternate funding sources, the TUMF program establishes the share of unfunded improvement costs in rough proportionality to the number of trips generated by new development and assigns the fair-share fee to new developments on this basis. A sizable percentage of trip-making for any given local community extends beyond the bounds of the individual community as residents pursue employment, education, shopping and entertainment opportunities elsewhere. As new development occurs within a particular local community, this migration of trips of all purposes by new residents contributes to the need for transportation improvements within their community and in the other communities of Coachella Valley. The idea behind the TUMF program is to have new development throughout the Coachella Valley contribute equally to paying the cost of improving the transportation facilities that serve these trips within and between communities. For this reason, the TUMF revenues are used to improve transportation facilities that primarily serve trips within and between communities in Coachella Valley (primarily arterial roadways). Much, but not all, of the new trip-making in a given area is generated by residential development (i.e. when people move into new homes, they create new trips on the transportation system as they travel to work, school, shopping or entertainment). Some of the new trips are generated simply by activities associated with new businesses (i.e. new businesses will create new trips through the delivery of goods and services, etc.). With the exception of commute trips by local residents coming to and from work, and the trips of local residents coming to and from new businesses to get goods and services, the travel demands of new businesses are not directly attributable to residential development. The TUMF program considers the relative impacts of different sources of new trip generation by assessing both residential and non-residential development for their related transportation impacts. In summary, the TUMF concept includes the following: • A uniform fee is levied on new development throughout the Coachella Valley to
mitigate the cumulative regional impacts of trips generated by new development. • The fee is assessed with rough proportionality on new residential and non-residential
development based on the relative impact of each new use on the transportation system.
CVAG TUMF Nexus Study Report 2006 Fee Schedule Update June 27, 2006
12
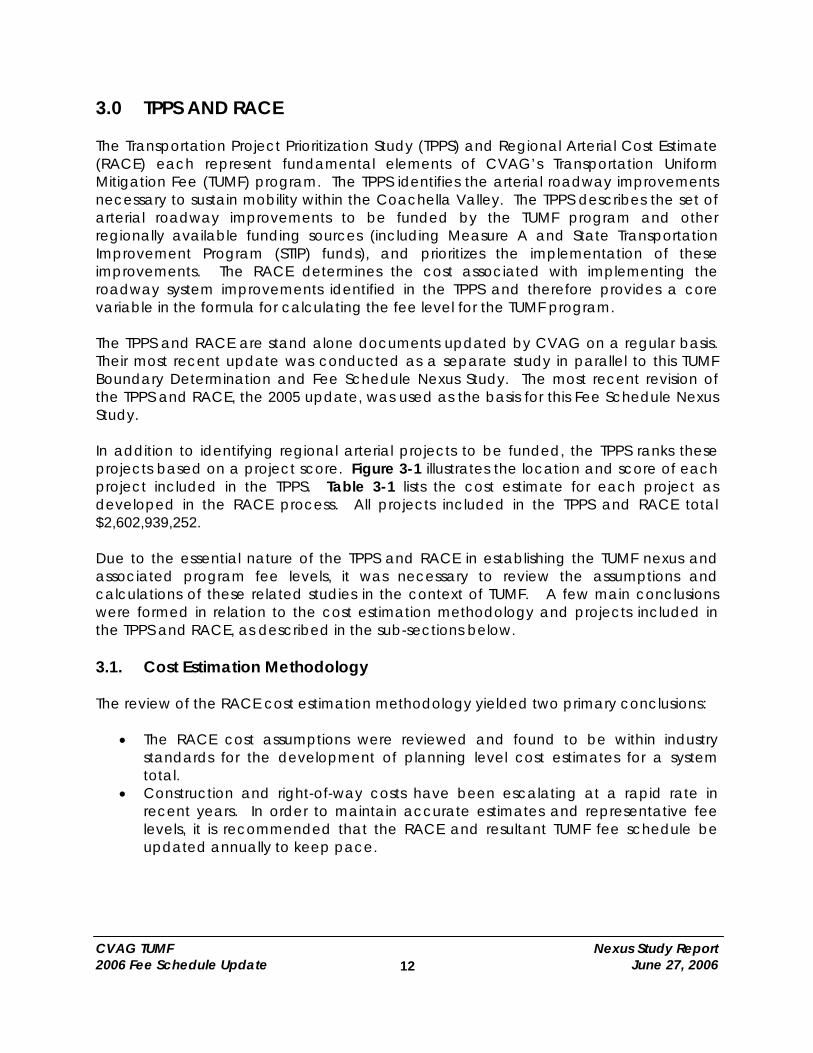
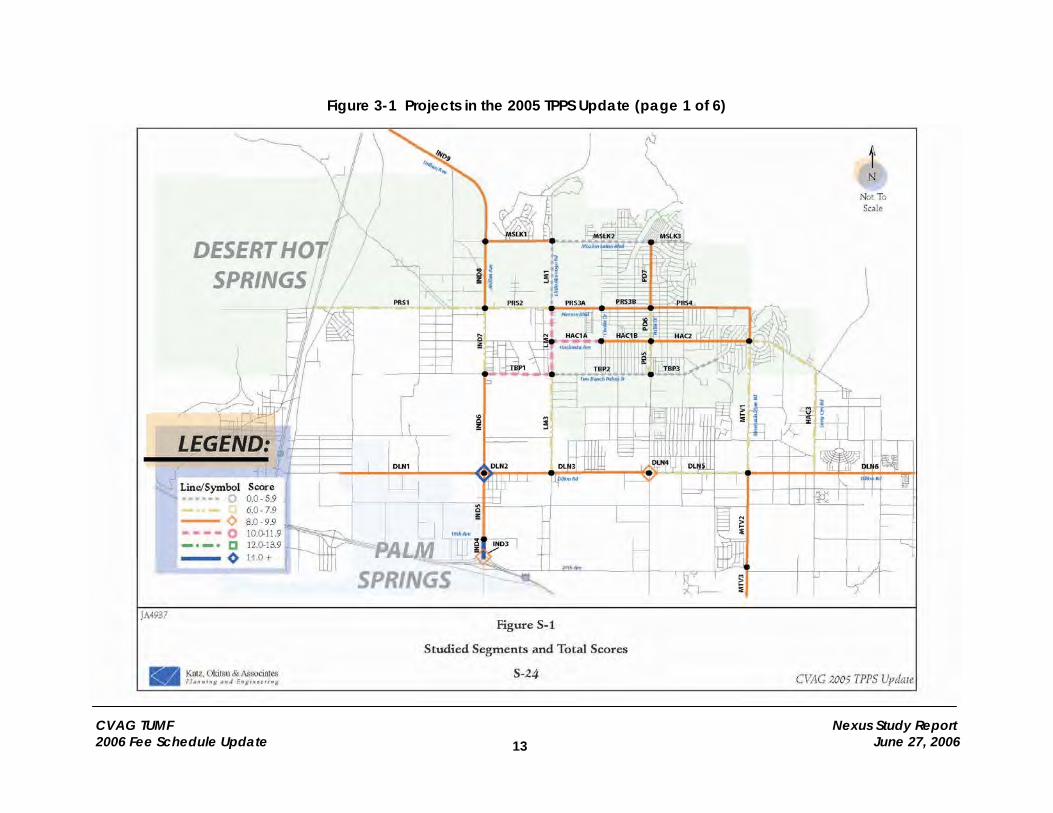
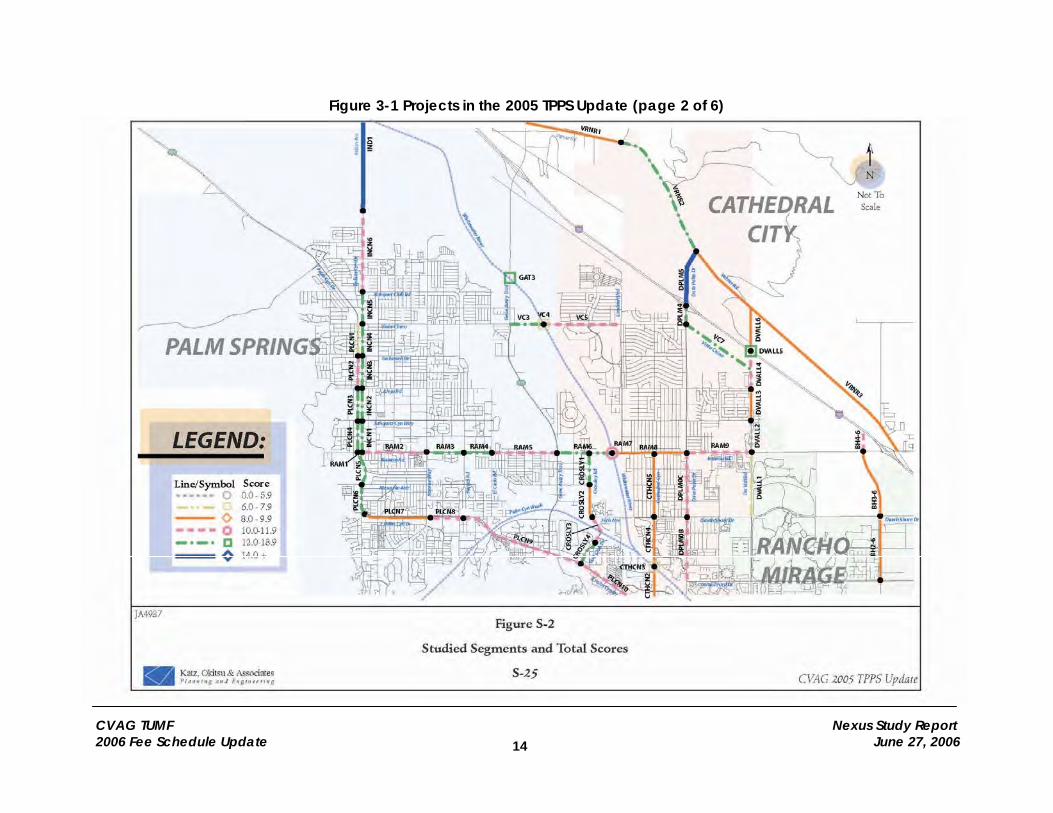
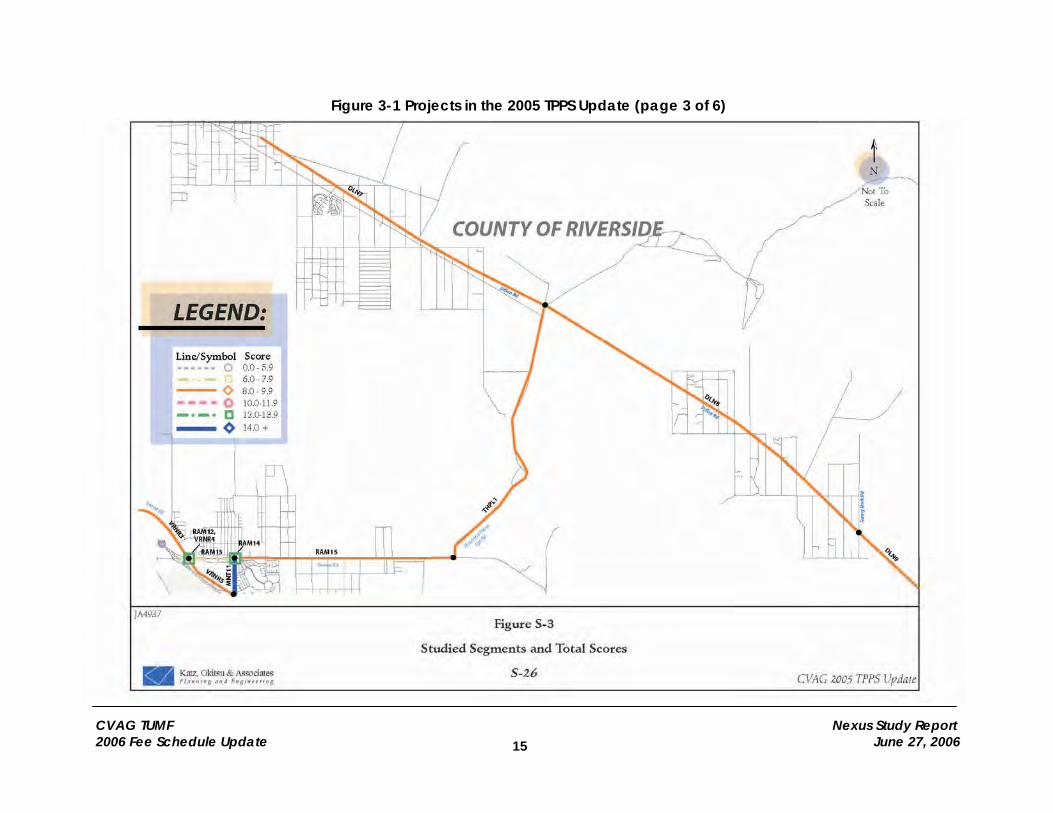
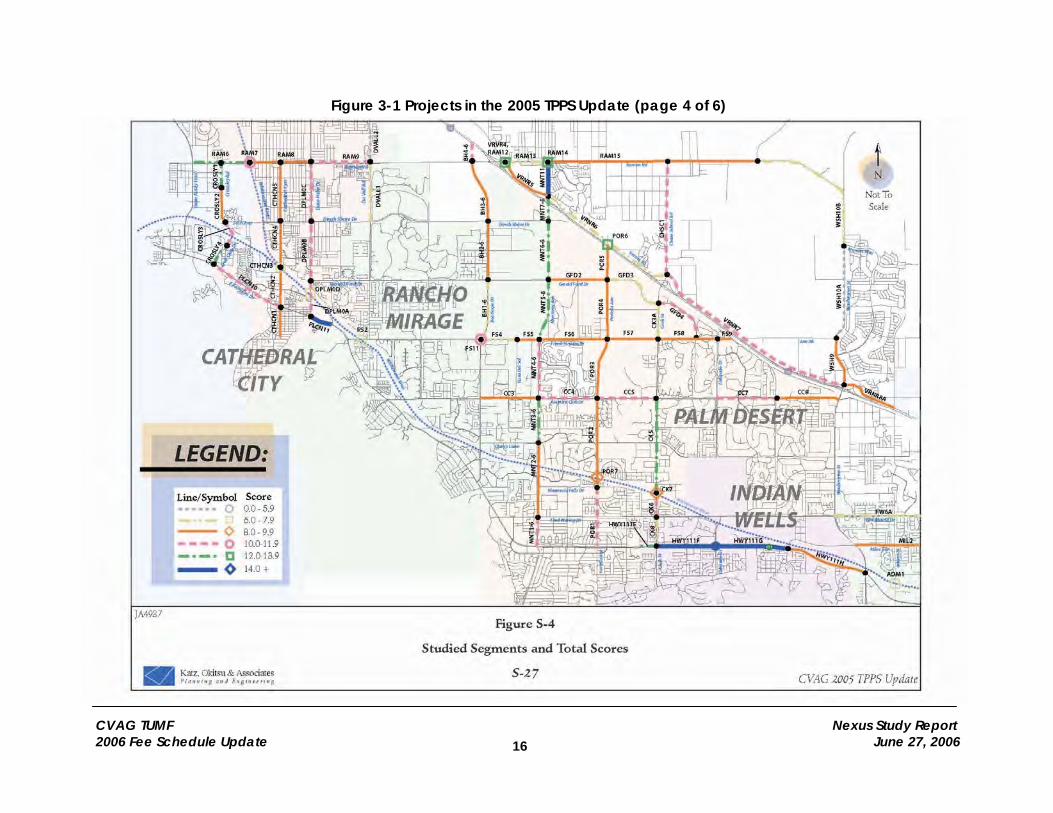
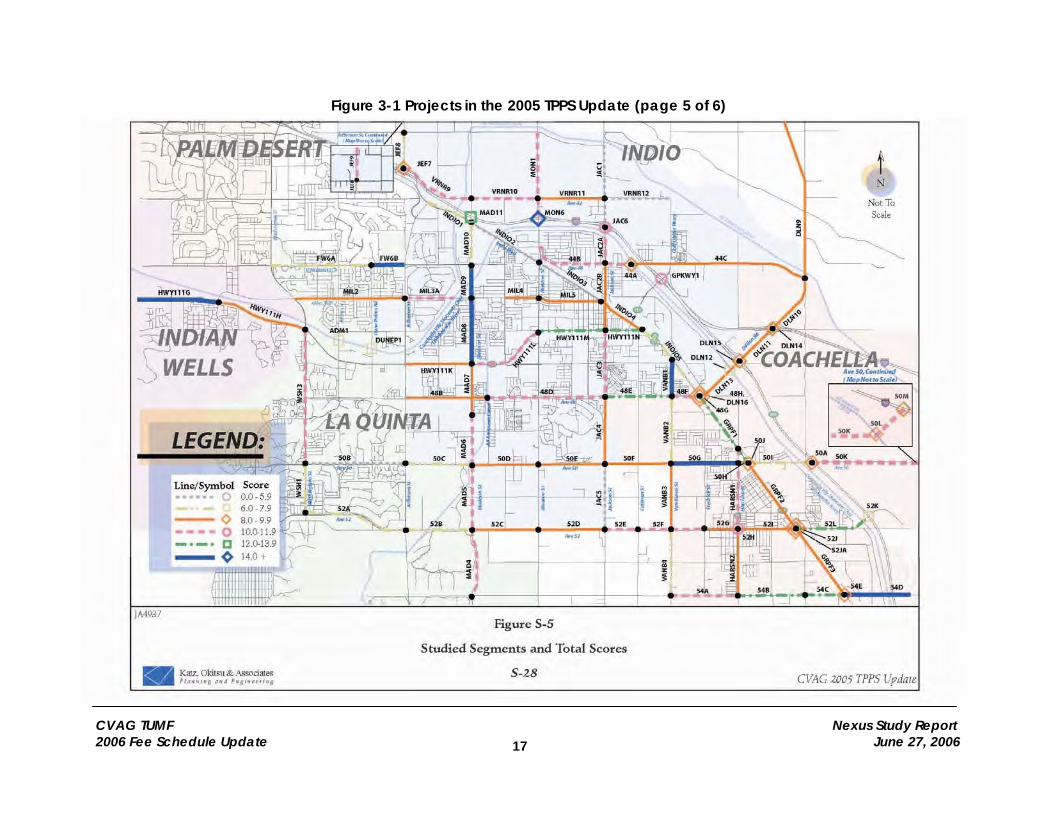
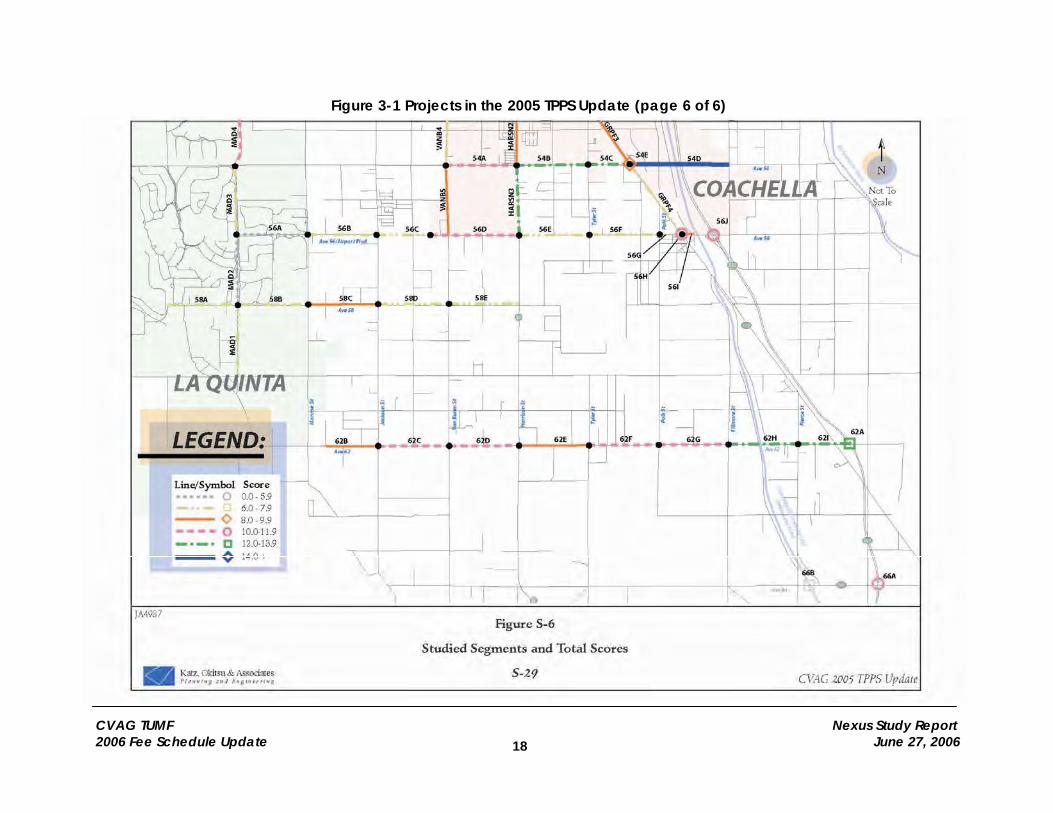
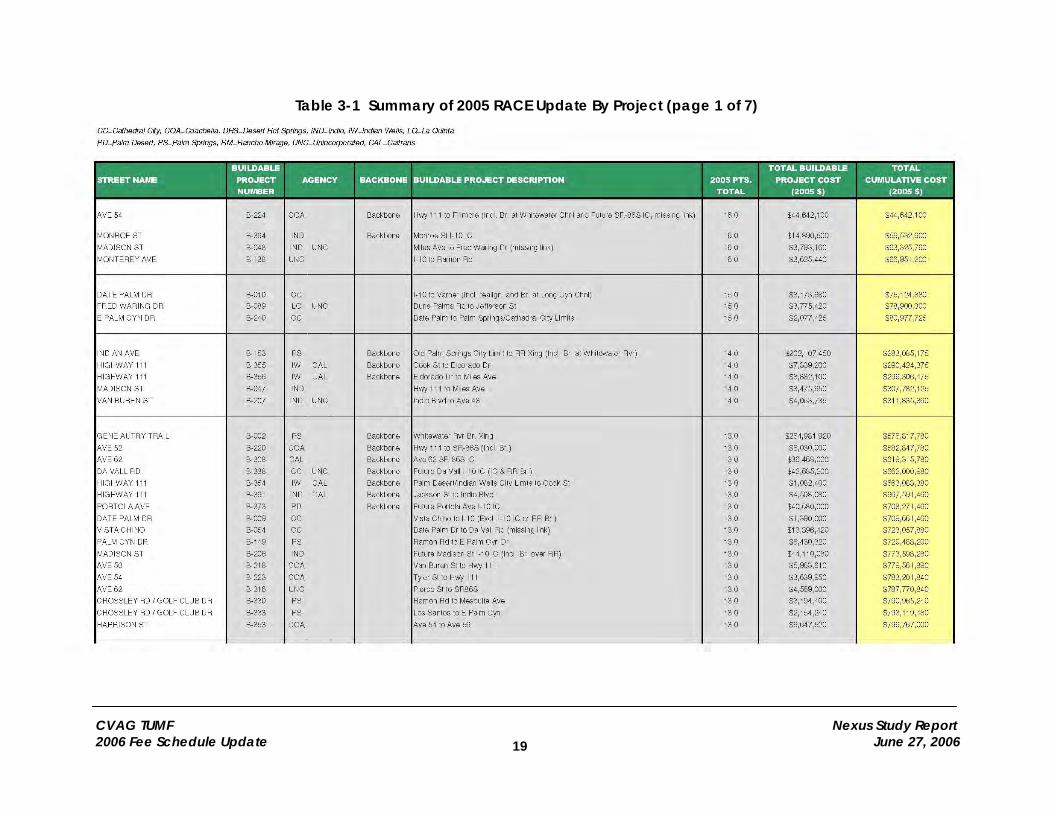
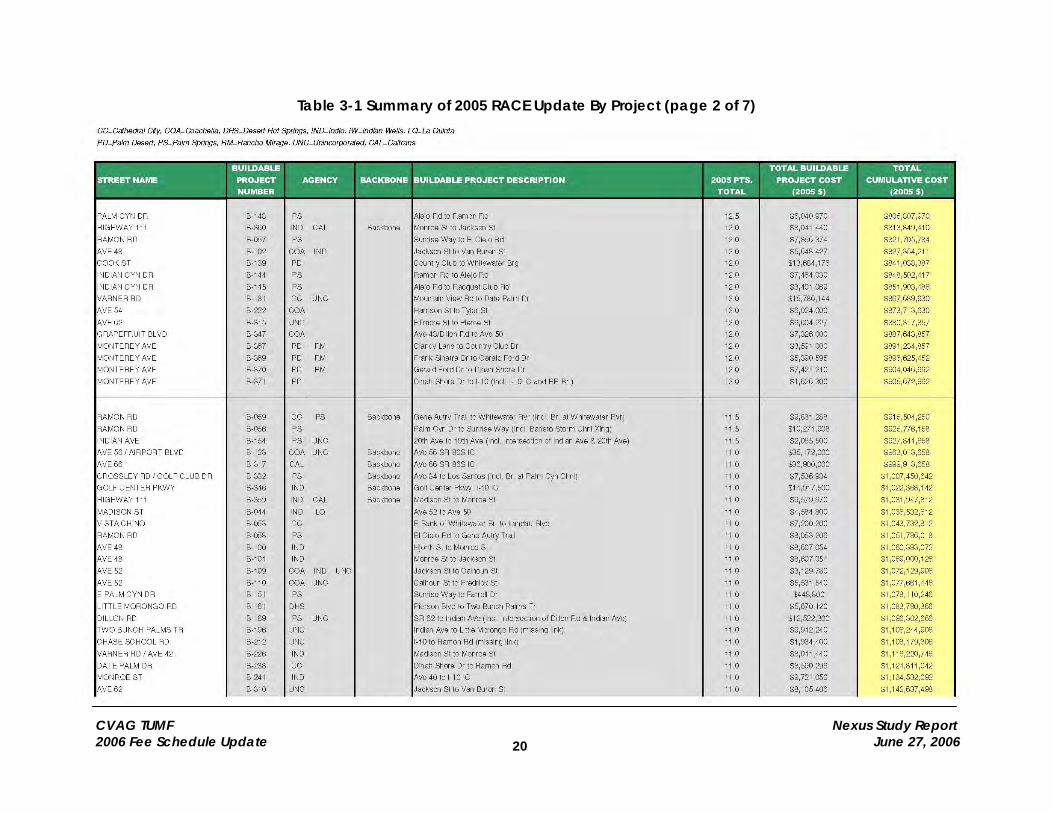
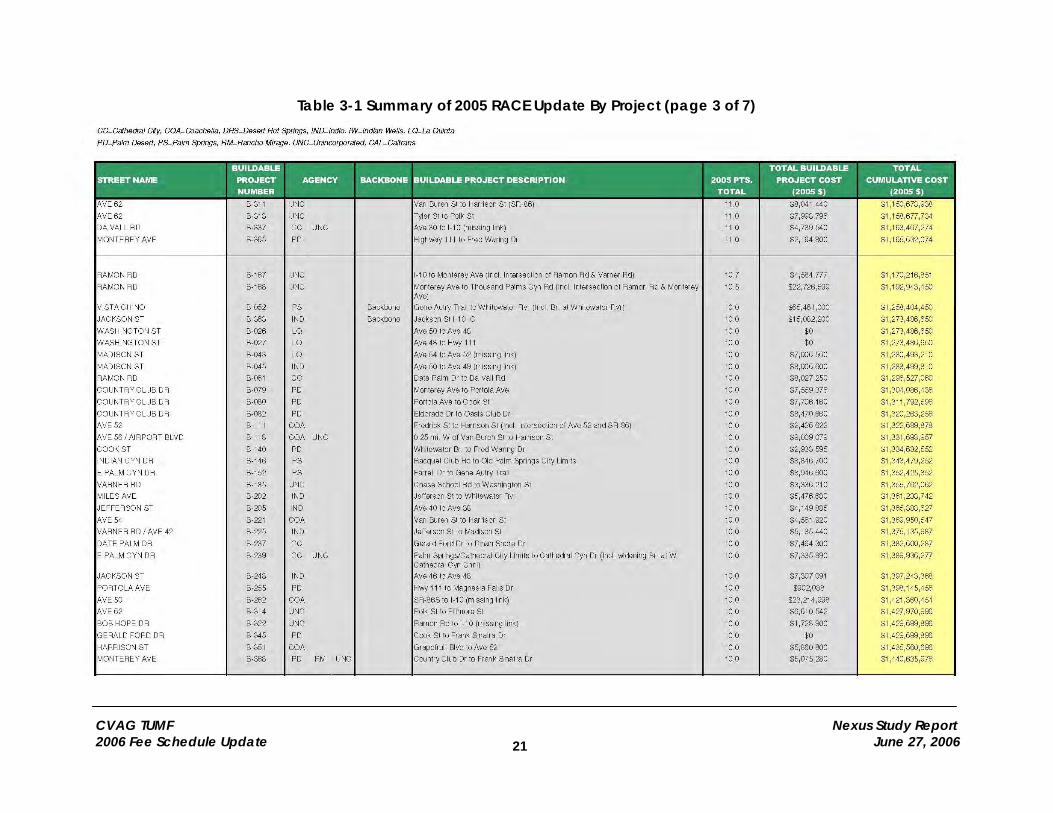
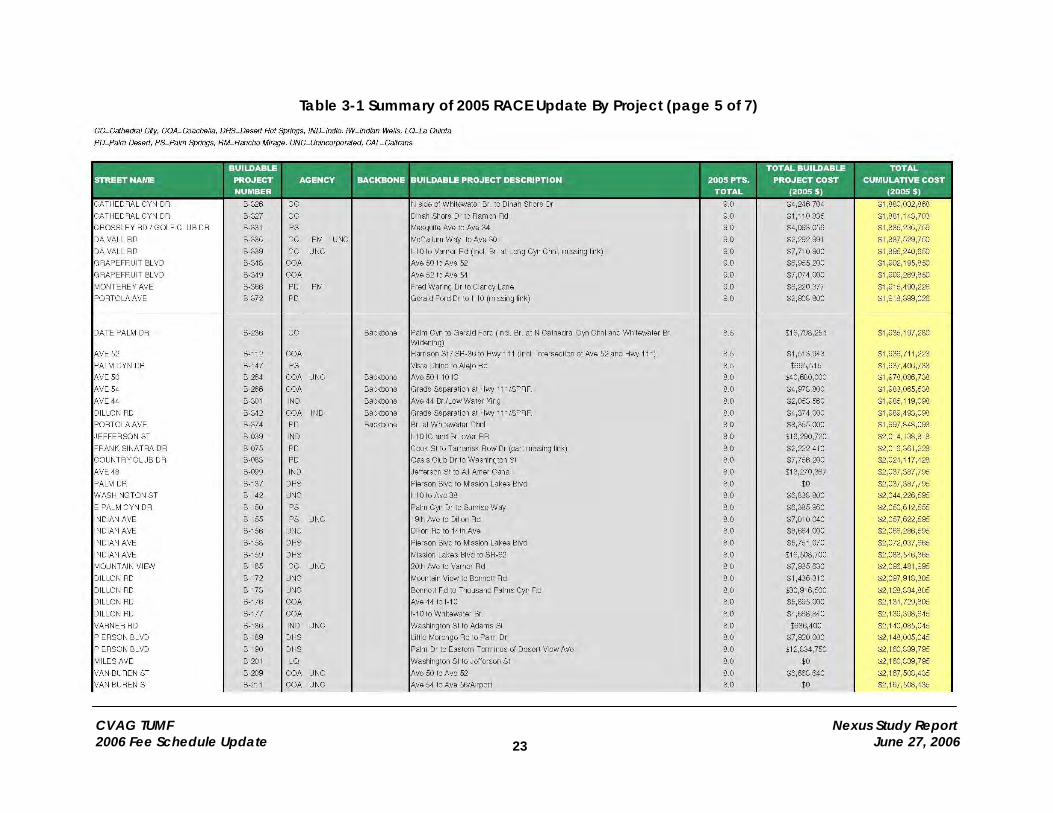
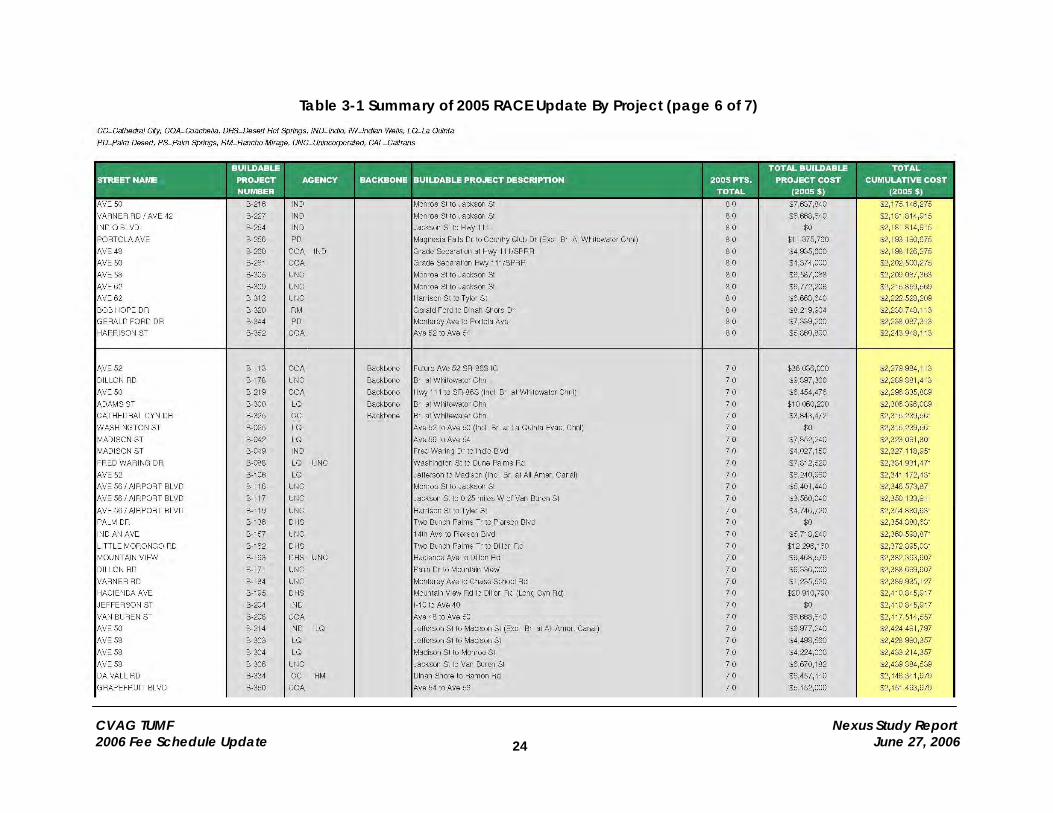
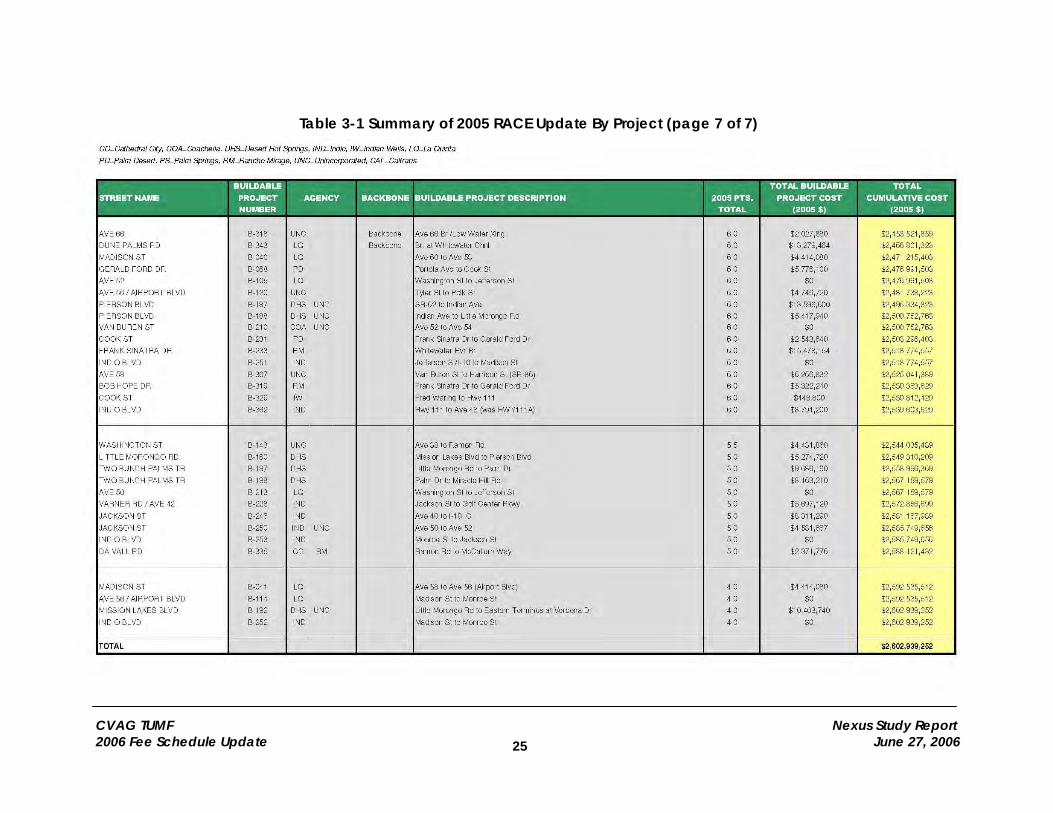
3.0 TPPS AND RACE The Transportation Project Prioritization Study (TPPS) and Regional Arterial Cost Estimate (RACE) each represent fundamental elements of CVAG’s Transportation Uniform Mitigation Fee (TUMF) program. The TPPS identifies the arterial roadway improvements necessary to sustain mobility within the Coachella Valley. The TPPS describes the set of arterial roadway improvements to be funded by the TUMF program and other regionally available funding sources (including Measure A and State Transportation Improvement Program (STIP) funds), and prioritizes the implementation of these improvements. The RACE determines the cost associated with implementing the roadway system improvements identified in the TPPS and therefore provides a core variable in the formula for calculating the fee level for the TUMF program. The TPPS and RACE are stand alone documents updated by CVAG on a regular basis. Their most recent update was conducted as a separate study in parallel to this TUMF Boundary Determination and Fee Schedule Nexus Study. The most recent revision of the TPPS and RACE, the 2005 update, was used as the basis for this Fee Schedule Nexus Study. In addition to identifying regional arterial projects to be funded, the TPPS ranks these projects based on a project score. Figure 3-1 illustrates the location and score of each project included in the TPPS. Table 3-1 lists the cost estimate for each project as developed in the RACE process. All projects included in the TPPS and RACE total $2,602,939,252. Due to the essential nature of the TPPS and RACE in establishing the TUMF nexus and associated program fee levels, it was necessary to review the assumptions and calculations of these related studies in the context of TUMF. A few main conclusions were formed in relation to the cost estimation methodology and projects included in the TPPS and RACE, as described in the sub-sections below. 3.1. Cost Estimation Methodology The review of the RACE cost estimation methodology yielded two primary conclusions:
• The RACE cost assumptions were reviewed and found to be within industry standards for the development of planning level cost estimates for a system total.
• Construction and right-of-way costs have been escalating at a rapid rate in recent years. In order to maintain accurate estimates and representative fee levels, it is recommended that the RACE and resultant TUMF fee schedule be updated annually to keep pace.
CVAG TUMF Nexus Study Report 2006 Fee Schedule Update June 27, 2006
13
Figure 3-1 Projects in the 2005 TPPS Update (page 1 of 6)
CVAG TUMF Nexus Study Report 2006 Fee Schedule Update June 27, 2006
14
Figure 3-1 Projects in the 2005 TPPS Update (page 2 of 6)
CVAG TUMF Nexus Study Report 2006 Fee Schedule Update June 27, 2006
15
Figure 3-1 Projects in the 2005 TPPS Update (page 3 of 6)
CVAG TUMF Nexus Study Report 2006 Fee Schedule Update June 27, 2006
16
Figure 3-1 Projects in the 2005 TPPS Update (page 4 of 6)
CVAG TUMF Nexus Study Report 2006 Fee Schedule Update June 27, 2006
17
Figure 3-1 Projects in the 2005 TPPS Update (page 5 of 6)
CVAG TUMF Nexus Study Report 2006 Fee Schedule Update June 27, 2006
18
Figure 3-1 Projects in the 2005 TPPS Update (page 6 of 6)
CVAG TUMF Nexus Study Report 2006 Fee Schedule Update June 27, 2006
19
Table 3-1 Summary of 2005 RACE Update By Project (page 1 of 7)
CVAG TUMF Nexus Study Report 2006 Fee Schedule Update June 27, 2006
20
Table 3-1 Summary of 2005 RACE Update By Project (page 2 of 7)
CVAG TUMF Nexus Study Report 2006 Fee Schedule Update June 27, 2006
21
Table 3-1 Summary of 2005 RACE Update By Project (page 3 of 7)
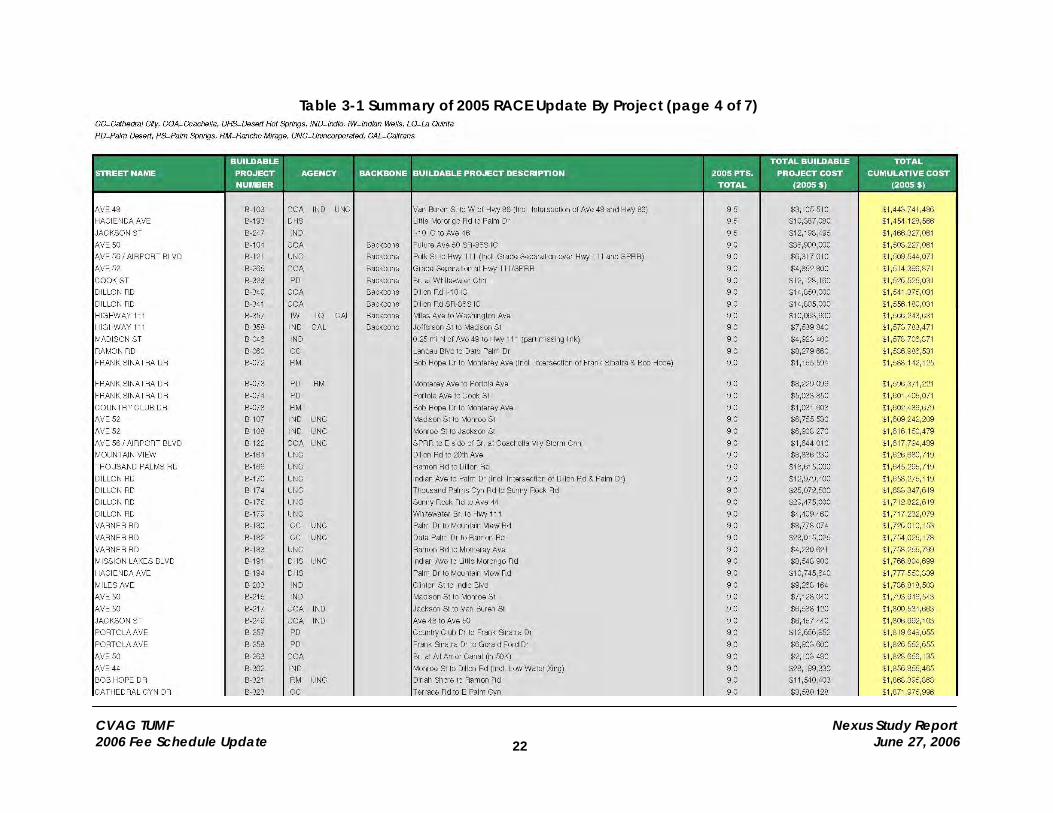
CVAG TUMF Nexus Study Report 2006 Fee Schedule Update June 27, 2006
22
Table 3-1 Summary of 2005 RACE Update By Project (page 4 of 7)
CVAG TUMF Nexus Study Report 2006 Fee Schedule Update June 27, 2006
23
Table 3-1 Summary of 2005 RACE Update By Project (page 5 of 7)
CVAG TUMF Nexus Study Report 2006 Fee Schedule Update June 27, 2006
24
Table 3-1 Summary of 2005 RACE Update By Project (page 6 of 7)
CVAG TUMF Nexus Study Report 2006 Fee Schedule Update June 27, 2006
25
Table 3-1 Summary of 2005 RACE Update By Project (page 7 of 7)
CVAG TUMF Nexus Study Report 2006 Fee Schedule Update June 27, 2006
26
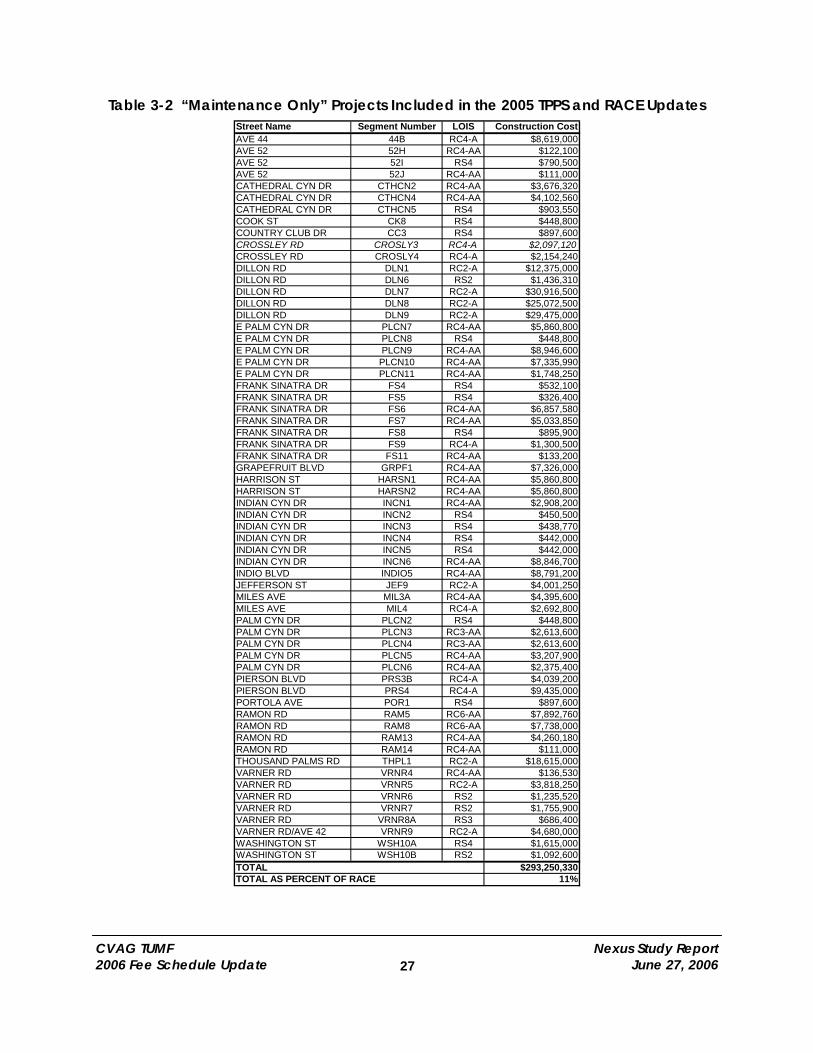
3.2. Projects Included in the TPPS and RACE In order to be consistent with California’s Mitigation Fee Act, TUMF funds should not be applied towards maintenance projects. For this reason, PB reviewed the projects included in the TPPS and RACE to determine what portion of projects could clearly be categorized as maintenance projects. Maintenance projects were identified based on the Level of Improvement Standards (LOIS) used to develop construction cost estimates in the RACE. The following LOIS appear to be purely maintenance related:
• RS2: Resurface existing 24’ (2 lanes) • RC2-A: Reconstruct existing 24’ (2 lanes). Average daily traffic less than 10,000. • RC2-AA: Reconstruct existing 24’ (2 lanes). Average daily traffic greater than
10,000. • RS3: Resurface existing 36’ (3 lanes) • RC3-A: Reconstruct existing 36’ (3 lanes). Average daily traffic less than 10,000. • RC3-AA: Reconstruct existing 36’ (3 lanes). Average daily traffic greater than
10,000. • RS4: Resurface existing 48’ (4 lanes) • RC4-A: Reconstruct existing 48’ (4 lanes). Average daily traffic less than 10,000. • RC4-AA: Reconstruct existing 48’ (4 lanes). Average daily traffic greater than
10,000. • RS6: Resurface existing 72’ (6 lanes) • RC6-A: Reconstruct existing 72’ (6 lanes). Average daily traffic less than 10,000. • RC6-AA: Reconstruct existing 72’ (6 lanes). Average daily traffic greater than
10,000. Table 3-2 lists projects, or components of projects, falling into one of the above LOIS categories. As can be seen at the bottom of the table, the construction cost components of these projects total $293,250,330, or 11% of the total RACE value of $2,602,939,252. Since this value is less than the “other funding sources” identified and factored into the TUMF Target Collections, as discussed in a later section, the inclusion of these maintenance projects in the TPPS and RACE does not raise a nexus issue.
CVAG TUMF Nexus Study Report 2006 Fee Schedule Update June 27, 2006
27
Street Name Segment Number LOIS Construction CostAVE 44 44B RC4-A $8,619,000AVE 52 52H RC4-AA $122,100AVE 52 52I RS4 $790,500AVE 52 52J RC4-AA $111,000CATHEDRAL CYN DR CTHCN2 RC4-AA $3,676,320CATHEDRAL CYN DR CTHCN4 RC4-AA $4,102,560CATHEDRAL CYN DR CTHCN5 RS4 $903,550COOK ST CK8 RS4 $448,800COUNTRY CLUB DR CC3 RS4 $897,600CROSSLEY RD CROSLY3 RC4-A $2,097,120CROSSLEY RD CROSLY4 RC4-A $2,154,240DILLON RD DLN1 RC2-A $12,375,000DILLON RD DLN6 RS2 $1,436,310DILLON RD DLN7 RC2-A $30,916,500DILLON RD DLN8 RC2-A $25,072,500DILLON RD DLN9 RC2-A $29,475,000E PALM CYN DR PLCN7 RC4-AA $5,860,800E PALM CYN DR PLCN8 RS4 $448,800E PALM CYN DR PLCN9 RC4-AA $8,946,600E PALM CYN DR PLCN10 RC4-AA $7,335,990E PALM CYN DR PLCN11 RC4-AA $1,748,250FRANK SINATRA DR FS4 RS4 $532,100FRANK SINATRA DR FS5 RS4 $326,400FRANK SINATRA DR FS6 RC4-AA $6,857,580FRANK SINATRA DR FS7 RC4-AA $5,033,850FRANK SINATRA DR FS8 RS4 $895,900FRANK SINATRA DR FS9 RC4-A $1,300,500FRANK SINATRA DR FS11 RC4-AA $133,200GRAPEFRUIT BLVD GRPF1 RC4-AA $7,326,000HARRISON ST HARSN1 RC4-AA $5,860,800HARRISON ST HARSN2 RC4-AA $5,860,800INDIAN CYN DR INCN1 RC4-AA $2,908,200INDIAN CYN DR INCN2 RS4 $450,500INDIAN CYN DR INCN3 RS4 $438,770INDIAN CYN DR INCN4 RS4 $442,000INDIAN CYN DR INCN5 RS4 $442,000INDIAN CYN DR INCN6 RC4-AA $8,846,700INDIO BLVD INDIO5 RC4-AA $8,791,200JEFFERSON ST JEF9 RC2-A $4,001,250MILES AVE MIL3A RC4-AA $4,395,600MILES AVE MIL4 RC4-A $2,692,800PALM CYN DR PLCN2 RS4 $448,800PALM CYN DR PLCN3 RC3-AA $2,613,600PALM CYN DR PLCN4 RC3-AA $2,613,600PALM CYN DR PLCN5 RC4-AA $3,207,900PALM CYN DR PLCN6 RC4-AA $2,375,400PIERSON BLVD PRS3B RC4-A $4,039,200PIERSON BLVD PRS4 RC4-A $9,435,000PORTOLA AVE POR1 RS4 $897,600RAMON RD RAM5 RC6-AA $7,892,760RAMON RD RAM8 RC6-AA $7,738,000RAMON RD RAM13 RC4-AA $4,260,180RAMON RD RAM14 RC4-AA $111,000THOUSAND PALMS RD THPL1 RC2-A $18,615,000VARNER RD VRNR4 RC4-AA $136,530VARNER RD VRNR5 RC2-A $3,818,250VARNER RD VRNR6 RS2 $1,235,520VARNER RD VRNR7 RS2 $1,755,900VARNER RD VRNR8A RS3 $686,400VARNER RD/AVE 42 VRNR9 RC2-A $4,680,000WASHINGTON ST WSH10A RS4 $1,615,000WASHINGTON ST WSH10B RS2 $1,092,600TOTAL $293,250,330TOTAL AS PERCENT OF RACE 11%
Table 3-2 “Maintenance Only” Projects Included in the 2005 TPPS and RACE Updates
CVAG TUMF Nexus Study Report 2006 Fee Schedule Update June 27, 2006
28
4.0 TRAFFIC GROWTH ATTRIBUTABLE TO NEW DEVELOPMENT Traffic growth attributable to new development in the CVAG TUMF Collection Area is one of the two inputs which determine the TUMF Fee Schedule. Simply put, the TUMF collection target, described in a later section, is divided by the estimated traffic growth to develop the TUMF fee per trip. Section 4.1 describes the methodology used to estimate traffic growth. The current TUMF Fee Schedule has three rate categories: residential, retail, and non-retail or hotel. The fee for each land-use category is based on the portion of future growth attributable to each of these land-use categories. As a policy assumption, the current TUMF Fee Schedule reassigns 60% of trip growth attributable to retail to the residential category. The 60% factor was a policy decision made during the initial TUMF Nexus Study and ordinance development process. The 60% factor was reevaluated based on data from the newly updated CVATS Model and CVAG Origin-Destination Survey. Section 4.2 describes this analysis and presents the revised factor. 4.1. Determining Traffic Growth The Coachella Valley Area Transportation Study (CVATS) Model provided the most comprehensive forecast of traffic growth in the CVAG TUMF Collection Area. A model update was in process at the time of this study, and was sufficiently advanced to provide estimates of future traffic growth. Using the CVATS Model, traffic growth attributable to new development inside the TUMF Collection Area was estimated as follows:
• Trip growth as forecasted by the CVATS Model was determined (Section 4.1.2) • CVATS Model forecasts were converted to project level forecasts (Section 4.1.3)
4.1.1. Background on CVATS Model The CVATS Model provides the best available quantitative estimate of travel occurring and expected to occur in the CVAG region. It is based upon estimates of socioeconomic and land use characteristics. CVAG and the Southern California Association of Governments (SCAG) maintain it jointly. The CVATS modeling area includes nine cities and neighboring unincorporated areas of Riverside County. The nine cities included in the CVATS modeling area are Desert Hot Springs, Palm Springs, Cathedral City, Rancho Mirage, Palm Desert, Indian Wells, La Quinta, Indio, and Coachella. The CVATS modeling area is divided up into numerous transportation analysis zones (TAZs) which provide the spatial unit (or geographical area) within which travel behavior and traffic generation are estimated. Most TAZs cover the “internal” CVATS modeling area, while eight of them are cordons covering the area “external” to the
CVAG TUMF Nexus Study Report 2006 Fee Schedule Update June 27, 2006
29
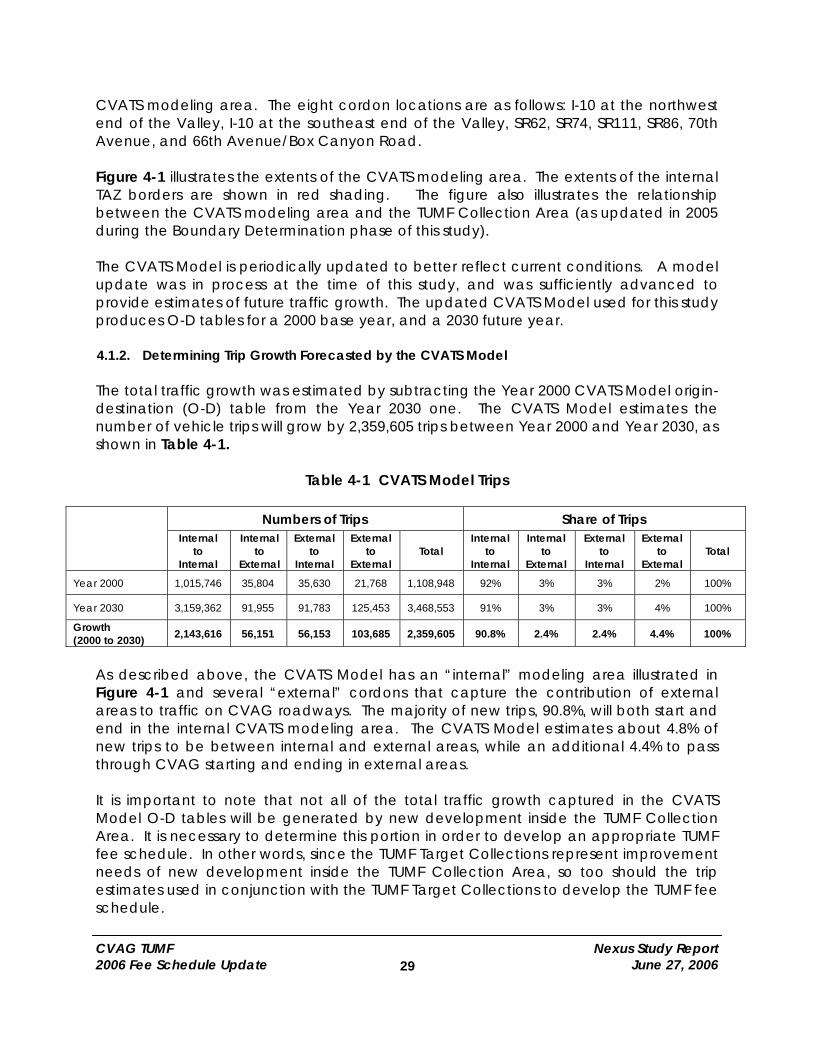
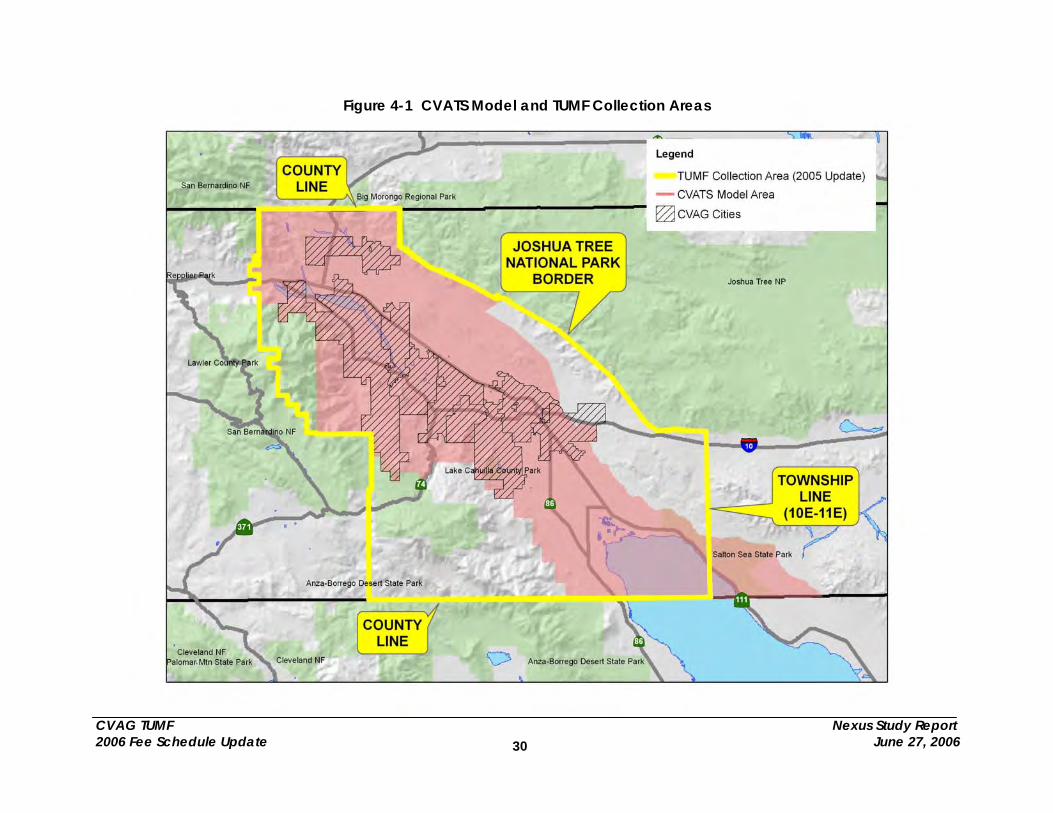
CVATS modeling area. The eight cordon locations are as follows: I-10 at the northwest end of the Valley, I-10 at the southeast end of the Valley, SR62, SR74, SR111, SR86, 70th Avenue, and 66th Avenue/Box Canyon Road. Figure 4-1 illustrates the extents of the CVATS modeling area. The extents of the internal TAZ borders are shown in red shading. The figure also illustrates the relationship between the CVATS modeling area and the TUMF Collection Area (as updated in 2005 during the Boundary Determination phase of this study). The CVATS Model is periodically updated to better reflect current conditions. A model update was in process at the time of this study, and was sufficiently advanced to provide estimates of future traffic growth. The updated CVATS Model used for this study produces O-D tables for a 2000 base year, and a 2030 future year. 4.1.2. Determining Trip Growth Forecasted by the CVATS Model The total traffic growth was estimated by subtracting the Year 2000 CVATS Model origin-destination (O-D) table from the Year 2030 one. The CVATS Model estimates the number of vehicle trips will grow by 2,359,605 trips between Year 2000 and Year 2030, as shown in Table 4-1.
Table 4-1 CVATS Model Trips
Numbers of Trips Share of Trips Internal
to Internal
Internal to
External
External to
Internal
External to
External Total
Internal to
Internal
Internal to
External
External to
Internal
External to
External Total
Year 2000 1,015,746 35,804 35,630 21,768 1,108,948 92% 3% 3% 2% 100%
Year 2030 3,159,362 91,955 91,783 125,453 3,468,553 91% 3% 3% 4% 100%
Growth (2000 to 2030) 2,143,616 56,151 56,153 103,685 2,359,605 90.8% 2.4% 2.4% 4.4% 100%
As described above, the CVATS Model has an “internal” modeling area illustrated in Figure 4-1 and several “external” cordons that capture the contribution of external areas to traffic on CVAG roadways. The majority of new trips, 90.8%, will both start and end in the internal CVATS modeling area. The CVATS Model estimates about 4.8% of new trips to be between internal and external areas, while an additional 4.4% to pass through CVAG starting and ending in external areas. It is important to note that not all of the total traffic growth captured in the CVATS Model O-D tables will be generated by new development inside the TUMF Collection Area. It is necessary to determine this portion in order to develop an appropriate TUMF fee schedule. In other words, since the TUMF Target Collections represent improvement needs of new development inside the TUMF Collection Area, so too should the trip estimates used in conjunction with the TUMF Target Collections to develop the TUMF fee schedule.
CVAG TUMF Nexus Study Report 2006 Fee Schedule Update June 27, 2006
30
Figure 4-1 CVATS Model and TUMF Collection Areas
CVAG TUMF Nexus Study Report 2006 Fee Schedule Update June 27, 2006
31
Figure 4-1, illustrating the correspondence between the CVATS modeling area and the TUMF Collection Area, is a key tool in isolating this portion attributable to new development inside the TUMF Collection Area. As can be seen in the figure, the CVATS internal zones roughly correspond to the CVAG TUMF Collection Area, while the CVATS external zones do not. Thus, the portion of traffic growth attributable to new development inside the CVAG TUMF Collection Area includes only those trip ends located in one of the internal CVATS zones. In other words the portion consists of both trip ends of the “internal to internal” trips and only the internal trip end of the “internal to external” and “external to internal” trips. This results in 2,143,616 plus half of 56,151 and 56,153 trips, or a total of 2,199,768 trips attributable to new development inside the TUMF Collection Area. 4.1.3. Converting Model Forecasts to Project Level Forecasts The next step in developing the necessary input for the TUMF fee calculation, was converting the number of model forecasts into trip ends or project level forecasts in order to be consistent with the TUMF implementation process. Model forecasts correspond to the total number of trips generated in the modeling region. Project level forecasts are computed for a specific development typically using trip generation rates from the Institute of Transportation Engineers (ITE) Trip Generation manual or another source. The CVAG TUMF program is implemented by computing a given development’s fee obligation as follows: the fee rate is multiplied by the specific development’s trip generation rate as prescribed in the ITE Trip Generation manual to yield the fee obligation for that particular trip end. Since fees are assessed on new development that could represent either end of a model forecast trip, it follows that the fee rate should be set based on trip end or project level forecasts. The total project level forecasts for a region are about twice the model level forecasts since project level forecasts are computed for each of the two trip ends of a model trip. This can best be understood with an example. Consider a trip made from someone’s home to their office. The model would count this as one trip. However, the sum of the project level trip generation for the house and the project level trip generation for the office would equal two trips (i.e. one at the house end and one at the office end). Applying this simple one to two relationship between model and project forecasts, it follows that two times 2,199,768, or 4,399,536, project level trips are attributable to new development in the TUMF Collection Area. 4.2. Fee Category Share of New Trips The current TUMF Fee Schedule has three land use categories utilized to determine the fee rate:
• Residential • Retail • Non-retail or Hotel
CVAG TUMF Nexus Study Report 2006 Fee Schedule Update June 27, 2006
32
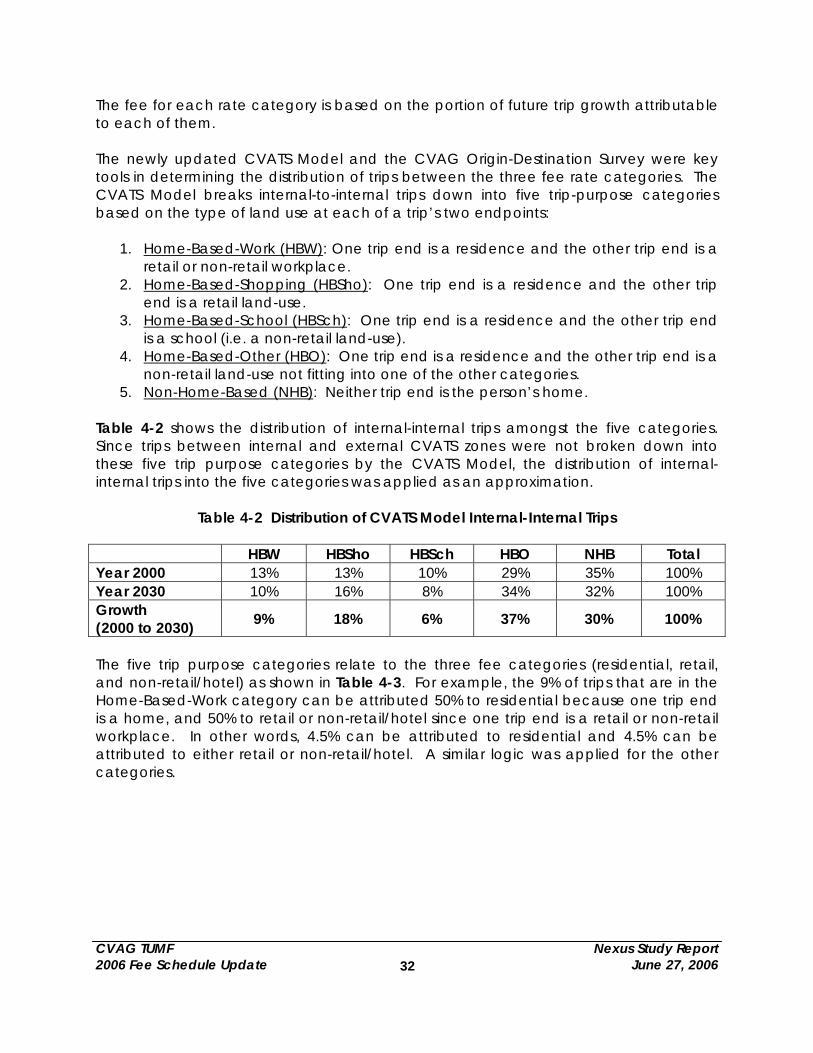
The fee for each rate category is based on the portion of future trip growth attributable to each of them. The newly updated CVATS Model and the CVAG Origin-Destination Survey were key tools in determining the distribution of trips between the three fee rate categories. The CVATS Model breaks internal-to-internal trips down into five trip-purpose categories based on the type of land use at each of a trip’s two endpoints:
1. Home-Based-Work (HBW): One trip end is a residence and the other trip end is a retail or non-retail workplace.
2. Home-Based-Shopping (HBSho): One trip end is a residence and the other trip end is a retail land-use.
3. Home-Based-School (HBSch): One trip end is a residence and the other trip end is a school (i.e. a non-retail land-use).
4. Home-Based-Other (HBO): One trip end is a residence and the other trip end is a non-retail land-use not fitting into one of the other categories.
5. Non-Home-Based (NHB): Neither trip end is the person’s home. Table 4-2 shows the distribution of internal-internal trips amongst the five categories. Since trips between internal and external CVATS zones were not broken down into these five trip purpose categories by the CVATS Model, the distribution of internal-internal trips into the five categories was applied as an approximation.
Table 4-2 Distribution of CVATS Model Internal-Internal Trips HBW HBSho HBSch HBO NHB Total Year 2000 13% 13% 10% 29% 35% 100% Year 2030 10% 16% 8% 34% 32% 100% Growth (2000 to 2030) 9% 18% 6% 37% 30% 100%
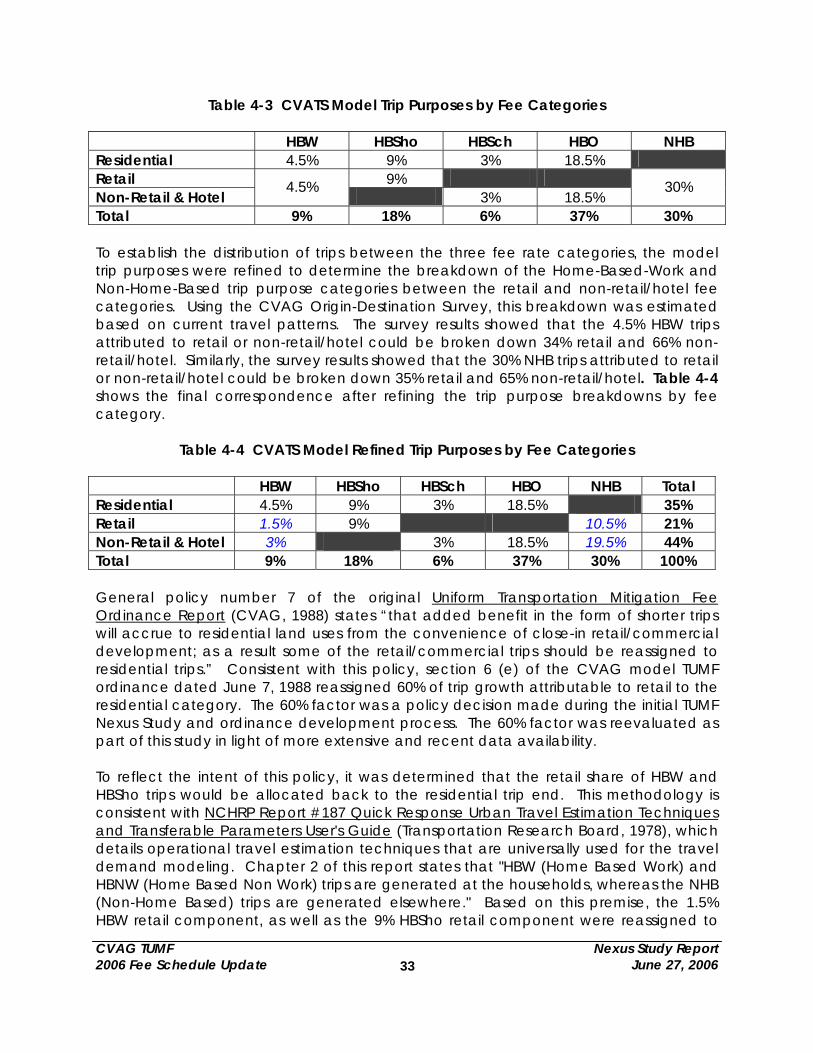
The five trip purpose categories relate to the three fee categories (residential, retail, and non-retail/hotel) as shown in Table 4-3. For example, the 9% of trips that are in the Home-Based-Work category can be attributed 50% to residential because one trip end is a home, and 50% to retail or non-retail/hotel since one trip end is a retail or non-retail workplace. In other words, 4.5% can be attributed to residential and 4.5% can be attributed to either retail or non-retail/hotel. A similar logic was applied for the other categories.
CVAG TUMF Nexus Study Report 2006 Fee Schedule Update June 27, 2006
33
Table 4-3 CVATS Model Trip Purposes by Fee Categories HBW HBSho HBSch HBO NHB Residential 4.5% 9% 3% 18.5% Retail 9% Non-Retail & Hotel
4.5% 3% 18.5% 30%
Total 9% 18% 6% 37% 30% To establish the distribution of trips between the three fee rate categories, the model trip purposes were refined to determine the breakdown of the Home-Based-Work and Non-Home-Based trip purpose categories between the retail and non-retail/hotel fee categories. Using the CVAG Origin-Destination Survey, this breakdown was estimated based on current travel patterns. The survey results showed that the 4.5% HBW trips attributed to retail or non-retail/hotel could be broken down 34% retail and 66% non-retail/hotel. Similarly, the survey results showed that the 30% NHB trips attributed to retail or non-retail/hotel could be broken down 35% retail and 65% non-retail/hotel. Table 4-4 shows the final correspondence after refining the trip purpose breakdowns by fee category.
Table 4-4 CVATS Model Refined Trip Purposes by Fee Categories HBW HBSho HBSch HBO NHB Total Residential 4.5% 9% 3% 18.5% 35% Retail 1.5% 9% 10.5% 21% Non-Retail & Hotel 3% 3% 18.5% 19.5% 44% Total 9% 18% 6% 37% 30% 100% General policy number 7 of the original Uniform Transportation Mitigation Fee Ordinance Report (CVAG, 1988) states “that added benefit in the form of shorter trips will accrue to residential land uses from the convenience of close-in retail/commercial development; as a result some of the retail/commercial trips should be reassigned to residential trips.” Consistent with this policy, section 6 (e) of the CVAG model TUMF ordinance dated June 7, 1988 reassigned 60% of trip growth attributable to retail to the residential category. The 60% factor was a policy decision made during the initial TUMF Nexus Study and ordinance development process. The 60% factor was reevaluated as part of this study in light of more extensive and recent data availability. To reflect the intent of this policy, it was determined that the retail share of HBW and HBSho trips would be allocated back to the residential trip end. This methodology is consistent with NCHRP Report #187 Quick Response Urban Travel Estimation Techniques and Transferable Parameters User's Guide (Transportation Research Board, 1978), which details operational travel estimation techniques that are universally used for the travel demand modeling. Chapter 2 of this report states that "HBW (Home Based Work) and HBNW (Home Based Non Work) trips are generated at the households, whereas the NHB (Non-Home Based) trips are generated elsewhere." Based on this premise, the 1.5% HBW retail component, as well as the 9% HBSho retail component were reassigned to
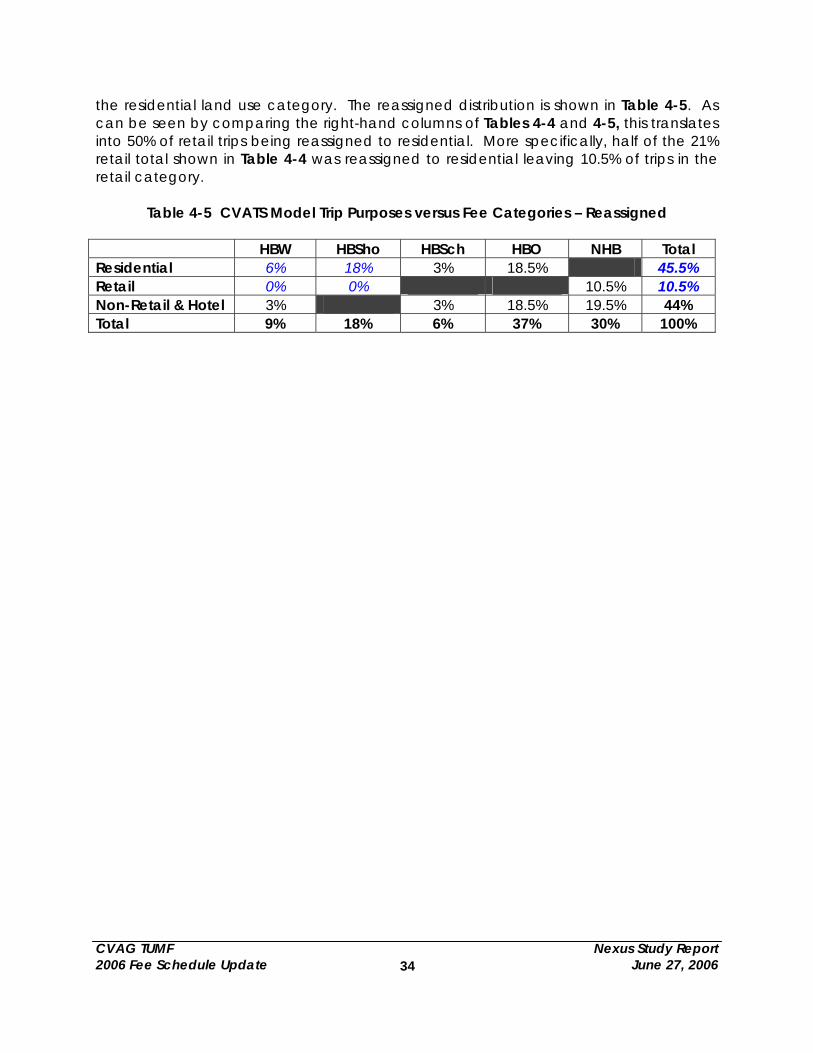
CVAG TUMF Nexus Study Report 2006 Fee Schedule Update June 27, 2006
34
the residential land use category. The reassigned distribution is shown in Table 4-5. As can be seen by comparing the right-hand columns of Tables 4-4 and 4-5, this translates into 50% of retail trips being reassigned to residential. More specifically, half of the 21% retail total shown in Table 4-4 was reassigned to residential leaving 10.5% of trips in the retail category.
Table 4-5 CVATS Model Trip Purposes versus Fee Categories – Reassigned HBW HBSho HBSch HBO NHB Total Residential 6% 18% 3% 18.5% 45.5% Retail 0% 0% 10.5% 10.5% Non-Retail & Hotel 3% 3% 18.5% 19.5% 44% Total 9% 18% 6% 37% 30% 100%
CVAG TUMF Nexus Study Report 2006 Fee Schedule Update June 27, 2006
35
5.0 TUMF COLLECTION TARGET Based on the TPPS and RACE document described in Section 3.0, the total value of needed improvements to the arterial street system in Coachella Valley exceeds $2.6 billion. However, only a portion of this amount can be attributed to improvement needs necessary to mitigate the cumulative regional transportation impacts of new development. Some of the improvements identified in the TPPS address existing transportation needs that have not been caused by the impact of new development (although new development may exacerbate the existing need). Other projects in the TPPS are for maintenance purpose only and therefore do not directly mitigate the impacts of new development. The availability of other funding sources to address existing needs and maintenance projects in addition to future capacity expansion can offset the share of improvement needs that are attributable to new development and obligated through the payment of TUMF. Developer dedications as a condition of development approvals can also result in the completion of improvements identified in the TPPS further reducing the share of the RACE allocable to the TUMF. This section of the Nexus Report will quantify the share of the arterial improvement costs that will likely be satisfied by other available funding sources and developer dedications. By accounting for the use of other funding sources to help address existing needs and roadway maintenance, and the share of the TPPS that is likely to be accomplished through developer dedications, it is possible to establish the TUMF collection target which is the rough proportion of the RACE that will be assessed through the payment of TUMF. 5.1. Other Funding Sources Section 6 (a) of the CVAG model TUMF ordinance dated June 7, 1988 prescribes that “the Uniform Transportation Mitigation Fee proceeds shall not exceed the unfunded portion of the construction cost of the regional system…” Section 6 (b) further clarifies that “the Uniform Transportation Mitigation fee is not intended to be the sole source of funding for the construction of the Regional System.” Consistent with Section 6 (c) of the model ordinance, the original TUMF collection target was adjusted by 50% to account for other funding sources that would be used to implement the regional system improvements. The 50% other funding level was considered to adequately account for existing needs and other funding sources but was not quantified as part of the Nexus determination. Section 6 (c) of the model ordinance indicates that “this share may change, however, as future revisions are made to the fees.” For the purpose of this update, it was determined that an estimate of the other revenue sources expected to be available for implementation of the regional system would be used as the basis for adjusting the TUMF collection target to address other funding.
CVAG TUMF Nexus Study Report 2006 Fee Schedule Update June 27, 2006
36
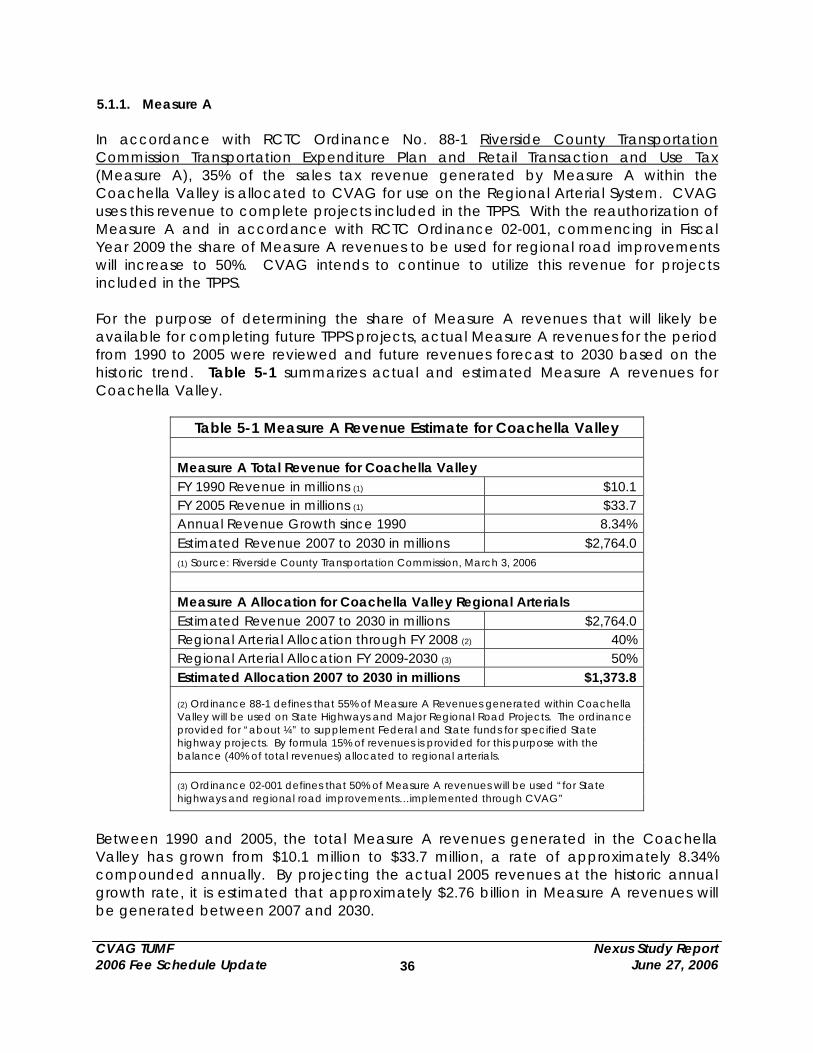
5.1.1. Measure A In accordance with RCTC Ordinance No. 88-1 Riverside County Transportation Commission Transportation Expenditure Plan and Retail Transaction and Use Tax (Measure A), 35% of the sales tax revenue generated by Measure A within the Coachella Valley is allocated to CVAG for use on the Regional Arterial System. CVAG uses this revenue to complete projects included in the TPPS. With the reauthorization of Measure A and in accordance with RCTC Ordinance 02-001, commencing in Fiscal Year 2009 the share of Measure A revenues to be used for regional road improvements will increase to 50%. CVAG intends to continue to utilize this revenue for projects included in the TPPS. For the purpose of determining the share of Measure A revenues that will likely be available for completing future TPPS projects, actual Measure A revenues for the period from 1990 to 2005 were reviewed and future revenues forecast to 2030 based on the historic trend. Table 5-1 summarizes actual and estimated Measure A revenues for Coachella Valley.
Table 5-1 Measure A Revenue Estimate for Coachella Valley Measure A Total Revenue for Coachella Valley FY 1990 Revenue in millions (1) $10.1 FY 2005 Revenue in millions (1) $33.7 Annual Revenue Growth since 1990 8.34% Estimated Revenue 2007 to 2030 in millions $2,764.0 (1) Source: Riverside County Transportation Commission, March 3, 2006
Measure A Allocation for Coachella Valley Regional Arterials Estimated Revenue 2007 to 2030 in millions $2,764.0 Regional Arterial Allocation through FY 2008 (2) 40% Regional Arterial Allocation FY 2009-2030 (3) 50% Estimated Allocation 2007 to 2030 in millions $1,373.8
(2) Ordinance 88-1 defines that 55% of Measure A Revenues generated within Coachella Valley will be used on State Highways and Major Regional Road Projects. The ordinance provided for “about ¼” to supplement Federal and State funds for specified State highway projects. By formula 15% of revenues is provided for this purpose with the balance (40% of total revenues) allocated to regional arterials.
(3) Ordinance 02-001 defines that 50% of Measure A revenues will be used “for State highways and regional road improvements…implemented through CVAG”
Between 1990 and 2005, the total Measure A revenues generated in the Coachella Valley has grown from $10.1 million to $33.7 million, a rate of approximately 8.34% compounded annually. By projecting the actual 2005 revenues at the historic annual growth rate, it is estimated that approximately $2.76 billion in Measure A revenues will be generated between 2007 and 2030.
CVAG TUMF Nexus Study Report 2006 Fee Schedule Update June 27, 2006
37
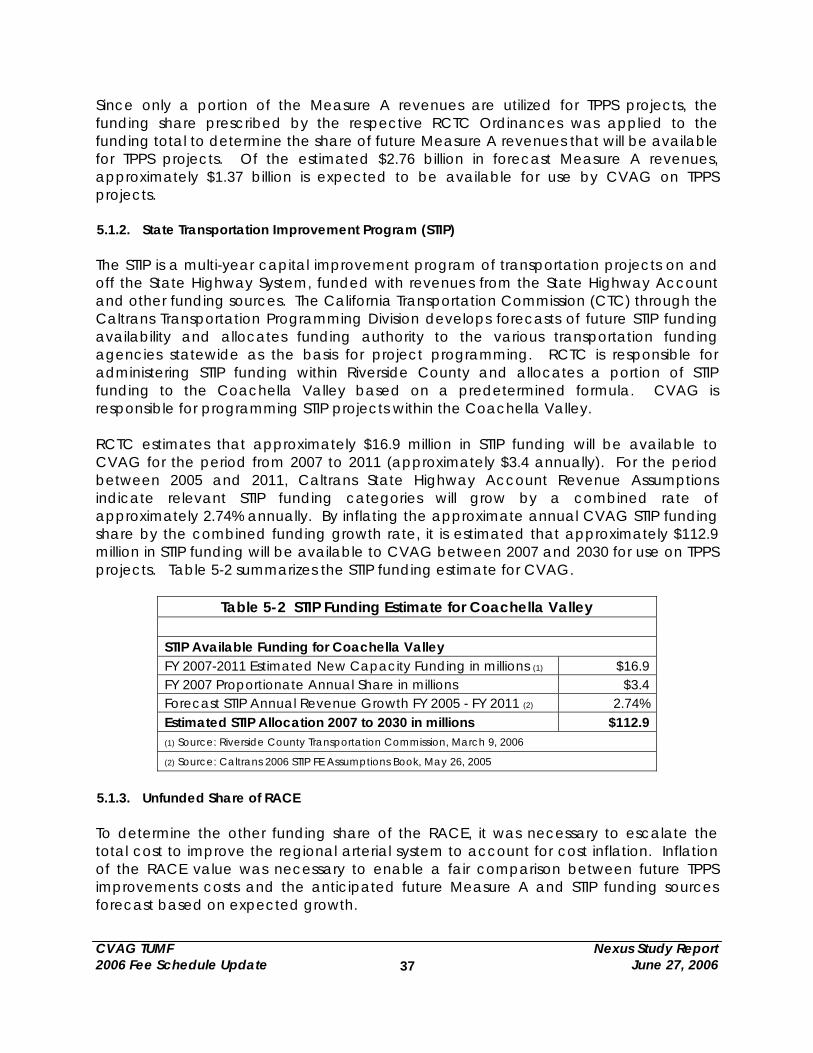
Since only a portion of the Measure A revenues are utilized for TPPS projects, the funding share prescribed by the respective RCTC Ordinances was applied to the funding total to determine the share of future Measure A revenues that will be available for TPPS projects. Of the estimated $2.76 billion in forecast Measure A revenues, approximately $1.37 billion is expected to be available for use by CVAG on TPPS projects. 5.1.2. State Transportation Improvement Program (STIP) The STIP is a multi-year capital improvement program of transportation projects on and off the State Highway System, funded with revenues from the State Highway Account and other funding sources. The California Transportation Commission (CTC) through the Caltrans Transportation Programming Division develops forecasts of future STIP funding availability and allocates funding authority to the various transportation funding agencies statewide as the basis for project programming. RCTC is responsible for administering STIP funding within Riverside County and allocates a portion of STIP funding to the Coachella Valley based on a predetermined formula. CVAG is responsible for programming STIP projects within the Coachella Valley. RCTC estimates that approximately $16.9 million in STIP funding will be available to CVAG for the period from 2007 to 2011 (approximately $3.4 annually). For the period between 2005 and 2011, Caltrans State Highway Account Revenue Assumptions indicate relevant STIP funding categories will grow by a combined rate of approximately 2.74% annually. By inflating the approximate annual CVAG STIP funding share by the combined funding growth rate, it is estimated that approximately $112.9 million in STIP funding will be available to CVAG between 2007 and 2030 for use on TPPS projects. Table 5-2 summarizes the STIP funding estimate for CVAG.
Table 5-2 STIP Funding Estimate for Coachella Valley STIP Available Funding for Coachella Valley FY 2007-2011 Estimated New Capacity Funding in millions (1) $16.9 FY 2007 Proportionate Annual Share in millions $3.4 Forecast STIP Annual Revenue Growth FY 2005 - FY 2011 (2) 2.74% Estimated STIP Allocation 2007 to 2030 in millions $112.9 (1) Source: Riverside County Transportation Commission, March 9, 2006
(2) Source: Caltrans 2006 STIP FE Assumptions Book, May 26, 2005
5.1.3. Unfunded Share of RACE To determine the other funding share of the RACE, it was necessary to escalate the total cost to improve the regional arterial system to account for cost inflation. Inflation of the RACE value was necessary to enable a fair comparison between future TPPS improvements costs and the anticipated future Measure A and STIP funding sources forecast based on expected growth.
CVAG TUMF Nexus Study Report 2006 Fee Schedule Update June 27, 2006
38
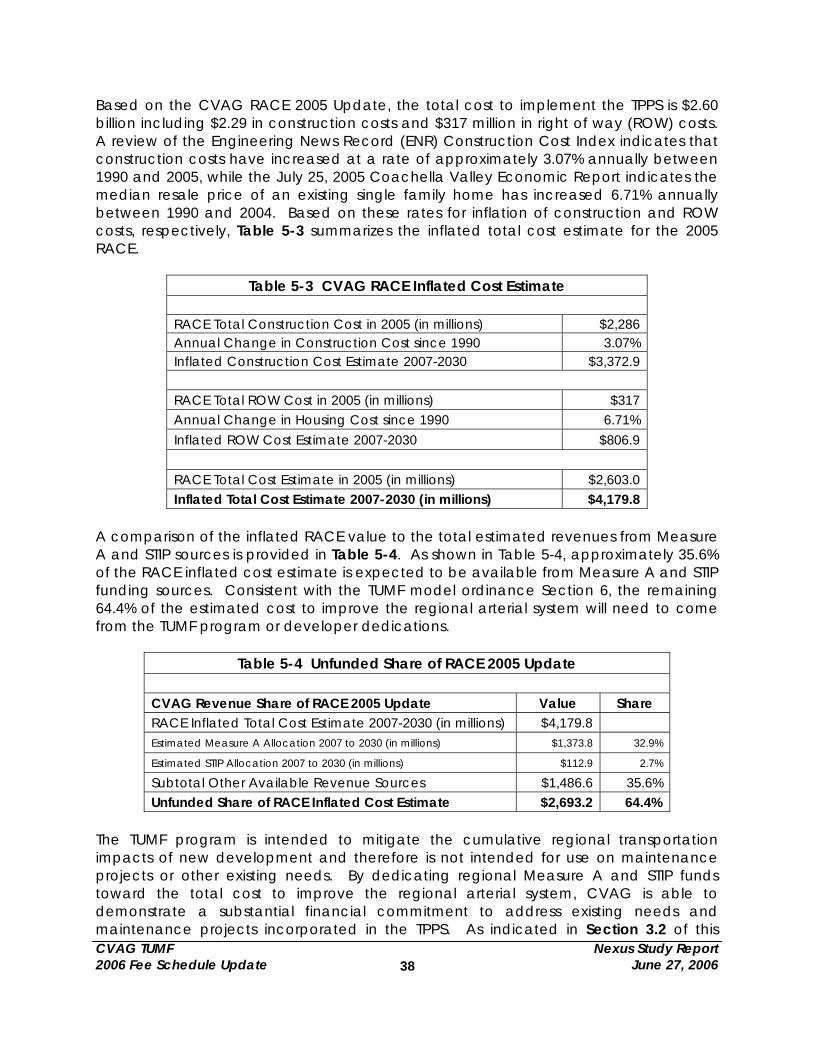
Based on the CVAG RACE 2005 Update, the total cost to implement the TPPS is $2.60 billion including $2.29 in construction costs and $317 million in right of way (ROW) costs. A review of the Engineering News Record (ENR) Construction Cost Index indicates that construction costs have increased at a rate of approximately 3.07% annually between 1990 and 2005, while the July 25, 2005 Coachella Valley Economic Report indicates the median resale price of an existing single family home has increased 6.71% annually between 1990 and 2004. Based on these rates for inflation of construction and ROW costs, respectively, Table 5-3 summarizes the inflated total cost estimate for the 2005 RACE.
Table 5-3 CVAG RACE Inflated Cost Estimate RACE Total Construction Cost in 2005 (in millions) $2,286 Annual Change in Construction Cost since 1990 3.07% Inflated Construction Cost Estimate 2007-2030 $3,372.9
RACE Total ROW Cost in 2005 (in millions) $317 Annual Change in Housing Cost since 1990 6.71% Inflated ROW Cost Estimate 2007-2030 $806.9
RACE Total Cost Estimate in 2005 (in millions) $2,603.0 Inflated Total Cost Estimate 2007-2030 (in millions) $4,179.8
A comparison of the inflated RACE value to the total estimated revenues from Measure A and STIP sources is provided in Table 5-4. As shown in Table 5-4, approximately 35.6% of the RACE inflated cost estimate is expected to be available from Measure A and STIP funding sources. Consistent with the TUMF model ordinance Section 6, the remaining 64.4% of the estimated cost to improve the regional arterial system will need to come from the TUMF program or developer dedications.
Table 5-4 Unfunded Share of RACE 2005 Update CVAG Revenue Share of RACE 2005 Update Value Share RACE Inflated Total Cost Estimate 2007-2030 (in millions) $4,179.8 Estimated Measure A Allocation 2007 to 2030 (in millions) $1,373.8 32.9%
Estimated STIP Allocation 2007 to 2030 (in millions) $112.9 2.7%
Subtotal Other Available Revenue Sources $1,486.6 35.6% Unfunded Share of RACE Inflated Cost Estimate $2,693.2 64.4%
The TUMF program is intended to mitigate the cumulative regional transportation impacts of new development and therefore is not intended for use on maintenance projects or other existing needs. By dedicating regional Measure A and STIP funds toward the total cost to improve the regional arterial system, CVAG is able to demonstrate a substantial financial commitment to address existing needs and maintenance projects incorporated in the TPPS. As indicated in Section 3.2 of this
CVAG TUMF Nexus Study Report 2006 Fee Schedule Update June 27, 2006
39
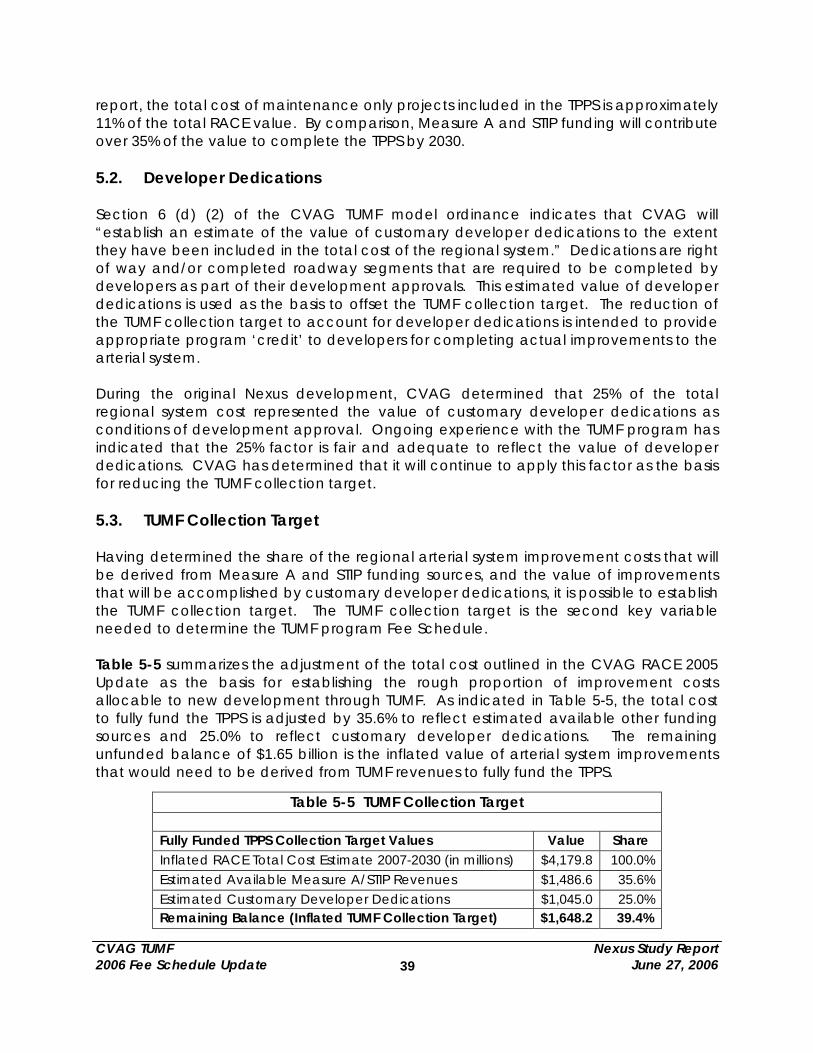
report, the total cost of maintenance only projects included in the TPPS is approximately 11% of the total RACE value. By comparison, Measure A and STIP funding will contribute over 35% of the value to complete the TPPS by 2030. 5.2. Developer Dedications Section 6 (d) (2) of the CVAG TUMF model ordinance indicates that CVAG will “establish an estimate of the value of customary developer dedications to the extent they have been included in the total cost of the regional system.” Dedications are right of way and/or completed roadway segments that are required to be completed by developers as part of their development approvals. This estimated value of developer dedications is used as the basis to offset the TUMF collection target. The reduction of the TUMF collection target to account for developer dedications is intended to provide appropriate program ‘credit’ to developers for completing actual improvements to the arterial system. During the original Nexus development, CVAG determined that 25% of the total regional system cost represented the value of customary developer dedications as conditions of development approval. Ongoing experience with the TUMF program has indicated that the 25% factor is fair and adequate to reflect the value of developer dedications. CVAG has determined that it will continue to apply this factor as the basis for reducing the TUMF collection target. 5.3. TUMF Collection Target Having determined the share of the regional arterial system improvement costs that will be derived from Measure A and STIP funding sources, and the value of improvements that will be accomplished by customary developer dedications, it is possible to establish the TUMF collection target. The TUMF collection target is the second key variable needed to determine the TUMF program Fee Schedule. Table 5-5 summarizes the adjustment of the total cost outlined in the CVAG RACE 2005 Update as the basis for establishing the rough proportion of improvement costs allocable to new development through TUMF. As indicated in Table 5-5, the total cost to fully fund the TPPS is adjusted by 35.6% to reflect estimated available other funding sources and 25.0% to reflect customary developer dedications. The remaining unfunded balance of $1.65 billion is the inflated value of arterial system improvements that would need to be derived from TUMF revenues to fully fund the TPPS.
Table 5-5 TUMF Collection Target
Fully Funded TPPS Collection Target Values Value Share Inflated RACE Total Cost Estimate 2007-2030 (in millions) $4,179.8 100.0% Estimated Available Measure A/STIP Revenues $1,486.6 35.6% Estimated Customary Developer Dedications $1,045.0 25.0% Remaining Balance (Inflated TUMF Collection Target) $1,648.2 39.4%
CVAG TUMF Nexus Study Report 2006 Fee Schedule Update June 27, 2006
40
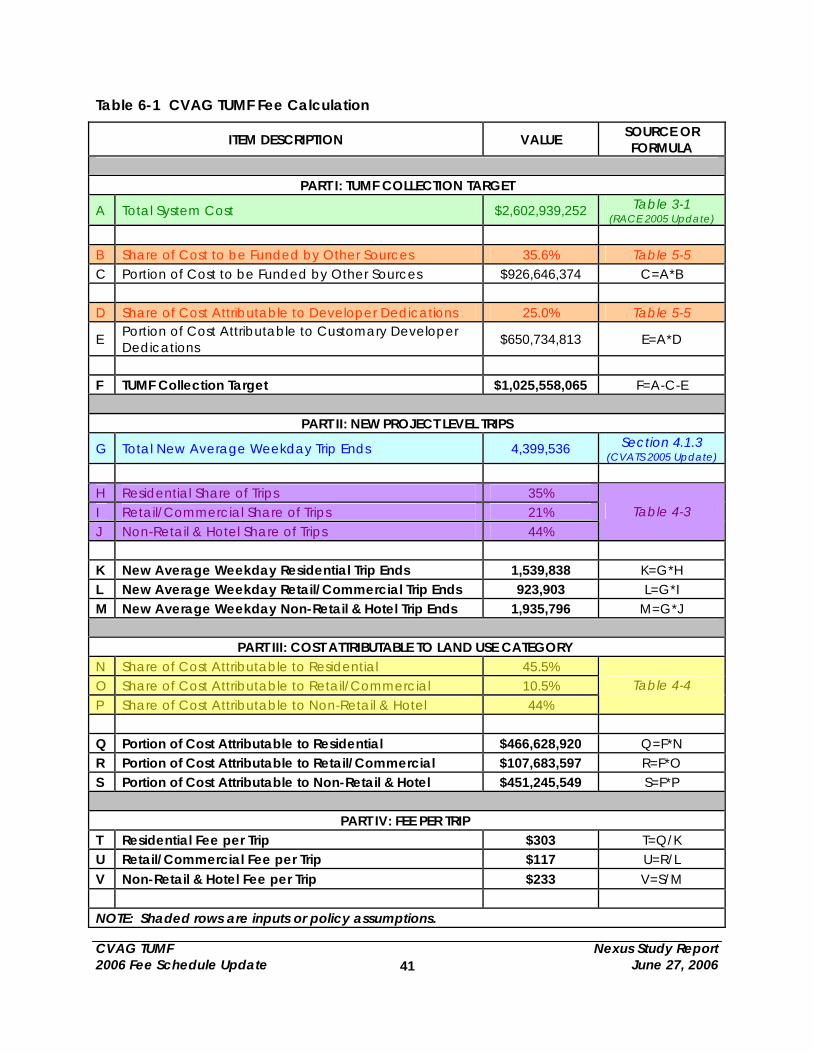
6.0 FEE CALCULATION The fee amounts that will need to be collected to mitigate the cumulative regional impacts of new development on the arterial street system in the Coachella Valley are quantified in this section. The calculation of the TUMF program fees follows the basic methodology that was utilized to establish the original fee schedule in 1988 yielding a fee per trip for three land use categories. As described in Section 3.0, the total present day cost to fully implement the TPPS (as presented in the RACE) is $2.60 billion. For the purpose of calculating the fee, the total RACE value is adjusted to reflect the availability of other funding sources and the value of customary developer dedications. Having accounted for other funding sources and developer dedications in Section 5.0, the share of the total RACE value that will be attributed to new development is 39.4%. At this level, the TUMF collection target to fully fund the implementation of the TPPS is approximately $1.03 billion in present day dollars. The total trips resulting from new development are divided between the three fee land use categories in the next step of the fee calculation. Based on the distribution of trips by purpose obtained from the CVATS model, it was determined that 35% of the new trips would have a residential based trip end, while 21% would have a retail/commercial trip end and 44% would have a non-retail or hotel trip end. The resultant trip values are used as the denominator in the equation to determine the respective fee levels per trip for each land use category. The numerator for the final fee calculation is the share of the TUMF collection target that is considered to be attributable to the particular land use category. As described previously, CVAG policy establishes that the added benefit in the form of shorter trips will accrue to residential land uses from the convenience of close-in retail/commercial development and therefore some of the retail/commercial trips should be reassigned to residential trips. Based on the evaluation of trip purposes derived from the CVATS model, the retail trip end of retail related home based work trips and all home based shopping trips are reassigned to the residential land use. Table 6-1 presents the TUMF Fee calculation following the steps described above. Table 6-1 indicates the resultant fees for the CVAG TUMF are $303 per trip for residential land uses, $117 per trip for retail/commercial land uses, and $233 per trip for non-retail and hotel land uses.
CVAG TUMF Nexus Study Report 2006 Fee Schedule Update June 27, 2006
41
Table 6-1 CVAG TUMF Fee Calculation
ITEM DESCRIPTION VALUE SOURCE OR FORMULA
PART I: TUMF COLLECTION TARGET
A Total System Cost $2,602,939,252 Table 3-1 (RACE 2005 Update)
B Share of Cost to be Funded by Other Sources 35.6% Table 5-5 C Portion of Cost to be Funded by Other Sources $926,646,374 C=A*B D Share of Cost Attributable to Developer Dedications 25.0% Table 5-5
E Portion of Cost Attributable to Customary Developer Dedications $650,734,813 E=A*D
F TUMF Collection Target $1,025,558,065 F=A-C-E
PART II: NEW PROJECT LEVEL TRIPS
G Total New Average Weekday Trip Ends 4,399,536 Section 4.1.3 (CVATS 2005 Update)
H Residential Share of Trips 35% I Retail/Commercial Share of Trips 21% J Non-Retail & Hotel Share of Trips 44%
Table 4-3
K New Average Weekday Residential Trip Ends 1,539,838 K=G*H L New Average Weekday Retail/Commercial Trip Ends 923,903 L=G*I M New Average Weekday Non-Retail & Hotel Trip Ends 1,935,796 M=G*J
PART III: COST ATTRIBUTABLE TO LAND USE CATEGORY
N Share of Cost Attributable to Residential 45.5% O Share of Cost Attributable to Retail/Commercial 10.5% P Share of Cost Attributable to Non-Retail & Hotel 44%
Table 4-4
Q Portion of Cost Attributable to Residential $466,628,920 Q=F*N R Portion of Cost Attributable to Retail/Commercial $107,683,597 R=F*O S Portion of Cost Attributable to Non-Retail & Hotel $451,245,549 S=F*P
PART IV: FEE PER TRIP
T Residential Fee per Trip $303 T=Q/K U Retail/Commercial Fee per Trip $117 U=R/L V Non-Retail & Hotel Fee per Trip $233 V=S/M NOTE: Shaded rows are inputs or policy assumptions.
CVAG TUMF Nexus Study Report 2006 Fee Schedule Update June 27, 2006
42
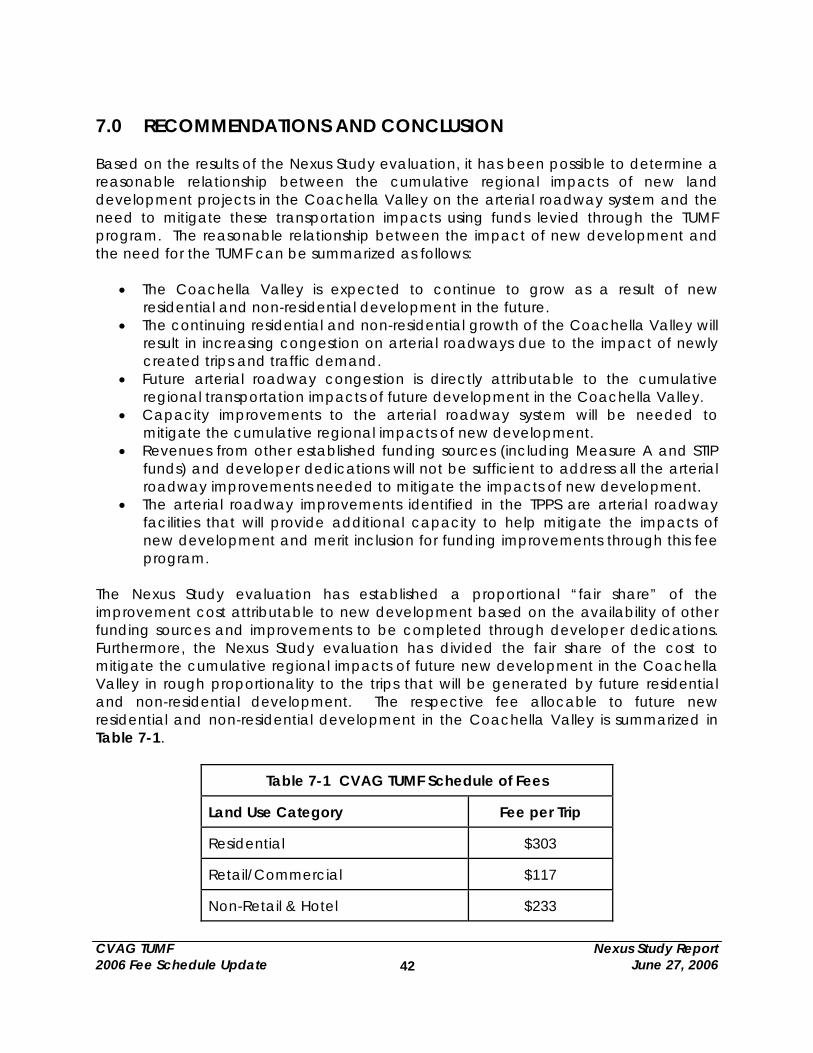
7.0 RECOMMENDATIONS AND CONCLUSION Based on the results of the Nexus Study evaluation, it has been possible to determine a reasonable relationship between the cumulative regional impacts of new land development projects in the Coachella Valley on the arterial roadway system and the need to mitigate these transportation impacts using funds levied through the TUMF program. The reasonable relationship between the impact of new development and the need for the TUMF can be summarized as follows:
• The Coachella Valley is expected to continue to grow as a result of new residential and non-residential development in the future.
• The continuing residential and non-residential growth of the Coachella Valley will result in increasing congestion on arterial roadways due to the impact of newly created trips and traffic demand.
• Future arterial roadway congestion is directly attributable to the cumulative regional transportation impacts of future development in the Coachella Valley.
• Capacity improvements to the arterial roadway system will be needed to mitigate the cumulative regional impacts of new development.
• Revenues from other established funding sources (including Measure A and STIP funds) and developer dedications will not be sufficient to address all the arterial roadway improvements needed to mitigate the impacts of new development.
• The arterial roadway improvements identified in the TPPS are arterial roadway facilities that will provide additional capacity to help mitigate the impacts of new development and merit inclusion for funding improvements through this fee program.
The Nexus Study evaluation has established a proportional “fair share” of the improvement cost attributable to new development based on the availability of other funding sources and improvements to be completed through developer dedications. Furthermore, the Nexus Study evaluation has divided the fair share of the cost to mitigate the cumulative regional impacts of future new development in the Coachella Valley in rough proportionality to the trips that will be generated by future residential and non-residential development. The respective fee allocable to future new residential and non-residential development in the Coachella Valley is summarized in Table 7-1.
Table 7-1 CVAG TUMF Schedule of Fees
Land Use Category Fee per Trip
Residential $303
Retail/Commercial $117
Non-Retail & Hotel $233
CVAG TUMF Nexus Study Report 2006 Fee Schedule Update June 27, 2006
43
7.1. Fee Adjustments and Program Updates 7.1.1. Annual Inflation Adjustment Section 12 of the CVAG model TUMF ordinance dated June 7, 1988 includes provisions that provide for an annual review and adjustment of the TUMF schedule of fees to account for cost inflation. To ensure the TUMF program revenues are adequate to accomplish the improvements recommended in the TPPS, it is appropriate to regularly adjust the underlying cost assumptions to reflect inflation. Specifically, the project costs identified in the RACE should be adjusted annually to reflect the influence of right-of-way and construction cost inflation. Based on the revised improvement cost information, the TUMF Schedule of Fees can be recalculated and the fees adjusted accordingly to sustain the value of the program. As the basis for completing an annual inflationary adjustment to the TUMF program, it is recommended that CVAG utilize separate indices for right-of-way and construction costs. By applying the respective index for right-of-way and construction costs, CVAG can adjust the project cost values presented in the RACE and summarized in Table 3-1 of this report. The resultant total cost value can then be used as the basis for recalculating the TUMF Schedule of Fees as presented in Table 6-1. For right-of-way cost adjustments, CVAG should utilize the “Existing Home Price Trend for Coachella Valley” as presented in the Coachella Valley Economic Report compiled for the Coachella Valley Economic Partnership (Exhibit 31 in the July 25, 2005 version of the report). The Existing Home Price Trend for Coachella Valley is developed from information compiled by the National Association of Realtors (NAR) to track the median sales price of existing single family homes in metropolitan areas across the country. The median sales price of existing single family homes represents the most widely available index of property values providing a relative measure of property values in a given area over time. Although the acquisition of right-of-way may involve some properties other than existing single family homes, this index provides a reasonably concise and readily accessible source of data reflecting the overall trend in land values. For construction costs, CVAG should utilize the Engineering News Record (ENR) Construction Cost Index (CCI). The ENR CCI represents the most widely accepted standard index for assessing changes in construction material and labor costs over time based on a monthly survey of the largest metropolitan markets in the United States. ENR builds its construction cost index by developing a twenty city average of the combined costs for labor and various common construction materials. The use of the national ENR CCI represents a more stable index over time by reducing the influence of local short term fluctuations in the supply of materials and labor. The application of a more stable index for adjusting cost values is recommended to reduce the potential for erratic fluctuation in the TUMF Schedule of Fees as part of the annual adjustment.
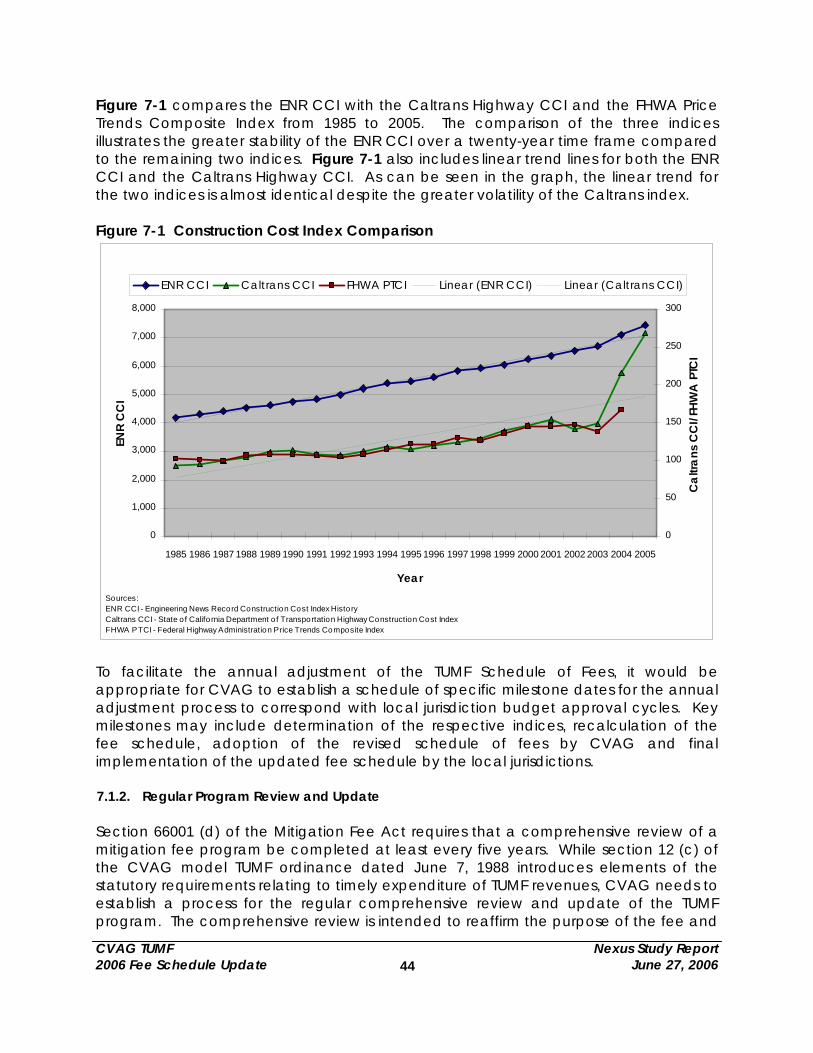
CVAG TUMF Nexus Study Report 2006 Fee Schedule Update June 27, 2006
44
Figure 7-1 compares the ENR CCI with the Caltrans Highway CCI and the FHWA Price Trends Composite Index from 1985 to 2005. The comparison of the three indices illustrates the greater stability of the ENR CCI over a twenty-year time frame compared to the remaining two indices. Figure 7-1 also includes linear trend lines for both the ENR CCI and the Caltrans Highway CCI. As can be seen in the graph, the linear trend for the two indices is almost identical despite the greater volatility of the Caltrans index. Figure 7-1 Construction Cost Index Comparison
0
1,000
2,000
3,000
4,000
5,000
6,000
7,000
8,000
1985 1986 1987 1988 1989 1990 1991 1992 1993 1994 1995 1996 1997 1998 1999 2000 2001 2002 2003 2004 2005
Year
ENR
CC
I
0
50
100
150
200
250
300
Cal
trans
CC
I/FH
WA
PTC
I
ENR CCI Caltrans CCI FHWA PTCI Linear (ENR CCI) Linear (Caltrans CCI)
Sources:ENR CCI - Engineering News Record Construction Cost Index HistoryCaltrans CCI - State o f Califo rnia Department of Transportation Highway Construction Cost Index FHWA PTCI - Federal Highway Administration Price Trends Composite Index
To facilitate the annual adjustment of the TUMF Schedule of Fees, it would be appropriate for CVAG to establish a schedule of specific milestone dates for the annual adjustment process to correspond with local jurisdiction budget approval cycles. Key milestones may include determination of the respective indices, recalculation of the fee schedule, adoption of the revised schedule of fees by CVAG and final implementation of the updated fee schedule by the local jurisdictions. 7.1.2. Regular Program Review and Update Section 66001 (d) of the Mitigation Fee Act requires that a comprehensive review of a mitigation fee program be completed at least every five years. While section 12 (c) of the CVAG model TUMF ordinance dated June 7, 1988 introduces elements of the statutory requirements relating to timely expenditure of TUMF revenues, CVAG needs to establish a process for the regular comprehensive review and update of the TUMF program. The comprehensive review is intended to reaffirm the purpose of the fee and
CVAG TUMF Nexus Study Report 2006 Fee Schedule Update June 27, 2006
45
the reasonable relationship between the fee and the purpose for which it is being charged, and to reassess the program’s financial status to ensure the designated improvements can be fully funded. The comprehensive review also provides the opportunity to update the program to respond to changing needs within the area. In particular, successive updates provide the opportunity to utilize the latest available demographic and travel demand forecast information for the area to reflect changing rates and patterns of development. By responding to changing development trends, the program can be adjusted as necessary to adequately address the improvement needs resulting from changes in development activity. In accordance with the provision of the Mitigation Fee Act, it is recommended that CVAG undertake a comprehensive review and update of the TUMF program within five years of the date of adoption of this Nexus Study. In addition to meeting the intents of the Mitigation Fee Act by reaffirming the rational nexus for the TUMF program, CVAG should use the comprehensive review and update as an opportunity to reevaluate the program within the context of changing development patterns and improvement needs. 7.2. TUMF Ordinance Amendments Changes to key assumptions, methodology and findings of the CVAG TUMF Nexus as presented in this report will necessitate amendments to the respective local TUMF ordinances to ensure consistency. The following section summarizes necessary changes to the TUMF ordinances based on a review of the CVAG model TUMF ordinance dated June 7, 1988. 7.2.1. Horizon Year and CVATS Various sections of the Model Ordinance will need to be amended to refer to the new horizon year 2030 which supercedes the original horizon year of 2010. Furthermore, the Model Ordinance refers to the 1987 Coachella Valley Area Transportation Study (CVATS) as the basis for the horizon year and for determining the extent to which new development will generate traffic. Such references will need to be amended to reflect the current methodology for establishing the TPPS. In particular, Sections 1 (a), 2 (b), 3, 3 (a), 3 (b), 3 (c), 3 (d), 3 (f), 4 (c), 6 (e), and 15 include references to CVATS or the horizon year 2010. 7.2.2. Trip Generation Rates Section 4 (e) of the CVAG model TUMF ordinance dated June 7, 1988 references the Institute of Traffic Engineers (ITE) Trip Generation Third Edition as the basis for determining trip generation rates for fee calculations. The current version of the ITE Trip Generation Seventh Edition (published in 2003) should be referenced as the basis for fee calculations.
CVAG TUMF Nexus Study Report 2006 Fee Schedule Update June 27, 2006
46
7.2.3. Applicability Section 5 of the CVAG model TUMF ordinance dated June 7, 1988 indicates the provisions of the ordinance shall take effect on January 1, 1989. Subsequent to the update of the program Nexus Study and the proposed amendments to the respective ordinances, it will be necessary to establish a new effective date in accordance with the desired time frame for implementation of the new schedule of fees. 7.2.4. Establishment of the Transportation Mitigation Fee Section 6 (c) of the CVAG model TUMF ordinance dated June 7, 1988 indicates that one-half of the cost of the regional system will be attributable to new development although this amount may change as future revisions are made to the program. Consistent with Section 6 (c) of the model ordinance, the original TUMF collection target was adjusted by 50% to account for other funding sources that would be used to implement the regional system improvements. The 50% other funding level was considered to adequately account for existing needs and other funding sources but was not quantified as part of the original Nexus determination. For the purpose of this update, an estimate of the other revenue sources expected to be available for implementation of the regional system was prepared as the basis for adjusting the TUMF collection target to address other funding. As described in Section 5.1 of this report, approximately 35.6% of the total cost to implement the TPPS was determined to be available through existing revenue sources including Measure A and STIP. This amount is considered to adequately account for existing needs on the regional system and therefore was used as the basis for adjusting the Total System Cost in the fee calculation. Reference to the one-half cost adjustment in Sections 6 (c), 6 (d) (1) and 6 (d) (3) of the Model Ordinance needs to be amended to be consistent with the revised fee calculation methodology. 7.2.5. Share of Trips Section 6 (e) of the 1988 Model Ordinance reassigns 60% of trip growth attributable to retail to the residential category. The 60% factor was a policy decision made during the initial TUMF Nexus Study and ordinance development process. To better quantify the influence of residential land uses on retail trip generation, the 60% factor was reevaluated as part of the Nexus Study update. As presented in Section 4.2 of this report, the share of trips between residential, retail and non-retail land uses was calculated based on data from the newly updated CVATS Model and CVAG Origin-Destination Survey. For the purposes of the fee calculation, 45.5% of the system cost was determined to be attributable to residential development, while 10.5% was determined to be retail and 44% was determined to be non-retail. Reflecting the intent of the original policy decision, the calculation of the share of trips effectively resulted in 50% of the retail trips being attributable to residential land uses. The relevant provision of the Model
CVAG TUMF Nexus Study Report 2006 Fee Schedule Update June 27, 2006
47
Ordinance needs to be amended to be consistent with the revised share of trips methodology. 7.2.6. Schedule of Fees Section 6 (h) of the 1988 Model Ordinance presents the schedule of fees on a per trip basis for each of the applicable land use categories. The schedule of fees needs to be amended to reflect the revised schedule of fees presented in Table 7-1. 7.2.7. List of Projects on the Regional System Appendix B of the 1988 Model Ordinance included a list of projects on the regional system to be implemented under the auspices of the TUMF program. The 2005 update of the TPPS establishes the list of projects as the basis for this Nexus Study update. The TPPS list of projects needs to be included by reference in the Model Ordinance superceding the list of projects contained in the original Appendix B.
CVAG TUMF Nexus Study Report 2006 Fee Schedule Update June 27, 2006
48
APPENDIX A – SCAG 2004 RTP Model Network Plots

YEAR 2000
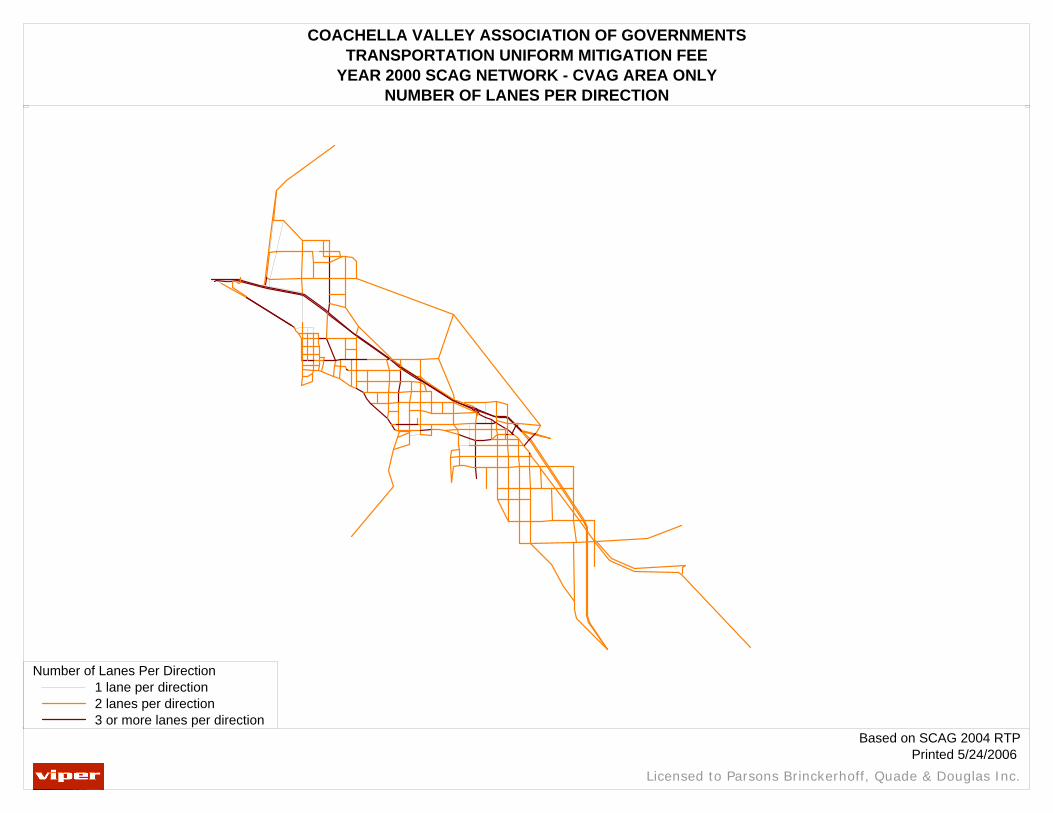
COACHELLA VALLEY ASSOCIATION OF GOVERNMENTSTRANSPORTATION UNIFORM MITIGATION FEE
YEAR 2000 SCAG NETWORK - CVAG AREA ONLYNUMBER OF LANES PER DIRECTION
Licensed to Parsons Brinckerhoff, Quade & Douglas Inc.
Printed 5/24/2006 Based on SCAG 2004 RTP
Number of Lanes Per Direction1 lane per direction2 lanes per direction3 or more lanes per direction
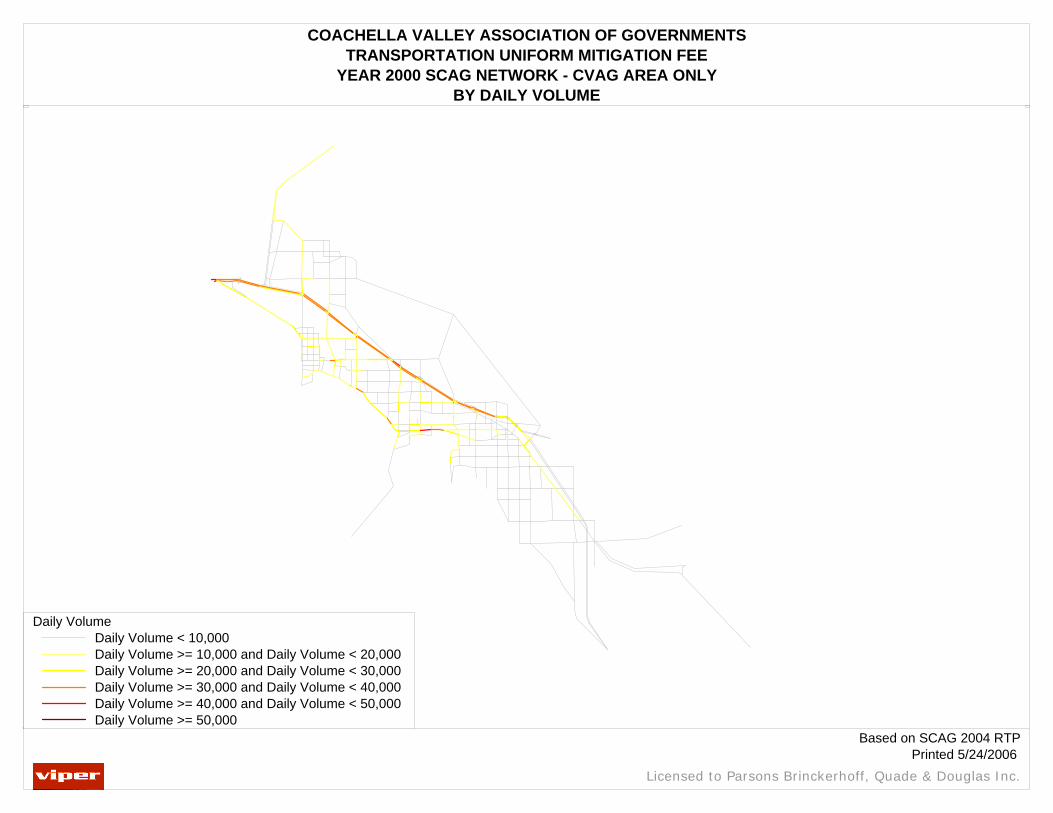
COACHELLA VALLEY ASSOCIATION OF GOVERNMENTSTRANSPORTATION UNIFORM MITIGATION FEE
YEAR 2000 SCAG NETWORK - CVAG AREA ONLYBY DAILY VOLUME
Licensed to Parsons Brinckerhoff, Quade & Douglas Inc.
Printed 5/24/2006 Based on SCAG 2004 RTP
Daily VolumeDaily Volume < 10,000Daily Volume >= 10,000 and Daily Volume < 20,000Daily Volume >= 20,000 and Daily Volume < 30,000Daily Volume >= 30,000 and Daily Volume < 40,000Daily Volume >= 40,000 and Daily Volume < 50,000Daily Volume >= 50,000
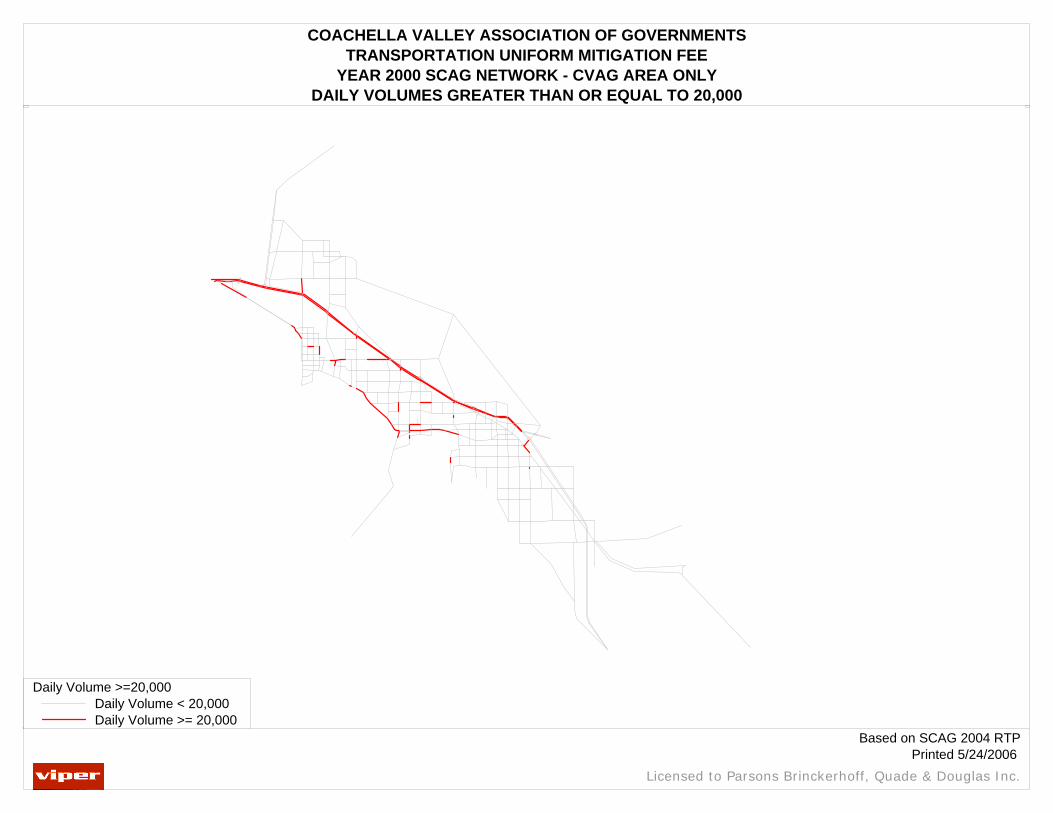
COACHELLA VALLEY ASSOCIATION OF GOVERNMENTSTRANSPORTATION UNIFORM MITIGATION FEE
YEAR 2000 SCAG NETWORK - CVAG AREA ONLYDAILY VOLUMES GREATER THAN OR EQUAL TO 20,000
Licensed to Parsons Brinckerhoff, Quade & Douglas Inc.
Printed 5/24/2006 Based on SCAG 2004 RTP
Daily Volume >=20,000Daily Volume < 20,000Daily Volume >= 20,000
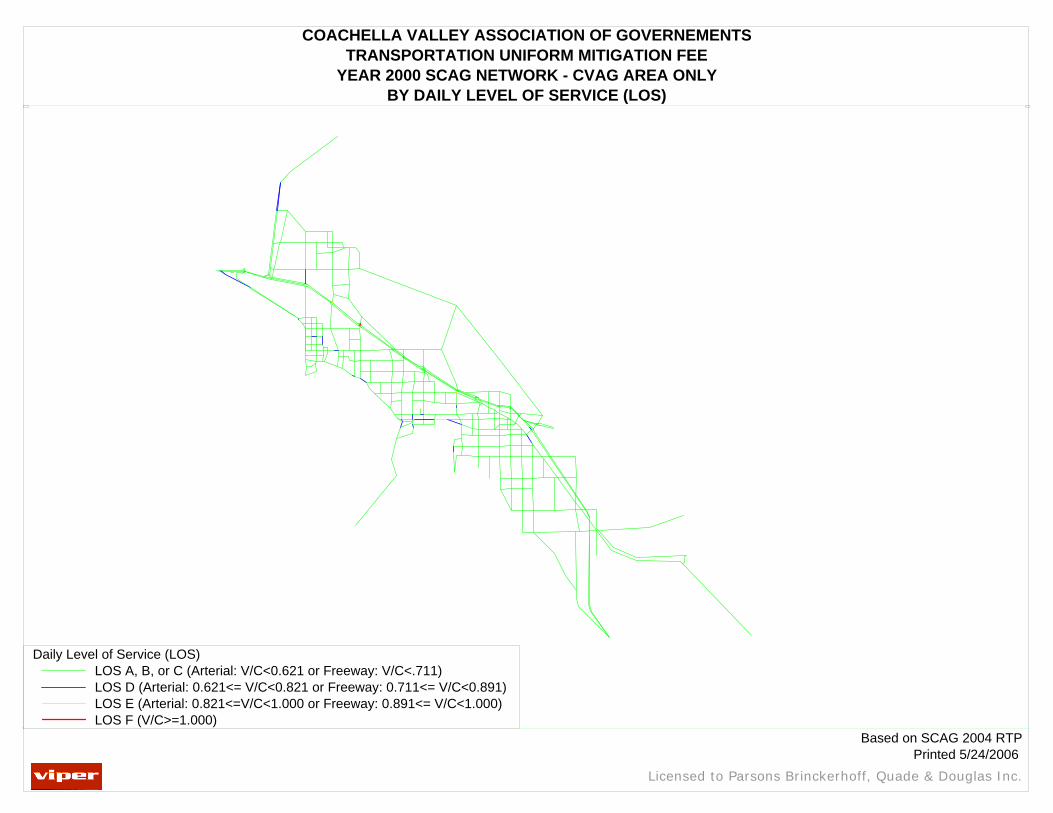
COACHELLA VALLEY ASSOCIATION OF GOVERNEMENTSTRANSPORTATION UNIFORM MITIGATION FEE
YEAR 2000 SCAG NETWORK - CVAG AREA ONLYBY DAILY LEVEL OF SERVICE (LOS)
Licensed to Parsons Brinckerhoff, Quade & Douglas Inc.
Printed 5/24/2006 Based on SCAG 2004 RTP
Daily Level of Service (LOS)LOS A, B, or C (Arterial: V/C<0.621 or Freeway: V/C<.711)LOS D (Arterial: 0.621<= V/C<0.821 or Freeway: 0.711<= V/C<0.891)LOS E (Arterial: 0.821<=V/C<1.000 or Freeway: 0.891<= V/C<1.000)LOS F (V/C>=1.000)
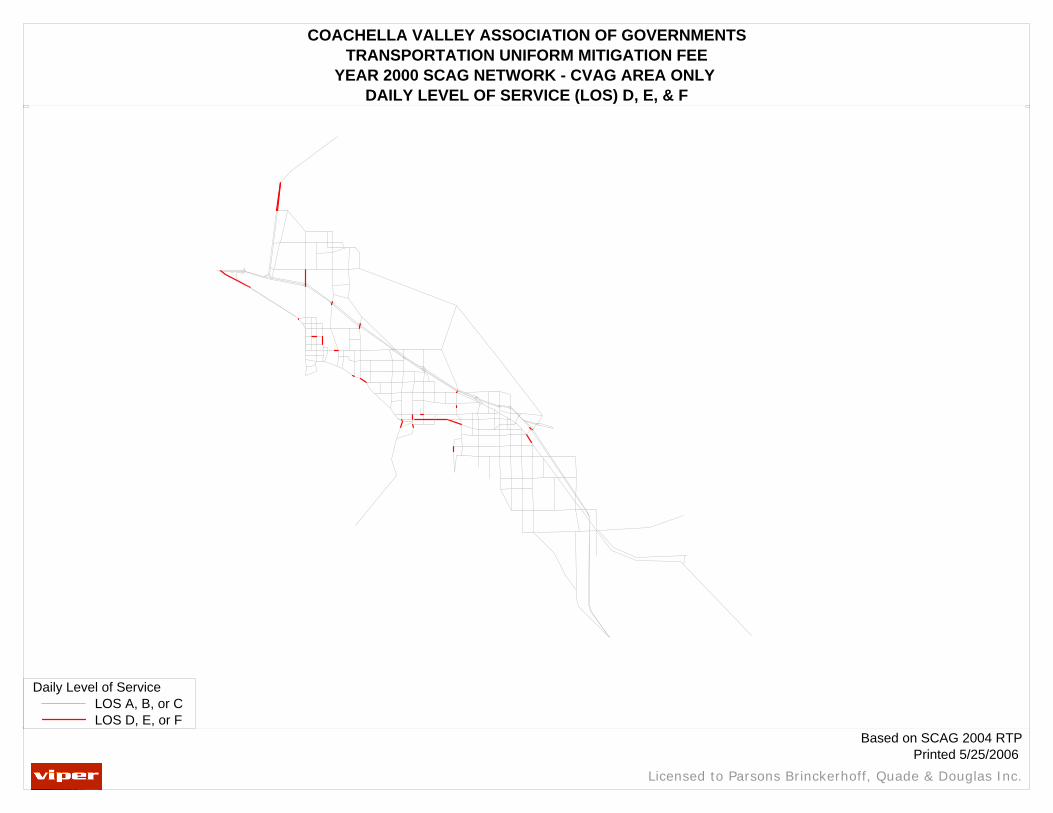
COACHELLA VALLEY ASSOCIATION OF GOVERNMENTSTRANSPORTATION UNIFORM MITIGATION FEE
YEAR 2000 SCAG NETWORK - CVAG AREA ONLY DAILY LEVEL OF SERVICE (LOS) D, E, & F
Licensed to Parsons Brinckerhoff, Quade & Douglas Inc.
Printed 5/25/2006 Based on SCAG 2004 RTP
Daily Level of ServiceLOS A, B, or CLOS D, E, or F

YEAR 2030 BASELINE

COACHELLA VALLEY ASSOCIATION OF GOVERNMENTSTRANSPORTATION UNIFORM MITIGATION FEE
YEAR 2030 BASELINE SCAG NETWORK - CVAG AREA ONLYNUMBER OF LANES PER DIRECTION
Licensed to Parsons Brinckerhoff, Quade & Douglas Inc.
Printed 5/24/2006 Based on SCAG 2004 RTP
Number of Lanes Per Direction1 lane per direction2 lanes per direction3 or more lanes per direction
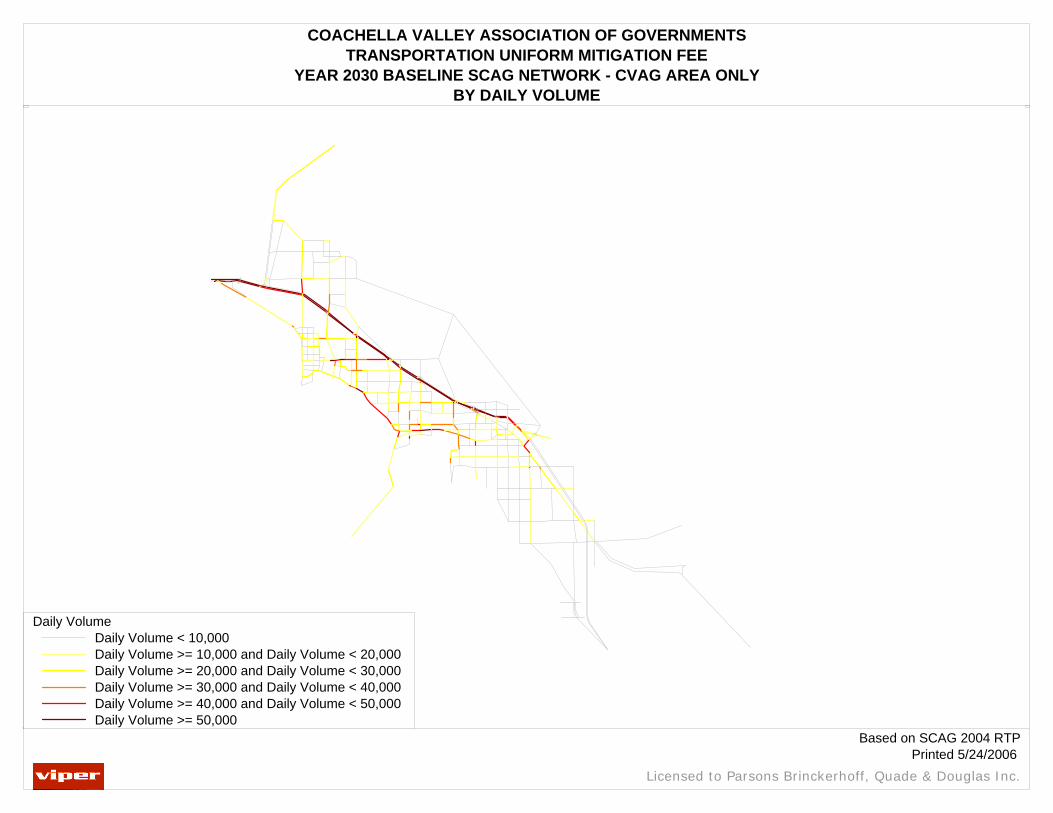
COACHELLA VALLEY ASSOCIATION OF GOVERNMENTSTRANSPORTATION UNIFORM MITIGATION FEE
YEAR 2030 BASELINE SCAG NETWORK - CVAG AREA ONLYBY DAILY VOLUME
Licensed to Parsons Brinckerhoff, Quade & Douglas Inc.
Printed 5/24/2006 Based on SCAG 2004 RTP
Daily VolumeDaily Volume < 10,000Daily Volume >= 10,000 and Daily Volume < 20,000Daily Volume >= 20,000 and Daily Volume < 30,000Daily Volume >= 30,000 and Daily Volume < 40,000Daily Volume >= 40,000 and Daily Volume < 50,000Daily Volume >= 50,000
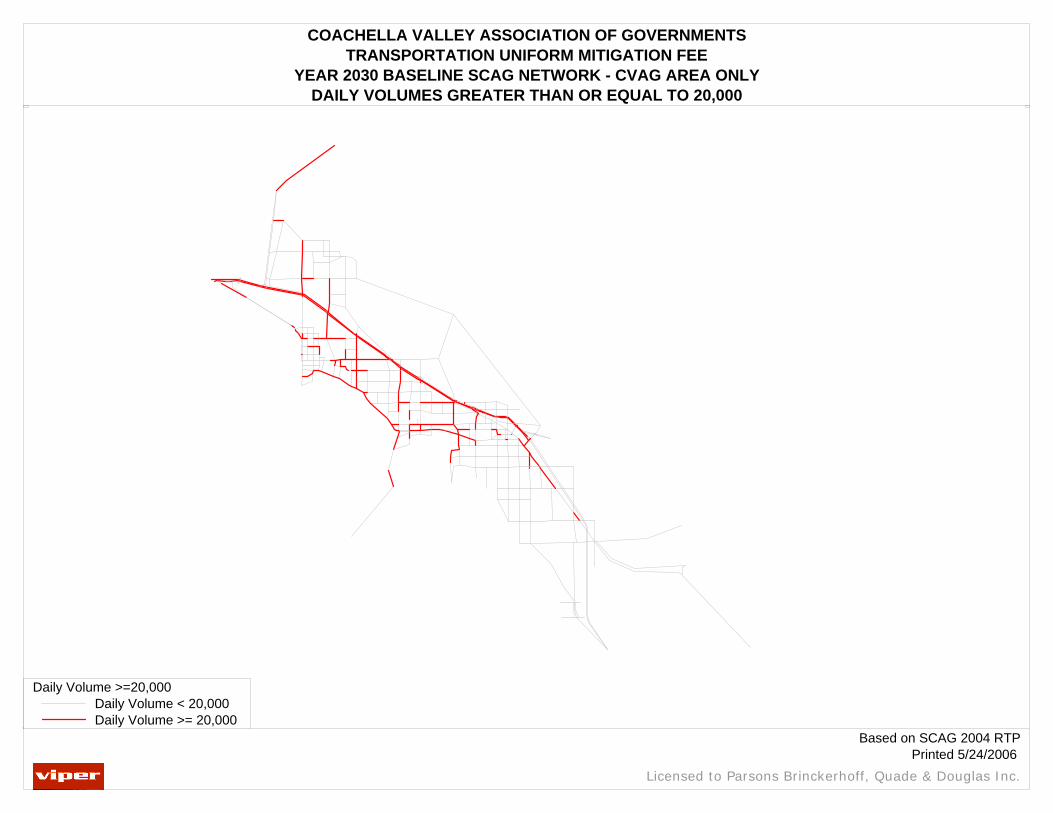
COACHELLA VALLEY ASSOCIATION OF GOVERNMENTSTRANSPORTATION UNIFORM MITIGATION FEE
YEAR 2030 BASELINE SCAG NETWORK - CVAG AREA ONLYDAILY VOLUMES GREATER THAN OR EQUAL TO 20,000
Licensed to Parsons Brinckerhoff, Quade & Douglas Inc.
Printed 5/24/2006 Based on SCAG 2004 RTP
Daily Volume >=20,000Daily Volume < 20,000Daily Volume >= 20,000
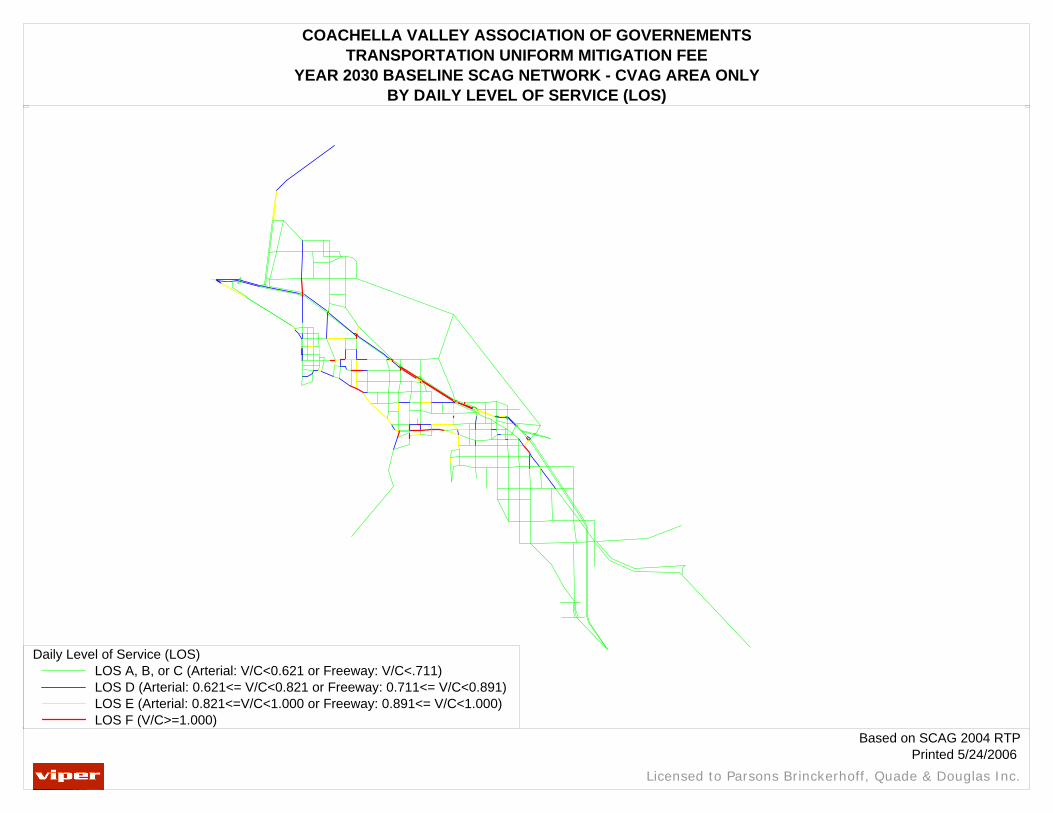
COACHELLA VALLEY ASSOCIATION OF GOVERNEMENTSTRANSPORTATION UNIFORM MITIGATION FEE
YEAR 2030 BASELINE SCAG NETWORK - CVAG AREA ONLYBY DAILY LEVEL OF SERVICE (LOS)
Licensed to Parsons Brinckerhoff, Quade & Douglas Inc.
Printed 5/24/2006 Based on SCAG 2004 RTP
Daily Level of Service (LOS)LOS A, B, or C (Arterial: V/C<0.621 or Freeway: V/C<.711)LOS D (Arterial: 0.621<= V/C<0.821 or Freeway: 0.711<= V/C<0.891)LOS E (Arterial: 0.821<=V/C<1.000 or Freeway: 0.891<= V/C<1.000)LOS F (V/C>=1.000)
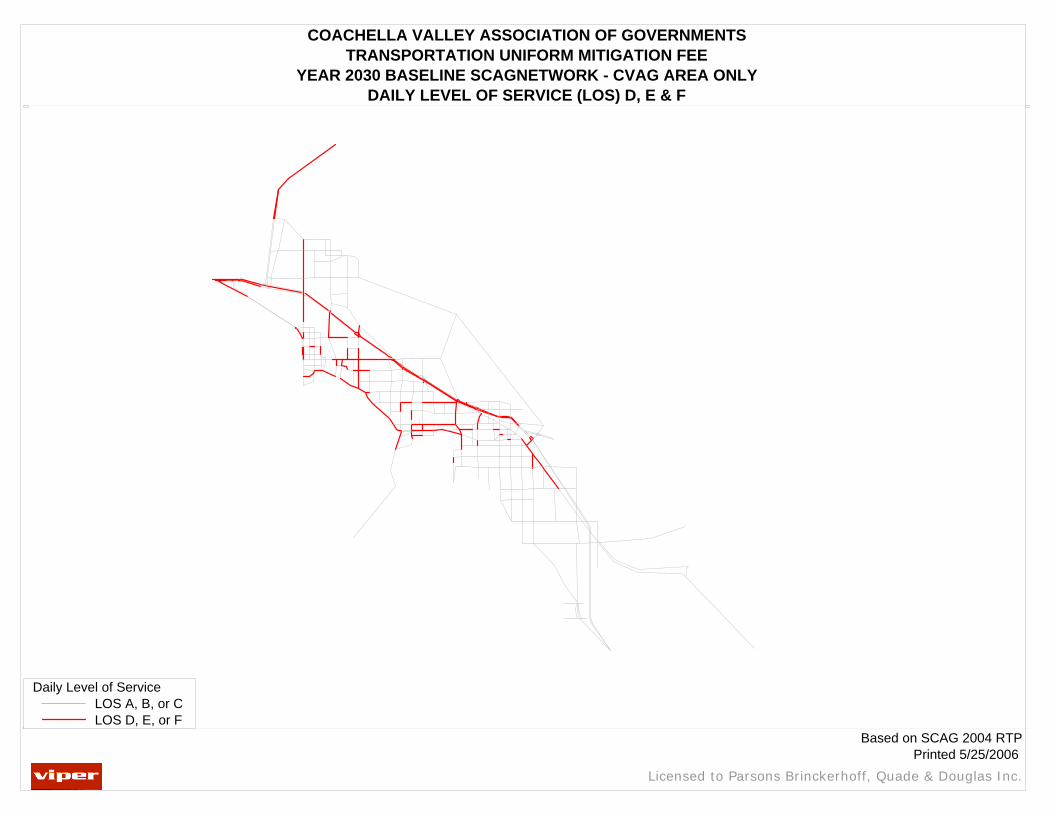
COACHELLA VALLEY ASSOCIATION OF GOVERNMENTSTRANSPORTATION UNIFORM MITIGATION FEE
YEAR 2030 BASELINE SCAGNETWORK - CVAG AREA ONLYDAILY LEVEL OF SERVICE (LOS) D, E & F
Licensed to Parsons Brinckerhoff, Quade & Douglas Inc.
Printed 5/25/2006 Based on SCAG 2004 RTP
Daily Level of ServiceLOS A, B, or CLOS D, E, or F