Embed Size (px)
Citation preview
PERSISTENT SURVEILLANCE FOR
PIPELINE PROTECTION AND THREAT INTERDICTION
Transport Stiffness of TGLF and It’s Impact on ITER
by
J.E. Kinsey
in collaboration with
G.M. Staebler, R.E. Waltz, J. Candy
General Atomics
Presented at the 53rd Annual Meeting of the
APS Division of Plasma Physics
Salt Lake City, Utah
November 14-18, 2011
J.E. Kinsey/APS/November 2011 113-11/JEK/rs
J.E. Kinsey/APS/November 2011 113-11/JEK/rs
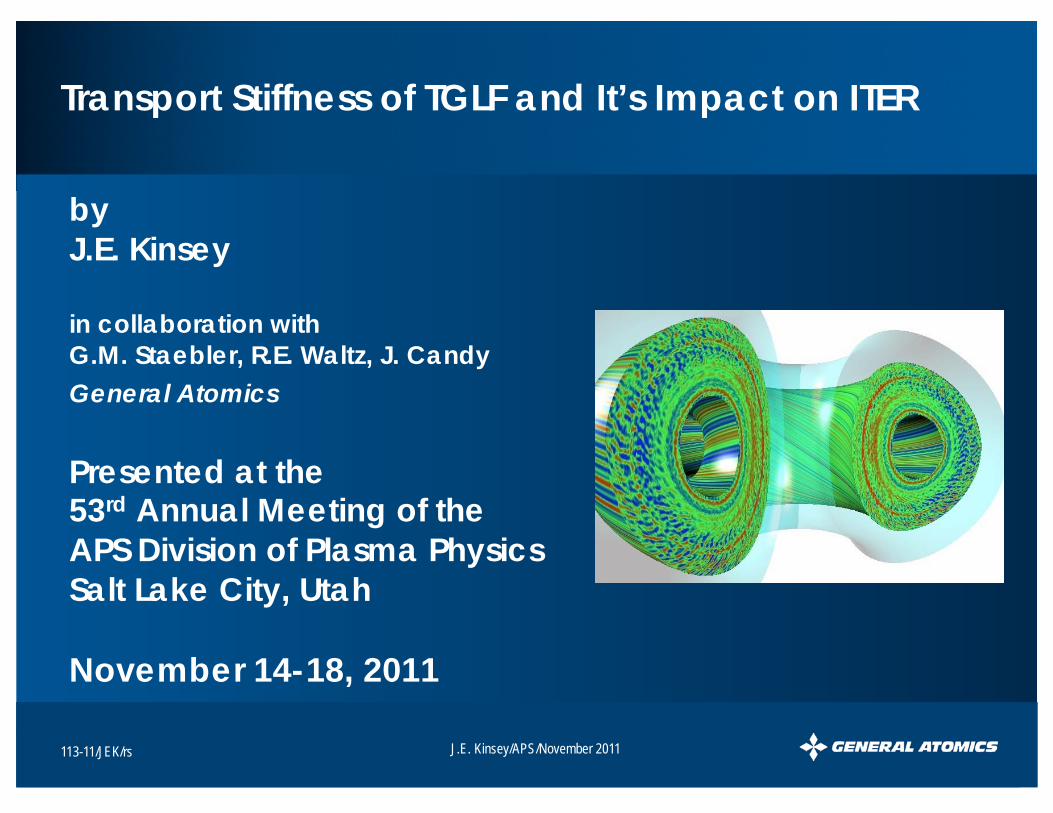
Motivation — A Key Ingredient in the TGLF Predictions for ITER is Core Temperature Profile Stiffness
• Stiffness feature #1: Profiles are insensitive to changes in Paux
– IAEA10 results showed that the predicted fusion Q=Pfus/Paux sensitive to
auxiliary heating, scales like Paux at fixed ped
– Challenging to increase Pfus by adding Paux but can increase fusion Q by reducing Paux (if ped remains fixed)
• Stiffness feature #2: Profiles are sensitive to the pedestal height – Fusion power scales like ped,N
2
EPED
0
10
20
30
40
50
10 20 30 40 50 60 70
TGLF-09TGLF-09 finite
QFus
ITER conv. H-modeTped=5.0 kevnped=9.e19neo/nped=1.3
Paux
(MW)
Q Paux
-0.80
at fixed ped
Q=10
v =0
ped,N=0.9
0
100
200
300
400
500
600
700
0.0 0.20 0.40 0.60 0.80 1.0
nped=8.0nped=8.5nped=9.0nped=10.0
PFus (
MW
)
ITER conv. H-modePaux=50 MWne0/nped=1.3
ped,N
TGLF-09 modelBased on TRANSP 20100216
Pfus
ped,N
2.0
Tped
=1.0
Tped
=3.0
Tped
=5.0
-0.8
J.E. Kinsey/APS/November 2011 113-11/JEK/rs
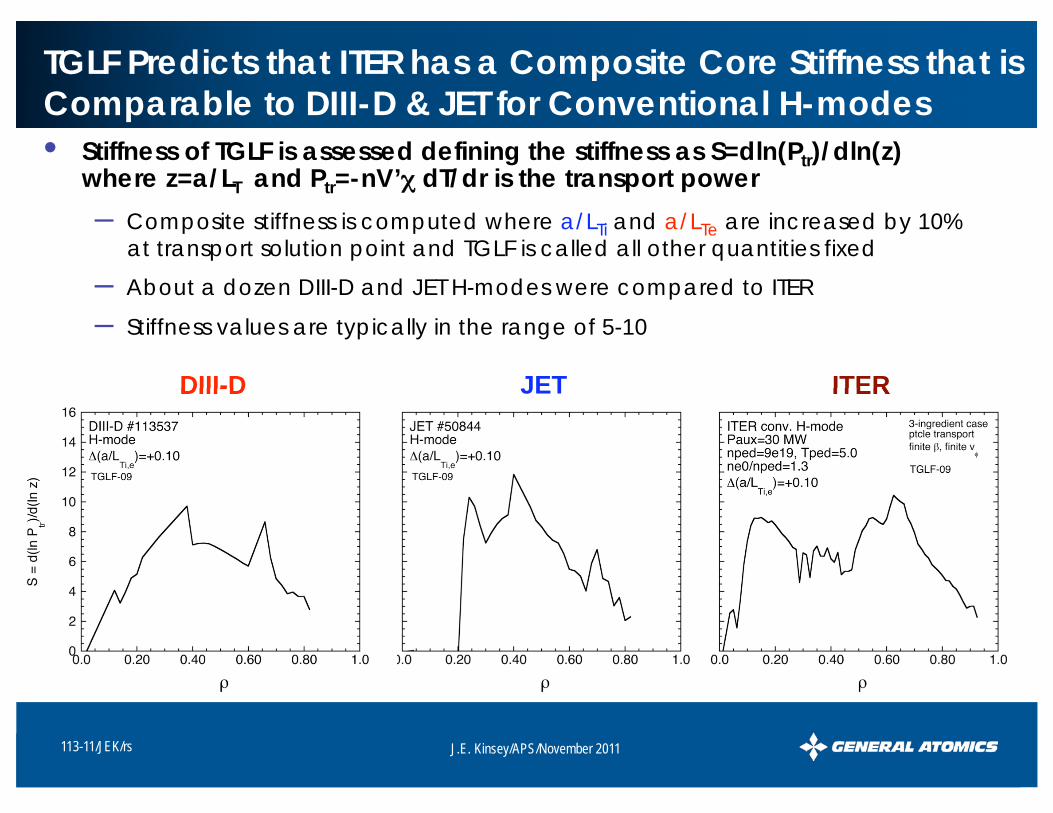
TGLF Predicts that ITER has a Composite Core Stiffness that is
Comparable to DIII-D & JET for Conventional H-modes
• Stiffness of TGLF is assessed defining the stiffness as S=dln(Ptr)/dln(z) where z=a/LT and Ptr=-nV’ dT/dr is the transport power
– Composite stiffness is computed where a/LTi and a/LTe are increased by 10% at transport solution point and TGLF is called all other quantities fixed
– About a dozen DIII-D and JET H-modes were compared to ITER
– Stiffness values are typically in the range of 5-10
DIII-D ITER JET
J.E. Kinsey/APS/November 2011 113-11/JEK/rs
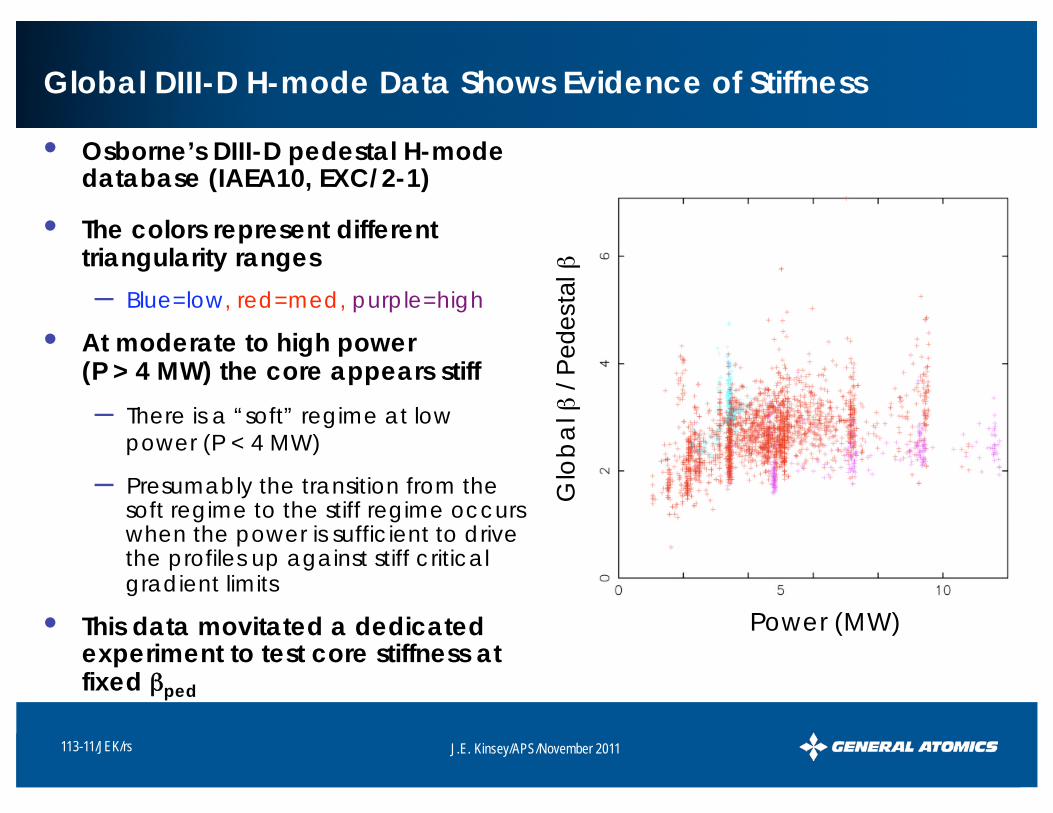
Global DIII-D H-mode Data Shows Evidence of Stiffness
• Osborne’s DIII-D pedestal H-mode database (IAEA10, EXC/2-1)
• The colors represent different triangularity ranges
– Blue=low, red=med, purple=high
• At moderate to high power (P > 4 MW) the core appears stiff
– There is a “soft” regime at low power (P < 4 MW)
– Presumably the transition from the soft regime to the stiff regime occurs when the power is sufficient to drive the profiles up against stiff critical gradient limits
• This data movitated a dedicated experiment to test core stiffness at fixed ped
Glo
ba
l /
Pe
de
sta
l
Power (MW)
J.E. Kinsey/APS/November 2011 113-11/JEK/rs
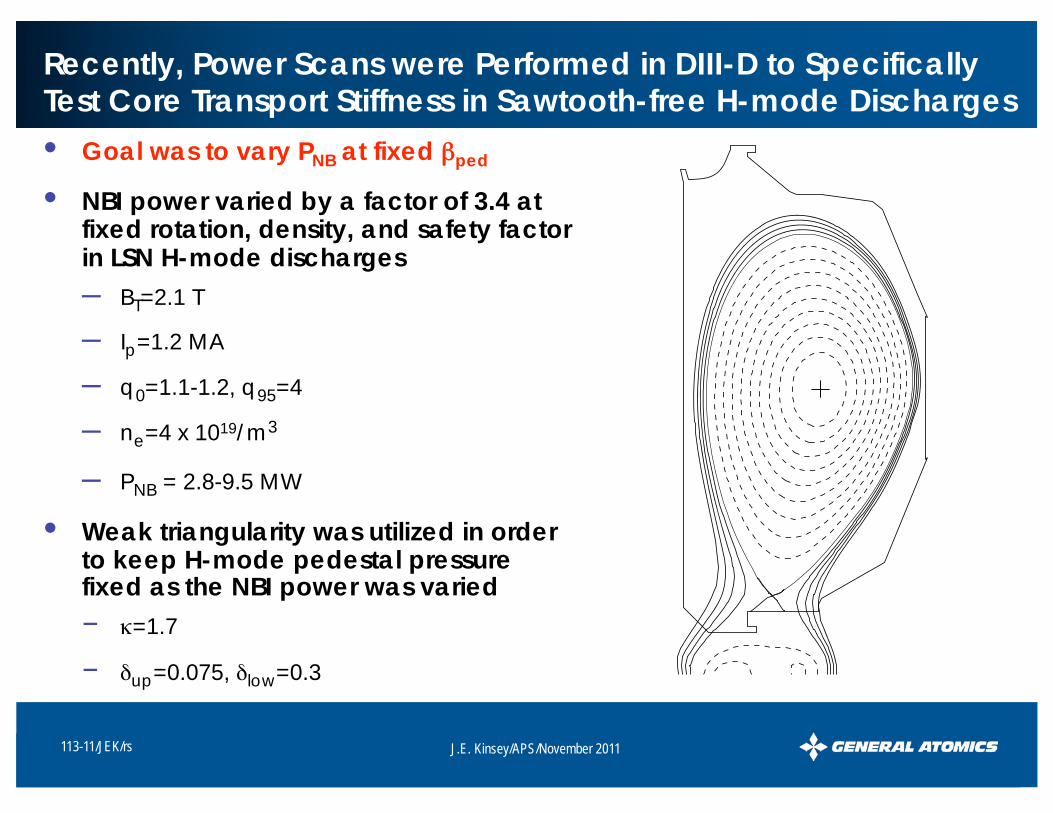
Recently, Power Scans were Performed in DIII-D to Specifically Test Core Transport Stiffness in Sawtooth-free H-mode Discharges
• Goal was to vary PNB at fixed ped
• NBI power varied by a factor of 3.4 at fixed rotation, density, and safety factor in LSN H-mode discharges
– BT=2.1 T
– Ip=1.2 MA
– q0=1.1-1.2, q95=4
– ne=4 x 10¹⁹/m3
– PNB = 2.8-9.5 MW
• Weak triangularity was utilized in order to keep H-mode pedestal pressure fixed as the NBI power was varied
– =1.7
– up=0.075, low=0.3
J.E. Kinsey/APS/November 2011 113-11/JEK/rs
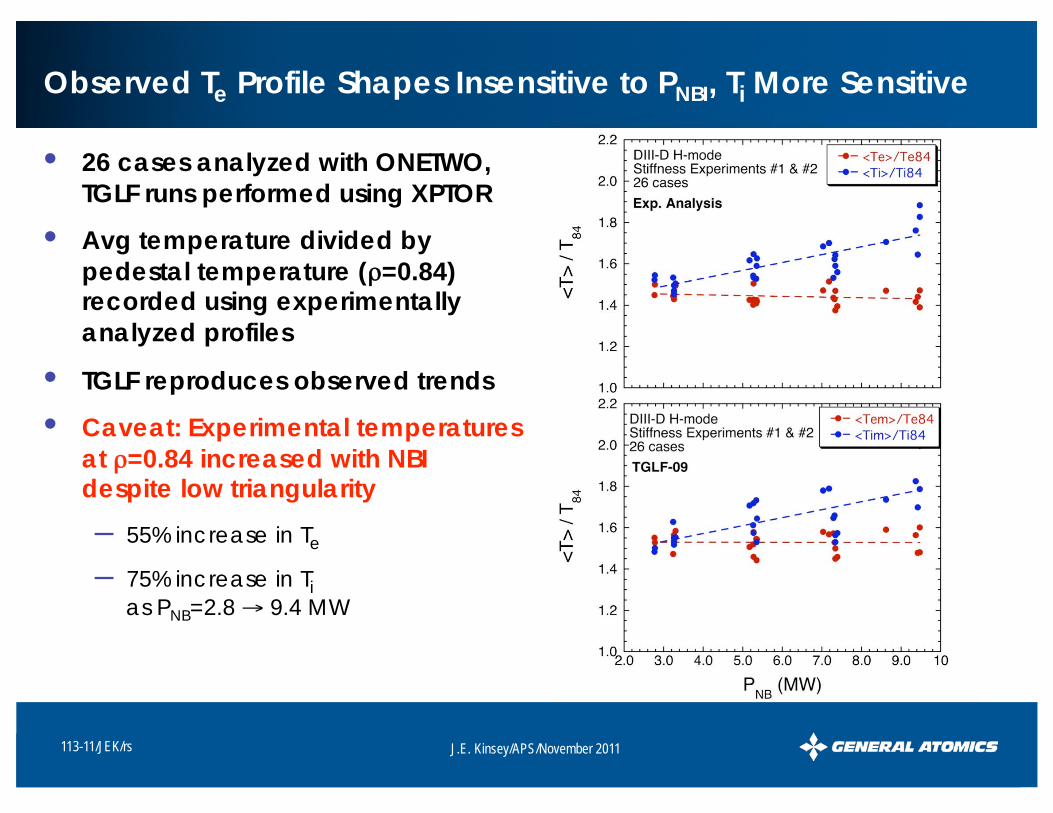
Observed Te Profile Shapes Insensitive to PNBI, Ti More Sensitive
• 26 cases analyzed with ONETWO,
TGLF runs performed using XPTOR
• Avg temperature divided by
pedestal temperature ( =0.84) recorded using experimentally
analyzed profiles
• TGLF reproduces observed trends
• Caveat: Experimental temperatures
at =0.84 increased with NBI despite low triangularity
– 55% increase in Te
– 75% increase in Ti
as PNB=2.8 9.4 MW
J.E. Kinsey/APS/November 2011 113-11/JEK/rs
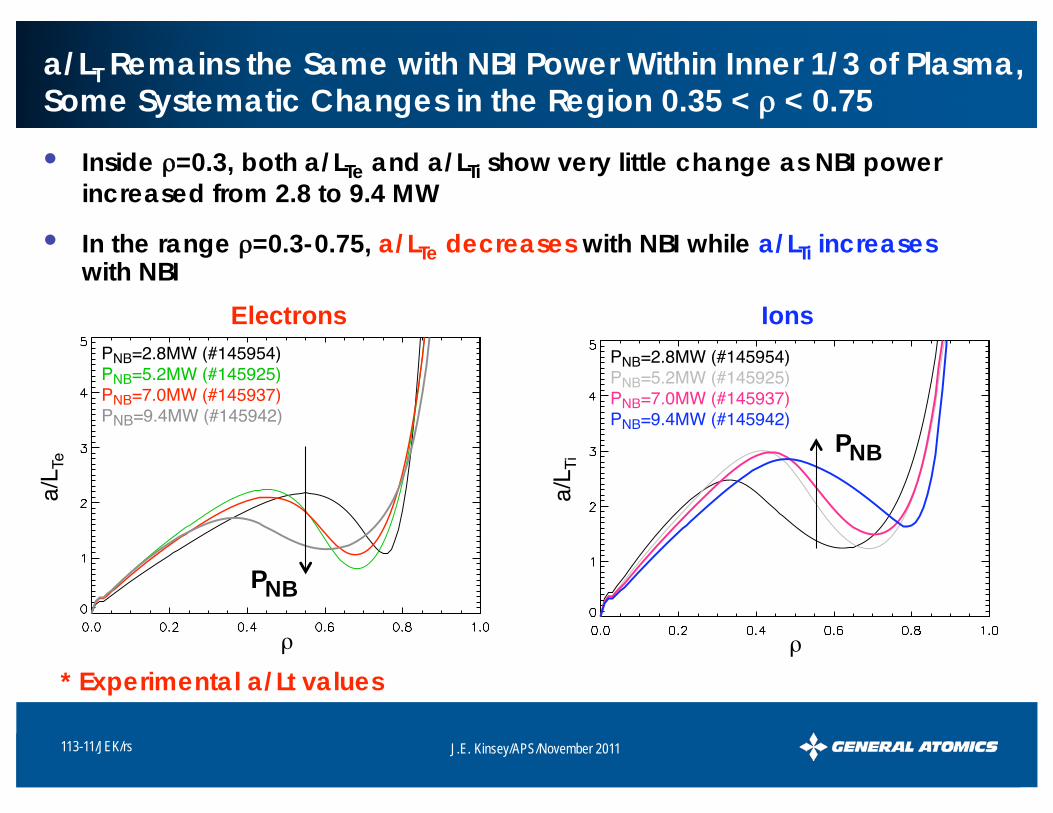
a/LT Remains the Same with NBI Power Within Inner 1/3 of Plasma, Some Systematic Changes in the Region 0.35 < < 0.75
• Inside =0.3, both a/LTe and a/LTi show very little change as NBI power
increased from 2.8 to 9.4 MW
• In the range =0.3-0.75, a/LTe decreases with NBI while a/LTi increases with NBI
Electrons Ions
PNB=2.8MW (#145954)PNB=5.2MW (#145925)PNB=7.0MW (#145937)PNB=9.4MW (#145942)
a/L T
i
PNB=2.8MW (#145954)PNB=5.2MW (#145925)PNB=7.0MW (#145937)PNB=9.4MW (#145942)
a/L T
e
PNB
PNB
* Experimental a/Lt values
J.E. Kinsey/APS/November 2011 113-11/JEK/rs
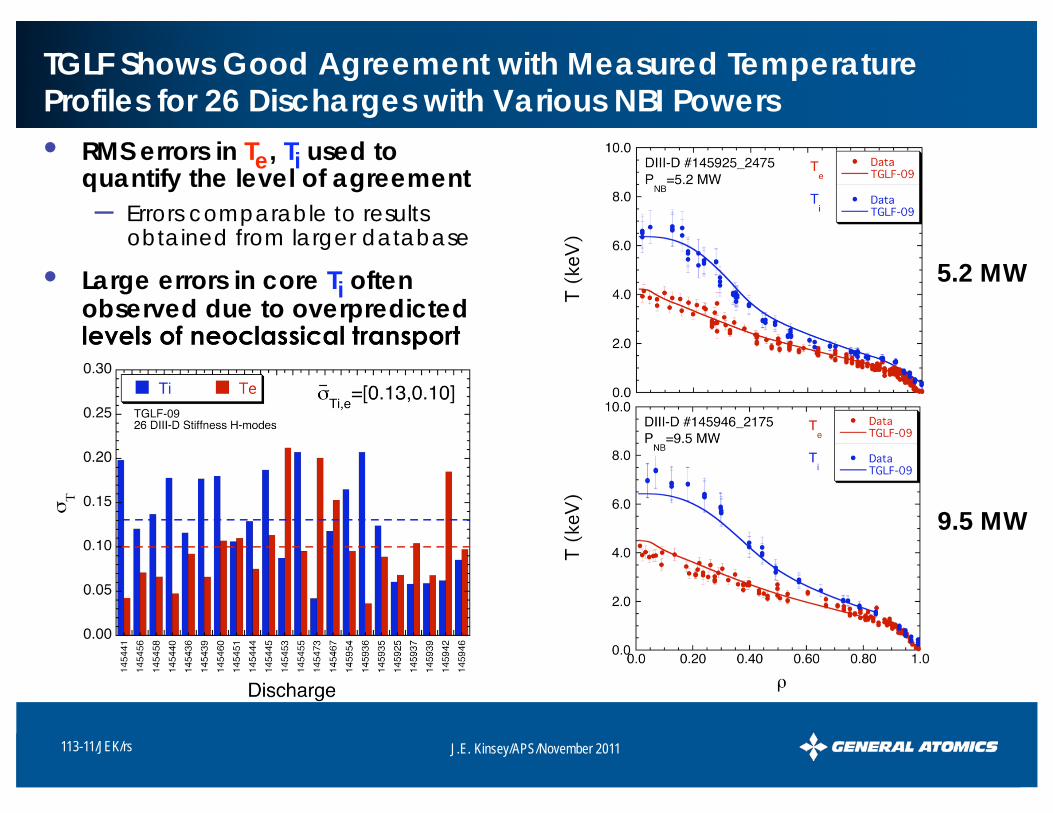
TGLF Shows Good Agreement with Measured Temperature Profiles for 26 Discharges with Various NBI Powers
• RMS errors in Te, Ti used to quantify the level of agreement
– Errors comparable to results obtained from larger database
• Large errors in core Ti often observed due to overpredicted levels of neoclassical transport
5.2 MW
9.5 MW
J.E. Kinsey/APS/November 2011 113-11/JEK/rs
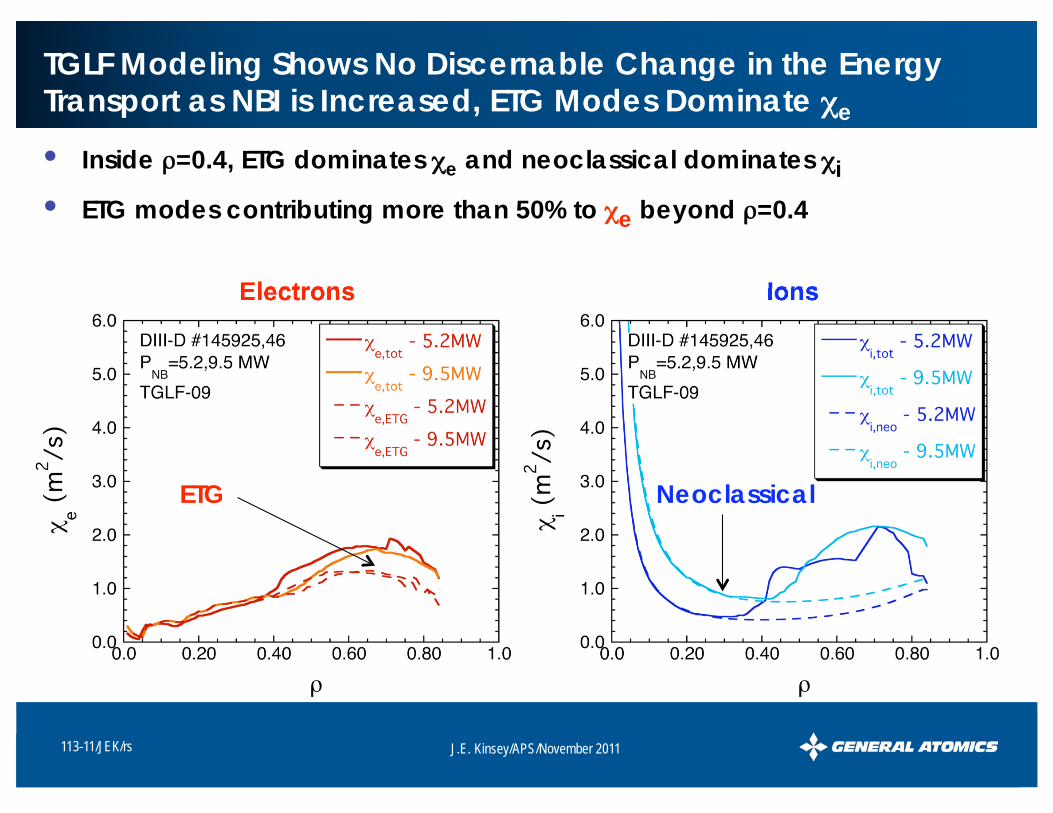
TGLF Modeling Shows No Discernable Change in the Energy Transport as NBI is Increased, ETG Modes Dominate e
• Inside =0.4, ETG dominates e and neoclassical dominates i
• ETG modes contributing more than 50% to e beyond =0.4
Electrons Ions
ETG Neoclassical
J.E. Kinsey/APS/November 2011 113-11/JEK/rs
Summary
• A key ingredient in the TGLF predictions for ITER is profile stiffness
– Q=Pfus/Paux scales like Paux at fixed ped and Pfus scales like ped,N
• TGLF predicts that ITER has a composite core stiffness that is comparable to DIII-D & JET H-mode discharges
• Global DIII-D H-mode data appears to show evidence of stiffness
– Recent JET experiments also appear stiff (Versloot NF2011, Mantica PRL2009)
• DIII-D power scans show that core Te and Ti profiles are insensitive to a factor of 3 change in NBI power, not clear if this is evidence of stiffness
– <T> / T84 independent of NBI power for electrons, scales approximately like P
0.15 for ions
– Even with low , temperatures at pedestal BC location increased with NBI: 55% increase in Te and 75% increase in Ti at =0.84 as PNB=2.8 9.4 MW
– TGLF modeling of 26 discharges in power scans shows good agreement with temperature profiles, little change in ’s as NBI power is increased
– RMS errors = 10-13% which is comparable to results from larger database
– ETG modes contribute to more than 50% of e
-0.8 2
J.E. Kinsey/APS/November 2011 113-11/JEK/rs
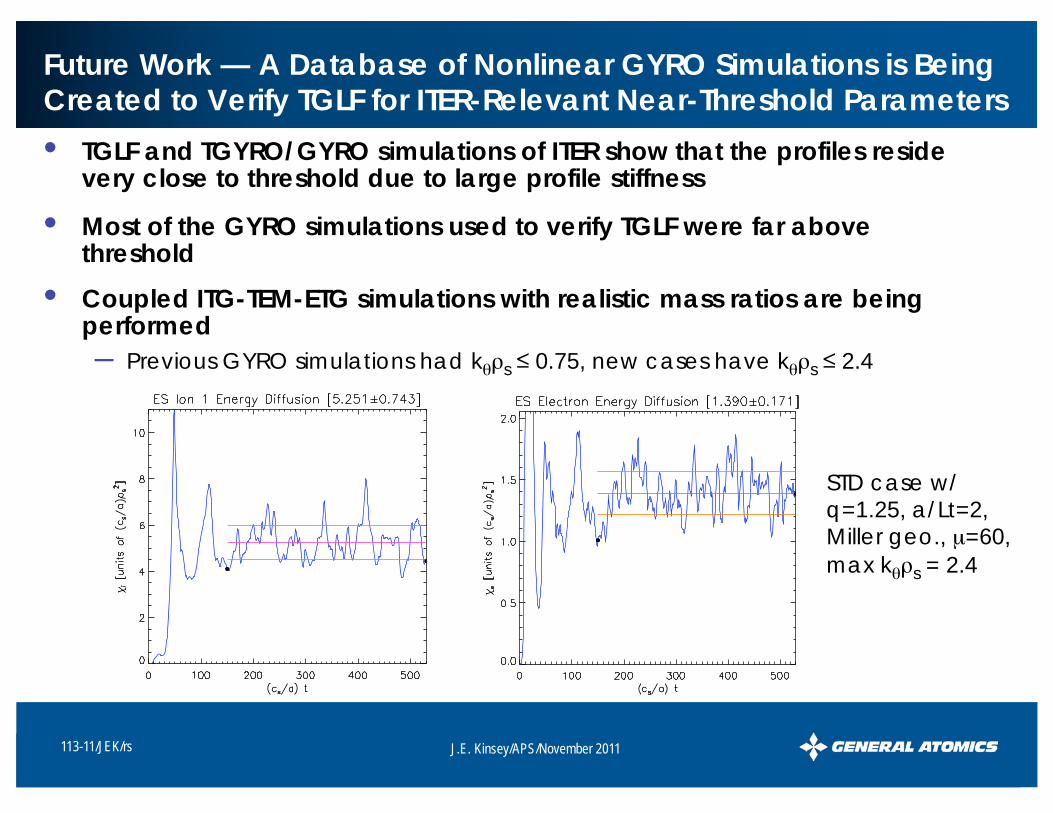
Future Work — A Database of Nonlinear GYRO Simulations is Being Created to Verify TGLF for ITER-Relevant Near-Threshold Parameters
• TGLF and TGYRO/GYRO simulations of ITER show that the profiles reside very close to threshold due to large profile stiffness
• Most of the GYRO simulations used to verify TGLF were far above threshold
• Coupled ITG-TEM-ETG simulations with realistic mass ratios are being performed
– Previous GYRO simulations had k s 0.75, new cases have k s 2.4
STD case w/ q=1.25, a/Lt=2, Miller geo., μ=60,
max k s = 2.4


![arXiv:1705.08041v2 [cs.CV] 18 Dec 2018 · iter iter iter iter Single Iteration: CNN Prior Figure 1: A proximal gradient ODP network for deblurring under Gaussian noise, mapping the](https://img.dokumen.tips/doc/110x75/5f39be22f6fe290b831f0c4a/arxiv170508041v2-cscv-18-dec-2018-iter-iter-iter-iter-single-iteration-cnn.jpg)