Embed Size (px)
Citation preview

Ekonomie
56
The Origin of the CreativeEconomics
The creative economics paradigm is justcomposing nowadays. Most authors dealingwith this topic take their own view on thecreativity, and that is why the results reachedare hardly comparable. This works perceivesthe creativity as a new element, which shouldsupplement the existing economic growththeory based mainly on Paul Romer [30], [31]and its endogenous growth theory. Theendogenous growth theory points out thenecessity of human resource and investmentsin research and development.
These aspects of endogenous theory formalso the creative economics which consideringthe time period completes the theoreticalframework by socio-cultural and urban aspect.Nowadays, The key role is represented byhuman creativity and ideas, which are by thesecreativity produced [14]. In connection with thelevel of development of an individual countrythere are new ideas incorporated to the
common life, increasing the standard of livingand then create the space for furtherdevelopment and human creativity application[20], [32].
The development of a creative economyhas been supported by the enormous developmentof technology [22] which has opened up newpaths in recent years via Internet and othermultimedia (Fig. 1). This technologicaldevelopment contributes to the development ofscience, culture and entertainment and at thesame time makes possible its commercia-lization. Increased investment into scienceincreases the demand for scientific workers.Possibilities in the area of entertainment (film,computer games) have also expandedsignificantly, with an additional increaseddemand for specific professions [18] and at thesame time the creation of space for theemergence of completely new professions.Last but not least, ICT technology hasinfluenced the appearance of already existingprofessions [3] and requires the expansion ofthe knowledge base amongst employees.
TRANSFORMATION OF 3T MODEL TOWARDSTHE COMPARISON OF CREATIVE CENTRESWITHIN THE EUROPEAN UNIONJitka Kloudová, Ondfiej Chwaszcz
Fig. 1: Information Exchange Rate
Source: made by author
EM_04_12_zlom(4) 26.11.2012 13:28 Stránka 56

Ekonomie
57
Development of ICT caused the formationof new social and labour group (the step frommass production to services and knowledgeeconomy is well noticed by Daniel Bell [2]), so-called creative class [6]. Members of this socialgroup nowadays represent main engine ofeconomic development which improves theeconomy by adding new ideas, technology andother creative products [19]. Among creativeclass jobs we count positions from field ofscience, education, culture and in widerconcept also trade, law, finance and healthservice. Florida [8] has been working with thehypothesis that bohemian cities attract creativeand talented individuals, which support thedevelopment of innovations and hi-tech areas.
Members of creative class tend to concentrationand formation of creative centres. Selectedcities and regions then achieve higher econo-mic performance and competiveness. RichardFlorida tries capturing these facts by using so-called 3T factors (technology, talent, tolerance).Florida`s 3T model contains great idea but onthe other hand the practice content is quitelimited (see also critiques by Peck [26] or Pratt[28]). The model itself consist of few selectedindexes while some of them are hard to verify(more in Hartley [12])
Although Florida along with Tinagli [9] haveinnovated their creative index to the Euro-creativity index, its use is still extremely limited.Smaller regions are unable to work with thisindex at all. The technological index, for example,contains indexes concerned with patents whichcan only be placed in a specific location withdifficulty in today's globalized world. The third,and at the same time final index in thiscategory, is the relationship between costs andR&D which, of course, only speaks of inputsand fails to deal with the outputs of the investeditems. Similarly limited indexes can also befound in the areas of tolerance and talent (fora detailed critique of Florida's thesis, seeMalanga [23]; Peck [26]; Markusen [24];Hansen et al. [11]; Hansen [10]).
1. Creativity as a Part of thePotential Economic Growth
The success of selected companies continuesto be evaluated at present in terms of productsand services which creates pressure on thetransformation of the economic system intocontinually more effective forms. Adam Smith
was the first to link the outputs of economicsystems; all forms of division of labour arecarried out due to the existence of lowertransactional costs. As Ronald H. Coase [4]has argued, transaction costs are dependenton established institutions functioning inparticular countries. The institutions consequentlyrepresent the legal, political, social andeducational system along with the culture of thegiven country. In reality it is the sameinstitutions which control the performance ofthe economy [5], [17].
Douglass North [25] provides a moredetailed definition of institutions characterizingthem as a person created with limits making upthe structure of human interactions with the aimof decreasing risk when achieving goals insocial, political and economic areas. Institutionsare created by formal rules (the constitution,laws and legal regulations, directives) andinformal restrictions (norms of behaviour,conventions, actual ideas regarding behaviour)and the ways in which they are enforced. Theseinstitutions consequently define the rules of thegame and determine the direction of furtherdevelopment. A well-established institutionalframework is thus the first presupposition foreconomic growth.
Creativity [29], which is capable of solvingand making more effective existing social andtrade processes in a creative manner, can beviewed as the main driving force for economicgrowth in advanced countries in relation to theestablishment of rules in society.
A creative environment rests on three basicpillars (Fig. 2). The first pillar consists of peoplewho make up the knowledge labour force.Creative employees contribute to the greatestextent to the development of a competitive company.Location is also an essential point in the area ofcreativity and this for two reasons in particular.Geographic location has an influence on theallocation of companies and the labour force. Inaddition, the actual cultural-social equipping ofthe locale also plays an essential role.
The support of local governments canserve to support the development of aninstitutional environment, create a suitablebusiness environment and monitor the area ofintellectual property which plays a key rolewithin the framework of a creative economy.The final pillar consists of a quality educationalsystem as creative centres cannot merely draw
EM_04_12_zlom(4) 26.11.2012 13:28 Stránka 57

Ekonomie
58
from their own potential which is able to attractcreative companies and employees but mustalso be able to create these companies andemployees themselves.
If and when a selected country has a highcreative potential, it has the finest bases fordevelopment and consequent implementationof innovation. Creativity must be focused oninnovations and the acceleration of this deve-lopment; the opposite direction is no longerpossible. Purchasing of highly innovative productsas well as technologies or licenses makingpossible their development is counterpro-ductive without sufficient creative potential(suitable employees and companies) [15]. Newinnovations can be reasonably carried out in
areas which are sufficiently supplied in terms ofproduction factors and which contain a certainlevel of economic development. In the oppositecase, newly produced ideas which emergedfrom the creative potential of selected countrieswould not be of use economically.
If and when the concerned locality hasa corresponding level of production factors andcreates a demand for new ideas for thepurposes of further development, only the finalstep remains, that being the implementation ofthese new innovations into the productionprocess. An effective production process bringswith it lower costs and opens up newpossibilities for business which consequentlyleads to economic growth and competitiveness.
Fig. 2: The system of economic growth in developed regions
Source: made by authors
The presented scheme also indicates thatcreativity contributes significantly to thedevelopment of competitiveness. In contrast, itshould be pointed out that creativity cannotevoke economic growth on its own. The actualcompany cannot function without the basicestablishment of the institutional framework. Ifthe basic rights and the possibilities for theirenforcement are not established, there is noreason to be occupied with economic science.
If and when a company functions on thebasis of freely elected institutions, creativityand potential need to be developed which willbe capable of transforming new ideas into
innovation and consequently also into generalproduction.
These realities are ignored by a number ofeconomists with an interest in the creativeeconomy since economic growth can never bedirectly linked with a creative environment;more influencing factors need to always beconsidered. Supporters of the creative industryoften try to do so when attempting to argue thatan increase in support of the creative industrywill lead to the development of the region.
The creative industry is without a doubta growing branch, but the growth stems fromthe growth to the living standard which is
EM_04_12_zlom(4) 26.11.2012 13:28 Stránka 58
Ekonomie
59
caused by the increase in the creative andinnovation potential of the area. Argumentsvoiced concerning marked support for thecreative industry are thus in the interests ofcertain lobby groups as opposed to an interestin supporting the growth of economic maturity.
The creative economy cannot be defined bya border which would distinctly measure its fieldof activity. The creative economy is based onnew ideas which make up the added value forinputs and contribute thus to the increase ineffectiveness on the side of outputs. Thecreative economy unites the creative ideologyor the cultural industry, creative cities and thecreative class.
2. Choice of Methodology and NewCreative Index
Social development along with the accelerationof development of new technologies hassignificantly influenced the appearance of theworld. Creativity has begun to be a significantaspect contributing to economic growth with thecreative class making up to the greatest extenta new working class; its representation percen-tage wise is growing continually for all workers.The basis for reaching an understanding of thesephenomena is their mapping out. Several authorsare presently working in the area of the creativeenvironment [34], [16], [9], [6], [7], [1], [33].Unfortunately, the majority of the work is limitedto a certain extent: a low number of indexes,a small collection of data, limitations in terms ofuse for merely the territory of the country, etc.
The aim of this study is to map the creativepotential within the selected European countriesand their regional locations. The study itselfworks with 89 cities in Germany, Spain, theNetherland, Finland, Sweden, Estonia andLuxemburg. The sample of the cities was chosenin order to cover both economically developedcountries with high quality of life and touristiccentres. Basic database come from urban auditof Eurostat, which was had lastly done from theinitiative of Directorate-General for Regional Policyat the European Commission in 2006–2007.
For the methodological instrument the NewCreative Index was chosen [21], which was
previously tested on sample of 32 Germanurban regions where it proved the closepositive correlation on the level of 0.7 betweenthis index and the level of GDP per capita. Theconstruction of New Creative Index itself looksto be based on Florida 3T model for the firstsight, but the content of 3T is composed fromdifferent indexes. The use of new indexes ingreater representation (32) eliminates someshortcomings which unable to apply the Floridacreative index to countries in EU or the smallerterritorial units.
3. The Analysis of Creative Potentialof Chosen Countries and theirUrban Regions
The analysis itself works with selected 3T areasseparately at the beginning and for each areathere is the sub-index set which is subse-quently formed into the New Creative Indexitself. Within the analysis of individual areasthere are used index presented and partialresults graphically evaluated. At every singleindex there is proportion between averagevalues among every region with high and lowcreative potential shown. The New CreativeIndex is presented from geographical point ofview in order to enable to evaluate thedistribution of creative potential from this view.It examines the results of the analysis inrelation to external indicators (GDP,demography) for purpose of confirmation orrefusal of suitably selected methodology.
3.1 Talent IndexTalent index is based on basic presumption thateducation is important input of productionprocess. Thus the higher level of education andtalent should accelerate the regional deve-lopment. Within the indexes is examined notjust the potential which is created by regionthrough the educational system but also therepresentation of educated labour in productionprocess. Among indexes of this field we findalso unemployment rate, what responds topresumption that creative centres create biggerjob offer than other regions.
EM_04_12_zlom(4) 26.11.2012 13:28 Stránka 59

Ekonomie
60
The analysis has confirmed that unemploy-ment in regions with high creative potential isby 51 % (1/1.953=51 %) lower than in regionswith low creative potential. All selected indexesshowed the positive correlation to the NewCreative Index within the model. Positivecorrelation of indexes related to educationconfirms its importance. As exceptional outputwe find in fact that higher correlation coefficientwas proved at ratio of labour force withsecondary education (3 or 4 ISCED) of 0.45 to
neutral correlation relation of labour force withtertiary education (5 or 6 ISCED).
The table of localities with a high creativeindex is led by the city of Tartu which is home tothe national university of Estonia (graph Fig. 3).This is followed by the German city of Darmstadtand its well-known technical university. Consequenttowns and cities are also high thanks to theiruniversities which serve to confirm the signi-ficant contribution of these institutions to the deve-lopment of the creative potential of an area.
Tab. 1: Talent Index
Talent Index Top / bottom
Unemployment rate (1/X) 1.953
Proportion of unemployed who are under 25 years old (1/X) 1.518
Students in higher education (ISCED level 5-6) per 100 resident population aged 20-34 1.501
Students in upper and further education (ISCED level 3-4) per 100 resident population aged 15-24
2.82
Prop, of working age population qualified at level 3 or 4 ISCED 1.42
Prop, of working age population qualified at level 5 or 6 ISCED 1.063
Source: Urban Audit - Eurostat; own calculations.
Fig. 3: Talent Index
Source: Urban Audit - Eurostat; own calculations
The small town of Santiago de Compostelawith its ancient university ranked first out of theSpanish towns and cities. On the opposite side
of the talent index were three Spanish cities(Palma di Mallorca, Las Palmas, Hospitalet deLlobregat) preceding Heerlen in the Netherlands.
EM_04_12_zlom(4) 26.11.2012 13:28 Stránka 60

Ekonomie
61
3.2 Technology IndexThis work has emphasized the importance ofICT to development of society and constitutionof creative class just at the beginning. Rapiddevelopment of ICT caused not just changes insocial behaviour but with use of new commu-nication options and share of information there
was routine way of trade changed. At the samemoment the significant demand for new specificwork force was created. For this reason therelevant part of indexes of Technological indexdeals with ICT sector. Beside, the attention ispaid to service sector and the Internet.
Tab. 2: Technology Index
Technology Index Top / bottom
Proportion of employment in industries G-P (NACE Rev, 1) 0.966
Proportion of employment in financial intermediation and business activities 1.257
Percentage of households with Internet access at home 1.665
Proportion of local companies that produce ICT products (max 1) 2.994
Percentage of those employed in manufacturing of ICT products 13.57
Percentage of those employed in the provision of ICT services 2.151
Percentage of those employed in the production of ICT content 2.637
Percent of population over 15 years who regularly use the Internet 1.476
Source: Urban Audit - Eurostat; own calculations
Indexes of individual regions, which comefrom ICT sector, show significant correlationwith New creative Index in almost every cases.This corresponds also to comparison of regionswith high and low creative potential. Here is theonly one index which does not show thedependence and that is the index of ratio ofemployees in service sector. Supposing that
the result is influenced by touristic regionswhere the creative potential was not proved.
In accordance with expectations, Germantowns and cities found their way on the leadingpositions (Karlsruhe, Darmstadt or Nuremberg).Helsinki and Oulu in Finland and Stockholm inSweden were in leading positions from othercountries (graph Fig. 4).
Fig. 4: Technology Index
Source: Urban Audit – Eurstat; own calculations.
EM_04_12_zlom(4) 26.11.2012 13:28 Stránka 61

Ekonomie
62
Two groups can be distinguished at firstglance within the framework of the Spanishtowns and cities. The first is located in theupper half of the creative index with the majoritybeing from the northern part of Spain (Hospi-talet de Llobregat, Vitoria-Gasteiz, Zaragoza,Barcelona). The second group is located inpositions with an extremely low technologicalindex (Las Palmas, Sta. Cruz de Tenerife,Córdoba, Santiago de Compostela, Vigo).
3.3 Tolerance IndexDetermination of tolerance index in formalFlorida’s 3T model was quite controversial.
Therefore, this work tries showing just theindexes measurable, well defined and usableeven for smaller region (Tab. 3). To completethe content of wide sense of tolerance index thebigger number of indexes was used and theywere divided into two areas. That’s how thesub-index, dealing with mobility and based onassumption that attractive location attract newcreative workers which are more mobile thanother people, was created. The other sub-indexis connected to environment which shouldretain and attract members of creative workingclass with contribution of suitable urbanamenities (culture, security, tourism and sport).
Tab. 3: Tolerance Index
Tolerance Index Top / bottom
Tolerance Index – people
EU nationals as a proportion of total population 7.536
Non-EU nationals as a proportion of total population 2.104
Nationals born abroad as a proportion of total population 3.619
Nationals that have moved to the city during the last two years as a proportion of the total population 1.702
EU Nationals that have moved to the city during the last two years as a proportion of the total population 8.705
Non-EU Nationals that have moved to the city during the last two years as a proportion of the total population 1.593
Proportion of Residents who are not EU Nationals and citizens of a country with high HDI 2.159
Moves to city during the last 2 years/moves out of the city during the last 2 years 0.952
Tolerance Index - environment
Total number of recorded crimes per 1,000 population (1/X) 0.101
Green space to which the public has access (m2 per capita) 1.693
Proportion of the area in recreational, sports and leisure use 0.317
Annual cinema attendance per resident 0.548
Number of cinema seats per 1,000 residents 0.835
Annual number of visitors to museums per resident 1.683
Total book and other media loans per resident 1.784
Proportion of employment in culture and entertainment industry 3.553
Tourist overnight stays per 1,000 population at high season 3.784
Tourist overnight stays per 1,000 population at low season 7.481
Source: Urban Audit - Eurostat; own calculations.
Analysis outputs confirm the presumptionthat regions with high creative potential attractother inhabitants. The significant positive
correlation was confirmed either in field of theresidents mobility within a state and in field ofratio of incomers to total population of a region.
EM_04_12_zlom(4) 26.11.2012 13:28 Stránka 62
Ekonomie
63
The mobility sub-index itself correlates withNew Creative Index with strong relation of 0.72.
Much smaller dependence was proved atenvironment sub-index. Significant positivedependence was found at index of ratio ofemployment rate at culture and entertainmentindustry and indexes connected with tourismindustry which corresponds to listed ratio betweenregions with high and low creative potential.
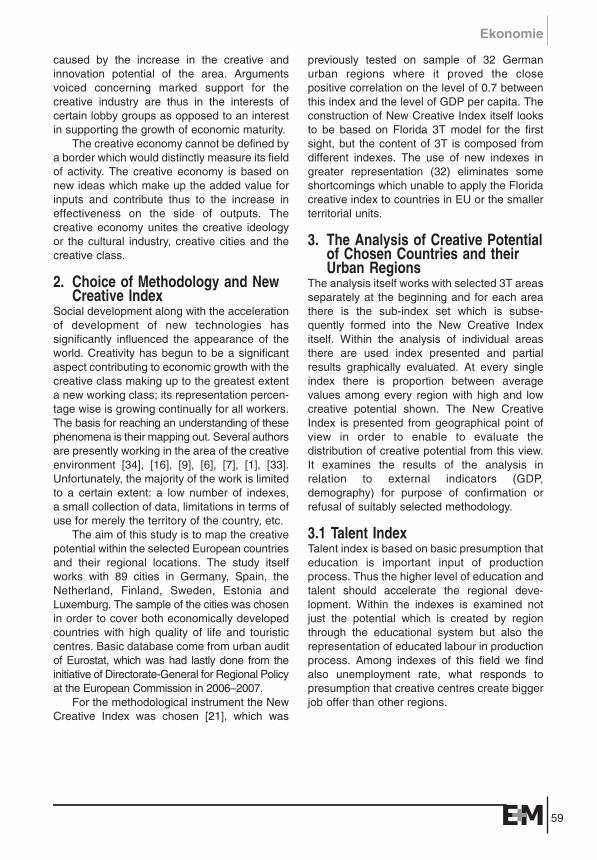
The following graph Fig. 5 depicts the orderof the analysed regions within the framework ofthe tolerance index. In contrast to previousgraph depictions, this graph is expanded by twosmaller indexes. One of these concerns theopenness of the area (Tolerance – People)while the second is focused on the quality ofthe locality and its sporting-cultural possibilities(Tolerance – Environment).
Fig. 5: Tolerance Index
The city of Luxembourg was prominent outof the concrete towns and cities in the area ofthe tolerance index as it revealed twocompletely balanced areas Tolerance – Peopleand the Tolerance Environment. It was followedby two German towns which clearly revealedtheir placement at the forefront of the list thanks to having indexes in the areas ofTolerance – People.
3.4 New Creative IndexThe output of the new creative index ispresented here through methodology whichserves to indicate the creative potential ofselected European regions. A retrospectanalysis of the creative indexes makes itpossible to discover the insufficiencies of theanalysed region. The definition of theseinsufficiencies is the first step toward rectifyingthem and for thereby introducing effective
support which can significantly contribute topreserving and increasing the competitivenessof a region.
Two methodologies were employed withinthe framework of the visualization of the results.The first visualization is the graph Fig. 6 whereall of the analysed regions are arranged ina bar graph in accordance with the size of theindex. It is apparent at first glance that Germantowns and cities are situated in leadingpositions (Darmstadt, Munich, Karlsruhe, Mainz)along with representatives of other countries.Helsinki was at the forefront concerning Finnishtowns and cities. Luxembourg was situated infront of the highest Swedish city Stockholm. Ofinterest is the fact that two Estonian cities(Tartu, Tallinn) were situated in the upper half ofthe examined group.
Towns and cities with a low creativepotential are located in the right part of graph
Source: Urban Audit - Eurostat; own calculations.
EM_04_12_zlom(4) 26.11.2012 13:28 Stránka 63

Ekonomie
64
Fig. 6. It is apparent at first glance that themajority of these regions consist of towns andcities from Spain and the Netherlands withseveral exceptions being located in Sweden(Ãrebro, Jönköping) and Germany (Bielefeld,Mılheim an der Ruhr, Schwerin). As concerns
Spanish regions, towns and cities in the north-east of the country found themselves in leadingpositions (Barcelona, Vitoria- Gasteiz). The lastpositions were held by the towns and cities ofSta. Cruz de Tenerife, Málaga, Vigo andCórdoba.
Fig 6: New Creative Index
Source: Urban Audit – Eurostat; own calculations
The second method of presentation of theresults of the creative potential works with thegeographic placement of the regions. Thismethod makes it possible to detect whether thedivision of creative potential is divided randomlyfrom a geographic perspective or whether thereexists a connection between the allocation ofthe region and its territorial location.
The greatest creative potential can be seenin the towns and cities marked in green (Fig. 7).These locales are most frequently located inGermany, specifically in the centre and southernparts (More on clusters and geographicallocation in Porter [27]). Additional highcreative regions consist of cities located inNorthern Europe. Towns and cities with lowcreative potential (marked in red) are mostoften located in the Netherlands and Spain.
The criterion can be loosely adapted andobserved in the required parts of the areas in
order to achieve clarity. Figure 8 only depictsSpanish towns and cities which were revealedto be localities to a greater or lesser extent withlow creative potential in comparison with theobserved group. A number of the analysedlocalities were focused to a significant extent ontourism. It was specifically these towns andcities which demonstrated a low creativepotential. It should be admitted, however, that thetourist regions have other competitive advan-tages. The geographic location is additionallynon-transferable with significant limited substi-tutes. For these reasons these towns and citieswill not face significant competitive pressure inthe area of creativity. They will be able toincrease the economic potential of the region ifand when they successfully develop and supporttourism despite the fact that the economic growthwill not be connected with innovations and high-tech production.
EM_04_12_zlom(4) 26.11.2012 13:28 Stránka 64

Ekonomie
65
Fig. 7: The new creative index – the geographical allocation
Source: Google maps; own research
Fig. 8: The new creative index – the geographical allocation of the Spanish regions
Source: Google maps; own research.
Note:high = greenlow = red
EM_04_12_zlom(4) 26.11.2012 13:28 Stránka 65

Ekonomie
66
4. Testing of Selected Methodologywith Using of External Indicators
Contribution of creativity within the economicgrowth was outlined at the beginning of thiswork. Subsequently, the New Creative Indexwas created which used for the detection ofcreative potential ratio in selected regions.Basic presumption of creative centres is not
just about greater representation of talent,technology or tolerance but mainly aboutcompetitive advantage, which appears ineconomic results. This basic premise isconfirmed in Table 4 that represents thedependence of selected economic indicatorswith New Creative Index and its associated3T indexes.
Tab. 4: The economic index and the creative potential of regions
Creativity Tolerance Technology Talent Top / bottom
GDP per employed person 0.422 0.471 0.399 0.039 1.311
Proportion of companies that have gone bankrupt
0.125 0.084 0.233 -0.06 2.337
New businesses registered as a proportion of existing 0.437 0.425 0.451 0.074 3.461companies
Source: Urban Audit – Eurostat; own calculations.
Basic premise which emphasised theimportance of creativity is the positivecorrelation (0.42) between New Creative Indexof examined regions and GDP indicator peremployed person. In comparison of absolutenumbers the creative centres reached by 31%higher GDP per employed person than regionswith low creative potential. There was provedbigger business sector activity in creativecentres. In creative centres went bankruptcymore businesses but on the other hand at thesame time much more companies were set up.So the regions with higher creative potentialrespond much faster to changes. The presenceof creativity enables the easier transformation
of private sector and creates new businessesand posts which reflect to changes inenvironment.
Data regarding demography, employmentand the accessibility of the region were includedamong accompanying external indicators whichinvolve non-economical variables (Tab. 5).A significant connection in relation to creativitywas not demonstrated with the demographicdata concerning the proportion of people ofa productive age in relation to the population,despite the fact that a minor positive correlationin relation to the increased mobility of thecreative class could be expected.
Tab. 5: The demography, employment and accessibility of the regions in relationto creative potential
Creativity Tolerance Technology Talent Top / bottom
Proportion of total population aged 25-54
0.091 0.459 -0.076 -0.153 1.005
Proportion of residents unemployed, 15-24 years
-0.484 -0.363 -0.329 -0.453 0.590
Proportion in part-time employment
0.409 0.178 0.405 0.339 1.942
Accessibility by air (EU27=100) 0.421 0.476 0.380 0.057 1.471
Accessibility by rail (EU27=100) 0.341 0.292 0.329 0.119 2.070
Accessibility by road (EU27=100) 0.338 0.277 0.334 0.120 2.018
Source: Urban Audit – Eurostat; own calculations
EM_04_12_zlom(4) 26.11.2012 13:28 Stránka 66

Ekonomie
67
As concerns the unemployment of youngpeople, the study confirmed that unemploymentin the 15-24 age group in creative centres wasat a much lower level (a negative correlationcoefficient). This reality exists due to reasons ofa higher representation of students in thetertiary education and at the same time thedemand for new work positions. The labourmarket in creative centres is much more flexiblewith this being confirmed by additional dataconcerning part-time work. Last but not least, ithas been demonstrated that creative centreshave superior accessibility concerning all typesof transportation.
Conclusion
This study works with current topic of creativeeconomy. Since this is a new field of economicresearch, there are still no generally accepteddefinitions and concept. Because of that it wasnecessary to state the perspective to creativeeconomics at the beginning. In this work thecreative economics is taken for next step ingrowth theories, which should include also thesocial changes. The creative economics isbased on previous theories and complete themby socio-cultural and urban aspect.
Party the expansion of creative economicsis caused by the development of ICT sector.The progress in ICT sector caused changes inmonotonous business models, modified therequirement for common jobs and also createdabsolutely new business areas with specificrequirements for employees. In developedcountries these changes are giving rise to thedecline of basic production factors and the rise inimportance of knowledge, ideas and creativity.
Creativity in and of itself significantlycontributes to economic growth despite the factthat economic success is not only related to thelevel of creativity in an analysed territory, but tomore factors. The primary aspect is the creationof a supporting, independent institutionalframework (Figure 2). It is additionally ofimportance that the analysed areas be capableof transforming the output from the creativeeconomy into the production phase; this factdepends on the successful transformation ofideas into innovation.
Analytic part of this work deals withmapping of creative potential in selectedEuropean countries and their regional locations
by using “New Creative Index” [21], which trieseliminating the shortcoming of previousmodels. This model works with transparentindexes, which are available within allEuropean countries and even within selectedurban areas. The re-analysis of individualcomponents of New creative index are used asthe basic guideline for the analysis of regions.
At the end of the work there is an analysisof New Creative Index in relation to externaleconomical and accompanying indicators. Thework confirmed the existence of dependencebetween this index and economic indicators,what supports the basic presumption aboutcreativity and its influence on economic growth.Countries with high creative potential reachedby 31% higher GDP per employed head thancountries with low creative potential. Within thecorrelation analysis the proximity was aboutlevel of 0.42. The analysis of private sectorbased on number of new establishedbusinesses and bankruptcy companies provedthe much high activity in creative centres. Sothe creativity contributes to much effectivedevelopment of privet business sector.
Furthermore, the work proved in thegeographical point of view that creative centresfrom the monitored complex are found mainly inGermany and big cities of Sweden and Finland.On the other hand the regions with low creativepotential are found predominantly in Spain,which is followed by the Netherland. Closerview on Spanish regions verified that touristiclocation is not sufficient for formation of creativecentres. Regions focused on tourism might beeconomically successful and benefit fromgeographical position and range of offeredservices. It is still remains a question if thetargeted expansion of tourism is capable tokeep the competitiveness of regions within theEuropean context.
This paper was carried out with the financialsupport from IGA UTB No. IGA/59/FaME/11/D.
References[1] BEDNÁ¤, P., GREBENÍâEK, P. Emergingcreative cities: mapping regional capitals in theCzech Republic and Slovakia. In: Advances inEconomics, Risk Management, Political and LawScience: Proceedings of the 1st WSEASInternational Conference on Economics, Politicaland Law Science (EPLS ‘12). Business and
EM_04_12_zlom(4) 26.11.2012 13:28 Stránka 67

Ekonomie
68
Economics Series, 2. 1st ed. Zlín: WSEAS Press,2012, s. 178-183. ISBN 978-1-61804-123-4.[2] BELL, D. The Coming of Post-IndustrialSociety: A Venture in Social Forecasting. NewYork: Basic Books, 1976. ISBN 978-0465097135.[3] CARNOY, M. Sustaining the New Economy:Work, Family, and Community in the InformationAge. Cambridge: Harvard University Press, 2002.ISBN 067400874X.[4] COASE, R. H. The new institutional economics.The American Economic Review. 1988, Vol. 88,No. 2, pp. 72-74. ISSN 0002-8282.[5] CHWASZCZ, O. Konec ãern˘ch krabic, anebnov˘ pohled na struktury fiízení. Scientia etSocietas. 2011, Vol. 7, No. 3, pp. 70-78. ISSN1801-7118.[6] FLORIDA, R. The Rise of the Creative Class:And How It’s Transforming Work, Leisure,Community and Everyday Life. 1st ed. New York:Basic Books, 2002. 416 p. ISBN 0-465-02476-9.[7] FLORIDA, R. The Rise of the Creative Class[online]. Washington Monthly, 2002-05 [cit. 2011-02-28]. Available from: <http://www.washingtonmonthly.com/features/2001/0205.florida.html>.[8] FLORIDA, R. Bohemia and EconomicGeography. Journal of Economic Geography.2002, Vol. 2, No. 1, pp. 55-71. ISSN 1468-2702.[9] FLORIDA, R., TINAGLI, I. Europe in theCreative Age [online]. Carnegie Mellon SoftwareIndustry Center, 2004-02 [cit. 2011-02-26]. 48 p.(PDF). Available from: <http://www.creativeclass.com/rfcgdb/articles/Europe_in_the_Creative_Age_2004.pdf>.[10] HANSEN, H. K. Technology, talent andtolerance – the geography of the creative class inSweden. Rapporter och Notiser 169. Lund: LundUniversity, Department of Social and EconomicGeography, 2007. 91 p.[11] HANSEN, H. K., VANG, J., ASHEIM, B. T. TheCreative class and regional growth: Towardsa knowledge based approach. CIRCLE ElectronicWorking Paper Series 2005/15 [online]. Lund:Lund University, 2005 [cit. 11-02-28]. Availablefrom: <http://www.circle.lu.se/upload/CIRCLE/workingpapers/200515_Hanse n_et_al.pdf>.[12] HARTLEY, J. Creative Industries. Wiley:Wiley – Blackwell, 2004. ISBN 978-1405101479.[13] HEARTFIELD, J. Great Expectations: TheCreative Industries in the New Economy. DesignAgenda, 2000. 32 p. ISBN 0953875806.[14] HOWKINS, J. The Creative Economy: HowPeople Make Money From Ideas. 1st ed. London:Penguin, 2001. ISBN 0140287949.
[15] HOWKINS, J. Understanding the Engine ofCreativity in a Creative Economy. An Interviewwith John Howkins by D. GHELFI [online]. WorldIntellectual Property Organization, c2008. [cit.2011-03-01]. Available from: <http://www.wipo.int/sme/en/documents/cr_interview_howkins.html>.[16] HUI, D., CHUNG-HUNG, N. G., MOK, P.A Study on Hong Kong Creativity Index. Interimreport [online]. The Hong Kong Special Administra-tive Region Government, c2004 [cit. 11-02-28]. 56 p.(PDF). Available from: <http://www.cnel.gov.pt/document/creativity_index_hong_kong.pdf>.[17] JIRÁSKOVÁ, E., ÎIÎKA, M. The Significanceof Business Localization Factors in the CzechRepublic. Creative and Knowledge Society. 2011,Vol. 1, No. 2, pp. 16-36. ISSN 1338-4465.[18] KENNEY, M. The Role of Information,Knowledge and Value in the Late 20th Century.Futures. 1996, Vol. 28, No. 8, pp. 695-707. ISSN0016-3287.[19] KLOUDOVÁ, J. Kreativní ekonomika a jejímûfiení. Ekonomick˘ ãasopis/Journal of Economics.2009, Vol. 57, No. 3, pp. 247-262. ISSN 0013-3035.[20] KLOUDOVÁ, J. et al. Kreativní ekonomika.Vybrané ekonomické, právní, masmediálnía informaãní aspekty. 1st ed. Bratislava:EUROKÓDEX, 2010. ISBN 978-80-89447-20-6.[21] KLOUDOVÁ, J., CHWASZCZ, O. New way ofanalysis of creative centers within Europe.Economics and Management. 2011, Vol. 16, pp. 197-206. ISSN 1822-6515.[22] KRAFTOVA, I., KRAFT, J. Hight Firms and theCreation of Welfare in the EMEA Countries.E+M Ekonomie a Management. 2008, Vol. 11, Iss. 4, pp. 6-20. ISSN 1212-3609.[23] MALANGA, S. The Course of the CreativeClass. City Journal – Winter. 2004, Vol. 14, No. 1,pp. 36-45. ISSN 1060-8540.[24] MARKUSEN, A. Urban development and thepolitics of a creative class: Evidence from a studyof artists. Environment and Planning A. 2006, Vol. 38, No. 10, pp. 1921-1940. ISSN 0308-518X.[25] NORTH, D. C. Economic Performance throughTime. American Economic Review. 1994, Vol. 84,Iss. 3, pp. 359-368. ISSN 0002-8282.[26] PECK, J. Struggling with creative class.International Journal of Urban and RegionalResearch. 2005, Vol. 29, No. 4, pp. 740-770. ISSN1468-2427.[27] PORTER, M. Clusters and the NewEconomics of Competition. Harvard businessreview. 1998, Vol. 76, No. 6, pp. 77-90. ISSN0017-8012.
EM_04_12_zlom(4) 26.11.2012 13:28 Stránka 68

Ekonomie
69
[28] PRATT, A. C. Creative cities: The culturalindustries and the creative class. GeografiskaAnnaler: Series B, Human Geography. 2008, Vol. 90,No. 2, pp. 107-117. ISSN 0435-3684.[29] PRATT, A. C. [Chapter 2], Policy Transfer andthe Field of the Cultural and Creative Industries:What Can be Learned from Europe. In KONG, L.,O’CONNOR, J. Creative Economies, CreativeCities. 1st ed. London: Springer Media, 2009. pp. 9-24. ISBN 978-1-4020-9948-9.[30] ROMER, P. M. Increasing Returns and Long-run Growth. Journal of Political Economy. 1986,Vol. 94, No. 5, pp. 1002-1037. ISSN 0022-3808.[31] ROMER, P. M. Endogenous TechnologicalChange. Journal of Political Economy. 1990, Vol. 98, No. 5, pp. 71-102. ISSN 0022-3808.[32] RUMPEL, P., SLACH, O., KOUTSK ,̄ J.Creative Industries in Spacial Perspective in theOld Industrial Moravian-Silesian Region. E+M Eko-nomie a Management. 2010, Vol. 13, Iss. 4, pp.30-42. ISSN 1212-3609.[33] STOLARICK, K. First Ever Rankings of the 50States on the Creativity Index. Creative Inteligence[online]. 2003, Vol. 1, No. 4 [cit. 2011-03-01]. pp. 1-5.Available from: <http://creativeclass.com/rfcgdb/articles/Creativity%20Index%20Rankings%20for%20U.S.%20States.pdf>.
[34] The Work Foundation. Staying Ahead: TheEconomic Performance of the UK’s CreativeIndustries. [online]. Department for Culture, Mediaand Sport, 2007-06 [cit. 2011-03-01]. 28 p. (PDF).Available from: <http://www.theworkfoundation.com/assets/docs/publications/176_stayingahead.pdf>.
doc. Ing. Jitka Kloudová, Ph.D.Tomas Bata University in Zlín
Faculty of Management and EconomicsDepartment of EconomicsPan European University
Ing. Ondfiej ChwaszczTomas Bata University in Zlín
Faculty of Management and EconomicsDepartment of Economics
Doruãeno redakci: 14. 11. 2011Recenzováno: 3. 1. 2012, 8. 1. 2012Schváleno k publikování: 26. 9. 2012
EM_04_12_zlom(4) 26.11.2012 13:28 Stránka 69

Ekonomie
70
Abstract
TRANSFORMATION OF 3T MODEL TOWARDS THE COMPARISON OF CREATIVE CENTRES WITHIN THE EUROPEAN UNION
Jitka Kloudová, Ondfiej Chwaszcz
This paper presents a new paradigm called “Creative Economics”. The globalization boom anddevelopment of new information and communication technologies (ICT) caused modifications inmany human action activities and business implementation in recent years. In developed countriescreativity and knowledge have become one of the main prerequisites for economic growth andmaintaining of competitiveness. This paper responds to these changes and together with use ofNew creative index analyses creative potential in selected countries of the European Union(Germany, Spain, the Netherland, Sweden, Finland, Estonia, Luxembourg) and their regionallocations (89 cities). As a result the basic premise is confirmed, the creative ratio responds toeconomical performance of the region. In the paper the structure of New creative index is shown(32 indicators), the results of the index are illustrated by transparent graphical demonstrations. Theconstruction of New Creative Index itself looks to be based on Florida 3T model for the first sight,but the content of 3T is composed from different indexes. The use of new indexes in widerrepresentation eliminates some shortcomings which unable to apply the Florida creative index tocountries in EU or the smaller territorial units. The regions with high creative potential are found inGermany and big cities of Sweden and Finland. On the other hand the regions with low creativepotential are found predominantly in Spain, which is followed by the Netherland. Closer view onSpanish regions verified that touristic location is not sufficient for formation of creative centers.
Key Words: creative economics, new creative index, Richard Florida, creativity, creativeregions.
JEL Classification: A13, C23, O11, R11.
EM_04_12_zlom(4) 26.11.2012 13:28 Stránka 70
![3T]caP[[h ]Tgc [TeT[ 3T[TQaPcT - Novotel Sydney Central · 3t[tqapct 3t]cap[[h 5if(spwf$pdlubjm1bdlbhf qfsqfstpo ipvsdbobqft ipvstpgcfwfsbhft $pdlubjm1bdlbhf qfsqfstpo ipvstpgefmjdjpvt{dbobqft{](https://img.dokumen.tips/doc/110x75/5f6aa72c2199805f6a1a97e5/3tcaph-tgc-tet-3ttqapct-novotel-sydney-central-3ttqapct-3tcaph-5ifspwfpdlubjm1bdlbhf.jpg)