Embed Size (px)
Citation preview

RESEARCH ARTICLE Open Access
Transcriptome sequencing of field pea and fababean for discovery and validation of SSR geneticmarkersSukhjiwan Kaur1, Luke W Pembleton1, Noel OI Cogan1, Keith W Savin1, Tony Leonforte2, Jeffrey Paull4,Michael Materne2 and John W Forster1,3*
Abstract
Background: Field pea (Pisum sativum L.) and faba bean (Vicia faba L.) are cool-season grain legume species thatprovide rich sources of food for humans and fodder for livestock. To date, both species have been relative‘genomic orphans’ due to limited availability of genetic and genomic information. A significant enrichment ofgenomic resources is consequently required in order to understand the genetic architecture of importantagronomic traits, and to support germplasm enhancement, genetic diversity, population structure anddemographic studies.
Results: cDNA samples obtained from various tissue types of specific field pea and faba bean genotypes weresequenced using 454 Roche GS FLX Titanium technology. A total of 720,324 and 304,680 reads for field pea andfaba bean, respectively, were de novo assembled to generate sets of 70,682 and 60,440 unigenes. Consensussequences were compared against the genome of the model legume species Medicago truncatula Gaertn., as wellas that of the more distantly related, but better-characterised genome of Arabidopsis thaliana L.. In comparison toM. truncatula coding sequences, 11,737 and 10,179 unique hits were obtained from field pea and faba bean. Totalsof 22,057 field pea and 18,052 faba bean unigenes were subsequently annotated from GenBank. Comparison tothe genome of soybean (Glycine max L.) resulted in 19,451 unique hits for field pea and 16,497 unique hits for fababean, corresponding to c. 35% and 30% of the known gene space, respectively. Simple sequence repeat (SSR)-containing expressed sequence tags (ESTs) were identified from consensus sequences, and totals of 2,397 and 802primer pairs were designed for field pea and faba bean. Subsets of 96 EST-SSR markers were screened forvalidation across modest panels of field pea and faba bean cultivars, as well as related non-domesticated species.For field pea, 86 primer pairs successfully obtained amplification products from one or more template genotypes,of which 59% revealed polymorphism between 6 genotypes. In the case of faba bean, 81 primer pairs displayedsuccessful amplification, of which 48% detected polymorphism.
Conclusions: The generation of EST datasets for field pea and faba bean has permitted effective unigeneidentification and functional sequence annotation. EST-SSR loci were detected at incidences of 14-17%, permittingdesign of comprehensive sets of primer pairs. The subsets from these primer pairs proved highly useful forpolymorphism detection within Pisum and Vicia germplasm.
* Correspondence: [email protected] of Primary Industries, Biosciences Research Division, VictorianAgriBiosciences Centre, 1 Park Drive, La Trobe University Research andDevelopment Park, Bundoora, Victoria 3083, AustraliaFull list of author information is available at the end of the article
Kaur et al. BMC Genomics 2012, 13:104http://www.biomedcentral.com/1471-2164/13/104
© 2012 Kaur et al; licensee BioMed Central Ltd. This is an Open Access article distributed under the terms of the Creative CommonsAttribution License (http://creativecommons.org/licenses/by/2.0), which permits unrestricted use, distribution, and reproduction inany medium, provided the original work is properly cited.

BackgroundThe Fabaceae (Leguminosae) is the third largest angios-perm family, containing c. 18,000 species attributed to650 genera [1-3]. Legumes provide major benefits tocropping systems and the environment, due to the abilityto perform symbiotic nitrogen fixation. In comparison tocereals, for which a broad range of genetic and genomicresources are available, genomic databases for legumesare generally still underdeveloped. However, recentadvances in sequencing and genotyping technologiesoffer the opportunity to rapidly ameliorate the status ofgiven species at relatively low cost [4]. Major efforts arecurrently being directed towards the development of spe-cies-specific genomic tools and datasets. As an example,the whole genome sequence of soybean, a warm-seasongrain legume, has recently been determined http://www.phytozome.net/soybean[5].Cool-season food legumes within the Hologalegina
clade of the Fabaceae sub-family Papilionoideae, whichincludes lentil, chickpea, field pea and faba bean (pulses),are important food and fodder crops, especially in devel-oping countries such as those of the Indian sub-continent[6]. These species are important components of farmingsystems across Western Asia, the Middle East, NorthAfrica, the Indian sub-continent, North America andAustralia. In Australia, pulses are sown over c. 2 millionhectares and produce c. 2.5 million tonnes of grain witha commodity value of over AU$ 675 million [7]. Despiteclose phylogenetic relationships, pulse species vary con-siderably in aspects of biology such as genome size, fun-damental chromosome number, ploidy level, and degreeof reproductive self-compatibility. The genome size ofchickpea is relatively small (c. 700 Mb), but pulses of theVicieae tribe (lentil, pea and faba bean) exhibit much lar-ger genome sizes (in the range from 4-13 Gb). Recently,generation of large-scale lentil transcriptome data by ourgroup has substantially increased the volume of publiclyavailable genomic data for this species [8]. Similar strate-gies have been pursued for field pea and faba bean in thecurrent study.Field pea, which is the third most globally important
grain legume crop (at 5.5 million hectares per year) aftersoybean and common bean (Phaseolus vulgaris L.), is aself-pollinating diploid (2n = 2x = 14) species with a gen-ome size of c. 5 Gbp [1]. Various studies have been per-formed to determine the genetic basis of multiplephenotypic traits in field pea [9-11] and to quantify diver-sity between different pea cultivars [12-16]. Recently, acomprehensive transcriptome analysis of field pea hasbeen performed using second-generation sequencing tech-nologies [17] that will contribute significantly to theenrichment of genomics resources for field pea. In con-trast, faba bean has not been widely adopted on a globalbasis. In terms of cultivation area, this species ranks fourth
among the cool-season food legumes (at 2.6 million hec-tares per year) after field pea, chickpea and lentil http://faostat.fao.org. Faba bean has been traditionally cultivatedin the Mediterranean basin, the Nile valley, Ethiopia, Cen-tral and East Asia, Latin America, Northern Europe, NorthAmerica and Australia [18]. Faba bean is a diploid taxon(2n = 2x = 12), and exhibits facultative cross-pollination atfrequencies ranging from 4-84%. The nuclear genome sizeof faba bean is one of the largest yet described amongcrop legumes, at c. 13 Gb. Formal genetic analysis of fababean, such as through genetic linkage mapping and identi-fication of quantitative trait loci (QTLs), has so far beenhindered by these aspects of biology [19].Conventional breeding methods based on phenotypic
assessment are currently in use for breeding line selec-tion in field pea and faba bean. Such methods are logis-tically demanding and time-consuming, especially fortraits that require specific biotic or abiotic challenges,such as resistance to individual diseases. In addition tothis, when breeding for types eaten as immature seed,quality testing adds considerable complexity to the rele-vant programs. There is consequently a major require-ment for species-specific molecular genetic markers andderived linkage maps for field pea and faba bean, toenable germplasm advancement through genomics-assisted selection.Current publicly available genetic and genomic tools
for field pea and faba bean are limited in extent [20-23],comprising 18,552 and 5,253 ESTs, respectively that areavailable in Genbank. In addition to this, a recentlysequenced Pisum sativum transcriptome generated atotal of 81,449 unigenes that are also available for down-load as a fully annotated fasta format [17]. Second-generation DNA sequencing systems such as the Roche454 massively-parallel pyrosequencing platform are cap-able of rapidly producing species-specific genomicresources to address these short-comings. This systemcan generate 4-6 × 10⁸ bp from each run, with indivi-dual read lengths of 400-500 bp [24], and is suitable forde novo sequencing of small genomes [25], whole gen-ome resequencing [26], SNP detection [27], and in parti-cular, sequencing of transcriptomes [28].ESTs obtained from the latter activity provide valuable
resources for gene discovery, large-scale expression ana-lysis, improved genome annotation, elucidation of phylo-genetic relationships and facilitation of breedingprograms for both plants and animals through provisionof SSR and single nucleotide polymorphism (SNP)genetic markers [29]. SSR loci have been widely used forimprovement of a range of crop species [30]. Only alimited number of SSRs are available in public domainfor field pea and faba bean, creating an incentive forfurther discovery and validation. In comparison withgenomic DNA-derived SSRs, those located in ESTs are
Kaur et al. BMC Genomics 2012, 13:104http://www.biomedcentral.com/1471-2164/13/104
Page 2 of 12

functionally associated with genic regions, and supportpotential diagnostic genetic marker development[31-34].This study describes the development, de novo assembly
and gene annotation of a transcriptome dataset derivedfrom cDNA samples obtained from several tissues at var-ious stages of development of multiple field pea and fababean genotypes. Clustering and annotation to generate aunigene set has permitted computational identification ofSSR loci, and the design and evaluation of a set of EST-SSR marker-directed primer pairs.
Materials and methodsPlant materialSeeds of field pea were obtained from the AustralianTemperate Field Crops Collection (ATFCC) held at theDepartment of Primary Industries, Horsham, Victoria,Australia. Faba bean seeds were obtained from the Aus-tralian faba bean breeding program at The University ofAdelaide, South Australia, Australia. Three to four seedsfrom each variety of field pea (Parafield, Yarrum, Kaspa,96-286*) and faba bean (Icarus, Ascot) were selectedbased on the criteria of genetic diversity and significantagronomic variation, and were sown into commercialpotting mix. These genotypes were also potential parentsfor the genetic mapping populations of field pea and fababean, to be used to dissect various traits of interest.Germinated plantlets were grown to maturity underglasshouse conditions with natural light at the Depart-ment of Primary Industries, Bundoora, Victoria, Austra-lia. Selected plant tissues were harvested for RNAisolation from plants at various stages of development,including leaf (young and mature), stem, flowers, imma-ture pods, mature pods and immature seeds. A total of 4-8 seeds were also germinated in Petri dishes in order toprovide material for harvest of seedling root and shootsamples. All of the vegetative plant tissues (leaf and stem)were pooled for RNA isolation and designated LS (leaf/stem) tissue. All of the reproductive organs includingflowers, immature pods, mature pods and immatureseeds were also pooled for RNA isolation and designatedFS (flower/seed) tissue. The seedling-derived root (RG)and shoot (SG) samples were used separately for RNAisolation.
RNA isolation and cDNA preparationTotal RNA isolation and cDNA synthesis were per-formed as described in an equivalent study performedfor lentil [8].
EST sequence generation, assembly and annotationcDNAs obtained from the four distinct RNA pools (LS,FS, RG and SG) were combined in equimolar ratio beforeproceeding to GS FLX library preparation.
Approximately 5 μg of bulked cDNA was sheared by neb-ulisation at 206 kPa for 2-4 min. The GS FLX Titaniumshotgun libraries were constructed following manufac-turer’s instructions (Roche Diagnostics, Castle Hill,NSW, Australia). The ssDNA libraries were quantifiedusing real-time quantitative PCR. Finally, emulsion (em)PCR was performed using the Lib-L emPCR protocol(Roche Diagnostics, Castle Hill, NSW, Australia). Theenriched beads obtained as a result of em-PCR wereloaded onto picotitre plates for sequencing. All of thepooled cDNA libraries obtained from different genotypesof field pea and faba bean were separately sequenced onindividual quarters of picotitre plates.All sequence reads generated from different genotypes
were de novo assembled using the Next Gene software(Softgenetics, State College, Pennsylvania, USA). Theadaptor and primer sequences were removed prior to theassembly using the ‘trimming’ function (trim sequenceswith 100% similarity to the primer/adaptor sequence). Denovo assembly was performed using the Greedy algo-rithm and error correction condensation. The Greedyalgorithm searches for maximum overlap between readsand extends the overlap to form large contigs and isrecommended for 454 reads or reads with average readlength > 70 bp. The error correction condensation toolfunctions by dividing sequence reads in which homopoly-mers are found and at least 16 bases intervene betweenthe homopolymer runs. These shorter reads were termedkeywords, and comparison of keywords between readsallowed the correct determination of the bases at the endof each keyword. Sequence reads that contain variationsof low frequency were then corrected.Assembled contig outputs were deposited in the Tran-
scriptome Shotgun Assembly (TSA) of GenBank (fieldpea; JR950756-JR964200 and faba bean; JR964201-JR970413). Contigs and singletons were compared againstthe M. truncatula (Mt 3.0), A. thaliana (TAIR 9 CDS[coding sequences]), G. max (Glyma 1.0) and P. sativum[17] transcriptome databases using BLASTN [35] with athreshold E value of 10-10. Both field pea and faba beanunigene sets were also BLASTN analysed against respec-tive EST and nucleotide sequences publicly available inGenBank. BLASTN analysis was also performed in thenon-redundant database of GenBank using the tBLASTXalgorithm to derive putative annotations of the unigeneset. Gene ontology (GO) terms were assigned to unigenesthat showed hits against the Arabidopsis thaliana databaseusing the ‘Gene Ontology at TAIR’ tool.
Discovery of EST-SSRs, primer design and markervalidationDetection of EST-SSR loci and primer pair design wasperformed using the Batch Primer3 software http://probes.pw.usda.gov/cgi-bin/batchprimer3/batchprimer3.
Kaur et al. BMC Genomics 2012, 13:104http://www.biomedcentral.com/1471-2164/13/104
Page 3 of 12
cgi. The parameters were designed for identification ofperfect di-, tri-, tetra-, penta-, and hexanucleotide motifswith minimum of repeat numbers of 6, 4, 3, 3, and 3,respectively. Primer design parameters were set as fol-lows: length range = 18 to 23 nucleotides with 21 as opti-mum; PCR product size range = 100 to 400 bp; optimumannealing temperature = 55°C; and GC content 40-60%,with 50% as optimum.Genomic DNA was extracted from target plant geno-
types for EST-SSR marker validation using the DNeasy®
96 Plant Kit (QIAGEN), following the manufacturer’sinstructions. Frozen leaf tissue from each genotype wasused for each extraction and ground using a Mixer Mill300 (Retsch®, Rheinische Straße, Haan, Germany). DNAwas resuspended in 50 μl of water and dilutions wereperformed to obtain a final concentration of 10 ng/μl,followed by storage at -20°C. A collection of randomlyselected EST-SSR primer pairs were validated experi-mentally, forward primers being synthesised with addi-tion of a bacteriophage M13-matching sequence, toenable fluorescent tail addition through the PCR ampli-fication process [36]. PCR conditions included a hot-start at 95°C for 10 minutes, followed by 10 cycles of94°C for 30 s, 60-50°C for 30 s and 72°C for 30 s, fol-lowed by 25 cycles of 94°C for 30 s, 50°C for 30 s and72°C for 30 s and a final elongation step of 72°C for10 min. PCR products were separated using anABI3730xl (Applied Biosystems, Foster City, California,USA) according to manufacturer’s instructions with theaddition of the ABI GeneScan LIZ500 size standard andamplification product sizes were determined using theGeneMapper® v3.7 software (Applied Biosystems).
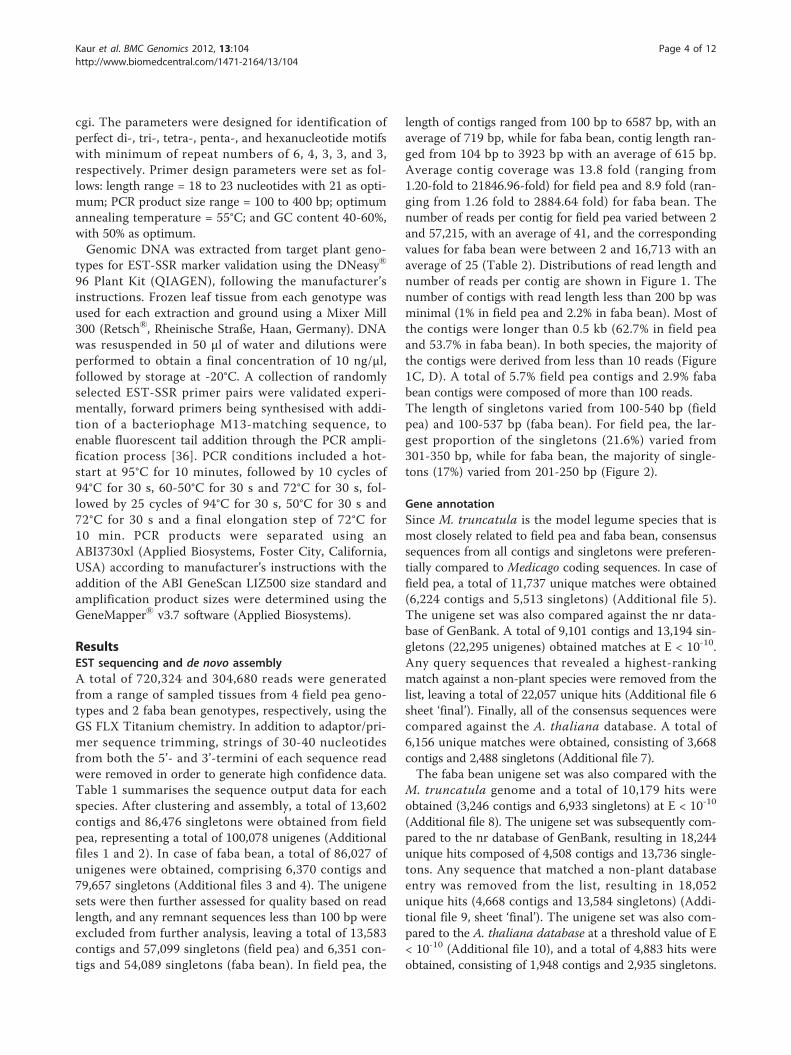
ResultsEST sequencing and de novo assemblyA total of 720,324 and 304,680 reads were generatedfrom a range of sampled tissues from 4 field pea geno-types and 2 faba bean genotypes, respectively, using theGS FLX Titanium chemistry. In addition to adaptor/pri-mer sequence trimming, strings of 30-40 nucleotidesfrom both the 5’- and 3’-termini of each sequence readwere removed in order to generate high confidence data.Table 1 summarises the sequence output data for eachspecies. After clustering and assembly, a total of 13,602contigs and 86,476 singletons were obtained from fieldpea, representing a total of 100,078 unigenes (Additionalfiles 1 and 2). In case of faba bean, a total of 86,027 ofunigenes were obtained, comprising 6,370 contigs and79,657 singletons (Additional files 3 and 4). The unigenesets were then further assessed for quality based on readlength, and any remnant sequences less than 100 bp wereexcluded from further analysis, leaving a total of 13,583contigs and 57,099 singletons (field pea) and 6,351 con-tigs and 54,089 singletons (faba bean). In field pea, the
length of contigs ranged from 100 bp to 6587 bp, with anaverage of 719 bp, while for faba bean, contig length ran-ged from 104 bp to 3923 bp with an average of 615 bp.Average contig coverage was 13.8 fold (ranging from1.20-fold to 21846.96-fold) for field pea and 8.9 fold (ran-ging from 1.26 fold to 2884.64 fold) for faba bean. Thenumber of reads per contig for field pea varied between 2and 57,215, with an average of 41, and the correspondingvalues for faba bean were between 2 and 16,713 with anaverage of 25 (Table 2). Distributions of read length andnumber of reads per contig are shown in Figure 1. Thenumber of contigs with read length less than 200 bp wasminimal (1% in field pea and 2.2% in faba bean). Most ofthe contigs were longer than 0.5 kb (62.7% in field peaand 53.7% in faba bean). In both species, the majority ofthe contigs were derived from less than 10 reads (Figure1C, D). A total of 5.7% field pea contigs and 2.9% fababean contigs were composed of more than 100 reads.The length of singletons varied from 100-540 bp (fieldpea) and 100-537 bp (faba bean). For field pea, the lar-gest proportion of the singletons (21.6%) varied from301-350 bp, while for faba bean, the majority of single-tons (17%) varied from 201-250 bp (Figure 2).
Gene annotationSince M. truncatula is the model legume species that ismost closely related to field pea and faba bean, consensussequences from all contigs and singletons were preferen-tially compared to Medicago coding sequences. In case offield pea, a total of 11,737 unique matches were obtained(6,224 contigs and 5,513 singletons) (Additional file 5).The unigene set was also compared against the nr data-base of GenBank. A total of 9,101 contigs and 13,194 sin-gletons (22,295 unigenes) obtained matches at E < 10-10.Any query sequences that revealed a highest-rankingmatch against a non-plant species were removed from thelist, leaving a total of 22,057 unique hits (Additional file 6sheet ‘final’). Finally, all of the consensus sequences werecompared against the A. thaliana database. A total of6,156 unique matches were obtained, consisting of 3,668contigs and 2,488 singletons (Additional file 7).The faba bean unigene set was also compared with the
M. truncatula genome and a total of 10,179 hits wereobtained (3,246 contigs and 6,933 singletons) at E < 10-10
(Additional file 8). The unigene set was subsequently com-pared to the nr database of GenBank, resulting in 18,244unique hits composed of 4,508 contigs and 13,736 single-tons. Any sequence that matched a non-plant databaseentry was removed from the list, resulting in 18,052unique hits (4,668 contigs and 13,584 singletons) (Addi-tional file 9, sheet ‘final’). The unigene set was also com-pared to the A. thaliana database at a threshold value of E< 10-10 (Additional file 10), and a total of 4,883 hits wereobtained, consisting of 1,948 contigs and 2,935 singletons.
Kaur et al. BMC Genomics 2012, 13:104http://www.biomedcentral.com/1471-2164/13/104
Page 4 of 12

Finally, the field pea and faba bean unigene sets were alsocompared against the G. max EST sequence database thatidentified 19,451 unique matches for field pea and 16,497for faba bean (Additional file 11). ‘The contigs and single-tons obtained from field pea in the current study were alsocompared against the unigene set generated from tran-scriptome analysis of field pea performed by Franssen etal. (2011) and as a result, a total of 45,161 overlapping hitswere identified (10,832 contigs [24%] and 34,329 single-tons [76%]) (Additional file 12). In some instances, morethan one contig revealed hits to the same gene, which maybe due to origin of more than one contig or singletonfrom a single gene due either to non-overlapping sequencereads or high levels of sequence error in a single read. Thisprocess has also demonstrated the benefits obtained fromcomparison between two complementary studies.All of the ESTs and nucleotide sequences currently
available in GenBank for field pea and faba bean were alsodownloaded on the local server to perform BLASTNsearches against field pea and faba bean contigs and sin-gletons obtained from the current study. In case of fieldpea, a total of 2,764 EST and 77,431 nucleotide sequencesobtained from Genbank showed significant hits againstunigene set generated in the current study (correspondingto 2,244 and 31,624 unique hits, respectively) (Additional
file 13, sheets 1-2). For faba bean, a total of 549 ESTs (222unique matches against faba bean unigene set) and 3,684nucleotides (1,277 unique matches against faba bean uni-gene set) were found be common between Genbank andtranscriptome data generated from the current study(Additional file 13, sheets 3-4).All unique matches obtained from field pea and faba
bean contigs by comparison against the A. thaliana data-base were annotated and GO terms were furtherassigned. For field pea, a total of 22,068 gene counts and30,739 annotation counts were obtained, while for fababean, these corresponding values were 11,869 genecounts and 17,075 annotation counts. Proportions ofeach unigene set attributed to major functional categorieswere determined (Figures 3, 4, 5, 6, 7, 8). In case of fieldpea, the intracellular component category of the cellularcomponent classification class contributed the largestproportion of all annotations (19%), followed by the cyto-plasmic component (15%), chloroplast component (11%),membrane component (11%), nuclear component andplasma membrane component (7%) categories. Othercomponents such as plastid, cytosol, mitochondria, ER,golgi apparatus, cell wall, ribosome and extracellularcomponents were represented at proportions less than5% of total (Figure 3). Among the molecular function
Table 1 Summary of GS FLX sequencing outputs (total number of reads, cumulative sequence output, median readlength, number of reads used for assembly)
Species Total number of reads generated Cumulative sequence (Mbp) Median read length (bp) Number of reads used for assembly
Field pea 720,324 261 389 687,200
Faba bean 304,680 83 277 248,448
Table 2 Summary of data on contig assemblies for field pea and faba bean
Number of reads per contig Number of contigs Percentage of total contigs per read number class
Field pea Faba bean Field pea Faba bean
2 239 71 1.8 1.1
3 642 247 4.7 3.9
4 1504 768 11.1 12.1
5 1348 747 9.9 11.8
6 1129 645 8.3 10.2
7 897 494 6.6 7.8
8 785 402 5.8 6.3
9 579 325 4.3 5.1
10 514 267 3.8 4.2
11-15 1573 772 11.6 12.2
16-20 873 343 6.4 5.4
21-25 512 231 3.8 3.6
26-30 409 184 3.0 2.9
31-35 310 129 2.3 2.0
36-40 269 83 2.0 1.3
41-45 221 84 1.6 1.3
46-50 173 78 1.3 1.2
> 50 1606 481 11.8 7.6
Kaur et al. BMC Genomics 2012, 13:104http://www.biomedcentral.com/1471-2164/13/104
Page 5 of 12

classification class, the enzyme activity, binding activity,hydrolase activity, transferase activity, molecular functionand nucleotide binding categories included the majorityof detected matches (Figure 4). In the biological pro-cesses classification class, cellular (26%) and metabolicprocesses (22%) constituted the major categories, fol-lowed by protein metabolism (9%) and unknown biologi-cal processes (7%), (Figure 5). Similar results wereobtained for faba bean. In the cellular component classifi-cation class, the major contributors were intracellularand cytoplasmic components (20% and 16% respectively)(Figure 6). The enzyme activity (16%), binding activity(14%) and unknown molecular functions (10%) categoriescontributed the most in molecular function classificationclass (Figure 7) while among the biological processesclassification class, cellular and metabolic processes (25%and 23% respectively) constituted the major categories(Figure 8).
EST-SSR discoveryIn field pea, EST-SSR discovery was performed based onanalysis of assembled contig templates, of which 2,345
(17%) contained at least one repetitive motif. A total of2,932 distinct loci were identified, 588 template contigscontaining at least two SSR loci eligible for primer pairdesign. A total of 2,397 SSR primer pairs were designedfrom these 2,932 distinct loci (Additional file 14, sheetFieldpea). In the case of faba bean, a total of 1,097 dis-tinct loci were identified in 914 of 6,351 assembled con-tigs (14%), from which 802 SSR primer pairs weredesigned (Additional file 14 sheet Fababean). Incidencesof different repeat types were determined (Table 3), themost abundant being trinucleotide arrays for both fieldpea (1,383; 57.7%) and faba bean (495; 61.7%). Frequen-cies for each array type according to repeat unit numberwere also evaluated (Table 3), the most common classbeing n = 4 (43.3% for field pea and 48.6% for fababean).
Validation of EST-SSR assaysA subset of 96 EST-SSR primer pairs each from field peaand faba bean data sets were selected for validation ofmarker assay performance. For field pea, a total of 86(90%) successfully obtained amplification products from
0
200
400
600
800
1000
1200
1400
100-200
201-300
301-400
401-500
501-600
601-700
701-800
801-900
901-1000
1001-1100
1101-1200
1201-1300
1301-1400
1401-1500
>1500
Read length (bp)
No
. o
f c
on
tig
s
0
500
1000
1500
2000
2500
3000
3500
4000
<10 <20 <30 <40 <50 <60 <70 <80 <90 <100 100-1000 >1000
No. of reads
No
. o
f co
nti
gs
0
500
1000
1500
2000
2500
3000
100-200
201-300
301-400
401-500
501-600
601-700
701-800
801-900
901-1000
1001-1100
1101-1200
1201-1300
1301-1400
1401-1500
>1500
Read length (bp)
No. of contig
s
0
1000
2000
3000
4000
5000
6000
7000
8000
<10 <20 <30 <40 <50 <60 <70 <80 <90 <100 100-1000
>1000
No. of reads
No. of
con
tigs
(A)- Field pea (B)- Faba bean
(C)- Field pea (D)- Faba bean
Figure 1 Frequency histograms showing the distribution of number of contigs versus function of read length (A, B)/no. of reads (C, D)in field pea and faba bean, respectively.
Kaur et al. BMC Genomics 2012, 13:104http://www.biomedcentral.com/1471-2164/13/104
Page 6 of 12

one or more template genotypes, of which 40 (46.5%)revealed polymorphism between 5 genotypes of field pea.Inclusion of a template sample from the non-domesticatedspecies PS3689 (wild type landrace accession of Pisumsativum from Afghanistan) permitted polymorphism
detection by 11 additional primer pairs (an increase to59.3% of total) (Additional file 15, sheet Fieldpea). For fababean, 81 primer pairs (84%) exhibited successful amplifica-tion, of which 24 detected polymorphic (29.6%) betweencultivated V. faba genotypes (Icarus and Ascot). When thenon-domesticated V. faba genotype ACC118 was includedin the analysis, polymorphism rate increased to 48%(Additional file 15, sheet Fababean).
DiscussionEST assembly and gene annotationThe increasing capacity of DNA sequencing technolo-gies has permitted substantial increases in genomic
Figure 2 Frequency histograms indicating the distribution ofnumber of singletons as a function of read length in field pea(A) and faba bean (B).
Figure 3 Pie-chart representation of GO annotation resultsfrom field pea consensus sequences for cellular processcomponents.
Figure 4 Pie-chart representation of GO annotation resultsfrom field pea consensus sequences for molecular processcomponents.
Figure 5 Pie-chart representation of GO annotation resultsfrom field pea consensus sequences for biological processcomponents.
Kaur et al. BMC Genomics 2012, 13:104http://www.biomedcentral.com/1471-2164/13/104
Page 7 of 12

resource availability for several legume crops that hadbeen previously underdeveloped. Recently, large-scaletranscriptome characterisation using the GS FLX plat-form has been performed for both lentil and pigeonpea[8,37]. This technology can deliver large amounts ofdata at considerably lower costs as compared to tradi-tional sequencing methods, and so provides an effectivemeans to expedite analysis of less-studied species [31].In the present study, equivalent approaches have beenapplied to the two Vicieae species, field pea and fababean, in order to develop a transcribed sequence data-base and to identify and validate EST-SSRs.
GS FLX sequencing has been shown to ineffectivelyprocess homopolymer regions that are longer than 8 bpin length [38]. Therefore, poly(A) tails at mRNA terminimay present major challenges, and result in under-representation of the 3’-ends of transcripts. In the pre-sent study, the problem was resolved through use of amodified primer with an interrupted polyd(T) tail. Thiscontributed to an increase in the output of the totalnumber of sequenced fragments by c. 6% (data notshown). A number of other transcriptome studies haveused the same approach to overcome the homopolymersequencing problems [39,40].Prior to sequencing, normalisation of the cDNA sam-
ples obtained from leaf and stem tissues was performedin order to increase the sequencing efficiency of raretranscripts. The normalisation process helps to reduceover -sampling of abundant transcripts that are presen-tin high quantities, hence increasing confidence ofdetecting a larger proportion of rare transcripts. Preli-minary experiments indicated that normalisation of leaf/stem cDNA could increase the possibility of detectingrare transcripts by c. 10% (unpublished data). Similarapproaches have been applied to detect rare transcriptsin lentil, M. truncatula, Artemisia annua and green-house whitefly [8,41-43].The average contig lengths for the target species in
this study are comparable to those observed in otherstudies (Pisum sativum, 454 bp [17], Pinus contorta, 500bp [44]; lentil, 770 bp [8]; sweet potato, 790 bp [45];mungbean, 843 bp [19]). A large proportion of the readsassembled into contigs in case of field pea (87%), whichis comparable to the values observed in other studies(Glanville fritillary butterfly, 91% [46]; Eucalyptusgrandis, 88% [47]; Acropora millepora larvae, 90% [48]).
Figure 6 Pie-chart representation of GO annotation resultsfrom faba bean consensus sequences for cellular processcomponents.
Figure 7 Pie-chart representation of GO annotation resultsfrom faba bean consensus sequences for molecular processcomponents.
Figure 8 Pie-chart representation of GO annotation resultsfrom faba bean consensus sequences for biological processcomponents.
Kaur et al. BMC Genomics 2012, 13:104http://www.biomedcentral.com/1471-2164/13/104
Page 8 of 12

In contrast, a relatively smaller proportion (65%) ofreads from faba bean assembled into contigs, resultingin lower length and depth as compared to the dataderived from field pea. This may be due to the fact thatthe sequencing output for faba bean was comparativelysmaller than that of field pea. Similar results have beenobserved in other studies [45]. As a result of de novoassembly, a large number of singletons were obtainedboth for field pea (86,476) and faba bean (79,657), alsoas observed for other species [17,42,44,48]. Althoughsome singletons may arise as contaminating sequencesor artefacts, the majority probably originate from tran-scripts expressed at low levels, and were consequentlyretained in the dataset. Many singleton sequences (15%for field pea and 17% for faba bean) exhibited high readquality due to matching of protein-encoding genes inthe existing genic databases, and hence provide valuablesources of information. The remaining singletons couldhave resulted from various reasons such as incomplete-ness of known databases, sequencing errors, short readlengths leading to difficulty in assembly etc. [8,31].BLAST searches against databases of model plant spe-
cies provided annotation data for field pea and faba beanESTs, with totals of 22,057 and 18,052 unique hits, respec-tively. These values are very close to the estimated numberof total genes (c. 25,000) present in a typical diploid plantgenome, based on data from rice (Oryza sativa L.), sor-ghum (Sorghum bicolor L.), A. thaliana and Brachpodiumdistachyon [49,50]. On this basis, the sequences annotatedin this study are likely to represent c. 88% and c. 72% ofthe gene complements of field pea and faba bean, respec-tively. Such estimates are also supported by comparisonwith the M. truncatula genome, from which a total of11,737 unique hits obtained from field pea represented c.49% of the known gene space, and 10,179 unique hits
from faba bean represented c. 41% of the known genespace. Comparisons were also made to G. max, which ismore distantly related to the Vicieae tribe species thanM. truncatula, being located outside the Hologaleginaclade, A total of 19,451 unique hits from field pea and 16,497 from faba bean represent c. 35% and 30% of theknown gene space respectively, based on total of predicted55,787 protein-coding loci in the palaeopolyploid genomeof soybean. In comparison to the genome of A. thaliana,which is more distantly related to both model and croplegume species within the dicotyledonous plants, the cor-responding values were c. 25% for field pea and c. 20% forfaba bean.
Marker discovery and validationOne major advantage of second-generation DNA sequen-cing technologies is the capacity for computational inter-rogation of transcriptome data in order to develop largenumbers of gene-based genetic markers such as SSRs andSNPs, of which few are currently available in the publicdomain for either field pea or faba bean. The EST-SSR pri-mer pair sets generated in the current study will provedirectly useful for the target species, and due to likely pri-mer site conservation, may also be readily transferable toclosely related species [51]. The transcriptome data gener-ated in the current study, being derived from distinct gen-otypes, may potentially be also used for the detection ofSNP markers in field pea and faba bean, to further enrichthe available genomic resources for these two species.The relative proportions of SSR array types in field pea
and faba bean were similar to those observed in otherplant species [8,52-54]. In theory, the frequencies of di-,tri-, tetra-, penta-, and hexanucleotide repeats shouldprogressively decrease, based on the relative probabilityof replication slippage events. However, trinucleotide
Table 3 Frequencies of different SSR repeat motif types observed in field pea and faba bean
SSR motif length Repeat unit number
Species 3 4 5 6 7 8 9 10 > 10 Total %
Dinucleotide Field pea 0 0 0 87 34 14 8 4 3 150 6.3
Faba bean 0 0 0 19 19 13 4 1 0 56 7.0
Trinucleotide Field pea 0 952 270 111 35 10 4 0 1 1383 57.7
Faba bean 0 370 86 17 15 4 1 1 1 495 61.7
Tetranucleotide Field pea 432 45 5 1 0 0 0 0 0 483 20.2
Faba bean 124 7 1 1 0 0 0 0 0 133 16.6
Pentanucleotide Field pea 147 17 3 0 1 0 0 0 0 168 7.0
Faba bean 41 6 1 0 0 0 0 0 0 48 6.0
Hexanucleotide Field pea 180 24 6 0 2 1 0 0 0 213 8.9
Faba bean 59 7 4 0 0 0 0 0 0 70 8.7
Total Field pea 759 1038 284 199 72 25 12 4 4 2397
Faba bean 224 390 92 37 34 17 5 2 1 802
% Field pea 31.7 43.3 11.8 8.3 3.0 1.0 0.5 0.2 0.2
% Faba bean 27.9 48.6 11.5 4.6 4.2 2.1 0.6 0.2 0.1
Kaur et al. BMC Genomics 2012, 13:104http://www.biomedcentral.com/1471-2164/13/104
Page 9 of 12
repeat units were predominant, followed by tetra-, di-,hexa-, and pentanucleotide repeat units. This observationis quite common for EST-derived SSRs, as trinucleotideexpansions (or multiples thereof) within translatedregions are capable of maintaining reading frame andhence generating a homopolymeric amino acid runwithin a partially or fully active protein.The validation results for sub-sets of EST-SSR mar-
kers demonstrated that inclusion of non-domesticatedgenotypes in the study increased rates of polymorphismdetection, consistent with the results of similar studies[8,55]. EST-SSRs generated in the present study willconsequently provide a valuable tool for the understand-ing of global genetic diversity among both non-domesti-cated and cultivated pea and faba bean germplasm, aswell as for dissection of the genetic control of importantagronomic traits.
ConclusionsIn the current study, the generation of EST-datasets forfield pea and faba bean has been described. Unigene setsobtained from field pea and faba bean were annotatedagainst different genomic databases including those ofM. truncatula, A. thaliana, G. max, and the nr databasefrom GenBank. Furthermore, the EST dataset was usedfor design of EST-SSRs, subsets of which were validatedacross a number of cultivated and wild genotypes of peaand faba bean, indicating effectiveness of polymorphismdetection and cross transferability.
Additional material
Additional file 1: Consensus sequences of assembled contigs fromfield pea. The data represents the consensus sequences of 13,602assembled contigs generated as a result of de novo assembly of field peaESTs.
Additional file 2: Sequence information on singletons from fieldpea. The data represents the sequence information on all the singletonsgenerated from de novo assembly of field pea ESTs.
Additional file 3: Consensus sequences of assembled contigs fromfaba bean. The data represents the consensus sequences of 6,370assembled contigs generated as a result of de novo assembly of fababean ESTs.
Additional file 4: Sequence information on singletons from fababean. The data represents the sequence information on all thesingletons generated from de novo assembly of faba bean ESTs.
Additional file 5: Bioinformatic annotation (BLASTN) of field peaunigene set against the Medicago truncatula genome. This filecontains the BLAST results obtained as a result of comparison of fieldpea unigene set against the M. truncatula genome at an E value < 10-10.
Additional file 6: Bioinformatic annotation (BLASTX) of field peaunigene set against the nr database of GenBank. This file containsthe BLAST results obtained as a result of comparison of field peaunigene set against the GenBank nr database at an E value < 10-10.
Additional file 7: Bioinformatic annotation (BLASTN) of field peaunigene set against the Arabidopsis thaliana genome. This filecontains the BLAST results obtained as a result of comparison of fieldpea unigene set against the A. thaliana genome at an E value < 10-10.
Additional file 8: Bioinformatic annotation (BLASTN) of faba beanunigene set against the Medicago truncatula genome. This filecontains the BLAST results obtained as a result of comparison of fababean unigene set against the M. truncatula genome at an E value < 10-10.
Additional file 9: Bioinformatic annotation (BLASTX) of faba beanunigene set against nr database of GenBank. This file contains theBLAST results obtained as a result of comparison of faba bean unigeneset against the GenBank nr database at an E value < 10-10.
Additional file 10: Bioinformatic annotation (BLASTN) of faba beanunigene set against Arabidopsis thaliana genome. This file containsthe BLAST results obtained as a result of comparison of faba beanunigene set against the A. thaliana genome at an E value < 10-10.
Additional file 11: Bioinformatic annotation (BLASTN) of field peaand faba bean unigene sets against the Glycine max genome. Thisfile contains the BLAST results obtained as a result of comparison of fieldpea and faba bean unigene sets against G. max genome at an E value <10-10.
Additional file 12: Bioinformatic annotation (BLASTN) of field peaand faba bean unigene sets against the Pisum sativumtranscriptome dataset from Franssen et al 2011. This file contains theBLAST results obtained as a result of comparison of field pea and fababean unigene sets against P. sativum transcriptome dataset at an E value< 10-10.
Additional file 13: BLASTN of field pea and faba bean contigs andsingltones against GenBank EST and nucleotide (nt) data. This filecontains the BLASTN results obtained as a result of comparison of fieldpea and faba bean contigs and singletons set against the EST andnucleotide (nt) databse of GenBank at an E value < 10-10.
Additional file 14: Sequence information of all of the SSR primerpairs identified and designed using BatchPrimer3 from field peaand faba bean ESTs. This file contains all of the information (sequenceinformation, orientation, sequence length, expected product length, Tm,GC content and SSR motif length) on SSR primer pairs designed usingBatchPrimer 3.
Additional file 15: Characterisation of a sub-sets of EST-SSRs onwild and cultivated genotypes of field pea and faba bean. This filerepresents the data on number and size of alleles amplified fromscreening of subsets of EST-SSRprimer pairs on different genotypes offield pea and faba bean.
AcknowledgementsThis work was supported by funding from the Victorian Department ofPrimary Industries and the Grains Research and Development Corporation,Australia.
Author details1Department of Primary Industries, Biosciences Research Division, VictorianAgriBiosciences Centre, 1 Park Drive, La Trobe University Research andDevelopment Park, Bundoora, Victoria 3083, Australia. 2Department ofPrimary Industries, Biosciences Research Division, Grains Innovation Park,Horsham, Victoria 3401, Australia. 3La Trobe University, Bundoora, Victoria3086, Australia. 4School of Agriculture, Food and Wine, The University ofAdelaide, Waite Campus, Glen Osmond, South Australia 5064, Australia.
Authors’ contributionsSK and LP contributed equally to the GS FLX sequencing, EST datasetanalysis, EST-SSR marker assay design and interpretation of SSR genotypingdata. SK and JF drafted the manuscript. KS assisted the sequence contigannotation process. NC contributed to data analysis, interpretation andassisted in drafting the manuscript. NC, SK, JF, TL, JP and MM co-conceptualised and coordinated the project. MM assisted in drafting themanuscript. All authors read and approved the final manuscript.
Received: 7 October 2011 Accepted: 20 March 2012Published: 20 March 2012
Kaur et al. BMC Genomics 2012, 13:104http://www.biomedcentral.com/1471-2164/13/104
Page 10 of 12

References1. Zhu H, Choi H-K, Cook DR, Shoemaker RC: Bridging model and crop
legumes through comparative genomics. Plant Physiol 2005,137:1189-1196.
2. Lavin M, Herendeen PS, Wojciechowski MF: Evolutionary rates analysis ofLeguminosae implicates a rapid diversification of lineages during thetertiary. Syst Biol 2005, 54:574-594.
3. In Legumes of the world. Edited by: Lewis G, Schrire B, Mackinder B, LockM. Kew Publishing; 2005:.
4. Cannon SB, Sterck L, Rombauts S, Sato S, Cheung F, Gouzy J, Wang X,Mudge J, Vasdewani J, Schiex T, Spannagl M, Monaghan E, Nicholson C,Humphray SJ, Schoof H, Mayer KFX, Rogers J, Quétier F, Oldroyd GE,Debellé F, Cook DR, Retzel EF, Roe BA, Town CD, Tabata S, Peer YV,Young ND: Legume genome evolution viewed through the Medicagotruncatulaand Lotus japonicus genomes. PNAS 2006, 103:14959-14964.
5. Schmutz J, Cannon SB, Schlueter J, Ma J, Mitros T, Nelson W, Hyten DL,Song Q, Thelen JJ, Cheng J, Xu D, Hellsten U, May GD, Yu Y, Sakurai T,Umezawa T, Bhattacharyya MK, Sandhu D, Valliyodan B, Lindquist E, Peto M,Grant D, Shu S, Goodstein D, Barry K, Futrell-Griggs M, Abernathy B, Du J,Tian Z, Zhu L, Gill N, Joshi T, Libault M, Sethuraman A, Zhang XC,Shinozaki K, Nguyen HT, Wing RA, Cregan P, Specht J, Grimwood J,Rokhsar D, Stacey G, Shoemaker RC, Jackson SA: Genome sequence of thepalaeopolyploid soybean. Nature 2010, 463:178-183.
6. Gepts P, Beavis WD, Brummer EC, Shoemaker RC, Stalker HT, Weeden NF,Young ND: Legumes as a Model Plant Family. Genomics for Food andFeed Report of the Cross-Legume Advances through GenomicsConference. Plant Physiol 2005, 137:1228-1235.
7. Gibson G: Pulse Australia-General Crop Information 2009, Pulse Australia.[http://www.pulseaus.com.au/crop_information.aspx].
8. Kaur SK, Cogan NOI, Pembleton LW, Shinozuka M, Savin KW, Materne M,Forster JW: Transcriptome sequencing of lentil based on second-generation technology permits large-scale unigene assembly and SSRmarker discovery. BMC Genomics 2011, 12:265.
9. Timmerman-Vaughan GM, Mills A, Whitfield C, Frew T, Butler R, Murray S,Lakeman M, McCallum J, Russell A, Wilson D: Linkage mapping of QTL forseed yield, yield components and development traits in pea. Crop Sci2005, 45:1336-1344.
10. Gomez-Roldan V, Fermas S, Brewer PB, Puech-Pagès V, Dun EA, Pillot J-P,Letisse F, Matusova R, Danoun S, Portais J-C, Bouwmeester H, Bécard G,Beveridge CA, Rameau C, Rochange SF: Strigolactone inhibition of shootbranching. Nature 2008, 455:189-194.
11. Hecht V, Knowles CL, Schoor JKV, Liew LC, Jones SE, Lambert MJM,Weller JL: Pea LATE BLOOMER1 is a GIGANTEA ortholog with roles inphotoperiodic flowering, deetiolation, and transcriptional regulation ofcircadian clock gene homologs. Plant Physiol 2007, 144:648-661.
12. Burstin J, Deniot G, Potier J, Weinachter C, Aubert G, Baranger A: Microstaellitepolymorphism in Pisum sativum. Plant Breed 2001, 120:311-317.
13. Tar’an B, Zhang C, Warkentin T, Tullu A, Vandenberg A: Genetic diversityamong varieties and wild species accessions of pea (Pisum sativum L.)based on molecular markers, and morphological and physiologicalcharacters. Genome 2005, 48:257-272.
14. Smýkal P, Horáèek J, Dostálová R, Hýbl M: Variety discrimination in pea(Pisum sativum L.) by molecular, biochemical and morphologicalmarkers. J Appl Genet 2008, 49:155-166.
15. Zong X, Redden RJ, Liu Q, Wang S, Guan J, Liu J, Xu Y, Liu X, Gu J, Yan L,Ades P, Ford R: Analysis of a diverse global Pisum sp. collection andcomparison to a Chinese local P. sativum collection with microsatellitemarkers. Theor Appl Genet 2009, 118:193-204.
16. Jing R, Vershinin A, Grzebyta J, Shaw P, Smýkal P, Marshall D, Ambrose MJ,Ellis N, Flavell AJ: The genetic diversity and evolution of field pea (Pisum)studied by high throughput retrotransposon based insertionpolymorphism (RBIP) marker analysis. BMC Evol Biol 2010, 10:44.
17. Franssen SU, Shrestha RP, Bräutigam A, Bornberg-Bauer E, Weber APM:Comprehensive transcriptome analysis of the highly complex Pisumsativum genome using next generation sequencing. BMC Genomics 2011,12:227.
18. Torres AM, Avila CM, Gutierrez N, Palomino C, Moreno MT, Cubero JI:Marker-assisted selection in faba bean (Vicia faba L.). Field Crops Res 2010,115:243-252.
19. Ellwood SR, Phan HTT, Jordan M, Hane J, Torres AM, Avila CM, Cruz-Izquierdo S, Oliver RP: Construction of a comparative genetic map in faba
bean (Vicia faba L.); conservation of genome structure with Lensculinaris. BMC Genomics 2008, 9:380.
20. Dalmais M, Schmidt J, Signor CL, Moussy F, Burstin J, Savois V, Aubert G,Brunaud V, Oliveira Y, Guichard C, Thompson R, Bendahmane A: UTILLdb, aPisum sativum in silico forward and reverse genetics tool. Genome Biol2008, 9:R43.
21. Coyne CJ, McClendon MT, Walling JG, Timmerman-Vaughan GM, Murray S,Meksem K, Lightfoot DA, Shultz JL, Keller KE, Martin RR, Inglis DA,Rajesh PN, McPhee KE, Weeden NF, Grusak MA, Li CM, Storlie EW:Construction and characterization of two bacterial artificial chromosomelibraries of pea (Pisum sativum L.) for the isolation of economicallyimportant genes. Genome 2007, 50:871-875.
22. Hofer J, Turner L, Moreau C, Ambrose M, Isaac P, Butcher S, Weller J,Dupin A, Dalmais M, Signor CL, Bendahmane A, Ellis N: Tendril-lessregulates tendril formation in pea leaves. Plant Cell 2009, 21:420-428.
23. Hellens RP, Moreau C, Lin-Wang K, Schwinn KE, Thomson SJ, Fiers MWEJ,Frew TJ, Murray SR, Hofer JMI, Jacobs JME, Davies KM, Allan AC,Bendahmane A, Coyne CJ, Timmerman-Vaughan GM, Ellis THN: Identificationof Mendel’s white flower character. PLoS One 2010, 10:e13230.
24. Moe KT, Chung J-W, Cho Y-I, Moon J-K, Ku J-H, Jung J-K, Lee J, Park Y-J:Sequence information on simple sequence repeats and singlenucleotide polymorphisms through transcriptome analysis ofMungbean. J Integr Plant Biol 2011, 53:63-73.
25. Thomson NR, Holden MTG, Carder C, Lennard N, Lockey SJ, Marsh P,Skipp P, O’Connor CD, Goodhead I, Norbertzcak H, Harris B, Ormond D,Rance1 R, Quail MA, Parkhill J, Stephens RS, Clarke IN: Chlamydiatrachomatis: Genome sequence analysis of lymphogranuloma venereumisolates. Genome Res 2008, 18:161-171.
26. Bentley DR: Whole-genome re-sequencing. Curr Opin Genet Dev 2006,16:545-552.
27. Barbazuk WB, Emrich SJ, Chen HD, Li L, Schnable PS: SNP discovery via454 transcriptome sequencing. Plant J 2007, 51:910-918.
28. Vera JC, Wheat CW, Fescemyer HW, Frilander MJ, Crawford DL, Hanski I,Marden JH: Rapid transcriptome characterization for a nonmodelorganism using 454 pyrosequencing. Mol Ecol 2008, 17:1636-1647.
29. Blanca J, Canizares J, Roig C, Ziarsolo P, Nuez F, Pico B: Transcriptomecharacterization and high throughput SSRs and SNPs discovery inCucurbita pepo (Cucurbitaceae). BMC Genomics 2011, 12:104.
30. Park YJ, Lee JK, Kim NS: Simple sequence repeat polymorphisms (SSRPs)for evaluation of molecular diversity and germplasm classification ofminor crops. Molecules 2009, 14:4546-4569.
31. Zeng S, Xiao G, Guo J, Fei Z, Xu Y, Roe BA, Wang Y: Development of a ESTdataset and characterization of EST-SSRs in a traditional Chinesemedicinal plant, Epimedium sagittatum (Sieb. Et Zucc.) Maxim. BMCGenomics 2010, 11:94.
32. Rafalski JA: Novel genetic mapping tools in plants: SNPs and LD-basedapproaches. Plant Sci 2002, 162:329-333.
33. Loridon K, McPhee K, Morin J, Dubreuil P, Pilet-Nayel ML, Aubert G,Rameau C, Baranger A, Coyne C, Lejeune-Hénaut I, Burstin J: Microsatellitemarker polymorphism and mapping in pea (Pisum sativum L.). Theor ApplGenet 2005, 111:1022-1031.
34. Hougaard BK, Madsen LH, Sandal N, Moretzsohn MC, Fredslund J,Schauser L, Nielsen AM, Rohde T, Sato S, Tabata S, Bertioli DJ, Stougaard J:Legume anchor markers link syntenic regions between Phaseolusvulgaris, Lotus japonicus, Medicago truncatula and Arachis. Genetics 2008,179:2299-2312.
35. Altschul SF, Gish W, Miller W, Myers EW, Lipman DJ: Basic local alignmentsearch tool. J Mol Biol 1990, 215:403-410.
36. Schuelke M: An economic method for the fluorescent labelling of PCRfragments. Nat Biotechnol 2000, 18:233-234.
37. Dutta S, Kumawat G, Singh BP, Gupta DK, Singh S, Dogra V, Gaikwad K,Sharma TR, Raje RS, Bandhopadhya TK, Datta S, Singh MN, Bashasab F,Kulwal P, Wanjari KB, Varshney RK, Cook DR, Singh NK: Devlopment ofgenic-SSR markers by deep transcriptome sequencing in pigeonpea[Cajanus cajan (L.) Millspaugh]. BMC Plant Biology 2011, 11:17.
38. Margulies M, Egholm M, Altman WE, Attiya S, Bader JS, Bemben LA, Berka J,Braverman MS, Chen YJ, Chen Z: Genome sequencing in microfabricatedhigh-density picolitre reactors. Nature 2005, 437:376-380.
39. Beldade P, Rudd S, Gruber JD, Long AD: A wing expressed sequence tagresource for Bicyclus anynana butterflies, an evo-devo model. BMCGenomics 2006, 7:130.
Kaur et al. BMC Genomics 2012, 13:104http://www.biomedcentral.com/1471-2164/13/104
Page 11 of 12

40. Sun C, Li Y, Wu Q, Luo H, Sun Y, Song J, Lui EMK, Chen S: De novosequencing and analysis of the American ginseng root transcriptomeusing a GS FLX Titanium platform to discover putative genes involved inginsenoside biosynthesis. BMC Genomics 2010, 11:262.
41. Cheung F, Haas BJ, Goldberg SM, May GD, Xiao Y, Town CD: SequencingMedicago truncatula expressed sequenced tags using 454 Life Sciencestechnology. BMC Genomics 2006, 7:272.
42. Wang W, Wang Y, Zhang Q, Qi Y, Guo D: Global characterization ofArtemisia annua glandular trichome transcriptome using 454pyrosequencing. BMC Genomics 2009, 10:465.
43. Karatolos N, Pauchet Y, Wilkinson P, Chauhan R, Denholm I, Gorman K,Nelson DR, Bass C, ffrench-Constant RH, Williamson MS: Pyrosequencingthe transcriptome of the greenhouse whitefly, Trialeurodes vaporariorumreveals multiple transcripts encoding insecticide targets and detoxifyingenzymes. BMC Genomics 2011, 12:56.
44. Parchman TL, Geist KS, Grahnen JA, Benkman CW, Buerkle CA:Transcriptome sequencing in an ecologically important tree species:assembly, annotation, and marker discovery. BMC Genomics 2010, 11:180.
45. Schafleitner R, Tincopa LR, Palomino O, Rossel G, Robles RF, Alagon R,Rivera C, Quispe C, Rojas L, Pacheco JA, Solis J, Cerna D, Kim JY, Hou J,Simon R: A sweetpotato gene index established by de novo assembly ofpyrosequencing and Sanger sequences and mining for gene-basedmicrosatellite markers. BMC Genomics 2010, 11:604.
46. Vera JC, Wheat CW, Fescemyer HW, Frilander MJ, Crawford DL, Hanski I,Marden JH: Rapid transcriptome characterization for a nonmodelorganism using 454 pyrosequencing. Mol Ecol 2008, 17:1636-1647.
47. Novaes E, Drost DR, Farmerie WG, Pappas GJ Jr, Grattapaglia D, Sedero RR,Kirst M: High-throughput gene and SNP discovery in Eucalyptus grandis,an uncharacterized genome. BMC Genomics 2008, 9:312.
48. Meyer E, Aglyamova GV, Wang S, Buchanan-Carter J, Abrego D,Colbourne JK, Willis BL, Matz MV: Sequencing and de novo analysis of acoral larval transcriptome using 454 GSFlx. BMC Genomics 2009, 10:219.
49. Vogel , et al: Genome sequencing and analysis of the model grassBrachypodium distachyon. Nature 2009, 463:763-768.
50. Bevan M, Walsh S: The Arabidopsis genome: A foundation for plantresearch. Genome Res 2005, 15:1632-1642.
51. Barbara T, Palma-Silva C, Paggi GM, Bered F, Fay MF, Lexer C: Cross-speciestransfer of nuclear microsatellite markers: potential and limitations. MolEcol 2007, 16:3759-3767.
52. Kumpatla SP, Mukhopadhyay S: Mining and survey of simple sequencerepeats in expressed sequence tags of dicotyledonous species. Genome2005, 48:985-998.
53. Eujayl I, Sledge MK, Wang L, May GD, Chekhovskiy K, Zwonitzer JC,Mian MAR: Medicago truncatula EST-SSRs reveal cross-species geneticmarkers for Medicago spp. Theor Appl Genet 2004, 108:414-422.
54. Luro FL, Costantino G, Terol J, Argout X, Allario T, Wincker P, Talon M,Ollitrault P, Morillon R: Transferability of the EST-SSRs developed on Nulesclementine (Citrus clementina Hort ex Tan) to other Citrus species andtheir effectiveness for genetic mapping. BMC Genomics 2008, 9:287.
55. Castillo A, Budak H, Varshney RK, Dorado G, Graner A, Hernandez P:Transferability and polymorphism of barley EST-SSR markers used forphylogenetic analysis in Hordeum chilense. BMC Plant Biol 2008, 8:97.
doi:10.1186/1471-2164-13-104Cite this article as: Kaur et al.: Transcriptome sequencing of field peaand faba bean for discovery and validation of SSR genetic markers. BMCGenomics 2012 13:104.
Submit your next manuscript to BioMed Centraland take full advantage of:
• Convenient online submission
• Thorough peer review
• No space constraints or color figure charges
• Immediate publication on acceptance
• Inclusion in PubMed, CAS, Scopus and Google Scholar
• Research which is freely available for redistribution
Submit your manuscript at www.biomedcentral.com/submit
Kaur et al. BMC Genomics 2012, 13:104http://www.biomedcentral.com/1471-2164/13/104
Page 12 of 12