Embed Size (px)
Citation preview

Transco Capex/Opex Review
REVIEW OF TRANSCO'S CAPITAL EXPENDITURE FORECASTS
Final Report 23 August 2005
Trans Co

Trans Co
Transco Capex/Opex Review
REVIEW OF TRANSCO'S CAPITAL EXPENDITURE FORECASTS 2005 – 2010
Final Report 23 August 2005
Sinclair Knight Merz ABN 37 001 024 095 369 Ann Street, Brisbane 4000 PO Box 246 Spring Hill QLD 4004 Australia Tel: +61 7 3244 7100 Fax: +61 7 3244 7301 Web: www.skmconsulting.com COPYRIGHT: The concepts and information contained in this document are the property of Sinclair Knight Merz Pty Ltd. Use or copying of this document in whole or in part without the written permission of Sinclair Knight Merz constitutes an infringement of copyright.
Review of Transco's Capital Expenditure Forecast
SINCLAIR KNIGHT MERZ
10023 TransCo Capex review final.doc PAGE i
Contents
1. Executive Summary 1
2. Introduction 2 2.1 Methodology 2
3. Recent Trends 4
4. Capex Forecast 5 4.1 Breakdown of capex forecast 7
5. Review of Forecasts 9 5.1 Represented fairly in discrete projects 9 5.2 Project Estimates 9 5.3 Design Efficiency 10 5.4 Capital prudency and efficiency 11 5.4.1 Overheads 11 5.5 Growth Forecasts 12 5.6 Target Levels of Performance 14
6. Capex/Opex Trade-off 16
Appendix A Capex Forecast Spreadsheets 18
Appendix B Capex Forecast in ERC Format 19
Appendix C Summary Capex Forecast by project 20

Review of Transco's Capital Expenditure Forecast
SINCLAIR KNIGHT MERZ
10023 TransCo Capex review final.doc PAGE ii
Document history and status Revision Date issued Reviewed by Approved by Date approved Revision type
1 Ben Kearney Draft for comment
2 21/8/2005 Ben Kearney Ben Kearney 21/8/2005 Final Draft
3 23/8/2005 Ben Kearney Ben Kearney 23/8/2005 Final
Distribution of copies Revision Copy no Quantity Issued to
1 1 Electronic K Murray, C Manrique, M Donato, G Galang
2 1 Electronic K Murray, C Manrique, M Donato, G Galang
3 1 1 K Murray LECG
Printed: 24 August 2005
Last saved: 24 August 2005 09:25 PM
File name: D:\My Documents\a QH10023 LECG Transco capex opex\10023 TransCo Capex review draft v2 doc
Author: Ben Kearney
Project manager: Greg Edwards
Name of organisation: LECG Consulting
Name of project: Transco Capex/Opex Review
Name of document: Review of Transco's Capital Expenditure Forecasts
Document version: Final
Project number: QH10023
Review of Transco's Capital Expenditure Forecast
SINCLAIR KNIGHT MERZ
10023 TransCo Capex review final.doc PAGE 1
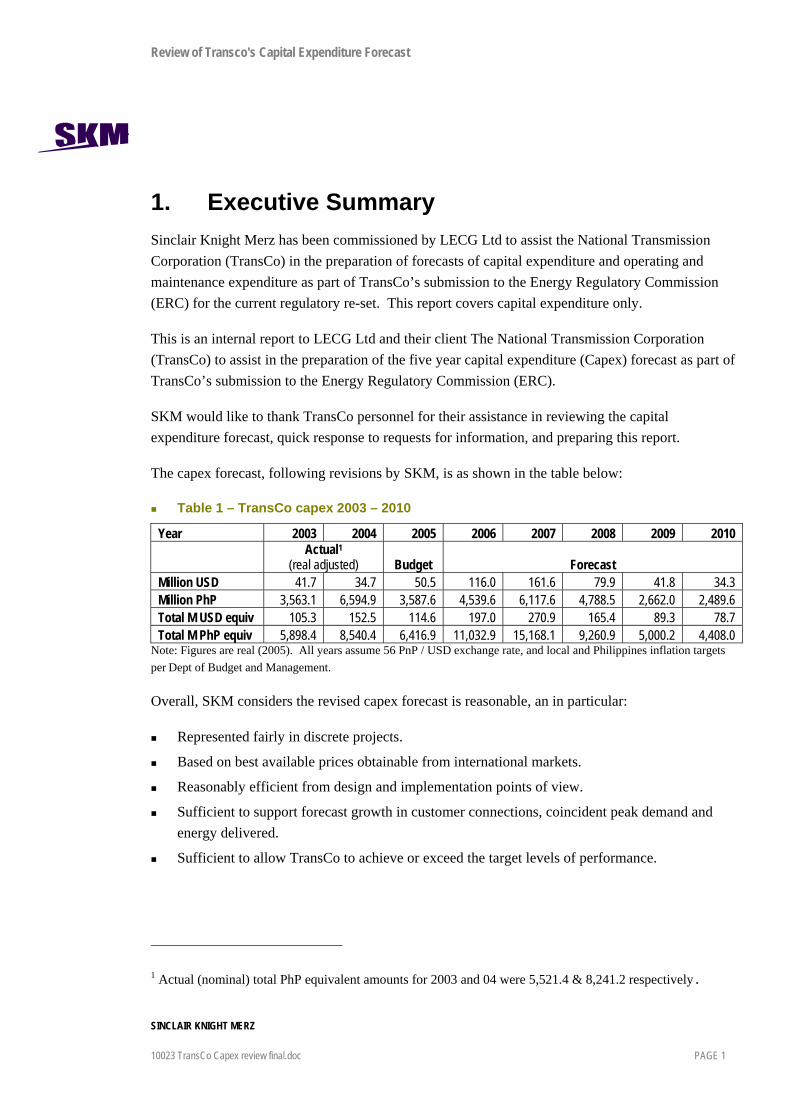
1. Executive Summary Sinclair Knight Merz has been commissioned by LECG Ltd to assist the National Transmission Corporation (TransCo) in the preparation of forecasts of capital expenditure and operating and maintenance expenditure as part of TransCo’s submission to the Energy Regulatory Commission (ERC) for the current regulatory re-set. This report covers capital expenditure only.
This is an internal report to LECG Ltd and their client The National Transmission Corporation (TransCo) to assist in the preparation of the five year capital expenditure (Capex) forecast as part of TransCo’s submission to the Energy Regulatory Commission (ERC).
SKM would like to thank TransCo personnel for their assistance in reviewing the capital expenditure forecast, quick response to requests for information, and preparing this report.
The capex forecast, following revisions by SKM, is as shown in the table below:
Table 1 – TransCo capex 2003 – 2010
Year 2003 2004 2005 2006 2007 2008 2009 2010
Actual1
(real adjusted) Budget Forecast Million USD 41.7 34.7 50.5 116.0 161.6 79.9 41.8 34.3 Million PhP 3,563.1 6,594.9 3,587.6 4,539.6 6,117.6 4,788.5 2,662.0 2,489.6 Total M USD equiv 105.3 152.5 114.6 197.0 270.9 165.4 89.3 78.7 Total M PhP equiv 5,898.4 8,540.4 6,416.9 11,032.9 15,168.1 9,260.9 5,000.2 4,408.0
Note: Figures are real (2005). All years assume 56 PnP / USD exchange rate, and local and Philippines inflation targets per Dept of Budget and Management.
Overall, SKM considers the revised capex forecast is reasonable, an in particular:
Represented fairly in discrete projects.
Based on best available prices obtainable from international markets.
Reasonably efficient from design and implementation points of view.
Sufficient to support forecast growth in customer connections, coincident peak demand and energy delivered.
Sufficient to allow TransCo to achieve or exceed the target levels of performance.
1 Actual (nominal) total PhP equivalent amounts for 2003 and 04 were 5,521.4 & 8,241.2 respectively.

Review of Transco's Capital Expenditure Forecast
SINCLAIR KNIGHT MERZ
10023 TransCo Capex review final.doc PAGE 2
2. Introduction Sinclair Knight Merz has been commissioned by LECG Ltd to assist The National Transmission Corporation (TransCo) in the preparation of forecasts of capital expenditure and operating and maintenance expenditure as part of TransCo’s submission to the Energy Regulatory Commission (ERC) for the current regulatory re-set.
This report focuses on the capital expenditure forecast.
The Transmission Wheeling Rate Guidelines (TWRG) require the capital expenditure (Capex) forecast to be provided in a format defined in ERC’s Issue Paper (September 10, 2004). SKM’s brief is to assist TransCo to articulate why the Capex forecast is necessary and reasonable or to prepare revised forecasts that meet these criteria.
Specifically, SKM is required to comment on whether the Capex forecasts are:
a) Represented fairly in discrete projects.
b) Based on best available prices obtainable from international markets.
c) Reasonably efficient from design and implementation points of view.
d) Sufficient to support forecast growth in customer connections, coincident peak demand and energy delivered.
e) Sufficient to allow TransCo to achieve or exceed the target levels of performance.
2.1 Methodology In reviewing and revising the capex forecast for 2005 to 2010 SKM has:
reviewed the planning criteria and application of these criteria in developing the projects in the Transmission Development Plan and Capex forecast
reviewed the costing methodology and costs of a sample of projects included in the forecast
reviewed overheads and other costs included in the forecast
recommended changes to the capex forecast where the TransCo draft did not meet the requirements of the TWRG or Issues Paper (which were accepted by TransCo).
Revised the capex forecast to effect these recommendations

Review of Transco's Capital Expenditure Forecast
SINCLAIR KNIGHT MERZ
10023 TransCo Capex review final.doc PAGE 3
SKM reviewed the following sources of information in the preparation and review of the capex forecast:
Interviews and data provided by TransCo personnel
ERC Requirements as set out in the TWRG and Issues Paper
Transmission Development Plan 2005 – 2014
Capex forecast prepared by TransCo 2005 – 2010
Project Feasibility Studies
Demand Forecasts
Dept of Budget and Management Macroeconomic and Fiscal targets
Project cost estimates
Various internal documents, including network planning and financial records

Review of Transco's Capital Expenditure Forecast
SINCLAIR KNIGHT MERZ
10023 TransCo Capex review final.doc PAGE 4
3. Recent Trends Historical and forecast capital expenditure by TransCo is shown in the table below:
Table 2 – TransCo capex 2003 – 2010
Year 2003 2004 2005 2006 2007 2008 2009 2010
Actual2
(real adjusted) Budget Forecast Million USD 41.7 34.7 50.5 116.0 161.6 79.9 41.8 34.3 Million PhP 3,563.1 6,594.9 3,587.6 4,539.6 6,117.6 4,788.5 2,662.0 2,489.6 Total M USD equiv 105.3 152.5 114.6 197.0 270.9 165.4 89.3 78.7 Total M PhP equiv 5,898.4 8,540.4 6,416.9 11,032.9 15,168.1 9,260.9 5,000.2 4,408.0
Note: Figures are real (2005). All years assume 56 PnP / USD exchange rate, and local and Philippines inflation targets per Dept of Budget and Management.
Total TransCo Capex forecast
0
2,000
4,000
6,000
8,000
10,000
12,000
14,000
16,000
2003 (H) 2004 (H) 2005 (B) 2006 (F) 2007 (F) 2008 (F) 2009 (F) 2010 (F)
Cape
x (eq
uiva
lent P
esos
, milli
on re
al)
Foreign componentLocal component
History prior to 2003 is not readily available as TransCo was part of NPC which included generation and other functions not readily separable. Average capex for the period 2005 – 2010 is 18% higher than the 2003 – 04 average, though this is not a sufficient period of historical data on which to make assumptions, and also partially reflects an assumed relaxation of capital constraints on TransCo from 2007 when a concessionaire will assume funding of projects.
2 Actual (nominal) total PhP equivalent amounts for 2003 and 04 were 5,521.4 & 8,241.2 respectively.

Review of Transco's Capital Expenditure Forecast
SINCLAIR KNIGHT MERZ
10023 TransCo Capex review final.doc PAGE 5
4. Capex Forecast SKM was provided with a capex forecast prepared by TransCo, summarised in the table below:
Table 3 – Original TransCo (nominal) Capex forecast
Original TransCo (nominal) 2005 2006 2007 2008 2009 2010 Total USD 50.5 116.2 151.8 62.6 - - 381.2 Pesos 4,366.4 6,619.9 9,171.3 8,164.6 4,522.1 3,365.1 36,209.4 Total USD 128.5 234.5 315.5 208.4 80.8 60.1 1,027.8 Total Pesos 7,195.7 13,129.2 17,670.7 11,672.2 4,522.1 3,365.1 57,554.9
In discussions with TransCo personnel, SKM made the following adjustments to the Transco forecast:
Converted from nominal to real in order to provide reporting format required in issues paper
Interest during construction removed from projects
Timing of some projects revised (delayed) to reflect revised (conservative) demand forecasts in Luzon.
Capitalised overheads were adjusted to incorporate planned increases in wages (see separate opex report)
Provision for transmission line easement costs was included, based on the expected costs arising from litigation currently before the courts.
Asset categories were changed to match the format specified in the TWRG and Issues paper.
The revised forecast is shown below, in real terms as required by TWRG and nominal terms for comparison with the original forecast:
Table 4 – Revised (real) Capex forecast
Revised (real) 2005 2006 2007 2008 2009 2010 Total USD 50.5 116.0 161.6 79.9 41.8 34.3 484.0 Pesos 3,587.6 4,539.6 6,117.6 4,788.5 2,662.0 2,489.6 24,184.7 Total USD 114.6 197.0 270.9 165.4 89.3 78.7 915.8 Total Pesos 6,416.9 11,032.9 15,168.1 9,260.9 5,000.2 4,408.0 51,287.0

Review of Transco's Capital Expenditure Forecast
SINCLAIR KNIGHT MERZ
10023 TransCo Capex review final.doc PAGE 6
Table 5 – Revised (nominal) Capex forecast
Revised (nominal) 2005 2006 2007 2008 2009 2010 Total USD 50.5 118.7 169.5 85.8 45.9 38.6 509.0 Pesos 3,587.6 4,766.5 6,680.4 5,438.2 3,144.1 3,058.1 26,674.8 Total USD 114.6 203.9 288.8 182.9 102.1 93.2 985.3 Total Pesos 6,416.9 11,415.7 16,170.5 10,240.4 5,715.0 5,218.0 55,176.5
Overall, the revised forecast is 4.1% lower than the original forecast (equivalent nominal), principally due to the removal of interest during construction and deferral of a number of projects.
In addition to the numerical capex forecast prepared by SKM, project summary sheets are being prepared by TransCo to provide other information required in the TWRG. Drafts of only a few of these documents were available for review at the time this report was prepared, but the format provided satisfies the information requirements specified in the TWRG for projects > P 50 million.
The final capital forecast to be provided to ERC should include:
Covering memo outlining assumptions (financial and others, such as demand forecast)
Summary spreadsheets as outlined in Appendix B of the Issues Paper
Individual project details, including the Project Details summaries being prepared by TransCo Network Planning, and individual project capex forecasts in ERC format prepared by SKM.
For the purposes of the ERC pricing determination, it is of little consequence whether projects are to be implemented by TransCo or the Concessionaire, hence SKM recommends projects be included in a single group, rather than split by TransCo / Concessionaire as per the original TransCo capex forecast. Details of who it likely to implement each project are included on the header for each project in the individual SKM capex budget spreadsheets.

Review of Transco's Capital Expenditure Forecast
SINCLAIR KNIGHT MERZ
10023 TransCo Capex review final.doc PAGE 7
4.1 Breakdown of capex forecast Table 6 Breakdown of capex forecast (2005 real) by project type
Capex Type Project Status Region
Total Equivalent PnP (million) % of Total
Network Projects Ongoing All 1,086.9 Luzon 7,447.6 Mindanao 5,968.0 Visayas 12,088.2 Ongoing Total 26,590.7 52% New Luzon 4,644.7 Mindanao 6,337.8 Visayas 2,077.7 New Total 13,060.2 25% O&M Mindanao 1,417.7 North Luzon 646.0 South Luzon 1,079.0 Visayas 867.0 O&M Total 4,009.7 8% Network Projects Total 43,660.5 85% Network Control Safety & Metering projects New All 25.3 System Operations 822.9
New Total 848.2 Network Control Safety & Metering projects Total 848.2 2% Non-network projects New Eng 182.6 HO 1,508.4 New Total 1,691.0 Non-network projects Total 1,691.0 3% Capitalised overheads All All 5,087.2 All Total 5,087.2 Capitalised overheads Total 5,087.2 10%
Grand Total 51,287.0 100%
In general, there is nothing highlighted by this breakdown of capex that SKM would consider unreasonable. Capitalised overheads are discussed in further detail later in this report.
Capitalised O&M costs at the upper end of what SKM would consider reasonable, but given TransCo’s historical practices and manning levels, are not considered to be out of keeping with past practice. Some of these issues are discussed in the separate Operating Cost forecast review report.

Review of Transco's Capital Expenditure Forecast
SINCLAIR KNIGHT MERZ
10023 TransCo Capex review final.doc PAGE 8
A further breakdown by driver (growth, non-growth) is shown below:
Table 7 - Breakdown of capex forecast (2005 real) by project driver
Capex Type Driver Project Status Total % of Total Network Projects Load growth Ongoing 25,503.8 New 12,518.6 Load growth Total 38,022.4 74% Non-growth Ongoing 1,086.9 New 541.5 O&M 4,009.7 Non-growth Total 5,638.1 11% Network Projects Total 43,660.5 85% Network Control Safety & Metering projects
Non-growth New 848.2
Network Control Safety & Metering projects Total 848.2 2% Non-network projects Non-growth New 1,691.0 Non-network projects Total 1,691.0 3% Capitalised overheads Non-growth All 5,087.2 Capitalised overheads Total 5,087.2 10% Grand Total 51,287.0 100%
This analysis shows the capex program is principally driven by load growth, with other components (non growth, overheads) no larger than around 10%. This indicates the main driver for the capex program is meeting increasing demand and performance targets.

Review of Transco's Capital Expenditure Forecast
SINCLAIR KNIGHT MERZ
10023 TransCo Capex review final.doc PAGE 9
5. Review of Forecasts In preparing the revised forecast, SKM undertook the following review of projects and the capex forecast as a whole.
5.1 Represented fairly in discrete projects SKM has found no evidence that projects have been split to fall below the 50 million pesos threshold stipulated in the TWRG for detailed project disclosure. SKM considers TransCo has fairly represented the capital works forecast in complete projects, and there has been no attempt to split large projects into smaller components to avoid the ERC reporting threshold of PhP 50 million.
Of the total capital expenditure over the period 2005 – 2010, 99% is included in projects > PhP 50 million, indicating the capital forecast is overwhelmingly made up of large projects above the ERC threshold.
5.2 Project Estimates Project cost estimates were reviewed for a number of substation and transmission line projects, against SKM’s knowledge of costs of transmission projects in other countries, and in particular the “modern equivalent asset” rates determined as part of the recent asset revaluation.
A sample of substation and transmission line project cost estimates were reviewed, covering some 65% of the total new network projects included in the capex forecast. The projects reviewed were:
New Binga substation
New Calbayog substation
Bunawan substation expansion
Pulangi (Maramag) substation
New Polanco SS
Tomonton CTS
Talisay CTS
Tomonton SS
Luzon substation upgrade project 1
Binga – San Manual transmission line
Wright – Calbayog transmission line
Abaga – Kirahon transmission line
Mamarag (Pulangi) - Bunawan transmission line

Review of Transco's Capital Expenditure Forecast
SINCLAIR KNIGHT MERZ
10023 TransCo Capex review final.doc PAGE 10
Kirahon - Maramag (Pulangi) transmission line
Aurora - Polanco transmission line
Talisay - Tomonton transmission line
Bacolod - Talisay transmission line
San Juan - Tomonton transmission line
The review found:
Transmission line cost estimates in the capex forecast were around 4% higher on average than the MEA rates would value those assets
Substation cost estimates in the capex forecast were around 13% higher on average than the MEA rates would value those assets
These figures are considered within a reasonable margin of error, and also reflect the more detailed level of estimate prepared by TransCo. Given that a proportion TransCo’s ongoing development projects are “brownfield” developments, these costs are considered reasonable. SKM would typically apply loadings of 25% - 50% to standard greenfield costs for brownfield projects.
5.3 Design Efficiency In producing an Optimised Depreciated Replacement Cost valuation, SKM reviewed substation designs, feeder configurations and transmission voltage levels. Optimisation, to remove any excess capacity or over-design, amounted to approximately 3.5% of the total network replacement cost. This indicates that the network design is reasonably efficient.
A number of specific proposed projects were reviewed to provide comfort that the historical efficiency reflected in the optimisation results was being carried forward in future project designs. A sample of projects included in the forecast were selected, and the designs were reviewed and found to be reasonable and not “over-designed” or “gold plated”.
TransCo’s practice to date has been to apply a 30 year life to network elements generally, and program asset replacement on the age of an asset exceeding this nominal life. In the asset valuation, expected typical asset lives have been mostly extended beyond 30 years. The replacement of aged assets is not driven by age itself but by the asset condition, performance and the costs of maintenance.
Each replacement project should be individually justified on these bases. The overall level of replacement assets included in the forecast is 4.2 billion pesos over 2005 – 2010, or an average of

Review of Transco's Capital Expenditure Forecast
SINCLAIR KNIGHT MERZ
10023 TransCo Capex review final.doc PAGE 11
697 million pesos pa. This is below the level of 5.0 billion pesos 2005 – 2010 modelled by SKM3 using the extended asset lives determined from the separate asset valuation study, indicating replacement of assets included in the capex forecast is not excessive.
5.4 Capital prudency and efficiency Project needs were discussed with transmission planning department, who demonstrated load flow analysis results used to determine project needs and as inputs to the transmission development plan.
Planning criteria in the TDP reviewed and considered reasonable, and likely to become more stringent in the future (eg move to full N-1 or higher in the future).
5.4.1 Overheads TransCo’s capex forecast includes an amount of capitalised overheads, as shown in the table below.
Table 8 – Original TransCo (nominal) Capex forecast
Million Pesos (real) 2005 2006 2007 2008 2009 2010Site & Project Management 134.6 190.2 184.3 158.9 7.7 2.4
Engineering 206.6 228.3 533.7 570.2 674.4 699.8
Head office & Admin 84.4 119.1 278.4 297.5 351.8 365.1
Projects 217.8 307.7 236.3 197.0 9.7 2.5
Total capitalised overheads 643.3 845.2 1,232.7 1,223.6 1,043.5 1,069.7 Total capex forecast 6,416.9 11,022.5 15,112.3 9,167.4 4,910.2 4,361.9 Overheads % 10% 8% 8% 13% 21% 25%
With other transmission businesses SKM has worked with it is not uncommon for a proportion of overheads to be capitalised or included in capitalised labour / wages component of capital projects. The scope of SKM’s review did not, however, include a review of Philippines accounting standards and requirements, so SKM is unaware of any specific requirements regarding capitalisation of overheads and whether this treatment is in keeping with any such requirements.
The current level of capitalised overheads is within the range SKM would expect, typically 5 – 15% of total capex. The allocation of the engineering group to capex is considered reasonable given its role in the planning and execution of capital projects. Likewise head office and admin allocation to capital (mostly 0%, with a few groups 50 – 70% such as finance and contracts) has been reviewed and is considered reasonable. The increase in overheads in the latter years of the forecast represents the proposed increases in real wages foreshadowed. SKM’s separate opex report reviews these increases in detail.
3 See separate report on TransCo Aged Asset Replacement Projection expenditure, SKM 2005

Review of Transco's Capital Expenditure Forecast
SINCLAIR KNIGHT MERZ
10023 TransCo Capex review final.doc PAGE 12
5.5 Growth Forecasts Revised growth forecasts were discussed with TransCo Corporate Planning personnel. TransCo’s forecasting methodology includes a mix of econometric and trend based forecasting techniques, combined with forecasts provided with distribution companies. There was only a brief discussion of these methodologies, but this indicated TransCo’s forecasting techniques are reasonable.
The original demand forecast and the alternate (more conservative) forecast for used to modify the capital works forecast are compared in the Table below.
Table 9 – Comparison of Demand Forecasts (MW)
TDP 2005 DOE TRANSCO
Year
(DOE - Macro) DDP 2004
Conservative forecast used
for Capex budget
2005 7,343 7,045 6,443 2006 7,964 7,493 6,747 2007 8,635 7,977 7,014 2008 9,372 8,497 7,290 2009 10,171 9,057 7,574 2010 11,018 9,665 7,866 2011 11,917 10,310 8,149 2012 12,871 11,057 8,437 2013 13,884 11,854 8,728 2014 14,959 12,509 9,025
SKM understands from discussions with TransCo the reason for these differences is a higher than expected Luzon demand from DoE (approximately 75% of total TransCo demand), based on higher than expected demand projections provided by the local distribution authority Meralco. These distribution forecasts have since been revised down, and SKM understands the unofficial draft of the new DoE forecast is now very close to the TransCo conservative forecast shown above. In light of this, SKM recommends the capex forecast be based on the TransCo conservative load forecast.
Timing of individual projects was adjusted to reflect the revised (conservative), Luzon forecasts (supported by draft DOE revised forecast). In practice, there has been little impact on project timing overall, as project timing is already constrained by TransCo’s ability to implement projects.

Review of Transco's Capital Expenditure Forecast
SINCLAIR KNIGHT MERZ
10023 TransCo Capex review final.doc PAGE 13
In consultation with TransCo Transmission Planning staff, the timing of the following projects were adjusted:
Table 10 – Project timing revision as a result of demand forecast change
Project Original end date Revised end date Deferral (years)
LUZON SUBSTATION EXPANSION - 2 2008 2009 1
LUZON SUBSTATION EXPANSION PROJECTS - 3 2009 2011 2
Binga-San Manuel 230kV TL Proj. 2008 2010 2
Luzon S/S Expansion Proj-1 2008 2010 2
The impact on the capex forecast of these changes is shown below:
Table 11 – Capex forecast (real) – with deferred projects (final)
Revised (nominal) 2005 2006 2007 2008 2009 2010 Total USD 50.5 116.0 161.6 79.9 41.8 34.3 484.0 Pesos 3,587.6 4,539.6 6,117.6 4,788.5 2,662.0 2,489.6 24,184.7 Total USD 114.6 197.0 270.9 165.4 89.3 78.7 915.8 Total Pesos 6,416.9 11,032.9 15,168.1 9,260.9 5,000.2 4,408.0 51,287.0
Table 12 – Capex forecast (real) – with original project timing
Revised (nominal) 2005 2006 2007 2008 2009 2010 Total USD 50.5 125.6 177.4 95.0 26.7 11.6 486.8 Pesos 3,596.4 4,720.9 6,371.5 4,994.5 2,441.0 2,151.0 24,275.3 Total USD 114.7 209.9 291.1 184.2 70.3 50.0 920.3 Total Pesos 6,425.7 11,752.4 16,304.3 10,317.0 3,937.9 2,797.9 51,535.1
The overall impact of the deferrals is a reduction of 0.5% in the overall capex forecast, though the “time value” impact of these deferrals will be marginally greater. The changes are shown in the chart below.

Review of Transco's Capital Expenditure Forecast
SINCLAIR KNIGHT MERZ
10023 TransCo Capex review final.doc PAGE 14
Impact of revised Luzon demand forecast
$0
$50
$100
$150
$200
$250
$300
$350
2005 2006 2007 2008 2009 2010
Cape
x (To
tal e
quiv
millio
n USD
real)
Original project timingDeferred project timing
5.6 Target Levels of Performance A summary TransCo’s recent historical reliability performance is shown in the table below.
Table 13 – Original TransCo (nominal) Capex forecast
Table 5: TransCo’s Historical Reliability Performance
Year Performance Indicators
2001 2002 2003 2004
Unserved Energy (GWh) 54.06 42.84 39.95 27.47 SAIFI 1.31 1.05 0.77 0.76 Transmission SAIDI (mins) 177.67 342.27 115.05 94.94 SAIFI 5.12 5.86 4.98 2.87 Sub-
transmission SAIDI (mins) 1014.04 1240.47 1238.53 474.31 Frequency Limit Compliance (%) 99.98101 99.86911 99.94365 99.96453 Voltage Limit Compliance (%) 70.74715 85.42783 90.44265 90.77524
Reliability targets have not yet been set by the ERC. This suggests that the methodology to be used to set targets for the next regulatory period will be based on the average performance over the last five years (as per Philippine Grid Code). TransCo officers have calculated the following targets using the methodology described in the section 10.4.2 of the Philippine Grid Code:

Review of Transco's Capital Expenditure Forecast
SINCLAIR KNIGHT MERZ
10023 TransCo Capex review final.doc PAGE 15
Table 14 – Original TransCo (nominal) Capex forecast
Table 6: Reliability Targets
Targets for Philippine System Performance Indicators
Lower Upper
SAIFI 0.71 1.56 Transmission SAIDI (mins) 85.17 279.51 SAIFI 3.63 5.87 Sub-
transmission SAIDI (mins) 707.94 1362.96 Luzon 99.90131 99.99656 Visayas 97.48735 99.97597
Frequency Limit Compliance (%)
Mindanao 99.73636 99.94452 Luzon 70.09699 92.02393 Visayas 98.53432 100.0
Voltage Limit Compliance (%)
Mindanao 97.43117 99.41015
These targets represent a continuation of the present performance levels. Hence current planning practices should continue to meet these “status quo” targets, and thus capex forecast is considered adequate to meet required performance levels.
The impact of individual projects on these reliability indicators is in practice difficult if not impossible to accurately quantify. Because of this limitation, high level planning criteria (eg “N-1”) together with targeted reliability projects in areas or types of equipment with poor reliability are the best means of incorporating performance standards into the capex plan.
In this regard, TransCo’s planned projects is considered reasonable, as they are based on a continuation of existing planning criteria, with some targeted reliability projects also included

Review of Transco's Capital Expenditure Forecast
SINCLAIR KNIGHT MERZ
10023 TransCo Capex review final.doc PAGE 16
6. Capex/Opex Trade-off The TransCo network is considered to be relatively young with a weighted average age of approximately 14 years. SKM has developed a replacement/refurbishment capital budget projection from the age profile data gained in the recent valuation. The replacement/refurbishment report is attached as Appendix C to this report.
This replacement projection is a desktop study of expected numbers of assets reaching the end of their economic lifetimes and requiring replacement. It assumes standard lifetimes for each asset class, rather than using condition based assessment. In this regard the timing of some replacements may not be optimal, but the overall trend and level of replacements required is considered reasonably accurate over the medium – long term.
The modelling carried out for this study indicates that the replacement expenditure required over the next five years is approximately PhP 5 billion for the transmission network and approximately PhP 7 billion for the subtransmisson network. By comparison, the capex forecast indicates PhP 4.7 billion of transmission replacement assets from 2005-2010, indicating an appropriate level of replacement is included in the forecast.
It is reasonable to expect that the operating and maintenance requirements of a network will increase as the system ages. In previous projects, SKM has modelled the opex versus age relationship for various asset types. In these models, it has been assumed that the relationship between opex and age follows an exponential equation. The true relationship will depend on the environment, utilisation, mix of assets and many other variables.
It is difficult to translate these curves from one business to another. However, SKM has good knowledge of the mix of assets which make up the TransCo asset base. Despite reservations, a weighted mix of opex/age curves generated for other businesses has been applied to the known mix of TransCo assets. This analysis suggests that if a similar business with a similar set of assets and with a weighted average age of 14 years was operated in Australia, then the expected operating and maintenance expenditure would be approximately 1.25% of the replacement cost of the asset. This is a little below the current level of opex for TransCo (1.9%). The difference could well result from the onerous tropical conditions which reduce expected asset lives and the high rates of vegetation growth. The lack of N-1 capacity will also make access to assets for maintenance more difficult and expensive.
This same analysis suggests that, as the system ages further, additional opex equal to approximately 0.05% of RC will be required for each additional year of aging. This is an attempt to quantify the trade-off between capital expenditure and operating and maintenance expenditure. There is no

Review of Transco's Capital Expenditure Forecast
SINCLAIR KNIGHT MERZ
10023 TransCo Capex review final.doc PAGE 17
apparent allowance in the opex forecast for additional resources to cope with any real increase in the asset age.
Capex – opex trade-off modelling indicates there are few if any current opportunities for TransCo to cost effectively reduce opex through additional capex, and hence TransCo’s capex forecast is considered reasonable in this regard.

Review of Transco's Capital Expenditure Forecast
SINCLAIR KNIGHT MERZ
10023 TransCo Capex review final.doc PAGE 18
Appendix A Capex Forecast Spreadsheets

Review of Transco's Capital Expenditure Forecast
SINCLAIR KNIGHT MERZ
10023 TransCo Capex review final.doc PAGE 19
Appendix B Capex Forecast in ERC Format

Review of Transco's Capital Expenditure Forecast
SINCLAIR KNIGHT MERZ
10023 TransCo Capex review final.doc PAGE 20
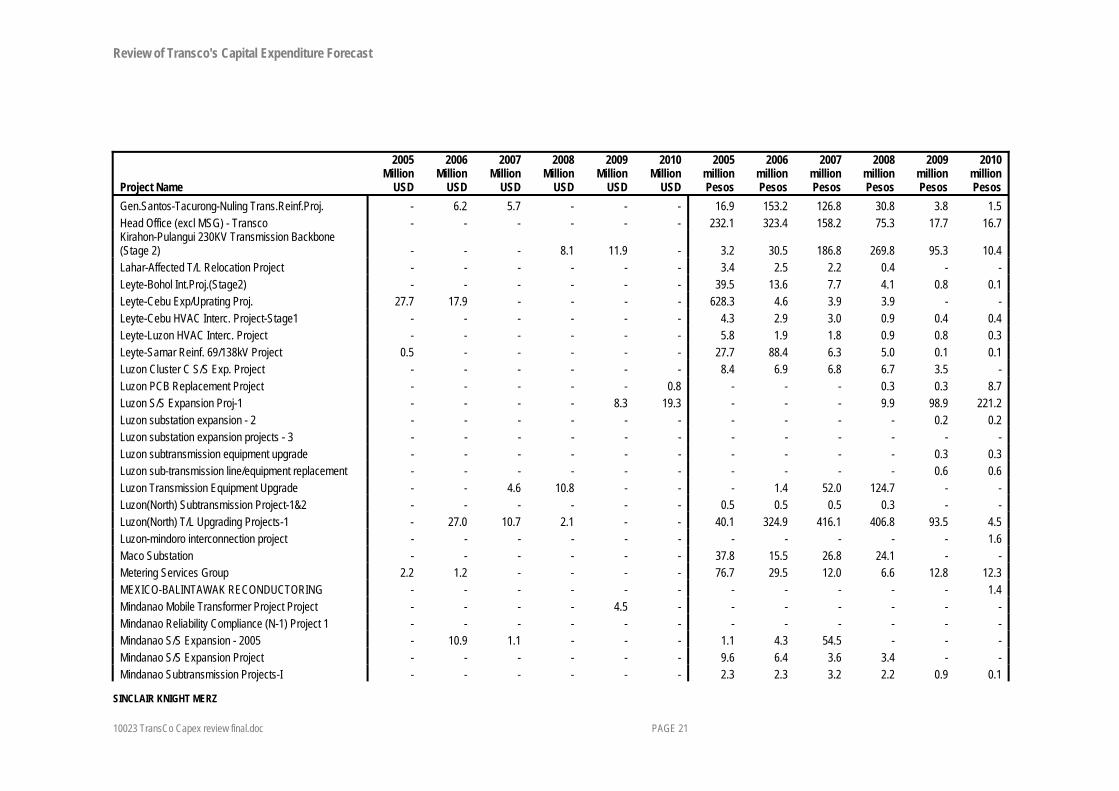
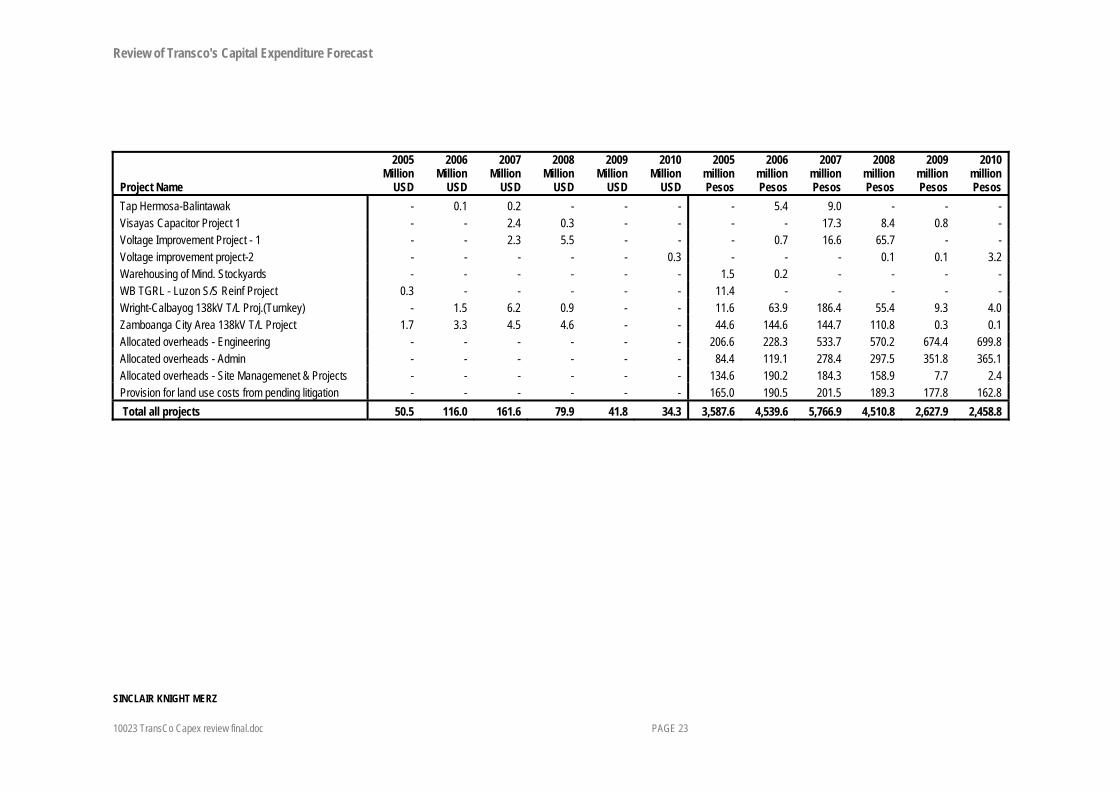
Appendix C Summary Capex Forecast by project The following is a summary of capex by project used as the basis for the capex forecast presented in this report
Project Name
2005 Million
USD
2006 Million
USD
2007 Million
USD
2008 Million
USD
2009 Million
USD
2010 Million
USD
2005 million Pesos
2006 million Pesos
2007 million Pesos
2008 million Pesos
2009 million Pesos
2010 million Pesos
Abaga-Kirahon 230kV TL Project - 14.4 21.2 - - - 26.5 263.1 467.4 49.1 8.4 3.0 Allocated overheads - Interest During Construction - - - - - - - - - - - - Aurora-Polanco(Dipolog) 138kV TL Proj (Turnkey) - - 1.4 9.8 1.4 - 3.1 34.0 121.1 151.8 161.3 6.3 Batangas Trans. Reinf. Project 1.0 6.7 5.1 1.0 - - 110.4 201.7 143.2 80.6 0.8 0.2 Bauang-San Esteban L2 Stringing Project - - - - - - 23.1 48.1 45.2 55.4 1.2 0.4 Biñan-Dasmariñas T/L Upgrading - - - - - - 86.2 20.9 19.9 21.7 0.8 0.8 Biñan-Sucat 230kV Line Upgrade - 0.5 3.8 0.5 - - 3.6 39.4 155.8 28.1 3.1 2.2 Binga-San Manuel 230kV TL Proj. - - - 9.2 6.8 3.9 - - 8.0 157.8 143.3 124.1 Bohol Backbone Project - - - - - - - - - 20.0 22.9 68.1 Bunawan S/S - - - - - - 13.4 1.0 14.2 15.3 - - Calaca II Asso. T/L - - - - - - 1.0 1.0 0.9 0.1 0.4 0.1 Capitalised O&M expenses - Concessionaire1 - - - - - - - - 42.7 55.0 36.8 31.8 Capitalised O&M expenses - Concessionaire2 - - - - - - - - 38.6 49.7 73.6 63.6 Capitalised O&M expenses - Concessionaire3 - - - - - - - - 75.3 97.0 41.2 35.6 Capitalised O&M expenses - Concessionaire4 - - - - - - - - 132.8 163.6 64.9 56.1 Capitalised O&M expenses - TransCo1 - - - - - - 161.1 146.3 60.0 43.7 36.8 31.8 Capitalised O&M expenses - TransCo2 - - - - - - 326.3 296.3 54.2 39.5 73.6 63.6 Capitalised O&M expenses - TransCo3 - - - - - - 188.1 170.8 105.5 76.9 41.1 35.6 Capitalised O&M expenses - TransCo4 - - - - - - 295.1 268.0 186.3 129.8 64.9 56.1 Casecnan (Manablon) Hydro Asso. TL - - - - - - 11.3 5.5 8.1 7.5 7.2 1.7 Cebu III Transmission - - - - - - 30.8 79.7 77.8 21.3 1.7 0.8 Cebu-Mactan Interconnection Proj.(Turnkey) 11.8 6.0 4.4 1.4 - - 22.5 17.8 14.9 5.4 0.4 0.8 Cebu-Negros Interconnection Uprating (Turnkey) - 6.3 27.5 8.5 - - 31.3 206.7 226.6 109.2 6.9 3.0 Dasmariñas-Rosario 230KV T/L Project - - 0.8 2.9 0.4 - - 8.2 21.3 147.0 29.5 0.8
Review of Transco's Capital Expenditure Forecast
SINCLAIR KNIGHT MERZ
10023 TransCo Capex review final.doc PAGE 21
Project Name
2005 Million
USD
2006 Million
USD
2007 Million
USD
2008 Million
USD
2009 Million
USD
2010 Million
USD
2005 million Pesos
2006 million Pesos
2007 million Pesos
2008 million Pesos
2009 million Pesos
2010 million Pesos
Gen.Santos-Tacurong-Nuling Trans.Reinf.Proj. - 6.2 5.7 - - - 16.9 153.2 126.8 30.8 3.8 1.5 Head Office (excl MSG) - Transco - - - - - - 232.1 323.4 158.2 75.3 17.7 16.7 Kirahon-Pulangui 230KV Transmission Backbone (Stage 2) - - - 8.1 11.9 - 3.2 30.5 186.8 269.8 95.3 10.4 Lahar-Affected T/L Relocation Project - - - - - - 3.4 2.5 2.2 0.4 - - Leyte-Bohol Int.Proj.(Stage2) - - - - - - 39.5 13.6 7.7 4.1 0.8 0.1 Leyte-Cebu Exp/Uprating Proj. 27.7 17.9 - - - - 628.3 4.6 3.9 3.9 - - Leyte-Cebu HVAC Interc. Project-Stage1 - - - - - - 4.3 2.9 3.0 0.9 0.4 0.4 Leyte-Luzon HVAC Interc. Project - - - - - - 5.8 1.9 1.8 0.9 0.8 0.3 Leyte-Samar Reinf. 69/138kV Project 0.5 - - - - - 27.7 88.4 6.3 5.0 0.1 0.1 Luzon Cluster C S/S Exp. Project - - - - - - 8.4 6.9 6.8 6.7 3.5 - Luzon PCB Replacement Project - - - - - 0.8 - - - 0.3 0.3 8.7 Luzon S/S Expansion Proj-1 - - - - 8.3 19.3 - - - 9.9 98.9 221.2 Luzon substation expansion - 2 - - - - - - - - - - 0.2 0.2 Luzon substation expansion projects - 3 - - - - - - - - - - - - Luzon subtransmission equipment upgrade - - - - - - - - - - 0.3 0.3 Luzon sub-transmission line/equipment replacement - - - - - - - - - - 0.6 0.6 Luzon Transmission Equipment Upgrade - - 4.6 10.8 - - - 1.4 52.0 124.7 - - Luzon(North) Subtransmission Project-1&2 - - - - - - 0.5 0.5 0.5 0.3 - - Luzon(North) T/L Upgrading Projects-1 - 27.0 10.7 2.1 - - 40.1 324.9 416.1 406.8 93.5 4.5 Luzon-mindoro interconnection project - - - - - - - - - - - 1.6 Maco Substation - - - - - - 37.8 15.5 26.8 24.1 - - Metering Services Group 2.2 1.2 - - - - 76.7 29.5 12.0 6.6 12.8 12.3 MEXICO-BALINTAWAK RECONDUCTORING - - - - - - - - - - - 1.4 Mindanao Mobile Transformer Project Project - - - - 4.5 - - - - - - - Mindanao Reliability Compliance (N-1) Project 1 - - - - - - - - - - - - Mindanao S/S Expansion - 2005 - 10.9 1.1 - - - 1.1 4.3 54.5 - - - Mindanao S/S Expansion Project - - - - - - 9.6 6.4 3.6 3.4 - - Mindanao Subtransmission Projects-I - - - - - - 2.3 2.3 3.2 2.2 0.9 0.1

Review of Transco's Capital Expenditure Forecast
SINCLAIR KNIGHT MERZ
10023 TransCo Capex review final.doc PAGE 22
Project Name
2005 Million
USD
2006 Million
USD
2007 Million
USD
2008 Million
USD
2009 Million
USD
2010 Million
USD
2005 million Pesos
2006 million Pesos
2007 million Pesos
2008 million Pesos
2009 million Pesos
2010 million Pesos
Naga-Tayabas T/L Rehab Project - - - - - - 10.6 2.7 1.9 1.4 - - Natural Gas Ilijan Asso T/L - - - - - - 3.5 1.0 0.3 0.1 0.1 - Negros III Transmission 0.1 - - - - - 15.7 - - - - - Negros IV 138kV Transmission Project - - - - - - 5.4 1.0 0.9 0.4 0.2 0.1 Negros V Transmission Project - - - - - - 4.9 34.2 39.4 40.0 12.1 - Negros-Panay Interconnection Uprating (Turnkey) - - 33.1 9.2 - - 9.2 28.5 194.7 119.3 7.1 10.7 Network Control Centre Projects - - - - - - 25.3 - - - - - New Gamu 230 KV SS Project - - 1.0 0.1 - - - 29.6 58.5 10.7 - - New Naga S/S Project - - - - - 4.0 - - - 6.4 18.6 79.0 Northern Panay Backbone Project - 1.5 9.3 4.6 - - 5.2 44.6 211.3 140.1 27.2 4.7 Northwestern EHV - - - - - - 24.8 10.5 5.7 1.9 0.6 0.4 Others not in the TDP - - - - - - 21.2 39.8 34.0 30.7 28.5 26.9 Pagbilao Coal T/L - - - - - - 108.2 5.7 1.4 1.3 1.3 1.2 Panay IV Transmission - - - - - - 27.9 13.2 11.0 17.3 0.3 0.2 Panay-Boracay Interconnection Project - - - - - - 5.1 105.7 36.0 0.1 - - Power Circuit Breaker Replacement Program - Mindanao - - - - 5.6 3.0 - - - 20.4 56.0 25.5 Power Circuit Breaker Replacement Project - Visayas - - - - 2.9 2.9 - - - 6.9 41.2 20.6 Pulangui-Bunawan 230kV T/L Proj.(Turnkey) (Stage 1) - 10.5 15.5 0.4 - - 7.7 296.9 378.4 58.5 13.8 5.4 Reliability Compliance Project I - Mindanao - - - - - - - - - 14.7 27.6 66.2 San Francisco 138kV S/S Project (New) - - - - - - 3.2 22.7 61.8 9.0 - - SAN JOSE 500 KV RECONFIGURATION - - - - - - - - - - - 1.4 SAN JOSE-BALINTAWAK T/L UPGRADE - - - - - - - - - - - 0.5 San Roque Asso. T/L & S/S 0.9 0.2 0.7 - - - 6.1 9.3 9.9 16.1 - - Southern Panay Backbone T/L Project - - - - - - - - - 0.8 1.6 53.6 Sucat-Sta Mesa-Balintawak - - - - - - 7.8 4.8 3.3 3.2 0.4 0.1 System Operations - TransCo 0.9 0.2 - - - - 155.2 119.8 52.0 51.8 16.4 14.2 T/L & S/S Proj- Package 1 & 2 3.3 1.4 - - - - 9.4 5.9 2.9 0.9 - - Tacurong-Nuling 138 kV Transmission Line Project - - - - - - - - - 0.8 1.6 43.8
Review of Transco's Capital Expenditure Forecast
SINCLAIR KNIGHT MERZ
10023 TransCo Capex review final.doc PAGE 23
Project Name
2005 Million
USD
2006 Million
USD
2007 Million
USD
2008 Million
USD
2009 Million
USD
2010 Million
USD
2005 million Pesos
2006 million Pesos
2007 million Pesos
2008 million Pesos
2009 million Pesos
2010 million Pesos
Tap Hermosa-Balintawak - 0.1 0.2 - - - - 5.4 9.0 - - - Visayas Capacitor Project 1 - - 2.4 0.3 - - - - 17.3 8.4 0.8 - Voltage Improvement Project - 1 - - 2.3 5.5 - - - 0.7 16.6 65.7 - - Voltage improvement project-2 - - - - - 0.3 - - - 0.1 0.1 3.2 Warehousing of Mind. Stockyards - - - - - - 1.5 0.2 - - - - WB TGRL - Luzon S/S Reinf Project 0.3 - - - - - 11.4 - - - - - Wright-Calbayog 138kV T/L Proj.(Turnkey) - 1.5 6.2 0.9 - - 11.6 63.9 186.4 55.4 9.3 4.0 Zamboanga City Area 138kV T/L Project 1.7 3.3 4.5 4.6 - - 44.6 144.6 144.7 110.8 0.3 0.1 Allocated overheads - Engineering - - - - - - 206.6 228.3 533.7 570.2 674.4 699.8 Allocated overheads - Admin - - - - - - 84.4 119.1 278.4 297.5 351.8 365.1 Allocated overheads - Site Managemenet & Projects - - - - - - 134.6 190.2 184.3 158.9 7.7 2.4 Provision for land use costs from pending litigation - - - - - - 165.0 190.5 201.5 189.3 177.8 162.8 Total all projects 50.5 116.0 161.6 79.9 41.8 34.3 3,587.6 4,539.6 5,766.9 4,510.8 2,627.9 2,458.8