Embed Size (px)
Citation preview
Transbay Program Final EIS Reevaluation Updating the Transbay Program 2004 Final EIS for Adoption by the Federal Railroad Administration
May 2010

May 2010 Page i of iii
CONTENTS I. Introduction and Summary of Conclusions ...................................................................................... 1
II. Updates to Description of the Phase 1 Train Box ............................................................................. 2
A. Description of Train Box ........................................................................................................... 2 B. Addenda to the 2004 EIS ........................................................................................................... 5 C. Construction Schedule and Methods ......................................................................................... 7 D. HST Ridership ........................................................................................................................... 8
III. Environmental Reevaluation of Pertinent 2004 EIS Analyses ...................................................... 10
A. Air Quality ............................................................................................................................... 10 1. Air Quality Conformity .................................................................................................... 10 2. Affected Environment Updates......................................................................................... 11 3. Air Quality Impacts Associated with High Speed Trains ................................................. 16
B. Transportation ......................................................................................................................... 18 1. Transportation Affected Environment Updates ................................................................ 19 2. Transportation Impact Reevaluation ................................................................................. 19
C. Noise and Vibration ................................................................................................................. 28 1. Noise and Vibration Affected Environment Update ......................................................... 29 2. Air Borne Noise ................................................................................................................ 30 3. Ground Borne Noise and Vibration .................................................................................. 30 4. Construction Noise and Vibration .................................................................................... 31 5. Effectiveness of Noise and Vibration Mitigation ............................................................. 32
D. Construction ............................................................................................................................ 32 E. Cumulative Impacts of the HST System ................................................................................. 32
1. Traffic and Circulation and Travel Conditions ................................................................. 33 2. Land Use Compatibility .................................................................................................... 33 3. Agricultural Land .............................................................................................................. 33 4. Aesthetics and Visual Resources ...................................................................................... 33 5. Cultural and Paleontological Resources ........................................................................... 34 6. Biological Resources and Wetlands .................................................................................. 34 7. Public Parks and Recreation Resources (Section 4(f) and 6(f) Resources) ...................... 34
IV. Updated Financial Analysis .............................................................................................................. 35
A. Current Transit Center Phase 1 Financial Plan ........................................................................ 35 B. Phasing of the Program ........................................................................................................... 35 C. American Recovery and Reinvestment Act ............................................................................ 37 D. Capital Plan ............................................................................................................................. 37
1. Local and Regional Plans.................................................................................................. 37 2. Capital Cost Estimates ...................................................................................................... 38 3. Funding Sources ............................................................................................................... 39 4. Level of Detail, Certainty, and Revenue Commitments ................................................... 44 5. Sources for Debt Service/Loan Repayment ...................................................................... 46
May 2010 Page ii of iii
6. Contingencies/Funding Shortfalls ..................................................................................... 47 E. Operating Plan ......................................................................................................................... 48
1. Transit Center Operating and Maintenance Plan .............................................................. 48 2. Transit Service Providers Operating and Maintenance ..................................................... 48
V. FRA as a Signatory to Section 106 MOA ........................................................................................ 49
VI. Conclusion .......................................................................................................................................... 49
FIGURES AND TABLES Figure 1 Phase 1 Train Box
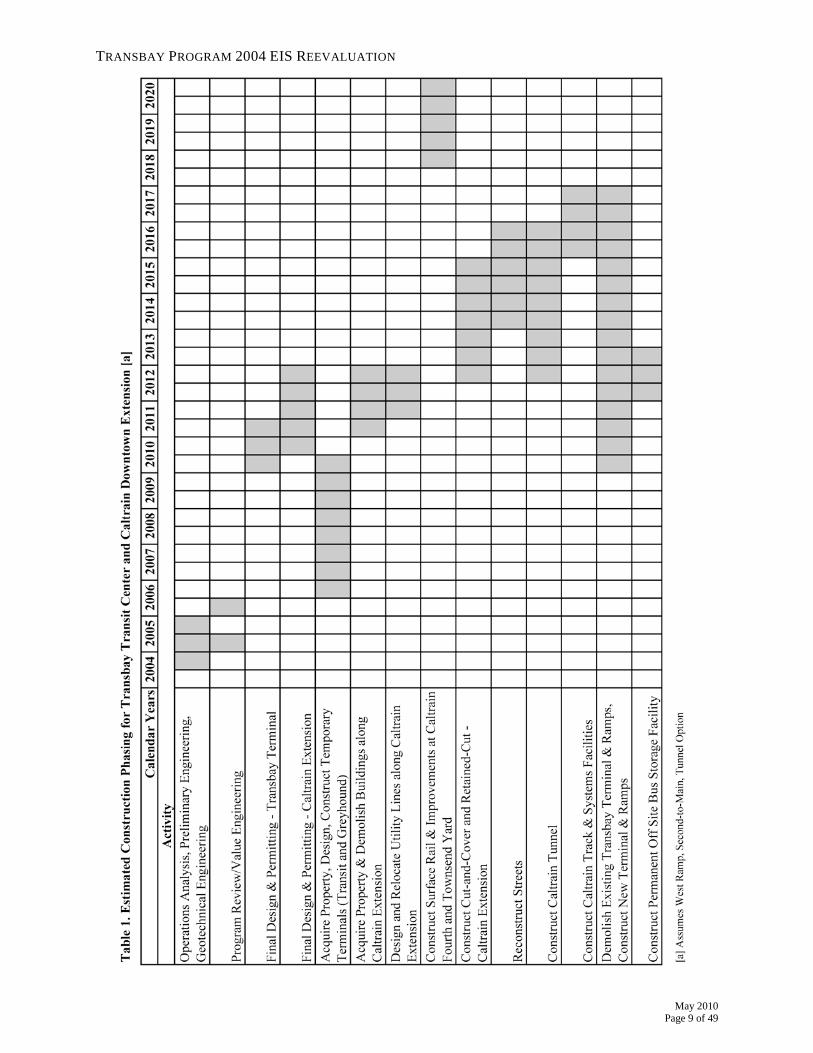
Table 1 Estimated Construction Phasing for Transbay Transit Center and Caltrain Downtown Extension
Table 2 National and California Ambient Air Quality Standards
Table 3 Current Federal and State Attainment Status for the Bay Area
Table 4 Summary of Pollutant Monitoring Data at San Francisco—Arkansas Street Monitoring Station
Table 5 Potential Statewide Impacts to Air Quality and Greenhouse Gases from the Pacheco Alignment Alternative
Table 6 Summary of PM Peak Hour Boarding Calculations, 2035
Table 7 Summary of HST Passenger Modes of Travel, 2035
Table 8 Intersection Level of Service – 2030 Cumulative Conditions, Weekday PM Peak Hour
Table 9 Determination of Project Significant Traffic Impacts
Table 10 Crosswalk Level of Service – 2030 Cumulative Conditions, Weekday PM Peak Hour
Table 11 Corner Level of Service – 2030 Cumulative Conditions, Weekday PM Peak Hour
Table 12 Ground Borne Vibration and Ground Borne Noise Impact Criteria for General Assessment
Table 13 Transbay Program Phase 1 Cost Estimate as of March 2010
Table 14 Revenue by Phase as of March 2010
Table 15 Phase 1 Revenue Commitment Status as of March 2010
Table 16 Identified Sources for Debt Service/Loan Repayment for Phase 1 Construction Period Loan
Table 17 Estimate Availability for Identified Revenue Sources for Debt Service
EXHIBITS Exhibit 1 TJPA, Addendum for the Transbay Terminal/Downtown Extension/Redevelopment
Project Final Environmental Impact Statement/Report (May 25, 2006)
Exhibit 2 TJPA, Second Addendum to the Transbay Terminal/Downtown Extension/Redevelopment Project Final Environmental Impact Statement/Environmental Impact Report (April 19, 2007)
May 2010
Page iii of iii
Exhibit 3 TJPA, Third Addendum to the Transbay Terminal/Downtown Extension/Redevelopment Project Final Environmental Impact Statement/Environmental Impact Report (Jan. 17, 2008)
Exhibit 4 TJPA, Fourth Addendum to the Transbay Terminal/Downtown Extension/Redevelopment Project Final Environmental Impact Statement/Environmental Impact Report (Oct. 3, 2008)
Exhibit 5 TJPA, Fifth Addendum to the Transbay Terminal/Downtown Extension/Redevelopment Project Final Environmental Impact Statement/Environmental Impact Report (March 30, 2009)
Exhibit 6a FTA, Environmental Clearance for Advance Construction of Train Box Portion of Transbay Transit Center (August 13, 2009)
Exhibit 6b FRA, Letter regarding $400 million in funding for the train box (March 29, 2010)
Exhibit 7 TJPA, Transbay Terminal/Caltrain Downtown Extension/Redevelopment Project FEIS/FEIR Mitigation Monitoring and Reporting Program (Rev. Nov. 2007)
Exhibit 8 Memorandum of Agreement Between the Federal Transit Administration, and the California State Historic Preservation Officer Regarding the Transbay Terminal/Caltrain Downtown Extension/Redevelopment Project in San Francisco County, California (June 2004)
Exhibit 9a CHSRA, Report to the Legislature (December 2009)
Exhibit 9b CHSRA Staff Report re Transbay Transit Center Design/Trainbox (March 31, 2010)
TECHNICAL APPENDIXES Appendix A Phase 1 Train Box
Appendix B Transportation Analyses

May 2010 Page 1 of 49
Transbay Program 2004 EIS Reevaluation Updating the Transbay Program 2004 EIS for Adoption by the Federal Railroad Administration
I. INTRODUCTION AND SUMMARY OF CONCLUSIONS
The Federal Railroad Administration (“FRA”) is adopting the portion of the March 2004 Transbay Terminal/Caltrain Downtown Extension/Redevelopment Project (“Transbay Program”) Final Environmental Impact Statement/Environmental Impact Report (“2004 EIS”) that covers Phase 1 of the Transbay Program to satisfy FRA’s obligations under the National Environmental Policy Act (“NEPA”). FRA is adopting the Phase 1 portions of the 2004 EIS to support a decision to provide grant funding for the Transbay Transit Center train box. FRA has prepared this Reevaluation of the Phase 1 portions of the 2004 EIS to consider recent modifications to the train box design and to update environmental information contained in the 2004 EIS pursuant to FRA’s Procedures for Considering Environmental Impacts (64 FR 28545, May 26, 1999). The American Recovery and Reinvestment Act (“Recovery Act”) provided $8 billion as initial funding for the High-Speed Intercity Passenger Rail (“HSIPR”) grant program. The Secretary of Transportation selected the California High-Speed Rail Authority (“CHSRA”) to receive up to $2.25 billion from the Recovery Act to fund the development of high-speed intercity passenger rail service in California. As the Transit Center has been demonstrated to be the only feasible and practicable site in San Francisco for the northern terminus of the California high-speed rail system, it is the intention of the FRA to provide up to $400 million of the CHSRA Recovery Act funding to the Transbay Joint Powers Authority (“TJPA”) in order to begin construction of the train box designed to accommodate the future high-speed rail service at the Transit Center. FRA is adopting the 2004 EIS pursuant to the regulations promulgated by the Council on Environmental Quality (“CEQ”).1
CEQ regulations permit Federal agencies to adopt a Final EIS, or portion thereof, issued by another Federal agency if the EIS or portion thereof “meets the standards for an adequate statement” and the actions covered by the original environmental impact statement and the proposed action are “substantially the same.” FRA has determined that the 2004 EIS meets the standards for adequacy and the action covered is substantially the same as the FRA’s proposed action.
Part II of this Reevaluation updates the description of the train box, including the method and staging of construction; summarizes five addenda to the 2004 EIS that evaluated modifications to and refinements of the Transbay Program; and updates California high-speed train (“HST”) ridership projections based on the most recent projections from the CHSRA in its report to the Legislature in December 2009. Part III reevaluates certain elements of the environmental analyses in the 2004 EIS that are pertinent to providing HST service at the Transit Center; specifically, air quality, including greenhouse gas; transportation, including vehicles, transit, parking, and pedestrians; noise and vibration; construction impacts, including solid waste generated by construction; and cumulative impacts of HST service. Part IV updates the financial analysis in the 2004 EIS, Part V discusses FRA’s intent to become a signatory to the Section 106 Memorandum of Agreement (“MOA”) for the Transbay Program, and Part VI summarizes the conclusions of this Reevaluation. 1 40 C.F.R. 1506.3
TRANSBAY PROGRAM 2004 EIS REEVALUATION
May 2010 Page 2 of 49
In summary, this Reevaluation does not identify any changes to Phase 1 of the Transbay Program that would result in significant environmental impacts that were not previously evaluated in the 2004 EIS, nor does it identify new information or circumstances relevant to environmental concerns and bearing on the proposed action or its impacts that would result in significant environmental impacts not previously evaluated in the 2004 EIS. Based on the Reevaluation, FRA has determined that the 2004 EIS is still adequate, accurate, and valid to support the proposed action.
II. UPDATES TO DESCRIPTION OF THE PHASE 1 TRAIN BOX
Phase 1 of the Transbay Program consists of construction of the new Transit Center and the below-grade train box. The proposed FRA action is the funding of construction of the Transit Center train box through FRA’s HSIPR Program. The Transit Center will replace the existing 1939 Transbay Terminal, located at First and Mission streets in downtown San Francisco, with a modern multi-modal transit hub serving as the San Francisco terminus for HST service between Los Angeles and San Francisco; Caltrain commuter train service from the Peninsula to San Francisco; regional public and private bus networks2
; and connections between HST and San Francisco Municipal Railway light rail (“San Francisco Muni”), Bay Area Rapid Transit (“BART”), and bus service including Amtrak Thruway Bus Services.
The design of Phase 1 is well advanced, and the land acquisition is nearly complete. The Temporary Terminal has been constructed on an adjacent site and is ready for occupancy. The bus services are ready to be relocated to the new Temporary Terminal, following adequate prior notice, at which time the existing terminal will be demolished and construction of the Transit Center, including the train box, will commence.
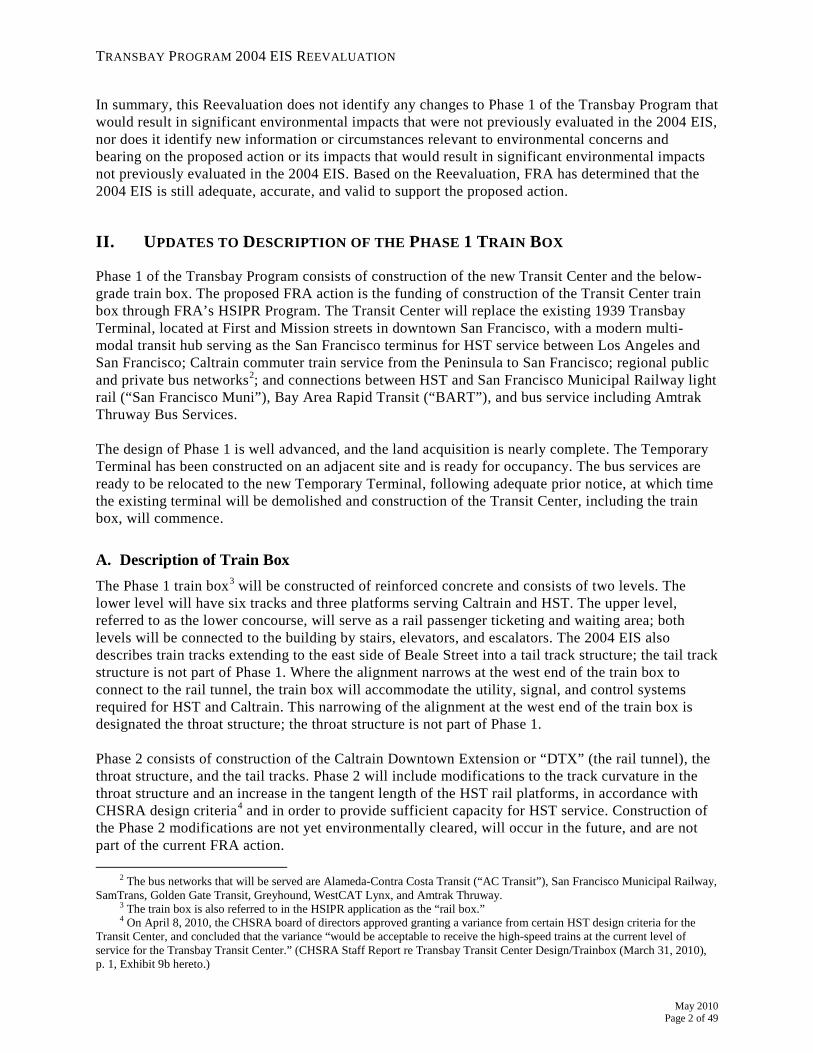
A. Description of Train Box The Phase 1 train box3
will be constructed of reinforced concrete and consists of two levels. The lower level will have six tracks and three platforms serving Caltrain and HST. The upper level, referred to as the lower concourse, will serve as a rail passenger ticketing and waiting area; both levels will be connected to the building by stairs, elevators, and escalators. The 2004 EIS also describes train tracks extending to the east side of Beale Street into a tail track structure; the tail track structure is not part of Phase 1. Where the alignment narrows at the west end of the train box to connect to the rail tunnel, the train box will accommodate the utility, signal, and control systems required for HST and Caltrain. This narrowing of the alignment at the west end of the train box is designated the throat structure; the throat structure is not part of Phase 1.
Phase 2 consists of construction of the Caltrain Downtown Extension or “DTX” (the rail tunnel), the throat structure, and the tail tracks. Phase 2 will include modifications to the track curvature in the throat structure and an increase in the tangent length of the HST rail platforms, in accordance with CHSRA design criteria4
2 The bus networks that will be served are Alameda-Contra Costa Transit (“AC Transit”), San Francisco Municipal Railway,
SamTrans, Golden Gate Transit, Greyhound, WestCAT Lynx, and Amtrak Thruway.
and in order to provide sufficient capacity for HST service. Construction of the Phase 2 modifications are not yet environmentally cleared, will occur in the future, and are not part of the current FRA action.
3 The train box is also referred to in the HSIPR application as the “rail box.” 4 On April 8, 2010, the CHSRA board of directors approved granting a variance from certain HST design criteria for the
Transit Center, and concluded that the variance “would be acceptable to receive the high-speed trains at the current level of service for the Transbay Transit Center.” (CHSRA Staff Report re Transbay Transit Center Design/Trainbox (March 31, 2010), p. 1, Exhibit 9b hereto.)
TRANSBAY PROGRAM 2004 EIS REEVALUATION
May 2010
Page 3 of 49
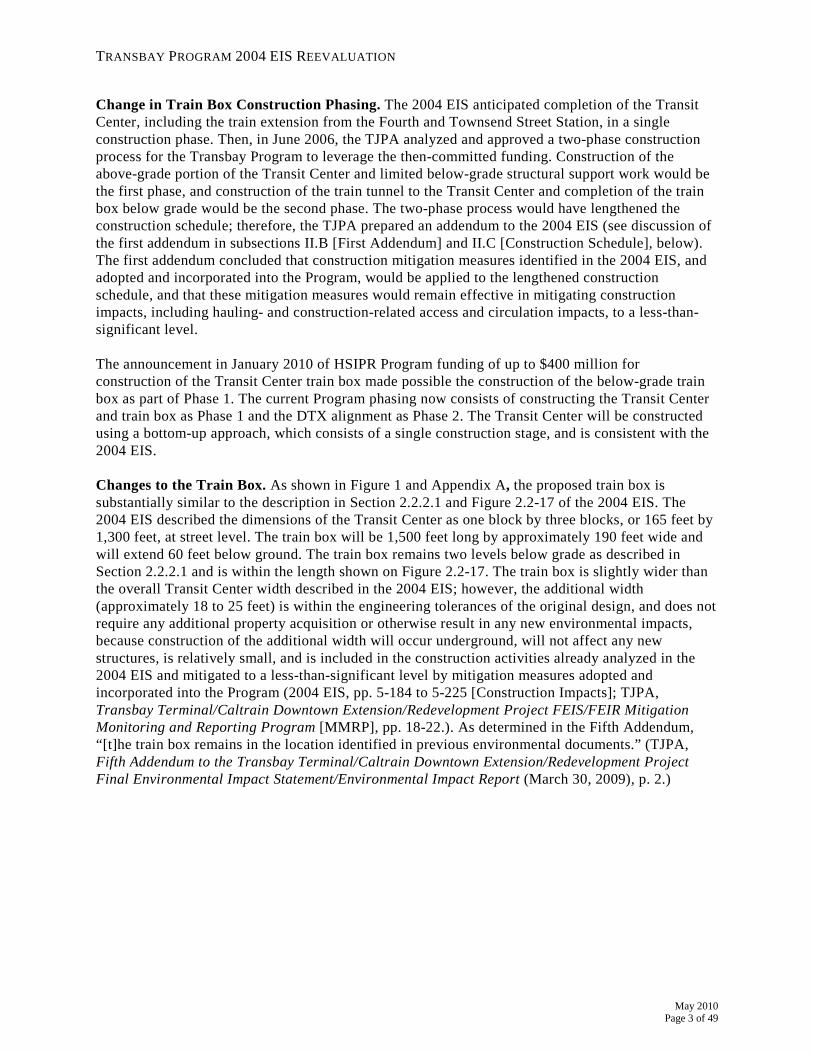
Change in Train Box Construction Phasing. The 2004 EIS anticipated completion of the Transit Center, including the train extension from the Fourth and Townsend Street Station, in a single construction phase. Then, in June 2006, the TJPA analyzed and approved a two-phase construction process for the Transbay Program to leverage the then-committed funding. Construction of the above-grade portion of the Transit Center and limited below-grade structural support work would be the first phase, and construction of the train tunnel to the Transit Center and completion of the train box below grade would be the second phase. The two-phase process would have lengthened the construction schedule; therefore, the TJPA prepared an addendum to the 2004 EIS (see discussion of the first addendum in subsections II.B [First Addendum] and II.C [Construction Schedule], below). The first addendum concluded that construction mitigation measures identified in the 2004 EIS, and adopted and incorporated into the Program, would be applied to the lengthened construction schedule, and that these mitigation measures would remain effective in mitigating construction impacts, including hauling- and construction-related access and circulation impacts, to a less-than-significant level. The announcement in January 2010 of HSIPR Program funding of up to $400 million for construction of the Transit Center train box made possible the construction of the below-grade train box as part of Phase 1. The current Program phasing now consists of constructing the Transit Center and train box as Phase 1 and the DTX alignment as Phase 2. The Transit Center will be constructed using a bottom-up approach, which consists of a single construction stage, and is consistent with the 2004 EIS. Changes to the Train Box. As shown in Figure 1 and Appendix A, the proposed train box is substantially similar to the description in Section 2.2.2.1 and Figure 2.2-17 of the 2004 EIS. The 2004 EIS described the dimensions of the Transit Center as one block by three blocks, or 165 feet by 1,300 feet, at street level. The train box will be 1,500 feet long by approximately 190 feet wide and will extend 60 feet below ground. The train box remains two levels below grade as described in Section 2.2.2.1 and is within the length shown on Figure 2.2-17. The train box is slightly wider than the overall Transit Center width described in the 2004 EIS; however, the additional width (approximately 18 to 25 feet) is within the engineering tolerances of the original design, and does not require any additional property acquisition or otherwise result in any new environmental impacts, because construction of the additional width will occur underground, will not affect any new structures, is relatively small, and is included in the construction activities already analyzed in the 2004 EIS and mitigated to a less-than-significant level by mitigation measures adopted and incorporated into the Program (2004 EIS, pp. 5-184 to 5-225 [Construction Impacts]; TJPA, Transbay Terminal/Caltrain Downtown Extension/Redevelopment Project FEIS/FEIR Mitigation Monitoring and Reporting Program [MMRP], pp. 18-22.). As determined in the Fifth Addendum, “[t]he train box remains in the location identified in previous environmental documents.” (TJPA, Fifth Addendum to the Transbay Terminal/Caltrain Downtown Extension/Redevelopment Project Final Environmental Impact Statement/Environmental Impact Report (March 30, 2009), p. 2.)
TRANSBAY PROGRAM 2004 EIS REEVALUATION
May 2010 Page 4 of 49
Figure 1, Phase 1 Train Box
TRANSBAY PROGRAM 2004 EIS REEVALUATION
May 2010
Page 5 of 49
B. Addenda to the 2004 EIS The Federal Transit Administration (“FTA”) issued a Record of Decision (“ROD”) in February 2005, which determined that the 2004 EIS satisfied the requirements of NEPA. Since that time, the TJPA Board of Directors has adopted five addenda to the 2004 EIS, each prior to approving modifications and refinements to the Transbay Program. The modifications and refinements to the Transbay Program evaluated in the five addenda, and summarized below and attached as Exhibits 1 through 5, have not substantially changed the scope of the train box. First Addendum. The first addendum to the 2004 EIS evaluated modifications and refinements to the Transit Center design and construction staging, and revisions to the Temporary Terminal site plan (Exhibit 1). The first addendum was adopted by the TJPA Board of Directors on June 2, 2006. The changes considered in the first addendum included the following refinements to the Transit Center component of the locally preferred alternative:
• reduction in the building height and size;
• consolidation of the bus operations on the AC Transit level;
• relocation of Greyhound operations to the train mezzanine (lower concourse);
• elimination of one level of bus ramp;
• improvements in public access and pedestrian circulation at the ground level;
• a two-stage construction process;5
• use of a temporary Greyhound boarding area prior to construction of the permanent boarding facility in the second stage; and
• use of a reduced number of piles (caissons) for construction of the Transit Center building. Second Addendum. The second addendum evaluated modifications and refinements to the locally preferred alternative for the “DTX” portion of the Transbay Program, including design provisions to allow future construction of a Townsend/Embarcadero/Main Loop and delay in construction of tail tracks on Main Street pending the outcome of future rail planning studies to accommodate HST (Exhibit 2). The second addendum was adopted by the TJPA Board on April 19, 2007. The modifications considered in the second addendum included the following changes to the DTX component of the approved locally preferred alternative, all of which contribute to a reduction in the size of various elements of the DTX component or rearrangement of uses within the Program area previously analyzed in the 2004 EIS:
• two-track lead on the surface and below ground leading to the DTX tunnel system to just before the Fourth and Townsend Street underground station;
• three tracks beginning at the Fourth and Townsend Street underground station and continuing to the throat section approaching the Transit Center where the three-track system splays to six tracks to accommodate the six platform berthing locations within the station;
• at-grade rail car storage within the existing Caltrain rail storage yard rather than underground storage, which would reduce the amount of underground construction associated with the project and would not significantly change the existing use of the rail storage area; design provisions to allow for a future connection to the cut-and-cover tunnel on Townsend Street that will facilitate construction of future system capacity for both Caltrain and HST, and will be capable of
5 As described in Section II.C, this revised staging plan was subsequently rescinded, and the Transit Center construction
phasing reverted back to the phasing analyzed in the 2004 EIS.
TRANSBAY PROGRAM 2004 EIS REEVALUATION
May 2010 Page 6 of 49
accommodating the construction of a future Townsend Street/Embarcadero/Main Street Loop with minimal disruption to ongoing rail service; and
• delay in construction of the tail tracks, pending the outcome of future planning studies related to accommodating HST and optimizing concurrent Caltrain and HST operations, which would reduce the amount of underground construction within the project footprint analyzed in the 2004 EIS at this time.
Third Addendum. The third addendum evaluated adding 546 Howard Street, which was identified in the 2004 EIS for partial acquisition, to the list of properties identified for full acquisition (Exhibit 3). The third addendum was adopted by the TJPA Board on January 17, 2008. The 546 Howard Street property is an undeveloped lot used for surface parking. The entire property was determined to be needed for construction staging for the Transit Center project. The only increased physical effect of acquiring the entire property, rather than part of the property, is that more surface parking would be removed. The San Francisco Planning Code Section 161(c) does not require the provision of off-street parking for any use in the downtown in light of the compact and congested nature of the area. Fourth Addendum. The fourth addendum evaluated the configuration, boarding platforms and waiting areas, bus staging areas, and street design associated with the Temporary Terminal (Exhibit 4). The fourth addendum was adopted by the TJPA Board on October 17, 2008. The modifications and refinements considered in the fourth addendum included the following changes to the Temporary Terminal component of the approved locally preferred alternative:
• consolidation of the Temporary Terminal facilities on a single block, bounded by Folsom, Main, Howard, and Beale streets;
• incorporation of boarding facilities and passenger waiting areas for Greyhound and AC Transit bus services into the interior of the block;
• reconfiguration of the boarding and staging areas for the other bus operators around the perimeter of the block and along adjacent blocks; and
• modifications to the bus lane configuration on the surrounding streets. Fifth Addendum. The fifth addendum evaluated the building design for the Transit Center, specifically, the exterior façade of the upper levels, a pedestrian bridge over Beale Street, and associated public right-of-way vacations (Exhibit 5). The fifth addendum was adopted by the TJPA Board on April 9, 2009, and authorized the Executive Director of the Transbay Joint Powers Authority (“TJPA”) to submit a street vacation application to the City and County of San Francisco. Based on results of the design competition and refinements to design of the Transit Center, certain modifications and refinements to the Transit Center design have occurred, specifically: (1) the addition of above-ground outer wall basket structures, and (2) the possible addition of a pedestrian bridge over Beale Street (“Design Modifications”). The Transit Center, including its Design Modifications, will need to occupy portions of the public streets and sidewalks that are owned by the City and County of San Francisco as a public right-of-way. The Transit Center will need to occupy areas above and below public streets and sidewalks, specifically:
• air space for the Transit Center outer wall basket structures over Minna, Natoma, and Beale streets;
• air space for the proposed pedestrian bridge over Beale Street;
• air space for the Transit Center bus deck bridges over First and Fremont streets;
• below ground for the train box under Minna, Natoma, First, Fremont, and Beale streets; and
TRANSBAY PROGRAM 2004 EIS REEVALUATION
May 2010
Page 7 of 49
• air space for the bus ramps connecting the Transit Center to Interstate 80 where the bus ramps cross over Natoma, Howard, Tehama, Clementina, Folsom, Harrison, and First streets.
C. Construction Schedule and Methods Construction Schedule. As discussed in Section II.B, in June 2006, the TJPA approved a two-phase construction process for the Transbay Program (TJPA, First Addendum to 2004 EIS). The 2004 EIS had previously anticipated completion of the Transit Center, including the train extension from the Fourth and Townsend Street Station, in one construction phase. The two-phase process proposed construction of the above-grade portion of the Transit Center and limited below-grade structural support work as the first phase, and construction of the train tunnel to the Transit Center and completion of the train box below grade as the second phase. The two-phase process would have lengthened the construction schedule. Accordingly, the first addendum analyzed whether this lengthened construction schedule would result in any new significant impacts. The first addendum found that construction impacts, including hauling- and construction-related access and circulation impacts, would be mitigated to a less-than-significant level. (TJPA, First Addendum to 2004 EIS, pp. 16-17.) This conclusion remains valid for the current construction schedule. Demolition of the existing terminal and construction of the Transit Center, including the train box, is now expected to last roughly 7 years, or 3½ years longer than estimated in the 2004 EIS. Daily construction-related traffic and activities would not increase from what was assumed in the 2004 EIS, however. Construction mitigation measures identified in the 2004 EIS and adopted and incorporated into the Program would be applied to the lengthened construction schedule. (2004 EIS, pp. 5-158 to 5-222; MMRP, pp.18-22.) These include pre-construction measures to protect building integrity and local businesses; general construction measures to maintain adequate vehicle and pedestrian circulation; “basic control measures” and “enhanced control measures” recommended by the Bay Area Air Quality Management District (“BAAQMD”) to reduce construction air emissions; and measures to reduce visual and aesthetic impacts from construction. As determined in the first addendum, these mitigation measures would remain effective in mitigating construction impacts to a less-than-significant level despite the longer construction period. Accordingly, the lengthened construction schedule would not produce any new significant environmental impacts, and was environmentally cleared in the first addendum. Following adoption of the first addendum to the 2004 EIS, it was determined that construction of the below-grade train box would be included as part of the first phase, consistent with the 2004 EIS. FTA issued a memorandum on August 13, 2009, included as Exhibit 6a, which concluded that this change would not result in any additional environmental impacts not analyzed in the 2004 EIS, and that no additional environmental review would be required. (FTA, Environmental clearance for advance construction of train box portion of Transbay Transit Center, August 13, 2009.)6
The adopted construction phasing now consists of constructing the Transit Center as Phase 1 and the DTX alignment as Phase 2. The Transit Center will be constructed using a bottom-up approach, which consists of a single construction stage, and is consistent with the 2004 EIS.
While consistent with the 2004 EIS, the start of construction for the Transit Center has been delayed. The updated construction schedule, shown in Table 1, commences 3 years later than the schedule shown in the 2004 EIS. The revised schedule shows the anticipated start of demolition in the second half of 2010.
6 The August 2009 memorandum was issued by the FTA in conjunction with the Department of Transportation’s award of a TIFIA loan to the TJPA.
TRANSBAY PROGRAM 2004 EIS REEVALUATION
May 2010 Page 8 of 49
Construction Methods. The proposed construction equipment and methods for demolition of the existing terminal and construction of the Transit Center remain consistent with the equipment and methods identified in Section 5.20 of the 2004 EIS.
D. HST Ridership The 2004 EIS assumed that the Transit Center would need to accommodate 43,000 HST boardings and alightings (i.e., passengers) per day in 2020 in addition to 29,300 Caltrain boardings and alightings. (2004 EIS, pp. 3-31, 3-33.) The HST passenger figures were not used for all 2004 EIS analyses, however. Since the 2004 EIS was completed, revised HST ridership projections past 2020 (for 2035) have become available and are used in this Reevaluation to assess the effects from all projected HST ridership, not just the increment above the ridership assumed in the 2004 EIS. The CHSRA most recently refined its ridership projections in its Report to the Legislature December 2009 (“December 2009 Business Plan”), attached hereto as Exhibit 9a. The December 2009 Business Plan, Table D, projects 24,100 daily HST boardings at the Transit Center in 2035, which is equivalent to approximately 48,200 boardings and alightings (passengers). Of these, approximately 80% are expected to be inter-regional travelers, and the remaining 20% are expected to be local commuters (December 2009 Business Plan, p. 72). Table F of the December 2009 Business Plan indicates that 54% of inter-regional travelers and 66% of commuters will travel during the 6-hour daily peak period. As indicated in Figure 6 of the December 2009 Business Plan, the anticipated passenger boardings at the Transit Center during the heaviest peak hour will be approximately 3,550 people. Hourly boardings at the Transit Center during off-peak periods are shown in Figure 7 to be approximately 900 passengers. This is equivalent to approximately 8 trains per hour into and from the Transit Center during the morning and evening peak periods of 3 hours each, and approximately 6 trains per hour into and from the Transit Center during the remaining 10 off-peak hours of operation. Section III of this Reevaluation updates the 2004 EIS by analyzing how these currently forecast HST ridership projections might impact air quality, transportation, and noise and vibration and affect construction impacts and cumulative impacts.
TRANSBAY PROGRAM 2004 EIS REEVALUATION
May 2010
Page 9 of 49
TRANSBAY PROGRAM 2004 EIS REEVALUATION
May 2010 Page 10 of 49
III. ENVIRONMENTAL REEVALUATION OF PERTINENT 2004 EIS ANALYSES
This section reevaluates certain elements of the environmental review in the 2004 EIS, and provides an update to those sections for which new information is available that is pertinent to the proposed action.
A. Air Quality Sections 5.7 (operational impacts) and 5.21.9 (construction impacts) of the 2004 EIS analyzed the air quality impacts of the Transbay Program, including the Transit Center. The 2004 EIS concluded that the operational impacts would not be significant, because vehicle miles traveled (“VMT”) in the region would be reduced and there would be no carbon monoxide exceedences at local intersections in the vicinity of the Transit Center. While air quality impacts of construction of the Transit Center could result in short term emissions of nitrogen oxides, carbon monoxide, and sulfur oxides from diesel-powered construction equipment; carbon monoxide emissions from worker vehicles; dust or respirable particulate matter emissions from vehicles traveling on unpaved surfaces and/or grading and other earthmoving activities; and reactive organic gas emissions from asphalt placement and architectural coatings; there are no quantitative emissions thresholds for construction activities, which by their nature are temporary and occur over a large area, potentially affecting different receptors at different times. The 2004 EIS used the BAAQMD’s approach to the analysis of construction impacts, which involves implementation of effective and comprehensive control measures rather than detailed quantification of emissions. These measures are identified on page 5-205 of the 2004 EIS and are incorporated into Mitigation Measures AC 01 through AC 15 (TJPA, MMRP, pp. 20-21; FTA and SHPO, MOA, p. 15). The MMRP is included as Exhibit 7, and the MOA is included as Exhibit 8.
1. Air Quality Conformity
The 2004 EIS determined that there would be no air quality exceedences, because the Transbay Program would be consistent with the conformity requirements established by the United States Environmental Protection Agency (“USEPA”), and the 2004 EIS determined that the Transbay Program met conformity requirements (2004 EIS, pp. 5-61 to 5-64). In FTA’s 2005 ROD, the FTA concurred with the 2004 EIS conformity determination (FTA, ROD, pp. 14-15). Thus, no exceedences of state or federal ambient air quality standards were projected in the future analysis year of 2020, and no mitigation is proposed for long-term air quality effects resulting from project operation. This section updates federal and state air quality standards; updates air quality conditions in the Bay Area and study area; and analyzes air quality impacts associated with providing HST service to the Transit Center. This section also reviews and updates the air quality Transportation Conformity analysis conducted in the 2004 EIS and incorporates by reference the General Conformity analysis contained in the 2008 Bay Area to Central Valley High Speed Train (HST) Final Program EIR/EIS (CHSRA and U.S. Department of Transportation FRA, 2008), hereinafter referred to as the “2008 Bay Area to Central Valley EIR/EIS.” This section confirms that both the 2004 Transportation Conformity analysis and the 2008 Bay Area to Central Valley EIR/EIS General Conformity analysis are still valid.
TRANSBAY PROGRAM 2004 EIS REEVALUATION
May 2010
Page 11 of 49
2. Affected Environment Updates
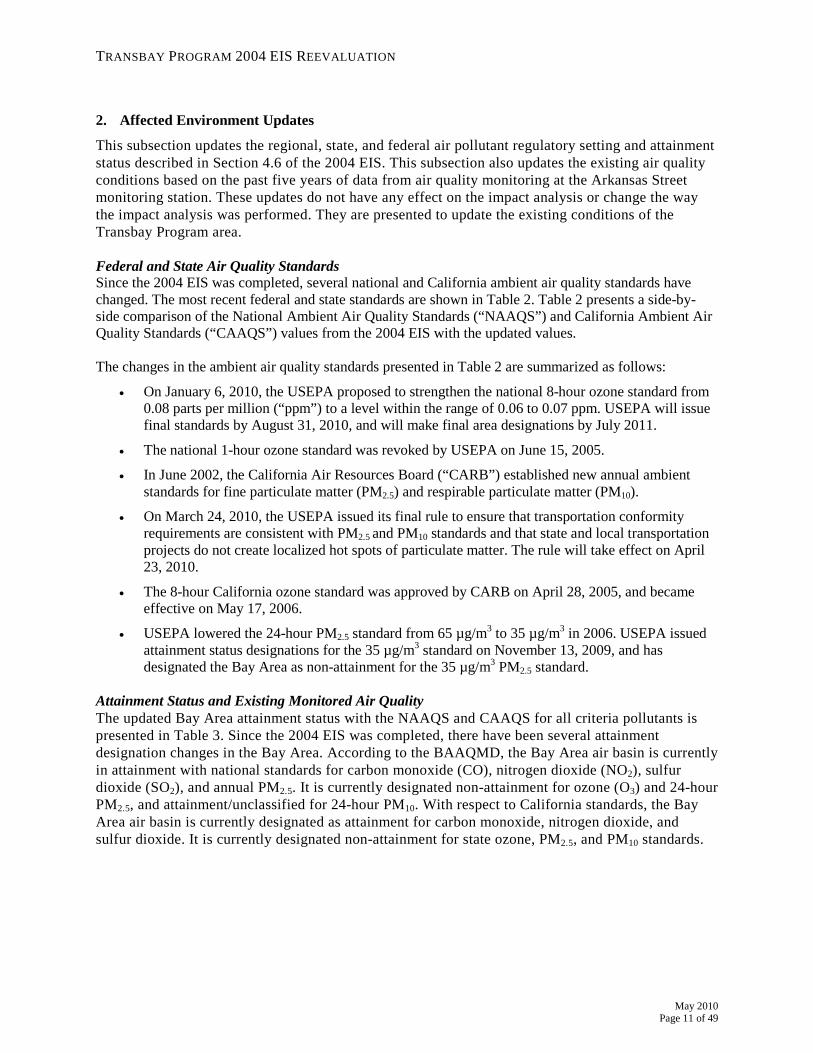
This subsection updates the regional, state, and federal air pollutant regulatory setting and attainment status described in Section 4.6 of the 2004 EIS. This subsection also updates the existing air quality conditions based on the past five years of data from air quality monitoring at the Arkansas Street monitoring station. These updates do not have any effect on the impact analysis or change the way the impact analysis was performed. They are presented to update the existing conditions of the Transbay Program area. Federal and State Air Quality Standards Since the 2004 EIS was completed, several national and California ambient air quality standards have changed. The most recent federal and state standards are shown in Table 2. Table 2 presents a side-by-side comparison of the National Ambient Air Quality Standards (“NAAQS”) and California Ambient Air Quality Standards (“CAAQS”) values from the 2004 EIS with the updated values. The changes in the ambient air quality standards presented in Table 2 are summarized as follows:
• On January 6, 2010, the USEPA proposed to strengthen the national 8-hour ozone standard from 0.08 parts per million (“ppm”) to a level within the range of 0.06 to 0.07 ppm. USEPA will issue final standards by August 31, 2010, and will make final area designations by July 2011.
• The national 1-hour ozone standard was revoked by USEPA on June 15, 2005.
• In June 2002, the California Air Resources Board (“CARB”) established new annual ambient standards for fine particulate matter (PM2.5) and respirable particulate matter (PM10).
• On March 24, 2010, the USEPA issued its final rule to ensure that transportation conformity requirements are consistent with PM2.5 and PM10 standards and that state and local transportation projects do not create localized hot spots of particulate matter. The rule will take effect on April 23, 2010.
• The 8-hour California ozone standard was approved by CARB on April 28, 2005, and became effective on May 17, 2006.
• USEPA lowered the 24-hour PM2.5 standard from 65 µg/m3 to 35 µg/m3 in 2006. USEPA issued attainment status designations for the 35 µg/m3 standard on November 13, 2009, and has designated the Bay Area as non-attainment for the 35 µg/m3 PM2.5 standard.
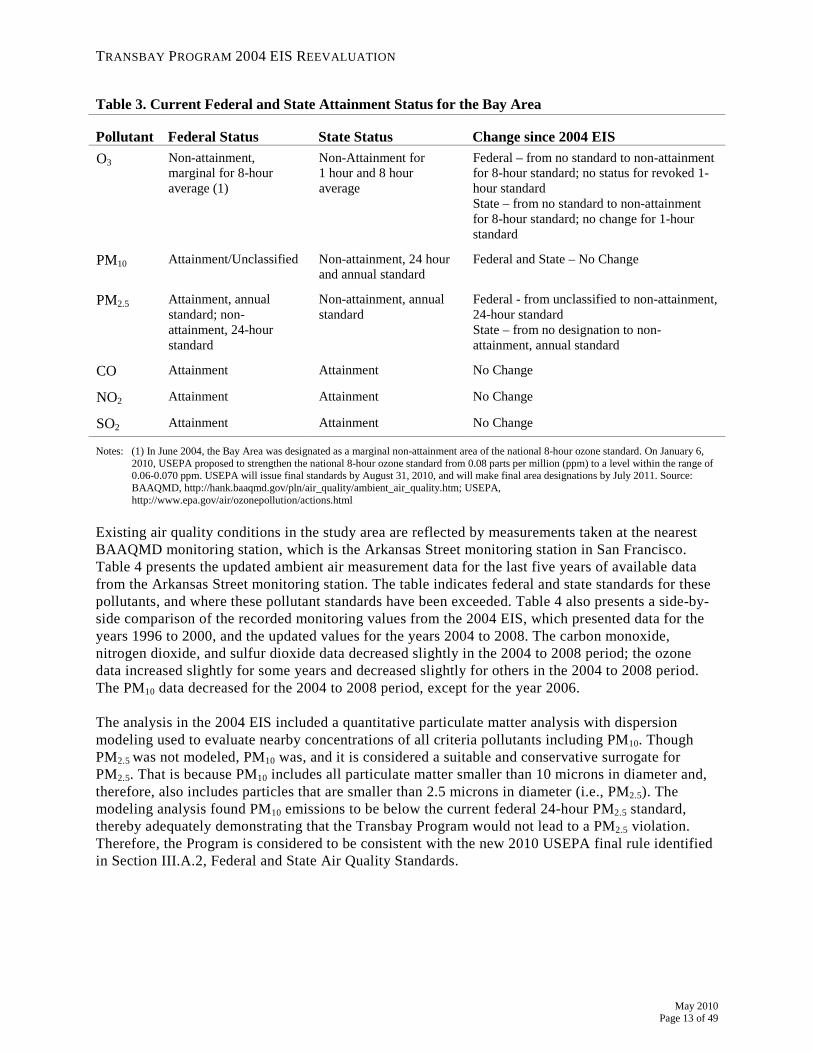
Attainment Status and Existing Monitored Air Quality The updated Bay Area attainment status with the NAAQS and CAAQS for all criteria pollutants is presented in Table 3. Since the 2004 EIS was completed, there have been several attainment designation changes in the Bay Area. According to the BAAQMD, the Bay Area air basin is currently in attainment with national standards for carbon monoxide (CO), nitrogen dioxide (NO2), sulfur dioxide (SO2), and annual PM2.5. It is currently designated non-attainment for ozone (O3) and 24-hour PM2.5, and attainment/unclassified for 24-hour PM10. With respect to California standards, the Bay Area air basin is currently designated as attainment for carbon monoxide, nitrogen dioxide, and sulfur dioxide. It is currently designated non-attainment for state ozone, PM2.5, and PM10 standards.

TRANSBAY PROGRAM 2004 EIS REEVALUATION
May 2010 Page 12 of 49
TRANSBAY PROGRAM 2004 EIS REEVALUATION
May 2010
Page 13 of 49
Table 3. Current Federal and State Attainment Status for the Bay Area
Pollutant Federal Status State Status Change since 2004 EIS O3 Non-attainment,
marginal for 8-hour average (1)
Non-Attainment for 1 hour and 8 hour average
Federal – from no standard to non-attainment for 8-hour standard; no status for revoked 1-hour standard State – from no standard to non-attainment for 8-hour standard; no change for 1-hour standard
PM10 Attainment/Unclassified Non-attainment, 24 hour and annual standard
Federal and State – No Change
PM2.5 Attainment, annual standard; non-attainment, 24-hour standard
Non-attainment, annual standard
Federal - from unclassified to non-attainment, 24-hour standard State – from no designation to non-attainment, annual standard
CO Attainment Attainment No Change
NO2 Attainment Attainment No Change
SO2 Attainment Attainment No Change
Notes: (1) In June 2004, the Bay Area was designated as a marginal non-attainment area of the national 8-hour ozone standard. On January 6, 2010, USEPA proposed to strengthen the national 8-hour ozone standard from 0.08 parts per million (ppm) to a level within the range of 0.06-0.070 ppm. USEPA will issue final standards by August 31, 2010, and will make final area designations by July 2011. Source: BAAQMD, http://hank.baaqmd.gov/pln/air_quality/ambient_air_quality.htm; USEPA, http://www.epa.gov/air/ozonepollution/actions.html
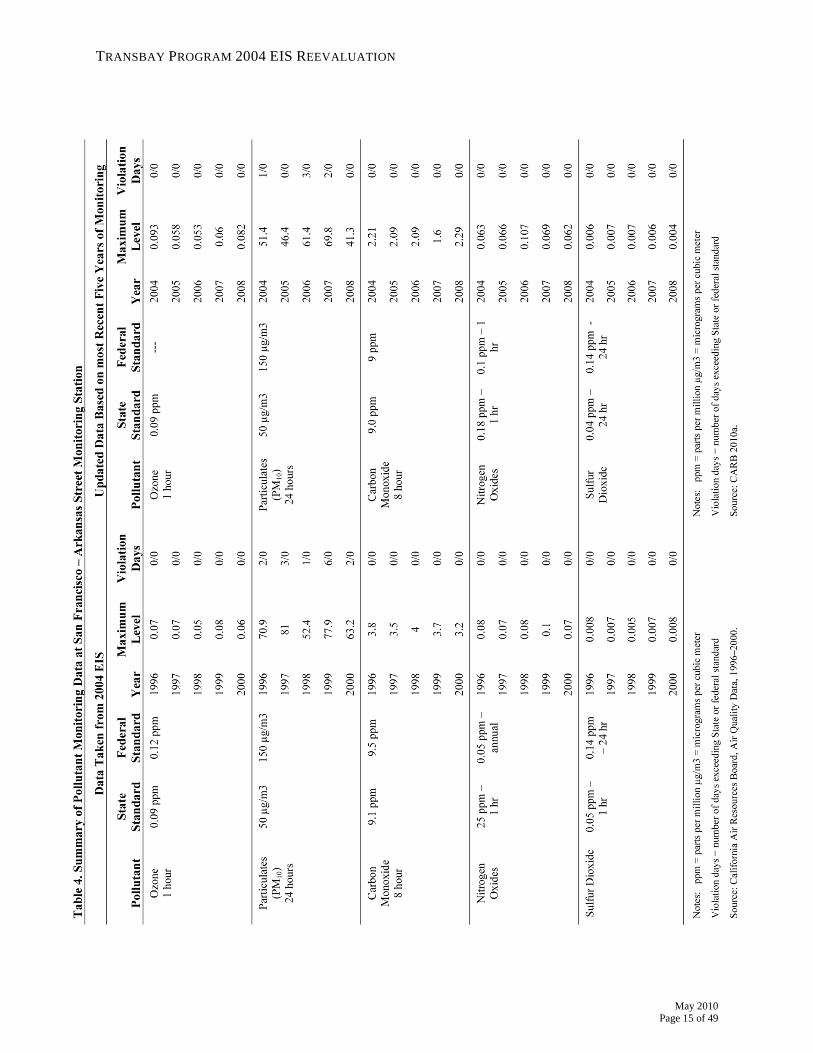
Existing air quality conditions in the study area are reflected by measurements taken at the nearest BAAQMD monitoring station, which is the Arkansas Street monitoring station in San Francisco. Table 4 presents the updated ambient air measurement data for the last five years of available data from the Arkansas Street monitoring station. The table indicates federal and state standards for these pollutants, and where these pollutant standards have been exceeded. Table 4 also presents a side-by-side comparison of the recorded monitoring values from the 2004 EIS, which presented data for the years 1996 to 2000, and the updated values for the years 2004 to 2008. The carbon monoxide, nitrogen dioxide, and sulfur dioxide data decreased slightly in the 2004 to 2008 period; the ozone data increased slightly for some years and decreased slightly for others in the 2004 to 2008 period. The PM10 data decreased for the 2004 to 2008 period, except for the year 2006. The analysis in the 2004 EIS included a quantitative particulate matter analysis with dispersion modeling used to evaluate nearby concentrations of all criteria pollutants including PM10. Though PM2.5 was not modeled, PM10 was, and it is considered a suitable and conservative surrogate for PM2.5. That is because PM10 includes all particulate matter smaller than 10 microns in diameter and, therefore, also includes particles that are smaller than 2.5 microns in diameter (i.e., PM2.5). The modeling analysis found PM10 emissions to be below the current federal 24-hour PM2.5 standard, thereby adequately demonstrating that the Transbay Program would not lead to a PM2.5 violation. Therefore, the Program is considered to be consistent with the new 2010 USEPA final rule identified in Section III.A.2, Federal and State Air Quality Standards.
TRANSBAY PROGRAM 2004 EIS REEVALUATION
May 2010 Page 14 of 49
Changes in the federal and state attainment status for the Bay Area do not change the Program’s impacts. That is because, as previously discussed, the Transbay Program, including the Transit Center, and the proposed HST system would result in beneficial impacts related to air quality, because these projects would result in the beneficial reduction in VMT and reduction in the number of airplane trips. Greenhouse Gases (GHGs) Background Regarding GHGs and Environmental Effects. GHGs are gases that trap heat in the atmosphere because they capture heat radiated from the sun as it is reflected back into the atmosphere, much like a greenhouse does. The accumulation of GHGs has been implicated as a driving force for global climate change. Definitions of climate change vary between and across regulatory authorities and the scientific community, but in general they can be described as the changing of the earth’s climate caused by natural fluctuations and anthropogenic activities that alter the composition of the global atmosphere. Individual projects contribute to the cumulative effects of climate change by emitting GHGs during demolition, construction, and operational phases. The principal GHGs are carbon dioxide (CO2), methane (CH4), nitrous oxide (N2O), ozone, and water vapor. Carbon dioxide is the “reference gas” for climate change, meaning that emissions of GHGs are typically reported in “carbon dioxide-equivalent” measures (CO2e). Thus, the “carbon dioxide-equivalent” measure of CO2 is 1, and the terms “CO2” and “CO2e” are interchangeable for this analysis. Emissions of carbon dioxide are largely by-products of fossil fuel combustion, whereas methane results from off-gassing associated with agricultural practices and landfills. Other GHGs, with much greater heat-absorption potential than carbon dioxide, including hydrofluorocarbons, perfluorocarbons, and sulfur hexafluoride, are generated in certain industrial processes. The predominant GHG associated with the proposed Transit Center is CO2. Addressing GHGs in NEPA Documents. At the time the 2004 EIS was completed, the study and analysis of GHGs was not generally included in NEPA documents. The CO2e emissions associated with the California HST system have been quantified, and are presented in Section III.A.3. Providing HST service, even taking account of the CO2e emissions resulting from construction of the HST system, would decrease GHGs compared to the No Action scenario as a result of a decrease in VMT.
TRANSBAY PROGRAM 2004 EIS REEVALUATION
May 2010
Page 15 of 49
TRANSBAY PROGRAM 2004 EIS REEVALUATION
May 2010 Page 16 of 49
3. Air Quality Impacts Associated with High Speed Trains
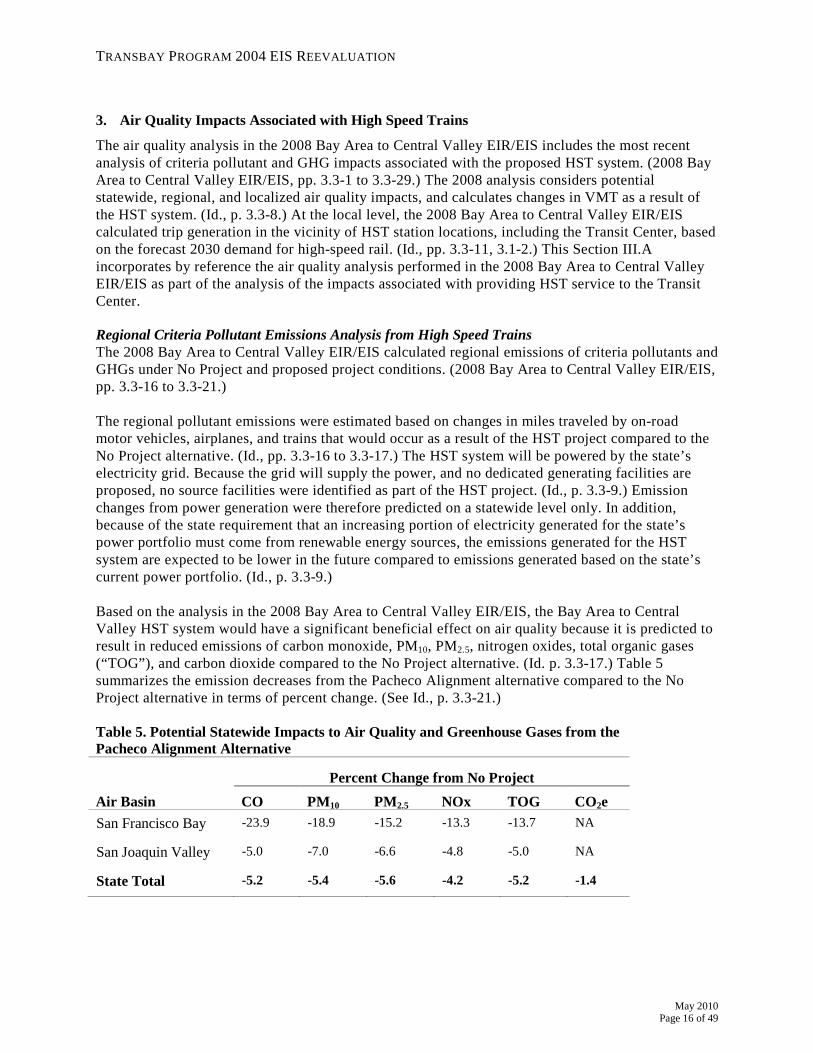
The air quality analysis in the 2008 Bay Area to Central Valley EIR/EIS includes the most recent analysis of criteria pollutant and GHG impacts associated with the proposed HST system. (2008 Bay Area to Central Valley EIR/EIS, pp. 3.3-1 to 3.3-29.) The 2008 analysis considers potential statewide, regional, and localized air quality impacts, and calculates changes in VMT as a result of the HST system. (Id., p. 3.3-8.) At the local level, the 2008 Bay Area to Central Valley EIR/EIS calculated trip generation in the vicinity of HST station locations, including the Transit Center, based on the forecast 2030 demand for high-speed rail. (Id., pp. 3.3-11, 3.1-2.) This Section III.A incorporates by reference the air quality analysis performed in the 2008 Bay Area to Central Valley EIR/EIS as part of the analysis of the impacts associated with providing HST service to the Transit Center. Regional Criteria Pollutant Emissions Analysis from High Speed Trains The 2008 Bay Area to Central Valley EIR/EIS calculated regional emissions of criteria pollutants and GHGs under No Project and proposed project conditions. (2008 Bay Area to Central Valley EIR/EIS, pp. 3.3-16 to 3.3-21.) The regional pollutant emissions were estimated based on changes in miles traveled by on-road motor vehicles, airplanes, and trains that would occur as a result of the HST project compared to the No Project alternative. (Id., pp. 3.3-16 to 3.3-17.) The HST system will be powered by the state’s electricity grid. Because the grid will supply the power, and no dedicated generating facilities are proposed, no source facilities were identified as part of the HST project. (Id., p. 3.3-9.) Emission changes from power generation were therefore predicted on a statewide level only. In addition, because of the state requirement that an increasing portion of electricity generated for the state’s power portfolio must come from renewable energy sources, the emissions generated for the HST system are expected to be lower in the future compared to emissions generated based on the state’s current power portfolio. (Id., p. 3.3-9.) Based on the analysis in the 2008 Bay Area to Central Valley EIR/EIS, the Bay Area to Central Valley HST system would have a significant beneficial effect on air quality because it is predicted to result in reduced emissions of carbon monoxide, PM10, PM2.5, nitrogen oxides, total organic gases (“TOG”), and carbon dioxide compared to the No Project alternative. (Id. p. 3.3-17.) Table 5 summarizes the emission decreases from the Pacheco Alignment alternative compared to the No Project alternative in terms of percent change. (See Id., p. 3.3-21.) Table 5. Potential Statewide Impacts to Air Quality and Greenhouse Gases from the Pacheco Alignment Alternative
Air Basin Percent Change from No Project
CO PM10 PM2.5 NOx TOG CO2e San Francisco Bay -23.9 -18.9 -15.2 -13.3 -13.7 NA
San Joaquin Valley -5.0 -7.0 -6.6 -4.8 -5.0 NA
State Total -5.2 -5.4 -5.6 -4.2 -5.2 -1.4
TRANSBAY PROGRAM 2004 EIS REEVALUATION
May 2010
Page 17 of 49
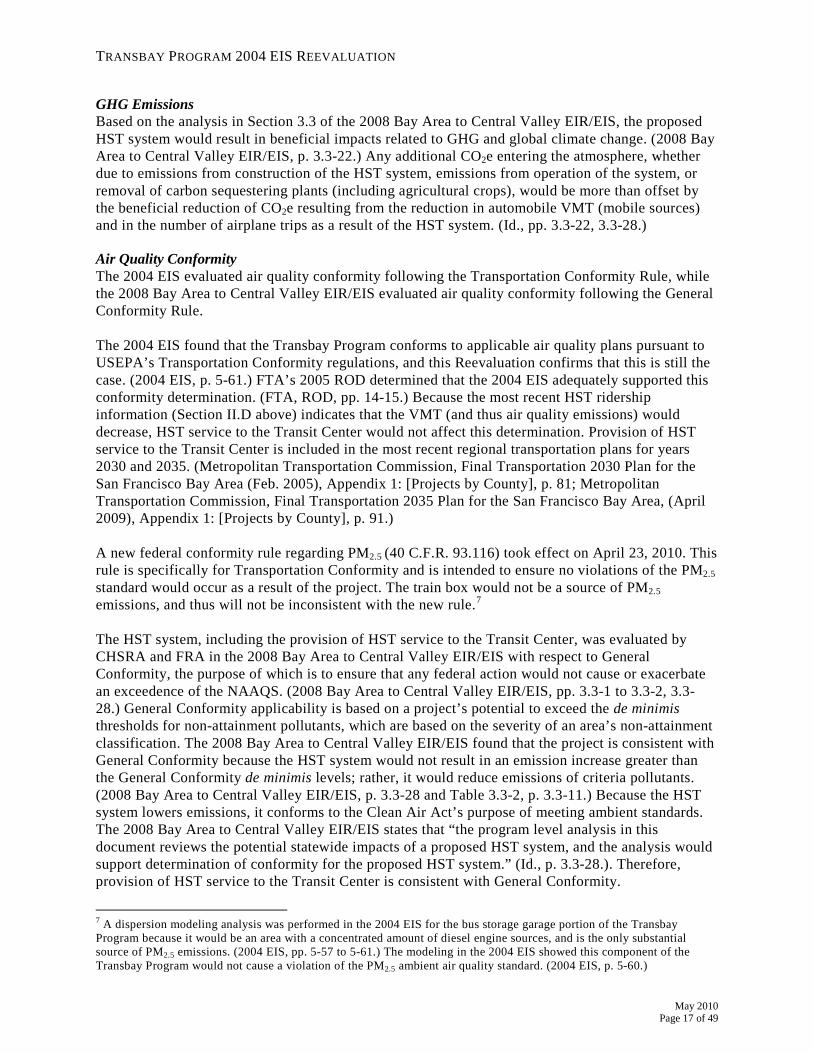
GHG Emissions Based on the analysis in Section 3.3 of the 2008 Bay Area to Central Valley EIR/EIS, the proposed HST system would result in beneficial impacts related to GHG and global climate change. (2008 Bay Area to Central Valley EIR/EIS, p. 3.3-22.) Any additional CO2e entering the atmosphere, whether due to emissions from construction of the HST system, emissions from operation of the system, or removal of carbon sequestering plants (including agricultural crops), would be more than offset by the beneficial reduction of CO2e resulting from the reduction in automobile VMT (mobile sources) and in the number of airplane trips as a result of the HST system. (Id., pp. 3.3-22, 3.3-28.) Air Quality Conformity The 2004 EIS evaluated air quality conformity following the Transportation Conformity Rule, while the 2008 Bay Area to Central Valley EIR/EIS evaluated air quality conformity following the General Conformity Rule. The 2004 EIS found that the Transbay Program conforms to applicable air quality plans pursuant to USEPA’s Transportation Conformity regulations, and this Reevaluation confirms that this is still the case. (2004 EIS, p. 5-61.) FTA’s 2005 ROD determined that the 2004 EIS adequately supported this conformity determination. (FTA, ROD, pp. 14-15.) Because the most recent HST ridership information (Section II.D above) indicates that the VMT (and thus air quality emissions) would decrease, HST service to the Transit Center would not affect this determination. Provision of HST service to the Transit Center is included in the most recent regional transportation plans for years 2030 and 2035. (Metropolitan Transportation Commission, Final Transportation 2030 Plan for the San Francisco Bay Area (Feb. 2005), Appendix 1: [Projects by County], p. 81; Metropolitan Transportation Commission, Final Transportation 2035 Plan for the San Francisco Bay Area, (April 2009), Appendix 1: [Projects by County], p. 91.) A new federal conformity rule regarding PM2.5 (40 C.F.R. 93.116) took effect on April 23, 2010. This rule is specifically for Transportation Conformity and is intended to ensure no violations of the PM2.5
standard would occur as a result of the project. The train box would not be a source of PM2.5 emissions, and thus will not be inconsistent with the new rule.7
The HST system, including the provision of HST service to the Transit Center, was evaluated by CHSRA and FRA in the 2008 Bay Area to Central Valley EIR/EIS with respect to General Conformity, the purpose of which is to ensure that any federal action would not cause or exacerbate an exceedence of the NAAQS. (2008 Bay Area to Central Valley EIR/EIS, pp. 3.3-1 to 3.3-2, 3.3-28.) General Conformity applicability is based on a project’s potential to exceed the de minimis thresholds for non-attainment pollutants, which are based on the severity of an area’s non-attainment classification. The 2008 Bay Area to Central Valley EIR/EIS found that the project is consistent with General Conformity because the HST system would not result in an emission increase greater than the General Conformity de minimis levels; rather, it would reduce emissions of criteria pollutants. (2008 Bay Area to Central Valley EIR/EIS, p. 3.3-28 and Table 3.3-2, p. 3.3-11.) Because the HST system lowers emissions, it conforms to the Clean Air Act’s purpose of meeting ambient standards. The 2008 Bay Area to Central Valley EIR/EIS states that “the program level analysis in this document reviews the potential statewide impacts of a proposed HST system, and the analysis would support determination of conformity for the proposed HST system.” (Id., p. 3.3-28.). Therefore, provision of HST service to the Transit Center is consistent with General Conformity.
7 A dispersion modeling analysis was performed in the 2004 EIS for the bus storage garage portion of the Transbay Program because it would be an area with a concentrated amount of diesel engine sources, and is the only substantial source of PM2.5 emissions. (2004 EIS, pp. 5-57 to 5-61.) The modeling in the 2004 EIS showed this component of the Transbay Program would not cause a violation of the PM2.5 ambient air quality standard. (2004 EIS, p. 5-60.)
TRANSBAY PROGRAM 2004 EIS REEVALUATION
May 2010 Page 18 of 49
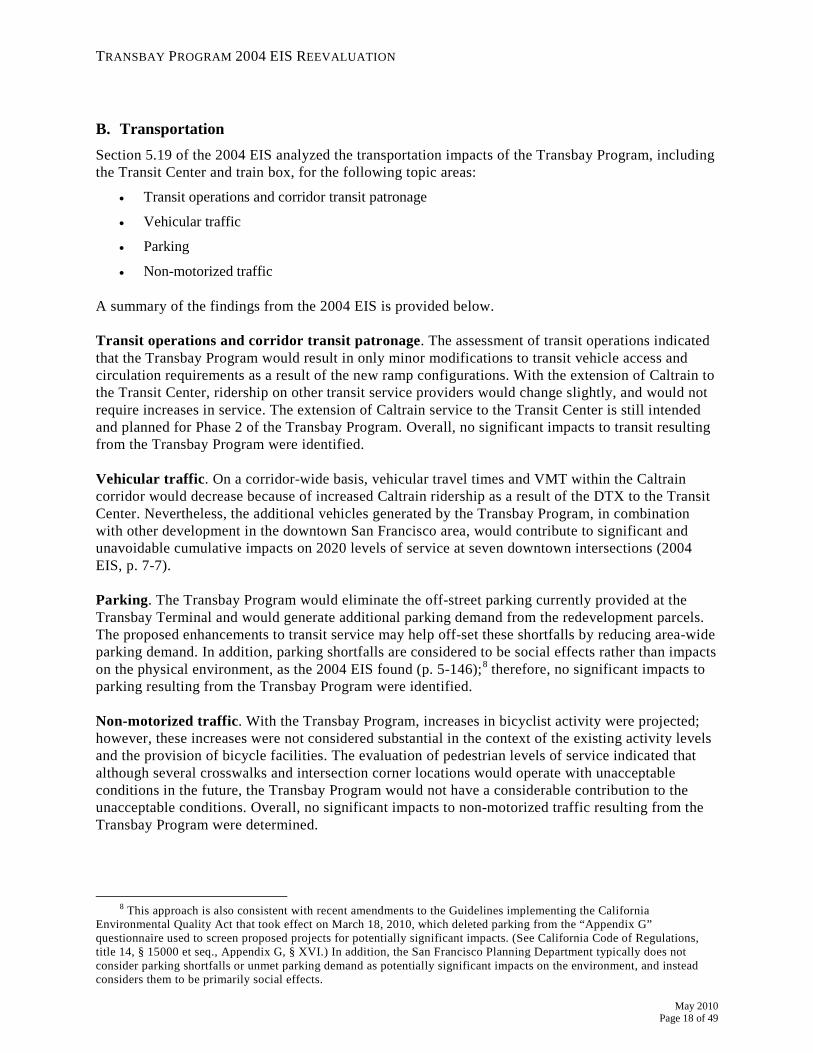
B. Transportation Section 5.19 of the 2004 EIS analyzed the transportation impacts of the Transbay Program, including the Transit Center and train box, for the following topic areas:
• Transit operations and corridor transit patronage
• Vehicular traffic
• Parking
• Non-motorized traffic A summary of the findings from the 2004 EIS is provided below. Transit operations and corridor transit patronage. The assessment of transit operations indicated that the Transbay Program would result in only minor modifications to transit vehicle access and circulation requirements as a result of the new ramp configurations. With the extension of Caltrain to the Transit Center, ridership on other transit service providers would change slightly, and would not require increases in service. The extension of Caltrain service to the Transit Center is still intended and planned for Phase 2 of the Transbay Program. Overall, no significant impacts to transit resulting from the Transbay Program were identified. Vehicular traffic. On a corridor-wide basis, vehicular travel times and VMT within the Caltrain corridor would decrease because of increased Caltrain ridership as a result of the DTX to the Transit Center. Nevertheless, the additional vehicles generated by the Transbay Program, in combination with other development in the downtown San Francisco area, would contribute to significant and unavoidable cumulative impacts on 2020 levels of service at seven downtown intersections (2004 EIS, p. 7-7). Parking. The Transbay Program would eliminate the off-street parking currently provided at the Transbay Terminal and would generate additional parking demand from the redevelopment parcels. The proposed enhancements to transit service may help off-set these shortfalls by reducing area-wide parking demand. In addition, parking shortfalls are considered to be social effects rather than impacts on the physical environment, as the 2004 EIS found (p. 5-146);8
therefore, no significant impacts to parking resulting from the Transbay Program were identified.
Non-motorized traffic. With the Transbay Program, increases in bicyclist activity were projected; however, these increases were not considered substantial in the context of the existing activity levels and the provision of bicycle facilities. The evaluation of pedestrian levels of service indicated that although several crosswalks and intersection corner locations would operate with unacceptable conditions in the future, the Transbay Program would not have a considerable contribution to the unacceptable conditions. Overall, no significant impacts to non-motorized traffic resulting from the Transbay Program were determined.
8 This approach is also consistent with recent amendments to the Guidelines implementing the California
Environmental Quality Act that took effect on March 18, 2010, which deleted parking from the “Appendix G” questionnaire used to screen proposed projects for potentially significant impacts. (See California Code of Regulations, title 14, § 15000 et seq., Appendix G, § XVI.) In addition, the San Francisco Planning Department typically does not consider parking shortfalls or unmet parking demand as potentially significant impacts on the environment, and instead considers them to be primarily social effects.
TRANSBAY PROGRAM 2004 EIS REEVALUATION
May 2010
Page 19 of 49
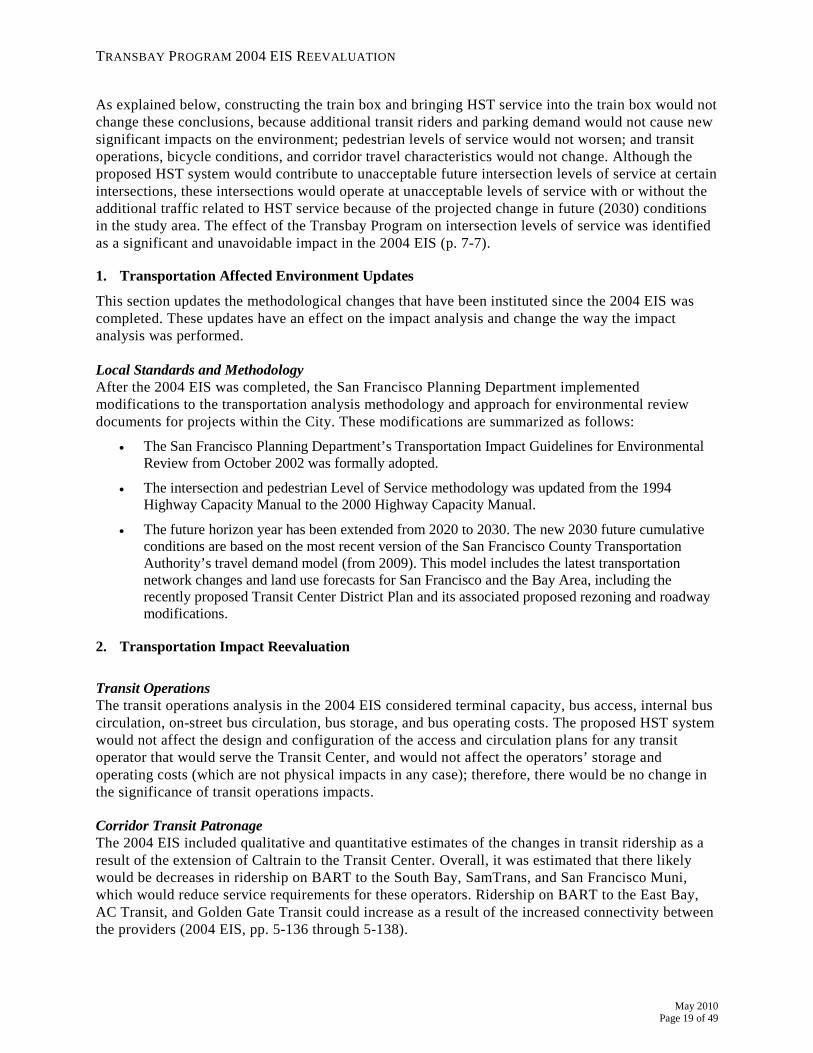
As explained below, constructing the train box and bringing HST service into the train box would not change these conclusions, because additional transit riders and parking demand would not cause new significant impacts on the environment; pedestrian levels of service would not worsen; and transit operations, bicycle conditions, and corridor travel characteristics would not change. Although the proposed HST system would contribute to unacceptable future intersection levels of service at certain intersections, these intersections would operate at unacceptable levels of service with or without the additional traffic related to HST service because of the projected change in future (2030) conditions in the study area. The effect of the Transbay Program on intersection levels of service was identified as a significant and unavoidable impact in the 2004 EIS (p. 7-7).
1. Transportation Affected Environment Updates
This section updates the methodological changes that have been instituted since the 2004 EIS was completed. These updates have an effect on the impact analysis and change the way the impact analysis was performed. Local Standards and Methodology After the 2004 EIS was completed, the San Francisco Planning Department implemented modifications to the transportation analysis methodology and approach for environmental review documents for projects within the City. These modifications are summarized as follows:
• The San Francisco Planning Department’s Transportation Impact Guidelines for Environmental Review from October 2002 was formally adopted.
• The intersection and pedestrian Level of Service methodology was updated from the 1994 Highway Capacity Manual to the 2000 Highway Capacity Manual.
• The future horizon year has been extended from 2020 to 2030. The new 2030 future cumulative conditions are based on the most recent version of the San Francisco County Transportation Authority’s travel demand model (from 2009). This model includes the latest transportation network changes and land use forecasts for San Francisco and the Bay Area, including the recently proposed Transit Center District Plan and its associated proposed rezoning and roadway modifications.
2. Transportation Impact Reevaluation
Transit Operations The transit operations analysis in the 2004 EIS considered terminal capacity, bus access, internal bus circulation, on-street bus circulation, bus storage, and bus operating costs. The proposed HST system would not affect the design and configuration of the access and circulation plans for any transit operator that would serve the Transit Center, and would not affect the operators’ storage and operating costs (which are not physical impacts in any case); therefore, there would be no change in the significance of transit operations impacts. Corridor Transit Patronage The 2004 EIS included qualitative and quantitative estimates of the changes in transit ridership as a result of the extension of Caltrain to the Transit Center. Overall, it was estimated that there likely would be decreases in ridership on BART to the South Bay, SamTrans, and San Francisco Muni, which would reduce service requirements for these operators. Ridership on BART to the East Bay, AC Transit, and Golden Gate Transit could increase as a result of the increased connectivity between the providers (2004 EIS, pp. 5-136 through 5-138).
TRANSBAY PROGRAM 2004 EIS REEVALUATION
May 2010 Page 20 of 49
The addition of HST service would bring more riders (in addition to any new riders resulting from Caltrain service) to the transit providers that directly serve the Transit Center and those that operate nearby, including AC Transit, BART to the East Bay, Golden Gate Transit, and San Francisco Muni. Based on the most recent HST ridership estimates (see Section II.D), the following ridership increases are projected for each operator in 2035 from HST riders, which is the horizon year for HST ridership projections:
• Muni = 12,000 riders per day
• BART to/from East Bay = 2,000 riders per day
• AC Transit = 2,000 riders per day
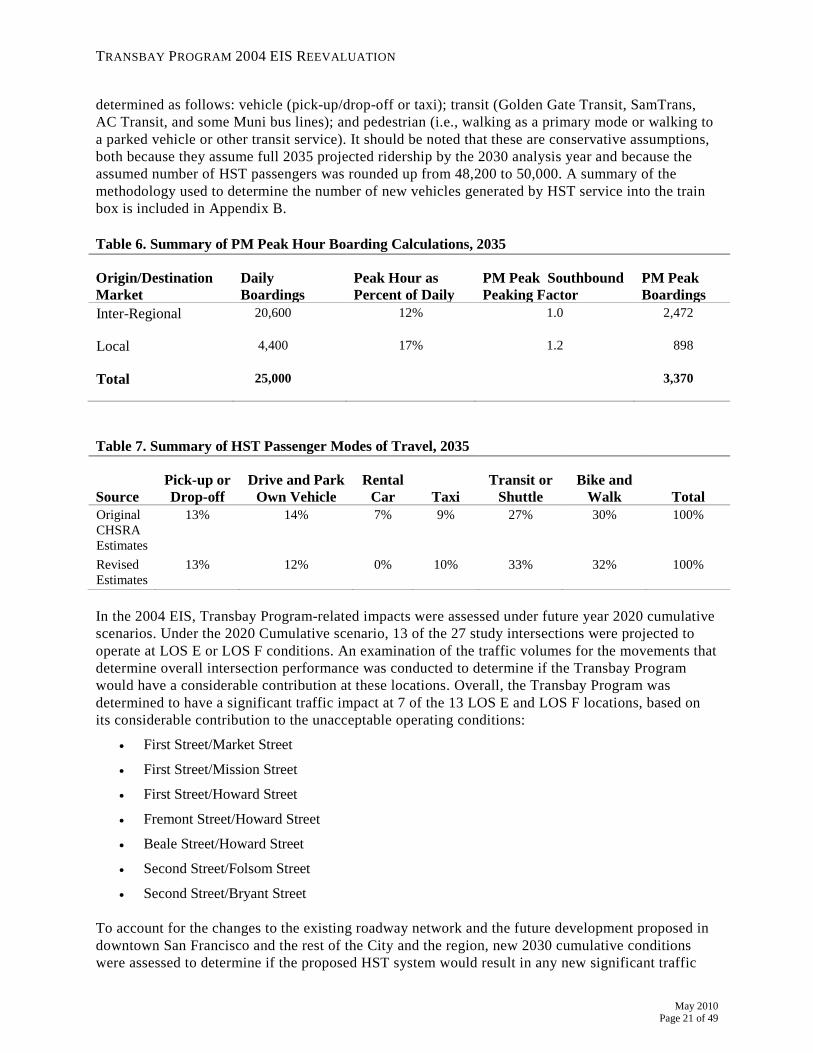
• Golden Gate Transit = 1,000 riders per day In general, all transit operators have the available capacity to accommodate additional riders within their current operating plans, or they have the ability to increase service levels accordingly. Increases in transit ridership are not normally considered impacts on the physical environment when they can be accommodated without the need for construction of new physical infrastructure. Therefore, there would be no change in the significance of transit patronage impacts as a result of HST service. Vehicular Traffic The vehicular traffic analysis in the 2004 EIS assessed three main categories: vehicular travel time impacts, VMT impacts, and intersection level of service conditions at key intersections around the Transit Center. The proposed HST system would not affect the shifting of trips from private vehicles to Caltrain, and may result in the further shifting of trips from private vehicles to the new HST service. Therefore, there would be increased beneficial effects on vehicular travel time. Similarly, the proposed HST system would not affect the decrease in distance of travel by private vehicles in the corridor as a result of the extension of Caltrain, and would result in further decreases in VMT with the new HST service. Therefore, there would be increased beneficial effects on VMT. The 2004 EIS assessed weekday PM peak hour traffic conditions at 27 key intersections within the study area. In general, intersection operating conditions are described by the concept of Level of Service (“LOS”), which is a qualitative measure of the performance of the intersection based on the average delay per vehicle (measured in seconds per vehicle). Intersection levels of service range from LOS A (representing excellent or free-flow conditions) to LOS F (representing poor or severely congested conditions). In the 2004 EIS, LOS E and LOS F were considered to be unacceptable, and the Transbay Program was considered to result in a significant traffic impact if it caused intersection operating conditions to worsen from LOS D or better to LOS E or LOS F, or from LOS E to LOS F. In addition, under future cumulative conditions, the Program was considered to result in a significant impact if it had a considerable contribution to the growth in traffic volumes at an intersection critical movement (defined as a movement that dictates the overall intersection operations). A detailed evaluation of the projected HST system ridership was conducted to estimate the number of new vehicle, transit, pedestrian and other trips generated by HST service into the train box. Information obtained from CHSRA and data on existing travel characteristics within downtown San Francisco was used to factor the projected daily ridership values to boardings and alightings for the weekday PM peak hour (Table 6 and Table 7). The ridership values were then assigned to the various primary travel modes (such as taxi, drive and park, or pedestrian). For each primary mode of travel, the mode of travel for HST riders as they actually enter or exit the Transit Center was then
TRANSBAY PROGRAM 2004 EIS REEVALUATION
May 2010
Page 21 of 49
determined as follows: vehicle (pick-up/drop-off or taxi); transit (Golden Gate Transit, SamTrans, AC Transit, and some Muni bus lines); and pedestrian (i.e., walking as a primary mode or walking to a parked vehicle or other transit service). It should be noted that these are conservative assumptions, both because they assume full 2035 projected ridership by the 2030 analysis year and because the assumed number of HST passengers was rounded up from 48,200 to 50,000. A summary of the methodology used to determine the number of new vehicles generated by HST service into the train box is included in Appendix B. Table 6. Summary of PM Peak Hour Boarding Calculations, 2035
Origin/Destination Market
Daily Boardings
Peak Hour as Percent of Daily
PM Peak Southbound Peaking Factor
PM Peak Boardings
Inter-Regional 20,600 12% 1.0 2,472
Local 4,400 17% 1.2 898
Total 25,000 3,370
Table 7. Summary of HST Passenger Modes of Travel, 2035
Source Pick-up or Drop-off
Drive and Park Own Vehicle
Rental Car Taxi
Transit or Shuttle
Bike and Walk Total
Original CHSRA Estimates
13% 14% 7% 9% 27% 30% 100%
Revised Estimates
13% 12% 0% 10% 33% 32% 100%
In the 2004 EIS, Transbay Program-related impacts were assessed under future year 2020 cumulative scenarios. Under the 2020 Cumulative scenario, 13 of the 27 study intersections were projected to operate at LOS E or LOS F conditions. An examination of the traffic volumes for the movements that determine overall intersection performance was conducted to determine if the Transbay Program would have a considerable contribution at these locations. Overall, the Transbay Program was determined to have a significant traffic impact at 7 of the 13 LOS E and LOS F locations, based on its considerable contribution to the unacceptable operating conditions:
• First Street/Market Street
• First Street/Mission Street
• First Street/Howard Street
• Fremont Street/Howard Street
• Beale Street/Howard Street
• Second Street/Folsom Street
• Second Street/Bryant Street To account for the changes to the existing roadway network and the future development proposed in downtown San Francisco and the rest of the City and the region, new 2030 cumulative conditions were assessed to determine if the proposed HST system would result in any new significant traffic
TRANSBAY PROGRAM 2004 EIS REEVALUATION
May 2010 Page 22 of 49
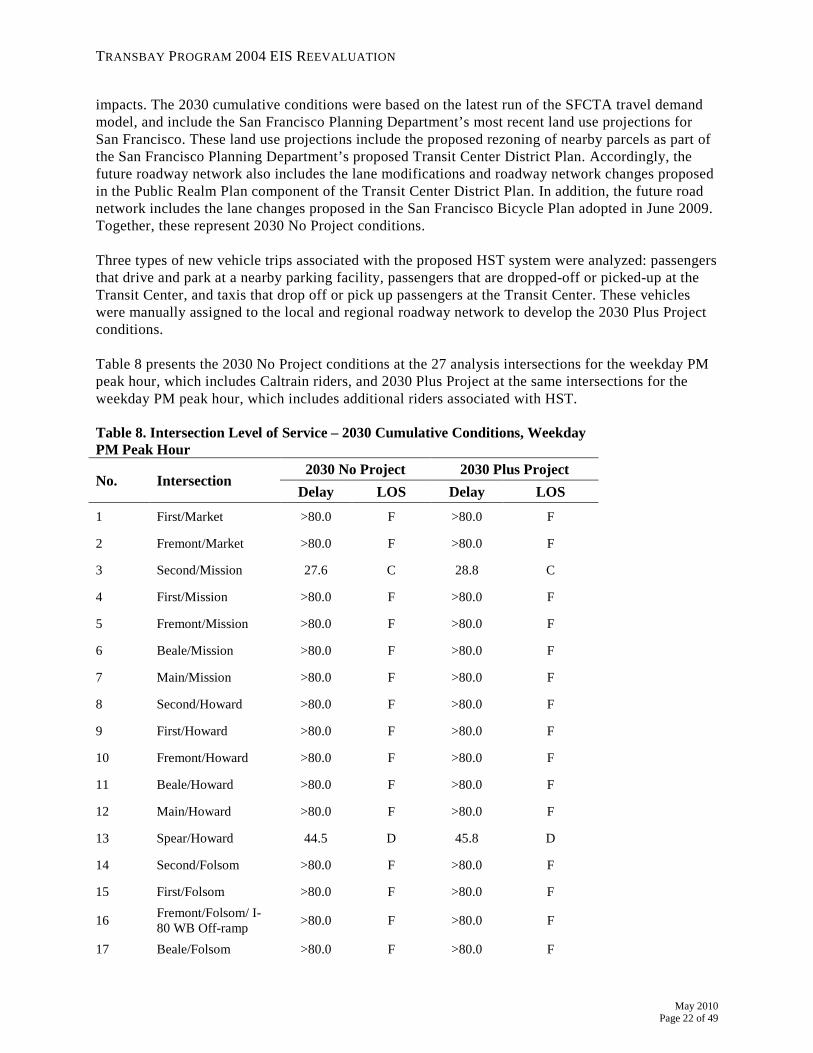
impacts. The 2030 cumulative conditions were based on the latest run of the SFCTA travel demand model, and include the San Francisco Planning Department’s most recent land use projections for San Francisco. These land use projections include the proposed rezoning of nearby parcels as part of the San Francisco Planning Department’s proposed Transit Center District Plan. Accordingly, the future roadway network also includes the lane modifications and roadway network changes proposed in the Public Realm Plan component of the Transit Center District Plan. In addition, the future road network includes the lane changes proposed in the San Francisco Bicycle Plan adopted in June 2009. Together, these represent 2030 No Project conditions. Three types of new vehicle trips associated with the proposed HST system were analyzed: passengers that drive and park at a nearby parking facility, passengers that are dropped-off or picked-up at the Transit Center, and taxis that drop off or pick up passengers at the Transit Center. These vehicles were manually assigned to the local and regional roadway network to develop the 2030 Plus Project conditions. Table 8 presents the 2030 No Project conditions at the 27 analysis intersections for the weekday PM peak hour, which includes Caltrain riders, and 2030 Plus Project at the same intersections for the weekday PM peak hour, which includes additional riders associated with HST. Table 8. Intersection Level of Service – 2030 Cumulative Conditions, Weekday PM Peak Hour
No. Intersection 2030 No Project 2030 Plus Project
Delay LOS Delay LOS 1 First/Market >80.0 F >80.0 F
2 Fremont/Market >80.0 F >80.0 F
3 Second/Mission 27.6 C 28.8 C
4 First/Mission >80.0 F >80.0 F
5 Fremont/Mission >80.0 F >80.0 F
6 Beale/Mission >80.0 F >80.0 F
7 Main/Mission >80.0 F >80.0 F
8 Second/Howard >80.0 F >80.0 F
9 First/Howard >80.0 F >80.0 F
10 Fremont/Howard >80.0 F >80.0 F
11 Beale/Howard >80.0 F >80.0 F
12 Main/Howard >80.0 F >80.0 F
13 Spear/Howard 44.5 D 45.8 D
14 Second/Folsom >80.0 F >80.0 F
15 First/Folsom >80.0 F >80.0 F
16 Fremont/Folsom/ I-80 WB Off-ramp >80.0 F >80.0 F
17 Beale/Folsom >80.0 F >80.0 F
TRANSBAY PROGRAM 2004 EIS REEVALUATION
May 2010
Page 23 of 49
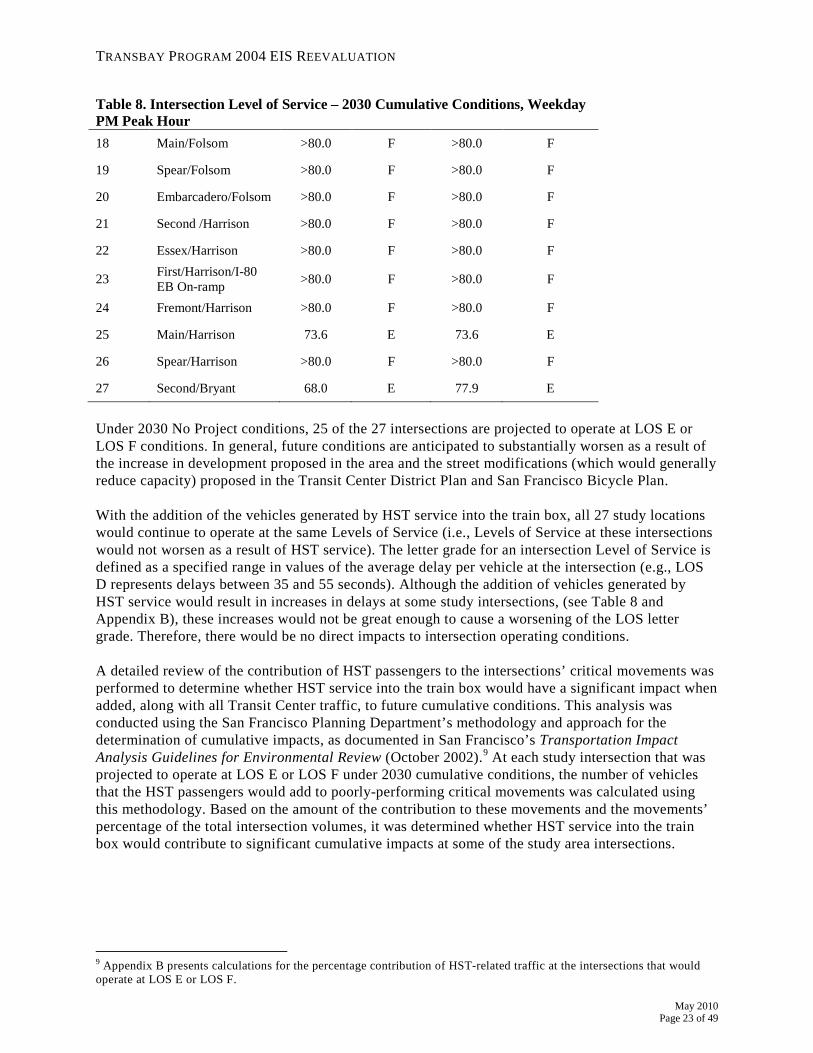
Table 8. Intersection Level of Service – 2030 Cumulative Conditions, Weekday PM Peak Hour 18 Main/Folsom >80.0 F >80.0 F
19 Spear/Folsom >80.0 F >80.0 F
20 Embarcadero/Folsom >80.0 F >80.0 F
21 Second /Harrison >80.0 F >80.0 F
22 Essex/Harrison >80.0 F >80.0 F
23 First/Harrison/I-80 EB On-ramp >80.0 F >80.0 F
24 Fremont/Harrison >80.0 F >80.0 F
25 Main/Harrison 73.6 E 73.6 E
26 Spear/Harrison >80.0 F >80.0 F
27 Second/Bryant 68.0 E 77.9 E
Under 2030 No Project conditions, 25 of the 27 intersections are projected to operate at LOS E or LOS F conditions. In general, future conditions are anticipated to substantially worsen as a result of the increase in development proposed in the area and the street modifications (which would generally reduce capacity) proposed in the Transit Center District Plan and San Francisco Bicycle Plan. With the addition of the vehicles generated by HST service into the train box, all 27 study locations would continue to operate at the same Levels of Service (i.e., Levels of Service at these intersections would not worsen as a result of HST service). The letter grade for an intersection Level of Service is defined as a specified range in values of the average delay per vehicle at the intersection (e.g., LOS D represents delays between 35 and 55 seconds). Although the addition of vehicles generated by HST service would result in increases in delays at some study intersections, (see Table 8 and Appendix B), these increases would not be great enough to cause a worsening of the LOS letter grade. Therefore, there would be no direct impacts to intersection operating conditions. A detailed review of the contribution of HST passengers to the intersections’ critical movements was performed to determine whether HST service into the train box would have a significant impact when added, along with all Transit Center traffic, to future cumulative conditions. This analysis was conducted using the San Francisco Planning Department’s methodology and approach for the determination of cumulative impacts, as documented in San Francisco’s Transportation Impact Analysis Guidelines for Environmental Review (October 2002).9
At each study intersection that was projected to operate at LOS E or LOS F under 2030 cumulative conditions, the number of vehicles that the HST passengers would add to poorly-performing critical movements was calculated using this methodology. Based on the amount of the contribution to these movements and the movements’ percentage of the total intersection volumes, it was determined whether HST service into the train box would contribute to significant cumulative impacts at some of the study area intersections.
9 Appendix B presents calculations for the percentage contribution of HST-related traffic at the intersections that would operate at LOS E or LOS F.
TRANSBAY PROGRAM 2004 EIS REEVALUATION
May 2010 Page 24 of 49
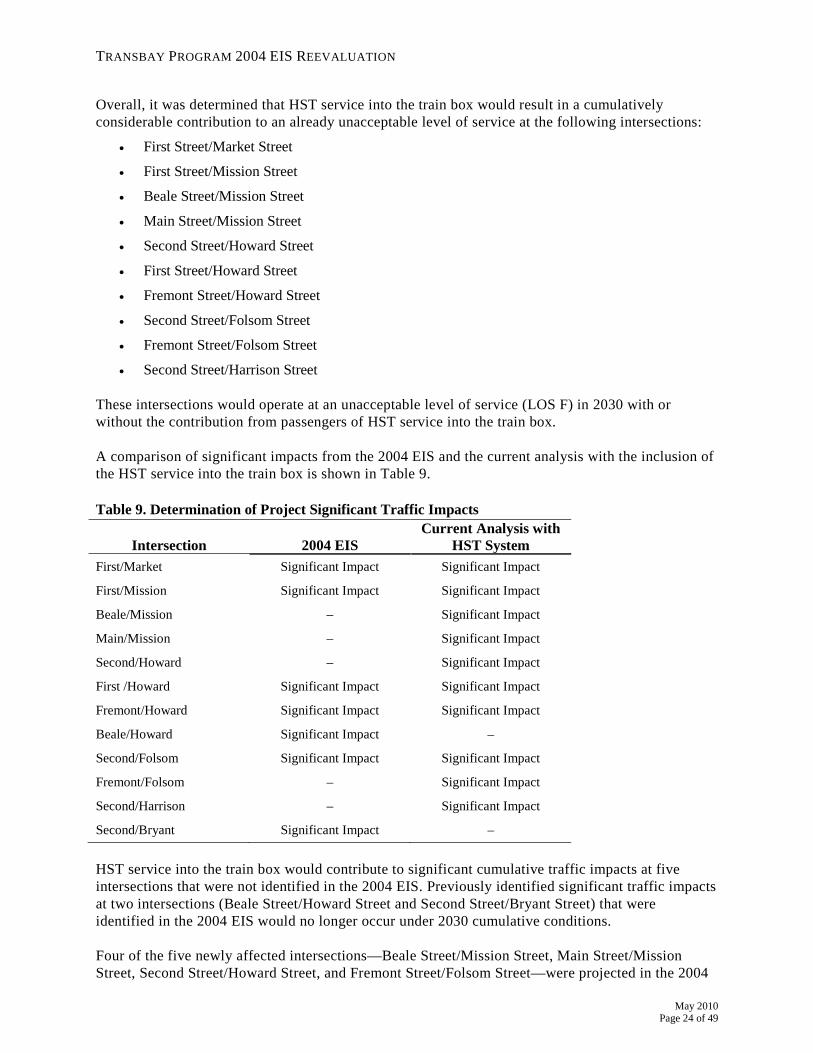
Overall, it was determined that HST service into the train box would result in a cumulatively considerable contribution to an already unacceptable level of service at the following intersections:
• First Street/Market Street
• First Street/Mission Street
• Beale Street/Mission Street
• Main Street/Mission Street
• Second Street/Howard Street
• First Street/Howard Street
• Fremont Street/Howard Street
• Second Street/Folsom Street
• Fremont Street/Folsom Street
• Second Street/Harrison Street These intersections would operate at an unacceptable level of service (LOS F) in 2030 with or without the contribution from passengers of HST service into the train box. A comparison of significant impacts from the 2004 EIS and the current analysis with the inclusion of the HST service into the train box is shown in Table 9. Table 9. Determination of Project Significant Traffic Impacts
Intersection 2004 EIS Current Analysis with
HST System First/Market Significant Impact Significant Impact
First/Mission Significant Impact Significant Impact
Beale/Mission – Significant Impact
Main/Mission – Significant Impact
Second/Howard – Significant Impact
First /Howard Significant Impact Significant Impact
Fremont/Howard Significant Impact Significant Impact
Beale/Howard Significant Impact –
Second/Folsom Significant Impact Significant Impact
Fremont/Folsom – Significant Impact
Second/Harrison – Significant Impact
Second/Bryant Significant Impact –
HST service into the train box would contribute to significant cumulative traffic impacts at five intersections that were not identified in the 2004 EIS. Previously identified significant traffic impacts at two intersections (Beale Street/Howard Street and Second Street/Bryant Street) that were identified in the 2004 EIS would no longer occur under 2030 cumulative conditions. Four of the five newly affected intersections—Beale Street/Mission Street, Main Street/Mission Street, Second Street/Howard Street, and Fremont Street/Folsom Street—were projected in the 2004
TRANSBAY PROGRAM 2004 EIS REEVALUATION
May 2010
Page 25 of 49
EIS to operate at LOS D or better under 2020 Cumulative conditions; therefore, no significant impacts were identified. Under the 2030 cumulative analysis, however, these intersections would operate at LOS E and LOS F conditions as a result of the projected increase in traffic in the study area and the roadway network modifications included in the proposed Transit Center District Plan without Transit Center-related traffic. While HST service into the train box will contribute to these significant cumulative impacts, the unacceptable future levels of service at these intersections would occur with or without the increase in traffic volumes generated by HST service into the train box as a result of projected future development in the area. The intersection of Second Street/Harrison Street, the fifth newly identified intersection, was projected to operate at LOS F under 2020 Cumulative conditions in the 2004 EIS, but the Transbay Program was determined not to have a cumulatively considerable contribution. However, the 2030 cumulative conditions now include new bicycle lanes along northbound and southbound Second Street as proposed in the San Francisco Bicycle Plan. Implementation of these bicycle lanes would result in the elimination of one northbound and one southbound through travel lane along Second Street, including at the intersection of Second Street and Harrison Street. As a result of the elimination of these through lanes, the northbound and southbound approaches (at which the HST service would add vehicles) would become the critical approaches, as they would contain the critical movements that cause the intersection’s poor operating conditions. Because the proposed bicycle lanes on Second Street were not part of the cumulative context at the time the 2004 EIS was prepared, the northbound and southbound approaches were not critical and the Transbay Program contributions were not cumulatively considerable. The 2004 EIS identified the effects of the Transbay Program on intersection levels of service as a significant and unavoidable impact. Although there would be changes in the significance of traffic impacts to which HST service would contribute, these changes would occur with or without the traffic generated by HST service into the train box. In general, these changes are primarily due to the differences between the 2020 cumulative future traffic and roadway conditions analyzed in the 2004 EIS and the current analysis, which is based on updated, projected cumulative future conditions in 2030. Parking As documented in the 2004 EIS, the Transbay Program would cause the removal of almost 2,000 public and private parking spaces at or near the existing Transbay Terminal. As part of the Transbay Program, the proposed new development on the redevelopment parcels would result in new parking demand and the elimination of additional off-street parking lots. The HST service into the train box would not affect the provision or removal of any off-street parking facilities, nor would it affect the loss in spaces or parking demand associated with the redevelopment parcels. With the overall net loss in parking in the area, which has already begun as part of ongoing implementation of the Transbay Program, vehicles that would have parked in these displaced spaces would need to seek other parking facilities in the area, park further away from their destinations, or shift modes to non-auto uses. HST service into the train box would generate additional parking demand (estimated to be about 250 spaces), and would not provide any additional parking. However, as identified in the 2004 EIS (p. 5-146), parking shortfalls are considered to be social effects rather than impacts on the physical environment. Therefore, there would be no change in the significance of parking impacts.
TRANSBAY PROGRAM 2004 EIS REEVALUATION
May 2010 Page 26 of 49
Non-motorized Traffic The 2004 EIS considered the effects of the Transbay Program on bicycle and pedestrian conditions in the area. Overall, it was estimated that there would be increases in bicyclists on the streets surrounding the Transit Center as a result of general background growth in downtown San Francisco, growth generated by development of the redevelopment parcels, and the provision of additional transit service at the Transit Center. HST service into the train box would add to these bicycle volumes, because a portion of the new HST riders (about 1% or approximately 480 riders per day) would travel to and from the Transit Center on bicycle. The 2004 EIS assessed bicycles added to the streets as a result of AC Transit and Caltrain ridership, and concluded that the existing bicycle facilities plus proposed future bike lane extensions would adequately accommodate bicycling around the Transit Center. (2004 EIS, p. 5-158.) This analysis was updated to include HST riders traveling to and from the Transit Center on bicycles, and the current and proposed bicycle lanes and routes in the area, as described in the recently approved San Francisco Bicycle Plan. With the addition of the 480 daily bicyclists commuting to and from HST, it is still anticipated that the bicycle lanes and routes around the Transit Center would accommodate these bicycle volumes. The 2004 EIS estimated that 232 bicycle parking spaces would be needed at the Transit Center to accommodate AC Transit and Caltrain riders commuting by bicycle. (2004 EIS, p. 5-158.) Assuming every HST rider who arrives by bicycle will require bicycle storage at the Transit Center (which is a conservative assumption), an additional 240 bicycle storage spaces would be required at the Transit Center, for a total of 472 spaces. The current design of the Transit Center includes secured, staffed, and enclosed bicycle storage facilities for a minimum of 500 bicycles. Therefore, the planned bicycle facilities at and around the Transit Center would accommodate the bicycle ridership projections for HST, and there would be no change in the significance of bicycle impacts. In addition, the 2004 EIS included a detailed evaluation of pedestrian operations at the corners and crosswalks of key intersections adjacent to the Transit Center for weekday PM peak hour conditions. Similar to intersection conditions, pedestrian conditions are described using the concept of Level of Service, which is based on the amount of space (in terms of square feet) each pedestrian has at the selected corner or crosswalk. Pedestrian corner and crosswalk levels of service range from LOS A (representing excellent or free-flow conditions) to LOS F (representing poor or severely congested conditions). In the 2004 EIS, LOS F was considered to be unacceptable. In the 2004 EIS, Program-related impacts were assessed under future year 2020 cumulative scenarios. Under the 2020 Cumulative scenario, two study crosswalks and eleven study corners were projected to operate at LOS F conditions, and thus would operate at an unacceptable level of service with or without the Transbay Program (2004 EIR, pp. 5-146 to 5-152). An examination of the proportion of the pedestrian volumes at each location was conducted to determine if the Transbay Program would have a significant impact at these locations. The 2004 EIS concluded that the additional pedestrian traffic resulting from the Transbay Program would not have a significant impact or create a significant contribution to these future cumulative conditions (2004 EIS, p. 5-156). To account for the changes to the projected future development and the changes to the roadway network and pedestrian facilities proposed in downtown San Francisco, updated 2030 cumulative conditions were assessed to determine if the proposed HST system would result in any new significant pedestrian impacts. The 2030 cumulative conditions were based on the most recent San Francisco County Transportation Authority (“SFCTA”) travel demand model and include the San Francisco Planning Department’s most recent land-use projections for San Francisco. These land-use
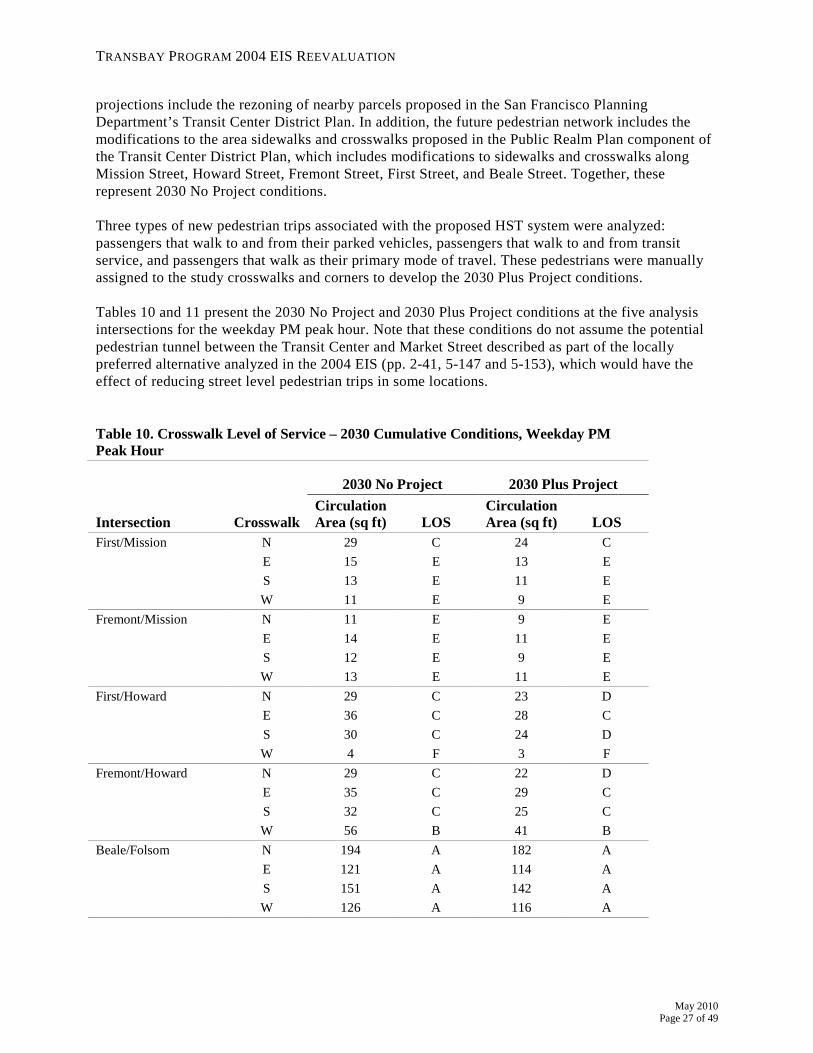
TRANSBAY PROGRAM 2004 EIS REEVALUATION
May 2010
Page 27 of 49
projections include the rezoning of nearby parcels proposed in the San Francisco Planning Department’s Transit Center District Plan. In addition, the future pedestrian network includes the modifications to the area sidewalks and crosswalks proposed in the Public Realm Plan component of the Transit Center District Plan, which includes modifications to sidewalks and crosswalks along Mission Street, Howard Street, Fremont Street, First Street, and Beale Street. Together, these represent 2030 No Project conditions. Three types of new pedestrian trips associated with the proposed HST system were analyzed: passengers that walk to and from their parked vehicles, passengers that walk to and from transit service, and passengers that walk as their primary mode of travel. These pedestrians were manually assigned to the study crosswalks and corners to develop the 2030 Plus Project conditions. Tables 10 and 11 present the 2030 No Project and 2030 Plus Project conditions at the five analysis intersections for the weekday PM peak hour. Note that these conditions do not assume the potential pedestrian tunnel between the Transit Center and Market Street described as part of the locally preferred alternative analyzed in the 2004 EIS (pp. 2-41, 5-147 and 5-153), which would have the effect of reducing street level pedestrian trips in some locations. Table 10. Crosswalk Level of Service – 2030 Cumulative Conditions, Weekday PM Peak Hour
Intersection Crosswalk
2030 No Project 2030 Plus Project Circulation Area (sq ft) LOS
Circulation Area (sq ft) LOS
First/Mission N 29 C 24 C E 15 E 13 E S 13 E 11 E W 11 E 9 E
Fremont/Mission N 11 E 9 E E 14 E 11 E S 12 E 9 E W 13 E 11 E
First/Howard N 29 C 23 D E 36 C 28 C S 30 C 24 D W 4 F 3 F
Fremont/Howard N 29 C 22 D E 35 C 29 C S 32 C 25 C W 56 B 41 B
Beale/Folsom N 194 A 182 A E 121 A 114 A S 151 A 142 A W 126 A 116 A
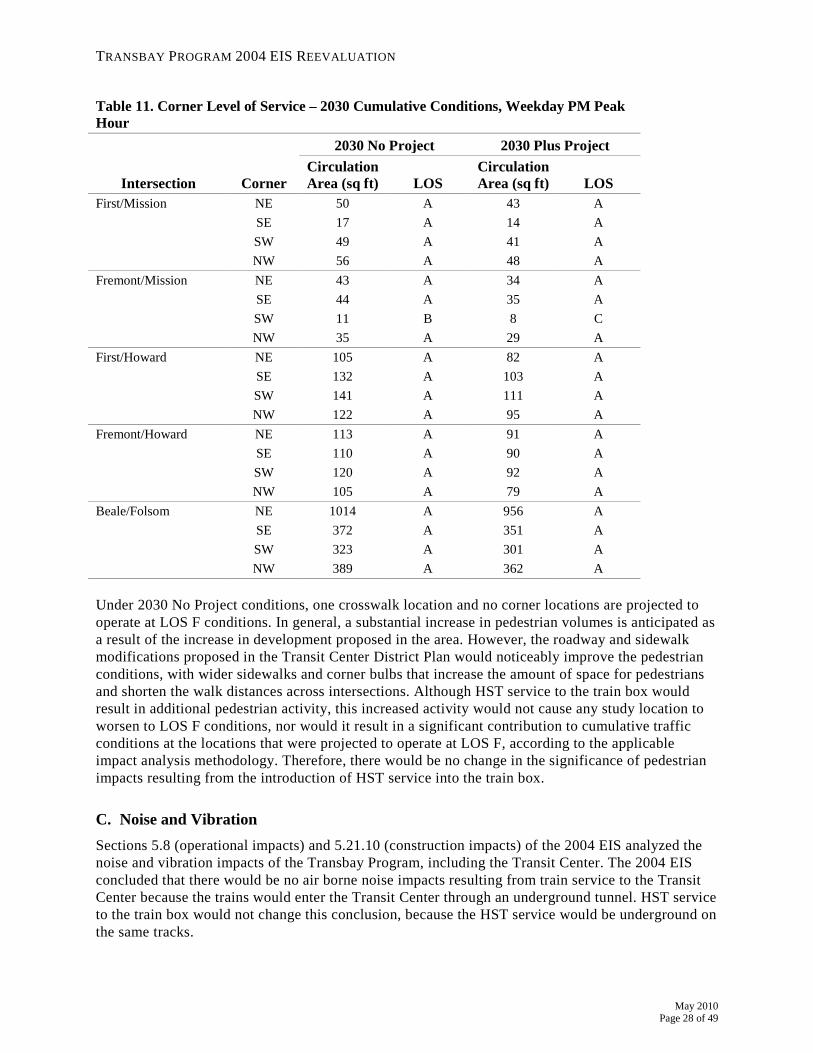
TRANSBAY PROGRAM 2004 EIS REEVALUATION
May 2010 Page 28 of 49
Table 11. Corner Level of Service – 2030 Cumulative Conditions, Weekday PM Peak Hour
Intersection Corner
2030 No Project 2030 Plus Project Circulation Area (sq ft) LOS
Circulation Area (sq ft) LOS
First/Mission NE 50 A 43 A SE 17 A 14 A SW 49 A 41 A NW 56 A 48 A
Fremont/Mission NE 43 A 34 A SE 44 A 35 A SW 11 B 8 C NW 35 A 29 A
First/Howard NE 105 A 82 A SE 132 A 103 A SW 141 A 111 A NW 122 A 95 A
Fremont/Howard NE 113 A 91 A SE 110 A 90 A SW 120 A 92 A NW 105 A 79 A
Beale/Folsom NE 1014 A 956 A SE 372 A 351 A SW 323 A 301 A NW 389 A 362 A
Under 2030 No Project conditions, one crosswalk location and no corner locations are projected to operate at LOS F conditions. In general, a substantial increase in pedestrian volumes is anticipated as a result of the increase in development proposed in the area. However, the roadway and sidewalk modifications proposed in the Transit Center District Plan would noticeably improve the pedestrian conditions, with wider sidewalks and corner bulbs that increase the amount of space for pedestrians and shorten the walk distances across intersections. Although HST service to the train box would result in additional pedestrian activity, this increased activity would not cause any study location to worsen to LOS F conditions, nor would it result in a significant contribution to cumulative traffic conditions at the locations that were projected to operate at LOS F, according to the applicable impact analysis methodology. Therefore, there would be no change in the significance of pedestrian impacts resulting from the introduction of HST service into the train box.
C. Noise and Vibration Sections 5.8 (operational impacts) and 5.21.10 (construction impacts) of the 2004 EIS analyzed the noise and vibration impacts of the Transbay Program, including the Transit Center. The 2004 EIS concluded that there would be no air borne noise impacts resulting from train service to the Transit Center because the trains would enter the Transit Center through an underground tunnel. HST service to the train box would not change this conclusion, because the HST service would be underground on the same tracks.
TRANSBAY PROGRAM 2004 EIS REEVALUATION
May 2010
Page 29 of 49
Operation of the Transbay Program would have significant ground borne vibration impacts at four locations along the DTX. However, the impacts at these locations would be reduced to a less-than-significant level by mitigation identified on page 5-77 of the 2004 EIS.10
HST service into the train box would not change this conclusion.
As discussed in detail below, although HST service would increase the total number of daily train movements (inbound and outbound), the number of movements would remain within the threshold category analyzed in the 2004 EIS (i.e., “frequent”), the per event level of noise and vibration would not increase, and there would be no change in the location of the train box in relationship to sensitive receptors. While the level of service proposed for Caltrain would remain essentially unchanged, at 132 train movements per weekday, the total number of train movements per day would increase to as many as 348 for conventional and HST service combined. The CHSRA 2009 Business Plan indicates that daily HST service to the Transit Center will occur over a 16-hour period. During the morning and evening peak periods of 3 hours each, HST will operate approximately 8 trains per hour into and from the Transit Center. During the remaining 10 hours of operation, HST is expected to operate approximately 6 trains per hour into and from the Transit Center. This proposed level of service results in a total of approximately 216 daily HST movements at the Transit Center over a 16-hour period.11
This change would not result in additional or more severe vibration impacts, because the change in the number of trains per hour is minor and because Mitigation Measure VibO-1 would effectively reduce HST vibration impacts to a less-than-significant level.
The 2004 EIS concluded that the short-term noise and vibration impacts of construction of the Transit Center would be significant. These impacts would be reduced to a less-than-significant level by measures identified in the 2004 EIS that were incorporated into Mitigation Measures NoiC-1 through NoiC-6 and VibC-1 through VibC-6 (2004 EIS, pp. 5-212 to 5-214; MMRP, pp. 2-5), which were adopted and incorporated into the Transbay Program. Constructing the train box and bringing HST service into the train box would not change these conclusions because, as described in Sections II.C and III.D, no changes are proposed with regard to construction of the train box. Mitigation Measures NoiC-1 through NoiC-6 and VibC-1 through VibC-6 would continue to apply to the entire Transbay Program, including the train box, and would mitigate construction vibration and noise impacts to a less-than-significant level.
1. Noise and Vibration Affected Environment Update
The potential changes to the Transbay Program associated with the currently proposed HST service into the Transit Center are summarized as follows. Project Element HST Considerations Project Alignment Both Caltrain and CHSRA trains will use the 3-track tunnel
described in the 2004 EIS, which will enter the train box from the west side. The tunnel is not part of Phase 1, but is in Phase 2.
Station Design/Train Box The configuration is similar to the description in the 2004 EIS (see Section II.A). The train box will be approximately 1,500 feet long by 190 feet wide and extend 60 feet below ground. It will be reinforced concrete consisting of two levels. The lower level will have 6 tracks and 3 platforms. The upper level will serve as a train
10 The mitigation identified on page 5-77 of the 2004 EIS was adopted and incorporated into the Transbay Program as
Mitigation Measure VibO-1. 11 The number of HSTs that can be processed at the Transit Center is directly related to the proposed train dwell time at the
station platform. With shorter dwell times, more trains can be processed. The anticipated HST peak hour level of service at the Transit Center is based on a minimum platform dwell time of approximately 30 minutes.
TRANSBAY PROGRAM 2004 EIS REEVALUATION
May 2010 Page 30 of 49
passenger ticketing and waiting area; both will be connected to the building by stairs, elevators, and escalators. The train box will widen at the west end, where it will connect to the underground rail tunnel. Train speed in the Transit Center and tail tracks will be limited to a maximum of 5 to 10 miles per hour.
Train Operations The 2004 EIS noise and vibration analysis assumed up to 132 conventional train movements per day (inbound and outbound over 24 hours). HST service would add up to 216 train movements per day through the tunnel and into and out of the Transit Center, for a maximum daily total of 348 train movements, at a rate of 8 trains per hour during the 3-hour morning and evening peak periods, and 6 trains per hour during the 10 off-peak hours.
2. Air Borne Noise
The 2004 EIS did not identify impacts from air borne noise because the trains will enter the Transit Center underground from a tunnel (2004 EIS, p. 5-69). The determination of no impact would remain the same with the addition of HST operations, because the high-speed trains also would be in a tunnel. Therefore, there would be no change in the significance of air borne noise impacts.
3. Ground Borne Noise and Vibration
The 2004 EIS concluded that impacts from ground borne noise and vibration would be significant at four locations along the DTX and with mitigation would be reduced to a less-than-significant level (2004 EIS, pp. 5-75 to 5-77). HST service would add as many as 8 trains per hour during the 3-hour morning and evening peak periods, and 6 trains per hour during the 10 off-peak hours. This would result in an increase in the total number of train movements in the tunnel and into the Transit Center. While the total number of train movements could increase from up to 132 trains per day for conventional train operations (Caltrain) to as many as 348 movements per day for combined conventional and HST service, over the course of a 16-hour operating day this would amount to only an average of 8 additional train movements per hour during the 3-hour morning and evening peak periods, and 6 trains per hour during the 10 off-peak hours. This change would not result in additional or more severe vibration impacts, because Mitigation Measure VibO-1 would effectively reduce HST vibration impacts to a less-than-significant level. The changes to ground borne noise impacts would be similar to those for ground borne vibration in that the number of events would increase, but the level of noise per event would not. Because the significance threshold is based on the level of noise per event, rather than the number of events, the 2004 EIS analysis of ground borne noise assumed that the Program would be in the “frequent” category, and the level of noise per event would not increase; therefore, no change to the significance of this impact would occur. (2004 EIS, pp. 5-75 to 5-77.) The FTA ground borne vibration and ground borne noise impact criteria, from Table 8-1 of the FTA Noise and Vibration Impact Assessment Manual (2006), which has been updated since the 2004 EIS was prepared, are shown in Table 12.12
12 Table 12 is from the 2006 FTA Noise and Vibration Impact Assessment Manual. The 2004 EIS used the previous,
1995 edition of the same manual. The ground borne vibration impact criteria for frequent events and the 70 events-per-day definition of “frequent events” are unchanged from the 1995 edition.
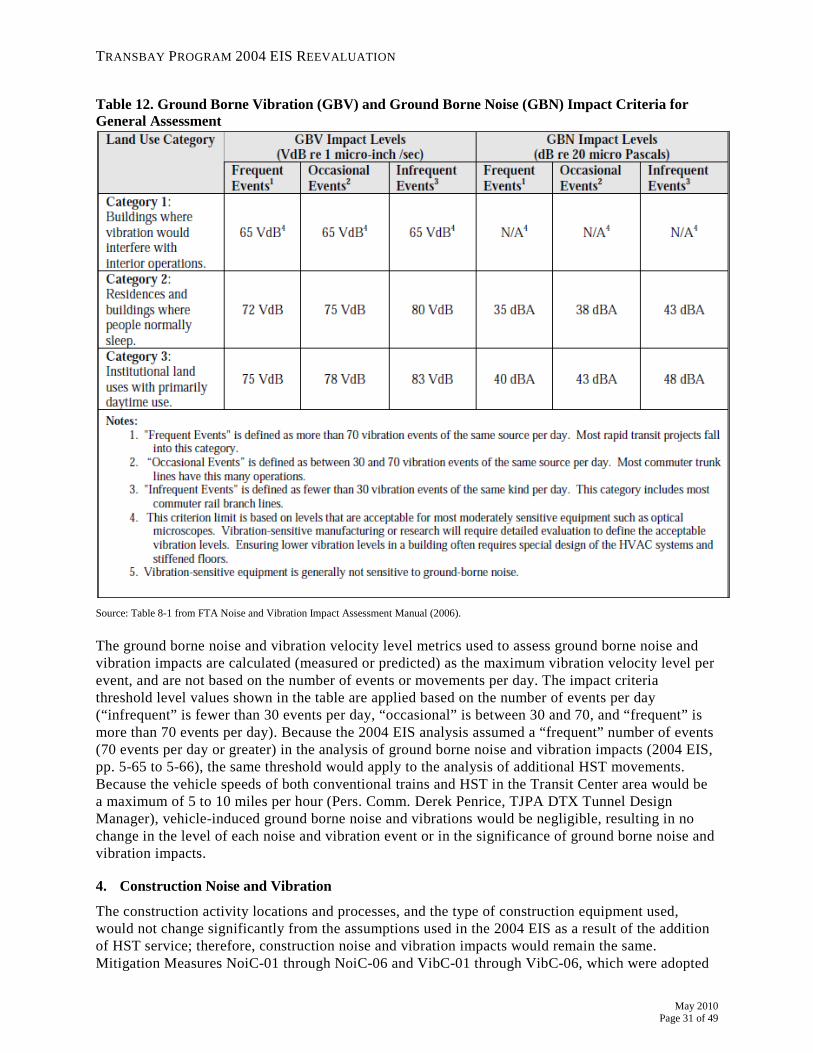
TRANSBAY PROGRAM 2004 EIS REEVALUATION
May 2010
Page 31 of 49
Table 12. Ground Borne Vibration (GBV) and Ground Borne Noise (GBN) Impact Criteria for General Assessment
Source: Table 8-1 from FTA Noise and Vibration Impact Assessment Manual (2006). The ground borne noise and vibration velocity level metrics used to assess ground borne noise and vibration impacts are calculated (measured or predicted) as the maximum vibration velocity level per event, and are not based on the number of events or movements per day. The impact criteria threshold level values shown in the table are applied based on the number of events per day (“infrequent” is fewer than 30 events per day, “occasional” is between 30 and 70, and “frequent” is more than 70 events per day). Because the 2004 EIS analysis assumed a “frequent” number of events (70 events per day or greater) in the analysis of ground borne noise and vibration impacts (2004 EIS, pp. 5-65 to 5-66), the same threshold would apply to the analysis of additional HST movements. Because the vehicle speeds of both conventional trains and HST in the Transit Center area would be a maximum of 5 to 10 miles per hour (Pers. Comm. Derek Penrice, TJPA DTX Tunnel Design Manager), vehicle-induced ground borne noise and vibrations would be negligible, resulting in no change in the level of each noise and vibration event or in the significance of ground borne noise and vibration impacts.
4. Construction Noise and Vibration
The construction activity locations and processes, and the type of construction equipment used, would not change significantly from the assumptions used in the 2004 EIS as a result of the addition of HST service; therefore, construction noise and vibration impacts would remain the same. Mitigation Measures NoiC-01 through NoiC-06 and VibC-01 through VibC-06, which were adopted
TRANSBAY PROGRAM 2004 EIS REEVALUATION
May 2010 Page 32 of 49
and incorporated into the Transbay Program (MMRP, pp. 2-4, 5), would continue to apply and would reduce the impact from construction noise and vibration to a less-than-significant level.
5. Effectiveness of Noise and Vibration Mitigation
Mitigation Measure VibO-01 was adopted and incorporated into the Transbay Program (MMRP, p. 4) to reduce the significance of ground borne Caltrain train noise and vibration impacts to a less-than-significant level. While these impacts are not associated with operation of the train box, Mitigation Measure VibO-01 would apply to HST service as well and would also be effective in addressing HST noise and vibration. The effectiveness of the adopted vibration mitigation elements, such as resilient rail fasteners or resiliently supported ties, is dependent upon on the frequency spectrum of the transmitted vibration and may depend on the specific vehicle characteristics. While HST vehicle design characteristics, such as axle loads, suspension stiffness, and operating speed, have not yet been established, it is assumed that the HST vehicles would travel at the same speed entering the train box as the Caltrain vehicles, and Mitigation Measure VibO-01 would be effective for HST vehicles. Additionally, based on current design assumptions, HST vehicles are anticipated to enter the train box at 5 to 10 miles per hour, a speed low enough that there would be no new or more severe impacts from vibration.
D. Construction Since 2004, minor changes have been made to construction details of the Transit Center during development of final design. As explained in Section II.C, the FTA found that construction of the Transit Center in either one or two stages would not result in environmental impacts beyond those previously evaluated in the 2004 EIS. The 2004 EIS identified the potential use of tiebacks or struts for temporary excavations. Based on the current design, only struts would now be used, thereby eliminating the need to obtain access underneath other existing structures. The use of struts only for temporary excavation would not result in new or more severe impacts, but would reduce impacts identified in the 2004 EIS. The analysis of Solid Waste Management in 2004 EIS Section 5.4.2.3 (p. 5-39) remains current, although a new City enactment adopted since 2004 will have the effect of reducing the solid waste generated during construction. City and County of San Francisco Ordinance No. 27-06, which took effect on July 1, 2006, created a mandatory program to maximize the recycling of mixed construction and demolition (“C&D”) debris. The ordinance requires that mixed C&D debris must be transported off-site by a registered transporter and taken to a registered facility that can process and divert from landfill disposal a minimum of 65% of the material generated from construction, demolition or remodeling projects. The Transbay Program will comply with this ordinance. Because compliance with this ordinance will result in the diversion of more C&D material from landfills than was anticipated in the 2004 EIS, the Transbay Program’s previously evaluated impacts to area landfills would be reduced. All other construction considerations related to the train box remain substantially similar to those covered in the 2004 EIS. Thus, HST service into the train box would not result in any new significant construction impacts, and no updating of the 2004 EIS is required.
E. Cumulative Impacts of the HST System This section summarizes consideration of the cumulative impacts analysis in the 2008 Bay Area to Central Valley EIR/EIS, which analyzes the portion of the California HST system that includes the Transit Center. The FRA is relying on the CHSRA’s 2008 Bay Area to Central Valley EIR/EIS because it is the most recently available information on the impacts of high-speed rail. The 2008 Bay
TRANSBAY PROGRAM 2004 EIS REEVALUATION
May 2010
Page 33 of 49
Area to Central Valley EIR/EIS analyzed whether implementation of the Bay Area to Central Valley portion of the HST system, including the Transit Center train box, could result in significant cumulative impacts in combination with closely related past, present, and reasonably foreseeable probable future projects (CHSRA, 2008 Bay Area to Central Valley EIR/EIS, pp. 3.17-1 to 3.17-42). The 2008 Bay Area to Central Valley EIR/EIS found that the HST system could have a cumulatively considerable impact on the following: traffic and circulation and travel conditions; land use compatibility; agricultural land; aesthetics and visual resources; cultural and paleontological resources; biological resources and wetlands; and public parks and recreation resources (Section 4(f) and 6(f) Resources) (CHSRA, 2008 Bay Area to Central Valley EIR/EIS, CEQA Findings of Fact and Statement of Overriding Considerations, pp. 69-72). HST service into the train box either would not contribute to these cumulative impacts, or would not change the prior analysis in the 2004 EIS for the following reasons.
1. Traffic and Circulation and Travel Conditions
Section 7.2.2 of the 2004 EIS identified vehicular impacts at seven local intersections as a significant and unavoidable cumulative impact. Future conditions in 2030, with or without HST service to the train box, would contribute to cumulative impacts at different intersections (identified in Section III.B) as a result of the change in future development. These intersections would operate at unacceptable levels of service with or without the contribution of HST passengers as a result of the projected future development; however, the contribution of HST would be cumulatively considerable at some locations. Thus, the Transbay Program would continue to have a significant and unavoidable cumulative impact on intersection levels of service. Mitigation Measure PC 7, which was adopted and incorporated into the Transbay Program and would apply to construction of the train box, would reduce the potential impacts of construction on traffic and transportation to a less-than-significant level (2004 EIS, pp. 5-159 to 5-180, 5-184-5-202; MMRP, p. 20). As discussed in Sections III.D (Construction) and III.B (Transportation) of this Reevaluation, HST service into the train box would not change these conclusions.
2. Land Use Compatibility
The 2004 EIS determined that the Transbay Program is compatible with local land use. It would not conflict with local land use plans and policies, divide an established community, result in significant job loss, or have significant environmental justice impacts (2004 EIS, pp. 5-4, 5-13, 5-35 to 5-37). Potential community impacts resulting from property acquisition and construction would be mitigated to a less-than-significant level by Mitigation Measures Prop 1, PC 1-7, and GC 1-5 (2004 EIS pp. 5-34, 5-159 to 5-182, 5-202 to 5-205; MMRP, pp. 1, 18-20). HST service into the Transit Center would not change any of these conclusions, because the Program’s land use and footprint remain the same.
3. Agricultural Land
The Transbay Program, including the Transit Center, would have no impact on agricultural resources, because there are no agricultural resources in the Transbay Program area (2004 EIS, p. 4-1).
4. Aesthetics and Visual Resources
The Transit Center would not have any impacts on aesthetics and visual resources (2004 EIS, pp. 5-112 to 5-114, 7-9). HST service into the Transit Center would not change this conclusion because it would have no effect on the above-ground design of the Transit Center. In addition, the 2004 EIS found that short-term visual changes as a result of construction activities would be less than significant, and these impacts were further reduced by Mitigation Measures VA 1 and VA 2 (2004 EIS, pp. 5-224 to 5-225; MMRP, p. 22). As discussed in Section III.D (Construction) of this Reevaluation, HST service into the train box would not change this conclusion.
TRANSBAY PROGRAM 2004 EIS REEVALUATION
May 2010 Page 34 of 49
5. Cultural and Paleontological Resources
The Transbay Program would have a significant impact on archeological resources, but that impact would be mitigated to a less-than-significant level by Mitigation Measures CH 1, CH 2, and CH 15-20 that require preparation of a comprehensive archaeological research design and treatment plan for archeological resources (2004 EIS, pp. 5-86 to 5-89; MMRP, pp. 7-11, 14). The Transbay Program would have a significant and unavoidable effect on historic resources, and would thus contribute to this cumulative impact (2004 EIS, pp. 5-90 to 5-111, 7-6). Mitigation Measures CH 1-14 and CH 19-20 would not reduce this impact to a less-than-significant level (MMRP, pp. 7-11). Construction of the Transbay Program, including the train box, would continue to contribute to this significant cumulative impact. These impacts would not be increased or otherwise affected by HST service into the train box, however.
6. Biological Resources and Wetlands
The Transbay Program would have no impact on biological resources, because no sizable natural habitat for biological plant, animal, or bird species remains in the study area. The Program area is outside of the 100-foot Bay shoreline band, and the U.S. Fish and Wildlife Service has indicated that no adverse effects on endangered species of wildlife and plants are expected from the Transbay Program (2004 EIS, p. 4-39).
7. Public Parks and Recreation Resources (Section 4(f) and 6(f) Resources)
The Transbay Program will use Section 4(f) resources through direct acquisition and temporary occupancy. This is because it requires demolition of the Transbay Terminal and loop ramp structures, which are contributing elements of the San Francisco–Oakland Bay Bridge, which is listed on the National Register of Historic Places (“NRHP”), and demolition of three buildings that contribute to a historic district eligible for the NRHP (2004 EIS, pp. 8-1 to 8-2). The 2004 EIS and the FTA ROD found that there is no feasible and prudent alternative to the use of these Section 4(f) resources and that the Transbay Program includes all possible planning to minimize harm resulting from such use (2004 EIS, pp. 8-24; FTA ROD, pp. 15-21). Construction of the Transbay Program, including the train box, would continue to contribute to this significant cumulative impact. These impacts would not be increased or otherwise affected by HST service into the Transit Center. The Transbay Program would have no impact on Section 6(f) resources, because there are no Section 6(f) resources in the Program area (CHSRA, 2008 Bay Area to Central Valley EIR/EIS, Table 3.16-3, p. 3.16-6).

TRANSBAY PROGRAM 2004 EIS REEVALUATION
May 2010
Page 35 of 49
IV. UPDATED FINANCIAL ANALYSIS
A. Current Transit Center Phase 1 Financial Plan This section summarizes the current Transit Center Phase 1 financial plan. To prepare the 2004 EIS and regularly thereafter, the TJPA’s financial consultants have undertaken an iterative financial planning process of assigning revenues that can be reasonably expected to be available and that are eligible for expenditure on the identified contract commitments. The funding plan utilizes grant funds early in the schedule to minimize the gap between non-escalating revenues and cost escalation, conforms to any restrictions on funding, minimizes debt issuance and related financing costs, and utilizes assumptions that are consistent with industry best practices and historical experience. The financial plan will continue to be updated throughout the life of the Program to reflect current conditions. Since the 2004 EIS, elements of the financial plan have changed. However, the primary financial conclusion of the 2004 EIS still holds: the TJPA has the financial capacity to build, operate, and maintain the Transit Center. To summarize, the following key elements of the financial plan have changed:
• The Transbay Program has been phased to deliver a useable transportation improvement with currently available funding.
• Capital cost estimates have been updated periodically since the 2004 EIS. The Phase 1 cost is estimated at $1.589 billion (year of expenditure [“YOE”]). The Phase 2 cost estimate is under development.
• Capital revenues have been committed and allocated to the project.
• New funding sources, including the federal HSIPR program funds and a capital commitment from AC Transit, have become available.
• The TJPA has secured a TIFIA loan for Phase 1 of the Program. These and other changes are discussed in the following sections.
B. Phasing of the Program In 2005 and 2006, the TJPA, in consultation with the Program Management/Program Controls consultant, conducted a value engineering exercise to identify methods of reducing the overall cost of the Transbay Program and secure the greatest benefit from the funds committed to date. The principal outcome of this process was a recommendation to split the Transbay Program into two phases: Phase 1 included the elements of the Program necessary for bus operations: construction of the temporary terminal; demolition of the existing Transbay Terminal and bus ramps; and construction of the above-grade levels of the Transit Center, the bus ramps, and bus storage. In Phase 1, the TJPA planned to build drilled caisson foundations and other improvements in the Transit Center to allow for future construction of the train box. Phase 2 involved construction of the DTX, the rail extension for Caltrain commuter rail and HST, and the train box. Constructing the above-ground portion of the Transit Center to allow for the later construction of the train box below it is referred to as the top-down method of construction. At its June 2, 2006, meeting, the TJPA Board adopted this phased implementation strategy.
TRANSBAY PROGRAM 2004 EIS REEVALUATION
May 2010 Page 36 of 49
The Transit Center design team headed by Pelli Clarke Pelli Architects designed the Transit Center through Conceptual Validation and Schematic Design assuming that the Transit Center would be built in two phases using the top-down strategy. However, the design team also kept open the possibility that the Transit Center train box could be constructed in Phase 1 if the TJPA were able to secure additional funding. Including the train box in the same phase of construction as the above-ground bus station levels of the Transit Center would change the construction method used for the Transit Center to bottom-up. On June 11, 2009, the TJPA Board directed staff and the design team to proceed with the bottom-up approach, which will result in significant total Program cost savings, distinct design advantages, and other benefits as described below:
• While adding $400 million to the $1.2 billion cost of Phase 1 of the Transit Center, constructing the train box in Phase 1 will result in an estimated overall savings of $100 million for the Transbay Program. The following factors contribute to these savings: (a) the drilled caissons designed to serve as the future columns of the train box structure under the top-down strategy will not be required; (b) excavation and construction of the train box will be easier and less costly; and (c) building the train box now, in a soft construction market, will result in savings in the cost of labor and materials.
• Constructing the train box during Phase 1 will allow “back of house” systems—electrical transformers and switch gear, mechanical rooms, and other administrative, maintenance and building support spaces essential to the operation of the Transit Center—to be located below grade on the lower concourse level, out of sight and out of the path of ground floor visitors to the Transit Center. The top-down strategy would not allow for below-ground construction other than foundations; accordingly, these systems would have to be located on the ground level, compromising horizontal and vertical circulation and displacing retail and other public uses that will activate the Transit Center. Moreover, some of these systems would have to be reworked during Phase 2 under the top-down strategy.
• Including the train box in Phase 1 will simplify construction and mitigate the construction risks posed by the top-down method. Constructing the train box during Phase 2 would require the contractor to excavate underneath the constructed or partially constructed above-grade levels of the Transit Center, making construction slower and more expensive than conventional open-pit excavation. The contractor would have to carefully monitor and control ground settlement during excavation to protect earlier Transit Center construction; if settlement exceeds projections, the measures required to stabilize the excavation and mitigate the settlement would be more difficult and costly to implement than with bottom-up construction. Additionally, obstacles encountered during the course of bottom-up construction will be easier and less expensive to address, resulting in fewer delays.
• Under the top-down strategy, the vertical control and alignment of the drilled caissons that would serve as the columns of the future rail levels would be challenging, and the columns would require moderate to extensive rework during Phase 2 to produce an acceptable finished alignment. Constructing the train box in Phase 1 allows for the design of the train box as a large bath tub. Constructing the train box in Phase 2 would require the construction of deep foundations to support the Phase 1 structure followed in Phase 2 by the construction of the train box. The penetration of the train box by the Phase 1 foundations would compromise the train box waterproofing systems, resulting in poorer waterproofing performance and long-term maintenance challenges.
• Constructing the train box in Phase 1 will decrease the total time for construction of the Transit Center by several months and reduce the associated disruption of vehicle and pedestrian traffic and access to adjoining properties resulting from the construction.
TRANSBAY PROGRAM 2004 EIS REEVALUATION
May 2010
Page 37 of 49
• Buildings adjacent to the Transit Center will exert loads on the train box during construction. Constructing the train box during Phase 1, before construction of the Transit Tower and other anticipated development on adjoining property, will eliminate the requirement for the train box to provide lateral support for these later structures. Rather, when these structures are built, they will be required to protect the train box.
• Building the train box now during Phase 1, during an economic recession, rather than waiting for several years, will have the added advantage of creating jobs when they are most needed. The TJPA estimates that the train box construction alone will directly and indirectly add 12,000 jobs to the local economy.
C. American Recovery and Reinvestment Act On February 17, 2009, President Obama signed into law the American Recovery and Reinvestment Act (“Recovery Act”). The Recovery Act includes $8 billion nationally for high-speed rail and intercity rail grants. On April 16, 2009, the FRA released its Vision for High-Speed Rail in America, a strategic plan describing how FRA will use the $8 billion in Recovery Act funds for intercity and high-speed rail. On January 28, 2010, Transportation Secretary LaHood announced his intent to allocate $400 million for the train box in the Transbay Transit Center. In a March 29, 2010, letter to the TJPA, USDOT confirmed that it has reserved $400 million within the overall California allocation of the Department’s High Speed Rail grants to provide funding for the train box (Exhibit 6b). The inclusion of the Recovery Act funds for the train box brings the revised Phase 1 budget to $1.589 billion (YOE).
D. Capital Plan
1. Local and Regional Plans
The Transbay Program is included in numerous local and regional transportation plans. These include:
• Metropolitan Transportation Commission’s (“MTC”) Resolution 3434: Regional Transit Expansion Plan (“RTEP”)
• Regional Transportation Program (“RTP”) for Environmental, Preliminary Engineering, and Right of Way phases
• Transportation Improvement Program (“TIP”)
• MTC’s 2000 Blueprint
• MTC’s Transportation 2035 Plan for the San Francisco Bay Area
• San Francisco Countywide Transportation Plan
• San Francisco Countywide Congestion Management Plan
• New Expenditure Plan for San Francisco (“Prop K”)
• Expenditure Plan for Regional Measure 2 (“RM 2”)
• Transbay Redevelopment Project Area Design for Development All of these plans included extensive public outreach regarding the inclusion of and prioritization of projects.
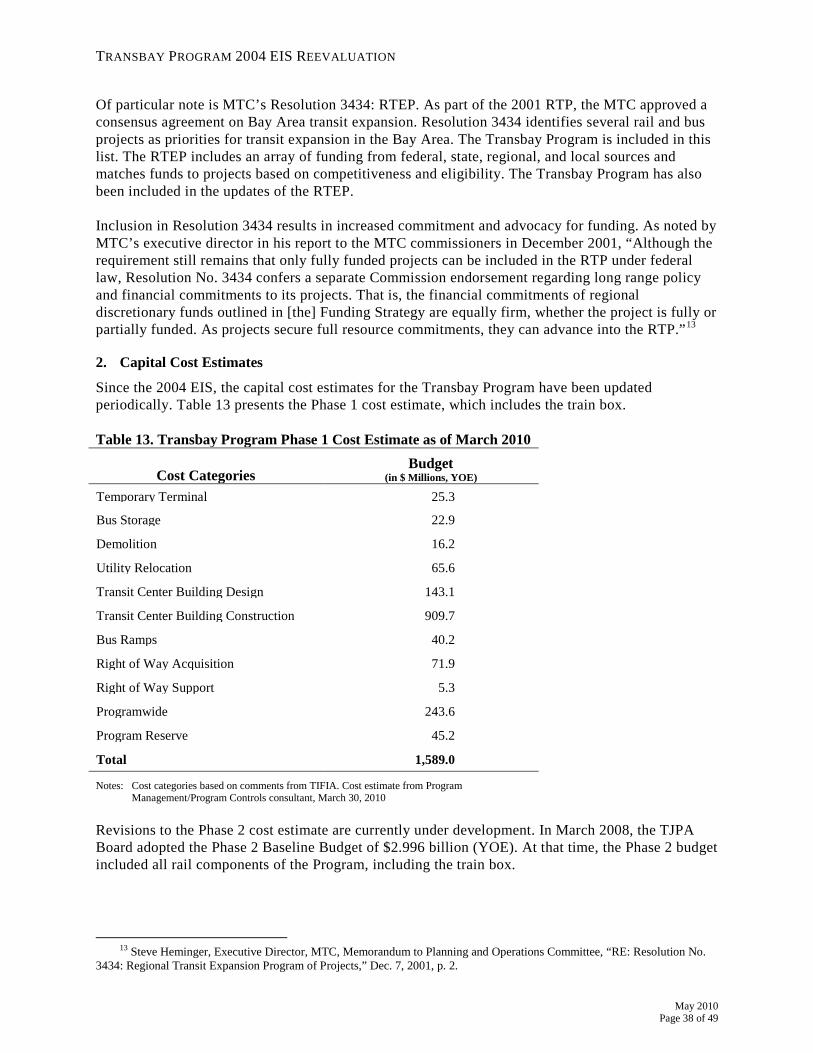
TRANSBAY PROGRAM 2004 EIS REEVALUATION
May 2010 Page 38 of 49
Of particular note is MTC’s Resolution 3434: RTEP. As part of the 2001 RTP, the MTC approved a consensus agreement on Bay Area transit expansion. Resolution 3434 identifies several rail and bus projects as priorities for transit expansion in the Bay Area. The Transbay Program is included in this list. The RTEP includes an array of funding from federal, state, regional, and local sources and matches funds to projects based on competitiveness and eligibility. The Transbay Program has also been included in the updates of the RTEP. Inclusion in Resolution 3434 results in increased commitment and advocacy for funding. As noted by MTC’s executive director in his report to the MTC commissioners in December 2001, “Although the requirement still remains that only fully funded projects can be included in the RTP under federal law, Resolution No. 3434 confers a separate Commission endorsement regarding long range policy and financial commitments to its projects. That is, the financial commitments of regional discretionary funds outlined in [the] Funding Strategy are equally firm, whether the project is fully or partially funded. As projects secure full resource commitments, they can advance into the RTP.”13
2. Capital Cost Estimates
Since the 2004 EIS, the capital cost estimates for the Transbay Program have been updated periodically. Table 13 presents the Phase 1 cost estimate, which includes the train box. Table 13. Transbay Program Phase 1 Cost Estimate as of March 2010
Cost Categories Budget
(in $ Millions, YOE) Temporary Terminal 25.3
Bus Storage 22.9
Demolition 16.2
Utility Relocation 65.6
Transit Center Building Design 143.1
Transit Center Building Construction 909.7
Bus Ramps 40.2
Right of Way Acquisition 71.9
Right of Way Support 5.3
Programwide 243.6
Program Reserve 45.2
Total 1,589.0
Notes: Cost categories based on comments from TIFIA. Cost estimate from Program Management/Program Controls consultant, March 30, 2010
Revisions to the Phase 2 cost estimate are currently under development. In March 2008, the TJPA Board adopted the Phase 2 Baseline Budget of $2.996 billion (YOE). At that time, the Phase 2 budget included all rail components of the Program, including the train box.
13 Steve Heminger, Executive Director, MTC, Memorandum to Planning and Operations Committee, “RE: Resolution No.
3434: Regional Transit Expansion Program of Projects,” Dec. 7, 2001, p. 2.

TRANSBAY PROGRAM 2004 EIS REEVALUATION
May 2010
Page 39 of 49
Since the adoption of the Phase 2 Baseline Budget, preliminary engineering has continued, and other changes have been made to the scope of the DTX. To summarize, the primary changes to Phase 2, which will impact the cost estimate include:
• Acceleration of the train box into Phase 1 and change of construction of the Transit Center to a bottom-up construction methodology;
• Revisions to DTX scope as requested by CHSRA; and
• Completion of DTX Preliminary Engineering, anticipated for summer 2010.
3. Funding Sources
The revenues identified for the Transbay Program generally fall into two categories: revenues to be used for capital costs and revenues to be used for repayment of a construction period loan. The revenues to be used for capital costs are grants, land sales proceeds, lease income from acquired right of way parcels,14
and other one-time revenue generation opportunities. Several long-term revenue streams have been identified in the Transbay financial plan. These include tax increment funds from the state-owned parcels in the Transbay Redevelopment Project Area and passenger facilities charges (“PFCs”) or other commitments from transit operators using the Transit Center. Because the bulk of the revenue from these sources is anticipated after the completion of a portion of the Transbay Program, the financial plan includes a construction period loan. Descriptions of the identified revenue sources are provided in the following section. Table 14 includes a summary of the identified funding for the Transbay Program, each of which is discussed in detail below.
Table 14. Revenue by Phase as of March 2010 Identified Revenue (in $ Millions, YOE)
Source
Phase 1 (Transit Center Building
& Train Box) Phase 2 (DTX) Total
SF Prop K 98.2 49.0 147.2 San Mateo Sales Tax 4.5 24.5 29.0 AC Transit Capital Contribution 38.5 38.5 Lease & Interest Income and TDRs 6.2 6.2 Other Local 0.8 0.8 RM 1 54.4 54.4 RM 2 143.0 7.0 150.0 AB 1171 150.0 150.0 RTIP 28.3 28.3 Land Sales 429.0 185.0 614.0 FTA Section 1601 8.8 8.8 SAFETEA-LU Grants 53.6 53.6 FRA Rail Relocation 2.65 TIFIA Loan Proceeds 171.0 377.4 548.4 Recovery Act High Speed Rail 400.0 400.0 Total (may not sum due to rounding) 1,589.0 642.9 2,231.9
14 Lease income will be generated from right of way parcels after they are acquired and before they are vacated for
construction or staging purposes. This lease income does not include revenues generated from state-owned parcels after they are transferred to the TJPA. Lease income from the state-owned parcels will be deposited in the Public Transportation Account with the State.
TRANSBAY PROGRAM 2004 EIS REEVALUATION
May 2010 Page 40 of 49
The timing of revenues for Phase 1 (Transit Center building, including train box) is based on the construction schedule. Like many other capital projects and programs, the availability of funding is tied closely to the nature and schedule of the Program elements to be constructed. The schedule directly influences the availability of several revenue sources, including land sales, tax increment, and PFCs. The funding plan includes land sales revenues that are contingent upon completion of various components of the Program. When the Transbay Program no longer requires specific parcels (e.g., for construction staging or for the temporary bus terminal), those parcels can be sold and developed. The estimated land sales schedule used to develop the financial plan accounts for the timing and uses of all state-owned parcels. The updated land sales schedule and sales estimates form the bases of a revised tax increment revenue projection. For the Phase 1 (Transit Center building, including train box) funding plan, only those enacted revenues that would be available during the construction period have been applied to the commitment schedule. Thus, no statewide bond proceeds or other undetermined revenues are included in the Phase 1 funding plan. In addition, only tax increment and AC Transit PFCs have been assumed for the TIFIA loan repayment for Phase 1. Local Sources San Francisco Proposition K Sales Tax. On November 4, 2003, the voters of San Francisco approved Prop K, which imposes a 0.5% sales tax to be used for transportation purposes. The SFCTA is responsible for allocating, administering, and overseeing Prop K funds. The Prop K Expenditure Plan, which provided voters with the list of projects and programs to be funded with the sales taxes, includes $270 million (in 2003 dollars) for the Transbay Program. When developing the Expenditure Plan, the SFCTA did not take into account the cost of advancing sales tax revenues to fund capital projects scheduled early in the tax collection period. In addition, the new Prop K sales tax replaced the existing transportation sales tax, and several large capital projects were grandfathered into the new tax program. Whereas most of the new projects were responsible for the financing costs associated with advancing funds to meet their delivery schedules, the financing costs for the grandfathered projects were distributed among all of the new projects and programs. Thus, when the SFCTA developed its 2005 Strategic Plan, the document that guides revenue allocations, the funding available for the engineering, design, and construction of the Transbay program was reduced to approximately $135 million (in 2003 dollars), or $148 million in YOE dollars. As of March 2010, $147.2 million in Prop K funds have been allocated to the Transbay Program. San Mateo Measure A Sales Tax. The San Mateo County Transportation Authority (“SMCTA”) is an independent agency formed to administer the proceeds of a county-wide 0.5% sales tax. Voters approved Measure A, which established the program in June 1988. Measure A sales tax collections began in January of 1989. The tax expired on Dec. 31, 2008. Resolution 3434, the RTEP, includes approximately $29 million (in 2004 dollars) of San Mateo Measure A sales tax funds for the Transbay Program. The financial plan assumes an annual Measure A sales tax growth rate of 3%. As of March 2010, $11.1 million in Measure A funds have been allocated to the Transbay Program. Additional allocations of $11.8 million are pending SMCTA board action. AC Transit Capital Contribution. The AC Transit Lease and Use Agreement outlines AC Transit’s bus operations in the Temporary Terminal and the Transit Center through at least the year 2050. In the agreement, AC Transit has committed to contribute $57 million in 2011 dollars to the capital cost of the Transit Center. Although the AC Transit and TJPA have agreed on a schedule of estimated payments of particular amounts, the agreement grants AC Transit flexibility to determine the amount and timing of its capital contribution payments, as long as it pays the capital contribution in full by 2050. AC Transit plans to use grant funds to pay the first $38.5 million of its capital contribution in
TRANSBAY PROGRAM 2004 EIS REEVALUATION
May 2010
Page 41 of 49
lump sums of varying amounts from 2010 to 2014. AC Transit expects to pay the remaining $19 million when it begins bus service in the Transit Center by imposing PFCs on its passengers traveling to and from San Francisco. AC Transit has proposed a PFC of $.25 per trip, to be increased by $.05 every three years, until AC Transit’s total capital contribution is paid. If AC Transit is unable to pay the full amount of any estimated lump sum or annual payment, then AC Transit will pay the outstanding balance through collection of PFC revenue after 2032. AC Transit may prepay all or part of its capital contribution, as long as the total payment equals $57 million in 2011 dollars, applying a discount rate of 4.5%. Pre-Construction Lease Proceeds. The TJPA receives lease income from tenants of properties acquired for the Transbay Program. The funding plan includes lease income for the period prior to termination of the leases as a result of the start of construction. Transferable Development Rights. The TJPA’s purchase of the 80 Natoma property for right of way preservation included transferable development rights (“TDRs”). The Appraisal of Real Estate defines a transferable development right as "a development right that is separated from a landowner's bundle of rights and transferred, generally by sale, to another landowner in the same or a different area."15 Buyers of TDRs may use the rights to develop at higher densities than zoning regulations might otherwise allow. Ownership of TDRs is a taxable property interest, and the conveyance of TDRs is a change of ownership requiring reappraisal of this property interest for property tax purposes.16
The TJPA has sold 160,000 units of TDR equivalent to 160,000 square feet of gross floor area improvements for $4.04 million. These funds will be applied to the Transbay Program costs.
Interest Income. The TJPA’s investment policy allows the TJPA to invest cash balances in the City and County of San Francisco’s City Treasurer’s cash and investments pool as well as insured savings or money market accounts. The estimated returns on these investments are included in the Transbay Program financial plan. Other Local Sources. The San Francisco Redevelopment Agency has made an in-kind contribution to the TJPA. This work included the Design for Development preparation for the Transbay Redevelopment Project Area. Regional Sources Regional Measure 1. In November 1988, Bay Area voters approved Regional Measure 1 (“RM 1”), which authorized a standard auto toll of $1 for all seven state-owned Bay Area toll bridges. The additional revenues generated by the toll increase were identified for use for certain highway and bridge improvements, public transit rail extensions, and other projects that reduce congestion in the bridge corridors. Resolution 3434 includes $53 million in RM 1 funds for the Transbay Program. In addition, $1.4 million in RM 1 funds were provided as local matching funds to the TJPA’s Federal Section 1601 planning grant. As of March 2010, an additional $5.2 million in RM 1 funds has been allocated to the Transbay Program.
15 Appraisal Institute, The Appraisal of Real Estate, 11th ed. Chicago: Appraisal Institute, 1996, p. 148. 16 Assessor’s Handbook Section 501, Basic Appraisal, California State Board of Equalization, January 2002, p. 26.
TRANSBAY PROGRAM 2004 EIS REEVALUATION
May 2010 Page 42 of 49
Regional Measure 2. On March 2, 2004, voters passed RM 2, raising the toll on the seven state-owned toll bridges in the San Francisco Bay Area by $1.00. This extra dollar funds various transportation projects within the region that have been determined to reduce congestion or to make improvements to travel in the toll bridge corridors, as identified in SB 916.17
Specifically, RM 2 establishes the Regional Traffic Relief Plan and identifies specific transit operating assistance and capital projects and programs eligible to receive RM 2 funding. The Transbay Program is eligible for $150 million in RM 2 capital funds, and $3 million per year (escalated by 3.5% per year, starting in July 2004) of RM 2 operating funds for the operation and maintenance of the Transit Center. As of March 2010, all $150 million in RM 2 funds has been allocated to the Transbay Program.
AB 1171. MTC’s Resolution 3434 includes $150 million in AB 1171 funds for the Transbay Program. This source results from the adoption of AB 1171 by the California legislature for a plan to fund the cost of seismic retrofit of Bay Area toll bridges. The Transbay Program is eligible for these funds under a provision that makes the money available to projects consistent with the purposes of the voter-approved RM 1 program. As of March 2010, $15.9 million has been allocated to the Transbay Program. State Sources Regional Transportation Improvement Program. The State Transportation Improvement Program (“STIP”) is the State’s spending plan for state and federal funding. The STIP is comprised of the Regional Transportation Improvement Program (“RTIP”) and the Interregional Transportation Improvement Program (“ITIP”). MTC and the SFCTA, acting as the San Francisco Congestion Management Agency, program Regional Improvement Program funds for inclusion in the RTIP. RTIP funds for the Transbay Program are planned to come from the Public Transportation Account, and are subject to fluctuations in the state budget and the condition of the economy. The STIP is updated every two years and currently covers a five-year period. The 2004 update to MTC’s Resolution 3434 includes $24 million (in 2004 dollars) for the Transbay Program. The financial plan assumes an annual RTIP growth rate of 3%. SFCTA’s Resolution 06-30, approved in November 2005, limits programming of all San Francisco RTIP capital funds to four major capital projects, including the Transbay Program, until the RTIP commitments to those four projects under Resolution 3434 are fulfilled. As of March 2010, $7.391 million in RTIP funds have been allocated to the Transbay Program. Land Sales. The 1998 Loma Prieta earthquake resulted in the demolition of several elevated freeway structures in the vicinity of the Transbay Terminal. In a cooperative agreement signed in July 2003, the State of California agreed to transfer approximately 12 acres of this state-owned land for the benefit of the Transbay Program. In December 2007, the California Transportation Commission (“CTC”) authorized the transfer of the parcels, the final step in conveying the land for the Transbay Program. The cooperative agreement limits the use of the land sales revenues to construction costs. This limitation has been incorporated into the financial plan. The uses for each parcel have been described in the Transbay Redevelopment Project Area Design for Development. Based on the Transit Center building construction schedule, the Program Management/Program Controls consultant developed an estimate of when each of the parcels would be available for sale. The land use information and sale schedule form the basis for the land sales revenue estimates prepared by The Concord Group. The Concord Group estimate was prepared in 2007, and will be updated in 2010 and throughout the life of the Program. The financial plan assumes an annual growth rate of 2% for land values.
17 Chapter 715, Statutes of 2004.

TRANSBAY PROGRAM 2004 EIS REEVALUATION
May 2010
Page 43 of 49
Federal Sources Section 1601 Grant. The Transbay Program received a commitment of $8.8 million under Section 1601 of the Transportation Equity Act for the 21st Century (“TEA-21”). The federal funds have been matched by approximately $800,000 in RM 2 bridge tolls and $1.4 million in RM 1 bridge tolls. The TJPA has used these funds for planning, environmental, and preliminary engineering work. High Priority Bus. The federal transportation reauthorization bill, the Safe, Accountable, Flexible, Efficient Transportation Equity Act: A Legacy for Users (“SAFETEA-LU”), includes two commitments of Section 5309 Bus and Bus-Related Facilities funds for the Transbay Program totaling $29.2 million. The Bus and Bus-Related Facilities program provides capital assistance for new and replacement buses and related equipment and facilities. As of March 2010, after the federal rescissions, which are calculated during the annual appropriations process, all $29.1 million has been awarded to the Transbay Program. Projects of National and Regional Significance. The Projects of National and Regional Significance (“PNRS”) program provides funding for high cost projects of national or regional importance. SAFETEA-LU includes a commitment of $27 million for the Transbay Program under PNRS. As of March 2010, after the federal rescissions, which are calculated during the annual appropriations process, all $24.5 million has been awarded to the Transbay Program. Federal Railroad Administration Rail Relocation. The Program for Capital Grants for Rail Line Relocation and Improvement Projects funds construction projects that improve the route or structure of a rail line and involves a lateral or vertical relocation of any portion of the rail line, or are carried out for the purpose of mitigating the adverse effects of rail traffic on safety, motor vehicle traffic flow, community quality of life, or economic development. The TJPA has received two commitments totaling $2.65 million under this program. TIFIA Loan. The financial plan includes a loan from the Department of Transportation under the Transportation Infrastructure Finance and Innovation Act (“TIFIA”) of 1998, which provides secured loans, loan guarantees, and standby lines of credit for surface transportation projects of national or regional significance. This program may provide credit support to large transportation projects for up to 33% of a project’s eligible cost. Sources for repayment of the TIFIA loan include tax increment from state-owned parcels and PFCs. After an exhaustive review of the Phase 1 funding plan and credit analysis by Fitch Ratings, the TJPA’s $171 million TIFIA loan closed on January 25, 2010. Recovery Act High Speed and Intercity Passenger Rail. On February 17, 2009, President Obama signed into law the American Recovery and Reinvestment Act (“Recovery Act”). The Recovery Act appropriated $8 billion nationally for high-speed rail and intercity rail grants to be administered by the FRA. The TJPA applied for $400 million in high-speed and intercity passenger rail funds for the train box. On January 28, 2010, Transportation Secretary LaHood announced his intent to allocate $400 million for the train box in the Transit Center. In a March 29, 2010, letter to the TJPA, USDOT confirmed that it has reserved $400 million within the overall California allocation of the Department’s High Speed Rail grants to provide funding for the train box (Exhibit 6b). Since that time, the TJPA has been working with the FRA to develop a grant agreement.
TRANSBAY PROGRAM 2004 EIS REEVALUATION
May 2010 Page 44 of 49
4. Level of Detail, Certainty, and Revenue Commitments
Large capital projects are developed in several distinct design stages, with increasing levels of detail produced in each stage. The greater the level of detail, the more certain the program costs. Typically, the level of certainty in the Transbay Program’s financial plan increases along with the level of certainty in the design stages. Although the Transbay Program is not participating in the FTA Section 5309 New Starts process, the FTA method for evaluating financial feasibility can be applied to other large capital projects such as this, in order to assess the relative stability and reliability of the capital funding sources. Using the FTA method for determining the status of revenue commitments, the Transbay Program financial plan has a high level of certainty. As shown in Table 15, approximately 22% of the identified funding for Phase 1 (Transit Center building, including train box) has been received, and 78% is committed. As funding commitments occur periodically, the information in the tables is accurate as of the publication of this report in April 2010. For the Phase 1 (Transit Center building, including train box) funding plan, 100% of the revenue has been received or requested, or is committed. According to the FTA’s New Starts evaluation procedures, the level of commitment for the TJPA’s financial plan for Phase 1 would receive a “high” rating, the best possible score, for having “100% of Non-Section 5309 New Starts Funds… committed or budgeted.”18
18 FTA, Office of Planning and Environment, “Guidelines and Standards for Assessing Local Financial Commitment,” June
2007, p. 8.
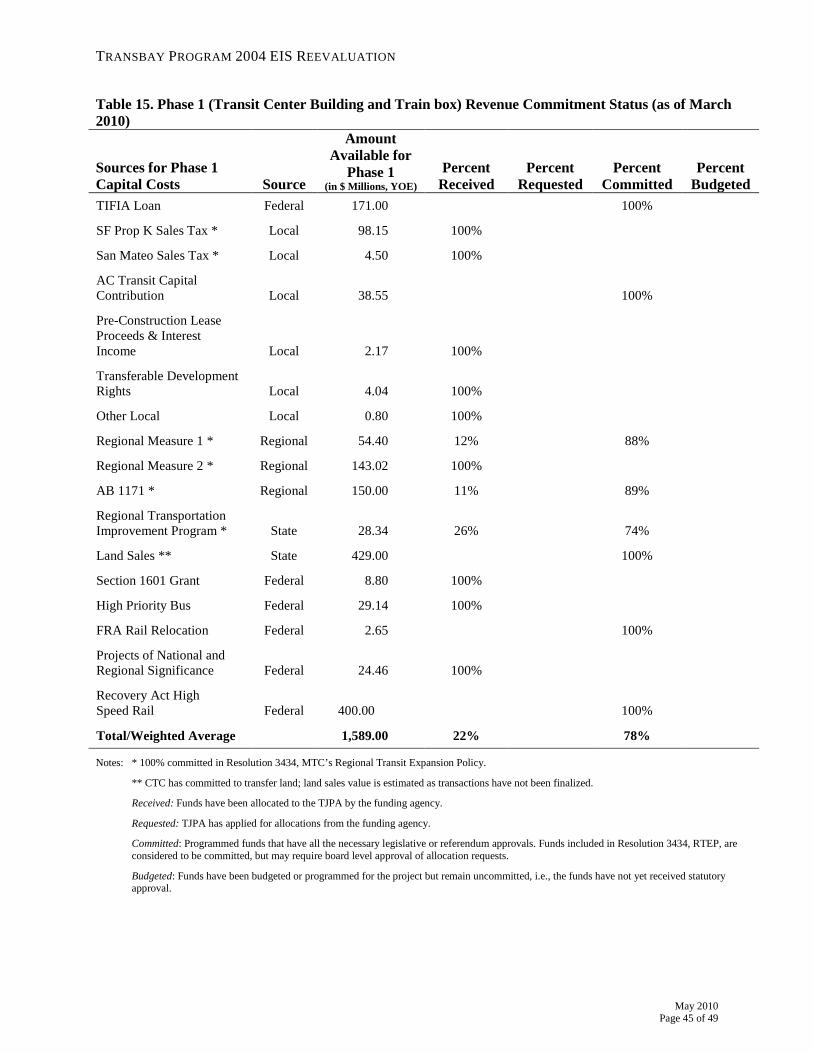
TRANSBAY PROGRAM 2004 EIS REEVALUATION
May 2010
Page 45 of 49
Table 15. Phase 1 (Transit Center Building and Train box) Revenue Commitment Status (as of March 2010)
Sources for Phase 1 Capital Costs Source
Amount Available for
Phase 1 (in $ Millions, YOE)
Percent Received
Percent Requested
Percent Committed
Percent Budgeted
TIFIA Loan Federal 171.00 100%
SF Prop K Sales Tax * Local 98.15 100%
San Mateo Sales Tax * Local 4.50 100%
AC Transit Capital Contribution Local 38.55 100%
Pre-Construction Lease Proceeds & Interest Income Local 2.17 100%
Transferable Development Rights Local 4.04 100%
Other Local Local 0.80 100%
Regional Measure 1 * Regional 54.40 12% 88%
Regional Measure 2 * Regional 143.02 100%
AB 1171 * Regional 150.00 11% 89%
Regional Transportation Improvement Program * State 28.34 26% 74%
Land Sales ** State 429.00 100%
Section 1601 Grant Federal 8.80 100%
High Priority Bus Federal 29.14 100%
FRA Rail Relocation Federal 2.65 100%
Projects of National and Regional Significance Federal 24.46 100%
Recovery Act High Speed Rail Federal 400.00 100%
Total/Weighted Average 1,589.00 22% 78%
Notes: * 100% committed in Resolution 3434, MTC’s Regional Transit Expansion Policy.
** CTC has committed to transfer land; land sales value is estimated as transactions have not been finalized.
Received: Funds have been allocated to the TJPA by the funding agency.
Requested: TJPA has applied for allocations from the funding agency.
Committed: Programmed funds that have all the necessary legislative or referendum approvals. Funds included in Resolution 3434, RTEP, are considered to be committed, but may require board level approval of allocation requests.
Budgeted: Funds have been budgeted or programmed for the project but remain uncommitted, i.e., the funds have not yet received statutory approval.
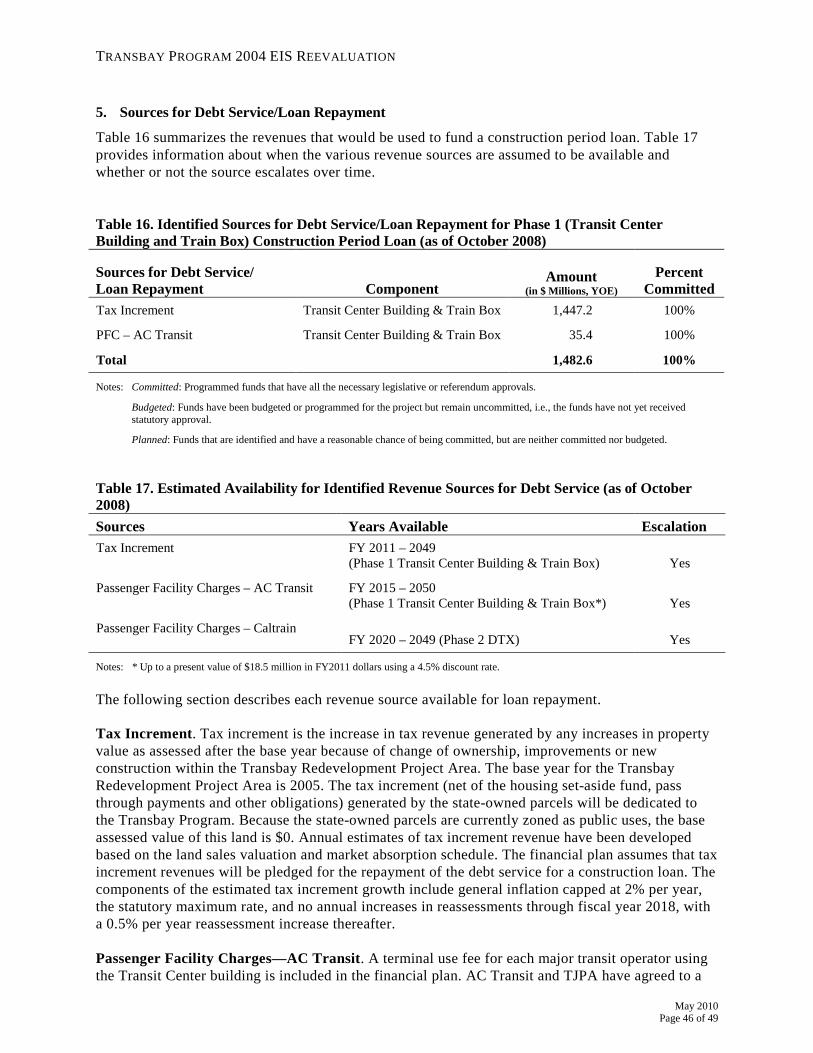
TRANSBAY PROGRAM 2004 EIS REEVALUATION
May 2010 Page 46 of 49
5. Sources for Debt Service/Loan Repayment
Table 16 summarizes the revenues that would be used to fund a construction period loan. Table 17 provides information about when the various revenue sources are assumed to be available and whether or not the source escalates over time. Table 16. Identified Sources for Debt Service/Loan Repayment for Phase 1 (Transit Center Building and Train Box) Construction Period Loan (as of October 2008)
Sources for Debt Service/ Loan Repayment Component
Amount (in $ Millions, YOE)
Percent Committed
Tax Increment Transit Center Building & Train Box 1,447.2 100%
PFC – AC Transit Transit Center Building & Train Box 35.4 100%
Total 1,482.6 100%
Notes: Committed: Programmed funds that have all the necessary legislative or referendum approvals.
Budgeted: Funds have been budgeted or programmed for the project but remain uncommitted, i.e., the funds have not yet received statutory approval.
Planned: Funds that are identified and have a reasonable chance of being committed, but are neither committed nor budgeted. Table 17. Estimated Availability for Identified Revenue Sources for Debt Service (as of October 2008) Sources Years Available Escalation Tax Increment FY 2011 – 2049
(Phase 1 Transit Center Building & Train Box) Yes
Passenger Facility Charges – AC Transit FY 2015 – 2050 (Phase 1 Transit Center Building & Train Box*) Yes
Passenger Facility Charges – Caltrain FY 2020 – 2049 (Phase 2 DTX) Yes
Notes: * Up to a present value of $18.5 million in FY2011 dollars using a 4.5% discount rate. The following section describes each revenue source available for loan repayment. Tax Increment. Tax increment is the increase in tax revenue generated by any increases in property value as assessed after the base year because of change of ownership, improvements or new construction within the Transbay Redevelopment Project Area. The base year for the Transbay Redevelopment Project Area is 2005. The tax increment (net of the housing set-aside fund, pass through payments and other obligations) generated by the state-owned parcels will be dedicated to the Transbay Program. Because the state-owned parcels are currently zoned as public uses, the base assessed value of this land is $0. Annual estimates of tax increment revenue have been developed based on the land sales valuation and market absorption schedule. The financial plan assumes that tax increment revenues will be pledged for the repayment of the debt service for a construction loan. The components of the estimated tax increment growth include general inflation capped at 2% per year, the statutory maximum rate, and no annual increases in reassessments through fiscal year 2018, with a 0.5% per year reassessment increase thereafter. Passenger Facility Charges—AC Transit. A terminal use fee for each major transit operator using the Transit Center building is included in the financial plan. AC Transit and TJPA have agreed to a
TRANSBAY PROGRAM 2004 EIS REEVALUATION
May 2010
Page 47 of 49
payment plan, included in the Lease and Use Agreement. The agreement allows AC Transit to meet its capital obligation through the payment of up-front capital contributions, through annual payments of PFCs, or through a combination of up-front and annual contributions. The total obligation is $57 million in 2011 dollars. For financial planning purposes and as contemplated in the agreement, this contribution has been calculated as a terminal use fee or PFC. AC Transit has proposed a PFC of $.25 per trip, to be increased by $.05 every three years, until AC Transit’s total capital contribution is paid. The PFC has been included in the ridership model conducted for the 2004 EIS. In November 2007, Cambridge Systematics, Inc., updated the regional transit ridership model to better estimate future bus ridership to the Transit Center. The financial plan assumes that PFC or other revenues would be collected by AC Transit when the Transit Center opens. This revenue stream will be used to partially repay the debt service for a construction loan for Phase 1. Passenger Facility Charges—Caltrain. As with AC Transit, the financial plan includes a contribution from Caltrain calculated as a fee assessed to each passenger using the Transit Center building. This revenue source requires a commitment by the Caltrain board of directors. The calculation is based on a per Caltrain passenger fee of $.75 in fiscal year 2001 dollars; the financial plan assumes the PFCs would escalate at 3% per year. The PFC has been included in the ridership modeling exercise conducted for the 2004 EIS. The financial plan assumes that PFC or other revenues would be used to partially repay the debt service for a construction loan for Phase 2, the DTX.
6. Contingencies/Funding Shortfalls
The TJPA continues to seek cost savings and new revenue sources for both phases of the Transbay Program. New sources or increased revenues that could be realized after the construction of Phase 1 would be applied to Phase 2. Some of the options currently under consideration include the following:
• federal Stimulus Recovery Act grants, including Urban Circulator funds;
• statewide bond proceeds, including Prop 1B (Highway Safety, Traffic Reduction, Air Quality, and Port Security), Prop 1C (Housing and Emergency Shelter Trust Fund), and High Speed Rail bonds;
• real estate-based revenues including Mello-Roos District fees or transportation impact fees;
• advancing land sales revenues from Phase 2 (DTX) to Phase 1 (Transit Center building, including train box);
• revenue sharing with Caltrain from projected ridership increases;
• advocacy for new regional and statewide revenue sources through MTC’s Resolution 3434, such as bridge toll revenues, regional gas taxes, state revenue restructuring and potential increases, VMT pricing, and congestion pricing;
• funds from federal transportation bill reauthorization;
• private partnerships including options such as naming rights and annuities;
• further phasing of Transbay Program to advance Phase 2 (DTX) elements to reduce impacts of cost escalation;
• Federal Passenger Rail Investment and Improvement Act grants; and
• California Prop 1A high-speed rail bonds.
TRANSBAY PROGRAM 2004 EIS REEVALUATION
May 2010 Page 48 of 49
The TJPA will continue to seek new funding, secure identified sources, and reduce Program costs throughout the planning process.
E. Operating Plan
1. Transit Center Operating and Maintenance Plan
The new Transit Center would feature a number of design elements to reduce maintenance requirements and operating costs. For example, the new Transit Center will take advantage of natural daylight to offset the need for electric lighting during daylight hours while light columns will bring natural light into the internal areas of the station. In September 2008, the TJPA and AC Transit entered into a Lease and Use Agreement for the Transit Center. At the time of the agreement, the estimated annual operating and maintenance costs for the Transit Center were approximately $6 million (in 2007 dollars). Updates to the cost estimates are on-going. The TJPA has identified several sources of revenue to fund the Transit Center operations and maintenance costs. Ongoing revenues are anticipated from commercial leases in the Transit Center. The TJPA is working with retail consultants to determine an appropriate mix of retail that is viable, contributes to operational revenues, and effectively co-exists with transit operations. RM 2 includes a commitment of $3 million per year (escalated at 3.5% per year, starting on July 1, 2004) of bridge toll funds to be used as operating and maintenance assistance for the new facility. Under the terms of the Lease and Use Agreement, transit operators (tenants) will be responsible to fund the net operating and maintenance costs.
2. Transit Service Providers Operating and Maintenance
Bus and rail transit service operating costs and revenues are not included in the Transbay financial plan. Individual operators using the Transit Center will continue to have jurisdiction over their operations and maintenance programs and revenues. However, this section provides a brief overview of the anticipated changes to operating costs attributable to the Transbay Program. It is anticipated that changes to AC Transit’s operating costs (aside from the lease payments due under the Lease and Use Agreement) will be negligible, as the new Transit Center bus station will be built on the same site as the current Transbay Terminal. As stated in the 2004 EIS, moving the Caltrain terminal from Fourth and King streets to the Transit Center, a distance of 1.3 miles, would have a modest effect on the total annual operating costs of Caltrain service. The projected increase in train operating costs is expected to be funded by fare revenues from increased Caltrain ridership. The 2008 Bay Area to Central Valley EIR/EIS reports that “the 4th and King terminal station would attract about 1 million fewer annual passengers (about 3%) than the Transit Center (including long-distance commuter passengers) and would have $19 million less revenue (0.6% less).”19
19 California High Speed Rail Authority, 2008 Bay Area to Central Valley EIR/EIS, page 7-141.
Thus, HST service along the DTX alignment from Fourth and King to the Transit Center would generate $19 million in annual revenue. The incremental cost of operations is anticipated to be significantly less than $19 million per year.
TRANSBAY PROGRAM 2004 EIS REEVALUATION
May 2010
Page 49 of 49
V. FRA AS A SIGNATORY TO SECTION 106 MOA
Federal Railroad Administration (“FRA”) intends to become a signatory to the Section 106 Memorandum of Agreement between the Federal Transit Administration and the California State Historic Preservation Officer Regarding the Transbay Terminal/Caltrain Downtown Extension/Redevelopment Project in San Francisco County, California (“MOA”). On March 30, 2010, a letter of formal notice of FRA’s request to be added as a signatory was sent by the Transbay Joint Powers Authority (“TJPA”) to the State Historic Preservation Officer (“SHPO”). An amendment to the MOA adding FRA as a signatory will be developed with the signatories to the MOA (SHPO and Federal Transit Administration).
VI. CONCLUSION
This Reevaluation considers the previously conducted environmental review for the Transbay Transit Center train box, and concludes that there have been no changes to the proposed action that would result in significant environmental impacts that were not previously evaluated in the 2004 EIS, and no new information or circumstances relevant to environmental concerns and bearing on the proposed action or its impacts that would result in significant environmental impacts not previously evaluated in the 2004 EIS. Based on this conclusion, and because the Transbay Program as described in the 2004 EIS, including the mitigation measures identified therein, satisfied the requirements of NEPA, and the actions covered by the 2004 EIS and the proposed action are substantially the same, it is appropriate for the FRA to adopt the 2004 EIS as updated by this Reevaluation.