Embed Size (px)
Citation preview

The use of integrated environmental assessment tools for improved MEA implementation
Achieving National and Sectoral Development Priorities
TRAINING MODULE
The use of IEA tools for improved MEA implementation
IEA Module
Achieving National and Sectoral Development Priorities: Using integrated environmental assessment tools for improved MEA implementation
List of Authors:Darren Swanson, IISDLivia Bizikova, IISDChris Corbin, UNEPLaszlo Pinter, IISD Andrea Sabelli, UNEPGraciela Metternicht, UNEPAnya Thomas, CARICOM SecretariatAndrea Salinas, UNEPThérèse Yarde, CARICOM Secretariat
Published November 2011Revised March 2013

The use of IEA tools for improved MEA implementation
AcknowledgementsFunding for the development and pilot testing of this training module was provided by the Caribbean Community (CARICOM), the United Nations Environment Programme–Regional Office for Latin America and the Caribbean (UNEP-ROLAC), and the Global Environment Facility Integrating Watershed and Coastal Area Management (GEF IWCAM) project. Financial assistance was provided by the European Union through a joint EU-UNEP-CARICOM project. The views expressed in this publication do not necessarily reflect the opinion of the European Commission.
We are grateful to the following policy-makers and experts in the Caribbean for their participation and suggestions during the interview series: Keith Nichols and Peter Murray (Secretariat of the Organisation of Eastern Caribbean States, OECS), George James (St. Lucia), Dr. David Persaud (Trinidad and Tobago), Gordon Bispham (Barbados). Samuel Carrette (Dominica), Diane Black Layne (Antigua and Barbuda), Philip Weech (Bahamas), John Wilson (Barbados), Mr. Edmund Jackson (St. Vincent and the Grenadines), Dr. Indarjit Ramdass (Guyana), Damian Fernandes (Guyana), Sharifah Razack (Guyana) and Geeta Singh (Guyana).
Valuable input and examples for this module were also provided by the workshop participants in Paramaribo, Suriname (March 29–April 1, 2011): Jason Williams (Antigua & Barbuda), Lisa Benjamin (The Bahamas), Lisa Sandiford-Cupid (Barbados), Kareem Sabir (Barbados), Travis Sinckler (Barbados), Leo Brewster (Barbados), Steve Devonish (Barbados), Henry Sanchez (Belize), Samuel Carrette (Dominica), Christopher Joseph (Grenada), Damian Fernandes (Guyana), Joseph Ronald Toussaint (Haiti), Jerome Smith (Jamaica), Michelle Rene Walters (St Kitts and Nevis), Laverne Walker (St Lucia), David Latchman (St Vincent & the Grenadines), Ivette Patterzon (Suriname), Estrella Kromodihardjo (Suriname), Nancy Wijngaarde (Suriname), Nataly Plet (Suriname), Henna Uiterloo (Suriname), Sindy Singh (Trinidad and Tobago), Lourdes Coya de la Fuente (Cuba), Daniel Encarnación (Dominican Republic), Joan John-Norville (Secretariat of the Organisation of Eastern Caribbean States, OECS), Calvin James (Caribbean Network for Integrated Rural Development, CNIRD), Christopher Roberts (Caribbean Environmental Health Institute, CEHI), Mahlet Teshome Kebede (African Union Commission AUC).
Finally, we wish to thank Garfield Barnwell, Anya Thomas, Shunae Samuels, Dorrett Campbell, and Thérèse Yarde of the CARICOM Secretariat, Graciela Metternicht, Andrea Salinas and Andrea Sabelli of UNEP-ROLAC, Chris Corbin from UNEP CEP and Vincent Sweeney representing the GEF IWCAM Project for their valuable input to this training module.

The use of IEA tools for improved MEA implementation
List of contents List of Acronyms
Overview
Course Materials 11. Introduction 1
1.1 Challenges for MEA Implementation 1
1.2 The Global Environment Outlook (GEO) Context 2
1.3 Learning Objectives 5
2.1 Step 1: Clarify focal MEAs, implementation status and linkage with development priorities 6
2.1.1 Introduction to MEAs 6
2.1.2 Tool #1: MEA Priorities Mapping 12
2.2 Step 2: Identifying synergies among MEAs using IEA tools 19
2.2.1 Introduction to the DPSIR Analytical Framework 19
2.2.2 Tool #2: MEA Synergies Mapping 24
2.3 Step 3: Envisioning desired future MEA outcomes 28
2.3.1 Introduction to Backcasting 28
2.3.2 Progress Indicators and Target Setting 29
2.3.3 Tool #3: The Challenge Scenario 33
2.4 Step 4: Identifying a portfolio of policies for achieving future MEA outcomes 34
2.4.1 What are Policies? 34
2.4.2 Introduction to Adaptive Policy-making 40
2.4.2 Tool #4: Policy Mapping 42
2.5 Step 5: Assessing risks, opportunities and adaptations 45
2.5.1 Introduction to Risk and Opportunities Analysis 45
2.5.2 Tool #5: Rapid MEA Stress Testing 47
2.6: Step 6: Preparing the MEA policy planning brief 53
References 60
Appendix 62Appendix A: Indicators and Targets for Planetary Boundaries 64Appendix B: Principles of Adaptive Policy-making 67Appendix C: Illustrative Agenda 69

The use of IEA tools for improved MEA implementation
List of AcronymsAIA Advance informed agreement
AUC African Union Commission
CARICOM Caribbean Community
CBD Convention on Biological Biodiversity
CEHI Caribbean Environmental Health Institute
CIAT International Center for Tropical Agriculture
CNIRD Caribbean Network for Integrated Rural Development
DPSIR Drivers Pressures State Impact Responses
EEA The European Environmental agency
GEF Global Environment Facility
GEO Global Environmental Outlook
IEA Integrated Environmental Assessment
IISD International Institute for Sustainable Development
IPCC The Intergovernmental Panel on Climate Change
IWCAM Integrating Watershed & Coastal Areas Management
LBS Protocol Concerning Pollution From Land-Based Sources And Activities To The Cartagena Convention For The Protection And Development Of The Marine Environment Of The Wider Caribbean Region
LMO Living modified organisms
MEA Multilateral Environmental Agreements
MPA Marine Protected Area
OECS High Commission of the Organisation of Eastern Caribbean States
SIDS Small Island Developing States
SPAW Protocol Concerning Specially Protected Areas And Wildlife To The Convention For The Protection And Development Of The Marine Environment Of The Wider Caribbean Region
UNDP United Nations Development Programme
UNEP United Nations Environment Programme
UNEP CEP UNEP’s Caribbean Environment Progamme
UNEP ROLAC UNEP’s Regional Office for Latin America and the Caribbean
UNFCCC United Nations Framework Convention on Climate Change
UNITAR United Nations Institute for Training and Research

The use of IEA tools for improved MEA implementation
OverviewOver the last decade governments around the world have come under pressure to tackle a growing array of environmental sustainability risks and manage the flow of ecosystem goods and services. Recognizing the need for coordinated action, governments have negotiated and entered into many multilateral environmental agreements (MEAs) that often include concrete commitments. Based on available evidence on environmental trends and conditions, there is clearly a gap between MEA commitments and action (Victor et al., 1998). The lack of effective action is clearly unsustainable and, besides raising questions about accountability, it also contributes to growing economic and human risks and costs of environmental degradation.
Experts across the Caribbean had the following to say regarding challenges in national-level MEA implementation:
“We need to highlight what the national benefit is of the MEAs. The minister needs to see how and why it is good for the country.”
“What is the national development plan and how does the MEA fit into this. We need to show that the MEA fits into the plan and is not additional work.”
“We need to move beyond the perception that a specific MEA belongs to a single Ministry and is not relevant to others.”
The reasons for the often weak link between MEAs and mainstream development mechanisms are complex. Addressing them requires an integrated approach that must include, as an important component, the assessment of the interrelationships between environmental trends and outcomes and their policy drivers, both from a retrospective and forward-looking perspective. The assessment must cover not only environmental policies, but all relevant policies and policy options that significantly affect environmental outcomes, including as a priority those that are agreed upon in MEAs.
This module is designed to convey innovative integrated environmental assessment (IEA) tools that can generate win-win scenarios for achieving national development priorities in the Caribbean through more effective MEA implementation. Some of the same tools have already been used in and can build on the experience of those countries of the Caribbean that already have an IEA process in place and have published integrated environmental outlook reports.
The module addresses these challenges through a series of six hands-on working sessions, each representing a critical step in MEA Outcome Planning (Figure 1). Each session features a specific IEA tool that helps to more cogently demonstrate the relevance of the MEA to national and sectoral development priorities and the important synergies among MEAs. The sessions and featured tools include:
1. Clarify Focal MEAs, Status and Linkages with Development Priorities—This session features an MEA Priorities Mapping Tool designed to help demonstrate the relevance of an MEA to national development priorities by identifying the ecosystem services supported by the MEA and exploring how each of these services advances human well-being.
2. Identify Synergies Among Focal MEAs—This session features an MEA Synergies Mapping Tool designed to help illustrate the commonalities among the various MEAs that have been ratified by a country, and thus increase the efficiency of implementation efforts. This tool utilizes the Driving Forces-Pressure-State-Impact-Response (DPSIR) analysis framework to obtain a better systems and comprehensive view of an MEA.

The use of IEA tools for improved MEA implementation
3. Envision Desired Future Outcomes—This session uses insights gleaned from the first two sessions to provide guidance for identifying key progress indicators and targets related to future MEA outcomes. It sets an MEA Challenge Scenario for the future, recognizing the synergies among MEAs and their relevance to national development priorities.
4. Identify a Portfolio of MEA Policies for Achieving Future Outcomes—This session features a Policy Mapping Tool that uses the DPSIR analysis framework to inventory the key policy options in support of a specific MEA, identify major gaps, and make recommendations for achieving the desired future MEA outcomes.
5. Assess Risks and Opportunities and Improve and Adapt as Necessary—This session features a Policy Stress Testing Tool to help identify the MEA implementation risks and opportunities under different plausible future scenarios.
6. Prepare MEA Policy Planning Brief—This session helps workshop participants compile all of their results from the workshop into an MEA Policy Brief designed to help politicians and policy-makers understand, with supporting evidence, the importance of successful MEA implementation for advancing national development priorities.
Figure 1. Steps in MEA outcome planning
The workshop and module development was funded by the Caribbean Community (CARICOM) with financial assistance from the European Union, by the United Nations Environment Programme (UNEP)-Regional Office for Latin America and the Caribbean, and by UNEP’s GEF-IWCAM Project.

1
The use of IEA tools for improved MEA implementation
Course Materials1. IntroductionNoting the persistent gap between the need, availability and systematic use of scientifically credible, policy relevant information in policy-making, UNEP’s Governing Council through the Bali Strategic Plan for Technology Support and Capacity-building recognized the priority of capacity building for integrated environmental assessment (IEA) and reporting at global and the sub-global levels.1 In collaboration with the International Institute for Sustainable Development (IISD) and other partners, UNEP has developed and deployed an extensive set of IEA capacity development materials that have contributed over time to a growing number of institutionalized IEA processes and reports.2
Recognizing the fit between the need for strengthening Multilateral Environmental Agreement (MEA) implementation on the one hand and the availability of strategic guidance in MEAs and related capacity building on the other, the Caribbean Community (CARICOM) Secretariat and UNEP’s Regional Office for Latin America and the Caribbean (UNEP ROLAC) has initiated the development and deployment of this capacity-building effort targeting senior level national policymakers.
1.1 Challenges for MEA Implementation
In preparing this training module, experts from across the Caribbean were contacted and asked a series of questions to better understand the challenges related to MEA implementation and the use of IEA information in policy design. The expert responses illuminated three core challenges.
“We need to highlight what the national benefit is of the MEAs. The minister needs to see how and why it is good for the country.”
“What is the national development plan and how does the MEA fit into this. We need to show that the MEA fits into the plan and is not additional work.”
“The tendency is not to take on a specific MEA and due to a perception that it belongs to a single Ministry and not relevant to others.”
Challenge #1: Clarifying the vertical relevance of MEAs. The large number of MEAs to be implemented, in contrast to the limited human resource capacity in a country, points to the importance of clarifying the relevance of MEAs to national development priorities. Furthermore, MEAs tend to fall under the responsibility of environment departments from the political and governance point of view, but these departments are often under-resourced and too weak to deal with a large number of agreements that also span the mandate of other ministries. Addressing this challenge would require wider collaboration across a range of ministries. IEA information, approaches and tools can play a significant role here by clarifying how environmental improvements are related to advancing various aspects of human well-being as related to national development priorities.
Challenge #2: Clarifying the horizontal relevance of MEAs. In most instances an MEA is seen as only being relevant to a single ministry, and there is consequently little collaboration or complementary financial and human resources capacity brought to bear on MEA implementation. Successfully addressing this challenge requires identifying and communicating the importance of an MEA to various line ministries and departments. IEA information, approaches and tools can help address
1 http://www.unep.org/dec/docs/Bali.Strategic.Plan.pdf2 http://www.unep.org/ieacp/iea/

2
The use of IEA tools for improved MEA implementation
this challenge through integrated analysis of environmental Drivers, Pressures, States, Impacts and Responses—the DPSIR framework often used in Global Environmental Outlook (GEO’s) IEA reporting processes.
Challenge #3: Funding. This was identified as a major barrier to MEA implementation. Specifically, there is a lack of funding to assemble the necessary human resources required for addressing different MEAs. IEA information, approaches and tools can play an important role here in the same functionality as described for MEA Challenges #1 and #2 i.e., clarifying vertical and horizontal linkages for MEA implementation would inherently result in additional personnel, budgeting resources and in more efficient use of existing resources.
Discussion Questions
1. Can you relate to the above challenges? Elaborate on your experience.
2. Have you experienced other challenges in relation to implementing MEAs in your country?
1.2 The Global Environment Outlook (GEO) Context
Assessing and reporting on the state of the environment is a fundamental mandate of the United Nations Environment Programme (UNEP). The Global Environment Outlook (GEO) process emerged out of this mandate. It is a consultative, participatory process with a strong element of capacity-building for IEA aimed at strengthening the interaction between science, policy and decision-making.
Since the first GEO process began in 1995, the IEA methodology has been expanded, refined and applied to a wide range of contexts and to different scales resulting in a large number of global and sub-global assessment reports. Each of these has its own purpose, process and identity but it is unified by the participatory and consultative characteristics of the GEO approach, a focus on policy-maker needs, and options for action in each report.
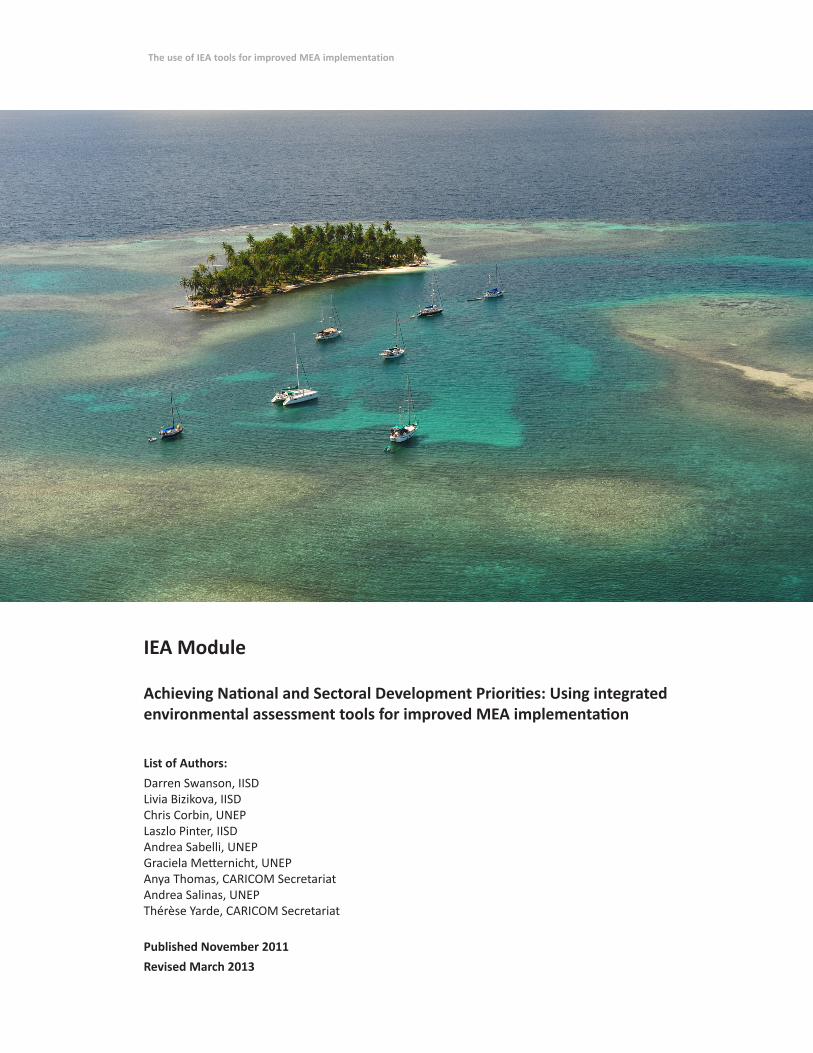
All GEO reports aim at answering the following fundamental questions, each defining a step in the overall IEA process.
3
The use of IEA tools for improved MEA implementation
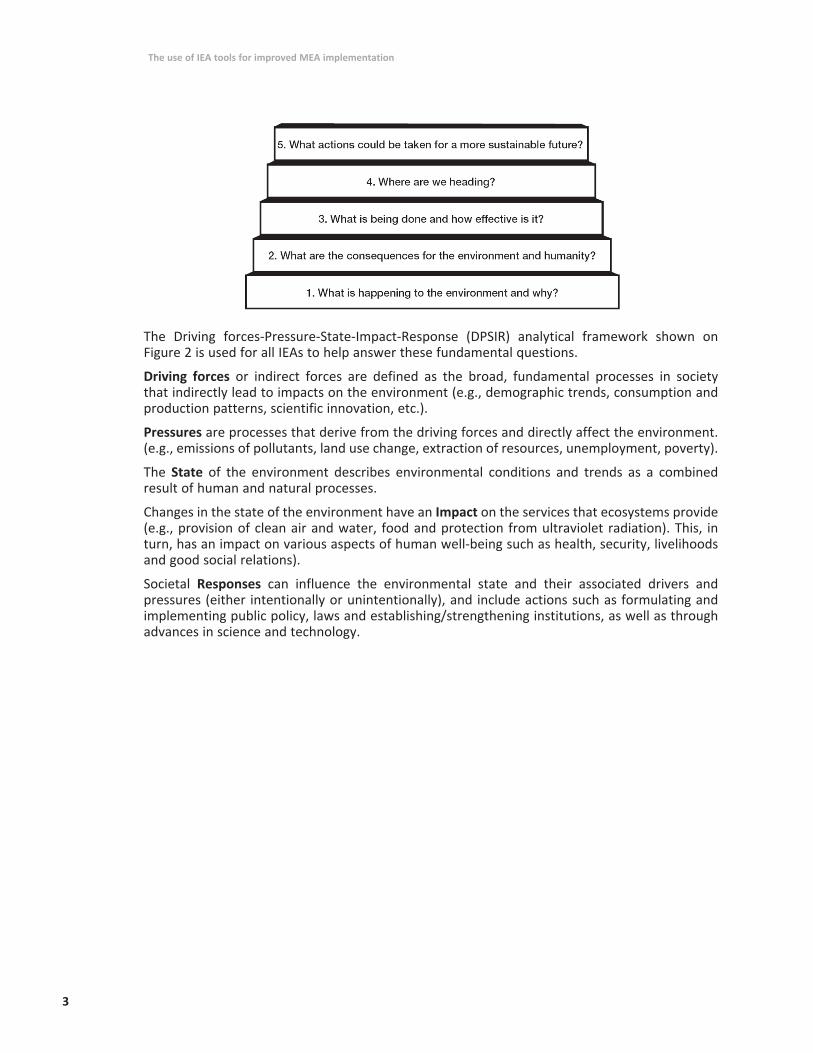
The Driving forces-Pressure-State-Impact-Response (DPSIR) analytical framework shown on Figure 2 is used for all IEAs to help answer these fundamental questions.
Driving forces or indirect forces are defined as the broad, fundamental processes in society that indirectly lead to impacts on the environment (e.g., demographic trends, consumption and production patterns, scientific innovation, etc.).
Pressures are processes that derive from the driving forces and directly affect the environment. (e.g., emissions of pollutants, land use change, extraction of resources, unemployment, poverty).
The State of the environment describes environmental conditions and trends as a combined result of human and natural processes.
Changes in the state of the environment have an Impact on the services that ecosystems provide (e.g., provision of clean air and water, food and protection from ultraviolet radiation). This, in turn, has an impact on various aspects of human well-being such as health, security, livelihoods and good social relations).
Societal Responses can influence the environmental state and their associated drivers and pressures (either intentionally or unintentionally), and include actions such as formulating and implementing public policy, laws and establishing/strengthening institutions, as well as through advances in science and technology.
4
The use of IEA tools for improved MEA implementation
Figure 2. The DPSIR framework developed for GEO-4. Arrows indicate the general cause-and-effect relations among the framework’s components (UNEP 2007)
The Latin America and Caribbean (LAC) region has been a pioneer in the use of the IEA methodology and adapting it to different scales. At present, a number of reports exist in LAC produced using the IEA methodology that range from regional to urban scale. They are all available at UNEP LAC’s regional website: http://www.pnuma.org/deat1/publicaciones.html, including:

5
The use of IEA tools for improved MEA implementation
GEO LAC Report (2010) http://www.unep.org/publications/contents/title_search.asp?search=GEO+LAC
Caribbean Environment Outlook (n.d.)
http://www.pnuma.org/deat1/pdf/GEO%20Carribean%20Environment%20Outlook%20Ing%202004.pdf
GEO Health (2009 and 2008) http://www.pnuma.org/deat1/pdf/GEO%20Salud%20INGLES%20final.pdf http://www.pnuma.org/deat1/pdf/GEO%20Health%20Executive%20Summary_FINAL_VE_JULY09.pdf
GEO Youth Caribbean (2008) http://www.pnuma.org/deat1/pdf/geo_Youth_caribbean.pdf
National GEO Reports http://www.pnuma.org/deat1/nacionales.html
Training manuals are also available both in English and Spanish for downloading at the following addresses:
IEA at national scale (2008) http://www.pnuma.org/deat1/pdf/GEORessourceBookcomplete.pdf
IEA at urban scale (n.d.) http://www.pnuma.org/deat1/pdf/Metho_GEOCitiesinddOK.pdf
Climate change vulnerability assessment at national scale (2009)
http://www.unep.org/ieacp/_res/site/file/pdf/ClimateChange_Manual_Final.pdf
Climate change vulnerability assessment at urban scale (2010)
http://www.iisd.org/adaptation/ CC city module final draft 3 Dec 2010.pdf
IEA for youth processes (2004) http://www.pnuma.org/deat1/pdf/ManualdeCapacitacionGeoJuvenil.pdf
Environment and health assessment (2009)
http://www.pnuma.org/deat1/pdf/GEO Salud INGLES final.pdf
For general information about the GEO processes the brochure is available at http://www.unep.org/geo/Docs/GEOProcessBrochure.pdf
1.3 Learning Objectives
This training module is part of an intensive three-day training workshop designed to help senior policy-makers achieve more effective MEA implementation through the use of IEA approaches and tools. Upon completion of this module you will be able to:
n Clarify the linkage of MEAs with other national development priorities;
n Identify synergies among MEAs;
n Envision desired future MEA outcomes and set SMART targets (Specific, Measurable, Achievable, Relevant, Time-bound);
n Identify a portfolio of MEA policies for achieving desired future outcomes;
n Assess risks and identify opportunities and adaptations for MEA policy implementation; and
n Prepare a policy planning brief that encompasses all of the above learnings.

6
The use of IEA tools for improved MEA implementation
This module is organized according to the six steps of MEA Outcome Planning, with each step addressing one of the above learning objectives. Each step introduces a specific tool and provides case studies and exercises for a trained workshop facilitator to guide participants through hands-on experience in using the tools.
2.1 Step 1: Clarify focal MEAs, implementation status and linkage with development priorities
In order to support the implementation of MEAs, this section features an MEA Priorities Mapping Tool designed to help demonstrate the relevance of an MEA to national development priorities by identifying the ecosystem services supported by the MEA and exploring how these services each advance human well-being.
The use of the MEA Priorities Mapping Tool will be demonstrated for the following six MEAs:
n Convention on Biological Diversity (CBD);
n Cartagena Protocol on Biosafety;
n Protocol Concerning Specially Protected Areas And Wildlife To The Convention For The Protection And Development Of The Marine Environment Of The Wider Caribbean Region (SPAW); and
n Protocol Concerning Pollution From Land-Based Sources And Activities To The Cartagena Convention For The Protection And Development Of The Marine Environment Of The Wider Caribbean Region (LBS).
n Convention on International Trade in Endangered Species of Wild Fauna and Flora (CITES)
n The Convention on Wetlands—also called the “Ramsar Convention”
This section begins with an introduction to MEAs, including the six contextual MEAs outlined above, followed by a detailed presentation of the Priorities Mapping Tool, including exercises and discussion questions.
2.1.1 Introduction to MEAs
During the last three decades there have been an increasing number of treaties focusing on global environmental problems. The beginning of MEAs can be tracked back to the first UN Conference on the Human Environment in Stockholm in 1972. This marked the first occasion when state representatives convened to set the groundwork for international action (Gray, 2000). The Stockholm Declaration provided a comprehensive list of norms to “inspire and guide the peoples of the world in the preservation and enhancement of the human environment (UN Conference on Human Environment, 1972).” Subsequently, the international community began to address specific environmental concerns leading to a number of agreements over time.
Currently, there are over 500 MEAs, covering such diverse issues as loss of biological diversity, pollution of the atmosphere, ocean degradation and deforestation (Crossen, 2003). Increasingly, the work in the international environmental field is focused on implementation, more than on the development of landmark agreements. Moreover, it is clear that this work must be ongoing. While we can point to key milestones in signing and ratifying agreements with number of countries, MEAs are rather tools for trying to reduce degradation of environment by managing relationships of people with the environment globally, regional and nationally. To deliver environmental results for the world, we need to continue to focus on effective implementation of existing agreements, as well as to address gaps and promote synergies (UNEP, 2007).

7
The use of IEA tools for improved MEA implementation
Convention on Biological Diversity (CBD)The CBD has three main objectives: 1) the conservation of biological diversity; 2) the sustainable use of the components of biological diversity; and 3) the fair and equitable sharing of the benefits arising out of the utilization of genetic resources. The Convention stresses the finiteness of natural resources and the need for their sustainable management, which will bring significant environmental, economic and social benefits in return. The Convention advocates the use of the precautionary principle, which states that when there is a threat of significant reduction or loss of biological diversity, scientific uncertainty should not be used as a reason for postponing cost-effective measures to prevent environmental degradation. The Convention is legally binding and reminds States of their right to exploit resources, and their responsibility to ensure that activities within their control do not cause damage to another State’s environment.
With regard to national action, governments are required to:
n Develop national biodiversity strategies and plans that are integrated into their broader development plans;
n Identify and monitor biological diversity and processes and activities that may have adverse impacts on it;
n Establish protected areas and sustainable use plans and implement measures for rehabilitation and recovery of threatened species and ecosystems, prevent introduction of harmful pollutants and organisms;
n Respect traditional knowledge on sustainable use of biodiversity;
n Educate and raise public awareness of the importance of biodiversity; and
n Report on progress.
With regard to international action, governments are required to:
n Share best practices and policies;
n Provide financial and technical support to developing countries and support for capacity building and investment in projects to help developing countries meet their commitment under the convention. The Global Environment Facility (GEF) is a financial mechanism to support developing countries;
n Promote the safe transfer and biotechnology through the Biosafety Protocol;
n Share the benefits of genetic resources and recognize national sovereignty over them; and
n Recognize traditional knowledge and the dependence of indigenous people on these resources.
Cartagena Protocol on Biosafety The main objective of the Biosafety Protocol to the Convention on Biological Diversity is to reduce threats to biological diversity posed by the introduction of living modified organisms (LMO), resulting from modern biotechnology, into the environment. In order to meet this objective, the protocol contains regulations on the international trade, handling and use of LMOs that may have harmful effects on the conservation and sustainable use of biodiversity, while also taking into account potential effects on human health. Through the establishment of an advance informed agreement (AIA), exporters of LMOs are required to obtain consent and provide information regarding the LMO to the importing country. The exporter is required to submit a scientific risk assessment to the importing country on which the decision to import the LMO will be made.
8
The use of IEA tools for improved MEA implementation
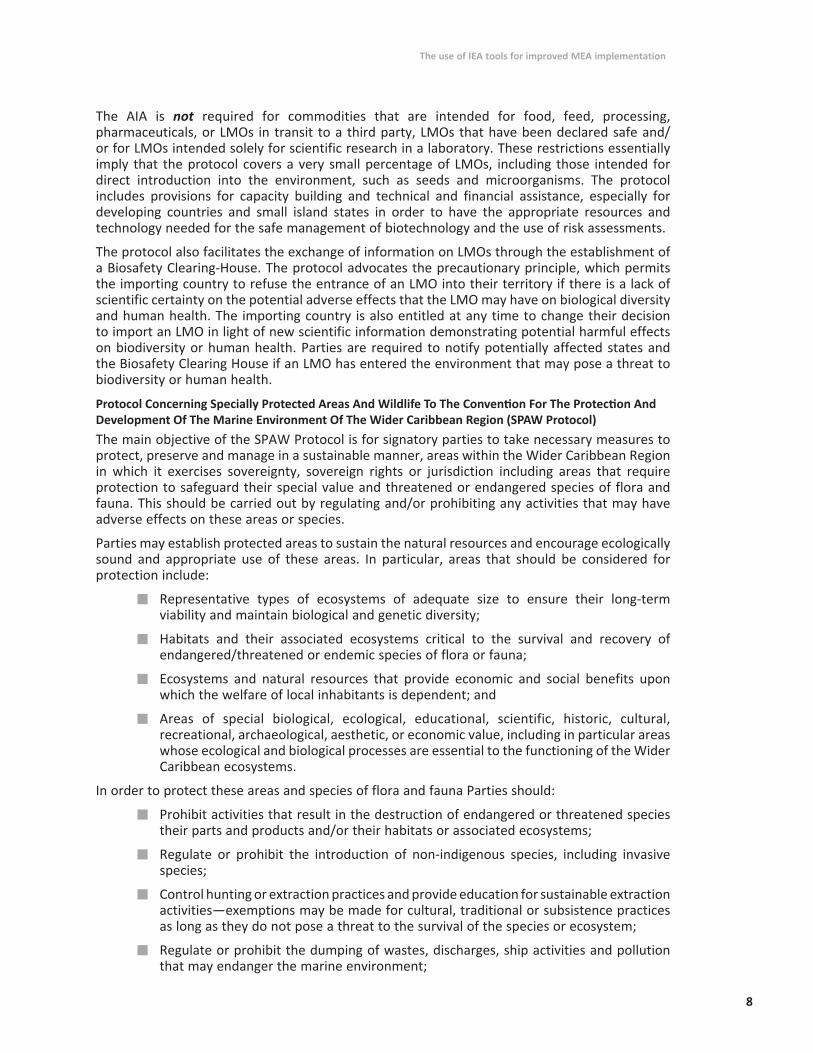
The AIA is not required for commodities that are intended for food, feed, processing, pharmaceuticals, or LMOs in transit to a third party, LMOs that have been declared safe and/or for LMOs intended solely for scientific research in a laboratory. These restrictions essentially imply that the protocol covers a very small percentage of LMOs, including those intended for direct introduction into the environment, such as seeds and microorganisms. The protocol includes provisions for capacity building and technical and financial assistance, especially for developing countries and small island states in order to have the appropriate resources and technology needed for the safe management of biotechnology and the use of risk assessments.
The protocol also facilitates the exchange of information on LMOs through the establishment of a Biosafety Clearing-House. The protocol advocates the precautionary principle, which permits the importing country to refuse the entrance of an LMO into their territory if there is a lack of scientific certainty on the potential adverse effects that the LMO may have on biological diversity and human health. The importing country is also entitled at any time to change their decision to import an LMO in light of new scientific information demonstrating potential harmful effects on biodiversity or human health. Parties are required to notify potentially affected states and the Biosafety Clearing House if an LMO has entered the environment that may pose a threat to biodiversity or human health.
Protocol Concerning Specially Protected Areas And Wildlife To The Convention For The Protection And Development Of The Marine Environment Of The Wider Caribbean Region (SPAW Protocol)The main objective of the SPAW Protocol is for signatory parties to take necessary measures to protect, preserve and manage in a sustainable manner, areas within the Wider Caribbean Region in which it exercises sovereignty, sovereign rights or jurisdiction including areas that require protection to safeguard their special value and threatened or endangered species of flora and fauna. This should be carried out by regulating and/or prohibiting any activities that may have adverse effects on these areas or species.
Parties may establish protected areas to sustain the natural resources and encourage ecologically sound and appropriate use of these areas. In particular, areas that should be considered for protection include:
n Representative types of ecosystems of adequate size to ensure their long-term viability and maintain biological and genetic diversity;
n Habitats and their associated ecosystems critical to the survival and recovery of endangered/threatened or endemic species of flora or fauna;
n Ecosystems and natural resources that provide economic and social benefits upon which the welfare of local inhabitants is dependent; and
n Areas of special biological, ecological, educational, scientific, historic, cultural, recreational, archaeological, aesthetic, or economic value, including in particular areas whose ecological and biological processes are essential to the functioning of the Wider Caribbean ecosystems.
In order to protect these areas and species of flora and fauna Parties should:
n Prohibit activities that result in the destruction of endangered or threatened species their parts and products and/or their habitats or associated ecosystems;
n Regulate or prohibit the introduction of non-indigenous species, including invasive species;
n Control hunting or extraction practices and provide education for sustainable extraction activities—exemptions may be made for cultural, traditional or subsistence practices as long as they do not pose a threat to the survival of the species or ecosystem;
n Regulate or prohibit the dumping of wastes, discharges, ship activities and pollution that may endanger the marine environment;

9
The use of IEA tools for improved MEA implementation
n Regulate or prohibit any activity involving the exploration or exploitation of the seabed or its sub-soil or a modification of the seabed profile which will pose a threat to protected areas, protected species and their habitats;
n Regulate tourist and recreational activities that might endanger protected areas and the survival of threatened or endangered species; and
n Require Environmental Impact Assessments from projects that pose a threat to these habitats and species.
Protocol Concerning Pollution From Land-Based Sources And Activities To The Cartagena Convention For The Protection And Development Of The Marine Environment Of The Wider Caribbean Region (LBS Protocol)The main objective of the LBS protocol is for contracting parties to prevent, reduce and control pollution from land-based sources and activities through the establishment of effluent and emission limits and/or the application of best management practices and most appropriate technologies. These actions should take into account existing national and local social, economic and environmental circumstances. The LBS protocol further promotes the exchange of information on land-based pollution through cooperation by its contracting parties in monitoring and research.
The LBS protocol establishes a set of general and specific obligations for identifying the main land-based point and non-point sources of pollution and proposes actions needed to reduce the impact of these pollutants on the coastal and marine environment.
The initial priority sources of pollutants identified in the LBS Protocol are:
n Domestic Sewage
n Oil refineries
n Sugar factories and distilleries
n Food processing
n Beverage manufacturing
n Pulp and paper manufacturing
n Chemical industries
n Agricultural runoff.
Seventeen specific categories of primary pollutants are identified as hazardous, and limitations on their release are proposed. Among them are organohalogen compounds, lubricating oil, heavy metals and crude petroleum, nitrous and phosphorous compounds, cyanides and detergents. The protocol provides guidelines for parties to consider when evaluating potential pollutants of concern that are not listed in the protocol. Among these recommendations are the pollutants persistency, toxicity, bio-accumulation, radioactivity etc. Finally, specific limitation and timelines to mitigate effluent releases for untreated domestic wastewater are provided. Domestic wastewater was identified as the major point source of pollution while agricultural runoff was identified as the major non-point source of pollution in the Wider Caribbean Region.
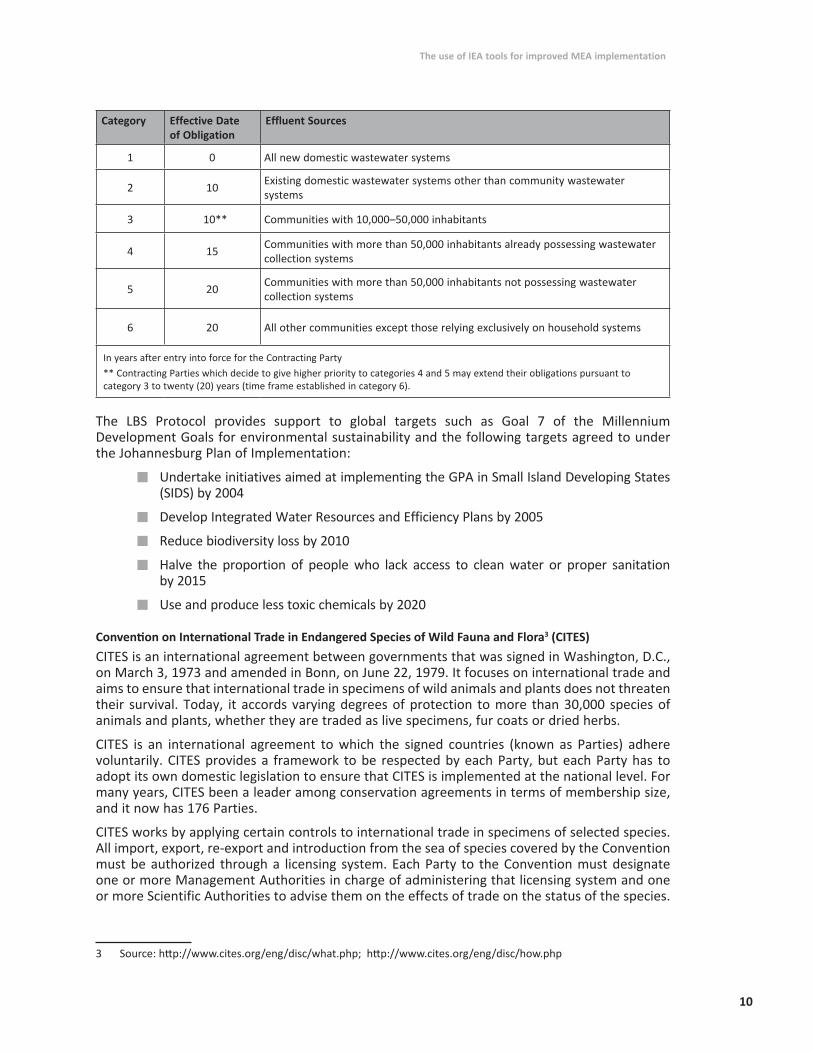
With specific regard to domestic wastewater discharges, the LBS Protocol establishes a system for the classification of receiving waters (Class 1 or Class 2), sets specific limitations on the quality of wastewater effluent releases depending on the water classification and establishes a timeframe for action depending on the population size of the community and/or the wastewater system already in place as presented in the table below.
10
The use of IEA tools for improved MEA implementation
Category Effective Date of Obligation
Effluent Sources
1 0 All new domestic wastewater systems
2 10 Existing domestic wastewater systems other than community wastewater systems
3 10** Communities with 10,000–50,000 inhabitants
4 15 Communities with more than 50,000 inhabitants already possessing wastewater collection systems
5 20 Communities with more than 50,000 inhabitants not possessing wastewater collection systems
6 20 All other communities except those relying exclusively on household systems
In years after entry into force for the Contracting Party** Contracting Parties which decide to give higher priority to categories 4 and 5 may extend their obligations pursuant to category 3 to twenty (20) years (time frame established in category 6).
The LBS Protocol provides support to global targets such as Goal 7 of the Millennium Development Goals for environmental sustainability and the following targets agreed to under the Johannesburg Plan of Implementation:
n Undertake initiatives aimed at implementing the GPA in Small Island Developing States (SIDS) by 2004
n Develop Integrated Water Resources and Efficiency Plans by 2005
n Reduce biodiversity loss by 2010
n Halve the proportion of people who lack access to clean water or proper sanitation by 2015
n Use and produce less toxic chemicals by 2020
Convention on International Trade in Endangered Species of Wild Fauna and Flora3 (CITES) CITES is an international agreement between governments that was signed in Washington, D.C., on March 3, 1973 and amended in Bonn, on June 22, 1979. It focuses on international trade and aims to ensure that international trade in specimens of wild animals and plants does not threaten their survival. Today, it accords varying degrees of protection to more than 30,000 species of animals and plants, whether they are traded as live specimens, fur coats or dried herbs.
CITES is an international agreement to which the signed countries (known as Parties) adhere voluntarily. CITES provides a framework to be respected by each Party, but each Party has to adopt its own domestic legislation to ensure that CITES is implemented at the national level. For many years, CITES been a leader among conservation agreements in terms of membership size, and it now has 176 Parties.
CITES works by applying certain controls to international trade in specimens of selected species. All import, export, re-export and introduction from the sea of species covered by the Convention must be authorized through a licensing system. Each Party to the Convention must designate one or more Management Authorities in charge of administering that licensing system and one or more Scientific Authorities to advise them on the effects of trade on the status of the species.
3 Source: http://www.cites.org/eng/disc/what.php; http://www.cites.org/eng/disc/how.php

11
The use of IEA tools for improved MEA implementation
The species covered by CITES are listed in three Appendices, according to the degree of protection they require:
n Appendix I includes species threatened with extinction. Trade in specimens of these species is permitted only in exceptional circumstances.
n Appendix II includes species not necessarily threatened with extinction, but in which trade must be controlled in order to avoid utilization incompatible with their survival.
n Appendix III contains species that are protected in at least one country, which has asked other CITES Parties for assistance in controlling the trade. Changes to Appendix III follow a distinct procedure from changes to Appendices I and II, as each Party’s is entitled to make unilateral amendments to it.
When a specimen of a CITES-listed species is transferred between a country that is a Party to CITES and a country that is not, the country that is a Party may accept documentation equivalent to the permits and certificates described above.
The Convention on Wetlands of International Importance Especially as Waterfowl Habitat4
The Convention on Wetlands of International Importance (also called the Ramsar Convention) is an intergovernmental treaty that provides the framework for national action and international cooperation for the conservation and wise use of wetlands and their resources. It was adopted in the Iranian city of Ramsar in 1971 and came into force in 1975. This is the only global environmental treaty that deals with a particular ecosystem—wetlands. The Convention’s mission is “the conservation and wise use of all wetlands through local, regional and national actions and international cooperation, as a contribution towards achieving sustainable development throughout the world.”
The Convention uses a broad definition of the types of wetlands covered in its mission, including swamps and marshes, lakes and rivers, wet grasslands and peatlands, oases, estuaries, deltas and tidal flats, near-shore marine areas, mangroves and coral reefs, and human-made sites such as fish ponds, rice paddies, reservoirs, and salt pans.
Wetlands provide fundamental ecological services and are regulators of water regimes and sources of biodiversity at all levels—species, genetic and ecosystem. They are also a rich resource of economic, scientific, cultural, and recreational value for the community. Furthermore, they play a vital role in climate change adaptation and mitigation. The key focus of the convention is the restoration and rehabilitation of wetlands, whenever possible. Furthermore, they should be conserved by ensuring their wise use. The term “wise use” is here understood as the promotion of conservation and the sustainable use of wetlands and their resources for the benefit of humankind.
Under the Convention, the Parties have committed themselves to:
n Working towards the wise use of all their wetlands through national land-use planning, appropriate policies and legislation, management actions, and public education.
n Designating suitable wetlands for the List of Wetlands of International Importance (“Ramsar List”) and ensuring their effective management.
The Conference of the Contracting Parties (COP) meets every three years and promotes policies and guidelines to further the application of the Convention. The Standing Committee, made up of Parties representing the six Ramsar regions of the world, meets annually to guide the Convention between meetings of the COP. The Scientific and Technical Review Panel provides guidance on key issues for the Convention.
4 Adapted from the introductory Ramsar brochure (3rd ed.), 2008. Available athttp://www.ramsar.org/cda/en/ramsar-about-introductory-ramsar/main/ramsar/1-36%5E16849_4000_0__

12
The use of IEA tools for improved MEA implementation
Nationally, each Contracting Party designates an Administrative Authority as its focal point for implementation of the Convention. Countries are encouraged to establish National Wetland Committees involving all government sectors dealing with water resources, development planning, protected areas, biodiversity, tourism, education, development assistance, etc. Participation by NGOs and civil society is also encouraged.
Discussion QuestionsShare an example with your colleagues at your table of how an MEA was demonstrated to be relevant to national and/or sectoral development priorities.
Discuss how environmental data and analysis played a role or could have played a role in strengthening of relevance.
2.1.2 Tool #1: MEA Priorities Mapping
As discussed in section 1, a critical challenge for more effective implementation of MEAs is to be able to clearly demonstrate the importance of a particular MEA to the range of development priorities and objectives in a country. Such a demonstration not only informs Parliament, Cabinet and line departments of the multiple co-benefits inherent in most MEAs (see challenge #1 toward better vertical integration of MEAs), but also provides the information necessary to convince sector ministers and departments that their efforts toward MEA implementation benefits their portfolios (see challenge #2 toward better horizontal integration).
The MEA Priorities Mapping Tool is presented in this section to provide a pragmatic analytical approach for clarifying how MEAs benefit national development priorities. The linkage between an MEA and national development priorities is made using the ecosystem services and human well-being framework advanced by the Millennium Ecosystem Assessment (2003) and GEO-4. The basic idea is that each MEA is designed to bring about an improvement in a particular state of the environment. The positive impact of this improvement is the maintenance of or an increase in the ability of ecosystems to provide certain services both to people and back to the environment, and the benefit to human well-being can be tracked back to specific ecosystem services.
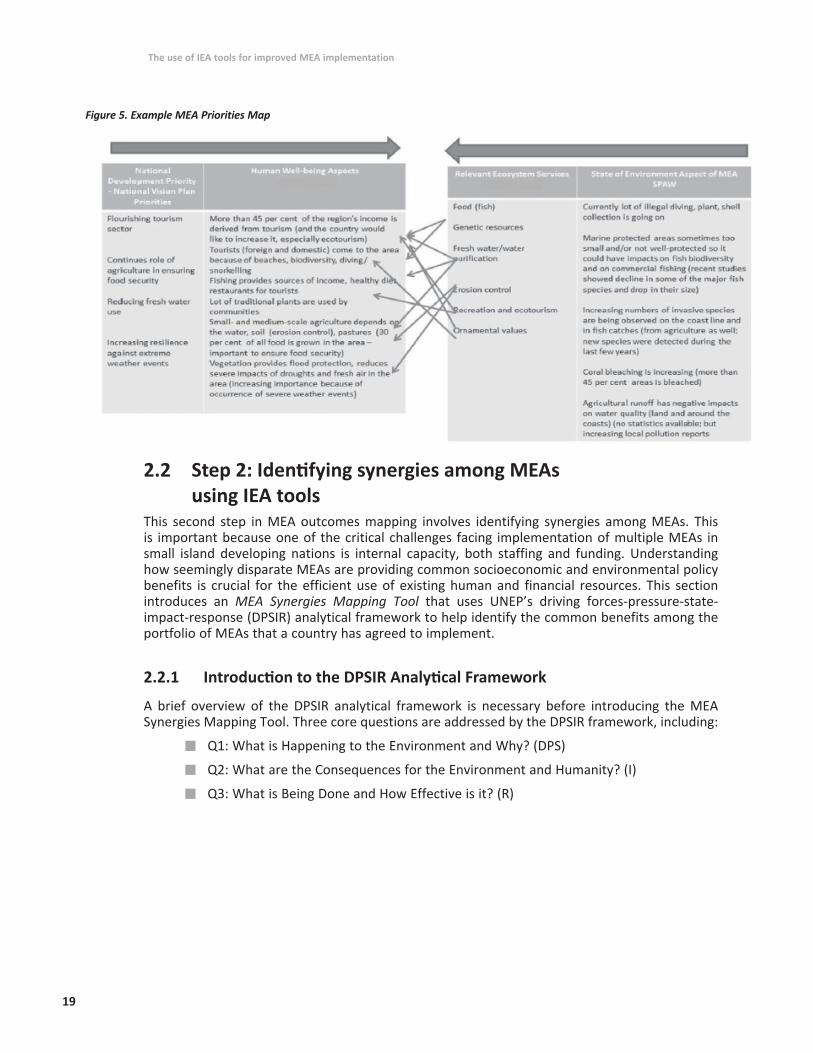
In its basic form the tool is a type of map as illustrated in Figure 3. Starting from the left, a specific national development priority is identified and the aspects of human well-being that the development priority is meant to address are listed. Then, starting from the right, a particular MEA is identified along with the state of the environment the MEA is intended to address. The range of ecosystem services that are impacted by an improvement in this state of the environment are

13
The use of IEA tools for improved MEA implementation
listed. The mapping exercise concludes by drawing linkages and recording rationale for how the individual ecosystem services support the various aspects of human well-being.
Figure 3. The MEA Priorities Mapping Tool
But what are the various types of ecosystem services and what are the different aspects of human well-being? Such guidance is part of the MEA Priorities Mapping Tool and is provided in the paragraphs that follow.
Human well-being is vitally dependent upon improving the management of Earth’s ecosystems to ensure their conservation and sustainable use (UNEP, 2009b). Intact, functioning ecosystems provide services—such as the provision of food, water, fuel and fibre, and climate regulation—on which nations and people rely to earn income from agriculture, fishing, forestry, tourism and other activities. Key types of ecosystem services include (MEA, 2003; UNEP, 2009a):
n Provisioning services are the products people obtain from ecosystems, such as food, fuel, fibre, fresh water and genetic resources.
n Regulating services are the benefits people obtain from the regulation of ecosystem processes, including air quality maintenance, climate regulation, erosion control, regulation of human diseases and water purification.
n Cultural services are the non-material benefits people obtain from ecosystems through spiritual enrichment, cognitive development, reflection, recreation and aesthetic experiences.
n Supporting services are those that are necessary for the production of all other ecosystem services, such as primary production, production of oxygen and soil formation.
Sustainable use of these ecosystem services and natural resource assets is increasingly recognized as a key factor in ensuring economic development and improvement in human welfare, and as a necessary condition for achieving the Millennium Development Goals (UNEP, 2009a). From a
14
The use of IEA tools for improved MEA implementation
country perspective, obligations and provisions agreed to in different MEAs could be directly linked to a status of the environment and thus the quality of ecosystem services, which in turn influences prospects for development. For example, development of tourism is influenced by water quality, status of beaches, biodiversity, overall health of natural parks and the ability of communities and countries to sustain them over time (see Box 1, the case study on Discovery Bay, Jamaica). Therefore, if communities and environmental policy-makers are able to pinpoint the relevance of the MEAs to development goals, there is a greater likelihood of getting the attention of senior decision-makers from a variety of different government departments.
A comprehensive approach to the exploration of linkages between environment and development is presented by the Millennium Ecosystem Assessment conceptual framework (Figure 4, MEA 2003). The Millennium Ecosystem Assessment recognized that human well-being elements are “complex and value-laden,” but that some elements are shared. In one study, people in 23 countries were asked to “reflect, analyze, and express their ideas of the bad and the good life” (Narayan et al. 2002). Among the results of this survey were the importance of secure and adequate livelihoods, cultural and spiritual activities and the ability to provide for their children. Among the five most comment elements as cited in the Millennium Ecosystem Assessment were the following:
1. The necessary material for a good life—including secure and adequate livelihoods, income and assets, enough food at all times, shelter, furniture, clothing, and access to goods.
2. Health—including being strong, feeling well and having a healthy physical environment.3. Good social relations—including social cohesion, mutual respect, good gender and
family relations, and the ability to help others and provide for children.4. Security—including secure access to natural and other resources, safety of person and
possessions, and living in a predictable and controllable environment with security from natural and human-made disasters.
5. Freedom and choice—including having control over what happens and being able to achieve what a person values doing or being.

15
The use of IEA tools for improved MEA implementation
Figure 4. Overview of the Millennium Ecosystem Assessment Framework (MEA 2003)
The Millennium Ecosystem Assessment further elaborates on the aspects of human well-being by describing six categories of “freedom.” These include participative freedom, economic facilities, social opportunities, transparency guarantees, protective security and ecological security. The sixth freedom, ecological security, is the contribution from the Millennium Ecosystem Assessment analysis and is defined as “the minimum level of ecological stock (an ecological safety net), defined by respective communities through an open and participatory process, that is required to provide the supporting services needed to ensure a sustainable flow of provisioning, regulating, and cultural ecosystem services (MEA, 2003).”
Freedoms and Choice
SecuritynAbility to live in an
environmentally clean and safe shelter
nAbility to reduce vulnerability to ecological shocks and stress
Basic Material for a Good LifenAbility to access resources
to earn income and gain livelihood
HealthnAbility to be adequately
nourishednAbility to be free from
avoidable diseasenAbility of have adequate and
clean drinking waternAbility to have clean airnAbility to have energy to keep
warm and cool
Good Social RelationsnOpportunity to express
aesthetic and recreational values associated with ecosystems
nOpportunity to express cultural and spiritual values associated with ecosystems
nOpportunity to observe, study, and learn about ecosystems
Determinants and Constituents of Well-being
Ecosystem Services
Provisioning ServicesProducts obtained from ecosystemsnFoodnFresh waternFuelwoodnFibernBiochemicalnGenetic resources
Regulating ServicesBenefits obtained from regulation of ecosystem processesnClimate regulationnDisease regulationnWater regulationnWater purification
Cultural ServicesNonmaterial benefits obtained from ecosystemsnSpiritual and
religiousnRecreation and
ecotourismnAestheticnInspirationalnEducationalnSense of PlacenCultural heritage
Supporting ServicesServices necessary for the production of all other ecosystem servicesnSocial formationnNutrient cyclingnPrimary
production

16
The use of IEA tools for improved MEA implementation
Table 1. Overview of the ecosystem services and their descriptions (MEA, 2003)Ecosystem Service Description
Provisioning
Food and Fibre This includes the vast range of food products derived from plants, animals, and microbes Fibre Materials such as wood, jute, hemp, silk, and many other products derived from ecosystems.
Fuel Wood, dung, and other biological materials serve as sources of energy.
Genetic Resources This includes the genes and genetic information used for animal and plant breeding and biotechnology.
Biochemicals, Natural Chemicals and Pharmaceuticals
Many medicines, biocides, food additives such as alginates, and biological materials are derived from ecosystems.
Ornamental Resources Animal products, such as skins and shells, and flowers are used as ornaments, although the value of these resources is often culturally determined.
Fresh water Fresh water is another example of linkages between categories—in this case, between provisioning and regulating services.
RegulatingAir Quality Maintenance Ecosystems both contribute chemicals to and extract chemicals from the atmosphere, influencing many aspects of air
quality.
Climate Regulation Ecosystems influence climate both locally and globally.For example, at a local scale, changes in land cover can affect both temperature and recipitation. At the global scale, ecosystems play an important role in climate by either sequestering or emitting greenhouse gases.
Water Regulation The timing and magnitude of runoff, flooding, and aquifer recharge can be strongly influenced by changes in land cover, including, in particular, alterations that change the water storage potential of the system, such as the conversion of wetlands or the replacement of forests with croplands or croplands with urban areas.
Erosion Control Vegetative cover plays an important role in soil retention and the prevention of landslides.
Water Purification and Waste Treatment
Ecosystems can be a source of impurities in fresh water but also can help to filter out and decompose organic wastes introduced into inland waters and coastal and marine ecosystems.
Regulation of Human Diseases
Changes in ecosystems can directly change the abundance of human pathogens, such as cholera, and can alter the abundance of disease vectors, such as mosquitoes.
Biological Control Ecosystem changes affect the prevalence of crop and livestock pests and diseases.
Pollination Ecosystem changes affect the distribution, abundance, and effectiveness of pollinators.
Storm Protection The presence of coastal ecosystems such as mangroves and coral reefs can dramatically reduce the damage caused by hurricanes or large waves.
Cultural
Cultural Diversity The diversity of ecosystems is one factor influencing the diversity of cultures.
Spiritual and Religious Values
Many religions attach spiritual and religious values to ecosystems or their components.
Knowledge Systems Ecosystems influence the types of knowledge systems developed by different cultures.
Educational Values Ecosystems and their components and processes provide the basis for both formal and informal education in many societies.
Inspiration Ecosystems provide a rich source of inspiration for art, folklore, national symbols, architecture, and advertising.
Aesthetic Values Many people find beauty or aesthetic value in various aspects of ecosystems, as reflected in the support for parks, “scenic drives,” and the selection of housing locations.
Social Relations Ecosystems influence the types of social relations that are established in particular cultures. Fishing societies, for example, differ in many respects in their social relations from nomadic herding or agricultural societies.
Sense of Place Many people value the “sense of place” that is associated with recognized features of their environment, including aspects of the ecosystem.
Cultural Heritage Values Many societies place high value on the maintenance of either historically important landscapes (“cultural landscapes”) or culturally significant species.
Recreation and Ecotourism
People often choose where to spend their leisure time based in part on the characteristics of the natural or cultivated landscapes in a particular area.

17
The use of IEA tools for improved MEA implementation
Box 1. Case study examples of crucial contributions of ecosystem services to development of
communities/regions and countries
Discovery Bay, Jamaica
Jamaica is the third largest island in the Caribbean Sea and home to one of the best-studied reefs in the world. Data collection and observations date back to the 1950s. This extensive base of knowledge lends itself well to a refined understanding of the pressures, state and potential impacts of the crucial roles that ecosystem services play in the development of the country.
Pressures: The main pressures impacting the role of ecosystem services in Jamaica include both human induced and natural pressures. Human-induced pressures of overfishing are impacting fish stocks, the health of reefs, subsistence harvesters and ultimately livelihoods. Data suggests that overfishing pressures affect approximately two thirds of the country’s reefs. Overfishing has made all large species and most predators absent or very scarce. These pressures are tied to the limited number of employment opportunities in the country, coupled with densely populated costal zones and easy access to stocks along the narrow shelf areas. Another human-induced pressure, further enhanced by natural pressures such as hurricanes, is coastal runoff. Agriculture, one of the primary economic activities of the country, has been characterized by practices and land clearing techniques that have resulted in increased erosion and nutrient pollution. The runoff is impacting rivers, increasing algae levels and damaging reefs. Increasing tourism has also added to this pressure with swelling populations and unmanaged development in the coastal zone. Finally, the occurrence of disease and coral bleaching are additional pressures impacting the country’s ecosystem services which have left the reefs less able to support fisheries, tourism and costal protection. Hundreds of years of the overfishing of algal grazers were compounded by a massive sea urchin kill in 1983 due to disease. The massive kill of sea urchins and algal grazers, led algal levels to rise dramatically. The rising levels meant a virtual replacement of the coral reefs by algal ecosystems. Coral bleaching has also been a reoccurring pressure, with events taking place in 1987, 1989, 1990 and 1998 with considerable mortality of local fauna.
State: The pressures of overfishing, coastal runoff, disease and bleaching events have left Jamaica’s reef system heavily degraded. Current management practices are ineffective and as a result most of the declared and proposed National Protected Area systems are characterized as “paper parks.”
Impacts: The pressure being placed on Jamaica’s ecosystem services, coupled with the current state of management practices in the country, has left Jamaica vulnerable to a number of very real and potential impacts. Reefs, the natural barriers that help minimize the effects of a hurricane’s or tropical storm’s impact on the land, are being destroyed. The destruction of the reefs, either human-induced or naturally occurring, means a loss of natural coastal protection. Additionally, with the growing number of pressures placed on the reefs, their ability to recover from natural disasters, infestations and disease is reduced. This reduced resiliency of the reefs is a significant impact for Jamaica. The health of the
LOW MEDIUM HIGH VERY HIGH
100
80
50
40
20
0
PERC
ENT
COAS
TAL
DEVE
LOPM
ENT
SEDI
MEN
TATI
ON
MAR
INE-
BASE
D PO
LLUT
ION
OVER
FISH
ING
INTE
GRAT
ED T
HREA
T
Reefs at risk in Jamaica

18
The use of IEA tools for improved MEA implementation
reefs and adequacy of fish stocks are tied to the ability of the island’s residents to harvest fish for both subsistence and commercial purposes. The data already indicates that fresh fish catches are negatively affected because the numbers and composition of fish species available have declined dramatically. The aquatic ecosystems of Jamaica are also a major draw for recreation and tourism. Impacts to the health of this delicate ecosystem reduce the ability of Discovery Bay to provide recreational benefits to residents and tourists. Lastly, real and potential impacts to human well-being are felt throughout the country due to changes to the livelihood of local fish harvesters, degraded recreational opportunities and reduced tourism revenue, as well as human health impacts tied to reduce food security.
Source: Caribbean Environment Outlook and World Resource Institute (2010)
Exercise 1: Using the MEA Priorities Mapping Tool
Required for the exercise: A group of five persons. A specific MEA to focus on. Your national development plan.
Task #1: Identifying Human Well-being Aspects. Pick a priority/goal from your national development plan, specify the selected goal and identify the various aspects of human well-being that the goal is meant to address [10 min]. Record your results on a flipchart, using the format provided in Figure 3 and Figure 5. Discuss your results with your table colleagues and refine your worksheet as necessary.
Task #2: Identifying Ecosystem Services. As a group, determine the two primary states of the environment that your focal MEA addresses and identify the various ecosystem services that are impacted by potential improvements in the two states of the environment. Record your results on your flipchart table (use the example in Figure 5).
Task #3: Identifying Linkages Between Human Well-being and Ecosystem ServicesAs a group, describe how each of the ecosystem services support the various aspects of human well-being identified for your national priority. Are some links stronger or more direct than others? Record your analysis by drawing a stronger and thinner line indicating the intensity of connections between ecosystem services and human well-being aspects on your flipchart.
Task #4: Compile data on current status, trends and scenariosIndividually, review the relevant environmental reports, including the county’s IEA report and national statistics for your country, and extract any relevant information to help describe the state, trends and future projections of the ecosystem services that your group identified. Share what information you found with your table colleagues and discuss if you found what you were looking for.
Task #5: Develop a compelling narrative demonstrating the importance of MEA commitments to national development prioritiesIndividually, write a one-paragraph briefing note communicating to your Parliament or Cabinet how your focal MEA is important to the achievement of specific national development priorities, incorporating any environmental data and projections you were able to find. Have your colleague to your right review your briefing note and revise as needed.
19
The use of IEA tools for improved MEA implementation
2.2 Step 2: Identifying synergies among MEAs using IEA tools
This second step in MEA outcomes mapping involves identifying synergies among MEAs. This is important because one of the critical challenges facing implementation of multiple MEAs in small island developing nations is internal capacity, both staffing and funding. Understanding how seemingly disparate MEAs are providing common socioeconomic and environmental policy benefits is crucial for the efficient use of existing human and financial resources. This section introduces an MEA Synergies Mapping Tool that uses UNEP’s driving forces-pressure-state-impact-response (DPSIR) analytical framework to help identify the common benefits among the portfolio of MEAs that a country has agreed to implement.
2.2.1 Introduction to the DPSIR Analytical Framework
A brief overview of the DPSIR analytical framework is necessary before introducing the MEA Synergies Mapping Tool. Three core questions are addressed by the DPSIR framework, including:
n Q1: What is Happening to the Environment and Why? (DPS)
n Q2: What are the Consequences for the Environment and Humanity? (I)
n Q3: What is Being Done and How Effective is it? (R)
Figure 5. Example MEA Priorities Map

20
The use of IEA tools for improved MEA implementation
Q1: What is Happening to the Environment and Why?
Analyzing the STATES and TRENDS of the environment is central to identify how obligations and priorities in MEAs are actually unfolding in a country. Focusing on key states and trends in the environment is also the central part of the integrated environmental assessment (IEA) approach (Figure 2). This involves identifying key environmental state issues, and analyzing changes retrospectively through space and time. In the context of UNEP’s Global Environment Outlook reports, typical environmental state variables are grouped according to categories such as air, land, water and biodiversity. To effectively answer the question What is happening to the environment and why? (Step 1, Figure 1), an analysis of state variables must be accompanied by an understanding and appreciation of the DRIVERS (driving forces or indirect drivers) and PRESSURES (direct drivers) that affect state variables individually and collectively. Drivers (including demographic changes, economic and societal processes) lead to more specific pressures on the environment (including, for example, land use change, resource extraction, emissions of pollutants and waste, and modification and movement of organisms). These pressures lead to changes of the STATE of the environment (e.g., climate change, stratospheric ozone depletion, changes in biodiversity and pollution or degradation of air water and soils), which are in addition to those that result from natural processes.
Q2: What are the Consequences for the Environment and Humanity?
These changes affect the ecological services that the environment provides to humankind, such as the provision of clean air and water, food and protection from ultraviolet radiation as well as impacts on other aspects of the environment itself, such as land degradation, habitat quality and quantity and biodiversity. As a result of changes in ecological services, and mediated by demographic, social and material factors, there are IMPACTS on the environment and human well-being (health, economic performance, material assets, good social relations and security).
Q3: What is Being Done and How Effective is it?
Societal RESPONSES can influence the environmental state and their associated drivers and pressures (either intentionally or unintentionally). Societal responses essentially fall under two categories: (1) responses directed at mitigating exposure to environmental impacts (e.g., through environmental restoration and enhancement); and (2) responses which help society adapt directly to the impacts that occur and/or build the capacity to adapt to changes in the environment. Societal responses include, for example, formulating and implementing public policy, laws and establishing/strengthening institutions, as well as through advances in science and technology. The exposure to changes in various environmental states, combined with the ability of society to adapt to these changes, determines the degree to which people are vulnerable or are resilient to environmental change.

21
The use of IEA tools for improved MEA implementation
Box 2. DPSIR Case Study
Marine Water Pollution in the Caribbean Sea
Introduction
The Caribbean Sea connects the shores of all the Island and Coastal States in the Caribbean region. Through constant exchanges with the land, the Caribbean Sea nourishes terrestrial and marine ecosystems that support the socioeconomy of this tropical expanse. Marine water pollution undermines the future of the Caribbean people who are defined by the sea’s natural bounty.
Drivers/Pressures
Marine water pollution in the Caribbean is driven primarily by human activities within the coastal and inland territories of the Latin American and Caribbean region. The vast majority (80–90 per cent) of urban and industrial wastewater in the Caribbean is emitted directly into rivers and oceans untreated (UNEP, 2010). For instance, aquaculture operations (which are expected to increase over time) typically degrade water quality by emitting concentrated fecal matter and antibiotics directly within coastal waters (Land and Surveys Department, University of Belize, & UNEP, 2010). Real estate and infrastructure developments, primarily motivated by the tourism industry, have resulted in the rising loss of natural coastal environments that prevent erosion and filter water pollutants. Their value has been recognized by Belize City which uses its natural pools and mangrove forests to treat the wastewater generated by its residents (Land and Surveys
Figure 6. Questions addressed by the DPSIR framework with illustrative examples (IEA manual, 2008)

22
The use of IEA tools for improved MEA implementation
Department, University of Belize, & UNEP, 2010). Inland activities such as agriculture, forestry and the establishment of dams can impact marine waters through agrichemical and fertilizer runoff and increased or decreased sedimentation. Climate change may also indirectly influence marine water pollution through more extreme climatic events such as hurricanes and tropical storms which will entrain pollutants into water bodies though increased runoff (Chase, 2008).
State
The water quality in the Caribbean Sea has degraded over time as human activity has expanded in the region. Two thirds of the Caribbean reefs are under threat (Burke & Maidens, 2005). Urbanization in the region is placing stress on wastewater treatment systems exemplified by cities like San Jose in Costa Rica where only 2.5 per cent of its wastewater is treated (UNEP, 2010). Untreated industrial waters, such as the contaminated waters of Bogotá River, also flow into the Caribbean Sea (UNEP, 2010). Existing and planned oil and gas extraction operations in the area are also degrading (or will degrade) marine water quality. Sediments in Trinidad and Tobago’s Gulf of Paria have higher hydrocarbon concentrations near oil extraction and refinery operations (Trinidad and Tobago Central Statistics Office, n.d.).
Impacts
Untreated urban and industrial wastewater introduces a variety of hydrocarbon, heavy metal, nutrient, pathogen and antibiotic pollutants into marine waters. Marine water pollution is having devastating health impacts on people who consume contaminated seafood. Similarly, marine water pollution can degrade biodiversity, which can have a ripple effect on the fisheries and tourism sectors that provide many livelihoods (UNEP, 2010; Agard et al., 2009). The dramatic losses of seagrass along parts of the Columbian coast are attributed to increasing sediment loads from the Magdelena River (see Figures below) (Restrepo et al., 2006)
Sediment loads monitored in the lower reaches of the Magdelena River have led to the disapearance of seagrass cover loss in the Cartagena bay and neighboring areas (Restrepo et al., 2006).

23
The use of IEA tools for improved MEA implementation
The DPSIR framework, while intended to identify and assess environmental issues, can also be used to analyze and better understand the components of an MEA. Consider the example analysis provided in Table 2 for the SPAW protocol with focus on the Caribbean countries.
Table 2. Illustrative example of the DPSI for SPAW protocol with a focus on Caribbean countries
States of the Environment
List the state(s) of the environment that the MEA is addressing, along with specific targets cited
Protected Areas and Wildlife in the Caribbean Sea
nEstablishing marine protected areas (Number of MPAs)
nProtection of coastal habitats
nCoastal water quality
Pressures
List the direct pressures on the state(s) of the environment identified above. For each pressure, list specific targets cited in the MEA and identify line departments having an influence
nOverfishing
nMining and construction
nImproper anchorage of boats
nImproper sewage management/grey water
nLack of public awareness/ownership
n Increase solid waste production
nImproper planning
Drivers
High-level drivers of change influencing the direct pressures identified above, along with any targets
nDevelopment within coastal areas
nPopulation growth
n International/regional trade
nIndustrial growth
n Tourism development (Increase in number of sustainable tourism initiatives)
Impacts
Articulate the impacts associated with changes in the environmental state(s). Use the ecosystem services and well-being categories to assist with the analysis.
nDecreased fish stocks
n Increased coastal erosion
n Loss of marine biodiversity
nCultural impacts
Developed by the workshop participants in Suriname (2011)

24
The use of IEA tools for improved MEA implementation
2.2.2 Tool #2: MEA Synergies Mapping
Viewing an MEA through the lens of the DPSIR framework produces some important insights for identifying synergies among MEAs. The framework makes it possible to peer deeper into the layers of the socioeconomic and ecological system that an MEA is designed to address, thus enabling a policy-maker to identify leverage points for implementation efficiency and increased effectiveness.
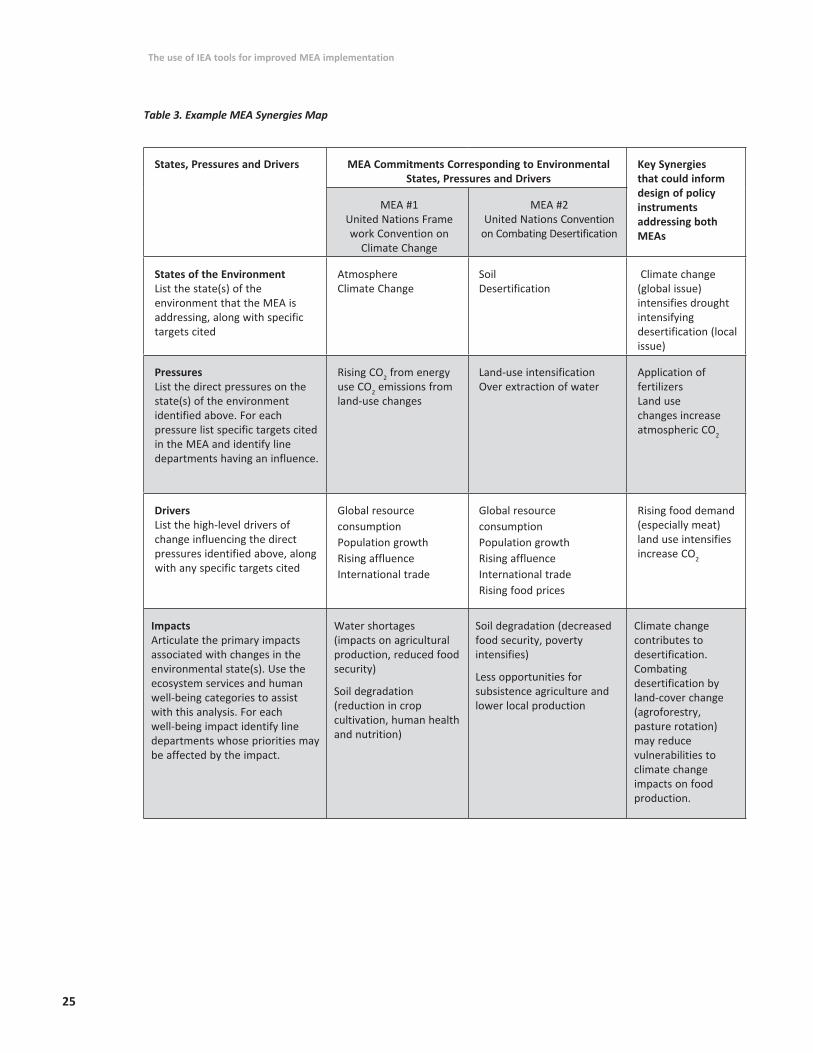
To illustrate this, consider the example MEA Synergies Map presented in Table 3. Two MEAs are considered in this example: the United Nations Framework Convention on Climate Change and the United Nations Convection to Combat Desertification. Starting with the most visible layer of the system—the State of the environment—the Synergies Map reveals that the two MEAs are focusing on mitigating changes in climatic parameters on the one hand, and desertification on the other. A look across these two MEAs reveals that a change in climate which manifests as increased duration and intensity of drought can also increases the level of desertification. Therefore, successful implementation of the desertification convention depends to a large degree on the success of the climate change convention. While this is intuitive, the insight may not provide practical policy guidance in the near term given that the climate change issue is a global commons issue with potential impacts which can be realized over next 50 and 100 years, while the desertification manifests with local or regional boundaries with immediate impacts on local livelihoods. One must therefore peer deeper into the system to extract practical insights for synergies in policy-making.
The next layer of the system is the direct pressures acting on the state of the environment. In the Synergies Map example, these include CO2 emissions and land use for the climate change and desertification conventions, respectively. A view at this system pressure level reveals an important leverage point for realizing synergies: the intense use of land for production and soil tillage increases CO2 emissions and desertification. Peering deeper into the system, an analysis of the societal-level drivers which accelerate or decelerate changes in the direct pressures, reveals that rising food demand (especially meat) intensifies both CO2 emissions and land degradation leading to increased desertification.
Analyzing the specific impacts on ecosystems and human well-being can reveal additional insights into the synergies among MEAs. For example, looking across both the climate change convention and the desertification convention reveals that combating desertification through land-cover change, namely agro-forestry and crop rotation, may reduce vulnerability to climate change impacts on food production.
As the example in Table 3 illustrates, use of the DPSIR framework can yield several insights toward areas of potential collaboration and resources sharing for the implementation of different MEAs.
25
The use of IEA tools for improved MEA implementation
Table 3. Example MEA Synergies Map
States, Pressures and Drivers MEA Commitments Corresponding to Environmental States, Pressures and Drivers
Key Synergies that could inform design of policy instruments addressing both MEAs
MEA #1 United Nations Frame work Convention on
Climate Change
MEA #2United Nations Convention
on Combating Desertification
States of the EnvironmentList the state(s) of the environment that the MEA is addressing, along with specific targets cited
AtmosphereClimate Change
SoilDesertification
Climate change (global issue) intensifies drought intensifying desertification (local issue)
PressuresList the direct pressures on the state(s) of the environment identified above. For each pressure list specific targets cited in the MEA and identify line departments having an influence.
Rising CO2 from energy use CO2 emissions from land-use changes
Land-use intensification Over extraction of water
Application of fertilizersLand use changes increase atmospheric CO2
DriversList the high-level drivers of change influencing the direct pressures identified above, along with any specific targets cited
Global resource consumption Population growth Rising affluence International trade
Global resource consumption Population growth Rising affluence International trade Rising food prices
Rising food demand (especially meat) land use intensifies increase CO2
Impacts Articulate the primary impacts associated with changes in the environmental state(s). Use the ecosystem services and human well-being categories to assist with this analysis. For each well-being impact identify line departments whose priorities may be affected by the impact.
Water shortages (impacts on agricultural production, reduced food security)
Soil degradation (reduction in crop cultivation, human health and nutrition)
Soil degradation (decreased food security, poverty intensifies)
Less opportunities for subsistence agriculture and lower local production
Climate change contributes to desertification. Combating desertification by land-cover change (agroforestry, pasture rotation) may reduce vulnerabilities to climate change impacts on food production.

26
The use of IEA tools for improved MEA implementation
Discussion Question
Referring to Table 3 above, how might knowledge of the synergies among the two MEAs (last column) help realize efficiencies and effectiveness of implementation of the MEAs? What other synergies can you think of between the climate change and desertification MEAs?
Exercise 2: Using the MEA Synergies Mapping Tool
Required for the exercise: A group of ~5 persons. At least two MEAs to focus on.
Task #1: Identify Environmental States Working as a group, list the state(s) of the environment that your focal MEAs are addressing, along with any specific indicators and targets cited. Record your results on a flipchart using the format given in the MEA Synergies Mapping template provided in Table 4.
Task #2: Identify Direct PressuresUsing the flipchart you created, list the direct pressures on the state(s) of the environment identified above, along with any specific targets cited.
Task #3: Identify High-level DriversList the high-level drivers of change influencing the direct pressures identified above, along with any specific targets cited.
Task #4: Articulate ImpactsArticulate the primary impacts associated with changes in the environmental state(s). Use the ecosystem services categories from Section 2.1.2 to assist with your analysis.
Task #5: Compare Synergies across different MEAsIn plenary, articulate the synergies between the MEAs by looking at the drivers, pressures, states and impacts that were listed across the different MEAs.
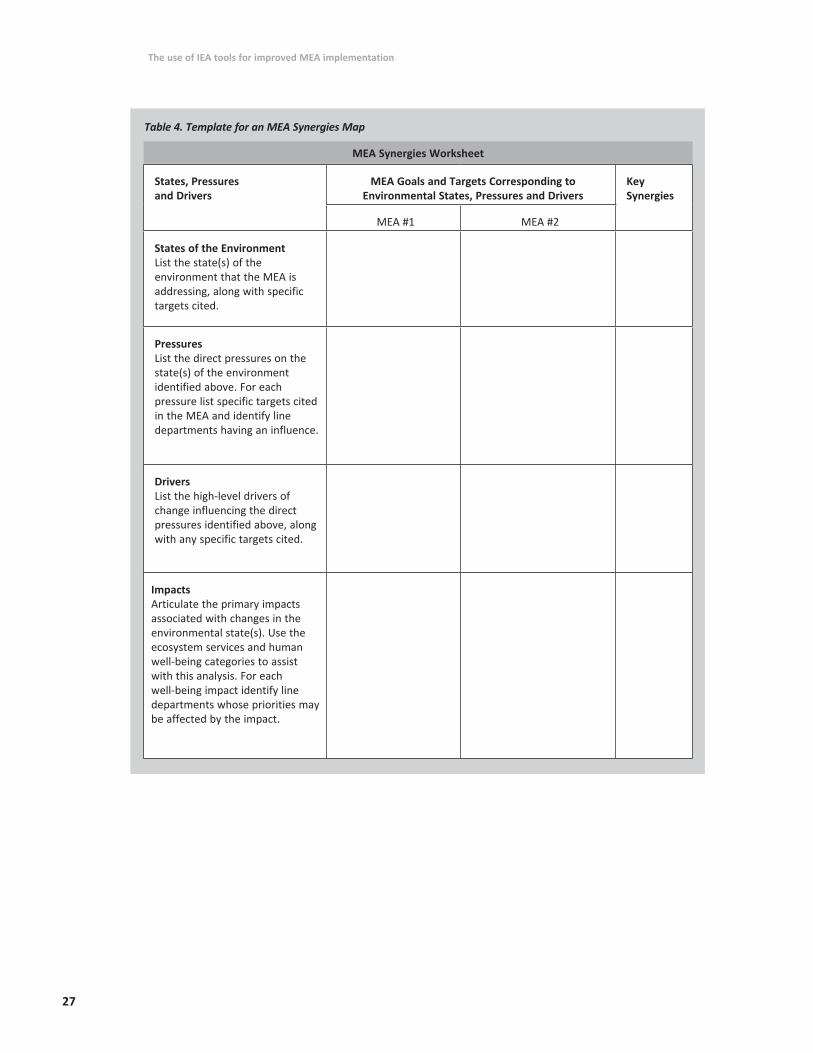
27
The use of IEA tools for improved MEA implementation
States, Pressures and Drivers
MEA Goals and Targets Corresponding to Environmental States, Pressures and Drivers
Key Synergies
MEA #1 MEA #2
States of the EnvironmentList the state(s) of the environment that the MEA is addressing, along with specific targets cited.
PressuresList the direct pressures on the state(s) of the environment identified above. For each pressure list specific targets cited in the MEA and identify line departments having an influence.
DriversList the high-level drivers of change influencing the direct pressures identified above, along with any specific targets cited.
Impacts Articulate the primary impacts associated with changes in the environmental state(s). Use the ecosystem services and human well-being categories to assist with this analysis. For each well-being impact identify line departments whose priorities may be affected by the impact.
MEA Synergies Worksheet
Table 4. Template for an MEA Synergies Map
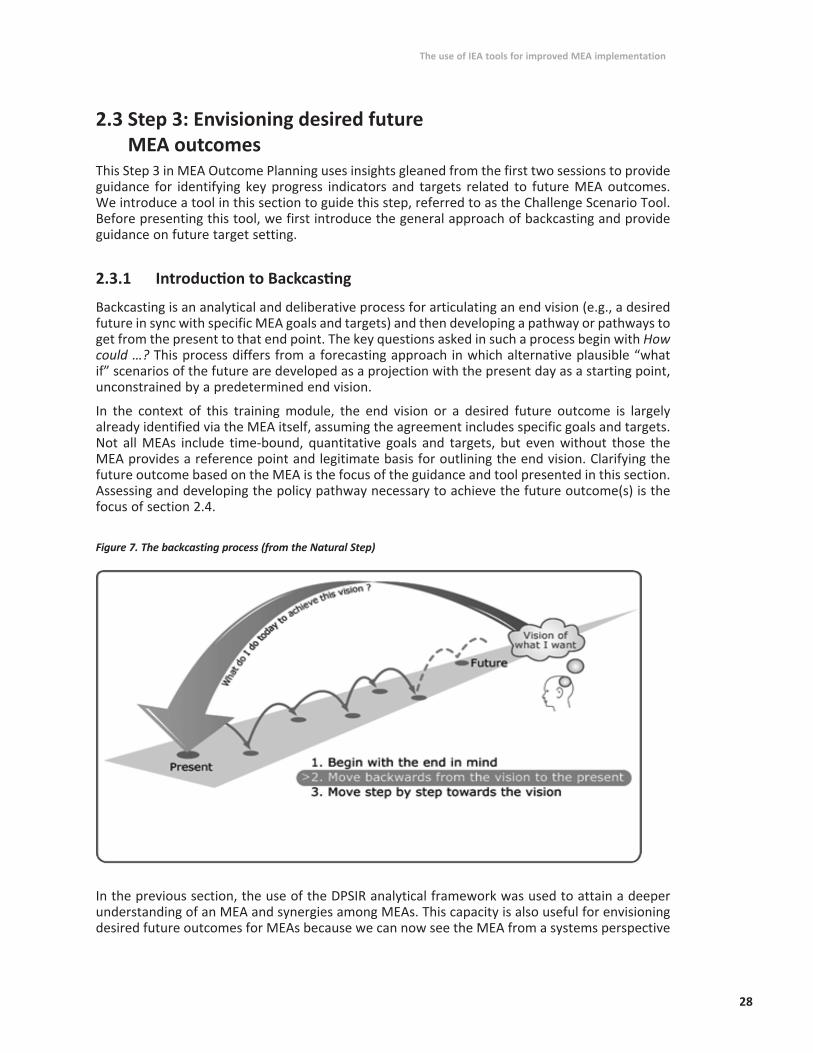
28
The use of IEA tools for improved MEA implementation
2.3 Step 3: Envisioning desired future MEA outcomes
This Step 3 in MEA Outcome Planning uses insights gleaned from the first two sessions to provide guidance for identifying key progress indicators and targets related to future MEA outcomes. We introduce a tool in this section to guide this step, referred to as the Challenge Scenario Tool. Before presenting this tool, we first introduce the general approach of backcasting and provide guidance on future target setting.
2.3.1 Introduction to Backcasting
Backcasting is an analytical and deliberative process for articulating an end vision (e.g., a desired future in sync with specific MEA goals and targets) and then developing a pathway or pathways to get from the present to that end point. The key questions asked in such a process begin with How could …? This process differs from a forecasting approach in which alternative plausible “what if” scenarios of the future are developed as a projection with the present day as a starting point, unconstrained by a predetermined end vision.
In the context of this training module, the end vision or a desired future outcome is largely already identified via the MEA itself, assuming the agreement includes specific goals and targets. Not all MEAs include time-bound, quantitative goals and targets, but even without those the MEA provides a reference point and legitimate basis for outlining the end vision. Clarifying the future outcome based on the MEA is the focus of the guidance and tool presented in this section. Assessing and developing the policy pathway necessary to achieve the future outcome(s) is the focus of section 2.4.
Figure 7. The backcasting process (from the Natural Step)
In the previous section, the use of the DPSIR analytical framework was used to attain a deeper understanding of an MEA and synergies among MEAs. This capacity is also useful for envisioning desired future outcomes for MEAs because we can now see the MEA from a systems perspective
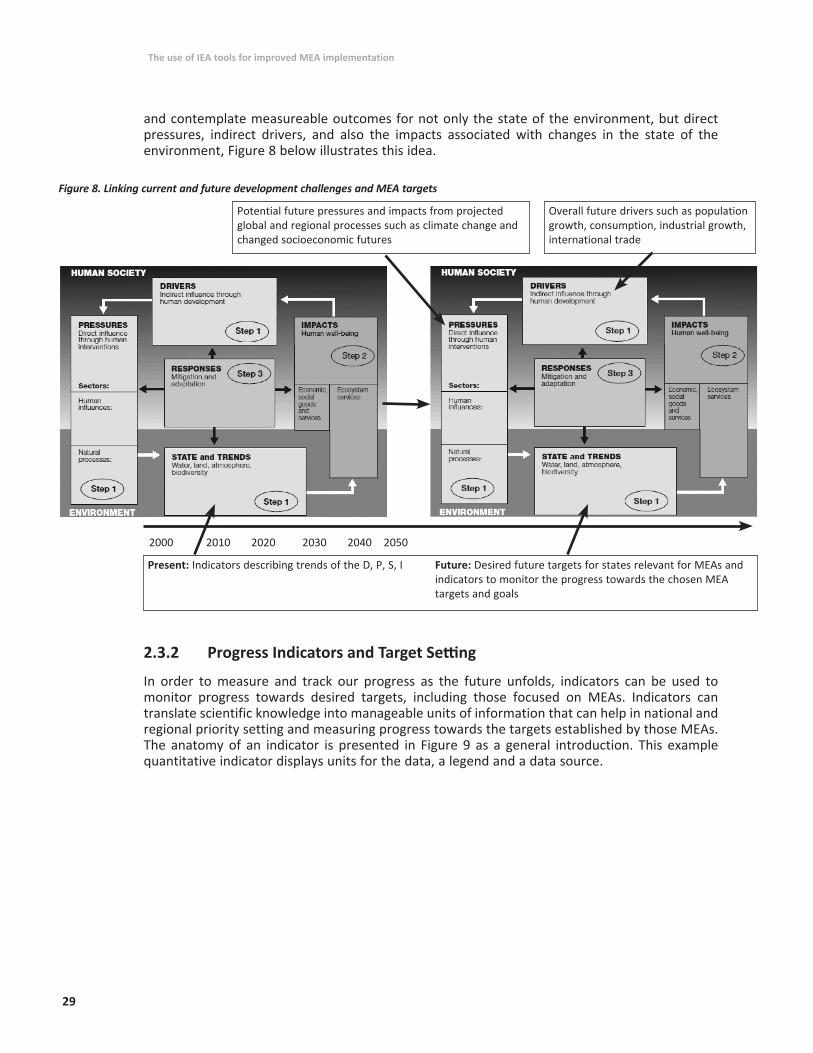
29
The use of IEA tools for improved MEA implementation
and contemplate measureable outcomes for not only the state of the environment, but direct pressures, indirect drivers, and also the impacts associated with changes in the state of the environment, Figure 8 below illustrates this idea.
2.3.2 Progress Indicators and Target Setting
In order to measure and track our progress as the future unfolds, indicators can be used to monitor progress towards desired targets, including those focused on MEAs. Indicators can translate scientific knowledge into manageable units of information that can help in national and regional priority setting and measuring progress towards the targets established by those MEAs. The anatomy of an indicator is presented in Figure 9 as a general introduction. This example quantitative indicator displays units for the data, a legend and a data source.
Potential future pressures and impacts from projected global and regional processes such as climate change and changed socioeconomic futures
Overall future drivers such as population growth, consumption, industrial growth, international trade
Present: Indicators describing trends of the D, P, S, I Future: Desired future targets for states relevant for MEAs and indicators to monitor the progress towards the chosen MEA targets and goals
2000 2010 2020 2030 2040 2050
Figure 8. Linking current and future development challenges and MEA targets

30
The use of IEA tools for improved MEA implementation
It is important that different categories of indicators be used to monitor the effectiveness of MEAs and their implementation. Consistent with the classification of indicators recommended by the Global Environment Facility, these are divided into Environmental status, Stress reduction and Process indicators (Heileman and Walling, 2008). These indicator categories are summarized below and in Table 5.
n Environmental status indicators (ESI) are goal-oriented and focus on actual improvements of ecosystem or environmental quality (state) as well as any associated socioeconomic improvements. These indicators are usually “static” snapshots of environmental and socioeconomic conditions at a given point in time and, like Stress Reduction, are usually reported against a baseline year and level to show change/improvement. Examples of ESIs are: (a) Improved (measurable) chemical, physical (including flow regimes), or biological parameters; and (b) Improved hydrological balance as vegetation cover increases as a result of reforestation programs.
n Stress reduction indicators (SRI) relate to the specific on-the-ground measures implemented by the countries to address more technical objectives of the MEA and which characterize and quantify specific reductions in the harm being posed to natural resources or increases in stress-reduction measures. Examples of SRIs include: (a) Pollution prevention/reduction programs implemented; and (b) Area of eroded land stabilized by tree planting for sedimentation reduction.
n Process indicators (PIs) focus on the processes or outputs that are likely to lead towards meeting the objectives of the MEA and to demonstrate actual, on-the-ground institutional and political progress in complying with the MEA obligations. These process indicators can assist in tracking institutional, policy, legislative, and regulatory reforms that facilitate MEA implementation. Examples of PIs relevant to MEA implementation are: (a) Formulation and documentation of National Intersectoral Committees to address and coordinate MEA issues; and (b) Formal Country ratification/accession of an MEA.
Figure 9. Anatomy of an indicator
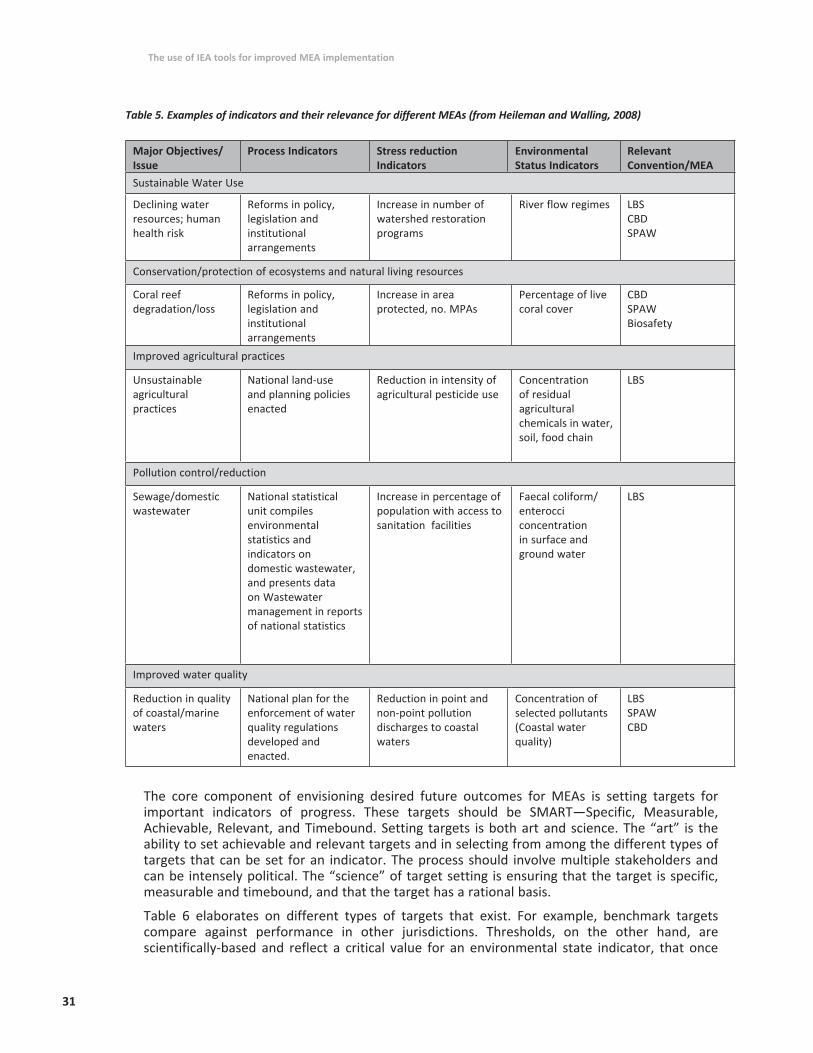
31
The use of IEA tools for improved MEA implementation
The core component of envisioning desired future outcomes for MEAs is setting targets for important indicators of progress. These targets should be SMART—Specific, Measurable, Achievable, Relevant, and Timebound. Setting targets is both art and science. The “art” is the ability to set achievable and relevant targets and in selecting from among the different types of targets that can be set for an indicator. The process should involve multiple stakeholders and can be intensely political. The “science” of target setting is ensuring that the target is specific, measurable and timebound, and that the target has a rational basis.
Table 6 elaborates on different types of targets that exist. For example, benchmark targets compare against performance in other jurisdictions. Thresholds, on the other hand, are scientifically-based and reflect a critical value for an environmental state indicator, that once
Table 5. Examples of indicators and their relevance for different MEAs (from Heileman and Walling, 2008)
Major Objectives/Issue
Process Indicators Stress reduction Indicators
Environmental Status Indicators
Relevant Convention/MEA
Sustainable Water Use
Declining water resources; human health risk
Reforms in policy, legislation and institutional arrangements
Increase in number of watershed restoration programs
River flow regimes LBS CBD SPAW
Conservation/protection of ecosystems and natural living resources
Coral reef degradation/loss
Reforms in policy, legislation and institutional arrangements
Increase in area protected, no. MPAs
Percentage of live coral cover
CBD SPAW Biosafety
Improved agricultural practices
Unsustainable agricultural practices
National land-use and planning policies enacted
Reduction in intensity of agricultural pesticide use
Concentration of residual agricultural chemicals in water, soil, food chain
LBS
Pollution control/reduction
Sewage/domestic wastewater
National statistical unit compiles environmental statistics and indicators on domestic wastewater, and presents data on Wastewater management in reports of national statistics
Increase in percentage of population with access to sanitation facilities
Faecal coliform/enterocci concentration in surface and ground water
LBS
Improved water quality
Reduction in quality of coastal/marine waters
National plan for the enforcement of water quality regulations developed and enacted.
Reduction in point and non-point pollution discharges to coastal waters
Concentration of selected pollutants (Coastal water quality)
LBS SPAW CBD

32
The use of IEA tools for improved MEA implementation
reached can elicit irreversible change in the behavior of the system. A standard is typically a national or internationally accepted and legally bound level of an environmental state or pressure indicator (e.g., water quality standards, pollutant loading limits). Policy-specific targets are typically determined in political deliberation and are often based on past experience (e.g., official development assistance shall be 0.4 per cent of national GDP).
Table 6. Examples of Types of Targets (IEA manual, 2008)
Type of Target Example
Benchmark Comparison with a documented best-case performance related to the same variable within another entity or jurisdiction. The policy is evaluated based on its impact in a given jurisdiction compared with conditions in the benchmark or reference jurisdiction. Example: highest percentage of households connected to sewage system in a comparable jurisdiction.
Thresholds The value of a key variable that will elicit a fundamental and irreversible change in the behaviour of the system. The policy is evaluated based on its role in making the system move toward or away from the threshold in any given period. Example: Maximum sustainable yield of a fishery.
Principle A broadly defined and often formally accepted rule. If the definition of the principle does not include a relevant performance measure, the evaluator should seek a mandate to identify one as part of the evaluation. Example: The policy should contribute to the increase of environmental literacy.
Standards Nationally and/or internationally accepted properties for procedures or environmental qualities. The policy is successful if it helps keep performance within specified limits. Example: Water quality standards for a variety of uses.
Policy-specific targets Determined in a political and/or technical process taking past performance and desirable outcomes into account. Example: official development assistance shall be 0.4 per cent of national GNP.
Some MEAs include targets as part of the agreement. The climate change convention is a good example, where Annex A agreed to specific greenhouse gas emission reduction targets within a specified time interval. Other MEAs however, do not provide specific or measureable targets as part of the agreement. For the latter case it is necessary in an outcome-based planning approach to identify Environmental Status indicators and Stress Reduction indicators and set achievable, relevant and time-bound targets for them. Some guidance for such a task is necessary and prudent. Consider the following ordering of sources to use for setting future MEA targets:
Sources for Setting Targets:
1. MEA specified target. Where a SMART target is already identified in the MEA, this is the obvious starting point for envisioning a desired future MEA outcomes.
2. National and sectoral policy statements and/or regulated standards reflecting the MEA commitment. Where SMART targets are not available within the MEA, there may already be clear policy targets or legal standards established at the national and sub-national levels.
3. Benchmark with a neighbouring country within region. Where SMART targets cannot be identified either within the MEA or within country policy documents or legal standards, benchmarking with a neighbouring country with similar socioeconomic and ecologic conditions can be considered.

33
The use of IEA tools for improved MEA implementation
4. Policy statements or recommendations from global or multilateral agencies. A next source of target information that can be considered are regionally-based policy statements or report findings from global or multilateral agencies.
5. Benchmark outside of region to a comparable country. Benchmarking with targets established in comparable countries outside the region can be considered if the above sources of targets do not yield relevant targets.
6. Reference to scientific literature. Credible and peer reviewed scientific reports that describe critical thresholds for environmental states are an important source of information for target setting. Ideally, targets gleaned from the above sources have been informed by science, but this is typically not the case. Therefore it is always useful to explore these sources of critical thresholds and compare to targets that are found from the sources described above. The planetary boundaries literature is one such source (Rockström et al., 2009), a summary of which is provided in Appendix A
6. Quantitative analysis/modelling and deliberation. Where no information can be found with respect to SMART targets relevant to the MEA, and where sufficient resources are available, quantitative analysis, and scenario modelling and deliberation can be undertaken. It should be noted, however, that this is an intensive process necessitating the involvement of scientific experts and computer modelling capabilities.
2.3.3 Tool #3: The Challenge Scenario
The Challenge Scenario worksheet is presented in this section as the mechanism for envisioning future MEA outcomes. This tool addresses the third question of UNEP’s integrated environmental assessment (IEA) approach, “Where are we heading?” The substance of the MEA takes care of most of the scenario development effort because it articulates the desired end state of the environmental issue. However, as noted in the previous two sections, there might be some extra work to do in identifying specific indicators and SMART targets for some MEAs.
The Challenge Scenario worksheet and exercise presented below is meant as a guide for creating a challenge scenario for the MEA and builds on the results of the previous MEA Synergies Mapping exercise.
Exercise 3: Setting the Challenge Scenario
Required for the exercise: Work in same groups as Exercise #3 and using the same MEAs as context
Building on the MEA Synergies Worksheet from Exercise #3, undertake the following tasks:
Task #1: Review the specific commitments for your MEA relating to environmental states, pressures and drivers, as identified in Exercise #3.
Task #2: Identify relevant indicators for each of the MEA commitments using guidance provided in Section 2.3.1.
Task #3: List the specific targets and time line, if available and articulated in the MEA. If none, review information sources for targets in the order discussed previously in Section 2.3.2.

34
The use of IEA tools for improved MEA implementation
2.4 Step 4: Identifying a portfolio of policies for achieving future MEA outcomes
The next step in MEA Outcome Planning (after setting a challenge scenario with SMART targets) is to articulate the pathway(s) for getting to the envisaged outcomes. This includes assessing the existing policy landscape directed at MEA implementation in a country and then identifying a portfolio of policy instruments for reaching the targets. A Policy Mapping Tool is introduced in this section for undertaking this policy assessment, preceded by an overview of the types of instruments that are available to policy-makers.
2.4.1 What are Policies?
While a policy can be described as an interrelated set of decisions and goals, a policy instrument is a tool or a mechanism used as a means to accomplish policy goals. There are myriad ways to categorize policy instruments. Table 8 presents one such way presented in UNEP’s GEO4 report including command and control regulations, direct provision by governments, policies that engage the public and private sectors, using markets, and creating markets.
States, Pressures and Drivers
MEA Commitments Key Synergies
Indicators and Targets
MEA #1 MEA #2
States of the EnvironmentList the state(s) of the environment that the MEA is addressing, along with specific targets cited.
PressuresList the direct pressures on the state(s) of the environment identified above. For each pressure list specific commitments in the MEA.
DriversList the high-level drivers of change influencing the direct pressures identified above, along with any specific commitments cited.
MEA Challenge Scenario Worksheet
Table 7. Challenge Scenario worksheet

35
The use of IEA tools for improved MEA implementation
For example, consider the climate change convention which sets forth national commitments at the environmental pressure level (CO2 emission reductions) and while not setting an environmental state commitment, there is a growing consensus on the critical threshold of a 2 degrees Celsius maximum global temperature increase, corresponding to an atmospheric CO2 concentration of between 380 and 430 ppm. An example of a portfolio of policy instruments as informed by the policy literature in support of this MEA outcome is provided below in Table 9.
Command-and- control regulations
Direct provision by governments
Engaging the public and the private sectors
Using markets
Creating markets
n Standards
nBans
nPermits and quotas
nZoning
nLiability
nLegal redress
nFlexible regulation
nEnvironmental infrastructure
nEco-industrial zones or parks
nNational parks, protected areas and recreation facilities
nEcosystems rehabilitation
n Public participation
nDecentralization
nInformation disclosure
nEco-labelling
nVoluntary agreements
nPublic-private partnership
nRemoving perverse subsidies
nEnvironmental taxes and charges
nUser charges
nDeposit-refund systems
nTargeted subsidies
nSelf-monitoring (such as ISO 14000)
n Property rights
nTradeable permits and rights
nOffset programmes
nGreen procurement
nEnvironmental investment funds
nSeed fund and incentives
nPayment for ecosystem services
Table 8. Classification of environmental policy instruments (from UNEP, 2007)

36
The use of IEA tools for improved MEA implementation
Table 9. Example policy portfolio relating to climate change mitigation
Policy Instrument Type
Policy Instruments Description and References
Command and control regulations
Energy efficiency standards for household appliances and vehicle fuel efficiency standards
California Global Warming Solutions Act
From Edenhoffer and Stern (2009), global Green Recovery “can induce investment, provided that the appropriate general conditions are in place.”
California Air Resources Board (2011). “Governor Schwarzenegger signed AB 32, the Global Warming Solutions Act of 2006, which set the 2020 greenhouse gas emissions reduction goal into law.”
Direct provision by governments
Energy efficiency targeted investment:
nBuildings US$208 billion
nTransport US$325 billion
nIndustry US$50-$63 billion
Renewable energy supply targeted investment: estimates of between US$233 billion and US$611 billion
Republic of Korea’s National Green New Deal Plan
Flagship project feasibility expenditures for energy supply and efficiency:
nCarbon capture and storage; Concentrated solar power; Ligno-cellulosic biomass; Power storage; Integrated hydrogen systems
UNEP Green Economy Report (2011). To meet IEA’s Blue Map scenario targets.
UNEP Green Economy Report (2011). “To increase penetration of renewables in power generation and primary energy consumption to at least reach targets set in IEA’s Blue Map scenario.”
UNEP Green Economy Report (2011). Enabling Conditions Chapter. “At a cost of around US$36 billion, or approximately 3 per cent of GDP, the initiative aims to create 960,000 jobs based on green infrastructure projects and public services.”
Edenhoffer and Stern (2009). Global Green Recovery.

37
The use of IEA tools for improved MEA implementation
Engaging public and private sectors
Government loan guarantees or (up front) refundable tax credits targeted at private sector investments in green recovery measures.
“G20 members increase their total spending on R&D related to energy efficiency, renewables and CCS to at least 0.05% of GDP.
G20 members who have not yet done so should establish publicly financed venture capital funds which target innovative clean-energy technologies. (The China Environment Fund and the UK Carbon Trust Venture Capital Fund are two examples of publicly backed funds in this area)”
“Training and skill enhancement programmes.”
Edenhoffer and Stern (2009). Global Green Recovery. “Given the large amounts of finance required [for a global green recovery], mobilising private sector investment and engaging in public private partnerships will be crucial to any successful attempt to tackle the economic crisis.”
UNEP Green Economy Report (2011), Enabling Conditions Chapter. “…will be needed to prepare the workforce for a green economy transition.”

38
The use of IEA tools for improved MEA implementation
Using Markets Sweden’s tax on NOx emissions
Eco Tax benefits: A study by the International Labour Organization (ILO) analyzed the impact of an eco-tax on the global labour market. It found that imposing a price on carbon emissions and using the revenue to cut labour costs by lowering social security contributions would create 14.3 million net new jobs over a period of five years, which is equivalent to a 0.5 per cent rise of world employment (ILO 2009). Even carbon-intensive industries see an increase in employment (ILO 2009).
Energy consumption:EU-wide minimum tax on carbon in order to bring energy taxation into line with the EU‘s 2020 objectives
Subsidy Reform“it is estimated that phasing out all fossil fuel consumption and production subsidies by 2020 could result in a 5.8 per cent reduction in global primary energy demand and a 6.9 per cent fall in greenhouse gas emissions (IEA/OPEC/OECD/World Bank 2010).”
Energy Efficiency “We recommend that G20 members increase energy efficiency in the transport sector by…restructuring vehicle taxation based on carbon emissions…”
From UNEP Green Economy Report (2011), Box 5, Chapter on Enabling Conditions. “Led to a dramatic increase in the adoption of existing abatement technology – from 7 per cent of the firms adopting the technology prior to the tax to 62 per cent the following year.”
From UNEP Green Economy Report (2011), Box 6, Chapter on Enabling Conditions.
Example from GEO 0draft Regional Chapter 4 Europe “The EU-wide carbon tax is expected to come into force on 1 January 2013, with the new members allowed the transition period until 1 January 2021. Similarly to the Sweden scheme, the main areas to be covered are transport, agriculture, households and small installations currently not covered by the EU ETS. Road transport is particularly important for regulating CO2 emissions as they have risen rapidly from this source during last decades (Figure.2.4.2).”
From UNEP Green Economy Report, Chapter on Enabling Conditions
From Edenoffer and Stern (2009) Global Green Recovery

39
The use of IEA tools for improved MEA implementation
Policy Instrument Type
Policy Instruments Description and References
Creating markets Feed-in Tariffs for renewable energy supply
n“We recommend that G20 governments ease temporarily high risk aversion among potential lenders and facilitate financing of clean-technology projects by providing and expanding feed-in tariffs, renewable portfolio standards, production tax credits, guarantees and loans.”
w “Feed-in tariffs can be a powerful market-based instrument to reduce greenhouse gas emissions, enhance energy supply security, and enhance economic competitiveness.”
Energy supply and efficiency The EU Emissions Trading System (EU ETS)
for renewables and energy efficiency
The Marrakech Task Force on sustainable public procurement
From Edenoffer and Stern (2009) Global Green Recovery “Clean-technology markets are likely to be a major source of future growth in several countries. In Germany, the output of this sector increased by 27% between 2005 and 2007, employing almost 1.8 million people (see Box 3).”
From UNEP Green Economy Report, Box 4, Chapter on Enabling Conditions.
“Feed-in tariffs are the most common policy used by governments to promote renewable power generation. Of the 83 countries that currently have renewable energy policies, at least 50 countries—both developed and developing—and 25 states/ provinces have feed-in tariffs. In Kenya, it is expected that a recently revised feed-in tariff policy will stimulate around 1300 MW of electricity generation capacity, contributing significantly to energy security in the country. Moreover, the Kenyan feed-in tariff is expected to stimulate the building of renewable energy infrastructure as well as lead to the implementation of projects to increase the capacity of sugar companies for biomass-based cogeneration, thereby contributing to employment and development in rural areas (UNEP 2010e).”
Example from GEO 0draft Regional Chapter 4 Europe “Being the first and biggest international scheme for the trading of greenhouse gas emission allowances, the EU ETS covers some 11,000 power stations and industrial plants in 30 countries, representing about 40% of EU GHG emissions.”
From UNEP Green Economy Report, Enabling Conditions chapter
Box 2: “The Marrakech Task Force on Sustainable Public Procurement was launched by the government of Switzerland in 2005, and is one of seven Task Forces in the Marrakech Process on Sustainable Consumption and Production, led by UNEP and the United Nations Department of Economic and Social Affairs (UNDESA).”

40
The use of IEA tools for improved MEA implementation
2.4.2 Introduction to Adaptive Policy-making
The process of MEA Outcome Planning helps to clarify the challenges that face policy-makers responsible for MEA implementation. It also provides the necessary anchor for analyzing existing policies directed at MEA implementation and for exploring a portfolio of new policies to fill critical gaps. But let there be no illusion. While this section and the featured Policy Mapping Tool are designed to help identify an effective portfolio of policy instruments, there is no magical master plan or silver bullet for successfully achieving the commitments of an MEA.
Climate, biodiversity, water, land, and waste are complex systems and have persistent problems, where the actions of unpredictable ecosystems comingle with adaptive and equally unpredictable people and institutions. As such, some of the policies implemented in support of MEAs are sure to fail—such is the reality of human intervention in complex systems. But others will work very well. Both successes and failures should be carefully examined. Policies that fail need to be revised or abandoned. Those policies and instruments that are working well should be strengthened, scaled up and shared with other regions and jurisdictions to learn from and potentially copy.
The careful tracking of policies through a prudent and adaptive plan–do–check cycle of policy set up, policy design and implementation and monitoring and review is a core element of adaptive governance in support of continuous learning and improvement, and an imperative for making any real and lasting progress toward sustainable development.
There exists a dearth of recent literature on policy-making guidance for uncertain and complex issues, which could provide a credible basis from which to inform approaches for adaptive governance. The paragraphs that follow provide a synthesis of principles for adaptive policy-making that emanate from a diverse range of economic sectors including health, science and technology, natural resources management, and international development (Swanson and Bhadwal, 2009; a compilation of the citations and references for the italicized text below are provided in Appendix B).
Policy Set-up StageImportant adaptive governance principles for the policy setup stage that guide a coherent understanding of the issue and the setting of objectives can be grouped under three main principles. The first common principle observed is the importance of integrated and forward-looking analysis. The healthcare and natural resource management sectors have experienced that it is critical “to understand the interactions among the natural, built and social environments.” In particular, it is important “to look for linkages in unusual places” and to “determine significant connections rather than measure everything.” Additionally, many sectors, particularly the private sector, see foresight as critical for policy setup and “scenario planning helps structure the perceptions of decision-makers about the alternative future settings in which their decisions might play out.”
A second common principle is using multi-stakeholder deliberation, a collective and collaborative public effort to examine an issue from different points of view prior to taking a decision: “Public discourse and open deliberation are important elements of social learning and policy adaptation and help build trust, collaboration, consensus and capacity for social action.” Co-design and learning is another critical principle for system innovation and transition: “social learning is aimed at reframing and changes in perspectives amongst stakeholders to jointly try to find shared problem perceptions and directions for sustainable solutions.” The transitions addressed in the chapter will conflict with vested interests and will have to deal with major path dependencies. This is a process of “creative destruction” in the transition towards a sustainable society.

41
The use of IEA tools for improved MEA implementation
Policy Design and Implementation StageGuidance for adaptive policy design and implementation can be conceptualized under three main principles. The first is to allow for diversity, innovation and selection. Among the most common recommendations coming from literature on effective intervention in complex and adaptive settings is to “promote variation.” It is also the consensus among leading adaptive management practitioners that “policies should test clearly formulated hypotheses about the behaviour of an ecosystem being changed by human use,” in other words, “learning and adaptation of the policy should be made explicit at the outset and the inevitable policy changes made part of a larger, recognized process.”
A second principle echoed across most complex systems and resilience literature is the underlying importance of enabling self-organization and networking. “Creating opportunity for cooperation,” “building networks of reciprocal interaction,” “ensuring that social capital (i.e., societal connections and relationships) remains intact,” “facilitating the copying of successes,” and just the basic assurance that “members of the population are free and able to interact,” are all fundamental elements of building the capacity of actors and policy itself to adapt to unanticipated conditions.
Thirdly, matching scales of ecosystems and governance and building cross-scale governance mechanisms is a guiding principle shared among resilience and ecosystem management practitioners. The ecosystem approach advocated by many organizations such as UNEP calls for “clear identification of the appropriate spatial and temporal scale” for the integrated management of natural resources. In many situations, the decentralization of decision making can increase the capacity of a policy to perform successfully when confronted with unforeseen events (e.g., watershed management districts and associations).
Monitoring and Continuous Learning and Improvement StageThis last stage of the iterative plan–do–check cycle calls for formalized policy review and continuous improvement, as evidenced by recommendations stemming from a range of sectors including healthcare, natural resources, and information technology. The healthcare sector for example, recommends “constant fine-tuning and selection” of policies for improving health in cities, and guidance for the adaptive management of natural resources tells us “that integral to design are the monitoring and remedial measures—they should not be post ad hoc additions after implementation.” The U.K. Cabinet office provides some practical guidance based on American and European experiences with policy pilots (see Box 3). Additionally, there are examples of “automatic policy adjustment,” such as weather-indexed insurance that formalize rapid policy review and triggering actions under conditions which can be anticipated in advance.
Box 3. Policy Pilots as a Mechanism for Adaptive Governance
One approach recommended builds on the experience of the Cabinet Office of the United Kingdom with respect to the design and implementation of policy pilots. Their review noted that “an important innovation in recent years has been the phased introduction of major government policies or programs, allowing them to be tested, evaluated, and adjusted where necessary, before being rolled out nationally” (U.K. Cabinet Office, 2003).
They observed that the practice of policy pilots has been relatively widespread in the United States owing in part to its federal structure, which in many instances has implemented and evaluated a policy within one state before being rolled out nationally. The recommendation of the U.K. Cabinet Office is:
“The full-scale introduction of new policies and delivery mechanisms should, wherever possible, be preceded by closely monitored pilots. Phased introduction not only helps to inform implementation, but also to identify and prevent unintended consequences. A pilot is an important first stage of regular, longer-term policy monitoring and evaluation.”

42
The use of IEA tools for improved MEA implementation
Discussion Question
Referring to the Table in Appendix B, which of the principles have you observed to be important in your policy-making experience? How might these and the other design and implementation principles guide your recommendations for an effective policy portfolio in support of MEAs you are responsible for?
How might these and the other design and implementation principles guide your recommendations for an effective policy portfolio in support of MEAs you are responsible for?
2.4.2 Tool #4: Policy Mapping
This tool addresses the fourth question in UNEP’s integrated environmental assessment (IEA) approach: What is being done and how effective is it? Identifying a portfolio of policy instruments for achieving MEA commitments necessitates knowing the current landscape of policy instruments already being implemented in a country.
Using the DPSIR analytical framework, the Policy Mapping Tool allows a policy-maker to map what policies are being implemented that address environmental states, direct pressures, indirect drivers and also the impacts of changes in the state of the environment. The Policy Map therefore provides a systems level view of the policy landscape, much more detailed than traditional policy analysis.
An example Policy Map related to biodiversity in the Caribbean context is shown in Figure 10. The first step in developing the map is identifying the specific environmental state that is the focus for improvement. In the example, two states are listed: forests and marine areas. The next step is to identify the direct pressures and indirect drivers of changes in the state of the environment, followed by the impacts on ecosystem services and human well-being. Now policy analysis can begin using both desk research and group deliberation to list policies that are currently being implemented to address the state, pressure, driver and impact parts of the system. The product is a comprehensive systems view of the policy landscape.

43
The use of IEA tools for improved MEA implementation
The forward-looking policy analysis is the next step, designed to identify gaps and a more rounded portfolio that addresses leverage points across the system. Key questions to address for this step include:
nIs the current portfolio of policies directed at the MEA sufficient to achieve the desired long-term outcome target?
nAre policies being directed at all system leverage points including states, pressures, drivers and impacts?
nIs a mix of policy instrument types being used, including command and control regulations, direct provision by governments, policies that engage the public and private sectors, using markets, and creating markets?
Developed by the workshop participants in Suriname (2011)
Figure 10. Example policy map related to biodiversity

44
The use of IEA tools for improved MEA implementation
Exercise 4: Creating a Policy Map
Required for the exercise: A specific MEA to focus on and the results of a DPSI analysis on that MEA (see exercise 2); A group of ~5 persons familiar with national level policies
Task #1: Using the Policy Map template provided (Figure 11), list your focal MEA at the top of the page and fill in the DPSI information, starting with the states of the environment.
Task #2: Brainstorm among your group to identify policies currently being implemented that address the DPSI parts of the system.
Task #3: Analyse the policy map by addressing the following questions:
a) Are policies being directed at all system leverage points including states, pressures, drivers and impacts?
b) Is a mix of policy instrument types being used, including command and control regulations, direct provision by governments, policies that engage the public and private sectors, using markets, and creating markets?
c) Is the current portfolio of policies directed at the MEA sufficient to achieve the desired long-term outcome target?
Task #4: Make recommendations to address any gaps identified in Task #3.
Figure 11. Policy Mapping Template.

45
The use of IEA tools for improved MEA implementation
2.5 Step 5: Assessing risks, opportunities and adaptations
The idea of MEA Stress Testing is to identify risks to successful MEA implementation, detect emerging opportunities for more effective implementation, and to make the necessary adaptations and improvements to an MEA and its supporting policies to mitigate the risks and leverage the opportunities.
This process is a long-standing practice in engineering design to ensure the performance of airplanes, buildings and others structures, and in the wake of the global financial crisis of 2008, is an emerging practice in the banking sector (Rösch, D. and H. Scheule, 2008). For example, in the latter application, “instead of doing financial projections on a ‘best estimate’ basis, a company may do stress testing where they look at how robust a financial instrument is in certain crashes, asking questions such as: What happens if equity markets crash by more than x% this year? What happens if interest rates go up by at least y%? What if half the instruments in the portfolio terminate their contracts in the fifth year? What happens if oil prices rise by 200%?” (Wikipedia: ‘stress testing’).
Figure 12. An engineer’s wind tunnel for testing aircraft performance under different stress conditions.
The importance of doing a similar stress test for MEA implementation is intuitive. The overview of adaptive policy-making in section 2.4.2 highlighted the inherent complexity and uncertainty in intervening in dynamic socioeconomic and ecologic systems. Any assumptions regarding intended success in such high-stakes settings must be questioned and tested as a matter of prudence.
This section introduces a MEA Stress Testing tool based on a family of techniques and tools for identifying risks and opportunities, the basics of which are summarized as a preface to the introduction of the tool.
2.5.1 Introduction to Risk and Opportunities Analysis
Risk and opportunities analysis has become an important part of strategic planning in both the public and private sectors. However, it has seen less application to specific policies and policy instruments, but yet such analysis can yield important insights for successful policy performance.
Risk and opportunities analysis covers a range of techniques and analytic tools. For example, consider the following sampling of such tools.

46
The use of IEA tools for improved MEA implementation
SWOT is the acronym for Strengths, Weaknesses, Opportunities, and Threats. A four-quadrant chart, representing the four elements of the analysis, typically summarizes the process. SWOT analysis essentially involves itemizing the internal factors (strengths and weaknesses) and the external factors (opportunities and threats) that (could) affect performance, outcomes and overall effectiveness of the implementation process. One reason SWOT analysis is so versatile is its simplicity. The process is relatively easy to complete, edit, and update as needed (Agheyisi, 2003).
The PESTLE analysis is used to provide a context for the organization, strategy or policy in relation to the external environment. It covers Political, Economic, Social, Technological, Legal and Environmental factors and additional factors such as education and demographics could be included. The factors can be considered at macro (e.g., World-, CARICOM, specific country or micro (e.g., institutional or individual) level. Depending on the scope and scale of the assessment being undertaken, the key questions considered for each factor may include:5
n Which of the factors are of most importance now?
n Which are likely to be most important in a few years?
n What are the factors influencing any changes in the outcomes/effectiveness/success?
The SCENARIO PLANNING APPROACH is used in strategic planning and delivers an understanding of the array of factors that are important to policy performance and which of these factors are most uncertain. Popularized by Royal Dutch Shell in the 1970s, scenarios are “frameworks for structuring executive’s perceptions about alternative future environments in which their decisions might play out” (Ralston and Wilson, 2006). The benefits of scenario analysis and planning in the public policy setting are many. For example, according to Ralston and Wilson (2006), they can provide a decision-maker with:
n an integrated approach to thinking about our environment—a practical means for linking comprehensive, contradictory and incomplete information;
n a better understanding of the dynamics of change that we must address;
n clues as to the timing and nature of key moments of change, where one scenario becomes more likely than another to emerge;
n a fuller range of opportunities and threats, and variety of possible futures to think through their implications;
n an understanding of the formative forces of the future to increase our ability to perceive a wider range of strategic opportunities that might emerge;
n transparency of decision-making—given that the rationales underlying scenarios are readily available to managers who wish to use them;
n a thorough assessment of risks;
n a sound basis for continuous monitoring of the environment (broadly speaking) and strategy adjustment and
n strategies that exhibit a greater degree of resilience and flexibility.
The latter two points are particularly noteworthy for policy making. Strategies and policies which emerge from scenario planning will have been tested against a set of scenarios and contingency plans developed along with triggers to set contingency plans in motion at the necessary point in time.
5 Source: http://www.jiscinfonet.ac.uk/tools/pestle-swot

47
The use of IEA tools for improved MEA implementation
Discussion Question
What experiences have you had with regard to risk and opportunities analysis? How did these exercises help you prepare for the future?
2.5.2 Tool #5: Rapid MEA Stress Testing
This section presents an MEA Stress Testing tool designed to help policy-makers conduct a rapid stress test of a specific MEA. The tool represents a hybrid of the approaches described in the previous section. It borrows from the scenario planning approach in that the tool provides in advance a future scenario of socioeconomic and environmental drivers that can affect the future performance of MEAs. The policymaker must then immerse him or herself in this future scenario to assess the risks and opportunities (a mini SWOT type of analysis) to a specific MEA. More involved scenario planning exercises typically allocate considerable deliberative time and analytic effort to the identification of the most important and uncertain factors affecting performance, and while this is certainly recommended, is beyond the scope of this Rapid Stress Testing tool.
Questions to address in a Rapid MEA Stress Test include:
1. What factors are most important to the successful performance of your MEA?
2. Given the scenario provided to you (Box 4 as an example), what are the consequences for the important performance factors over the next 20 years?
3. What risks and opportunities do your future projections of important performance factors pose to the successful performance of your MEA?
4. What actions can mitigate the risks and what actions can leverage the opportunities? Actions can be no-regrets actions implemented now, or actions that can be triggered in the future when more information is known.
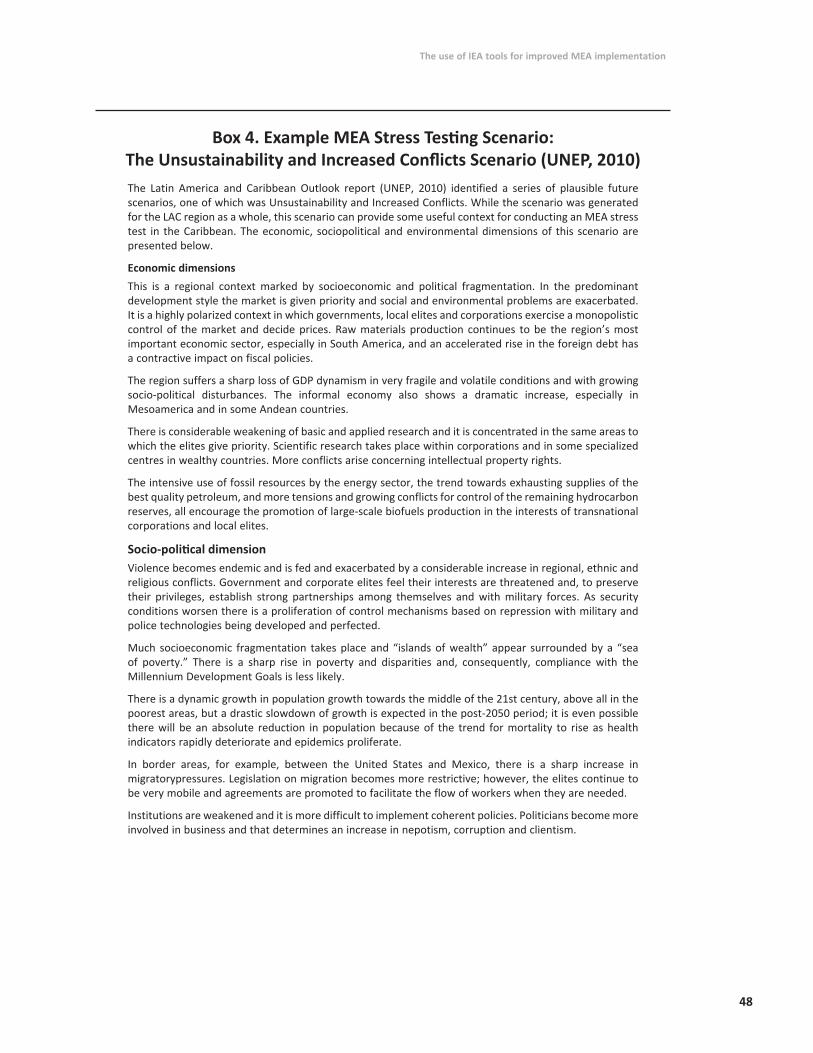
48
The use of IEA tools for improved MEA implementation
Box 4. Example MEA Stress Testing Scenario: The Unsustainability and Increased Conflicts Scenario (UNEP, 2010)The Latin America and Caribbean Outlook report (UNEP, 2010) identified a series of plausible future scenarios, one of which was Unsustainability and Increased Conflicts. While the scenario was generated for the LAC region as a whole, this scenario can provide some useful context for conducting an MEA stress test in the Caribbean. The economic, sociopolitical and environmental dimensions of this scenario are presented below.
Economic dimensionsThis is a regional context marked by socioeconomic and political fragmentation. In the predominant development style the market is given priority and social and environmental problems are exacerbated. It is a highly polarized context in which governments, local elites and corporations exercise a monopolistic control of the market and decide prices. Raw materials production continues to be the region’s most important economic sector, especially in South America, and an accelerated rise in the foreign debt has a contractive impact on fiscal policies.
The region suffers a sharp loss of GDP dynamism in very fragile and volatile conditions and with growing socio-political disturbances. The informal economy also shows a dramatic increase, especially in Mesoamerica and in some Andean countries.
There is considerable weakening of basic and applied research and it is concentrated in the same areas to which the elites give priority. Scientific research takes place within corporations and in some specialized centres in wealthy countries. More conflicts arise concerning intellectual property rights.
The intensive use of fossil resources by the energy sector, the trend towards exhausting supplies of the best quality petroleum, and more tensions and growing conflicts for control of the remaining hydrocarbon reserves, all encourage the promotion of large-scale biofuels production in the interests of transnational corporations and local elites.
Socio-political dimensionViolence becomes endemic and is fed and exacerbated by a considerable increase in regional, ethnic and religious conflicts. Government and corporate elites feel their interests are threatened and, to preserve their privileges, establish strong partnerships among themselves and with military forces. As security conditions worsen there is a proliferation of control mechanisms based on repression with military and police technologies being developed and perfected.
Much socioeconomic fragmentation takes place and “islands of wealth” appear surrounded by a “sea of poverty.” There is a sharp rise in poverty and disparities and, consequently, compliance with the Millennium Development Goals is less likely.
There is a dynamic growth in population growth towards the middle of the 21st century, above all in the poorest areas, but a drastic slowdown of growth is expected in the post-2050 period; it is even possible there will be an absolute reduction in population because of the trend for mortality to rise as health indicators rapidly deteriorate and epidemics proliferate.
In border areas, for example, between the United States and Mexico, there is a sharp increase in migratorypressures. Legislation on migration becomes more restrictive; however, the elites continue to be very mobile and agreements are promoted to facilitate the flow of workers when they are needed.
Institutions are weakened and it is more difficult to implement coherent policies. Politicians become more involved in business and that determines an increase in nepotism, corruption and clientism.

49
The use of IEA tools for improved MEA implementation
The elites, who tend to concentrate in isolated and protected urban settlements, encourage a culture based on increasing consumption. How to survive is a matter of crucial importance for poor sectors of the population and this leads to a resurgence of religious beliefs.
Subcultures are created, especially among excluded members of society, and family and community values are strengthened within these subgroups. Social mobility is very limited.
Environmental dimensionNo concern is shown about environmental sustainability because the elites do not consider it to be a priority while the excluded sectors face other more pressing anxieties, such as how to survive. The power elites and large corporations control and appropriate natural resources and there is no compliance with many international agreements on the environment.
Environmental degradation worsens. However, because they are of interest to the elites and transnational corporations, natural resources such as key forest areas in South America and Mesoamerica and the abundant water resources of the Southern Cone are preserved. Deforestation increases outside the protected areas and there is an accelerated loss of habitats and disappearance of species.
In these conditions the massive production of biofuel in the interests of the large transnational corporations and the local elites causes serious impacts, both social (for example, a worsening food crisis) and environmental (for example, fragile ecosystems’ serious health problems) due to the use of unsustainable formulas of biofuels production and utilization. This fever for biofuels encourages the use of genetically modified organisms, and invasive high-productivity plant species are introduced that have serious adverse socioenvironmental effects.
There are more frequent and intense extreme events and soil degradation intensifies in numerous areas. Although some coastal enclaves are preserved, in general, coastal degradation increases and there is a notable reduction in the services those ecosystems provide.
Surface and ground water pollution worsens because of a lack of compliance with national regulations. There is less rainfall in arid and semiarid areas and this, together with increased water consumption, puts pressure on water resources availability, particularly in these areas. There is a notable increase in the number of people living in water basins suffering from a severe shortage of water, and in the volume of sewage discharged into rivers.
In addition to the context provided in Box 4, it is useful in MEA stress testing to consider the potential future impacts of climate change as an integral part of any policy wind tunnel construction. Toward this we provide some additional context in this regard.
Climate change context for MEA stress testing
One of the major threats that countries are facing is climate change. We are already committed to changes in climate based on past emissions of GHGs into the atmosphere, and it is the future that is being decided. Some of the observed past changes include (UNEP, 2007):
n Rising temperatures: Of the last 12 years (1995–2006), 11 are among the 12 warmest since record-keeping began in 1850. Although temperature increases are observed globally, significant increases are evident in the northern Polar Regions.
n Rising sea levels: Sea levels across the globe have risen in a way consistent with the rising temperatures. The total global rise in the 20th century amounted to 17 centimetres.

50
The use of IEA tools for improved MEA implementation
n Melting ice caps: Satellite data recorded since 1978 show the annual average Arctic sea ice extent has shrunk by 2.7 per cent each decade, with larger decreases in summer. Mountain glaciers and average snow cover have declined in both hemispheres.
n Increased Precipitation: From 1900 to 2005, precipitation (rain, sleet and snow) increased significantly in parts of the Americas, northern Europe and northern and central Asia, resulting in floods, but declined in the Sahel, the Mediterranean, southern Africa and parts of southern Asia, causing serious droughts. Furthermore, floods and cyclones have occurred more frequently in the last 30 years, while other disasters not influenced by climate (such as earthquakes) are constant over years. However, a lack of systematic high quality observation mechanism prior to satellite observatories makes it difficult to detect a long-term trend.
A glimpse into the future indicates a range of potential climate change impacts. Developing future projections of the impacts of climate change consists of identifying scenarios of potential levels of GHGs based on projections of future socioeconomic development (Nakicenovic, et al., 2000). Using the estimated levels of GHGs corresponding to these future scenarios as the basis for simulations and applying general circulation models (GCMs)—which calculate the interrelationship of the elements of the earth system, we can thereby project future climate trends (Kropp and Scholze, 2009). The results of these models provide estimates of how basic climatic variables will develop in the future at the global level as a range of potential future impacts. Each step of projecting climatic variables includes uncertainties. IPCC uses different techniques to reduce these uncertainties including examining a number of future scenarios and an ensemble of GCMs to project changes in climatic variables (Jones et al., 2004).
Backed up by new studies and observations, the IPCC project indicates significant climatic changes will take place during this century, and that their ecological, economic and social impacts will be largely adverse (IPCC, 2007). Table 10 presents these projected impacts for the Caribbean region were reported with very high and high confidence.

51
The use of IEA tools for improved MEA implementation
Table 10. Key impacts of climate change with focus on the Caribbean (Mimuro et al., 2007)
Key impacts and levels of confidence Potential consequences of the impacts
Small islands, whether located in the tropics or higher latitudes, have characteristics which make them especially vulnerable to the effects of climate change, sea level rise, and extreme events (very high confidence).
This assessment confirms and strengthens previous observations show that characteristics such as limited size, proneness to natural hazards, and external shocks enhance the vulnerability of islands to climate change.
Sea level rise is expected to exacerbate inundation, storm-surge, erosion and other coastal hazards, thus threatening vital infrastructure, settlements and facilities that support the livelihood of island communities (very high confidence).
In the Caribbean and Pacific islands, more than 50 per cent of the population live within 1.5 kilometres of the shore. Almost without exception, international airports, roads and capital cities in the small islands of the Indian and Pacific Oceans and the Caribbean are sited along the coast, or on tiny coral islands. Sea level rise will exacerbate inundation, erosion and other coastal hazards, threaten vital infrastructure, settlements and facilities, and thus compromise the socioeconomic well-being of island communities and states.
There is strong evidence that under most climate change scenarios, water resources in small islands are likely to be seriously compromised (very high confidence).
Many islands in the Caribbean are likely to experience increased water stress as a result of climate change. Under all Special Report on Emissions Scenarios (SRES) scenarios, reduced rainfall in summer is projected for this region, so that it is unlikely that demand would be met during low rainfall periods. Increased rainfall in winter is unlikely to compensate, due to lack of storage and high runoff during storms.
Climate change is likely to heavily impact coral reefs, fisheries and other marine-based resources (high confidence).
Fisheries make an important contribution to the GDP of many island states. Changes in the occurrence and intensity of El Niño-Southern Oscillation (ENSO) events are likely to have severe impacts on commercial and artisanal fisheries.
On some islands, especially those at higher latitudes warming has already led to the replacement of some local species (high confidence)
Mid- and high-latitude islands are virtually certain to be colonized by non-indigenous invasive species, previously limited by unfavourable temperature conditions.
It is very likely that subsistence and commercial agriculture on small islands will be adversely affected by climate change (high confidence).
Sea-level rise, inundation, seawater intrusion into fresh water lenses, soil salinization, and decline in water supply are very likely to adversely impact coastal agriculture. Away from the coast, changes in extremes (e.g., flooding and drought) are likely to have a negative effect on agricultural production.
New studies confirm previous findings that the effects of climate change on tourism are likely to be direct and indirect, and largely negative (high confidence).
Whereas a warmer climate could reduce the number of people visiting small islands in low latitudes, it could have the reverse effect in mid- and high-latitude islands. However, water shortages and increased incidence of vector-borne diseases may also deter tourists.

52
The use of IEA tools for improved MEA implementation
Exercise 5: Rapid MEA Stress Testing
Required for the exercise: A specific MEA to focus on; A group of ~5 persons familiar with the elements of the MEA.
Task #1: Identify Performance Factors and Describe their Evolution
a) What factors are most important to the successful performance of your MEA?
b) Given the scenario provided to you (Box 4 as an example), what are the consequences for the important performance factors over the next 20 years (i.e., how might these factors evolve)?
Task #2: Identify Risks and Opportunities for Successful MEA Performance
a) What risks and opportunities do your future projections of important performance factors pose to the successful performance of your MEA?
Task #3: Identify Mitigating and Leveraging Actions
a) What actions can mitigate the risks and what actions can leverage the opportunities?
Below is an illustrative output from a Rapid MEA Stress Test exercise conducted for the LBS protocol.
Table 11. Example of assessing risks and opportunities in the Caribbean region for LBS protocol
Key consequences of the scenarios on the LBS:
1. Increased tourism activity: Coastal tourism development is projected to increase; intensifying pressure on coastal ecosystems, populations migrate into tourism belts.
2. Projected population growth and urban development: Increased food production is necessary and habitat destruction for new settlements thereby putting pressure on terrestrial ecosystems.
Risks and Opportunities for policy improvement:
n Unplanned development leads to pollution in the marine environment. The Act outlaws pollution; however, enforcement is an issue and needs to coordinate with Planning Act and CZ Policies (including health, tourism etc.) for sewage issues. The Act needs to speak to the increased pressure placed on the marine resources which will put further pressures on already over-stretched enforcement mechanisms particularly in MPAs.
n Increase pressure/conflict for the use of coastal zones/habitats. Increased land degradation and pollution and also the effects of Climate Change. There is a need therefore for a stronger Land-Use Plan and a CZM framework.
Final suggestions based on risks and opportunities
n Further collaboration between agencies/departments and legislation/regulations; this may provide an opportunity for institutional and public sector reform.
n Building awareness and ownership of natural resources and health issues.
n Improve agricultural practices.
n Improving legislation to provide for improved resilience to natural disasters through better management of environmental resources.
n Opportunities for funding under the MEA conventions and other financial institutions.
53
The use of IEA tools for improved MEA implementation
n Improve water/soil/air quality.
n Creation of air emissions standards.
n Assisting in capacity building, technology transfer, provisions of scientific/technical expertise, training and mobilization of resources.
n More informed national decision making for development through establishing national and regional data and information management systems.
n Result in improved health of the general public and visitors through decreased incidents of pollution-related illnesses.
n Improving legislation to provide for improved building codes and efficient effluent discharge systems
Developed by the workshop participants in Suriname (2011)
2.6 Step 6: Preparing the MEA policy planning brief
The MEA Outcome Mapping process, summarized again below in Figure 13, was created to bring the tools of UNEP’s integrated environmental assessment approach to bear on the key challenges associated with MEA implementation in the Caribbean region. This step in MEA Outcome Planning summarizes the results of the tools presented in the previous five steps in the form of a policy brief. The audience for the policy brief is at the Permanent Secretary and Minister level with the purpose to demonstrate the relevance of a particular MEA(s) to national development priorities and other line departments, and in so doing, garner additional support for implementation and enhanced impact.
The key areas of summation in the MEA Policy Brief include the following:
1. Overview of commitments in the [name of specific MEA(s)] and importance to national development priorities—This is an executive summary of the results from Tool #1 MEA Priorities Mapping which identifies the ecosystem services supported by the MEA and clarifies how these services each advance human well-being.
2. Important synergies among MEAs being implemented and relevance to line departments and other stakeholders—This is an executive summary of the results of Tool #2 MEA Synergies Mapping, which was designed to help illustrate the commonalities among the various MEAs that have been ratified by a country, and thus increase the efficiency of implementation efforts. This tool utilized the Driving Forces-Pressure-State-Impact-Response (DPSIR) analysis framework to obtain a better systems and comprehensive view of an MEA.
3. Possible future MEA outcome targets—This is an executive summary of the results of Tool #3 Setting the Challenge Scenario. This tool used insights gleaned from the first two sessions to provide guidance for identifying key progress indicators and targets related to future MEA outcomes. It sets an MEA Challenge Scenario for the future, recognizing the synergies among MEAs and their relevance to national development priorities.
4. Recommended policy portfolio for improving MEA implementation and impact—This is an executive summary of the results of Tool #4 MEA Policy Mapping that used the DPSIR analysis framework to inventory the key policies in support of a specific MEA, identify major gaps, and make recommendations for achieving the desired future MEA outcomes; and

54
The use of IEA tools for improved MEA implementation
5. Risks and Opportunities for Achieving MEA Outcomes—This is an executive summary of the results of Tool #5 MEA Stress Testing which was designed to help politicians and policy-makers understand, with supporting evidence, the importance of successful MEA implementation for advancing national development priorities.
Figure 13. Steps in MEA Outcome Planning
Exercise 6: Preparing the MEA Policy BriefRequired for the exercise: A specific MEA to focus on; A group of ~5 persons familiar with the elements of the MEA.
Task #1: Prepare, on your own or in groups an MEA policy brief using the template provided below.
Task #2: Hand your policy brief to the person to your right to review and discuss potential improvements.
Task #3: Finalize your policy brief and be prepared to present in plenary.
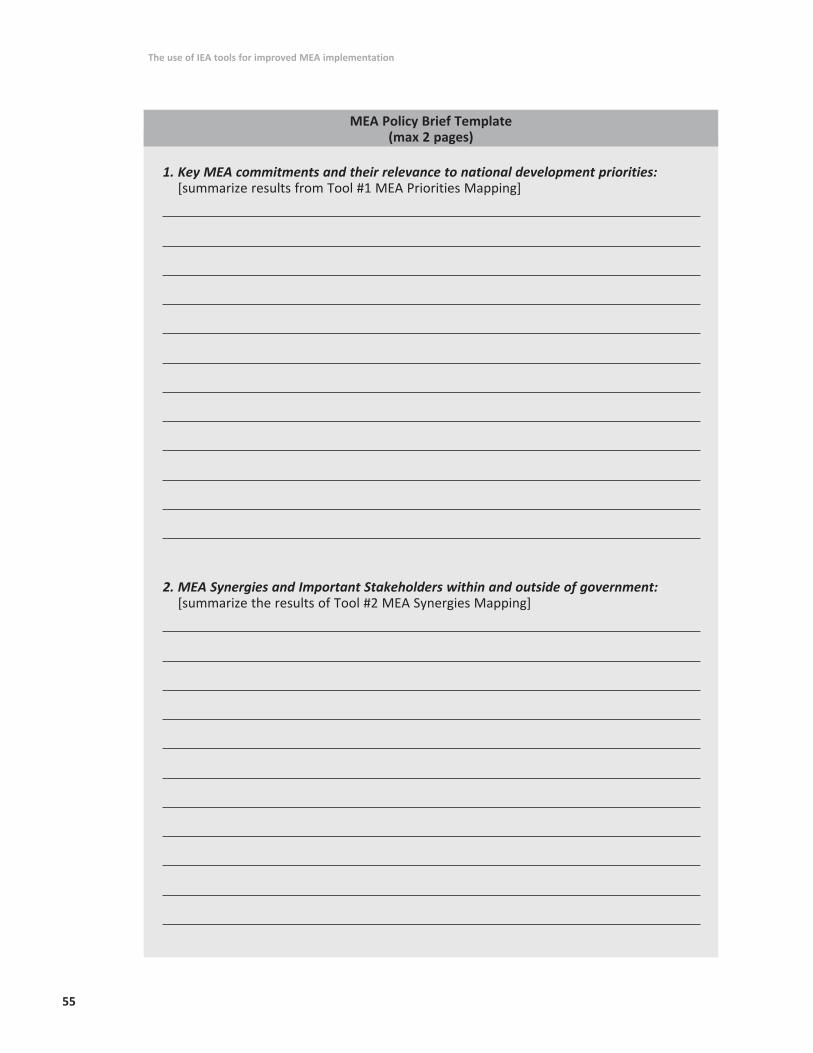
55
The use of IEA tools for improved MEA implementation
MEA Policy Brief Template (max 2 pages)
1. Key MEA commitments and their relevance to national development priorities: [summarize results from Tool #1 MEA Priorities Mapping]
2. MEA Synergies and Important Stakeholders within and outside of government: [summarize the results of Tool #2 MEA Synergies Mapping]

56
The use of IEA tools for improved MEA implementation
3. Possible future MEA outcome targets: [summarize the results of Tool #3 MEA Challenge Scenario]
4. Existing MEA Policy Inventory and Recommendations: [summarize the results of Tool #4 MEA Policy Mapping]

57
The use of IEA tools for improved MEA implementation
5. Risks and Opportunities for Achieving MEA Outcomes: [summarize the results of Tool #5 Policy Stress Testing]
Be prepared to present your policy brief in plenary

58
The use of IEA tools for improved MEA implementation
Table 12. MEA Policy Brief Example: LBS protocol
Executive Summary:Small Island Developing States (SIDS) and coastal communities are very dependent on their coastal and marine environments for continued economic advancement. The fishing, shipping and water-based tourism industries contribute significantly to Gross Domestic Product (GDPs). Coastal environments also act as a natural barrier, protecting coastal shorelines by dissipating wave and storm energy. According to the World Resource Institute, coral reefs contribute annually over US$6 billion to the Wider Caribbean Region. Yet, despite their value, coastal habitats are under threat. Increased development in coastal areas, a result of increasing populations and a growing tourism industry is exerting increased pressure on these habitats. Land-based activities, including construction, deforestation and poor agricultural practices, are depositing an increasing load of nutrients and sediment into coastal waters. The Caribbean Environment Programme of the United Nations Environment Programme (UNEP–CEP) has indicated that land-based sources of pollution constitute the greatest threat to Caribbean public health and coastal and marine habitats. Specifically, improper sewage treatment and disposal, as well as sedimentation, have been identified as the biggest threats to the integrity coastal waters and habitats.
Key MEA commitments and their relevance to national development:The Convention for the Protection and Development of the Marine Environment of the Wider Caribbean Region (Cartagena Convention) entered into force in 1986. Under the Convention, State Parties are required to take appropriate measures to prevent, reduce and control pollution of the Caribbean Sea. The LBS Protocol seeks to respond to the need to protect the marine environment from land-based point and non-point sources of marine pollution by outlining the types of control and management responses required for addressing land-based issues. It also focuses on the designation of coastal waters—class I and class II as it relates to acceptable water quality.
MEA Synergies and Important Stakeholders:The Convention is augmented by three protocols, the Oil Spills Protocol, Specially Protected Areas and Wildlife (SPAW) Protocol and the Land-Based Sources of Marine Pollution (LBS) Protocol. Target groups included government organizations (CZM, Fisheries, Environment, Planning, Agriculture, Health, Forestry, Water Resource Management, Tourism, Communications and Works, Finance, Lands and Survey, Public Utilities, Pesticides Control Unit), Non-Governmental and Civil Society Organizations (specifically Conservation Groups) and Private Sector.
MEA Outcome Targets:
1. Establish and increase sewage treatment plants and appropriate infrastructure for drainage
2. Monitor water quality to decrease fecal coliforms to LBS protocol standards and increase water quality
3. Establish recreational water monitoring
4. Establishing an environmental policy and action plans on public education and outreach
5. Monitor increased awareness of conservation issues by 10 per cent over five years
6. Improve agricultural management—regulate use of pesticides/herbicides/fertilizers; convert the agricultural sector from a chemical base to an organic base by 2030
7. Incorporate a full regulatory regime with respect to mining and construction
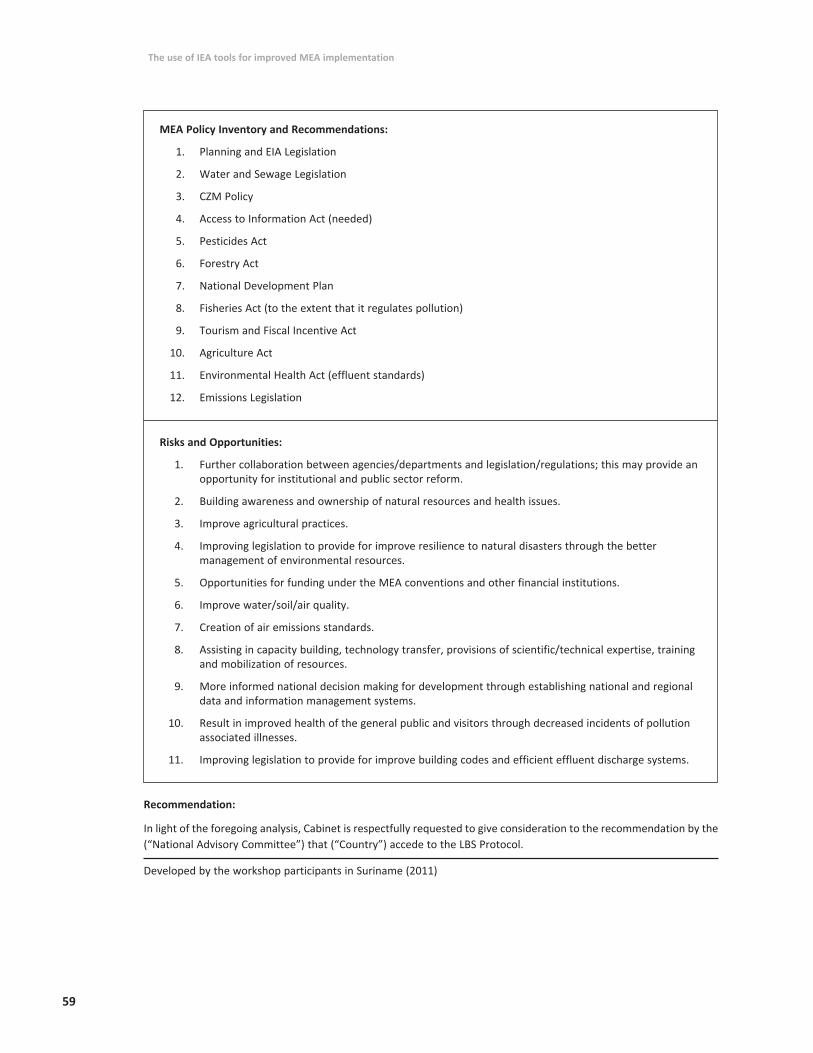
59
The use of IEA tools for improved MEA implementation
MEA Policy Inventory and Recommendations:
1. Planning and EIA Legislation
2. Water and Sewage Legislation
3. CZM Policy
4. Access to Information Act (needed)
5. Pesticides Act
6. Forestry Act
7. National Development Plan
8. Fisheries Act (to the extent that it regulates pollution)
9. Tourism and Fiscal Incentive Act
10. Agriculture Act
11. Environmental Health Act (effluent standards)
12. Emissions Legislation
Risks and Opportunities:
1. Further collaboration between agencies/departments and legislation/regulations; this may provide an opportunity for institutional and public sector reform.
2. Building awareness and ownership of natural resources and health issues.
3. Improve agricultural practices.
4. Improving legislation to provide for improve resilience to natural disasters through the better management of environmental resources.
5. Opportunities for funding under the MEA conventions and other financial institutions.
6. Improve water/soil/air quality.
7. Creation of air emissions standards.
8. Assisting in capacity building, technology transfer, provisions of scientific/technical expertise, training and mobilization of resources.
9. More informed national decision making for development through establishing national and regional data and information management systems.
10. Result in improved health of the general public and visitors through decreased incidents of pollution associated illnesses.
11. Improving legislation to provide for improve building codes and efficient effluent discharge systems.
Recommendation:
In light of the foregoing analysis, Cabinet is respectfully requested to give consideration to the recommendation by the (“National Advisory Committee”) that (“Country”) accede to the LBS Protocol.
Developed by the workshop participants in Suriname (2011)

60
The use of IEA tools for improved MEA implementation
ReferencesAgard et al. (2009). Caribbean Sea ecosystem assessment. Caribbean Marine Studies - Special Edition, 85.
Agheyisi R. (2003). Making Smart IT Choices: Understanding Value and Risk in Government IT Investments Report Content Writer, pp. 2; Center for Technology in Government, www.ctg.albany.edu.
Axelrod, R., & Cohen, M.D. (2000). Harnessing complexity: Organizational Implications of a Scientific Frontier. New York: Basic Books. Funded by the U.S. Department of Defense.
Barg, S., & Tyler, S. (2009). Decentralization of decisionmaking, In D. Swanson, & S. Bhadwal (Eds.), Creating adaptive policies: A guide for policymaking in an uncertain world. New Delhi/IDRC, Ottawa: Sage.
Berkes, F., Colding, J. & Folke. C. (2003). Navigating social-ecological systems: Building resilience for complexity and change. United Kingdom: Cambridge University Press.
Bhadwal, S., Barg, S., & Swanson, D. (2009). Automatic policy adjustment. In D. Swanson, & S. Bhadwal (Eds.), Creating adaptive policies: A guide for policymaking in an uncertain world. New Delhi/IDRC, Ottawa: Sage.
Broca S. S. (2002). Food insecurity, poverty and agriculture: A concept paper. ESA Working Paper No. 02-15, Agricultural and Development Economics Division, The Food and Agriculture Organization (FAO), Rome, pp. 87.
Burke, L., & Maidens, J. (2005, August). Caribbean reefs in danger. Retrieved from http://earthtrends.wri.org/features/view_feature.php?fid=55&theme=1
Chase, V. (2008). Water forum of the Americas–Report of the Caribbean Sub-Region. Interamerican Development Bank.
Crossen T. E. (2003). Multilateral environmental agreements and the compliance continuum. Bepress Legal Series 36, pp. 43. Retrieved from http://law.bepress.com/expresso/eps/36
Curran D., & Stobbe T. (2010). Local government policy options to protect agricultural land and improve the viability of farming in metro Vancouver. Prepared for Metro Vancouver, pp. 71. Retrieved from http://www.metrovancouver.org/planning/development/agriculture/AgricultureDocs/Local_Government_Policy_Options_to_Protect_Agricultural_Land.pdf
Echeverria J., & Ibrahim, M. (2009). Incentive and market-based mechanisms to prevent land degradation: Framework and methodology for applicability. Working paper. CATIE and The Global Mechanism XX, pp. 50
Geels, F.W., Elzen, B., & Green, K. (2004). General introduction: System innovation and transitions to sustainability. In B. Elzen, F.W. Ges and K. Green (Eds.), System innovation and the transition to sustainability: Theory, evidence and policy. Cheltenham: Edward Elgar.
Glouberman, S., Campsie, P., Gemar, M., & Miller, G. (2003). A toolbox for improving health in cities: A discussion paper. Ottawa: Caledon Institute for Social Policy.
Gray, K.R. (2000). International environmental impact assessment: potential for a multilateral environmental agreement. Colorado Journal of International Environmental Law & Policy, 11(1), 83-128.
Grin, J., Rotmans, J., & Schot, J. (2010). Transitions to sustainable development. New directions in the study of long term transformative change. New York: Routledge.

61
The use of IEA tools for improved MEA implementation
Heileman S. & Walling L. (2008). IWCam indicator mechanism and capacity assessment – Part One. GEF Project on “Integrating Watershed & Coastal Areas Management in Caribbean Small Island Developing States (GEF-IWCAM)”, pp. 106.
Holling, C.H. (1978). Adaptive environmental assessment and management. New York: John Wiley and Sons.
IAASTD (2009). International Assessment of Agricultural Science and Technology for Development: Global Report. B.D. McIntyre, H.R. Herren, J. Wakhungu and R.T. Watson (Editors). Washington, D.C.: Island Press.
Intergovernmental Panel on Climate Change (2007). Summary for policymakers. In M.L. Parry, O.F. Canziani, J.P. Palutikof, P.J. van der Linden & C.E. Hanson (eds.), Climate change 2007: Impacts, adaptation and vulnerability. Contribution of Working Group II to the Fourth Assessment Report of the Intergovernmental Panel on Climate Change (pp. 7–22). Cambridge, U.K.: Cambridge University Press.
Jaeger, C.C., Kasemir, B., Stoll-Kleemann, S., Schibli, D. & Dahinden U. (2000). Climate change and the voice of the public. Integrated Assessment 1, 339–349
Jones, R.G., Noguer, M., Hassell, D.C., Hudson, D., Wilson, S.S., Jenkins, G.J. & Mitchell, J.F.B. (2004). Generating high resolution climate change scenarios using PRECIS. Exeter, U.K.: Met Office Hadley Centre.
Land and Surveys Department, University of Belize, & UNEP (2010). Belize environment outlook. Belize: Ministry of Natural Resources and the Environment.
Lee K. (1993). Compass and gyroscope: Integrating science and politics for the environment. Washington, DC: Island Press
Majone, G., & Wildawsky, A. (1978). Implementation as evolution. Policy Studies Review 12, 103–117.
Millennium Ecosystem Assessment. (2003). Ecosystems and human well-being: A framework for assessment. New York: Island Press.
Munang R., Liu, J. & Thiaw, I. (2009). The role of ecosystem management in climate change adaptation and disaster risk reduction. Copenhagen Discussion Series. Nairobi: UNEP.
Narayan, D. (2002). Empowerment and poverty reduction. Washington, DC: World Bank).
Raskin, P., Banuri, T., Gallopin, G., Gutman, P., Hammond, A., Kates, R. & Swart, R. (2002). Great transition: The promise and lure of the times ahead. Stockholm Environment Institute, Boston and IEA Manual – Module 6. UNEP, IISD, Winnipeg, pp. 45.
Restrepo, J., Zapata, P., Diaz, J. M., Garzon-Ferreira, J., & Garcia, B. C. (2006). Fluvial fluxes into the Caribbean Sea and their impact on coastal ecosystems: The Magdalena River, Colombia. Global and Planetary Change, 33-49.
Rihani, S. (2002). Complex systems theory and development practice: Understanding non-linear realities. New York: Zed Books.
Robinson, J. (2003). Future Subjunctive: backcasting as social learning. Futures 35(8), pp. 839–856.
Rockström, J., Steffen, W., Noone, K., Persson, Å., Chapin III, F., S. Lambin, E. . . . Foley, J. (2009). Planetary boundaries: Exploring the safe operating space for humanity. Ecology and Society 14(2): 32. Retrieved from URL: http://www.ecologyandsociety.org/vol14/iss2/art32/
62
The use of IEA tools for improved MEA implementation
Rondinelli, D.A. (1993). Development projects as policy experiments: An adaptive approach to development administration. 2nd Edition. New York: Routledge.
Rösch, D. and H. Scheule (2008). Stress testing for financial institutions. Risk Books: Available at http://riskbooks.com/stress-testing-for-financial-institutions.
Roy, D., Nair, S., & Venema, H.D. (2009). Self-organization and social networking. In D. Swanson, S. Bhadwal (Eds.), Creating adaptive policies: A guide for policymaking in an uncertain world. New Delhi/IDRC, Ottawa: Sage Publications.
Ruitenbeek, J. and C. Cartier. (2001). The invisible wand: Adaptive co-management as an emergent strategy in complex bio-economic systems. Centre for International Forestry Research. ISSN 0854-9818.
Sabatier, P. & Jenkins-Smith, H. (1999). The advocacy coalition framework: An assessment. In P. Sabatier (Ed.) Theories of the policy process. Boulder, Colorado: Westview Press
Sartorius, C. & Zundel S. (Eds.) (2005). Time strategies, innovation and environmental policy. Cheltenham: Edward Elgar.
Senge, P. (1990). The fifth discipline: The art and practice of the learning organization. New York: Currency Doubleday.
Steinemann, A. & Norton, B. (2003). Environmental Values and Adaptive Management. In B. Norton (Ed.), Searching for sustainability. Cambridge, U.K.: Cambridge University Press.
Swanson, D. & Tomar, S. (2009). Integrated and forward-looking analysis. In D. Swanson & S. Bhadwal (Eds.), Creating adaptive policies: A guide for policy-making in an uncertain world, New Delhi/IDRC Ottawa: Sage Publications.
Swanson, D. A., and S. Bhadwal, (Eds.) (2009). Creating adaptive policies: A guide for policy-making in an uncertain world. New Delhi/IDRC Ottawa: Sage Publications.
Swanson, D. A., S. Barg, S. Tyler, H. D. Venema, et al. (2010). Seven Tools for Creating Adaptive Policies. Technological Forecasting & Social Change 77 (2010), 924–939.
Swanson, D., & Tomar, S. (2009). Integrated and forward-looking analysis. In D. Swanson & S. Bhadwal (Eds.), Creating adaptive policies: A guide for policymaking in an uncertain world. New Delhi / IDRC Ottawa: Sage Publications.
Tomar, S.,& Swanson, D., (2009). Formal policy review and continuous learning. In D. Swanson, S. Bhadwal (Eds.), Creating adaptive policies: A guide for policymaking in an uncertain world. New Delhi/IDRC Ottawa: Sage Publications.
Trinidad and Tobago Central Statistics Office. (Undated). Chapter 9 - Coastal Areas. Retrieved from http://www.cso.gov.tt/statistics/Statistics/Chapter%209%20part%201.pdf
U.K. (2003). Trying it out: The role of “pilots” in policy-making [Report of a review of government pilots]. U.K.: Government Chief Social Researcher’s Office, Cabinet Office
U.N. Conference on the Human Environment. Report of the United Nations Conference on the Human Environment. U.N. Doc. A/CONF.48/14 (1972), 11 I.L.M. 1416
UNEP (2000). The Ecosystem Approach: Decision Taken at the Fifth Conference of the Parties to the Convention on Biological Diversity, United Nations Environment Program, Retrieved July 2008 from Convention on Biological Diversity: www.cbd.int/decisions/?m=COP-05&id=7148&lg=0, 2000.
UNEP (2009a). Mainstreaming poverty-environment linkages into development planning: A handbook for practitioners. UNDP-UNEP Poverty-Environment Facility, Nairobi, pp. 134.
63
The use of IEA tools for improved MEA implementation
UNEP (2009b). Scaling-up the UNDP-UNEP poverty-environment initiative. Annual Progress Report. UNDP-UNEP Poverty-Environment Initiative, Gigiri, pp. 134, Kenya
UNEP (2010). Global environment outlook: Latin America and the Caribbean – GEO LAC 3. United Nations Environment Programme (UNEP), Regional Office for Latin America and the Caribbean, Panama city, pp. 308
UNEP (2007). Global environment outlook 4: Environment for development. United Nations Environment Programme. Retrieved from http://www.unep.org/geo/GEO_Products.asp.
UNEP (2008). IEA Manual – Module 5 and 6. UNEP, IISD, Winnipeg, pp. 55 and 45.
UNEP (2010). Latin America and the Caribbean - Environment Outlook. Panama City: United Nations Environment Programme.
Van den Bergh, J.C.M., Faber, A., Idenburg, A.M., & Oosterhuis, F.H. (2007). Evolutionary economics and environmental policy: Survival of the greenest. Cheltenham: Edward Elgar.
Victor, D.G., K. Raustiala and E.B. Skolnikoff. (1998). The implementation and effectiveness of international environmental commitments. Cambridge, MA: MIT Press.
Walker, W.E., & Marchau, V.A.W.J., (2003). Dealing with uncertainty in policy analysis and policy-making. Integrated Assessment 4(1): 1–4
Walker, W.E., Marchau, V.A.W.J., & Swanson, D. (2010). Addressing deep uncertainty using adaptive policies: Introduction to section 2. Technological Forecasting & Social Change 77 (2010)
Walker, W.E., Rahman, S.A., & Cave, J. (2001). Adaptive policies, policy analysis, and policy-making. European Journal of Operational Research 128: 282-289.
Wunder, S. (2005). Payments for environmental services: Some nuts and bolts. CIFOR, Occasional Paper No.42

64
The use of IEA tools for improved MEA implementation
AppendixAppendix A: Indicators and Targets for Planetary Boundaries
Table A-1. Planetary Boundaries (Rockström et al., 2009; retrieved from Stockholm Resilience Centre6)
Earth System process Control variable Threshold avoided or influenced by slow variable
Planetary boundary (zone of uncertainty)
State of knowledge
Climate change Atmospheric CO2 concentration, ppm; Energy imbalance at Earth’s surface, W m-2.
Loss of polar ice sheets. Regional climate disruptions. Loss of glacial fresh water supplies. Weakening of carbon sinks.
Atmospheric CO2 concentration: 350 ppm (350-550 ppm) Energy imbalance:+1 W m-2 (+1.0 – +1.5 W m-2).
1. Ample scientific evidence. 2. Multiple sub-system thresholds. 3. Debate on position of boundary.
Ocean acidification Carbonate ion concentration, average global surface ocean saturation state with respect to aragonite (Ωarag).
Conversion of coral reefs to algal-dominated systems. Regional elimination of some aragonite- and high-magnesium calcite-forming marine biota Slow variable affecting marine carbon sink.
Sustain ≥ 80 % of the preindustrial aragonite saturation state of mean surface ocean, including natural diel and seasonal variability (≥80 % - ≥70 %).
1. Geophysical processes well-known. 2. Threshold likely. 3. Boundary position uncertain due to unclear ecosystem response.
Stratospheric ozone depletion
Stratospheric O3 concentration, DU.
Severe and irreversible UV-B radiation effects on human health and ecosystems.
<5% reduction from preindustrial level of 290 DU (5 - 10 %).
1. Ample scientific evidence. 2. Threshold well established. 3. Boundary position implicitly agreed and respected.
Atmospheric aerosol loading
Overall particulate concentration in the atmosphere, on a regional basis.
Disruption of monsoon systems. Human health effects. Interacts with climate change and fresh water boundaries.
To be determined 1. Ample scientific evidence. 2. Global threshold behaviour unknown. 3. Unable to suggest boundary yet.
6 http://www.stockholmresilience.org/research/researchnews/tippingtowardstheunknown/quantitativeevolutionofboundaries.4.7cf9c5aa121e17bab42800043444.html

65
The use of IEA tools for improved MEA implementation
Nitrogen and phosphorus inputs to the biosphere and oceans
P: inflow of phosphorus to ocean, increase compared to natural background weathering N: amount of N2 removed from atmosphere for human use, Mt N yr-1
P: avoid a major oceanic anoxic event (including regional), with impacts on marine ecosystems. N: slow variable affecting overall resilience of ecosystems via acidification of terrestrial ecosystems and eutrophication of coastal and fresh water systems.
P: < 10× (10× - 100×) N: Limit industrial and agricultural fixation of N2 to 35 Mt N yr-1, which is ~ 25% of the total amount of N2 fixed per annum naturally by terrestrial ecosystems (25- 35%)
P: (1) Limited knowledge on ecosystem responses; (2) High probability of threshold but timing is very uncertain; (3) Boundary position highly uncertain. N: (1) Some ecosystem responses known; (2) Acts as a slow variable, existence of global thresholds unknown; (3) Boundary position highly uncertain.
Global fresh water use
Consumptive blue water use, km3 yr-1.
Could affect regional climate patterns (e.g., monsoon behaviour). Primarily slow variable affecting moisture feedback, biomass production, carbon uptake by terrestrial systems and reducing biodiversity
< 4,000 km3 yr-1 (4,000 - 6,000 km3 yr-1)
1. Scientific evidence of ecosystem response but incomplete and fragmented. 2. Slow variable, regional or subsystem thresholds exist. 3. Proposed boundary value is a global aggregate, spatial distribution determines regional thresholds.
Land system change Percentage of global land cover converted to cropland.
Trigger of irreversible & widespread conversion of biomes to undesired states. Primarily acts as a slow variable affecting carbon storage and resilience via changes in biodiversity and landscape heterogeneity.
≤ 15% of global ice-free land surface converted to cropland (15 – 20%).
1. Ample scientific evidence of impacts of land cover change on ecosystems, largely local and regional. 2. Slow variable, global threshold unlikely but regional thresholds likely. 3. Boundary is a global aggregate with high uncertainty, regional distribution of land system change is critical.

66
The use of IEA tools for improved MEA implementation
* State of knowledge regarding three factors: 1. Basic understanding of Earth system process. 2. Existence of threshold behaviour. 3. Position of the boundary
Biodiversity loss Extinction rate , extinctions per million species per year (E/MSY).
Slow variable affecting ecosystem functioning at continental and ocean basin scales. Impact on many other boundaries – C storage, fresh water, N and P cycles, land systems. Massive loss of biodiversity unacceptable for ethical reasons.
< 10 E/MSY (10 – 100 E/MSY)
1. Incomplete knowledge on the role of biodiversity for ecosystem functioning across scales. 2. Thresholds likelyat local and regional scales 3. Boundary position highly uncertain.
Chemical pollution For example, emissions, concentrations, or effects on ecosystem and Earth system functioning of persistent organic pollutants (POPs), plastics, endocrine disruptors, heavy metals, and nuclear waste.
Thresholds leading to unacceptable impacts on human health and ecosystem functioning possible but largely unknown. May act as a slow variable undermining resilience and increase risk of crossing other threshold.
To be determined 1. Ample scientific evidence on individual chemicals but lacks an aggregate, global-level analysis. 2. Slow variable, large-scale thresholds unknown. 3. Unable to suggest boundary yet.

67
The use of IEA tools for improved MEA implementation
Appendix B: Principles of Adaptive Policy-making
Table B-1. Synthesis of Principles for Adaptive Policy-making (adapted from Swanson and Bhadwal, 2009)
Policy-making Stages
Synthesis of Principles for Adaptive Policy-making and Governance
Policy set-up
Understanding the issue and policy objective setting
Conduct integrated and forward-looking analysis (Swanson and Tomar, 2009)
nUnderstand interactions with the natural, built and social environment (Glouberman et al., 2003; Holling, 1978)
n Look for linkages in unusual places (Ruitenbeek and Cartier, 2001)
n Respect history and understand local conditions, strengths and assets (Glouberman et al., 2003)
nDetermine significant connections rather than measure everything (Holling, 1978)
nScenario planning helps structure the perceptions of executives about alternative future settings in which their decisions might play out (Ralston and Wilson, 2006)
Use multi-stakeholder deliberation (Tyler, 2009)
nPublic discourse and open deliberation are important elements of social learning and policy adaptation (Steinemann and Norton, 2003)
nBuild trust, collaboration, consensus, identity, values, and capacity for social action (Forester, 1999)
nUse epistemic communities to inform policy design and implementation (Haas, 1992)
nCo-design and learning (Grin et al., 2010)

68
The use of IEA tools for improved MEA implementation
Policy design and implementation
Allow for diversity, innovation and selection
nPromote variation and redundancy (Berkes et al., 2003; Holling, 1978; Axelrod and Cohen, 2000; Glouberman et al., 2003; Nair and Roy, 2009)
n Policies should test clearly formulated hypotheses about the behaviour of an ecosystem being changed by human use (Lee, 1993)
nBalance exploitation of existing strategies with exploration of new ideas (Axelrod and Cohen, 2000)
n Learning and adaptation of the policy be made explicit at the outset and the inevitable policy changes become part of a larger, recognized process (Walker and Marchau, 2003)
Enable self-organization and networking (Roy et al., 2009)
nCreate opportunity for self-organization and build networks of reciprocal interaction (Axelrod and Cohen, 2000; Berkes et al., 2003; Glouberman et al., 2003)
nEnsure that social capital remains intact (Ruitenbeek and Cartier, 2001)
nPromote effective neighbourhoods of adaptive cooperation (Axelrod and Cohen, 2000)
n Members of the population have to be free and able to interact (Rihani, 2002)
nFacilitate copying of successes (Axelrod and Cohen, 2000; Ruitenbeek and Cartier, 2001)
Decentralization of decision-making (Barg and Tyler, 2009)
nMatch scales of ecosystems and governance and build cross-scale governance mechanisms (Berkes et al., 2003)
nClear identification of the appropriate spatial and temporal scale is vital to integrated management (the ecosystem approach; UNEP, 2000)
Monitoring and continuous learning and improvement
Formalize policy review and continuous improvement (Tomar and Swanson, 2009)
nIntegral to design are the monitoring and remedial mechanisms—should not be post ad hoc additions after implementation (Holling, 1978)
nFine-tune the process (Glouberman et al., 2003)
nConduct selection (Glouberman et al., 2003)
nUse policy pilots (U.K. Cabinet Office, 2003)
nMake use of automatic policy adjustment (Bhadwal et al., 2009)
nPolicies should be expected to evolve in their implementation (Majone and Wildavsky, 1978; Sabatier and Jenkins-Smith, 1999)
nUnderstand carefully the attribution of credit (Axelrod and Cohen, 2000)
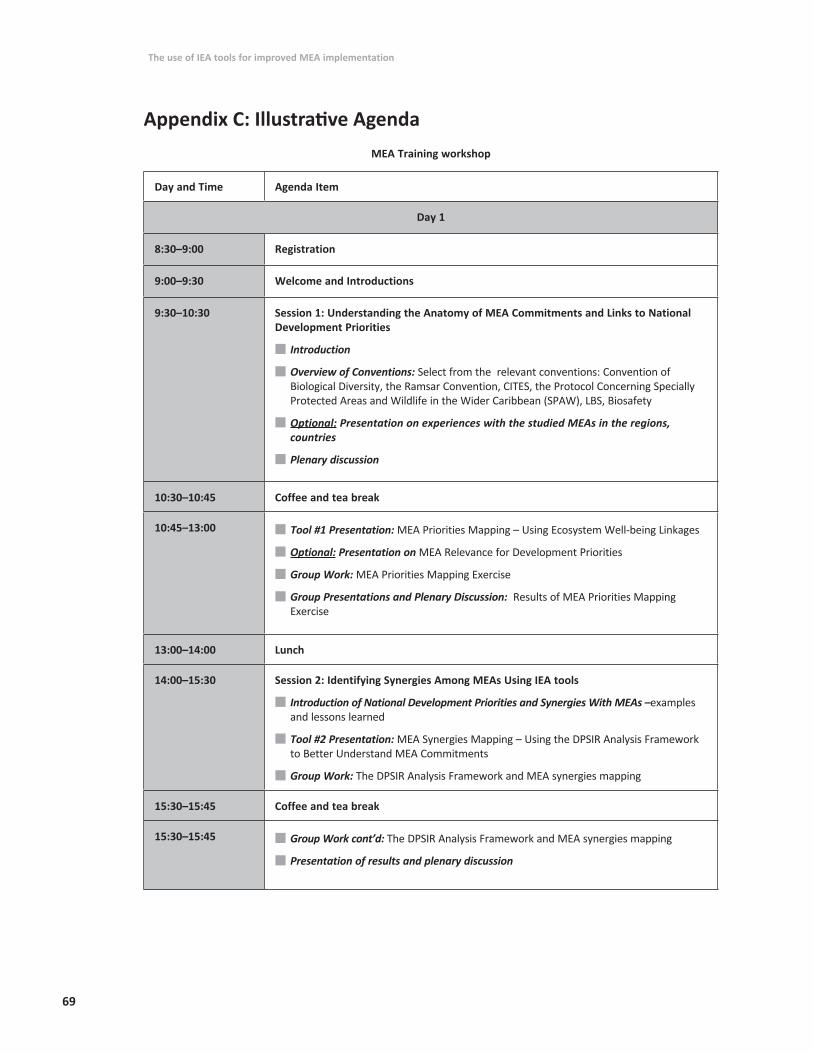
69
The use of IEA tools for improved MEA implementation
Appendix C: Illustrative AgendaMEA Training workshop
Day and Time Agenda Item
Day 1
8:30–9:00 Registration
9:00–9:30 Welcome and Introductions
9:30–10:30 Session 1: Understanding the Anatomy of MEA Commitments and Links to National Development Priorities
nIntroduction
n Overview of Conventions: Select from the relevant conventions: Convention of Biological Diversity, the Ramsar Convention, CITES, the Protocol Concerning Specially Protected Areas and Wildlife in the Wider Caribbean (SPAW), LBS, Biosafety
n Optional: Presentation on experiences with the studied MEAs in the regions, countries
nPlenary discussion
10:30–10:45 Coffee and tea break
10:45–13:00 n Tool #1 Presentation: MEA Priorities Mapping – Using Ecosystem Well-being Linkages
n Optional: Presentation on MEA Relevance for Development Priorities
n Group Work: MEA Priorities Mapping Exercise
nGroup Presentations and Plenary Discussion: Results of MEA Priorities Mapping Exercise
13:00–14:00 Lunch
14:00–15:30 Session 2: Identifying Synergies Among MEAs Using IEA tools
nIntroduction of National Development Priorities and Synergies With MEAs –examples and lessons learned
n Tool #2 Presentation: MEA Synergies Mapping – Using the DPSIR Analysis Framework to Better Understand MEA Commitments
n Group Work: The DPSIR Analysis Framework and MEA synergies mapping
15:30–15:45 Coffee and tea break
15:30–15:45 nGroup Work cont’d: The DPSIR Analysis Framework and MEA synergies mapping
n Presentation of results and plenary discussion

70
The use of IEA tools for improved MEA implementation
Day 2
9:00–10:30 Overview of the day
Session 3: Identifying Linkages Among National Priorities and MEAs
n Introducing selected targets and indicators relevant for MEAs
n Tool #3 Presentation: Setting a Challenge Scenario - Envisioning desired future MEA outcomes and setting targets and benchmarks
10:30–10:45 Coffee and tea break
10:45–13:00 nGroup Work and Presentations: Identifying indictors and targets
n Presentations and Plenary Discussion: Common links among MEAs and national development priorities and synergies between MEAs
13:00–14:00 Lunch
14:00–15:30 Session 4: Identifying a Portfolio of Polices for Achieving Future MEA Outcomes
n Introduction
n Examples of policies helping in meeting MEA goals
nTool #4 Presentation: Policy Mapping
n Group Work: Identifying key policies relevant for MEAs and key policy gaps
15:30–15:45 Coffee and tea break
15:30–15:45 n Group Work cont’d: Identifying key policies relevant for MEAs and key policy gaps
n Presentations and plenary discussion

71
The use of IEA tools for improved MEA implementation
Day 3
9:00–10:30 Overview Day 3
Session 5: Assessing Risks
nTool #5 Presentation: Policy Stress Testing and Case Examples
nPlenary discussion
Session 6: Preparing MEA Policy Planning Brief
nTool #6 Presentation: Preparing the MEA Policy Brief
10:30–10:45 Coffee and tea break
10:45–13:00 nGroup Work: Preparing a policy brief to report on MEA in the country context
n Preparing group presentations and outputs
13:00–14:00 Lunch
14:00–15:00 n Group Presentations and Plenary Discussion: Policy briefs on MEAs
Concluding Session
n Plenary Discussion: Next steps and peer networking opportunities
n Course evaluations
15:00–15:15 Coffee and tea break
15:15–16:15 nClosing remarks
n Presentation of training certificates

The use of integrated environmental assessment tools for improved MEA implementation This module is designed to convey innovative integrated environmental assessment (IEA) tools that can generate win-win scenarios for achieving national development priorities in the Caribbean through more effective MEA implementation. Some of the same tools have already been used in and can build on the experience of those countries of the Caribbean that already have an IEA process in place and have published integrated environmental outlook reports.
Training Module Achieving National and Sectoral Development Priorities