Embed Size (px)
Citation preview

Trade and Global Value Chain 15
2 Trade and Global Value Chain

Asian Economic Integration Report 201616
Recent Trends in Asia’s Trade Asia’s trade growth in 2015 continued to slow below world trade growth; it also fell further below GDP growth.
Trade growth by volume fell from 3.5% in 2014 to 2.3% in 2015 in Asia and the Pacific, much sharper than
the decline in global trade from 2.8% to 2.7% in the same period. In comparison, North America’s trade growth fell 0.8 percentage points to 3.7%, and Africa’s by 0.4 percentage points to 0.7%. Latin America’s total trade continued to contract (from a rate of –2.0% in 2014 to −2.3% in 2015). By contrast, trade growth accelerated to 4.3% from 2.7% in the European Union (EU) and to 3.3% from 1.5% in the Middle East.
Trade and Global Value Chain
b: World
-15-10-505
10152025
2001
2003
2005
2007
2009
2011
2013
2015
a: Asia
-15-10-505
10152025
2001
2003
2005
2007
2009
2011
2013
2015
Total trade growth GDP growth
Figure 2.1: Merchandise Trade and GDP Growth—Asia and World (%, y-o-y)
GDP = gross domestic product, y-o-y = year-on-year. Note: Real GDP growth is weighted using GDP at purchasing power parity. Total trade growth is the average of export volume growth and import volume growth. Sources: ADB calculations using data from International Monetary Fund. World Economic Outlook April 2016 Database. https://www.imf.org/external/pubs/ft/weo/2016/01/weodata/index.aspx; World Trade Organization Statistics database. http://stat.wto.org (accessed September 2016).
Asia’s trade growth has consistently fallen below output growth since 2012, consistent with the global trend (Figures 2.1a, 2.1b).
By volume, both export and import growth has slowed in Asia and the Pacific since 2011, after a rebound in 2010 following the global financial crisis. Worldwide growth deceleration was more pronounced in developing economies than developed economies. Developing Asia’s export growth slowed sharply to 3.0% in 2015 from 6.4% in 2013 and 4.6% in 2014, compared with the gradual recovery in developed economies’ export growth to 3.0% in 2015 from 1.7% in 2013 and 2.5% in 2014 (Figures 2.2a, 2.2b). Import growth has been below that in developed economies since 2014—a meager 1.7% in 2015 against 4.5% growth in developed economies. While sluggish import growth may have helped economies with current account deficits shore up current account balances, it also reflected the domestic demand weakness across

Trade and Global Value Chain 17
2001
2003
2005
2007
2009
2011
2013
2015
–40–30–20–10
0102030
–40–30–20–10
0102030
2001
2003
2005
2007
2009
2011
2013
2015
Developed Developing Asia
a: Export volume growth b: Import volume growth
Figure 2.2: Export and Import Volume Growth—Developed Economies and Developing Asia (%, y-o-y)
y-o-y = year-on-year.Notes: Economies were grouped into “developed” and “developing” based on country classification of the United Nations. The computations included 37 developed economies (European Union [EU], non-EU, Asia, and North America) and 146 developing economies (from non-EU, Africa, Asia, Middle East, and Latin America and the Caribbean). Developing Asia includes ADB’s 45 developing member economies.Source: Source: ADB calculations using data from World Trade Organization Statistics database. http://stat.wto.org (accessed October 2016).
developing Asia, further complicating the challenge of sustaining economic growth momentum beyond tepid export growth.
Asia’s trade slowdown was driven by weaker trade in the People’s Republic of China (PRC) and slower intermediate goods trade growth in the region.
The PRC’s trade slowdown worsened in 2015, with trade volume growth plunging to just 0.2% from 5.4% in 2014 (Figure 2.3). PRC’s exports continued to grow, but much slowly, down to 4.8% in 2015 from 6.8% in 2014, as reforms continue to steer the economy
-20
-10
0
10
20
30
40
50
2001
2003
2005
2007
2009
2011
2013
2015
PRC share in Asia's global trade volume Asia ex-PRC PRC
Figure 2.3: PRC and Asia ex-PRC Trade Volume Growth (%, y-o-y)
PRC = People’s Republic of China, y-o-y = year-on-year.Source: ADB calculations using data from World Trade Organization Statistics database. http://stat.wto.org (accessed October 2016).
away from export-oriented growth to more domestic demand-driven growth—slower yet more sustainable and balanced. Imports contracted 4.2%, reversing the 4% growth in 2014. With the PRC accounting for the bulk of the region’s total trade, the PRC trade slowdown pulled down Asia’s total global trade. Excluding the PRC, Asia’s aggregate trade volume growth rose to 3.1% from 2.5% in 2014.
By value, intermediate goods trade contracted 13.2% in 2015, affecting Asia’s overall trade performance as well. Intermediate goods—particularly processed goods—remain a major component of Asian exports and imports—accounting for about 58% of its total

Asian Economic Integration Report 201618
trade (Figures 2.4a, 2.4b). Beginning in 2010, growth of processed intermediate goods fell rapidly from 31% to 1.3% in 2014 and contracted 6.8% in 2015. Consumption goods growth also declined, but not as much—by 1.9% in 2015; while capital goods fell 3.6%. Detailed commodity level data show that the fall in intermediate goods trade value had nearly equal drops in both price and volume.4 Falling intermediate goods trade growth could indicate stagnating or loosening global and regional value chains (see “Analyzing Global and Regional Value Chains” for more details).
Asia’s Intraregional Trade
Despite the slowdown in overall trade, Asia’s intraregional trade share increased in 2015 given its declining trade with non-Asian economies.
Intraregional trade in Asia and the Pacific increased to 57.1% in 2015, up from an average 55.8% during 2010–2014 (Figure 2.5). By comparison, intraregional trade in the European Union (EU) and North America is 63% and 25%, respectively.
4 The United Nations Commodity Trade Database lists exports up to a six-digit product level.
Figure 2.4: Total Trade by Commodity Groups—Asia
0
2
4
6
8
10
12
14
1999
2001
2003
2005
2007
2009
2011
2013
2015
0102030405060708090
100
1999
2001
2003
2005
2007
2009
2011
2013
2015
Consumption: PrimaryIntermediate: PrimaryCapital
Consumption: Processed and othersIntermediate: Processed and othersOthers
a: Value ($ trillion) b: Share (%)
Note: Based on Broad Economic Categories. Source: ADB calculations using data from United Nations. Commodity Trade Database. https://comtrade.un.org (accessed October 2016).
20
30
40
50
60
7019
91
1993
1995
1997
1999
2001
2003
2005
2007
2009
2011
2013
2015
Asia Asia ex-PRC EU North America
Figure 2.5: Intraregional Trade Shares—Asia, European Union, North America (%)
EU= European Union, PRC= People’s Republic of China.Notes: EU refers to the aggregate of 28 EU members. North America covers Canada, Mexico, and the United States. Sources: ADB calculations using data from CEIC; and International Monetary Fund. Direction of Trade Database. https://www.imf.org/en/Data (accessed August 2016).
However, intraregional trade by value declined by 7.4% in 2015 after growing only 1.3% in 2014. Indeed, intra-Asia trade share increased in 2015 because of an even sharper drop in Asia’s trade with non-Asian economies (down by 13%). Excluding the PRC, intraregional trade growth fell even more sharply at 10% in 2015, while Asia’s trade with the PRC contracted 3% (Figure 2.6).

Trade and Global Value Chain 19
Trade share mostly strengthened within subregions, but declined across subregions—also confirmed by gravity model estimation results based on bilateral trade data.
While the intra-subregional trade shares of Central Asia, East Asia, and South Asia rose in 2015 from 2014, those of Southeast Asia and the Pacific and Oceania fell (Figure 2.7).5 Intra-subregional trade shares remain the highest in East Asia and Southeast Asia. Central Asia outpaced the Pacific and Oceania in 2015 and now occupies the third position. South Asia still has the lowest share, but not too far behind the Pacific and Oceania.
Inter-subregional trade shares—trade across subregions within Asia—declined in Central Asia and the Pacific and Oceania, and slightly rebounded in East Asia. Inter-subregional trade shares increased in South Asia and Southeast Asia. The Pacific and Oceania continues to engage in significantly more trade with other subregions in Asia than within itself, with the highest inter-subregional trade share among Asian subregions (Figure 2.8).
After controlling for economic size and geographic, cultural, and economic proximity, Asia’s intraregional exports are significantly higher than exports to non-Asian economies (Box 2.1). From gravity model estimation results based on data for 2011–2015, the most recent
5 The Pacific and Oceania includes ADB’s Pacific developing member economies plus Australia and New Zealand.
-30
-20
-10
0
10
20
30
40
1991
1993
1995
1997
1999
2001
2003
2005
2007
2009
2011
2013
2015
Intraregional (AXC) AXC with PRC Asia with non-Asia
Figure 2.6: Trade Value Growth—Asia By Partner (%, y-o-y)
AXC = Asia excluding the PRC, PRC = People’s Republic of China, y-o-y = year-on-year.Source: ADB calculations using data from International Monetary Fund. Direction of Trade Database. https://www.imf.org/en/Data (accessed August 2016).
05
1015202530354045
1990
1991
1993
1995
1997
1999
2001
2003
2005
2007
2009
2011
2013
2015
Central Asia East Asia South AsiaSoutheast Asia Paci�c and Oceania
Figure 2.7: Intra-subregional Trade Shares—Asia (%)
Source: ADB calculations using data from International Monetary Fund. Direction of Trade Database. https://www.imf.org/en/Data (accessed August 2016).
0
10
20
30
40
50
60
7019
9019
91
1993
1995
1997
1999
2001
2003
2005
2007
2009
2011
2013
2015
Central Asia East Asia South AsiaSoutheast Asia Paci�c and Oceania
Figure 2.8: Inter-subregional Trade Shares—Asia (%)
Source: ADB calculations using data from International Monetary Fund. Direction of Trade Database. https://www.imf.org/en/Data (accessed August 2016).
period, intraregional trade bias declined to 0.96 from 1.16 in 2010–2014.6
Gravity model is also a useful tool to assess the impact of foreign exchange rate on trade. The volatility of exchange rate has grown significantly recently. However, weaker local currency does not seem to contribute to export growth as much as before (Box 2.2).
6 Intraregional trade bias refers to the coefficient of the intra-Asia dummy in the gravity model of bilateral export flows. A positive and significant coefficient means that Asia’s trade with itself is higher than its trade with non-Asian economies.

Asian Economic Integration Report 201620
Box 2.1: Gravity Model Estimation of Bilateral Exports
In traditional gravity models, trade flows (either exports or imports) are determined by the size of the respective source and destination economies and distance, which appears to be an overall proxy for trade costs. However, this simple specification fails to capture the unobserved multilateral trade resistance. Multilateral trade resistance measures the cost of country i to export to country j relative to the cost of exporting to other economies (outward multilateral resistance) or the cost of country i to import from country j relative to the cost of importing from all possible import sources (inward multilateral resistance).
Because of the structural weakness of the intuitive gravity model in assessing trade flows, international trade literature uses the Anderson and van Wincoop (2003) gravity model specifications that account for multilateral trade resistance. To account for time-varying characteristics of each trading partner, the gravity model is augmented with country fixed effects interacted with year dummies.
Results of gravity model estimation using annual data covering 2011–2015 and 2010–2014 are shown in box table 1. This 5-year rolling regression, updated annually, provides a snapshot of progress
1: Gravity Model Estimation Results Dependent Variable: Log(bilateral exports)
All Goods Capital Goods Consumption Goods Intermediate Goods
Log(distance) -1.79***(0.02)
-1.72***(0.02)
-1.90***(0.02)
-1.83***(0.02)
Colonial relationship dummy 0.82***(0.11)
0.73***(0.10)
0.93***(0.12)
0.84***(0.11)
Common language dummy 0.98***(0.04)
0.92***(0.05)
1.04***(0.05)
0.82***(0.05)
Contiguity dummy 0.91***(0.12)
0.94***(0.11)
0.99***(0.12)
0.95***(0.12)
Regional dummies (base: Asia to ROW)Both in Asia dummy 0.96***[1.16***]
(0.32)0.11 [0.51](0.36)
0.48 [0.90**] (0.40)
0.15 [0.47](0.37)
Importer in Asia dummy 0.92(0.61)
-0.22(0.82)
0.09(0.65)
0.81(0.76)
Both in ROW dummy –0.61(0.46)
–0.93(0.70)
–1.27***(0.45)
0.03(0.61)
Sample size 148,780 148,780 148,780 148,780 Censored observations 40,292 76,499 58,922 54,211 Uncensored observations 108,488 72,281 89,858 94,569
*** = significant at 1%, **= significant at 5%, *= significant at 10%, robust standard errors in parentheses. ROW = rest of the world.Notes: Based on annual data covering 2011–2015. Numbers in brackets are the coefficients of the regional dummies for gravity model estimation results using annual data covering 2010–2014. Time-varying economy dummies are included but not shown for brevity. Heckman sample selection estimation was used to account for missing economy-pair data. Data cover 173 economies, of which 43 are from Asia. Trade data based on Broad Economic Categories. Sources: ADB calculations using data from Institute for Research on the International Economy. http://www.cepii.fr/CEPII/en/cepii/cepii.asp; and United Nations. Commodity Trade Database. https://comtrade.un.org (both accessed October 2016).

Trade and Global Value Chain 21
in regional trade integration. The coefficient of “both in Asia” dummy can be viewed as a trade integration index.
In terms of intra-subregional trade bias, East Asia still stands out, followed by Southeast Asia and Central Asia. South Asia continues to engage in significantly more trade with other subregions within Asia, although its inter-subregional bias weakened slightly (box table 2). While Asia’s intra-subregional bias remained high for both estimation periods (2011–2015 and 2010–2014) in all goods across most subregions, inter-subregional bias weakened. Subregional trade integration seems to be progressing steadily,
2: Gravity Model Estimation Results: Intra- and Inter-subregional Trade
Dependent Variable: Log(bilateral exports) Central Asia East Asia South Asia Southeast Asia
Pacific and Oceania
Intra-subregional Trade Dummy
All goods 4.53***[4.44***] 6.63***[6.74***] 1.33**[1.48***] 4.65***[4.81***] 1.07**[0.75]
Capital goods 3.16***[3.98***] 3.35***[3.84*] 0.57[0.85*] 3.06***[2.77***] 0.13 [0.47]
Consumption goods 5.48***[5.02***] 5.64***[5.03***] 0.72[1.29***] 4.79***[4.04***] 0.44 [-0.09]
Intermediate goods 3.59***[3.62***] 6.94***[7.27***] 0.85*[1.04***] 4.91***[5.46***] 0.13 [0.07]
Inter-subregional Trade Dummy
All goods 0.62 [0.90**] 0.65*[0.77**] 3.89***[4.13**] 0.83**[1.02***] -2.05***[-1.16*]
Capital goods -0.60 [-0.06] -0.28 [0.11] 1.94***[1.61***] 0.07 [0.39] -1.04 [-0.56]
Consumption goods 0.21 [1.10*] 0.24 [0.58] 4.32***[3.59***] 0.12 [0.54] -0.57 [-0.13]
Intermediate goods -0.52 [-0.03] -0.15 [0.10] 3.48***[4.14***] 0.28 [0.58] -3.43***[-2.09***]
*** = significant at 1%, **= significant at 5%, *= significant at 10%. Estimates for 2010–2014 are in brackets.Note: Base category (benchmark) is the subregion’s trade with economies outside Asia. A separate regression was estimated for “all goods” and for each commodity group. The usual gravity model variables and time-varying economy dummies are included but, for brevity, not shown. Heckman sample selection estimation was used to account for missing bilateral economy-pair data. Data cover 173 economies, of which 43 are from Asia. Trade data are based on Broad Economic Categories. Sources: ADB calculations using data from Institute for Research on the International Economy. http://www.cepii.fr/CEPII/en/cepii/cepii.asp; and United Nations. Commodity Trade Database. https://comtrade.un.org (both accessed October 2016).
centered on subregional specific integration initiatives such as the Greater Mekong Subregion, Central Asia Regional Economic Cooperation, South Asia Subregional Economic Cooperation, and the Pacific Islands Forum. While this is encouraging for advancing regional integration, weak inter-subregional trade links suggest more work is needed to improve inter-subregional connectivity and trade facilitation across subregions (beyond subregional level efforts).

Asian Economic Integration Report 201622
Box 2.2: Impact of Foreign Exchange Rate on Trade
Analyzing recent trade growth patterns reveals some interesting changes—a slump in trade growth or convergence toward moderate, longer-term growth rates. Given conventional wisdom—that exchange rate appreciation contributes to an increase in imports and decreased exports, with depreciation acting vice versa—the box examines how the change in exchange rate affected trade flows in the 2000s. Examining exchange rate movements over time, the analysis shows that variations in real effective exchange rate (REER) movements across economies decreased before the global financial crisis (box figure 1a). However, exchange rate variations across economies rapidly increased after the crisis (box figure 1b).
On the other hand, the trade response to exchange rate changes has been smaller since the global financial crisis. Many more economies had lower elasticity of both exports and imports
relative to changes in REER after the global financial crisis than before (box figures 2a, 2b).
Given the main focus on trade volume growth—excluding the volatile price factor—the empirical analysis investigates how real exchange rate movements lead to changes in trade volumes. While much of the literature tests the impact of exchange rate volatility on trade flows, not much examines the impact of the exchange rate level itself on trade, particularly trade volume. In investigating the relationship between changes in trade and exchange rates, a panel gravity model is employed with various fixed effects included to control for omitted variable bias and its associated endogeneity.
2: REER Index (post-GFC: 2012–2015)
020406080
100120140160180
2012 2013 2014 2015
020406080
100120140160180
2001 2002 2003 2004 2005 2006
1: Real Effective Exchange Rate Index
GFC = global financial crisis. Note: Includes 61 economies with available data on real effective exchange rate. Source: Bank for International Settlements. https://www.bis.org/statistics (accessed July 2016).
a: Pre-GFC: 2001–2006
b: Post-GFC: 2012–2015
4: REER Elasticity of Import Volume
REER = real effective exchange rate.Notes: Points above the 45-degree line indicate that REER elasticity of export (import) volume is higher during 2012–2015 compared to 2003–2006. Includes 61 economies with available data on REER. Source: Kang (2016).
0.0
0.5
1.0
1.5
2.0
2.5
3.0
0 0.5 1 1.5 2 2.52003−2006
2012
−201
5
0.00.20.40.60.81.01.21.41.61.8
0 0.5 1 1.5 2
2003−2006
2012
−201
5
2: Real Effective Exchange Rate Elasticity
a: Export volume
b: Import volume
ln Xijt= β0 + β1 ln xrateijt + β2 ln GDPjt + β3 Rij + γit + δj + φijt

Trade and Global Value Chain 23
where the subscript i and j denote the importer and exporter, respectively, and t denotes time. X is the annual bilateral export volume, calculated by deflating the export value by producer price index of the exporting economy. xrate is the bilateral real exchange rate, calculated by , where nxrate is the nominal exchange rate, and CPIi and CPIj are consumer price indexes of importing and exporting economies, respectively. GDP jt denotes the real GDP of exporting economies, and Rij controls the usual gravity variables, including distance, colonial relationship, common language, and geographical contiguity. is time-varying importer fixed effects to control for remaining importer specific factors on trade, such as tariffs and other nontariff barriers, and are exporter fixed effects. Finally, is an error term. The model tests the impact of exchange rate on exports for 2001–2015 and separately for 2003–2006 (before the global financial crisis), 2007–2010 (global financial crisis), and 2012–2015 (after the crisis). In addition to the level of real exchange rate, we test the impact of its one and two-lagged values (box Table 1). This can help estimate the longer-term impact of exchange rate and also addressing potential simultaneity problem.
on average leads to a 0.13% increase in export volume of the same year. When the lagged variable of the RER is considered, the magnitude of the impact decreases over time. The term structure of the RER impact on trade reveals interesting, consistent patterns. First, the size of the RER coefficient shrinks from level RER to lag(1) and lag(2) RERs. Even the significance of the RER is not retained for lag(2) RER across all three periods. This indicates the effect of the real exchange rate over export volume is greatest during the contemporaneous year and dissipates over time. There is no indication of a J-curve effect.
Second, the magnitude of the RER coefficient is consistently larger for the periods before and after the global financial crisis and much smaller during the global financial crisis. The exchange rate effect was significantly dampened during the crisis period.
Third, compared with the pre-global financial crisis period, the exchange rate effect on export volume in the period after the crisis was less than halved during the same year and its lagged impact has become even insignificant. The results show the exchange rate effect significantly weakened.
One potential cause of the subdued impact of exchange rate on trade is a deepening global value chain (GVC) worldwide. For example, while depreciation of the local currency may induce greater exports by increasing the price competitiveness of exported goods, the impact could be dampened if the exported goods embed a large portion of intermediates, as these demands could be undermined by the depreciation, obscuring the net impact of currency depreciation. Additionally, some adjustments were made to test this GVC factor hypothesis, by averaging export, GDP, and exchange rate variables for 2001–2003, 2006–2008, 2009–2011, and 2012–2014, and including the data of domestic value added (DVA) share out of gross bilateral exports for the years 2000, 2005, 2008, and 2011, given the available value added decomposition data for these years. This can also measure the persistent effect of GVC participation spreading over multiple years. box table 2 presents both summary results under a base-line model without time-varying importer fixed effects and an extended model with time-varying importer fixed-effects.
Overall, a larger DVA share leads to less bilateral exports. This indicates that deepening GVCs can induce greater trade, confirming the hypothesis that rapid expansion of GVCs has contributed to international trade growth. The impact of average real exchange rate on exports becomes negative
1: Gravity Model Estimation Results: Impact of Real Exchange Rates on Bilateral Exports
Period Log (RER) Log (RERt-1) Log (RERt-2)
Full Period 0.13*** 0.06*** 0.04***
Pre-GFC 0.66*** 0.22*** 0.05
GFC 0.09*** 0.03 0.01
Post-GFC 0.27*** 0.20 0.07*** = significant at 1%, ** = significant at 5%, * = significant at 10%. Dependent Variable: Log(bilateral exports volume).GFC = global financial crisis, RER = real exchange rate. Notes: Full-period covers 2001–2015, 2003–2006 is the period before the global financial crisis, 2007–2010 is the global financial crisis period, and 2012–2015 after the crisis. The usual gravity model variables were included but for brevity are not shown. For the complete gravity model estimation results, please see Annex 2a. Data cover 166 economies, of which 40 are from Asia.Sources: ADB calculations using data from Institute for Research on the International Economy. http://www.cepii.fr/CEPII/en/cepii/cepii.asp; United Nations. Commodity Trade Database. https://comtrade.un.org; and World Bank. World Development Indicators. data.worldbank.org/data-catalog/world-development-indicators (accessed September 2016).
First, trade resistance factors point to the significance and expected direction of influence on trade volume. For 2001–2015, the real exchange rate (RER) effect of the year is positive and significant at the 1% level, suggesting the weaker an exporter’s currency, the larger the export volume relative to trading partners. A 1% depreciation of an exporter’s RER
nxrate ×CPIi
CPIj
γit
δjφijt

Asian Economic Integration Report 201624
Analysis of Global and Regional Value ChainsThe expansion of global and regional value chains has slowed.
The Asian Economic Integration Report 2015 referred to maturing global and regional value chains as one of the potential causes of trade growth slowdown since 2012. The recent International World Input-Output data supports this argument.7 Among the components of gross world exports, the value of DVA increased 2.6 times between 2000 and 2011 and 1.1 times between 2011 and 2015. For the same periods, foreign value added (FVA) increased 2.8 and 0.8 times, respectively; returned domestic value added (RDV), 2.1 and 0.9 times; and purely double-counted terms (PDC), 3.2 and 0.5 times. While DVA still increased between 2011 and 2015, all other components that capture an expanding production network through multiple border-crossing have decreased in absolute value. As shown in Figure 2.9a, the DVA portion out of gross exports declined between 2000 and 2011, while other components’ shares grew, except for RDV during this period, indicating a deepening GVC. This trend reversed between 2011 and 2015, with the DVA portion accounting for a much larger portion.
As a major contributor to international trade and the deepening of the GVC, Asia is no exception. Value-added decomposition of Asia’s gross exports also points to deepening integration into the GVC between 2000 and 2011, which reversed the direction between 2011 and 2015 (Figure 2.9b).
Asia’s GVC participation as measured by the share of value added contents of gross exports used for further processing through cross-border production networks also attests to this. The GVC participation ratio rose from 63.2% to 65.5% between 2000 and 2011 but declined to 58.7% in 2015 (see Figure 2.9).8
7 The ADB Multi-Regional Input-Output Table covers 47 economies, with 14 from Asia and Pacific (Australia; Bangladesh; the PRC; India; Indonesia; Japan; the Republic of Korea; Malaysia; Mongolia; the Philippines; Sri Lanka; Taipei,China; Thailand; and Viet Nam).
8 The GVC participation ratio is measured as: [gross exports – (T1+T9+T10+T15+T16)]/gross exports. Please refer to Annex 2b for the components of decomposed gross exports.
2: Regression Results
Base Model Extended Model
DVA share -0.355***(0.144)
-0.279**(0.155)
Average RER-3.74e-05***(1.85e-05)
-2.98e-05**(1.73e-05)
DVA*(average RER)4.85e-05***
(2.14e-05)4.26e-05***(1.85e-05)
*** = significant at 1%, ** = significant at 5%. Dependent variable: Log(bilateral exports volume).DVA = domestic value added, RER = real exchange rate. Notes: Results for other gravity model variables, for brevity, are not presented. DVA share is the share of domestic value added in total exports for 47 economies with available data from the ADB Multi-Regional Input-Output Tables, with 14 economies from Asia (Australia; Bangladesh; People’s Republic of China; India; Indonesia; Japan; the Republic of Korea; Malaysia; Mongolia; the Philippines; Sri Lanka; Taipei,China; Thailand; and Viet Nam). Bilateral RER is deflated by the ratio of consumer price indexes of importer over that of exporter. Sources: ADB calculations using data from ADB Multi-Regional Input-Output Tables based on methodology by Wang, Wei, and Zhu (2014); Institute for Research on the International Economy. http://www.cepii.fr/CEPII/en/cepii/cepii.asp (accessed July 2016); United Nations. Commodity Trade Database. https://comtrade.un.org (accessed September 2016); and World Bank. World Development Indicators. data.worldbank.org/data-catalog/world-development-indicators (accessed September 2016).
after considering the GVC impact, although the sizes of the coefficients are very small. Further, the interaction between DVA share and exchange rates reveals a positive coefficient. These suggest deepening GVCs could have dampened the traditional mechanism of exchange rate levels influencing trade. Nevertheless, the coefficient of the interaction term indicates the impact of exchange rate could still be positive for the exports of an economy with higher than 77% of DVA share based on the basic model and 70% based on the extended model. These results suggest not that the GVC is the only factor that might have induced the weakening impact of exchange rate on trade, but that it could be one of the structural factors.
Box 2.2. continued.

Trade and Global Value Chain 25
0%20%40%60%80%
100%
2000 2011 20150%
20%
40%60%
80%
100%
2000 2011 2015
DVA FVA RDV PDC GVC participation rate
Figure 2.9: Components of Gross Exports (%)
DVA = domestic value added, FVA = foreign value added, PDC = purely double-counted terms, RDV = returned domestic value added.Note: The GVC participation ratio is measured as: [gross exports – (T1+T9+T10+T15+T16)]/gross exports. Please refer to Annex 2b for the components of decomposed gross exports.Sources: ADB calculations using ADB Multi-Regional Input-Output Tables and methodology by Wang, Wei, and Zhu (2014).
a: World b: Asia
Regional value chains have strengthened over time, while progress varies across subregions.
For the geographical linkage of value chains in Asian subregions from a forward-linkage perspective, we find that East Asia is becoming more integrated outside the region than inside, reflecting its strong outward orientation. Out of gross exports, DVA export share to the region has fallen slightly, from 34.4% in 2000 to 33.5% in 2015, while the share outside the region increased from 65.5% to 66.5% (Table 2.1). This phenomenon is more pronounced when the progress of vertical specialization is examined. In East Asia, 37% of FVA exports went outside the region in 2000 and jumped to 56% by 2015. The RDV and PDC also indicate a similar trend, albeit to a lesser extent.
In contrast, South Asia’s value chain linkage strengthened inside the region. South Asia’s DVA export share for the region grew from 20.1% to 25.5% between 2000 and 2015. The regional share for other components went even further in South Asia, reflecting its relatively closer value chain linkage inside the region. For example, the regional share for FVA increased from 22.3% to 38.4%. South Asia’s overall intra-subregional linkage weakened overtime. Instead its value chain linkage with other subregions strengthened, particularly with Southeast Asia. The share of Southeast Asia in South Asia’s FVA exports, for example, rose from just 9.7% in 2000 to 19.1% in 2015.
Southeast Asia does not show much change over time between regional and extra-regional value chain linkages. At the subregional level, however, its linkage has strengthened with South Asia in particular. Oceania, represented only by Australia in our data, reveals fast-
growing value chain linkage with the region. East Asia’s share is the largest for Oceania, while the share of other subregions has also grown in general.
Among select Asian economies, Viet Nam shows the highest FVA export portion of gross exports, at 31.0% in 2015, followed by Taipei,China at 25.4%; Malaysia at 25.3%; and Thailand at 24.7% (Table 2.2). This indicates significant amounts of processing manufacturing. While Malaysia’s FVA export portion drastically declined from 40.2% in 2000 to 25.3%, its weight on processing manufacturing remains significant. The PRC’s FVA export share edged up, from 13.8% in 2000 to 14.1% in 2015. Japan’s FVA grew significantly, from 6.6% to 12.1% in the period, which could have benefitted from expanding production offshoring activities of parts and components, driven by strengthening outward foreign direct investment (FDI).
Diagnosing Channels of the Brexit Impact: Trade and Investment LinkagesThe Brexit impact on Asia through trade and investment linkages may not be sizeable; but some economies may face additional costs due to value chain and indirect investment linkages.
The United Kingdom’s (UK) decision to leave the EU (Brexit) rattled the global financial market, triggering a flight to safe-haven assets such as the United States

Asian Economic Integration Report 201626
2000 AUS PRC IND INO JPN KOR MAL TAP THA VIE
DVA (% of total) 86.5 81.6 85.1 80.2 89.1 69.4 47.6 63.7 59.2 75.6
FVA (% of total) 10.1 13.8 11.9 15.0 6.6 22.8 40.2 26.7 33.6 20.4
RDV (% of total) 0.3 0.8 0.2 0.2 1.9 0.3 0.1 0.3 0.2 0.1
PDC (% of total) 3.1 3.8 2.9 4.6 2.4 7.5 12.1 9.3 6.9 4.0
2015 AUS PRC IND INO JPN KOR MAL TAP THA VIE
DVA (% of total) 90.2 81.5 86.1 90.6 83.9 72.8 68.8 65.8 71.1 65.7
FVA (% of total) 7.3 14.1 11.8 7.3 12.1 21.4 25.3 25.4 24.7 31.0
RDV (% of total) 0.4 1.5 0.3 0.4 0.9 0.3 0.2 0.2 0.2 0.1
PDC (% of total) 2.1 2.9 1.7 1.7 3.1 5.5 5.7 8.6 4.1 3.2
Table 2.2: Select Individual Asian Economies Export Component (% of total exports)
AUS = Australia; DVA = domestic value added; FVA = foreign value added; IND = India; INO = Indonesia; JPN = Japan; KOR = Republic of Korea; MAL = Malaysia; PDC = purely double-counted terms; PRC = People’s Republic of China; RDV = returned domestic value added; TAP = Taipei,China; THA = Thailand; VIE = Viet Nam. Sources: ADB calculations using ADB Multi-Regional Input-Output Tables and methodology by Wang, Wei, and Zhu (2014).
Exporter/Importer
2000 2015East Asia South Asia
Southeast Asia Oceania
Rest of the World
East Asia South Asia
Southeast Asia Oceania
Rest of the World
Domestic Value Added East Asia 24.3 1.0 7.3 1.8 65.5 21.1 3.7 6.5 2.2 66.5South Asia 11.3 3.1 4.1 1.6 79.8 9.3 5.4 8.8 2.0 74.5Southeast Asia 29.6 1.4 11.4 2.7 55.0 26.9 4.8 11.2 4.1 52.9Oceania 41.1 1.2 8.9 — 48.8 49.4 4.3 12.3 — 34.0Foreign Value AddedEast Asia 37.5 0.3 23.4 1.5 37.3 33.6 0.8 7.9 1.4 56.4South Asia 10.9 0.8 9.7 0.9 77.7 14.6 3.1 19.1 1.6 61.6Southeast Asia 29.3 0.5 38.6 3.9 27.7 35.2 2.9 27.8 4.7 29.4Oceania 45.5 0.9 16.0 — 37.7 66.7 2.1 14.0 — 17.2Returned Domestic Value AddedEast Asia 23.3 1.0 7.0 1.9 66.8 20.4 3.8 6.6 2.2 67.1South Asia 10.8 3.2 3.9 1.6 80.5 9.3 5.4 8.8 2.0 74.6Southeast Asia 32.4 1.5 10.8 3.4 51.9 27.8 4.9 11.3 4.5 51.5Oceania 41.4 1.2 8.8 — 48.6 49.9 4.3 12.0 — 33.9Purely Double-Counted TermsEast Asia 27.4 1.2 4.6 1.9 64.9 20.7 4.1 5.9 2.3 67.1South Asia 14.0 3.0 3.9 1.9 77.2 8.7 6.3 7.4 2.2 75.5Southeast Asia 25.0 1.4 11.6 1.6 60.4 23.5 4.9 10.2 2.9 58.4Oceania 38.7 1.4 8.4 — 51.5 41.9 5.7 15.7 — 36.7
Table 2.1: Asia’s Link to Global and Regional Value Chains (% of total per component)
— = data unavailable.Note: Data for the Pacific unavailable.Sources: ADB calculations using ADB Multi-Regional Input-Output Tables and methodology by Wang, Wei, and Zhu (2014).

Trade and Global Value Chain 27
(US) dollar and Japanese yen, and tightened financial markets. The global financial market quickly stabilized, however, supported by ultra-loose monetary policy in major advanced economies and slimmer prospects for further increases in the US interest rates in the near future. The International Monetary Fund (IMF), in its July 2016 World Economic Outlook, estimated minimal global spillover from Brexit, particularly in large economies such as the PRC and the US. However, it noted that the negative impact could be larger in “downside” or “severe” scenarios with tighter financial conditions and lower business and consumer confidence than the baseline; or where financial stress intensifies, especially in advanced European economies, leading to sharp tightening of financial conditions and a drop in confidence (IMF 2016).
Macroeconomic repercussions and financial market spillovers caused by the anticipated lengthy procedures culminating in the UK departure from the EU could themselves pose risks to the global economy and individual economies with relatively close UK economic ties. But the actual Brexit impact on the real sector will likely appear through trade and investment channels. The UK is one of the most open economies in the world. For non-EU trading partners, Brexit implies higher transaction costs. Before Brexit, country A in Figure 2.10 faced a common trade regime with the EU with the UK as a part, which included common tariffs and other trade-related systems. If a country already has a free trade agreement (FTA) with the EU, it could enjoy preferential treatment trading with the EU, including the UK.
With Brexit, however, country A faces a different trade regime from the EU’s when trading with the UK. Even if the UK provides the same or similar treatment as the EU to country A, it would still face higher transaction costs due to separate compliance requirements for trading with the UK, including separate documentation of certificates of origin, and so on. The same applies to the country’s trade with the EU, though to a lesser extent. If the country has an existing FTA with the EU, it loses flexibility in using UK resources and inputs in qualifying for EU preferential treatment, thus having to use non-UK-produced inputs in manufacturing final products to avail of EU preferential treatment. This implies additional transaction costs. As depicted below, shifting from a single transaction point to multiple ones entails higher costs to the trading partner both with the UK and the EU.
Before Brexit
After Brexit
Figure 2.10: Trade and Investment Channels of Brexit Impact
EU = European Union, UK = United Kingdom.Source: ADB.
Brexit impact: Trade channel
We now examine which economies in the EU and Asia could be more affected by Brexit by investigating their value chain linkages with the UK. We use the gross export decomposition methodology by Wang, Wei, and Zhu (2014), using the ADB Multi-Regional Input-Output tables. It covers 27 EU members, 14 Asian economies, Brazil, Canada, Mexico, the Russian Federation, Turkey, and the UK. If an economy in the EU or Asia has a deeper value chain linkage with the UK by sharing segments of a production network, the economy will likely suffer more from Brexit because transaction costs will rise due to the need for separate trading engagements with the UK, the increase in costs exacerbated by multiple border-crossings of products with respect to the UK.
In exports to the UK in 2015, Malta and Ireland are the EU economies with higher value chain linkage with the UK relative to gross export linkage (Table 2.3). In Figure 2.11, economies above the 45-degree line have higher value chain linkage than linkage through gross exports.
Among Asian economies’ value chain linkages with the UK, several are exposed to greater value added export linkages with the UK than others (Table 2.4). However, Asian economies overall are much less exposed to value chain linkages with the UK than EU economies. Sri Lanka has the highest export weight for the UK in gross terms, but its weight is around a half in terms of value chain linkages. Others with relatively higher value chain linkages with the UK are India and Australia (Figure 2.12).

Asian Economic Integration Report 201628
Exporter Gross Exports to UK (%)a
FVA+RDV+PDC Exports
(%) b
FVA+RDV+PDC Exports
(%) c
Malta 13.6 19.2 14.8Ireland 13.7 18.8 13.8Netherlands 11.9 9.5 7.2Belgium 8.8 6.2 8.4Denmark 7.2 6.2 4.9Cyprus 8.5 5.7 2.2Sweden 8.0 5.5 4.4France 8.2 5.0 3.6Germany 6.3 4.8 5.4
Portugal 7.9 4.3 3.2
Table 2.3: Top 10 EU Exporters to UK, 2015
EU = European Union, FVA = foreign value added, RDV = returned domestic value added, PDC = purely double-counted terms, UK = United Kingdom.a Share in gross exports to the world.b Share of FVA + RDV + PDC exports to the world.c Share of gross exports to the UK.Sources: ADB calculations using ADB Multi-Regional Input-Output Tables and methodology by Wang, Wei, and Zhu (2014).
AUT
BEL
BGR
CYP
CZE
DEU
DNK
ESP
EST
FINFRA
GRCHUN
IRL
ITA
LTULUX
LVA
MLT
NLD
POLPRT
ROM
SVK
SVN
SWE
0
5
10
15
20
25
0 2 4 6 8 10 12 14 16 18Gross exports to UK (% of gross exports to world)
FVA
+RD
V+PD
C ex
port
s to
UK
Figure 2.11: Global Value Chain Link (Exports) and Gross Exports of EU to UK, 2015 (% of world total)
AUT=Austria, BEL=Belgium, BGR=Bulgaria, CYP=Cyprus, CZE=Czech Republic, DEN=Denmark, EST=Estonia, FIN=Finland, FRA=France, FVA = foreign value added, GER=Germany, GRC=Greece, HUN=Hungary, IRE=Ireland, ITA=Italy, LTU=Lithuania, LUX=Luxembourg, LVA=Latvia, MLT=Malta, NET=Netherlands, PDC = purely double-counted terms, POL=Poland, POR=Portugal, RDV = returned domestic value added,ROM=Romania, SPA=Spain, SVK=Slovak Republic, SVN=Slovenia, SWE=Sweden, UK = United Kingdom.Sources: ADB calculations using ADB Multi-Regional Input-Output Tables and methodology by Wang, Wei, and Zhu (2014).
Table 2.4: Top Asian Exporters to the UK, 2015
PRC = People’s Repblic of China, FVA = foreign value added, PDC = purely double-counted terms, RDV = returned domestic value added, UK = United Kingdom. a Share in gross exports to the world.b Share of FVA + RDV + PDC exports to the world.c Share of gross exports to the UK.Source: ADB calculations using ADB Multi-Regional Input-Output Tables and methodology by Wang, Wei, and Zhu (2014).
Exporter Gross Exports to UK (%) a
FVA+RDV+PDC Exports
(%) b
FVA+RDV+PDC Exports
(% ) c
Sri Lanka 10.1 5.4 1.4India 6.4 3.6 1.8Australia 7.9 3.0 1.2Philippines 4.4 2.7 2.7Thailand 3.9 2.6 4.3Bangladesh 4.3 2.6 1.8Malaysia 2.3 1.8 6.9PRC 2.9 1.0 2.2Taipei,China 2.2 1.0 5.4Indonesia 3.1 0.9 0.8Republic of Korea 1.8 0.9 4.1Japan 1.8 0.9 2.7Viet Nam 1.7 0.9 3.5Mongolia 0.7 0.4 6.1
Figure 2.12: Global Value Chain Link (Exports) and Gross Exports of Asia to UK, 2015 (% of world total)
AUS = Australia; BAN = Bangladesh; PRC = People’s Republic of China;FVA = foreign value added; IND = India; INO = Indonesia; JPN = Japan; KOR = Republic of Korea; MAL = Malaysia; MON = Mongolia; PHI = Philippines; PDC = purely double-counted terms; RDV = returned domestic value added; SRI = Sri Lanka; TAP = Taipei,China; THA = Thailand; VIE = Viet Nam, UK = United Kingdom.Sources: ADB calculations using ADB Multi-Regional Input-Output Tables, and methodology by Wang, Wei, and Zhu (2014).
AUSBAN
INO
IND
JPN
KOR
MAL
MON
PHIPRC
SRI
TAP
THA
VIE
0123456789
10
0 5 10 15
FVA
+RD
V+PD
C ex
port
s to
UK
Gross exports to UK (% of gross exports to world)
Trade and Global Value Chain 29
Brexit impact: FDI channel
The higher transaction costs to Asian investors after Brexit include those associated with “passporting rights”, which for now facilitate the economy’s FDI into the EU through the UK and vice versa. In this sense, examining indirect FDI routes through the EU and the UK is useful in determining how much an economy could be exposed to additional transaction costs, including potential relocation costs if needed, which is not captured by sheer FDI exposure. In this analysis, indirect FDI refers to investments by a parent company through a subsidiary. We look at indirect investments from Asia to the UK through any member of the EU, and to any member of the EU through the UK. For example, Appco Group, a UK-based company, invested in business services in France in 2015. Appco is a subsidiary of Cobra Group International, which is incorporated and headquartered in Hong Kong, China. In this case, Hong Kong, China is the source of indirect investments to France through the UK.
Among major Asian investors to the UK, Japan and India show the largest number of “greenfield” investments in 2015—$3.9 billion and $3.1 billion, respectively (Figure 2.13).9 The Republic of Korea and Singapore greenfield FDI are geared more toward non-UK, EU economies. For indirect FDI into the UK and EU, India was relatively high in 2015, heading mainly to the EU through the UK (amounting to $1.5 billion in 2015). The Republic of Korea appears different: most indirect FDI went through the EU to the UK.
Updates on Regional Trade PolicyWhile trade liberalization is advancing centered on continued efforts to reach bilateral and regional free trade agreements, concern is growing about rising protectionism globally and regionally.
9 A greenfield investment is a form of foreign direct investment where a parent company builds its operations in a foreign country from the ground up. In addition to the construction of new production facilities, these projects can also include the building of new distribution hubs, offices, and living quarters.
Recent FTA trends
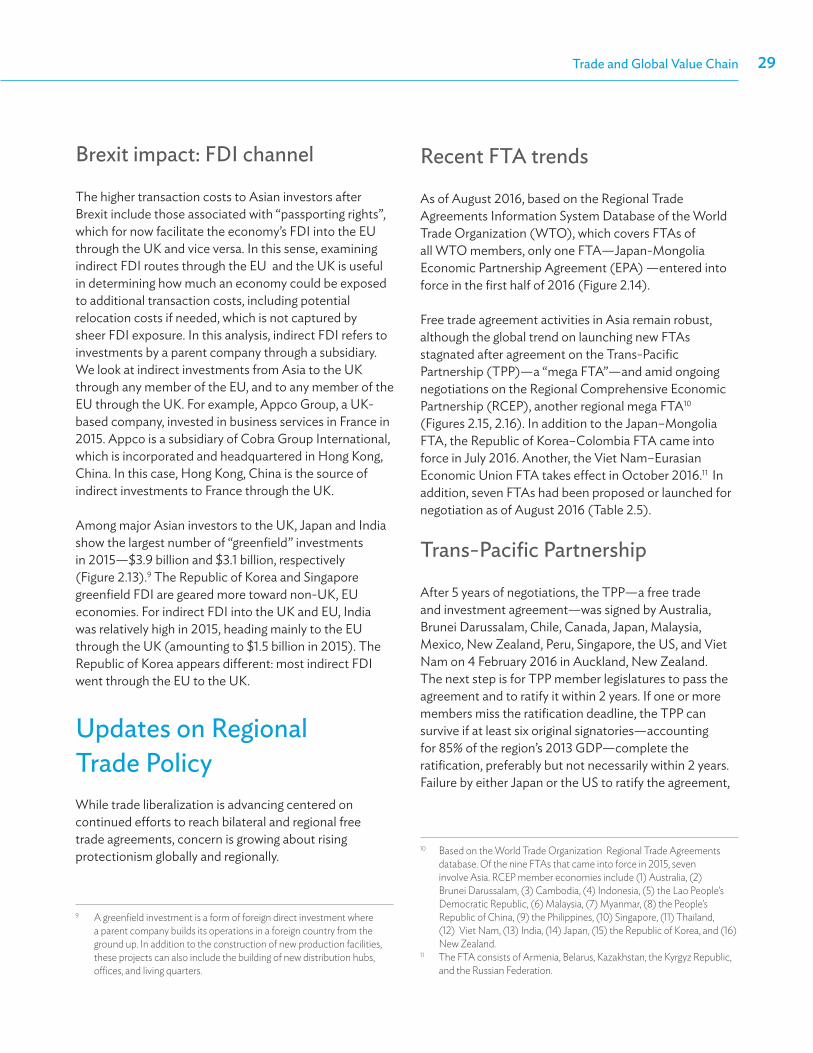
As of August 2016, based on the Regional Trade Agreements Information System Database of the World Trade Organization (WTO), which covers FTAs of all WTO members, only one FTA—Japan-Mongolia Economic Partnership Agreement (EPA) —entered into force in the first half of 2016 (Figure 2.14).
Free trade agreement activities in Asia remain robust, although the global trend on launching new FTAs stagnated after agreement on the Trans-Pacific Partnership (TPP)—a “mega FTA”—and amid ongoing negotiations on the Regional Comprehensive Economic Partnership (RCEP), another regional mega FTA10 (Figures 2.15, 2.16). In addition to the Japan–Mongolia FTA, the Republic of Korea–Colombia FTA came into force in July 2016. Another, the Viet Nam–Eurasian Economic Union FTA takes effect in October 2016.11 In addition, seven FTAs had been proposed or launched for negotiation as of August 2016 (Table 2.5).
Trans-Pacific Partnership
After 5 years of negotiations, the TPP—a free trade and investment agreement—was signed by Australia, Brunei Darussalam, Chile, Canada, Japan, Malaysia, Mexico, New Zealand, Peru, Singapore, the US, and Viet Nam on 4 February 2016 in Auckland, New Zealand. The next step is for TPP member legislatures to pass the agreement and to ratify it within 2 years. If one or more members miss the ratification deadline, the TPP can survive if at least six original signatories—accounting for 85% of the region’s 2013 GDP—complete the ratification, preferably but not necessarily within 2 years. Failure by either Japan or the US to ratify the agreement,
10 Based on the World Trade Organization Regional Trade Agreements database. Of the nine FTAs that came into force in 2015, seven involve Asia. RCEP member economies include (1) Australia, (2) Brunei Darussalam, (3) Cambodia, (4) Indonesia, (5) the Lao People’s Democratic Republic, (6) Malaysia, (7) Myanmar, (8) the People’s Republic of China, (9) the Philippines, (10) Singapore, (11) Thailand, (12) Viet Nam, (13) India, (14) Japan, (15) the Republic of Korea, and (16) New Zealand.
11 The FTA consists of Armenia, Belarus, Kazakhstan, the Kyrgyz Republic, and the Russian Federation.

Asian Economic Integration Report 201630
1,671.6
643.9
(Direct FDI)2,315.5
Australia
UK(Indirect FDI)
(Direct FDI) 568.4
22.2
Hong Kong, China
268.3
22.2EU
300.1
22.2
300.1 UK
268.3
153.8
(Indirect FDI) 156.5
3,859.2
2.7
2,373.3
153.82.7
UK
(Direct FDI)6,232.5
Japan
EU
3,859.2
2,373.3
481341.5
1,220.9EU
UK
(Direct FDI)1,701.9
(Indirect FDI)
341.5
Republic of Korea
481
1,220.9
341.5
0.3(Direct FDI)1,863.0
(Indirect FDI) 0.3
PRC
753.1
0.3
UK
1,109.9EU
753.1
1,109
(Direct FDI) 1,691.3
213.9
1,477.4
213.9
1,477.4
UK
EU
Singapore
UK
EU
3,105.8
1.6
3,105.8
1,481.51.6
2,338.8(Direct FDI)
5,444.6
India
2,338.8
1,481.5EU
UK(Indirect FDI)
1,483.0
1,671.6
643.9
EU = European Union, FDI = foreign direct investment, PRC = People’s Republic of China, UK = United Kingdom.Notes: Indirect FDI refers to investment by a parent company through a subsidiary. fDi Markets tracks greenfield FDI by source economy, which is the location of the parent company, and by investing company information. In the analysis, we look at indirect investments from Asia to the UK through any EU member and to any member of the EU through the UK. Values are in $ million.Source: ADB calculations using data from Financial Times. fDi Markets.
b: Hong Kong, China
d: India
f: Singapore
Figure 2.13: Direct and Indirect Greenfield Foreign Direct Investment to the UK and EU from Asian Economies, 2015
a: People’s Republic of China
c: Republic of Korea
e: Japan
g: Australia
Trade and Global Value Chain 31
02468
101214161820
1958
1961
1964
1967
1970
1973
1976
1979
1982
1985
1988
1991
1994
1997
2000
2003
2006
2009
2012
2015
Figure 2.14: Number of Newly Effective FTAs—World
FTA = free trade agreement. Source: World Trade Organization. Regional Trade Agreement Information System. http://rtais.wto.org (accessed August 2016).
Figure 2.15: Number of Signed FTAs—Asia (cumulative since 1975)
FTA = free trade agreement.Notes: Includes bilateral and plurilateral FTAs with at least one of ADB’s 48 regional members as signatory. The year 2016 covers FTAs that came into effect from January to July and FTAs that are expected to come into force within the year based on official statements. Source: ADB. Asia Regional Integration Center FTA Database. https://aric.adb.org/fta (accessed September 2016).
0
20
40
60
80
100
120
140
160
1975
1980
1982
1989
1992
1994
1996
1998
2000
2002
2004
2006
2008
2010
2012
2014
2016
Signed but not yet in e�ect Signed and in e�ect
0
5
10
15
20
25
30
35
40
2000
2001
2002
2003
2004
2005
2006
2007
2008
2009
2010
2011
2012
2013
2014
2015
2016
Proposed Signed Proposed 2-year moving average
FTA = free trade agreement.Notes: Includes bilateral and plurilateral FTAs with at least one of ADB’s 48 regional members as signatory. The year 2016 covers FTAs that came into effect from January to July, and FTAs that are expected to come into force within the year based on official statements. “Signed“ includes FTAs that are signed but not yet in effect, and signed and in effect. “Proposed” includes FTAs that are (i) proposed (the parties consider an FTA, governments or ministries issue a joint statement on the FTA’s desirability, or establish a joint study group and joint task force to conduct feasibility studies); (ii) framework agreement signed and under negotiation (the parties, through ministries, negotiate the contents of a framework agreement that serves as a framework for future negotiations); and (iii) under negotiation (the parties, through ministries, declare the official launch of negotiations, or start the first round of negotiations).Source: ADB. Asia Regional Integration Center FTA Database. https://aric.adb.org/fta (accessed September 2016).
Figure 2.16: Number of FTAs Proposed and Signed by Year—Asia

Asian Economic Integration Report 201632
constituting slightly less than 80% of total GDP of all TPP members, would effectively block the agreement.
United States. While President Barack Obama unequivocally supports TPP ratification, President-elect Donald Trump does not, and it is unlikely the US plans to take up the issue anytime soon. Neither Republicans nor Democrats have given clear indication of their support. Recent developments suggest bleak prospect of the US ratifying the agreement soon.
Nonetheless, a diverse group of US economic and industry leaders has endorsed the agreement, including the National Association of Manufacturers, the Business Roundtable, the US Chamber of Commerce, the National Small Business Association, and the American Farm Bureau Federation. The groups recognize the TPP’s economic benefits, which range from substantial tariff elimination to protecting innovation (Office of the United States Trade Representative 2016).
Japan. Although some economic sectors are against the TPP—particularly agriculture, which fears competition with imports from Australia and the US—Japan strongly supports the TPP. In July 2016, the economy top business leaders asked Prime Minister Shinzo Abe to push for the ratification of the TPP during the Diet session in
September (Prime Minister of Japan and His Cabinet 2016a). Prime Minister Abe reiterated his determination for quick ratification, calling the agreement “pivotal” to Japan’s economic growth.12 He also urged the US government to secure ratification as soon as possible, stressing that the success or failure of the agreement “will sway the direction of the global free trade system” (Prime Minister of Japan and His Cabinet 2016b). Japan’s lower house of Parliament voted to ratify the TPP on 10 November 2016.
New Zealand parliament has also passed the bill that allows the government to ratify the TPP. Meanwhile, leaders of TPP member economies have indicated the possibility that TPP membership could expand.
Regional Cooperation Economic Partnership
Another mega trade deal, the RCEP, is also being negotiated. As noted, the RCEP would bind the 10 ASEAN members and six economies with which ASEAN
12 This is the response of Prime Minister Abe to questions against TPP during debate in the Diet sessions where TPP ratification is under deliberation (Japan Times 2016).
2013 2014 2015 2016Japan–EU ASEAN–Hong Kong, China EEU–Iran Hong Kong, China–Georgia Japan–Turkey Indonesia–Chile India–EEU Hong Kong, China–Maldives Pakistan–Thailand Indonesia–Peru India–Iran Singapore–Sri Lanka Pakistan–Republic of Korea Pakistan–US Japan–Sri Lanka Republic of Korea–Israel PRC–Japan–Republic of Korea Peru–India Philippines–Canada Nepal–PRCPRC–Israel Philippines–Australia Philippines–Chile Thailand–Sri Lanka RCEP Philippines–EU Philippines–Mexico Indonesia–EU Thailand–EU Philippines–EFTA PRC–Maldives Thailand–Colombia PRC–EU PRC–Georgia Viet Nam–EEU PRC–Sri Lanka Thailand–Jordan New Zealand–EU Pakistan–Viet Nam Singapore–Turkey Pakistan–EEU Taipei,China–India Australia–EU Singapore–EEU
Table 2.5: Recently Proposed FTAs in Asia
ASEAN = Association of Southeast Asian Nations, EEU = Eurasian Economic Union, EFTA = European Free Trade Association, EU = European Union, FTA = free trade agreement, PRC = People’s Republic of China, RCEP = Regional Comprehensive Economic Partnership, US = United States.Source: ADB. Asia Regional Integration Center FTA Database. https://aric.adb.org/fta (accessed September 2016).

Trade and Global Value Chain 33
has existing FTAs. These 16 states have agreed to conclude negotiations before the end of 2016 (Malaysia Ministry of International Trade and Industry 2016). However, according to the latest reports, RCEP will miss its agreed timeframe for concluding negotiations. The Joint Leader’s Statement on RCEP released 8 September 2016 reiterated “the importance of advancing negotiations” and calls to “intensify negotiations in a cooperative manner for the swift conclusion of the RCEP negotiations” (ASEAN 2016). But the statement indicates no timeframe on concluding talks.
Several complex issues, including on services, are holding back the negotiations. Although members have now agreed to a single-tier system of tariff relaxation from the earlier three-tier system, talks have been slow (Business Standard 2016).
According to officials, RCEP participants are planning to accelerate negotiations by holding rounds of talks through the end of 2016 (Bangkok Post 2016). As of
October 2016, 15 rounds of negotiations, which include working groups on trade in goods, trade in services, and investment, have been conducted since 2013 (Ministry of Foreign Affairs of Japan 2016). The sixteenth round of negotiations will be held on 2–10 December 2016 in Indonesia (Australian Government Department Foreign Affairs and Trade 2016).
Trade Remedies
Rising protectionism worldwide attracts increasing attention from policy makers and academia (Box 2.3). While the Asian Economic Integration Report 2015 highlighted a fast-growing number of trade remedies amid the slowdown in international trade, this trend continued in 2015 (Figure 2.17). Antidumping duties are the most prevalent trade remedies imposed on Asian exporters (Table 2.6). There was a spike in the number of trade remedies involving Asia in 2013–2015. Base metals and chemicals are the most affected sectors in the
Box 2.3: Rising Protectionism
The World Trade Organization recently downgraded its forecast for world trade growth to 1.7% in 2016 from 2.8% in April. It also cut its growth projections for 2017 to 1.8%–3.1% from the previous forecast of 3.6%. Tepid world trade growth does not bode well for a still sluggish global economic recovery marked by weak domestic demand, unable to offset slack external demand.
More worrying is the bleak landscape surrounding the future of international trade. Rising protectionism in the run-up to the peak of election cycles and on the back of growing geopolitical tensions arising out of refugee and migration issues is looming over international trade. If history is any guide, protectionism in the 1930s—through increased tariff barriers and the forming of currency blocs—exacerbated conflicts that led to World War II. Nevertheless, politics, which are prone to weigh short-term (and domestic) benefits against long-term gains, tend to be susceptible to populist sentiments that blame globalization for growing income inequality and diminishing job opportunities in domestic economies. Making matters worse, the phenomenon seems to have a domino effect, be it through political rhetoric or more frequent issuance of nontariff barriers.
a For more on rising protectionism, see Kang and Legal (2016).
Given the multipolar international trade environment, growing tensions in trade may trigger a downward spiral of negative-sum games, prompting mutual retaliation through administrative trade policy tools and undermining the nascent status of global economic growth. Those administrative trade measures, such as trade remedies and nontariff barriers, are legitimate policy tools to restore a level playing field with the former and to protect national health and environment with the latter, including sanitary or phytosanitary measures and technical barriers to trade. But they are susceptible to the vested interests of domestic stakeholders and, thus, protectionism for the sake of safeguarding national interest at the expense of others.a
Given the public good nature of open and liberalized international trade, the importance of concerted effort from the international community cannot be overemphasized—particularly at this juncture. In this context, the role that the Group of 20 and other international forums can play in upholding the growth of international trade by averting creeping protectionism and further supporting trade liberalization and facilitation efforts should be strengthened.

Asian Economic Integration Report 201634
AgreementWorldTotal
Asiaa
Total
Asia(Complainant)
ROW(Respondent)
ROW(Complainant)
Asia (Respondent)
Asia (Complainant)
Asia (Respondent)
Antidumping (Article VI of GATT 1994) Number of measures implemented 888 719 346 103 270Number of cases 33 (4%) 25 (3.5%) 14 7 4 Countervailing MeasuresNumber of measures implemented 78 67 52 7 8Number of casesb 27 (35%) 19 (28%) 9 9 1 Safeguardsc
Number of measures implementedd 59 33 26 33 33Number of cases 12 (20%) 5 (15%)
3 0 2TotalNumber of measures implemented 1025 819 424 143 311Number of cases 72 (7%) 49 (6%) 26 16 7
Table 2.6: Trade Remedy Measures and WTO Cases, 2010–2016
ROW = rest of the world, WTO = World Trade Organization. a Asia as implementing or affected region, which is equivalent to the global number of trade remedy measures less ROW-ROW
(not shown in table). b Includes cases involving complaints on grant of subsidies and countervailing measures. c Safeguard measures are imposed on all WTO members; no bilateral data available. d Includes safeguard measures affecting all WTO members.Note: Trade remedies include measures in force. Sources: ADB calculations based on data from WTO. Integrated Trade Intelligence Portal. https://www.wto.org/english/res_e/statis_e/itip_e.htm; WTO. Disputes by Agreement. https://www.wto.org/english/tratop_e/dispu_e/dispu_agreements_index_e.htm (accessed August 2016).
2000
2001
2002
2003
2004
2005
2006
2007
2008
2009
2010
2011
2012
2013
2014
2015
Antidumping duties Countervailing duties Safeguards
0
50
100
150
200
250
300
Figure 2.17: Number of Trade Remedy Measures Affecting Asia (by type)
Note: Trade remedy measures include both “initiated” and “in force.” Safeguard measures are imposed on all members of the World Trade Organization; no bilateral data available.Source: ADB calculations based on data from WTO. Integrated Trade Intelligence Portal. https://www.wto.org/english/res_e/statis_e/itip_e.htm (accessed August 2016).

Trade and Global Value Chain 35
HS Product Description Total
Anti-dumping
DutiesCountervailing
Duties Safeguards
Base metals and articles
491 379 71 41
Products of the chemical and allied industries
202 173 16 13
Resins, plastics and articles; rubber and articles
147 125 12 10
Machinery and electrical equipment
109 91 11 7
Table 2.7: Number of Trade Remedy Measures Affecting Asia, 2010–2016
HS = harmonized system.Note: Trade remedy measures include both initiated and in force.Source: ADB calculations based on data from WTO. Integrated Trade Intelligence Portal. https://www.wto.org/english/res_e/statis_e/itip_e.htm (accessed August 2016).
Economy Affected
Number of Measures Implemented
ROW Asia Total
PRC 253 136 389
Republic of Korea 56 66 122
Taipei,China 58 63 121
PRC = People’s Republic of China, ROW = rest of the world.Notes: Trade remedies include measures in force. Safeguard measures are applied to all WTO members, hence the number of measures implemented include measures that are applied to all WTO members.Source: ADB calculations based on data from WTO. Integrated Trade Intelligence Portal. https://www.wto.org/english/res_e/statis_e/itip_e.htm (accessed August 2016).
Table 2.8: Number of Implemented Trade Remedy Measures—Top Affected Asian Economies, 2010–2016
region (Table 2.7). The PRC; the Republic of Korea; and Taipei,China are the Asian economies most affected by trade remedies (Table 2.8).
Sanitary and Phytosanitary and Technical Barriers to Trade Measures
An important goal for governments is to guarantee the safety of food for consumers and prevent or limit the spread of pests, outbreak of diseases among plants and animals, and other health risks arising from residues (of pesticides or veterinary drugs), contaminants (heavy metals), toxins or disease-causing organisms in food, beverages, or feed. Policies with these objectives are generally referred to as sanitary (human and animal health) and phytosanitary (plant health) measures, more commonly known as sanitary and phytosanitary (SPS) measures, which include all relevant laws, decrees, regulations, requirements and procedures.
In response to consumer demand for greater product safety and stricter environmental protection, governments have tightened existing rules or implemented new policies. Economies have therefore
increased technical regulations (which are mandatory) and standards (which are voluntary). These regulations and standards, also known as technical barriers to trade (TBTs), define either the specific characteristics of a product (for example, shape, size, or design and performance) or can pertain to the process and methods used in production (WTO 2012).
Despite their legitimate national heath and security rationale, stringent SPS and TBT measures and delays in unexpected procedures concerned could harm trade flows by acting as nontariff barriers, due to high compliance costs for businesses and the perishable nature of some exported products. The incidence of SPS and TBT measures has grown. As of August 2016, 14,123 SPS measures and 21,399 TBT measures had been notified to the World Trade Organization (WTO). Figures 2.18 and 2.19 show the number of notifications to the WTO and the number of notifying economies since 1995 for SPS and TBT measures—both trending upward.
The majority of SPS and TBT measures are imposed on all WTO members, although some are bilateral. On average, 46 WTO economies were notified as imposing SPS measures from 1995–2015; 30% from Asia. For the same period, an average of 59 WTO economies

Asian Economic Integration Report 201636
notified imposing TBT measures, with a quarter of these from Asia.
The evidence of upward trends in the number of SPS and TBT measures notified is supported by complaint-based information contained in the Specific Trade Concerns Database (Figures 2.20, 2.21). Trends also show that more TBT than SPS measures were imposed, and that more
economies imposed TBT measures than SPS measures. Asia imposed the most TBT (4,948) and SPS (4,297) measures, followed by North America, with 4,001 SPS measures and 2,337 TBT measures. Asia was most targeted by bilateral SPS measures (282) or SPS measures
SPS = sanitary and phytosanitary, TBT = technical barriers to tradeNote: SPS and TBT measures include both initiated and in force. Source: ADB calculations based on data from World Trade Organization. Integrated Trade Intelligence Portal. https://www.wto.org/english/res_e/statis_e/itip_e.htm (accessed August 2016).
Figure 2.18: Number of SPS Measures
0
10
20
30
40
50
60
0
200
400
600
800
1,000
1,200
1,400
1995
1997
1999
2001
2003
2005
2007
2009
2011
2013
2015
Number of SPS Measures (left scale)Number of economies imposing SPS measures (right scale)Number of Asian economies imposing SPS measures (right scale)
Figure 2.21: Number of Specific Trade Concerns Raised to the WTO TBT Committee
TBT = technical barriers to trade, WTO = World Trade Organization.Source: ADB calculations based on data from WTO. Integrated Trade Intelligence Portal. https://www.wto.org/english/res_e/statis_e/itip_e.htm (accessed August 2016).
Number of TBT-speci�c trade concern (left scale)Cumulative (right scale)
050
100150200250300350400450500
05
101520253035404550
1995
1997
1999
2001
2003
2005
2007
2009
2011
2013
2015
Number of SPS-related trade concerns (left scale)Cumulative (right scale)
0
50
100
150
200
250
300
350
400
450
05
101520253035404550
1995
1997
1999
2001
2003
2005
2007
2009
2011
2013
2015
SPS = sanitary and phytosanitary, WTO = World Trade Organization.Source: ADB calculations based on data from WTO. Integrated Trade Intelligence Portal. https://www.wto.org/english/res_e/statis_e/itip_e.htm (accessed August 2016).
Figure 2.20: Number of Specific Trade Concerns Raised to the WTO SPS Committee
SPS = sanitary and phytosanitary, TBT = technical barriers to trade,Note: SPS and TBT measures include both initiated and in force. Source: ADB calculations based on data from World Trade Organization. Integrated Trade Intelligence Portal. https://www.wto.org/english/res_e/statis_e/itip_e.htm (accessed August 2016).
Figure 2.19: Number of TBT Measures
010
20
30
40
50
60
70
80
90
0200400600800
1,0001,2001,4001,6001,8002,000
1995
1997
1999
2001
2003
2005
2007
2009
2011
2013
2015
Number of TBT measures (left scale)Number of economies imposing TBT measures (right scale)Number of Asian economies imposing TBT measures (right scale)

Trade and Global Value Chain 37
CIS = Commonwealth of Independent States, SPS = sanitary and phytosanitary.Note: SPS measures include both initiated and in force. Source: ADB calculations based on data from World Trade Organization. Integrated Trade Intelligence Portal. https://www.wto.org/english/res_e/statis_e/itip_e.htm (accessed August 2016).
0
500
1,000
1,500
2,000
2,500
3,000
3,500
4,000
4,500
Asia North America
Latin America and the
Caribbean
Europe MiddleEast
Africa CIS
Figure 2.22: Number of SPS Measures Imposedby Region, 1995–2015
Figure 2.23: Number of Bilateral SPS Measures Affecting Each Region, 1995–2015
CIS = Commonwealth of Independent States, SPS = sanitary and phytosanitary.Note: SPS measures include both initiated and in force. Source: ADB calculations based on data from World Trade Organization. Integrated Trade Intelligence Portal. https://www.wto.org/english/res_e/statis_e/itip_e.htm (accessed August 2016).
0
50
100
150
200
250
300
Asia LatinAmericaand the
Caribbean
Europe NorthAmerica
Africa Middle East CIS
that are imposed on a particular economy and not on all WTO members (Figures 2.22, 2.23).13
The US has imposed the most number of SPS (2,769) and TBT (1,256) measures. The PRC is second in TBT measures and third in SPS measures. Japan and the Republic of Korea are in the top 10 economies
13 No bilateral data are available on TBT measures.
Figure 2.24: Top 10 Economies Imposing SPS, 1995–2015 (number of measures)
PRC = People’s Republic of China, EU = European Union, SPS = sanitary and phytosanitary, US = United States.Note: SPS measures include both initiated and in force. Source: ADB calculations based on data from World Trade Organization. Integrated Trade Intelligence Portal. https://www.wto.org/english/res_e/statis_e/itip_e.htm (accessed August 2016).
0 1,500 3,000
US
Brazil
PRC
Canada
Peru
EU
New Zealand
Republic of Korea
Chile
Japan
PRC = People’s Republic of China, EU = European Union, TBT = technical barriers to trade, US = United States.Note: TBT measures include both initiated and in force. Source: ADB calculations based on data from World Trade Organization. Integrated Trade Intelligence Portal. https://www.wto.org/english/res_e/statis_e/itip_e.htm (accessed August 2016).
Figure 2.25: Top 10 Economies Imposing TBT, 1995–2015 (number of measures)
0 200 600 1,000 1,400
US
PRC
EU
Saudi Arabia
Israel
Brazil
Japan
Republic of Korea
Netherlands
Canada

Asian Economic Integration Report 201638
trade. Economic theory offers no straightforward forecast of how these measures impact international flows of goods. Instead, theory proposes that the effect of SPS and TBT measures on trade may vary and does not always reduce trade. For example, Thilmany and Barrett (1997) differentiate informative and non-informative regulatory measures. The former contains information addressing consumer concerns about product quality or safety; the latter does not. Evaluating the diverse effects of SPS and TBT measures remains an empirical issue.
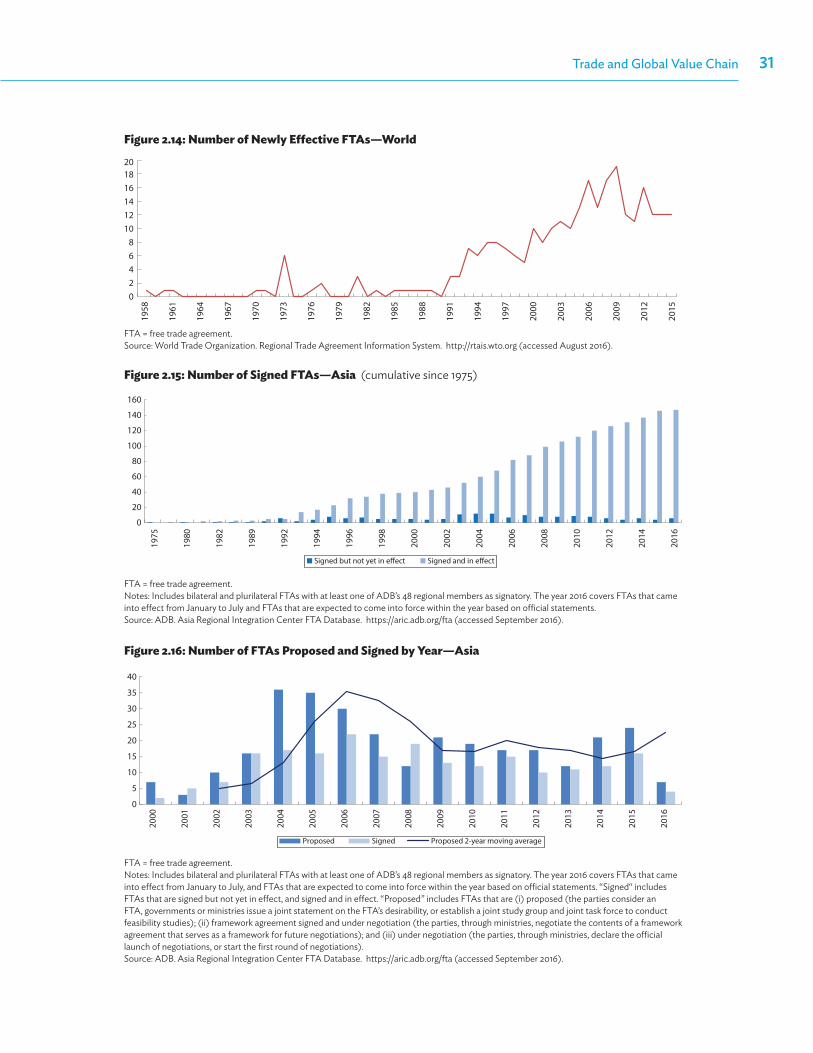
SPS and TBT measures are estimated to forge significantly negative impact on exports from developing economies, particularly on Asia’s intraregional trade in agricultural products.
SPS and TBT agreements require WTO members to notify the WTO Secretariat on the SPS and TBT measures they impose. These notifications are collected, complemented by information based on national sources, and analyzed by the United Nations Conference on Trade and Development, which are available through the World Bank’s World Integrated Trade Solution. For economies with no SPS and TBT data available under the World Integrated Trade Solution, we gather data from WTO’s Integrated Trade Intelligence Portal (I-TIP).
Using these data, we estimate various econometric models on the trade impact of SPS and TBT measures (Box 2.4). Model estimation results show that the positive impact of SPS and TBT on trade flows is mainly driven by exports of advanced economies, followed by Asian exports, while the majority of developing and least developed economies in the rest of the world face negative impacts from SPS and TBT. We further examine whether different impacts of SPS and TBT on trade exist by separately testing the impact of SPS and TBT. The results indicate that positive impacts largely stem from TBT, while the impact of SPS is insignificant. Developing Asia’s exports, in particular, are negatively affected by SPS measures. Developing Asia’s exports in agriculture sector are even more susceptible to SPS measures. Further, intraregional trade among developing Asia is also being hurt by SPS measures. These results suggest policy makers in the region need to act more proactively in resolving nontariff barriers across borders, in particular, by focusing on SPS. Stronger regional cooperation through subregional and regional dialogue should help.
Figure 2.26: Number of SPS and TBT Measures Imposed on Product Groups, 1995–2015
SPS = sanitary and phytosanitary, TBT = technical barriers to trade.Note: SPS and TBT measures include both initiated and in force. Source: ADB calculations based on data from World Trade Organization. Integrated Trade Intelligence Portal. https://www.wto.org/english/res_e/statis_e/itip_e.htm (accessed August 2016).
0 4,000 8,000 12,000
Unclassi�ed
Machinery andelectrical equipment
Prepared foodstu�;beverages, spirits, vinegar;
tobacco
Products of the chemical andallied industries
Resins, plastics and articles;rubber and articles
Vegetable products
Miscellaneous manufacturedarticles
Base metals and articles
Instruments, clocks, recorders, and reproducers
Live animals andproducts
SPS TBT
imposing the most number of SPS and TBT measures (Figures 2.24, 2.25).
Product groups subject to large numbers of SPS measures include (i) live animals and products; (ii) vegetable products; (iii) prepared foodstuff, beverages, spirits, vinegar, tobacco; (iv) products of the chemical and allied industries; and (v) animal and vegetable fats, oils and waxes (Figure 2.26).
Product groups subject to high numbers of TBT measures include (i) machinery and electrical equipment; (ii) prepared foodstuff; beverages, spirits, vinegar; tobacco; (iii) products of the chemical and allied industries; (iv) resins, plastics and articles; rubber and articles; and (v) vegetable products.
Despite their growing importance, there is a dearth of knowledge on the impact of SPS and TBT measures on

Trade and Global Value Chain 39
shows highly significant and negative effect on bilateral trade flows. As expected, ad valorem equivalent bilateral applied tariff rate (weighted average) exert a significantly negative impact on trade.
As shown in box table 1a, existence of SPS or TBT increases trade in both pooled OLS and panel regressions. According to the basic model, SPS and TBT increase average worldwide bilateral trade by 15% to 19%. Regional differences are revealed in the regression results under columns (3) and (4). Compared with economies of the Organisation for Economic Co-operation and Development (OECD), Asia’s exports to the world are more positively affected by the SPS and TBT measures of importers. On the other hand, exports of non-Asia, non-OECD economies are hurt by SPS and TBT measures, as evidenced by the significant, negative coefficient of −0. 38 (in pooled OLS) and −0.17 (in the panel regression). On average, exports of non-Asia, non-OECD economies are 13% lower due to SPS and TBT measures of importers, according to the pooled OLS regression. It is worth noting that, in our analysis, non-Asia, non-OECD economies constitute the largest sample, with 91 economies in Africa, the Middle East, Latin America, and Eastern Europe.
The regression results presented for the agriculture sector reveal interesting implications (box table 1b). When importers are OECD economies, the positive impact of SPS and TBT on exports from Asia and non-Asian, non-OECD economies are very much subdued, while OECD-to-OECD trades are greatly boosted. For Asian importers, the positive impact of SPS and TBT on exports from OECD economies in the agriculture sector is much smaller, at 27%. While this positive impact is significantly boosted for imports from non-Asia, non-OECD economies, the impact for imports from Asian economies is significantly dampened by SPS and TBT measures, making the overall impact −7%. For agriculture, SPS and TBT measures hurt intraregional trade in Asia.
Testing the impact of SPS and TBT separately reveals interesting results (box table 2). While Asia’s exports to the world are hurt by SPS measures of importing economies particularly in agricultural sector, TBT measures have positive impact on exports. The opposite results are demonstrated for non-Asia, non-OECD economies. Their exports are significantly larger due to SPS measures of importers, but are significantly lower due to TBT measures. When the effects of SPS and TBT are tested separately, SPS measures show large negative impact on intraregional trade. Intraregional trade among developing Asian economies is being hurt by SPS.
Box 2.4: Impact of Nontariff Measures on Trade Flows
Following Feenstra (2004), which measured the impact of sanitary and phytosanitary (SPS) and technical barriers to trade (TBT) measures on trade in agriculture, we estimate the gravity equation model using fixed effects for each exporting and importing economy. These fixed effects consider the size effects, including the price and number of varieties of the exporting economy for each sector and the size of demand and the price index of the importing partner. To control for various types of economy and sector-specific factors that may affect trade flows, we include a set of importer, exporter, and sector fixed effects, which can also mitigate potential endogeneity problems.
To measure transport costs, bilateral distance between both partners (d) are used. These distances are obtained from the CEPII database. In addition, a dummy variable “contiguity” (contig), which equals one if both economies share a border, is also included. Bilateral trade can be enhanced by economies’ cultural proximity. We therefore control for this proximity by introducing two dummy variables, respectively equal to 1 if there is a common official or primary language spoken in both economies (comlang_off) or if both partners have had colonial ties (col). Data are also derived from the CEPII database. The dependent variable x refers to bilateral import data of country j (importer) from country i (exporter) at the four-digit level of the Harmonized System classification. The source is the United Nations Commodity Trade database. Notifications and tariff data are compiled from 2012 to 2014 in our sample. To address the problem that the error terms are likely to exhibit correlation patterns for a given country-pair, we cluster the robust standard errors at the country-pair and four-digit product code level. Our model specification is analogous to the Disidier et al. (2008) approach.
The estimated base equation using pooled ordinary least squares (OLS) and panel regression method is
To investigate the impact of SPS and TBT measures on the exports of different exporter and importer groups and income groups, we also add regional and income group dummy for different regression models.
The regression results across all models confirm the expected impact of gravity factors. Gross domestic product (GDP) levels of both exporter and importer have significantly positive impact on trade. The same applies to border contiguity, use of common language, and historical colonial ties. Geographical distance
ln 𝑥𝑥𝑖𝑖𝑖𝑖𝑖𝑖ℎ𝑠𝑠4 = 𝜇𝜇𝑖𝑖𝑓𝑓𝑓𝑓𝑖𝑖
ℎ𝑠𝑠 + 𝛼𝛼𝑖𝑖𝑓𝑓𝑓𝑓𝑖𝑖ℎ𝑠𝑠 +𝛿𝛿1 ln 𝐺𝐺𝐺𝐺𝐺𝐺𝑖𝑖𝑖𝑖+𝛿𝛿2 ln 𝐺𝐺𝐺𝐺𝐺𝐺𝑖𝑖𝑖𝑖+ 𝛿𝛿3 ln 𝑑𝑑𝑖𝑖𝑖𝑖
+ 𝛿𝛿4contig𝑖𝑖𝑖𝑖 + 𝛿𝛿5comlang_off𝑖𝑖𝑖𝑖 + 𝛿𝛿6col𝑖𝑖𝑖𝑖+ 𝛿𝛿7𝑡𝑡𝑡𝑡𝑡𝑡𝑖𝑖𝑖𝑖𝑖𝑖ℎ𝑠𝑠4+ 𝛿𝛿8𝑁𝑁𝑁𝑁𝑁𝑁𝑖𝑖𝑖𝑖𝑖𝑖
ℎ𝑠𝑠4 + 𝜀𝜀𝑖𝑖𝑖𝑖ℎ𝑠𝑠4
Asian Economic Integration Report 201640
1a: Influence of SPS/TBT—Full Sample, 2012–2014
Dependent variable: Log(bilateral imports)
(1)Pooled OLS
(2)Panel–Random
Effects
(3)Pooled OLS
(4)Panel - Random
EffectsImporter All WTO member economies All WTO member economiesExporter All WTO member economies All WTO member economiesBilateral applied tariff AVE(weighted average) −0.01***
(0.00)−0.01***(0.00)
−0.01***(0.00)
−0.01***(0.00)
SPS/TBT dummy (at least 1 SPS or TBT at HS6 level)a
0.19***(0.01)
0.15***(0.01)
0.27***(0.01)
0.18***(0.01)
Exporter dummy (base = OECD)
Asia 0.67***(0.10)
1.24*** (0.07)
Non-Asia, non-OECD 2.94***(0.14)
−1.54*** (0.11)
Interaction: SPS/TBT dummy and exporter dummy
Asia 0.09***(0.02)
0.08***(0.02)
Non-Asia, non-OECD −0.38***(.02)
−0.17***(0.02)
Number of observations 2,448,182 2,448,182 2,448,182 2,448,182R-squared 0.39 0.31 0.39 0.31
1b: Influence of SPS/TBT—Agriculture Sector, 2012–2014
Dependent variable: Log(bilateral imports) (5) (6) (7) (8)
Importer OECD Economies Asian EconomiesExporter All WTO Member Economies All WTO Member EconomiesBilateral applied tariff AVE (weighted average) −0.003***
(0.00)−0.003***(0.00)
−0.001***(0.00)
−0.001***(0.00)
SPS/TBT dummy (at least 1 SPS or TBT at HS6 level)a 0.90***(0.13)
1.35***(0.13)
0.38***(0.04)
0.27***(0.06)
Exporter dummy(base = OECD)
Asia 0.31(0.34)
1.03***(0.40)
Non-Asia, non-OECD −3.05***(0.80)
−2.11*(1.09)
SPS/TBT dummy X exporter dummyAsia −0.70***
(0.11)−0.34***(0.12)
Non-Asia, non-OECD −1.01***(0.10)
0.79***(0.12)
Number of observations 157,006 157,006 146,137 146,137R-squared 0.32 0.32 0.24 0.25
*** = significant at 1%, ** = significant at 5%, * = significant at 10%. AVE = ad valorem equivalent, HS = harmonized system, OECD = Organisation for Economic Co-operation and Development, OLS = ordinary least squares, SPS = sanitary and phytosanitary, TBT = technical barriers to trade, WTO = World Trade Organization. a To clarify, four-digit level of the harmonized system (HS) classification is considered equal to 1 if the importing economy notifies at least one SPS or TBT measure at
the six-digit level, which is under the four-digit level of the HS classification.Note: Robust standard errors in parentheses. Based on pooled OLS, models (1) and (3) include exporter, importer, and sector (four-digit level) fixed effects (no interaction). Panel regression (random effects) models (2) and (4) include exporter, importer, and sector (two-digit level) fixed effects (no interaction). Pooled OLS models 5-8 include exporter and sector (two-digit level) specific importer fixed effects (with interaction) in all estimations. Usual gravity model variables were included, but not shown for brevity. Sources: ADB calculations using data from Institute for Research on the International Economy. http://www.cepii.fr/CEPII/en/cepii/cepii.asp; United Nations. Commodity Trade Database. https://comtrade.un.org; World Bank. World Integrated Trade Solution. https://wits.worldbank.org; and WTO. Integrated Trade Intelligence Portal. https://www.wto.org/english/res_e/statis_e/itip_e.htm (all accessed August 2016).
Box 2.4. continued.

Trade and Global Value Chain 41
2: Influence of SPS and TBT Separately, 2012–2014Dependent variable: Log(bilateral imports)
(1)SPS
(2)TBT
(3)SPS
(4)TBT
(5)SPS
(6)TBT
(7)SPS
(8)TBT
Importer All WTO members Developing AsiaExporter All WTO members All WTO membersSector All sectors Agriculture All sectorsBilateral applied tariff AVE (weighted average)
−0.02***(0.00)
−0.02***(0.00)
−0.02***(0.00)
−0.02***(0.00)
−0.02***(0.00)
−0.02***(0.00)
−0.06***(0.00)
−0.06***(0.00)
SPS (TBT) dummya −0.002(0.02)
0.09***(0.04)
−0.03(0.02)
0.34***(0.04)
−0.20***(0.04)
0.67***(0.07)
−0.37***(0.02)
0.32***(0.00)
Exporter dummy (base = OECD)Developing Asia 1.28***
(0.48)0.89*(0.48)
7.02***(1.06)
6.55***(1.07)
2.22(3.33)
2.44(3.33)
Non-Developing Asia, non-OECD
1.82***(0.57)
2.82***(0.58)
9.68***(1.22)
10.26(1.22)
3.51(3.83)
4.74(3.83)
Interaction: SPS (TBT) dummy and exporter dummyDeveloping Asia −0.50***
(0.04)0.20***(0.08)
−0.39***(0.09)
0.04(0.12)
−0.51***(0.10)
0.42***(0.13)
Non-Developing Asia, non-OECD
0.47***(0.04)
−1.07***(0.07)
0.29***(0.08)
−0.93***(0.11)
0.31***(0.10)
−0.41***(0.12)
Number of observations 271,280 271,280 271,280 271,280 60,151 60,151 19,182 19,182R-squared 0.38 0.38 0.38 0.38 0.16 0.16 0.44 0.44
*** = significant at 1%, ** = significant at 5%, * = significant at 10%. AVE = ad valorem equivalent, HS = harmonized system, OECD = Organisation for Economic Co-operation and Development, OLS = ordinary least squares, SPS = sanitary and phytosanitary, TBT = technical barriers to trade, WTO = World Trade Organization.a To clarify, four-digit level of the harmonized system (HS) classification is considered equal to 1 if the importing economy notifies at least one SPS (TBT) measure
at the six-digit level, which is under the four-digit level of the HS classification.Note: Robust standard errors in parentheses. Based on panel regression which includes exporter, importer, and sector (four-digit level) fixed effects (no interaction). For brevity, the results of coefficients for usual gravity factors are not presented. Pooled regression was also done to confirm and compare the results. Sources: ADB calculations using data from Institute for Research on the International Economy. http://www.cepii.fr/CEPII/en/cepii/cepii.asp; United Nations. Commodity Trade Database. https://comtrade.un.org; World Bank. World Integrated Trade Solution. https://wits.worldbank.org; and WTO. Integrated Trade Intelligence Portal. https://www.wto.org/english/res_e/statis_e/itip_e.htm (all accessed August 2016).
Box 2.4. continued.

Asian Economic Integration Report 201642
Dep
ende
nt V
aria
ble:
Lo
g (b
ilate
ral e
xpor
ts
volu
me)
Full
Perio
dPr
e-G
loba
l Fi
nanc
ial
Cris
is
Glo
bal
Fina
ncia
l Cr
isis
Post
-G
loba
l Fi
nanc
ial
Cris
isFu
ll Pe
riod
Pre-
Glo
bal
Fina
ncia
l Cr
isis
Glo
bal
Fina
ncia
l Cr
isis
Post
-G
loba
l Fi
nanc
ial
Cris
is
Full
Perio
dPr
e-G
loba
l Fi
nanc
ial
Cris
is
Glo
bal
Fina
ncia
l Cr
isis
Post
-G
loba
l Fi
nanc
ial
Cris
is
Log(
real
GD
P of
expo
rter)
0.43
3***
(0.0
692)
0.70
7**
(0.3
16)
0.28
6(0
.188)
0.11
7(0
.310
)0.
334*
**(0
.068
0)0.
562*
(0.3
22)
0.26
0(0
.189)
0.30
4(0
.311
)0.
326*
**(0
.069
1)0.
445
(0.3
14)
0.24
6(0
.190)
0.29
9(0
.319
)
Log(
dist
ance
)−1
.728
***
(0.0
286)
−1.7
36**
*(0
.032
2)−1
.802
***
(0.0
322)
−1.6
99**
*(0
.034
0)−1
.749*
**(0
.028
6)−1
.737
***
(0.0
323)
−1.8
06**
*(0
.032
4)−1
.716
***
(0.0
341)
−1.74
8***
(0.0
289)
−1.7
30**
*(0
.032
3)−1
.803
***
(0.0
331)
−1.70
2***
(0.0
336)
Colo
nial
relat
ions
hip
dum
my
0.60
1***
(0.12
6)0.
722*
**(0
.134)
0.60
2***
(0.13
7)0.
553*
**(0
.141)
0.58
6***
(0.12
5)0.
723*
**(0
.134)
0.59
6***
(0.13
7)0.
559*
**(0
.140)
0.57
1***
(0.12
7)0.
725*
**(0
.135)
0.60
3***
(0.13
8)0.
562*
**(0
.138)
Com
mon
lang
uage
dum
my
0.86
7***
(0.0
549)
0.74
1***
(0.0
636)
0.84
5***
(0.0
642)
0.86
4***
(0.0
657)
0.84
8***
(0.0
550)
0.73
8***
(0.0
640)
0.84
9***
(0.0
645)
0.85
4***
(0.0
662)
0.86
1***
(0.0
555)
0.74
6***
(0.0
642)
0.84
1***
(0.0
652)
0.87
4***
(0.0
661)
Cont
iguity
0.51
3***
(0.15
1)0.
511*
**(0
.164)
0.45
8***
(0.17
0)0.
507*
**(0
.172)
0.58
3***
(0.15
2)0.
509*
**(0
.164)
0.45
8***
(0.17
3)0.
534*
**(0
.173)
0.59
3***
(0.15
3)0.
510*
**(0
.163)
0.44
6**
(0.17
4)0.
579*
**(0
.174)
Log(
real
exch
ange
rate
)0.
130*
**(0
.010
9)0.
661*
**(0
.112)
0.08
78**
*(0
.033
9)0.
274*
**(0
.081
7)
Log(
real
exch
ange
rate
t-1)
0.05
76**
*(0
.009
15)
0.22
2***
(0.0
676)
0.02
56(0
.017
6)0.
197
(0.14
7)
Log(
real
exch
ange
rate
t-2)
0.04
16**
*(0
.008
72)
0.04
58(0
.041
2)0.
0092
5(0
.019
7)0.
0726
(0.0
549)
Cons
tant
13.7
2***
(1.9
05)
4.51
5(7
.949
)15
.95*
**(5
.407
)11
.40*
**(1
.606
)6.
971
(7.2
41)
9.97
8(6
.952
)12
.08*
**(1
.633
)9.
641
(7.11
7)7.8
31(7
.451
)
Obs
erva
tions
128,
046
32,3
6133
,863
30,4
0712
7,716
32,15
133
,682
31,2
9511
9,98
931
,933
33,5
1431
,707
Num
ber o
f cou
ntry
-pair
s10
,319
8,85
69,
400
8,81
510
,512
8,80
19,
332
8,69
910
,505
8,74
39,
250
8,76
6
Ann
ex 2
a: G
ravi
ty M
odel
Est
imat
ion
Resu
lts:
Impa
ct o
f Rea
l Exc
hang
e Ra
tes o
n Ex
port
s
*** =
sign
ifica
nt a
t 1%
, ** =
sign
ifica
nt a
t 5%
, * =
sign
ifica
nt a
t 10%
. N
ote:
Ful
l-per
iod
cove
rs 2
001−
2015
, pre
-glo
bal fi
nanc
ial c
risis
cove
rs 2
003–
2006
, glo
bal fi
nanc
ial c
risis
cove
rs 2
007–
2010
, and
pos
t-gl
obal
fina
ncia
l cris
is co
vers
201
2–20
15.
Sour
ces:
AD
B ca
lcul
atio
ns u
sing d
ata
from
Inst
itute
for R
esea
rch
on th
e In
tern
atio
nal E
cono
my.
http
://w
ww.
cepi
i.fr/C
EPII/
en/c
epii/
cepi
i.asp
; Uni
ted
Nat
ions
. Com
mod
ity T
rade
Dat
abas
e. h
ttps:/
/com
trade
.un.
org;
and
Wor
ld B
ank.
Wor
ld D
evel
opm
ent I
ndic
ator
s. d
ata.w
orld
bank
.org
/dat
a-ca
talo
g/w
orld
-dev
elop
men
t-in
dica
tors
(acc
esse
d Se
ptem
ber 2
016)
.
Ann
exes

Trade and Global Value Chain 43
Dom
estic
Val
ue A
dded
in G
ross
Expo
rts
Dom
estic
val
ue a
dded
ab
sorb
ed a
broa
d
T1In
�nal
go
ods
expo
rts
T2In
term
edia
tes
expo
rts
abso
rbed
by
dire
ct
impo
rter
s
T3+T
4+T5
Inte
rmed
iate
sre
-exp
orte
d to
th
ird c
ount
ries
Dom
estic
val
uead
ded
retu
rns
hom
e
T6In
term
edia
tes
that
retu
rn
via
�nal
im
port
s
T7In
term
edia
tes
that
retu
rn in
�n
al im
port
s vi
a th
ird
coun
trie
s
T8In
term
edia
tes
that
retu
rn v
ia
inte
rmed
iate
im
port
s
T3In
term
edia
te
expo
rts
to th
ird
coun
trie
sto
prod
uce
dom
estic
�na
l go
ods
T4Pr
oduc
e �n
al
good
s ex
port
s to
third
co
untr
ies
T5Pr
oduc
e in
term
edia
te
expo
rts
to
third
cou
ntrie
s to
pro
duce
ex
port
s
Fore
ign
valu
e-ad
ded
Fore
ign
valu
ead
ded
used
in
inte
rmed
iate
exp
orts
Fore
ign
valu
ead
ded
used
in �
nal g
oods
ex
port
s
T11
Sour
ced
from
the
dire
ct
impo
rter
s
T12
Sour
ced
from
oth
er
coun
trie
s
T13
Sour
ced
from
the
dire
ct
impo
rter
s
T14
Sour
ced
from
oth
er
coun
trie
s
Pure
doub
le c
ount
ing
Fore
ign
valu
ead
ded
used
in
inte
rmed
iate
exp
orts
Pure
doub
le c
ount
ing
from
fore
ign
sour
ces
T15
Due
to d
irect
im
port
er
expo
rts
prod
uctio
n
T16
Due
to
othe
r co
untr
ies
expo
rts
prod
uctio
n
T9D
ue to
�na
l go
ods
expo
rts
prod
uctio
n
T10
Due
to
inte
rmed
iate
ex
port
s pr
oduc
tion
Gro
ssEx
port
s
Ann
ex 2
b: D
ecom
posi
tion
of G
ross
Exp
orts
Sour
ce: W
ang,
Wei
, and
Zhu
(201
4).

Asian Economic Integration Report 201644
ReferencesADB. 2015. How can Special Economic Zones Catalyze
Economic Development? Asian Economic Integration Report 2015. Manila.
J.E. Anderson and E.V. Wincoop. 2003. Gravity And Gravitas: A Solution To The Border Puzzle. American Economic Review. 93(1). pp. 170-192.
Association of Southeast Asian Nations (ASEAN). 2016. ASEAN Joint Leaders’ Statement on the Regional Comprehensive Economic Partnership. https://www.asean2016.gov.la/kcfinder/upload/files/Joint%20Leaders%E2%80%99%20Statement%20%20on%20the%20Regional%20Comprehensive%20Economic%20Partnership%20(RCEP).pdf
Australian Government Department Foreign Affairs and Trade. 2016. Regional Comprehensive Economic Partnership. http://dfat.gov.au/trade/agreements/rcep/Pages/regional-comprehensive-economic-partnership.aspx
Bangkok Post. 2016. RCEP Leaders to Skip 2016 Completion Target. 7 September. http://www.bangkokpost.com/business/news/1080409/rcep-leaders-to-skip-2016-completion-target
Business Standard. 2016. RCEP Talks May Miss December 2016 Deadline, Enter 2017: Nirmala. 24 August. http://www.business-standard.com/article/pti-stories/rcep-talks-may-miss-december-2016-deadline-enter-2017-nirmala-116082401240_1.html
DBS Group Research. 2016. Japan: Rising Direct Investment in Southeast Asia. 18 March. https://www.dbs.com/aics/pdfController.page?pdfpath=/content/article/pdf/AIO/160318_insights_japan_looks_to_southeast_asia_for_growth.pdf.
A. C. Disdier, L. Fontagné, and M. Mimouni. 2008. The Impact of Regulations on Agricultural Trade: Evidence from the SPS and TBT Agreements. American Journal of Agricultural Economics. 90 (2). pp.336–50.
R. Feenstra. 2004. Advanced International Trade: Theory and Evidence. Princeton, New Jersey: Princeton University Press.
International Monetary Fund (IMF). 2016. World Economic Outlook Update: Uncertainty in the Aftermath of the UK Referendum. Washington, DC: International Monetary Fund.
Japan Times. 2016. Abe Goes Toe-to-toe Over TPP as Diet Debate Heats Up. 27 September. http://www.japantimes.co.jp/news/2016/09/27/national/politics-diplomacy/abe-goes-toe-toe-tpp-diet-debate-heats/#.V-s59_l96Uk
J.W. Kang and M. Legal. 2016. Rising tides of protectionism will cause more harm than good. Asian Development Blog. 25 May. https://blogs.adb.org/blog/rising-tides-protectionism-will-cause-more-harm-good
Malaysia Ministry of International Trade and Industry. 2016. Media Statement: ASEAN Committed Towards Preserving Centrality and Meeting the 2016 Deadline of Regional Comprehensive Economic Partnership (RCEP) Negotiations. http://www.miti.gov.my/index.php/pages/view/3048
Ministry of Foreign Affairs of Japan. 2016. Negotiations on Regional Comprehensive Economic Partnership (RCEP). http://www.mofa.go.jp/policy/economy/page2e_000001.html
Office of the United States Trade Representative. 2016. TPP Endorsements: Diverse Coalition of American Businesses, Farmers, and Manufacturers Call for TPP Passage to Help Boost Made in America Exports, Level the Playing Field. https://ustr.gov/about-us/policy-offices/press-office/press-releases/2016/january/Diverse-Coalition-American-Businesses-Farmers-Manufacturers-Call-for-TPP-Passage#
Prime Minister of Japan and His Cabinet. 2016a. Proposal from Economic Organizations on Seeking the Early Realization of the TPP Agreement. http://japan.kantei.go.jp/97_abe/actions/201607/13article2.html
Prime Minister of Japan and His Cabinet. 2016b. Address by Prime Minister Shinzo Abe at the Seminar “Investment Opportunities in Japan toward the New Asia-Pacific Era.” http://japan.kantei.go.jp/97_abe/actions/201607/13article2.html
D.D. Thilmany and C.B. Barrett. 1997. Regulatory Barriers in an Integrating World Food Market. Review of Agricultural Economics. 19 (1). pp. 91–107.
Z. Wang, S.J. Wei, and K. Zhu. 2014. Quantifying International Production Sharing at the Bilateral and Sector Levels. NBER Working Paper. No. 19677. Cambridge: National Bureau of Economic Research.
World Trade Organization. 2012. Trade and public policies: A closer look at non-tariff measures in the 21st century. Geneva.