Embed Size (px)
Citation preview
1
Towards an integrated scenario approach for spatial planning and
natural hazards mitigation José I. Barredo Laura Petrov Valentina Sagris Carlo Lavalle Elisabetta Genovese
2005 EUR 21900 EN

2
3
LEGAL NOTICE
Neither the European Commission nor any person acting on behalf of the Commission is responsible for the use which might be made of the following information.
A great deal of additional information on the European Union is available on the Internet. It can be accessed through the Europa server
(http://europa.eu.int).
© European Communities, 2005 Reproduction is authorised provided the source is acknowledged
Printed in Italy

5
Foreword In the frame of the support to the conception, definition and implementation of European policies, the Land Management Unit of the Institute for Environment and Sustainability (Directorate General Joint Research Centre (DG-JRC) of the European Commission (EC)) is developing an integrated framework to evaluate and propose strategies for the sustainable management of the European territory. An important tool within this framework is the MOLAND (Monitoring Land Use/Cover Dynamics) model for urban and regional growth forecast. The model is part of an integrated methodology based on a set of spatial planning tools that can be used for assessing, monitoring and modelling the development of urban and regional environments. The MOLAND model has been specifically designed for urban and regional development assessment. It is based on a spatial dynamics bottom-up approach. The model takes as input several georeferenced datasets for the future simulation of urban areas and/or regions. Thus, future urban scenarios can be produced by taking into account land use development trends, population growth, socio-economic factors and spatial planning policies. Urban simulations offer a useful approach to understanding the consequences of current spatial planning policies. Among other causes the analysis of urban areas and their development has particular relevance because of their growing exposure to natural hazards, particularly floods and forest fires. Inappropriate regional and urban planning can exacerbate the negative effects of natural hazards. On the other hand, good land management and planning practices, including appropriate land use and development control in flood-prone areas, represent suitable non-structural solutions to minimise flood damage. The effects of urban and regional development on flood risk should be evaluated to support both flood protection and spatial planning policies. This work supports policies such as the 6th Environment Action Program (Thematic Strategy on the Urban Environment; Thematic Strategy on Soil Protection), the forthcoming Floods Directive “Reducing the risks of floods in Europe”, the ESPON (European Spatial Planning Observation Network) programme, and the growing awareness at local level amongst spatial policy-makers of the close connections between world-wide land degradation and global change, as underpinned by the European Climate Change Programme. The new regulations for renewed Structural Funds and instruments for the period 2007-2013, adopted by the EC on 14 July 2004, foresee specific measures for “developing plans and measures to prevent and cope with natural risks”.

6
7
CONTENT
1. INTRODUCTION -----------------------------------------------------------------------------7
2. DYNAMIC SPATIAL MODELS FOR SCENARIO SIMULATION----------------8
2.1 Scenario simulations: potentialities, myths and realities--------------------------------------------------8
2.2 From cellular automata to the MOLAND model--------------------------------------------------------- 12
3. MOLAND MODEL APPLICATIONS -------------------------------------------------- 15
3.1 Spatial planning, urban growth and exposure to floods, the case of Pordenone Province (Friuli-Venezia Giulia Region, Italy) ------------------------------------------------------------------------------------- 15
3.1.1 Spatial dynamics in FVG: a territorial approach ------------------------------------------------------- 16 3.1.2 The dynamic spatial model for urban simulation------------------------------------------------------- 18 3.1.3 Flood risk assessment in Pordenone Province ---------------------------------------------------------- 19
3.2 Assessing regional dynamics in the Dresden-Prague corridor: 2000-2020 -------------------------- 22 3.2.1 The corridor region: main features ----------------------------------------------------------------------- 23 3.2.2 Exposure to natural hazards: The 2002 Floods --------------------------------------------------------- 25 3.2.3 Land use dynamics and scenario simulation ------------------------------------------------------------ 26
3.3 Growing exposure to floods in the Dresden-Prague corridor ------------------------------------------ 29 3.3.1 Exposure to natural hazards: the 2002 floods in central Europe ------------------------------------- 29 3.3.2 Flood exposure assessment in the Dresden-Prague corridor------------------------------------------ 30
3.4 Assessing regional development in Algarve (Portugal)-------------------------------------------------- 33 3.4.1 Modelling land use dynamics in Algarve --------------------------------------------------------------- 35 3.4.2 Modelling land use dynamics in Algarve using CORINE datasets ---------------------------------- 37
3.5 Sea level rise assessment in Pärnu city (Estonia) --------------------------------------------------------- 39 3.5.1 Land use dynamics and scenario simulation ------------------------------------------------------------ 40 3.5.2 Increasing exposure to surge floods---------------------------------------------------------------------- 42
4. FINAL REMARKS ------------------------------------------------------------------------- 45
REFERENCES --------------------------------------------------------------------------------- 47

8
7
1. Introduction Built-up areas are spreading across Europe. This is one of the effects of a mayor socio-economic process registered at continental level. Built-up areas are increasing much faster than the population (EEA, 2004). Moreover in a number of regions the population is even decreasing, however there is a continuous growth of new urban areas. There are several factors producing this trend. Among them the most relevant are: lack (or poor) of sustainable planning practices, rising standards of living that promotes single family housing, attraction of the country side (cleaner, less hurried), and others. On the other hand current built-up trends and urban de-centralisation are producing a number of undesirable consequences, for instance increases in traffic and infrastructure, increases in the use of private car (+GHG emissions), social segregation in urban areas, soil sealing, fragmentation of natural and agricultural areas (which poses a threat to biodiversity), and increasing exposure to natural hazards e.g. floods. In this report we address the topic of urban growth and decentralisation from a scenario approach. Several development scenarios are produced for several study areas across Europe. The results of the scenarios are further analysed on the light of the natural hazards subject. A key tool in this framework is the model for urban and regional growth simulation named MOLAND model (Barredo et al., 2003a). The model is part of an integrated methodology based on a set of spatial planning tools that can be used for assessing, monitoring and modelling the development of urban and regional environments. Based on alternative spatial planning and policy scenarios, the model then predicts the likely future development of land use. In order to compare the alternative predicted land use maps produced by the model various indicators are computed and analysed. Predicted land use maps can therefore be used for natural hazards minimization and to identify structural and non-structural measures to be implemented in the frame of spatial planning policies.
8
2. Dynamic spatial models for scenario simulation Scenario-based studies have been used since the middle of the 20th century to help decision makers cope with alternative courses of action and elements of uncertainty (Shearer, 2005). Today this approach has several aims: • To promote discussion and awareness between stakeholders:
public local and regional authorities urban planners green organisations NGO etc
• To support decision making • To propose good practices In addition to the scenario approach, tools that embrace the complexity of social or natural systems are necessary in order to produce different assumptions about the future. Thus, it is necessary to link scenarios and simulation tools in order to have an integrated approach for spatial planning. In this section these both elements: scenarios and simulation tools are discussed. The aim of this section is to give an overview of the proposed integrated approach for urban and regional scenario simulation.
2.1 Scenario simulations: potentialities, myths and realities Laura Petrov Generally, the alternative views of the future situation are called scenarios. Dictionaries define the word ‘scenario’ as a summary of the events of a play, film, or novel, which allows a representation of the dynamics, moves us through different situations. In the 1950s Herman Kahn appropriated the term for long-range visions of the future (Kleiner, 1996) recasting the ‘scenario’ as a hypothetical sequence of events constructed for the purpose of focusing attention on causal processing and decision points (Kahn et al., 1967). In the literature on the use of scenario, the terms scenario and alternative future are sometimes used interchangeably. However, there is a considerable methodological benefit in differentiating the expressions: an alternative future being defined as a possible end state; and a scenario being defined as a means to achieve that state (Shearer, 2005). As noted by Shearer, the scenarios share four principles:
- Scenarios are fictional - Scenarios describe situations, actions, and consequences - Scenarios are predictive judgements describing what could happened - Scenarios organize information within explicitly defined frameworks.
What are scenarios? Several answers can be given:
9
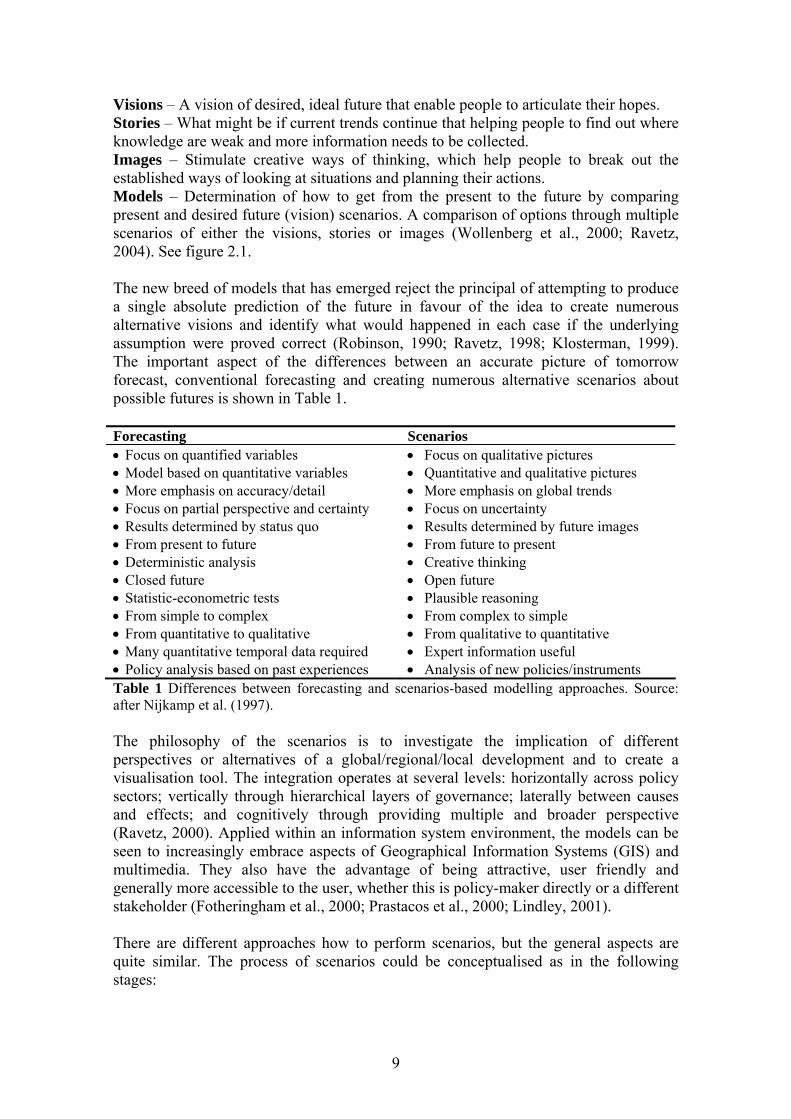
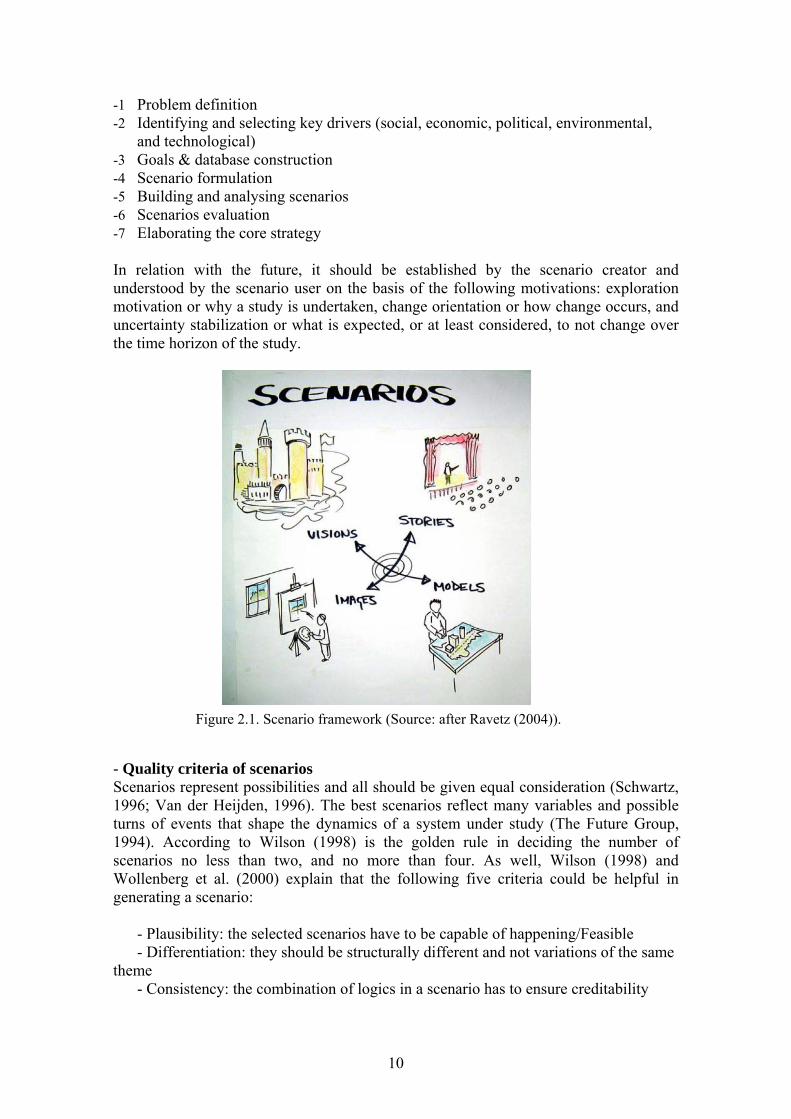
Visions – A vision of desired, ideal future that enable people to articulate their hopes. Stories – What might be if current trends continue that helping people to find out where knowledge are weak and more information needs to be collected. Images – Stimulate creative ways of thinking, which help people to break out the established ways of looking at situations and planning their actions. Models – Determination of how to get from the present to the future by comparing present and desired future (vision) scenarios. A comparison of options through multiple scenarios of either the visions, stories or images (Wollenberg et al., 2000; Ravetz, 2004). See figure 2.1. The new breed of models that has emerged reject the principal of attempting to produce a single absolute prediction of the future in favour of the idea to create numerous alternative visions and identify what would happened in each case if the underlying assumption were proved correct (Robinson, 1990; Ravetz, 1998; Klosterman, 1999). The important aspect of the differences between an accurate picture of tomorrow forecast, conventional forecasting and creating numerous alternative scenarios about possible futures is shown in Table 1. Forecasting Scenarios • Focus on quantified variables • Model based on quantitative variables • More emphasis on accuracy/detail • Focus on partial perspective and certainty • Results determined by status quo • From present to future • Deterministic analysis • Closed future • Statistic-econometric tests • From simple to complex • From quantitative to qualitative • Many quantitative temporal data required • Policy analysis based on past experiences
• Focus on qualitative pictures • Quantitative and qualitative pictures • More emphasis on global trends • Focus on uncertainty • Results determined by future images • From future to present • Creative thinking • Open future • Plausible reasoning • From complex to simple • From qualitative to quantitative • Expert information useful • Analysis of new policies/instruments
Table 1 Differences between forecasting and scenarios-based modelling approaches. Source: after Nijkamp et al. (1997). The philosophy of the scenarios is to investigate the implication of different perspectives or alternatives of a global/regional/local development and to create a visualisation tool. The integration operates at several levels: horizontally across policy sectors; vertically through hierarchical layers of governance; laterally between causes and effects; and cognitively through providing multiple and broader perspective (Ravetz, 2000). Applied within an information system environment, the models can be seen to increasingly embrace aspects of Geographical Information Systems (GIS) and multimedia. They also have the advantage of being attractive, user friendly and generally more accessible to the user, whether this is policy-maker directly or a different stakeholder (Fotheringham et al., 2000; Prastacos et al., 2000; Lindley, 2001). There are different approaches how to perform scenarios, but the general aspects are quite similar. The process of scenarios could be conceptualised as in the following stages:
10
-1 Problem definition -2 Identifying and selecting key drivers (social, economic, political, environmental,
and technological) -3 Goals & database construction -4 Scenario formulation -5 Building and analysing scenarios -6 Scenarios evaluation -7 Elaborating the core strategy In relation with the future, it should be established by the scenario creator and understood by the scenario user on the basis of the following motivations: exploration motivation or why a study is undertaken, change orientation or how change occurs, and uncertainty stabilization or what is expected, or at least considered, to not change over the time horizon of the study.
- Quality criteria of scenarios Scenarios represent possibilities and all should be given equal consideration (Schwartz, 1996; Van der Heijden, 1996). The best scenarios reflect many variables and possible turns of events that shape the dynamics of a system under study (The Future Group, 1994). According to Wilson (1998) is the golden rule in deciding the number of scenarios no less than two, and no more than four. As well, Wilson (1998) and Wollenberg et al. (2000) explain that the following five criteria could be helpful in generating a scenario:
- Plausibility: the selected scenarios have to be capable of happening/Feasible - Differentiation: they should be structurally different and not variations of the same
theme - Consistency: the combination of logics in a scenario has to ensure creditability
Figure 2.1. Scenario framework (Source: after Ravetz (2004)).
11
- Decision-Making Utility: each scenario should contribute specific into the future that help make the decision identified in step one
- Challenge: the scenarios should challenge the organization’s conventional wisdom about the future. - Advantages of the Scenario Approach A scenario is an extensive and detailed portrait of a possible future world that introduces a variety of new ideas and lead to a gradual understanding of what the new situation means. The advantages of scenarios is also that they do not describe just one future, but that several possible or even desirable futures are placed side by side in order to learn to deal with what might happen. Slaughter (1995) and Mietzer et al. (2004) show that scenarios can: • Raising issues of common concern that may be overlooked in the conventional
short-term view • Highlighting dangers, alternatives and choices that need to be considered before
they become urgent • Publicising emerging picture of medium-term future for involving the public in
decision-making process • Identifying the dynamics and policy implications of the transition to a sustainable
world and placing them on the political agenda • Facilitating the development of social innovations • Helping people to become genuinely empowered to participate in creating the future • Helping organizations to evolve in response to the changing global and local
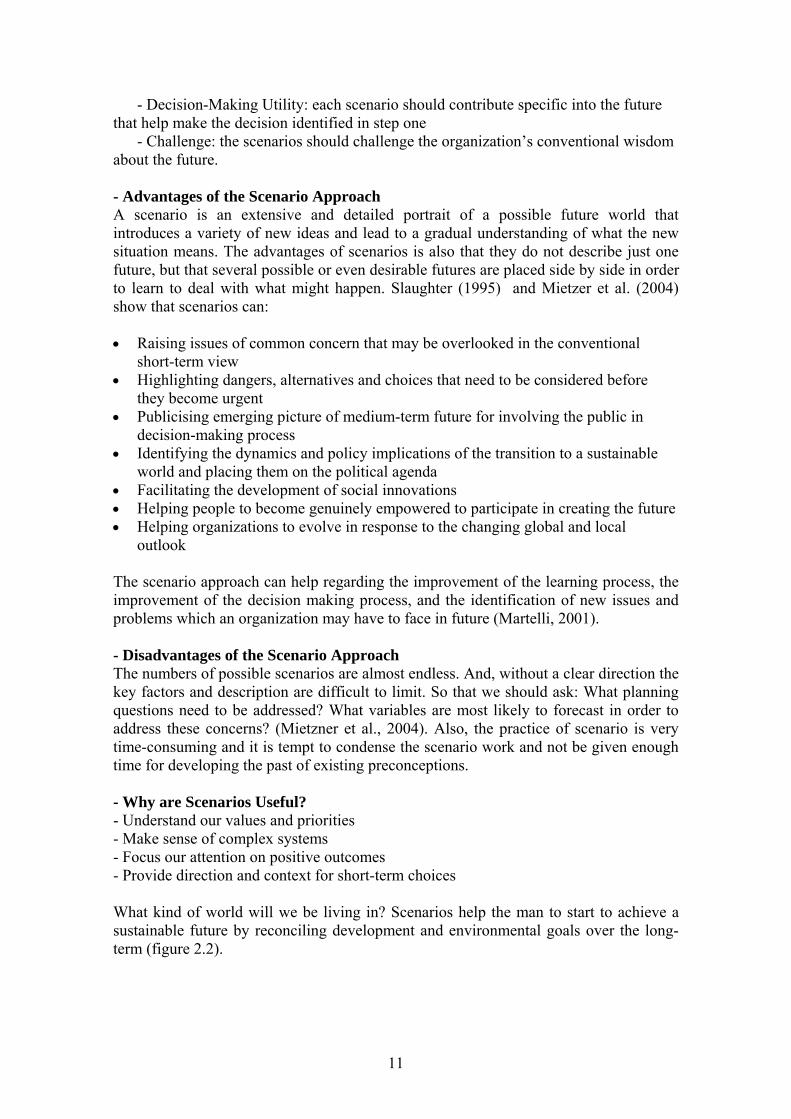
outlook The scenario approach can help regarding the improvement of the learning process, the improvement of the decision making process, and the identification of new issues and problems which an organization may have to face in future (Martelli, 2001). - Disadvantages of the Scenario Approach The numbers of possible scenarios are almost endless. And, without a clear direction the key factors and description are difficult to limit. So that we should ask: What planning questions need to be addressed? What variables are most likely to forecast in order to address these concerns? (Mietzner et al., 2004). Also, the practice of scenario is very time-consuming and it is tempt to condense the scenario work and not be given enough time for developing the past of existing preconceptions. - Why are Scenarios Useful? - Understand our values and priorities - Make sense of complex systems - Focus our attention on positive outcomes - Provide direction and context for short-term choices What kind of world will we be living in? Scenarios help the man to start to achieve a sustainable future by reconciling development and environmental goals over the long-term (figure 2.2).
12
2.2 From cellular automata to the MOLAND model José I. Barredo The theoretical formalism of cellular automata (CA) was introduced in the late 1940’s by the mathematicians John Von Neumann and Stanislaw Ulam. However, it was in the late 1960’s when John Conway developed the first CA, its name is Game of Life. However CA are far to be a game. CA are a joint product of the science of complexity and the computational revolution (Couclelis, 1986). CA can be defined as discrete dynamical systems, and are often described as the spatial counterpart of non-linear
Figure 2.2. Approaching sustainability. Sustainability involves ensuring the quality of life requiring a long term perspective, however it can be seen from different angles: • Financial sustainability has been synonymous with “self-sufficiency”; in the nearer term, it is the ability
to mobilize and efficiently use domestic and supplementary external resources on a reliable basis to achieve target levels of immunization performance in terms of access, utilization, quality, safety and equity.
• Political sustainability supposes the good governance and great community participation; strong network and collaboration; must work at the strengthening of family values.
• Institutional sustainability is to build a competent leadership and staff and developing their technical competencies; and being flexible and adaptable for changing of internal and external conditions.
• A technology is assumed to be sustainable if the initial investment is paid and the operating costs are covered from one or more of these sources; innovation and developments in technology are the key factors for achieving more sustainable economy and way of living.
• Civic sustainability is found in these so-called undeveloped places like social and environmental crises that face a community and it should be linked to what is believed being their root causes. It is important to understand how communities develop and implement their sustainability projects. A sustainable community is educated, prosperous and involved in supporting the dignity of families and individuals.
• Sustainable communities formulate goals that are rooted in a respect for both the natural environment and human nature and that call for the use of technology in an appropriate way. Consumer sustainability converts the linear flow of the material into a circular one.
• Personal/individual sustainability is providing for the individual a well-being by improving in economic and social conditions and environmental quality (Source: after Ravetz (2004)).
13
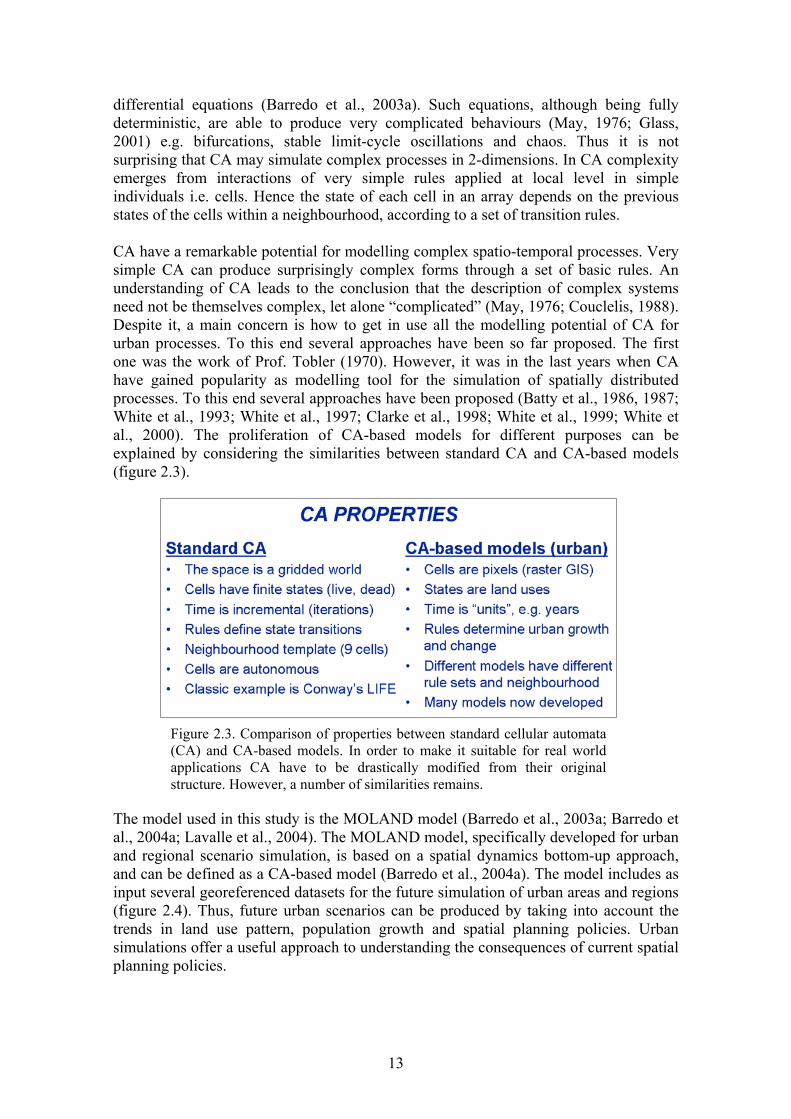
differential equations (Barredo et al., 2003a). Such equations, although being fully deterministic, are able to produce very complicated behaviours (May, 1976; Glass, 2001) e.g. bifurcations, stable limit-cycle oscillations and chaos. Thus it is not surprising that CA may simulate complex processes in 2-dimensions. In CA complexity emerges from interactions of very simple rules applied at local level in simple individuals i.e. cells. Hence the state of each cell in an array depends on the previous states of the cells within a neighbourhood, according to a set of transition rules. CA have a remarkable potential for modelling complex spatio-temporal processes. Very simple CA can produce surprisingly complex forms through a set of basic rules. An understanding of CA leads to the conclusion that the description of complex systems need not be themselves complex, let alone “complicated” (May, 1976; Couclelis, 1988). Despite it, a main concern is how to get in use all the modelling potential of CA for urban processes. To this end several approaches have been so far proposed. The first one was the work of Prof. Tobler (1970). However, it was in the last years when CA have gained popularity as modelling tool for the simulation of spatially distributed processes. To this end several approaches have been proposed (Batty et al., 1986, 1987; White et al., 1993; White et al., 1997; Clarke et al., 1998; White et al., 1999; White et al., 2000). The proliferation of CA-based models for different purposes can be explained by considering the similarities between standard CA and CA-based models (figure 2.3).
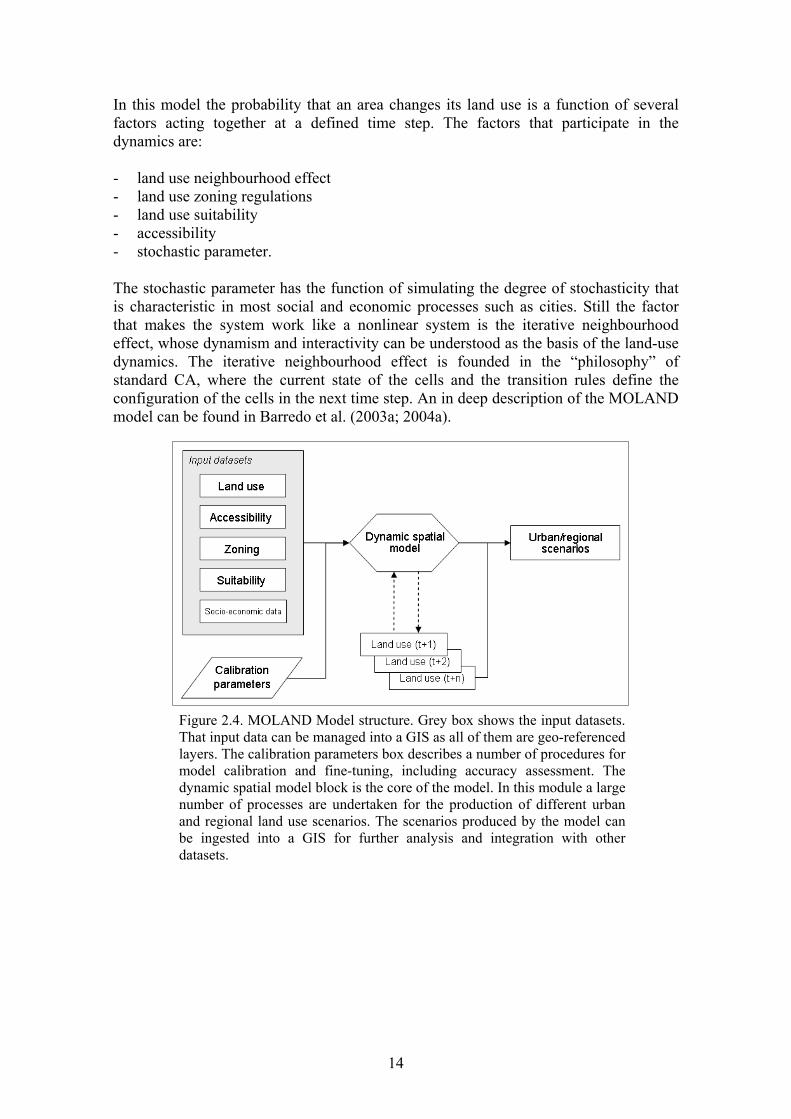
The model used in this study is the MOLAND model (Barredo et al., 2003a; Barredo et al., 2004a; Lavalle et al., 2004). The MOLAND model, specifically developed for urban and regional scenario simulation, is based on a spatial dynamics bottom-up approach, and can be defined as a CA-based model (Barredo et al., 2004a). The model includes as input several georeferenced datasets for the future simulation of urban areas and regions (figure 2.4). Thus, future urban scenarios can be produced by taking into account the trends in land use pattern, population growth and spatial planning policies. Urban simulations offer a useful approach to understanding the consequences of current spatial planning policies.
Figure 2.3. Comparison of properties between standard cellular automata (CA) and CA-based models. In order to make it suitable for real world applications CA have to be drastically modified from their original structure. However, a number of similarities remains.
14
In this model the probability that an area changes its land use is a function of several factors acting together at a defined time step. The factors that participate in the dynamics are: - land use neighbourhood effect - land use zoning regulations - land use suitability - accessibility - stochastic parameter. The stochastic parameter has the function of simulating the degree of stochasticity that is characteristic in most social and economic processes such as cities. Still the factor that makes the system work like a nonlinear system is the iterative neighbourhood effect, whose dynamism and interactivity can be understood as the basis of the land-use dynamics. The iterative neighbourhood effect is founded in the “philosophy” of standard CA, where the current state of the cells and the transition rules define the configuration of the cells in the next time step. An in deep description of the MOLAND model can be found in Barredo et al. (2003a; 2004a).
Figure 2.4. MOLAND Model structure. Grey box shows the input datasets. That input data can be managed into a GIS as all of them are geo-referenced layers. The calibration parameters box describes a number of procedures for model calibration and fine-tuning, including accuracy assessment. The dynamic spatial model block is the core of the model. In this module a large number of processes are undertaken for the production of different urban and regional land use scenarios. The scenarios produced by the model can be ingested into a GIS for further analysis and integration with other datasets.
15
3. MOLAND Model applications In this section we analyse urban and regional growth trends by using dynamic spatial models, i.e. the MOLAND Model. The objective of this approach is twofold: on the one hand to monitor sustainable development trends and on the other to assess the effect of natural hazards (e.g. flood and forest fires) in urban areas and regions. We propose the use of future urban scenarios in order to forecast the effects of urban and regional planning policies. In the last 20 years the extent of built-up areas in Europe has increased by 20%, exceeding clearly the 6% rate of population growth over the same period (EEA, 2002). The situation is still more worrying seeing that in some European regions the population has even decreased in the last 20 years, whilst the built-up areas continue to grow mainly in suburban and exurban areas. In some areas this trend contributes to unsustainable development patterns, and what is more, the exposure to natural hazards is increasing in large regions of Europe.
3.1 Spatial planning, urban growth and exposure to floods, the case of Pordenone Province (Friuli-Venezia Giulia Region, Italy) José I. Barredo This sub-section is organised in two parts. In the first part we analyse a study case in Friuli-Venezia Giulia (FVG) Region in northern Italy. We analyse several spatial indicators in the form of maps describing population growth, spatial patterns, and the historical growth of built-up areas. Then we show the results of a dynamic spatial model for simulating land use scenarios. The model used is the MOLAND Model. Future urban scenarios are produced by taking into account several factors –e.g. land use development, population growth or spatial planning policies–. Urban simulations offer a useful approach to understanding the consequences of current spatial planning policies. Inappropriate regional and urban planning can exacerbate the negative effects of extreme hydrological processes. Good land management and planning practices, including appropriate land use and development control in flood-prone areas, represent suitable non-structural solutions to minimise flood damages (Barredo et al., 2004b). The overall effects of these measures in terms of both sustainable development and flood defence can be quantified with the proposed modelling approach. In the second part we show some preliminary results of a pilot study case. Two future simulations produced by the model were used for a flood risk assessment in Pordenone (one of the four provinces of FVG). In the last 100 years Pordenone has suffered several floods. In that period the two major events were the heavy floods of 1966 and 2002. The disastrous consequences of those heavy floods have shown how vulnerable this area is. Early results of this study show that the main driving force of natural disasters damage is not only increasing flood hazard due to climate change, but increasing vulnerability, mainly due to urbanisation in flood prone areas.
16
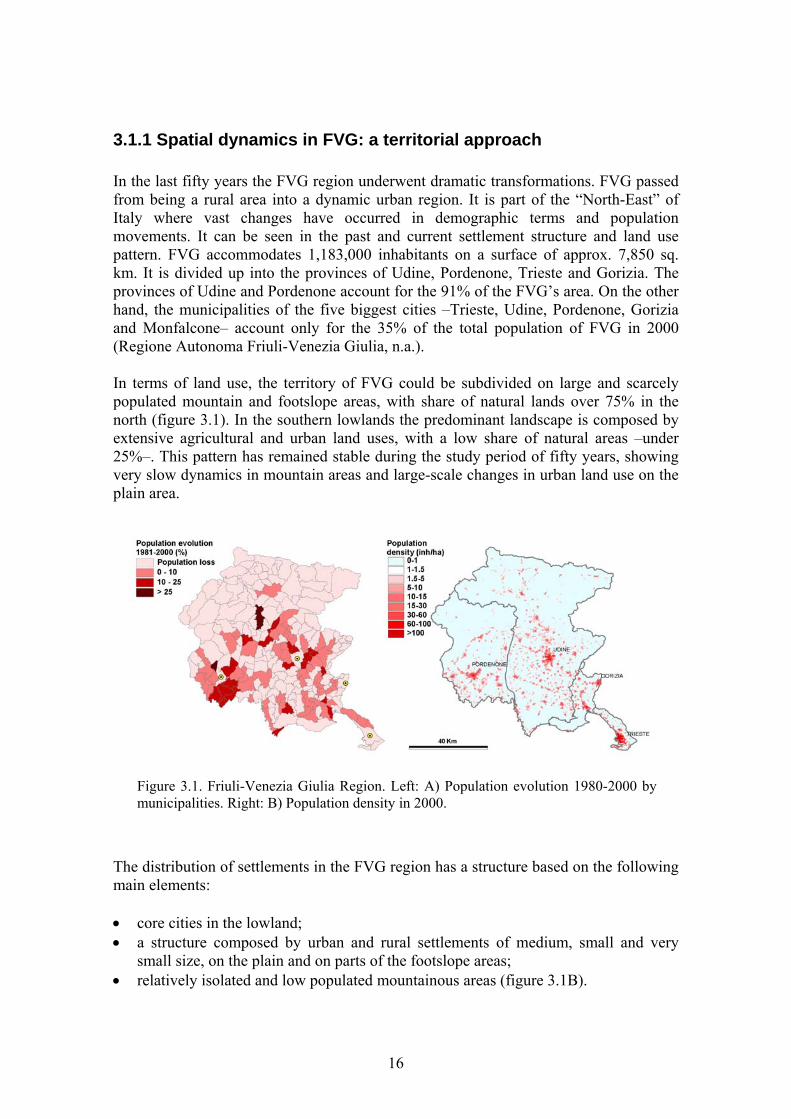
3.1.1 Spatial dynamics in FVG: a territorial approach In the last fifty years the FVG region underwent dramatic transformations. FVG passed from being a rural area into a dynamic urban region. It is part of the “North-East” of Italy where vast changes have occurred in demographic terms and population movements. It can be seen in the past and current settlement structure and land use pattern. FVG accommodates 1,183,000 inhabitants on a surface of approx. 7,850 sq. km. It is divided up into the provinces of Udine, Pordenone, Trieste and Gorizia. The provinces of Udine and Pordenone account for the 91% of the FVG’s area. On the other hand, the municipalities of the five biggest cities –Trieste, Udine, Pordenone, Gorizia and Monfalcone– account only for the 35% of the total population of FVG in 2000 (Regione Autonoma Friuli-Venezia Giulia, n.a.). In terms of land use, the territory of FVG could be subdivided on large and scarcely populated mountain and footslope areas, with share of natural lands over 75% in the north (figure 3.1). In the southern lowlands the predominant landscape is composed by extensive agricultural and urban land uses, with a low share of natural areas –under 25%–. This pattern has remained stable during the study period of fifty years, showing very slow dynamics in mountain areas and large-scale changes in urban land use on the plain area.
The distribution of settlements in the FVG region has a structure based on the following main elements: • core cities in the lowland; • a structure composed by urban and rural settlements of medium, small and very
small size, on the plain and on parts of the footslope areas; • relatively isolated and low populated mountainous areas (figure 3.1B).
Figure 3.1. Friuli-Venezia Giulia Region. Left: A) Population evolution 1980-2000 by municipalities. Right: B) Population density in 2000.
17
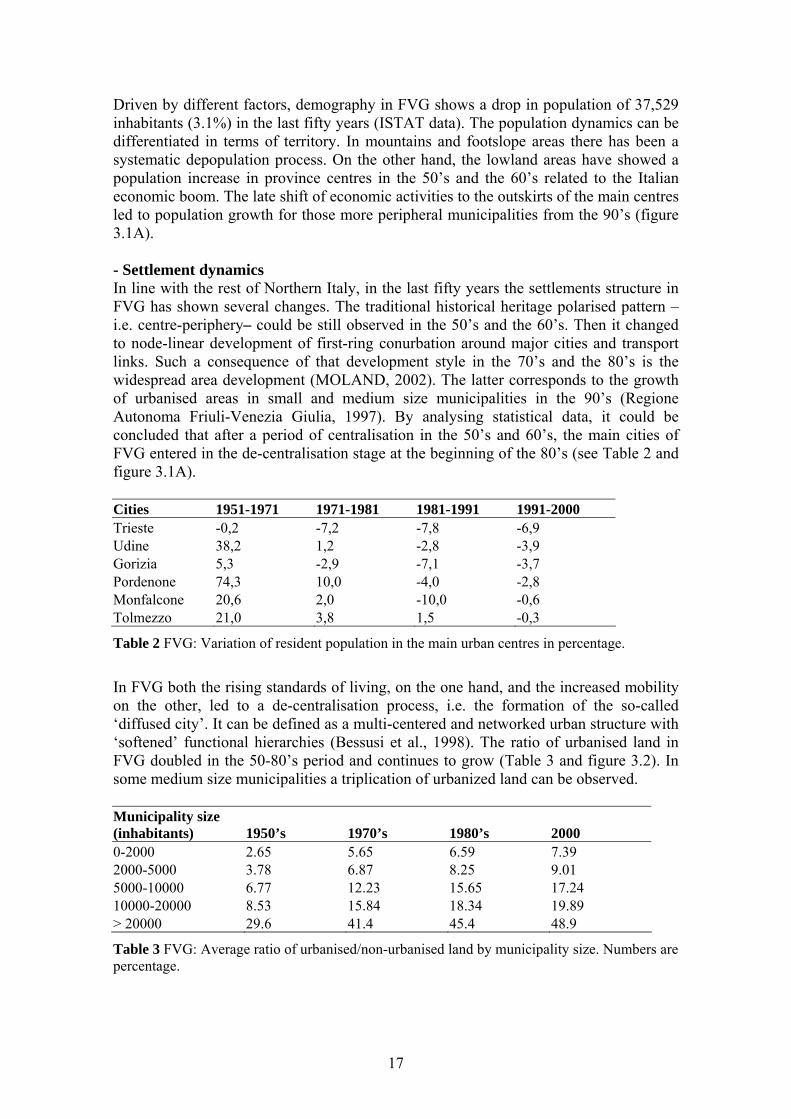
Driven by different factors, demography in FVG shows a drop in population of 37,529 inhabitants (3.1%) in the last fifty years (ISTAT data). The population dynamics can be differentiated in terms of territory. In mountains and footslope areas there has been a systematic depopulation process. On the other hand, the lowland areas have showed a population increase in province centres in the 50’s and the 60’s related to the Italian economic boom. The late shift of economic activities to the outskirts of the main centres led to population growth for those more peripheral municipalities from the 90’s (figure 3.1A). - Settlement dynamics In line with the rest of Northern Italy, in the last fifty years the settlements structure in FVG has shown several changes. The traditional historical heritage polarised pattern –i.e. centre-periphery– could be still observed in the 50’s and the 60’s. Then it changed to node-linear development of first-ring conurbation around major cities and transport links. Such a consequence of that development style in the 70’s and the 80’s is the widespread area development (MOLAND, 2002). The latter corresponds to the growth of urbanised areas in small and medium size municipalities in the 90’s (Regione Autonoma Friuli-Venezia Giulia, 1997). By analysing statistical data, it could be concluded that after a period of centralisation in the 50’s and 60’s, the main cities of FVG entered in the de-centralisation stage at the beginning of the 80’s (see Table 2 and figure 3.1A). Cities 1951-1971 1971-1981 1981-1991 1991-2000 Trieste -0,2 -7,2 -7,8 -6,9 Udine 38,2 1,2 -2,8 -3,9 Gorizia 5,3 -2,9 -7,1 -3,7 Pordenone 74,3 10,0 -4,0 -2,8 Monfalcone 20,6 2,0 -10,0 -0,6 Tolmezzo 21,0 3,8 1,5 -0,3
Table 2 FVG: Variation of resident population in the main urban centres in percentage.
In FVG both the rising standards of living, on the one hand, and the increased mobility on the other, led to a de-centralisation process, i.e. the formation of the so-called ‘diffused city’. It can be defined as a multi-centered and networked urban structure with ‘softened’ functional hierarchies (Bessusi et al., 1998). The ratio of urbanised land in FVG doubled in the 50-80’s period and continues to grow (Table 3 and figure 3.2). In some medium size municipalities a triplication of urbanized land can be observed. Municipality size (inhabitants) 1950’s 1970’s 1980’s 2000 0-2000 2.65 5.65 6.59 7.39 2000-5000 3.78 6.87 8.25 9.01 5000-10000 6.77 12.23 15.65 17.24 10000-20000 8.53 15.84 18.34 19.89 > 20000 29.6 41.4 45.4 48.9
Table 3 FVG: Average ratio of urbanised/non-urbanised land by municipality size. Numbers are percentage.
18
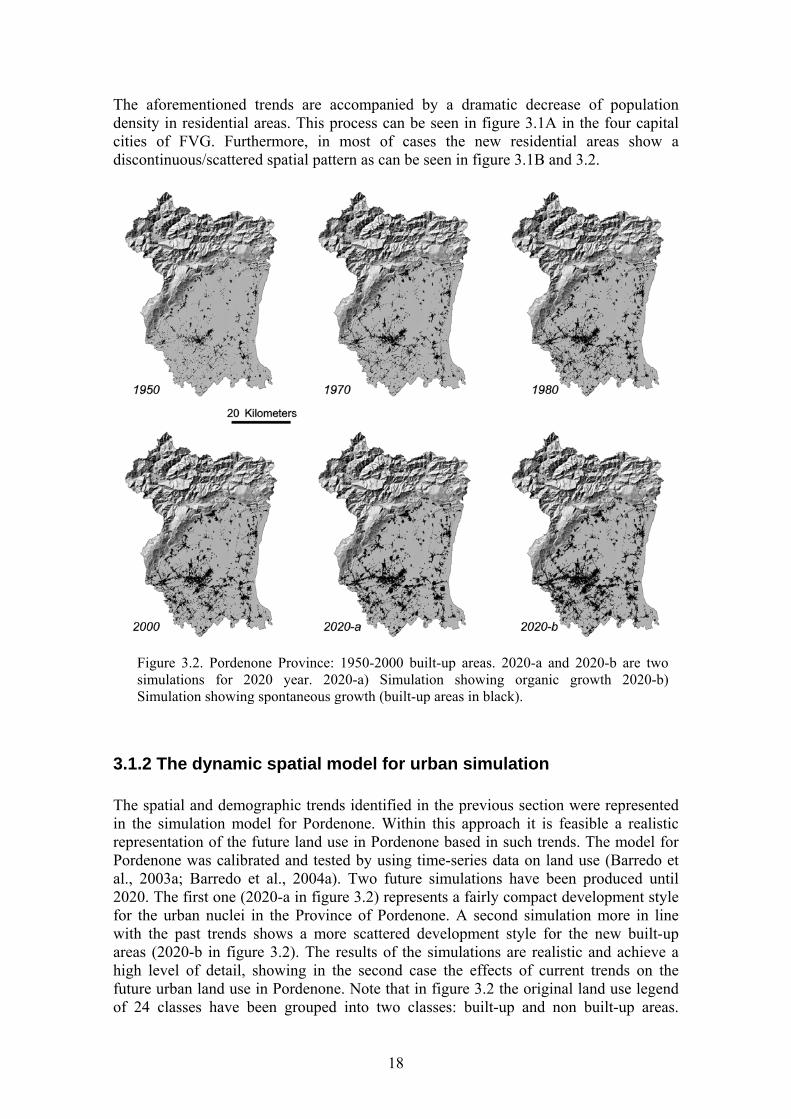
The aforementioned trends are accompanied by a dramatic decrease of population density in residential areas. This process can be seen in figure 3.1A in the four capital cities of FVG. Furthermore, in most of cases the new residential areas show a discontinuous/scattered spatial pattern as can be seen in figure 3.1B and 3.2.
3.1.2 The dynamic spatial model for urban simulation The spatial and demographic trends identified in the previous section were represented in the simulation model for Pordenone. Within this approach it is feasible a realistic representation of the future land use in Pordenone based in such trends. The model for Pordenone was calibrated and tested by using time-series data on land use (Barredo et al., 2003a; Barredo et al., 2004a). Two future simulations have been produced until 2020. The first one (2020-a in figure 3.2) represents a fairly compact development style for the urban nuclei in the Province of Pordenone. A second simulation more in line with the past trends shows a more scattered development style for the new built-up areas (2020-b in figure 3.2). The results of the simulations are realistic and achieve a high level of detail, showing in the second case the effects of current trends on the future urban land use in Pordenone. Note that in figure 3.2 the original land use legend of 24 classes have been grouped into two classes: built-up and non built-up areas.
Figure 3.2. Pordenone Province: 1950-2000 built-up areas. 2020-a and 2020-b are two simulations for 2020 year. 2020-a) Simulation showing organic growth 2020-b) Simulation showing spontaneous growth (built-up areas in black).
19
Nevertheless, it is noticeable the capability of the model for simulating several types of urban land-use classes simultaneously. - Future urban scenarios in Pordenone Province The two future scenario simulations produced for Pordenone cover a twenty-year period between 2000 and 2020, and were undertaken using the calibrated model. Built-up areas in Pordenone are expected to grow showing a similar pattern as in the last decades. During the past four decades it has grown continuously in a rather sparse way (see figure 3.2, from 1950 to 2000). Yet, as expected, the initial land-use configuration drives to a great extent the actual urban form. The future land-use growth trends can be obviously altered by a number of factors such as changes in the economic climate or in the land use planning policies. By using CA-based models it is possible to simulate different urban growth styles: Spontaneous, Diffusive, Organic, and Road-influenced (Clarke et al., 1997), or a combination of them, which is likely what happens in real situations. The simulation 2020-a in figure 3.2 is an example of organic urban growth influenced by roads. It means that the new built-up areas spread outwards from existing built-up areas. Bigger is the existing built-up area, bigger will be the influence in the organic growth. The second simulation, 2020-b in figure 3.2, is an example of spontaneous growth influenced by roads. In this case new built-up areas not necessarily lie adjacent to existing urbanised cells, however new urbanised cells fall close enough to existing urbanised cells. In both cases the influence of roads is taken into account for the growth of new built-up areas. From a visual point of view, the simulated maps maintain the general form of the existing built-up areas due to the initial conditions of transport network and land-use. The foreseen urban pattern appears to be realistic in both simulations. However, by taking into account the past trends showed in figure 3.1 and commented above, the more realistic simulation is that of figure 3.2 2020-b –i.e. spontaneous growth–. Despite it, in both simulations the form of the urban clusters has clearly developed and shows increased built-up nuclei in peripheral areas.
3.1.3 Flood risk assessment in Pordenone Province Historical land use datasets and two future simulations were used for the risk assessment. Pordenone is a highly flood-prone area. Two heavy floods hit Pordenone in the last years, the floods of 2002 with 580 mm of rain in 36 hours, and the still worse flood of 1966, which can be described as the 100-year flood event. The flood risk assessment is based on a flood hazard map for the Livenza River catchment area. The map has been produced by the regional Water Authority (Autorità di Bacino dei fiumi dell'Alto Adriatico, 2003). This is a hydrological hazard map for the Livenza river catchment area. The map covers most of the flood prone areas of the Province. Four river flood hazard areas have been defined in that map from very high hazard to moderate hazard (Autorità di Bacino dei fiumi dell'Alto Adriatico, 2003; Brezger, 2004). The hazard areas have been mapped by using a two-steps approach. In the first phase all the areas prone to be flooded by a 100-year flood event were mapped (100-years rain event of 24-hours duration). In the second phase, the areas have been verified by using a bi-dimensional flood model and historical flood records. In the
20
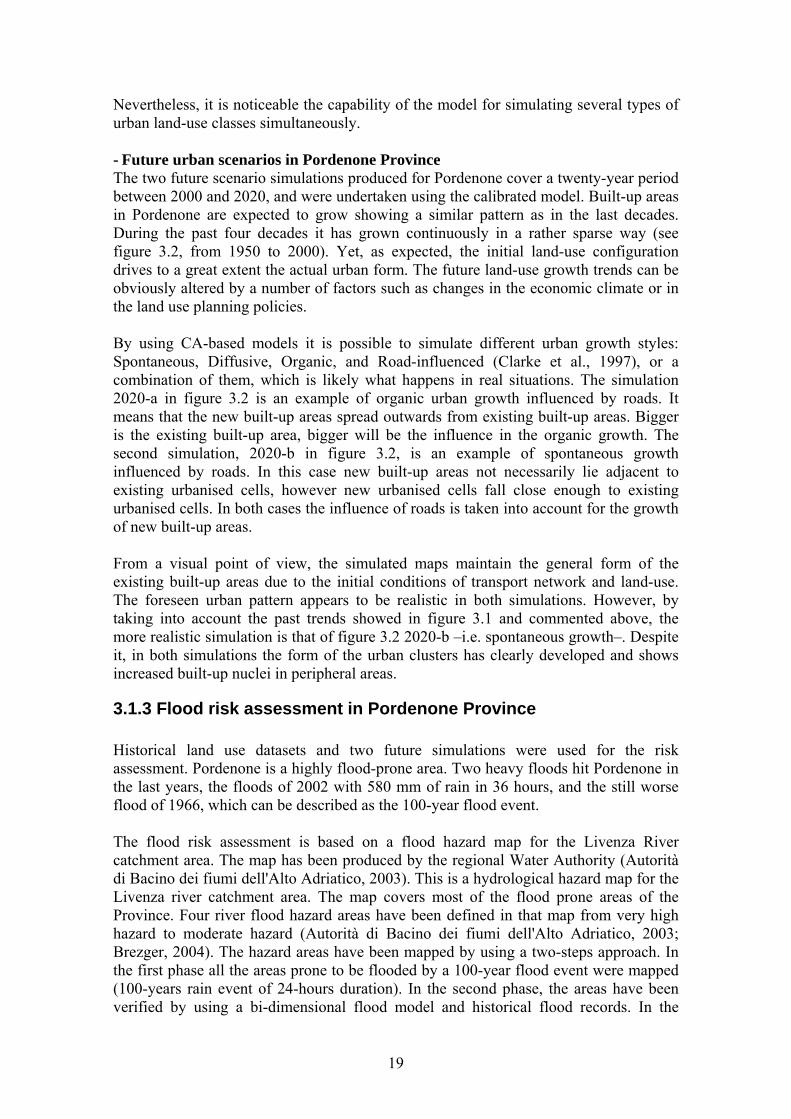
mapped hazard areas the height of the flood may reach not less than 1 meter in the case of a 100-years event. Next we show briefly the characteristics of the four flood hazard areas defined in the map (figure 3.3A): • F: Is the riverbed plus the immediately adjacent floodplain areas inside the dykes.
This area is subject to frequently flooding; • Very high hazard (P3): Areas close to the dykes, historically flooded by dikes
failure; • High hazard (P2): Areas along dykes and surrounding P3 areas. Critical areas in the
case of a 100-years event; • Moderate hazard (P1): Areas flooded by past events and other flood prone areas.
Figure 3.3. Pordenone Province. A) Flood hazard areas: F (rived bed), P1 (moderate hazard), P2 (high hazard) and P3 (very high hazard)). B) Built-up areas in 2000 (in black) and overall flood hazard areas. C) Population density (inh/ha) in 2000 and overall flood hazard areas. D) Simulated built-up areas in 2020 (in black) and overall flood hazard areas.
21
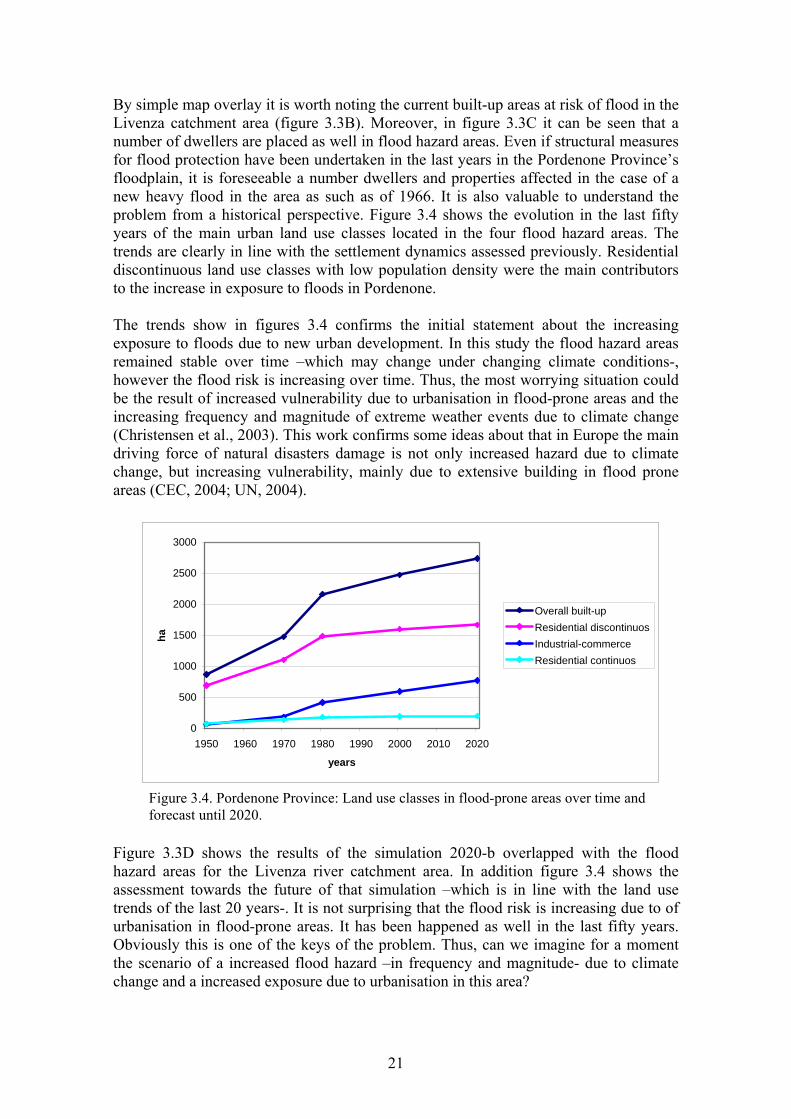
By simple map overlay it is worth noting the current built-up areas at risk of flood in the Livenza catchment area (figure 3.3B). Moreover, in figure 3.3C it can be seen that a number of dwellers are placed as well in flood hazard areas. Even if structural measures for flood protection have been undertaken in the last years in the Pordenone Province’s floodplain, it is foreseeable a number dwellers and properties affected in the case of a new heavy flood in the area as such as of 1966. It is also valuable to understand the problem from a historical perspective. Figure 3.4 shows the evolution in the last fifty years of the main urban land use classes located in the four flood hazard areas. The trends are clearly in line with the settlement dynamics assessed previously. Residential discontinuous land use classes with low population density were the main contributors to the increase in exposure to floods in Pordenone. The trends show in figures 3.4 confirms the initial statement about the increasing exposure to floods due to new urban development. In this study the flood hazard areas remained stable over time –which may change under changing climate conditions-, however the flood risk is increasing over time. Thus, the most worrying situation could be the result of increased vulnerability due to urbanisation in flood-prone areas and the increasing frequency and magnitude of extreme weather events due to climate change (Christensen et al., 2003). This work confirms some ideas about that in Europe the main driving force of natural disasters damage is not only increased hazard due to climate change, but increasing vulnerability, mainly due to extensive building in flood prone areas (CEC, 2004; UN, 2004).
Figure 3.3D shows the results of the simulation 2020-b overlapped with the flood hazard areas for the Livenza river catchment area. In addition figure 3.4 shows the assessment towards the future of that simulation –which is in line with the land use trends of the last 20 years-. It is not surprising that the flood risk is increasing due to of urbanisation in flood-prone areas. It has been happened as well in the last fifty years. Obviously this is one of the keys of the problem. Thus, can we imagine for a moment the scenario of a increased flood hazard –in frequency and magnitude- due to climate change and a increased exposure due to urbanisation in this area?
0
500
1000
1500
2000
2500
3000
1950 1960 1970 1980 1990 2000 2010 2020
years
ha
Overall built-upResidential discontinuosIndustrial-commerceResidential continuos
Figure 3.4. Pordenone Province: Land use classes in flood-prone areas over time and forecast until 2020.
22
The interplay and coordination of measures –technical and spatial- and instruments is the best and likely only way to address the new flood threats poses by climate change. Moreover, it is necessary to have a holistic catchment planning approach for adaptation to floods. Reducing of flood losses must be considered using the basin as the basic planning unit (UN, 2004).
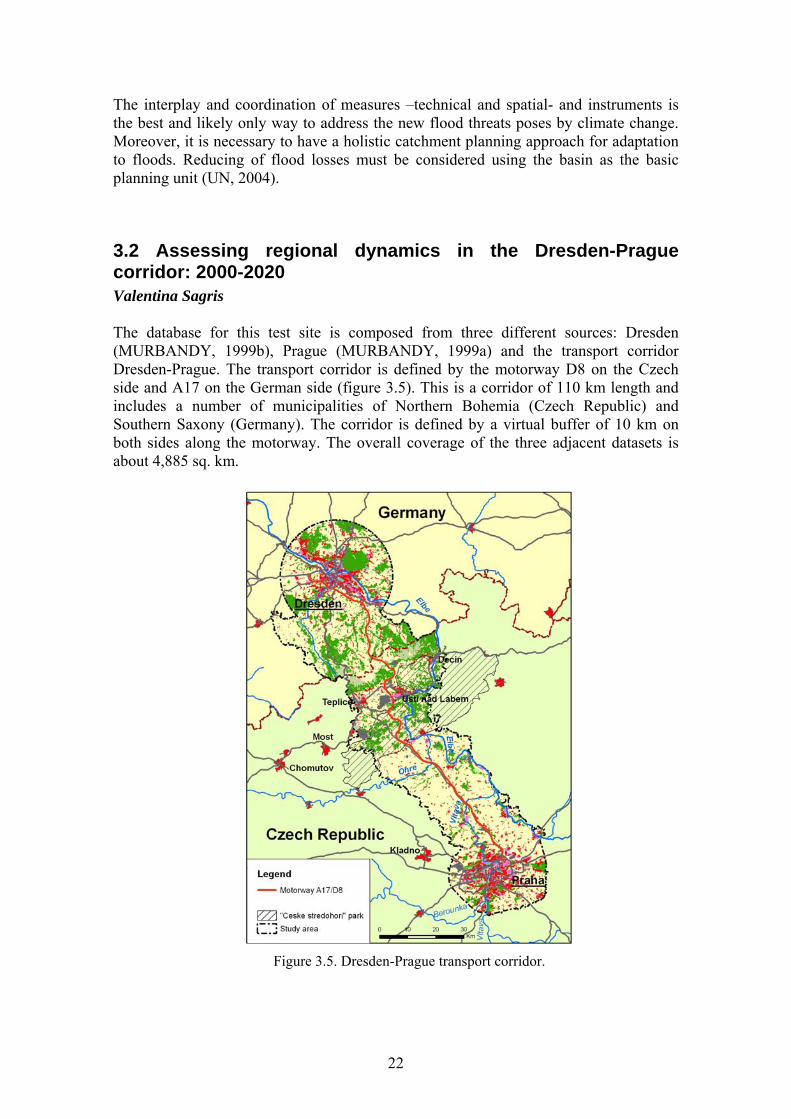
3.2 Assessing regional dynamics in the Dresden-Prague corridor: 2000-2020 Valentina Sagris The database for this test site is composed from three different sources: Dresden (MURBANDY, 1999b), Prague (MURBANDY, 1999a) and the transport corridor Dresden-Prague. The transport corridor is defined by the motorway D8 on the Czech side and A17 on the German side (figure 3.5). This is a corridor of 110 km length and includes a number of municipalities of Northern Bohemia (Czech Republic) and Southern Saxony (Germany). The corridor is defined by a virtual buffer of 10 km on both sides along the motorway. The overall coverage of the three adjacent datasets is about 4,885 sq. km.
Figure 3.5. Dresden-Prague transport corridor.
23
The three databases were produced by applying the MOLAND methodology (Barredo et al., 2003b) by using similar land use/land cover legends. Each database contains land use/land cover and transport network layers corresponding to following dates: Reference data Historical data Dresden 1998 1986 Prague 1998 1989 Dresden-Prague Transport Corridor 2000 1986 Due to fact that the differences between the dates are not so relevant it allows to us to merge the datasets from the three sources and to introduce it into a simulation model with time span of 12 years for calibration. The prediction of land use/cover evolution for 20 years has been done using the trends of the period 1990-2000.
3.2.1 The corridor region: main features The both cities and the corridor experienced similar and very turbulent historical and political development during 20th century. Besides of their historical value both were advanced industrial cities before the II World War. After the II World War communist regimes were established and Free State of Saxony became a part of GDR. The policies during the communist with their planned economy had clearly reflected in the patterns of land use /land cover development, e.g. the absence of large suburbs and undeveloped transport networks around cities. In contrast to other European capitals, no commercial zones and commercial centres were built on suburbs. In addition, satellite cities were built only on a limited scale. But despite of the economical situation after the II World War the main growth of the cities in terms of territory was recorded in the 50s and 60s (Kasanko et al., in press), which have slowed down considerably towards the 90s. Political changes that followed after the fall of the Berlin Wall trigged dramatic transformations in economic and social structures which were undergoing during the 90s. The Free State of Saxony was re-established and became the part of the unified Republic of Germany in 1990. Latter on in 1993 the Republic of Czechoslovakia, split into the Czech Republic and Slovakia. Since 1991, the ‘Euroregion Elbe-Labe’, including the cities of Dresden and Meissen on the German side and Teplice, Usti and Decin on the Czech side, has to live with a loss of 33 % of its work force (IÖR, 1997). The greatest part of this loss occurred in the Saxonian part where a part of the population moved to the former West Germany for better employment conditions and at the same time the birth rate in the region fell significantly. On the other hand, since the mid 90s the cities in the Northern Bohemian Basin and their densely populated surroundings show a population loss whereas the rural areas near the border display a slight recover in that respect (IÖR, 1997). Since the German re-unification important investments have been spent on the development of ‘the East’, focussing mainly on infrastructure and economy. However land use/land cover changes are not particularly relevant. On the other hand, in the Czech northern Bohemia region, investments are focused in already developed zones than in rural areas. Thus the main changes of the last 10 – 15 years are registered in and around bigger cities and along development axes, like for instance the Elbe River.
24
- Dresden The city of Dresden is situated in the south eastern part of the Saxony (Germany), which borders with Czech Republic and Poland. The main parts of the city are located within a marked widening of the Elbe valley, bounded by maximal 200 metres-high hillsides. The city is a home for roughly 500,000 inhabitants. The total population of the agglomeration “Oberes Elbtal/Osterzgebirge” –an area of about 3,400 sq km– is about one million people with population density of 300 residents per sq km (MURBANDY, 1999b). At the end of the II World War a series of five air raids practically erased the centre of Dresden and extensive areas of the suburbs (approximately 15 sq km). At the beginning of the 1950s reconstruction began, but despite certain important successes, the later economic difficulties left the reconstruction of the historical city incomplete. During post-war development Dresden partly managed to regain the former standing as an industrial centre. At the end of the 80s the city was part of an important industrial zone in the south of GDR. Despite it in the course of the political and economic transformation since 1989/90 the city lost over 70% of its industrial employment that induced a population decline. Over the 90s Dresden lost almost 10% of its population. In the 90s Dresden has undergone an intensive urban development. A new modern multifunctional city centre appeared next to the historical one. Thousands of new apartments have been built in that period and even new city districts have been developed. - Prague The city of Prague is located in the confluence of Vltava and Berounka rivers. The area of varying elevations with high proportion of forest has a significant recreational potential for Prague, as well as possibilities for housing development. The north east of Prague is gradually connected to the lowland of the Elbe River, one of the main agricultural areas of the Czech Republic. Prague is house for more than 1.2 million people. Contrary to the capitals of the neighbouring countries, Prague was almost untouched during the II World War. Its historical and economic value was therefore preserved. Currently employment in industry dropped by almost one-half if compared with last decade, whereas the services sector grew and currently accounts for 75% of employment. During the communist era housing blocks were built first on the northern part of Prague, and later on the southern, eastern and south-western part. After the communist regime collapsed, the building of the housing blocks was gradually stopped and satellite cities started to be developed. Shopping centres were built on the outskirts and Prague has become a more dynamic city. The recent construction boom in Prague‘s districts of Smíchov, Karlín and some suburban areas of the city documents how vast the change really is. The basic problem of Prague’s development in the 90s was the absence of an outside expressway ring and the inadequate functioning of the inner ring. Due to these two facts, all north-southern transit traffic passed directly trough the city centre. A few
25
traffic facilities that could improve the situation are currently under construction, but the positive effect they will provide is now far in the future. - Dresden-Prague corridor The Southern Saxonian part of the Corridor can be characterised as a comparably uniform landscape of hills and valleys, with small towns and villages. On the border with Czech Republic in the Ost-Erzgebirge (Eastern Ore Mountains), there is a forested area vegetated mainly by coniferous trees. The Czech part contains much more variety in terms of geographical and economical units. Just south of the Eastern Ore Mountains, on the Bohemian side, there is a densely populated area called the ‘Most Basin’ or ‘Northern Bohemian Basin’. Cities of Teplice (52,000) ,Usti nad Labem (97,000) and Decin (53,000) are industrial centres of Most Basin which development has been strongly connected to the nearby brown coal mines and naval commerce along Elbe River. Adjacent to the south of the industrial zone of the Northern Bohemian Basin there is a sparsely populated area of old volcanic cones that rise up to 800 m. It is called the ‘Ceske Stredohori’ region and is a densely forested area with scattered agricultural land use. In terms of bio-diversity it is a very important region. Further to the south from the ‘Ceske Stredohori’ park a vast agricultural plain with occasional small settlements extends until the outskirts of Prague. Its rich soils have made it the biggest agricultural area of the Czech Republic. The population density gets higher gradually again towards the Prague. The vicinity of Prague can be felt also in the increase of industrial and commercial units. - A17/D8 motorway The idea to connect Dresden and Prague by a fast transport link came up initially in the 40s. Latter on the 60s there were some preparative works. It was however in the 80s when effective actions begun. Since that date the planned highway was on the political agenda of authorities and public in both countries. Regarding the datasets for Czech Republic, the motorway (D8) line was quite definite, due to the fact that parts of the motorway already exist or are under in construction. On the other hand, some parts of the motorway are under construction in the area corresponding with the ‘Ceske Stredohori’ park. This caused discussions and even court trials between authorities and environmentalists lasting up to now. The motorway line is now defined with the result that a long road tunnel will be build to avoid the impact on the park. The German part of highway (A17) was started only in 1998. The last part of highway is planed to open for traffic in December 2005. The motorway D8/A17 will be the part of the Trans-European Network (TEN) Corridor IV, which links Dresden and Berlin to Istanbul via Prague, Bratislava, Gjor, Budapast, Arad, Krajova, Sofia and Plovdiv.
3.2.2 Exposure to natural hazards: The 2002 Floods Elba and Moldau Rivers are two of the most important geographical features in the corridor area. Both rivers flow to the north, and meet near the town of Melnik. Due to the fact that both rivers are navigable, they have always been very important transport
26
routes and main development axes. However, those rivers represent also a thread concerning floods for settlements located on the flood plain. In August of 2002 a 100-year flood event hit the area. It was the consequence of over a week of continuous heavy rains. This event affected several regions in Europe, killing dozens, dispossessing thousands, and causing damages of billions of euros in the Czech Republic, Austria, Germany, Slovakia, Poland, Hungary, Romania and Croatia Rivers’ discharge growth first in Austrian areas of Mühlviertel and Waldviertel and later in the Czech Republic, Thuringia and Saxony. Rivers overtopped dykes, and several villages in Northern Bohemia, Thuringia and Saxony were affected. Large areas of the cities of Dresden and Prague were under water and numerous historic buildings were damaged.
3.2.3 Land use dynamics and scenario simulation The statistics for land use dynamics were obtained by using historical (1986/89) and reference (1998/2000) land use/cover datasets. For Dresden, one can said that artificial surfaces are roughly 25% of the overall area, which had increased by the 8% during the period. The main contributors are residential, industrial and commercial areas. This last one shows a very dynamic development. On the other hand, the share of urban green areas is considerably small, but concerning only the administrative area of Dresden it rose up to 20%. On the other hand, the share of open land fell by 2 % in the period referred to. The main losses are registered in agricultural land decreasing by 3% and natural areas decreasing by 3.7%. According to the statistics obtained form the datasets for Prague, the artificial surfaces occupy 35% of the overall area which has increased by the 3%. The main contributors are industrial and commercial areas. The increase of construction sites by 75% shows the start of a extremely dynamic development period. On the other hand, the main landscapes declining due to urban expansion are agricultural lands. The evolution of land use in the transport corridor shows high dynamics for urban land use classes with an increase of 6%. New residential and industrial areas have been also located around the cities of Teplice and Usti nad Laben. The growth of commercial sites (33%) is associated mainly with towns’ centres and outskirts, which demonstrate slow expansion and re-structuring of urban space. - Scenario simulation The CA-based model was calibrated by using historical (1986/89) and reference (1998/2000) land use/cover datasets. In addition, transport network layers have been used in order to simulate the effect of accessibility on land use dynamics. The model has 9 “active” urban land use classes which participate in urban growth. 8 “vacant” land use classes, representing areas where expansion take place such as agricultural and natural land. And finally, 8 “fixed” classes where development is restricted. Among the active urban land use classes there are five classes for different types of residential areas, including “block houses”. This is an important category for cities with communist regime background. Others four are industrial, commercial, services and transport units. The simulation for the period of 12 years (1988-2000) was initiated using the historical dataset in order to test the results by comparing them with the actual land use from the reference dataset. The statistics of real changes between historical and reference datasets
27
in terms of territory were incorporated into the model in order to handle land demand for each particular land use class. Also the demand for some land use classes can be different during the calibration and should be adjusted based on background knowledge. For instance the majority of blockhouses were built in the 80’s and in the mid 90’s, then their construction stopped completely in the mid 90’s. In the corridor territory beyond the two main cities, it is reported a small amount of changes in the land use dynamic. Therefore, clear development trends were difficult to establish. On the other hand, the trends of land use evolution were in some periods very controversial and did not occur at the same rate during the calibration period. After fine-tuning of the model, accuracy assessments were carried out by using statistical methods and spatial metrics (Barredo et al., 2003b). As a result, the fine-tuned version of the simulation was able to transform founded parameters to a number of future scenarios of development. For each scenario the simulation model was established for a 20 years period from 2000 up to 2020. The scenarios produced were based on current land use trends and on the analysis of processes which are foreseen to happen during the simulated period. When information was available, the visions on spatial development strategies by the local planning authorities of the cities of Prague and Dresden and the regions were taking into account. The reunification of Germany in addition to the adhesion of Czech Republic to the EU led to the growing involvement of this corridor to the European market. New investments’ perspectives have opened, and the area also benefits from EU Cohesion and Structural Funds. In the average for new EU countries (EU-10) the gross domestic product is expected to triple and the number of households per capita is projected to double between 2000 and 2030 (EEA, 2005). But in contrary with economic growth the demographic trends for EU-10 will show dramatic decrease of 7% by the 2030 (EEA, 2005). In connection with trends in economy and policies, new trends and standards in spatial planning play their role in the new face of urbanization process. The ideas of polycentric development are appointed to improve demographic, economic and cultural situation in the cities’ outskirts and to create more balanced urban space (City Council of Prague, 2005). New transport solutions are called to reduce stress of old core cities’ centres. Three different land use scenarios were developed. The business as usual scenario concerns moderate growth. It is based on observed trends typical for the end of 90s. In addition, two alternative scenarios –built-up expansion and motorway- explore the ideas about different socio-economic development. For instance, in the motorway scenario we test the postulate that dynamic development affects not only the environments of the cities, but also the predominantly rural areas instantly influenced by transport link Dresden-Prague. – Business as usual scenario It was produced by using the trends from the end of the 90’s. The land demands for urban land use classes were calculated according to the trends of the last 4 years of the calibration period. Concerning the industrial land use class it is foreseen not to growth in the area. In fact, abandoned industrial areas can be re-developed and used by new
28
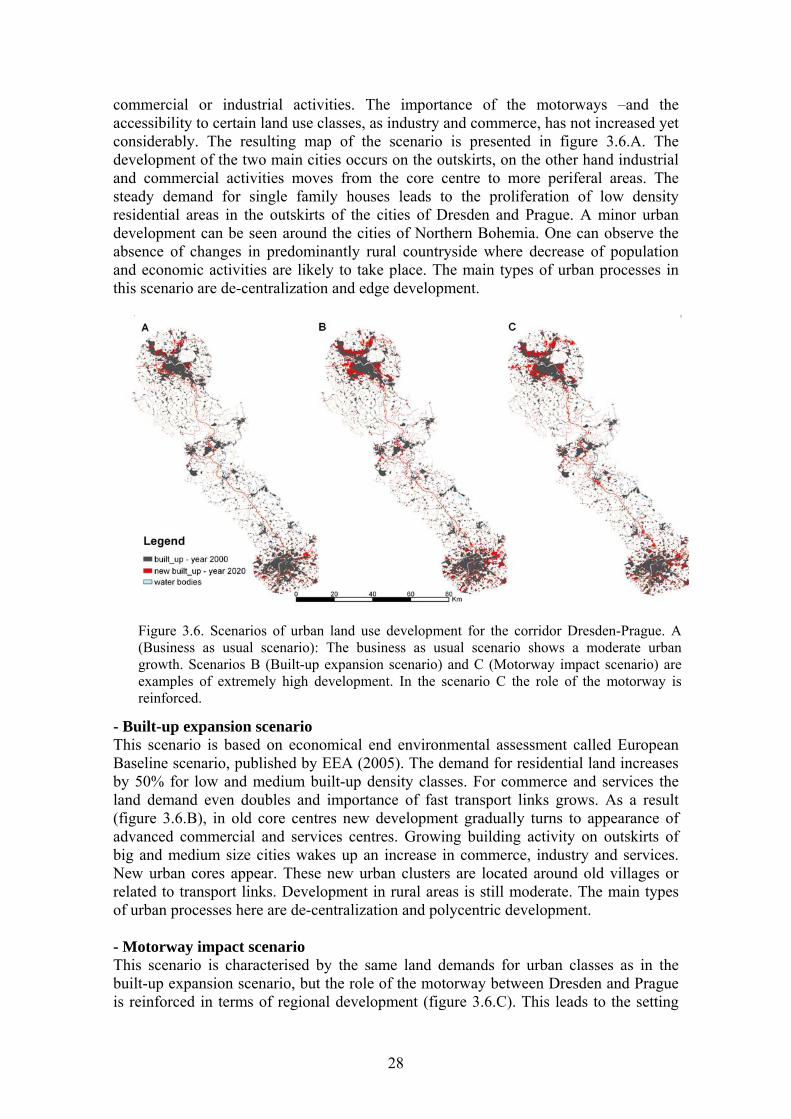
commercial or industrial activities. The importance of the motorways –and the accessibility to certain land use classes, as industry and commerce, has not increased yet considerably. The resulting map of the scenario is presented in figure 3.6.A. The development of the two main cities occurs on the outskirts, on the other hand industrial and commercial activities moves from the core centre to more periferal areas. The steady demand for single family houses leads to the proliferation of low density residential areas in the outskirts of the cities of Dresden and Prague. A minor urban development can be seen around the cities of Northern Bohemia. One can observe the absence of changes in predominantly rural countryside where decrease of population and economic activities are likely to take place. The main types of urban processes in this scenario are de-centralization and edge development.
- Built-up expansion scenario This scenario is based on economical end environmental assessment called European Baseline scenario, published by EEA (2005). The demand for residential land increases by 50% for low and medium built-up density classes. For commerce and services the land demand even doubles and importance of fast transport links grows. As a result (figure 3.6.B), in old core centres new development gradually turns to appearance of advanced commercial and services centres. Growing building activity on outskirts of big and medium size cities wakes up an increase in commerce, industry and services. New urban cores appear. These new urban clusters are located around old villages or related to transport links. Development in rural areas is still moderate. The main types of urban processes here are de-centralization and polycentric development. - Motorway impact scenario This scenario is characterised by the same land demands for urban classes as in the built-up expansion scenario, but the role of the motorway between Dresden and Prague is reinforced in terms of regional development (figure 3.6.C). This leads to the setting
Figure 3.6. Scenarios of urban land use development for the corridor Dresden-Prague. A (Business as usual scenario): The business as usual scenario shows a moderate urban growth. Scenarios B (Built-up expansion scenario) and C (Motorway impact scenario) are examples of extremely high development. In the scenario C the role of the motorway is reinforced.
29
up of commercial and services sites in its surroundings, which currently are predominantly rural areas. For the Northern Bohemia cities i.e. Teplice, Usti nad Labem and Decin and their surroundings, the increase of commercial activities is of great relevance regarding the development of the region with the new motorway connection. The three scenarios show that urbanisation in the corridor area will most likely take place around main cities. In the case of Dresden, a spread and diffuse development style is foreseen. In Prague, a more concentrated and clustered urban pattern is devised. The influence of transport networks will be higher in the immediate vicinity of the developed centres and either in predominantly rural areas. The role of the motorway as new development axis can reinforce the urban growth in the countryside, but real changes here will be strongly depended on general economic situation and/or special structural policies and regional projects. By comparing all three scenarios one can see that the demand for different land uses is a key element which is responsible for pace of the urbanisation processes. Through this approach different hypothesises of social-economic development can be transferred to landscape patterns by using CA modelling tools. Spatial measures in form of different indexes of urban processes can be later on applied for evaluation of sustainable development aspects of current policies. Also the urbanisation trends tested in the scenarios is a suitable approach for the assessment of growing expose to flood hazards by incorporating potential flood hazard maps into the analysis.
3.3 Growing exposure to floods in the Dresden-Prague corridor Elisabetta Genovese
3.3.1 Exposure to natural hazards: the 2002 floods in central Europe The Elbe and Moldau (Vltava) Rivers are two flow to the north of the corridor, converging near the town of Melnik. Due to the fact that both rivers are navigable, they have always been very important transport routes and main development axes. However, these rivers represent also a thread for floods.. In August 2002 a 100-year flood event hit the area. It was the consequence of over a week of continuous heavy rains. This event affected several regions in Europe, killing dozens, dispossessing thousands and causing damages of billions of euros in the Czech Republic, Austria, Germany, Slovakia, Poland, Hungary, Romania and Croatia. The discharge from rivers increased first in the Austrian areas of Mühlviertel and Waldviertel and later in the Czech Republic, Thuringia and Saxony. Rivers over-ran dykes, and several villages in Northern Bohemia, Thuringia and Saxony were affected. Large areas of the cities of Dresden and Prague were under water and numerous historic buildings were damaged.
30
3.3.2 Flood exposure assessment in the Dresden-Prague corridor We show in this section an application of the MOLAND Model for urban and regional development simulation in the transport corridor Dresden-Prague. The aim is the assessment of the exposure to flood risk in this area. This analysis shows an application that offers a useful approach to spatial planning policies and land management solutions to minimise flood damage. In this study a multi-temporal assessment was carried out by using both the MOLAND land use historical database of the Dresden-Prague corridor and the three future scenarios provided by the MOLAND model presented in the previous section. The integration and analysis of these land use datasets with a flood hazard model layer demonstrate the increasing exposure to floods in the area. And moreover, the worrying future trend is going in that direction as well if measures for land use management are not effectively applied. As explained in previous sections, demographic and socio-economic trends play an important role in increasing exposure to weather-driven natural hazards. Aspects such as housing developments in flood prone areas represent a straightforward indicator for this risk (CEC, 2004). Flood risk can be assessed on the basis of three components (Kron, 2002): • Hazard: the threatening natural event including its probability/magnitude of
occurrence • Exposure: the values/human that are present at the location involved • Vulnerability: the lack of resistance to damaging/destructive forces In this application a flood hazard model was used. It was derived using a 1 Km digital elevation model (DEM) and the 1 Km grid European flow network, and it is based on an algorithm calculating the elevation difference of a location with the nearest river, along the hydrological flow path. Elevation difference and the estimated extreme water level of the river determine the potential flood risk (Barredo et al., 2005). The model was generated at a 1 Km pixel size spatial resolution. However for this analysis it was resampled to 100 m pixel-size in order to make it comparable with the resulting scenarios of the MOLAND Model. Early results of this work demonstrate the efficiency of the combined use of two modelling approaches in order to evaluate the exposure and risk to floods at regional level. More accurate datasets are currently being implemented. In the next versions of the flood hazard model it is planned to use a higher resolution DEM (250 and 90 m grid-size) and calculate extreme water levels using the LISFLOOD model. In this report we address the topic of urban growth from a scenario approach: the historical database and the three future simulations described in the previous section are integrated with overlay techniques with the hydrological hazard map previously described. The original flood hazard model contains seven hazard classes from very low to very high hazard. In this analysis we considered only the three higher levels of hazard: very high, high and moderate hazard. The total hazard area accounted in the analysis is equal to almost 700 square kilometres. By simple map overlay, it is remarkable the current built-up areas at risk of flood in the area (figure 3.7)
31
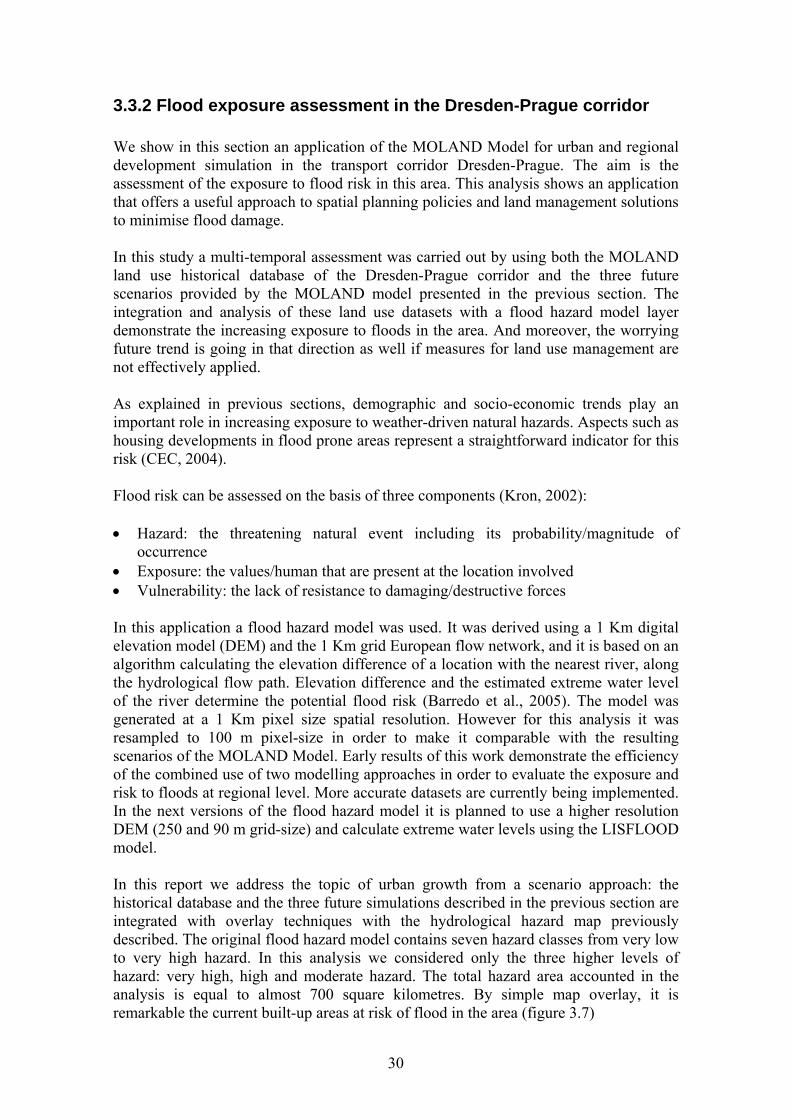
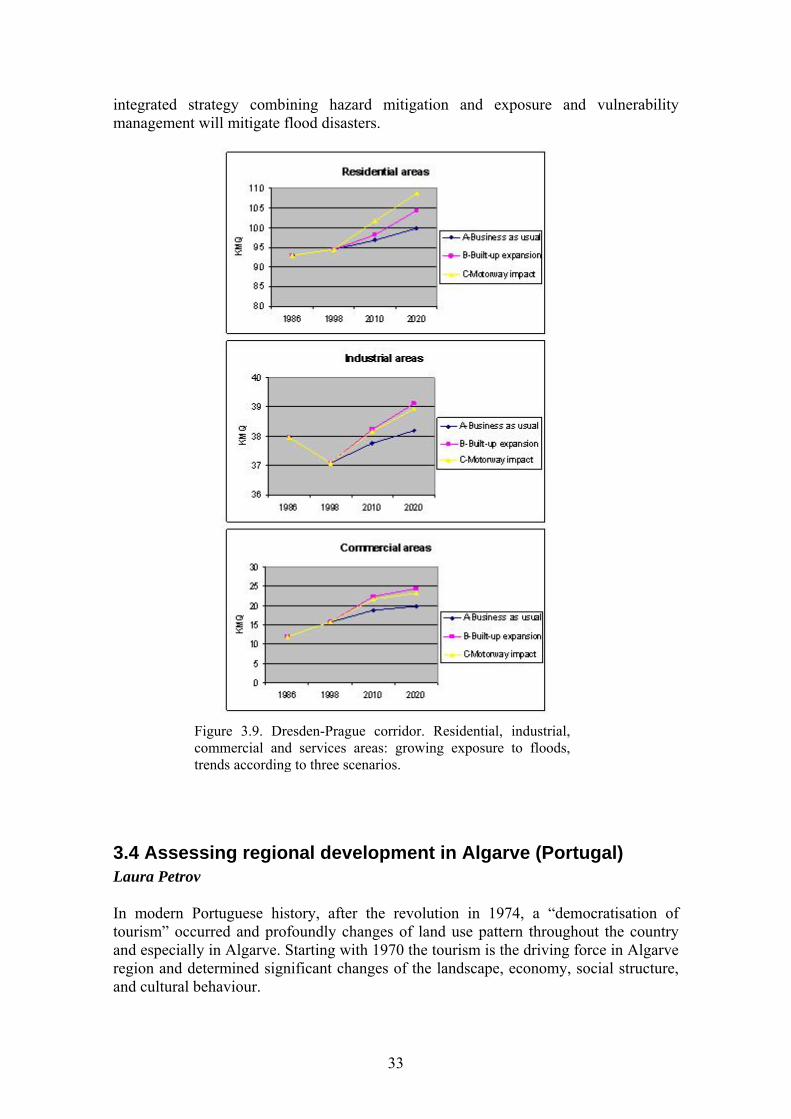
Figure 3.8 shows a chart of built-up surfaces simulated in the corridor for the three scenarios: A) “business as usual” scenario; B) built-up expansion scenario; and C) Motorway impact scenario. The trends shown in figure 3.8 confirm the initial statement on the increasing exposure to floods due to new artificial development: according to the simulations, exposure to floods is growing over time. Between 1986 and 1998 the “residential continuous dense” land use class within the corridor decreased by 7% and the “residential continuous medium dense” was reduced by 1%. As expected the proportion of “residential continuous dense” areas is not foreseen to rise in the future in any of the scenarios. In contrast, “residential medium dense” areas will increase by 3-4% at most. On the other hand, “residential discontinuous” urban fabric growths by more than 3% in flood prone areas in the corridor. Between 1998 and 2020, this trend is expected to continue to rise according to the model results, especially in the case of the B (+12%, equivalent to 4.7 sq. km) and C scenarios (+19%, 7.6 sq. km) scenarios.
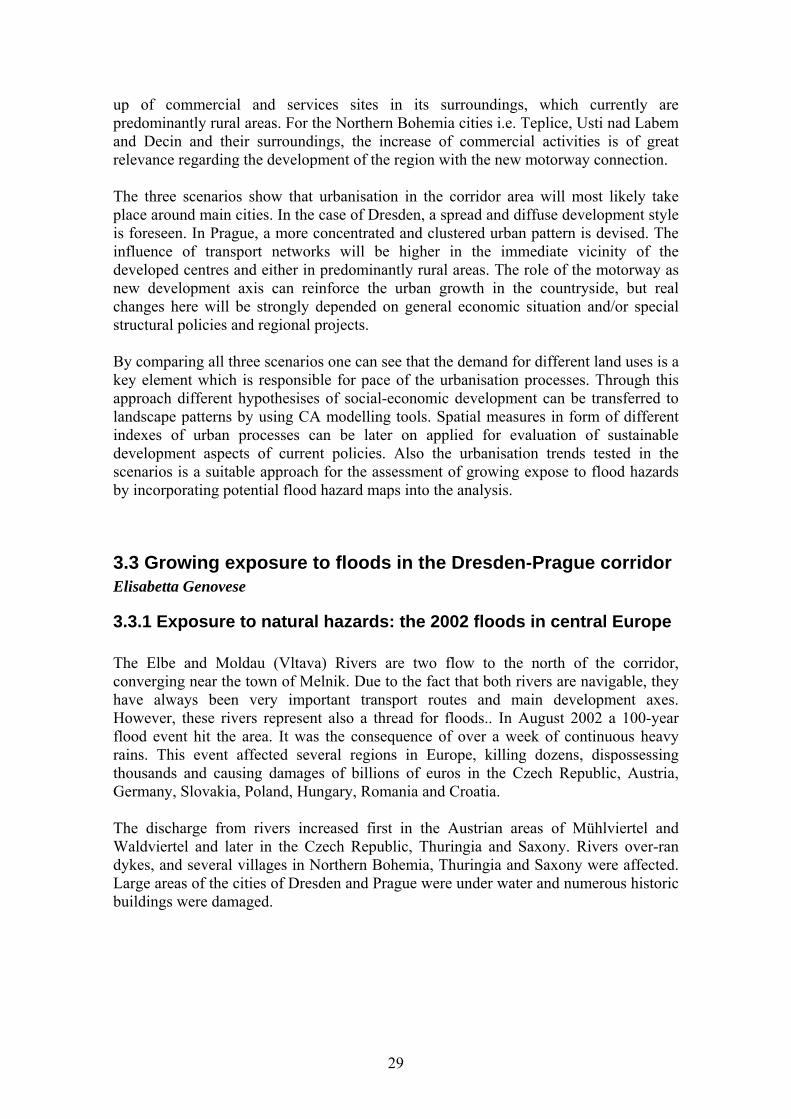
Figure 3.7. Dresden-Prague corridor. Scenario approach for flood risk assessment. 1) Scenario simulation for 2020. 2) Flood hazard map. 3) Overlay of 1 and 2. 4) Exposure to floods on the basis of the several scenarios produced for the corridor.
32
The same trend is observed for the “discontinuous sparse” urban fabric: +3% in the historical comparison. Future trends will bring a further increase in the period 1998-2020, about 8% for the A scenario and 16% for the C scenario, with a correspondence in sq km to 3.1 and 6.4 respectively. Figure 3.9 shows total residential continuous and discontinuous growth trends, which is estimated in a new urban area exposed to floods equal to 5.4 sq. km in the A scenario; and up to 14.2 sq. km in the C scenario. Therefore, higher potential damage is estimated in those areas. Exposure due to industrial areas was decreasing between 1986 and 1998; the analysis shows that also in the future the setting up of industrial areas in flood prone areas will grow only a few (between 1 and 2 sq. km, according to the different scenarios). Exposure and, subsequently, potential damage is expected to rise further due to commercial and services zones developments. In particular the commercial areas grew more than three times in the historical period and, without planning measures and according to B scenario, areas exposed to floods are expected to rise further until 2020 by 7.5 sq. km, doubling the figure for 1998. This worrying trend of commercial and services development in flood prone areas will lead to high damage expectations for businesses. We can summarize the result and say that, according with the A scenario, built-up areas in flood prone zones in the corridor are expected to rise by 11 sq. km in the future. In the case of the B and the C scenario, they will increase from 21 to 24 sq. km. The integrated approach of development scenarios and flood hazard shows the potential of land use-based flood impact assessment for future development. The main advantage of the approach is that it shows future damage potential and exposure trends under the assumption of persistent land use trends in hazard zones. The Dresden-Prague corridor has proved to be a very suitable study case for flood impact assessment. The intensive exposure to natural hazards, past and present, lead to the conclusion that only an
Figure 3.8. Dresden-Prague corridor: Built-up areas exposed to floods on the basis of three growth scenarios in the period 1998-2020. Changes are in percentage.
33
integrated strategy combining hazard mitigation and exposure and vulnerability management will mitigate flood disasters.
3.4 Assessing regional development in Algarve (Portugal) Laura Petrov In modern Portuguese history, after the revolution in 1974, a “democratisation of tourism” occurred and profoundly changes of land use pattern throughout the country and especially in Algarve. Starting with 1970 the tourism is the driving force in Algarve region and determined significant changes of the landscape, economy, social structure, and cultural behaviour.
Figure 3.9. Dresden-Prague corridor. Residential, industrial, commercial and services areas: growing exposure to floods, trends according to three scenarios.
34
The total surface of Algarve region is about 780 sq. km and the total urbanized area was 32.2 sq. km in 1950 and 119.1 sq. km in 1990. The population has moved from the inland to the shoreline and registers an annual increase of 0.5% during the eighties. This increase is rather due to internal migration than to natural demographic growth. The changes in the last 30 years led to a construction pressure especially residential area and tourism facilities. The major land use changes occurred in agricultural and natural areas, which were converted into artificial surfaces, mainly in residential areas. The growth in artificial surfaces occurred mainly next to the existing urban settlements and to the beach. The statistics shows an increase of 64% of development of residential area from 1972 to 1986. In the next decade was observed an increase of industrial building by 8.7%. The larger conversion of agricultural into residential areas was during the period of 1986–1998. The major development of industrial areas occurs in the eighties and of commercial areas in the nineties with the appearances of the major commercial units in the country. The green area had an increase due to construction of golf courses in the tourist areas as well increasing of natural areas due to abandonment of agricultural areas. It was also observed a decreasing of wetlands and water bodies. Nowadays, big hotels on the beach and large apartment buildings are not built anymore, but instead golf courses and holiday villages spread along the Algarve coast. The current development trend could be summarised in scattered built-up areas growing as very small and disperse patches. In the last years, Portugal suffered an increased number of large forest fires, particularly in 2003 faced the worst fire season in the last 23 years, which destroyed an important part of its forested area. The Algarve region was one of the most affected in the south of the country, where the fires burnt in August 2003 more than 35,745 ha of forest land and in September 2003 more 25,894 ha, devastating all the Serra of Monchique. In 2004 the situation was less serious concerning forest fires although some of the meteorological conditions carried the same high risk as 2003. What are the drivers of such intense fire period in this region? Is one of the consequences of the changing socio-economics dynamics in Algarve? Natural and cultural values have vanished and most of them in an unrecoverable way. To protect the most sensitive ecosystems, nature conservation areas were created. Ria Formosa Nature Park occupies 184 sq. km and it spreads along a strip of 60 km of shoreline. It was proclaimed a Man and the Biosphere Reserve (MAB) by the UNESCO, which aims the protection of the world’s major ecosystems. The objectives of the work in Algarve are to develop a future urban simulation, assess touristy impact and evaluate the forest fires problem. The dynamic of land use scenarios are examined based on several aspects, among them land use planning policies (master plans). Then, the future scenarios produced by the model are tailored to particular requirements such as touristy assessment and measures for improvement of regional needs. As well, to evaluate the impacts of forest fires hazard and understand the role of it in the environment (current and forecasted).
35
3.4.1 Modelling land use dynamics in Algarve The development of a land use forecast model, the MOLAND urban and regional growth model (Barredo et al., 2003a; Barredo et al., 2004a) is used to evaluate spatial planning for sustainable urban development and measures for natural risks reduction. The study follows the methodology already used for scenario simulation in other European areas such as the greatest Dublin in Ireland (Barredo et al., 2003a) and Friuli-Venezia Giulia in Italy (Barredo et al., 2003b). The MOLAND urban and regional growth model is based on spatial dynamics called cellular automata. The model takes as input five types of digital maps in relation with the geographical area of interest: a) actual land use types; b) accessibility of the area to the transport network; c) inherent suitability of the area for different land uses; d) zoning status of the area for different land uses; e) socio-economic characteristics (e.g. population, income, production, employment etc) of the area. A first simulation for the seashore of Algarve has been produced for the period 1986-1998 using the MOLAND model. The simulation starts using the historical database for the year 1986, in order to test the simulation results using the reference database for the year 1998. The simulation has been tested by comparison with the actual land use layer. The area modelled is represented as a mosaic of 259,050 grid cells, each representing an area of 100 X 100 m. The land use were classified in 25 categories, 10 of which are land use functions, 8 are vacant land uses, and 7 are land use features. The calibration of the model is based on an interactive procedure in which each state (active and passive) is adjusted versus each of the land use classes. In general, the urban land use classes should respond to similar attraction/ repulsion schemes, independently of the urbanized area. The weighting parameters were modified until the differences between the simulated and actual land use maps for 1998 fitted. It was observed that the built-up area has expanded significantly over the past 12 years. A significant increase was observed concerning residential continuous medium dense urban fabric from 0.59 to 1.10%, residential discontinuous urban fabric from 0.88 to 2.83%, and residential discontinuous sparse urban fabric from 4.74 to 9.61%. As well, a relevant increase was noted by industrial and commercial areas. The most affected were arable lands, which decreased by approximately 12%. In the model, for the case of future simulations, an additional planned transportation links represents an interesting approach for predicting the impact of new infrastructures on the territory and for modelling different development alternatives. It was taken into consideration the following fast transit roads, other roads, and railways. The assessment of the results test for Algarve seashore area was carried out using two approaches: (1) verifying visually for comparing if the land use maps fit in a logical way; this produces a first idea of what the model is able to do; (2) quantitative evaluation of the degree of coincidence between the two land use maps using the comparison matrices method in order to produce a fine-tuned version of the simulation and obtain accuracy values. Thus, calibration involves also finding suitable values for the stochastic parameter. In this case, it was set at α = 0.6 where the urban patterns appears to have a logical distribution (more scattered). The table results showed
36
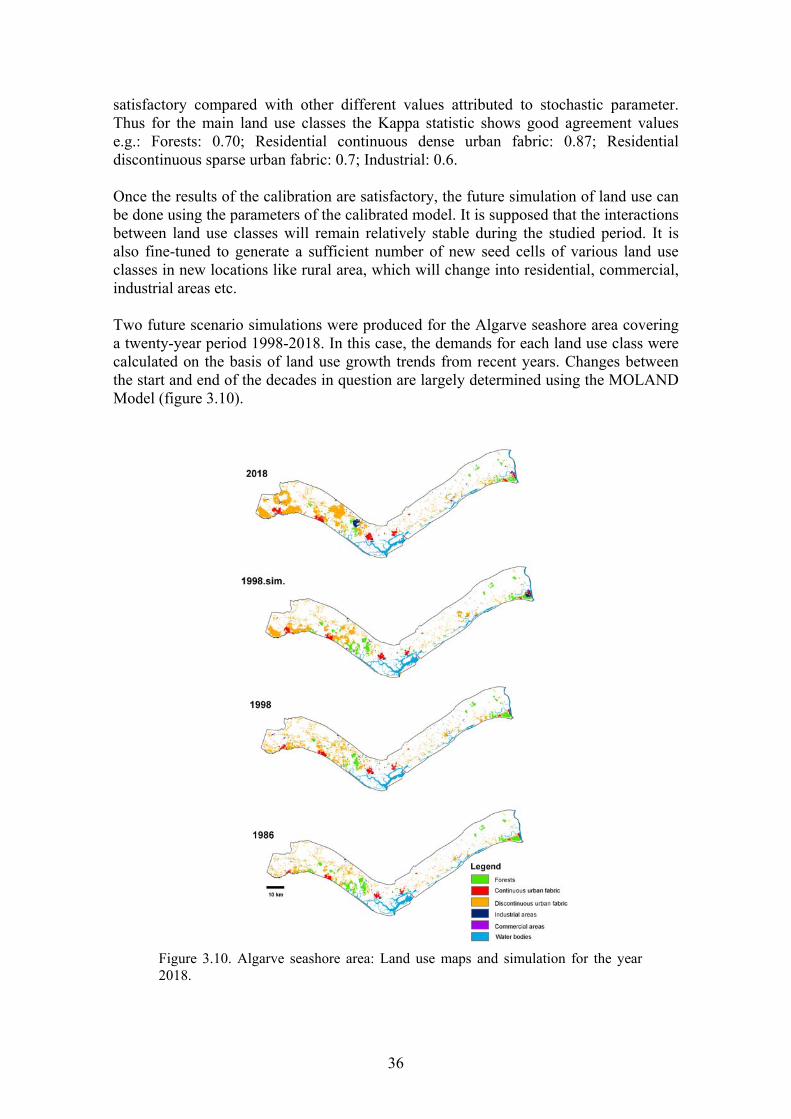
satisfactory compared with other different values attributed to stochastic parameter. Thus for the main land use classes the Kappa statistic shows good agreement values e.g.: Forests: 0.70; Residential continuous dense urban fabric: 0.87; Residential discontinuous sparse urban fabric: 0.7; Industrial: 0.6. Once the results of the calibration are satisfactory, the future simulation of land use can be done using the parameters of the calibrated model. It is supposed that the interactions between land use classes will remain relatively stable during the studied period. It is also fine-tuned to generate a sufficient number of new seed cells of various land use classes in new locations like rural area, which will change into residential, commercial, industrial areas etc. Two future scenario simulations were produced for the Algarve seashore area covering a twenty-year period 1998-2018. In this case, the demands for each land use class were calculated on the basis of land use growth trends from recent years. Changes between the start and end of the decades in question are largely determined using the MOLAND Model (figure 3.10).
Figure 3.10. Algarve seashore area: Land use maps and simulation for the year 2018.
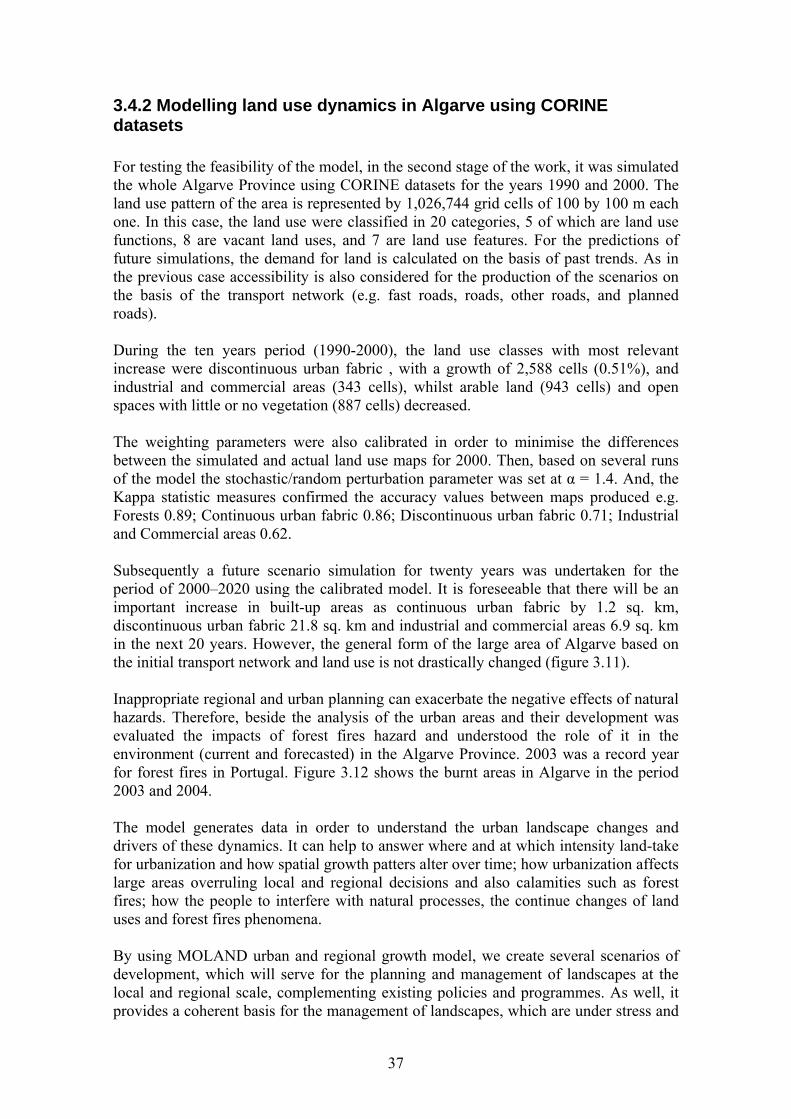
37
3.4.2 Modelling land use dynamics in Algarve using CORINE datasets For testing the feasibility of the model, in the second stage of the work, it was simulated the whole Algarve Province using CORINE datasets for the years 1990 and 2000. The land use pattern of the area is represented by 1,026,744 grid cells of 100 by 100 m each one. In this case, the land use were classified in 20 categories, 5 of which are land use functions, 8 are vacant land uses, and 7 are land use features. For the predictions of future simulations, the demand for land is calculated on the basis of past trends. As in the previous case accessibility is also considered for the production of the scenarios on the basis of the transport network (e.g. fast roads, roads, other roads, and planned roads). During the ten years period (1990-2000), the land use classes with most relevant increase were discontinuous urban fabric , with a growth of 2,588 cells (0.51%), and industrial and commercial areas (343 cells), whilst arable land (943 cells) and open spaces with little or no vegetation (887 cells) decreased. The weighting parameters were also calibrated in order to minimise the differences between the simulated and actual land use maps for 2000. Then, based on several runs of the model the stochastic/random perturbation parameter was set at α = 1.4. And, the Kappa statistic measures confirmed the accuracy values between maps produced e.g. Forests 0.89; Continuous urban fabric 0.86; Discontinuous urban fabric 0.71; Industrial and Commercial areas 0.62. Subsequently a future scenario simulation for twenty years was undertaken for the period of 2000–2020 using the calibrated model. It is foreseeable that there will be an important increase in built-up areas as continuous urban fabric by 1.2 sq. km, discontinuous urban fabric 21.8 sq. km and industrial and commercial areas 6.9 sq. km in the next 20 years. However, the general form of the large area of Algarve based on the initial transport network and land use is not drastically changed (figure 3.11). Inappropriate regional and urban planning can exacerbate the negative effects of natural hazards. Therefore, beside the analysis of the urban areas and their development was evaluated the impacts of forest fires hazard and understood the role of it in the environment (current and forecasted) in the Algarve Province. 2003 was a record year for forest fires in Portugal. Figure 3.12 shows the burnt areas in Algarve in the period 2003 and 2004. The model generates data in order to understand the urban landscape changes and drivers of these dynamics. It can help to answer where and at which intensity land-take for urbanization and how spatial growth patters alter over time; how urbanization affects large areas overruling local and regional decisions and also calamities such as forest fires; how the people to interfere with natural processes, the continue changes of land uses and forest fires phenomena. By using MOLAND urban and regional growth model, we create several scenarios of development, which will serve for the planning and management of landscapes at the local and regional scale, complementing existing policies and programmes. As well, it provides a coherent basis for the management of landscapes, which are under stress and
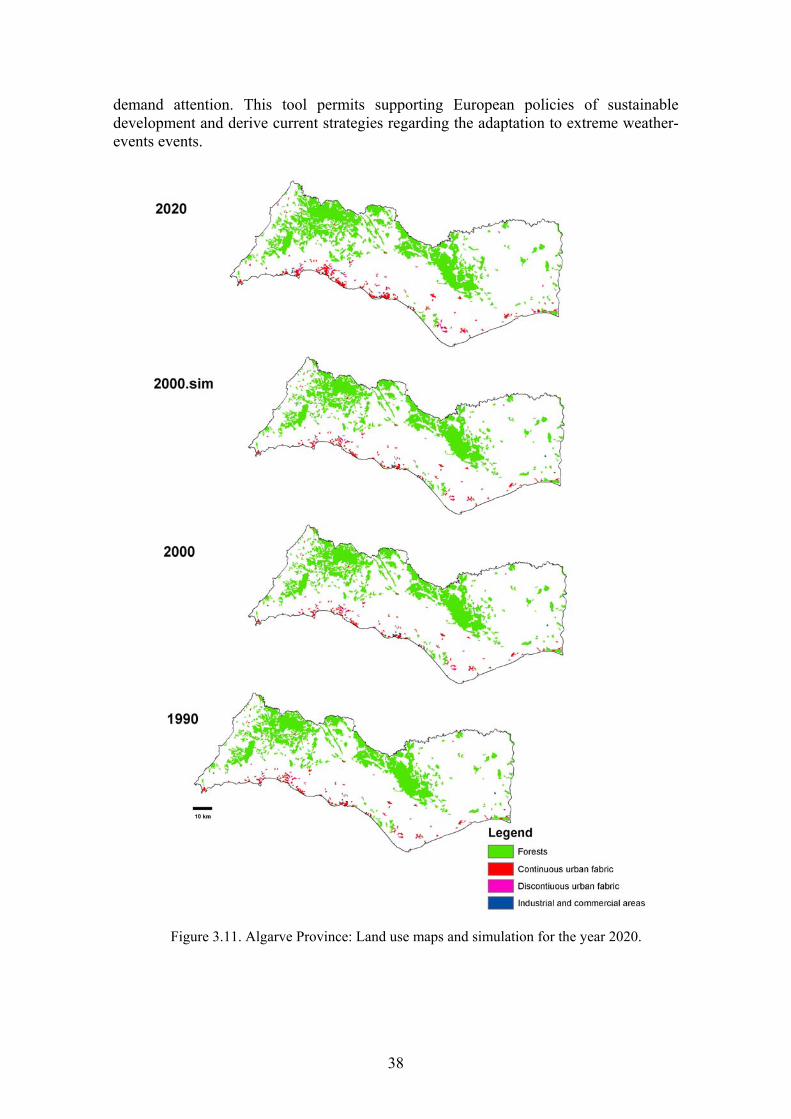
38
demand attention. This tool permits supporting European policies of sustainable development and derive current strategies regarding the adaptation to extreme weather-events events.
Figure 3.11. Algarve Province: Land use maps and simulation for the year 2020.
39
3.5 Sea level rise assessment in Pärnu city (Estonia) Valentina Sagris Pärnu is a city on the Baltic Sea coast on the Pärnu Bay in SW Estonia. It is the administrative centre of Pärnu County, a health resort and also a seaport of regional importance. The area was mapped according to MOLAND methodology in the frame of the project ‘Creation of the territorial and environmental data sets of the Harjumaa County and Via-Baltica transport corridor’ in 2002 (Demicheli et al., 2003). The datasets used in this work correspond to the reference (2000) and historical (1986) dates. For modelling purposes, the area corresponding with Pärnu city and its surroundings was extracted from the original datasets. The area delimitations do not follow the administrative boundaries of the city. The area is composed of the continuously built-up core and a buffer around them. This approach widens the analysis from administrative cities to more functional urban areas (Kasanko et al., in press). Therefore, the total area under study is 71.9 sq. km. - Geographical and historical background Pärnu is located on the coast of the Pärnu Bay at the confluence of Pärnu and Audru Rivers, two of the largest Estonian river systems. The Pärnu Bay is shallow and has low salinity. Till shore abraded by sea waves in the north-western part and abundant sandy shores and long ranges of shore ridges covered with sand dunes in south-western are typical coast features of the Pärnu Lowland - low (mostly less than 20 m above sea level) and flat area. The share of forested area in Pärnu County is higher than in the rest of Estonia, take up 50% of the county’s area. Arable land occupies 15% and mostly located scattered between large forest and bog areas. Forest and horticulture peat are two of the main resources in the region. Wood-cutting is very intense, the drainage systems are in good shape and there are many roads constructed across forested areas. Also most of peat bogs are used for peat production or drained. The coastal areas are important in recreation, recently also the inner marshes and forest areas have raised interest as rural tourism destinations. Pärnu city is home of approximately 44,000 inhabitants. Two-thirds of the County’s population reside in Pärnu city and its hinterlands (the rural municipalities of Audru,
Figure 3.12. Algarve Province: burnt areas in 2003 and 2004.
40
Sauga, Paikuse, and town of Sindi). During the period from the mid-80’s to the year 2000 different social and economical processes formed the face of the city. The collapse of the communist regime, economical and social difficulties at the first years of Estonian State independence, liberalisation of economy and following tourist boom leaded to controversial trends in city population and land use dynamics. The economic decline and population migration flows during immediate post-Soviet period led to considerable decrease in city population from 53,000 in 1987 to 50,000 in 2000. That process is still slowly continuing nowadays. The demand for new residents and industrial capacities was at very low level. The signs of gradual improvement can be seen only since the mid-90s with general revitalising of Estonian economy and tourism. - The Via-Baltica Transport Corridor The motorway Tallinn–Pärnu–Ikla and the railway link Pärnu–Riga are Estonian parts of the Pan- European Transport Corridor (TEN) I: Helsinki–Tallinn– Riga– Kaunas–Klaipeda–Warsaw. The motorway is also part of European route E67 – ‘Via-Baltica’. It links new EU Member States around Baltic See and through the Tallinn ports. This is also the shortest path from Helsinki to Eastern Europe. The progress of the infrastructure of Via-Baltica supported by EU Structural and Regional Funds and it is projected to have positive impact on regional development of the territory.
3.5.1 Land use dynamics and scenario simulation The total share of urban classes in the study area is considerably high (35%), however the dynamics of urban growth during period from 1986 to 2000 are extremely slow and show increase only by 1% of total study area. The historical centre of Pärnu is a compact core mostly represented by medium dense continuous urban fabric. The outskirts of the city are occupied by scattered family houses with their yards. The belt of urban greens separates historical centre from the seashore and the beaches. The share of industrial land use (5% of total in the 80’s) shows decrease by 1% in the period 1980-2000. On the other hand, commerce and service areas increased considerably: from 0.5% to 1.4% for commerce and from 1.1% to 6.8% for services. - Modelling land use dynamics: scenario simulation The MOLAND Model was calibrated by using historical (1986) and reference (2000) land use/cover datasets and transport network layers. The model has been implemented by including 9 ‘active’ urban classes which participate in urban dynamics; 9 ‘vacant’ land uses, representing areas where expansion takes place such as agricultural and natural land; and 7 ‘fixed’ classes where development is restricted (Barredo et al., 2003a). Among active urban classes there are five classes for different types of residential areas, including ‘block houses’ (this class is an important category for cities with communist regime background). Others four are industrial, commercial, services’ areas and transport units. The model was calibrated for a period of 14 years using historical datasets. Land demands for each active urban land-use class were derived from the change statistics between historical and reference datasets and incorporated into the model. Also different trends at different stages of calibration period were adjusted. As said before the dynamics of this area are quite slow in the period used for calibration purposes (1986-2000). By considering the relative small size of the studied area it was decided to produce a very fine spatial resolution model at 50 m pixel size.
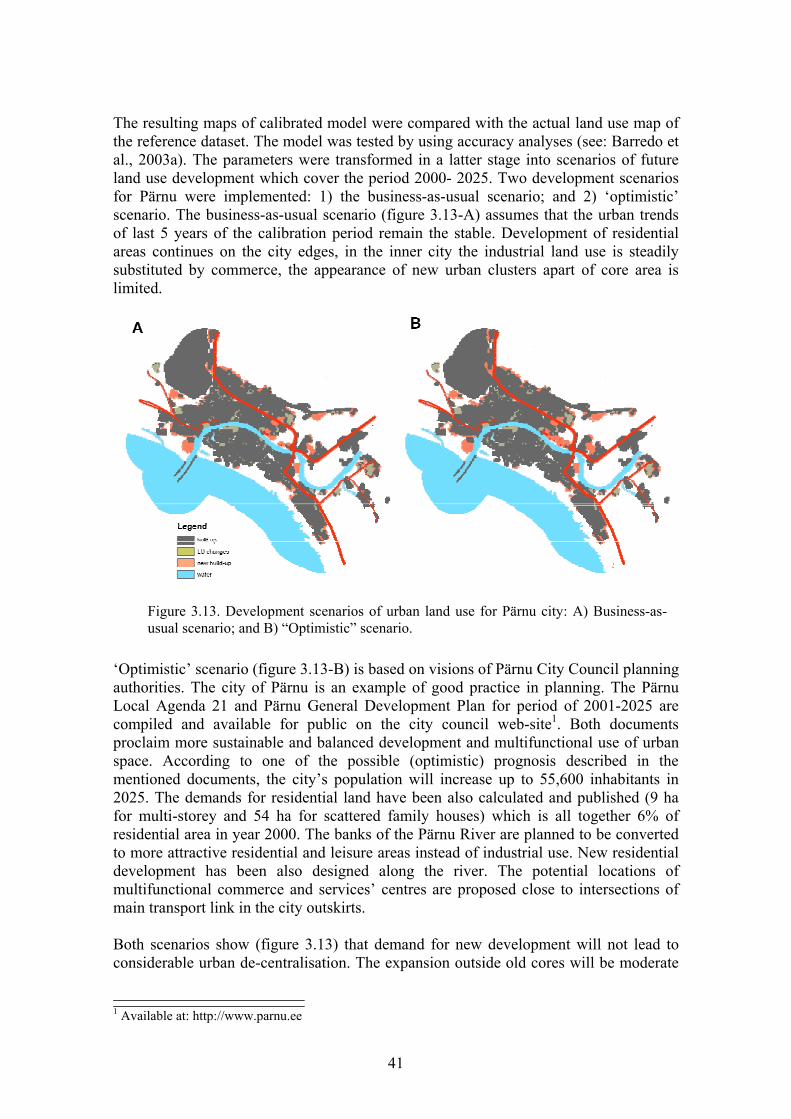
41
The resulting maps of calibrated model were compared with the actual land use map of the reference dataset. The model was tested by using accuracy analyses (see: Barredo et al., 2003a). The parameters were transformed in a latter stage into scenarios of future land use development which cover the period 2000- 2025. Two development scenarios for Pärnu were implemented: 1) the business-as-usual scenario; and 2) ‘optimistic’ scenario. The business-as-usual scenario (figure 3.13-A) assumes that the urban trends of last 5 years of the calibration period remain the stable. Development of residential areas continues on the city edges, in the inner city the industrial land use is steadily substituted by commerce, the appearance of new urban clusters apart of core area is limited.
‘Optimistic’ scenario (figure 3.13-B) is based on visions of Pärnu City Council planning authorities. The city of Pärnu is an example of good practice in planning. The Pärnu Local Agenda 21 and Pärnu General Development Plan for period of 2001-2025 are compiled and available for public on the city council web-site1. Both documents proclaim more sustainable and balanced development and multifunctional use of urban space. According to one of the possible (optimistic) prognosis described in the mentioned documents, the city’s population will increase up to 55,600 inhabitants in 2025. The demands for residential land have been also calculated and published (9 ha for multi-storey and 54 ha for scattered family houses) which is all together 6% of residential area in year 2000. The banks of the Pärnu River are planned to be converted to more attractive residential and leisure areas instead of industrial use. New residential development has been also designed along the river. The potential locations of multifunctional commerce and services’ centres are proposed close to intersections of main transport link in the city outskirts. Both scenarios show (figure 3.13) that demand for new development will not lead to considerable urban de-centralisation. The expansion outside old cores will be moderate
1 Available at: http://www.parnu.ee
Figure 3.13. Development scenarios of urban land use for Pärnu city: A) Business-as-usual scenario; and B) “Optimistic” scenario.
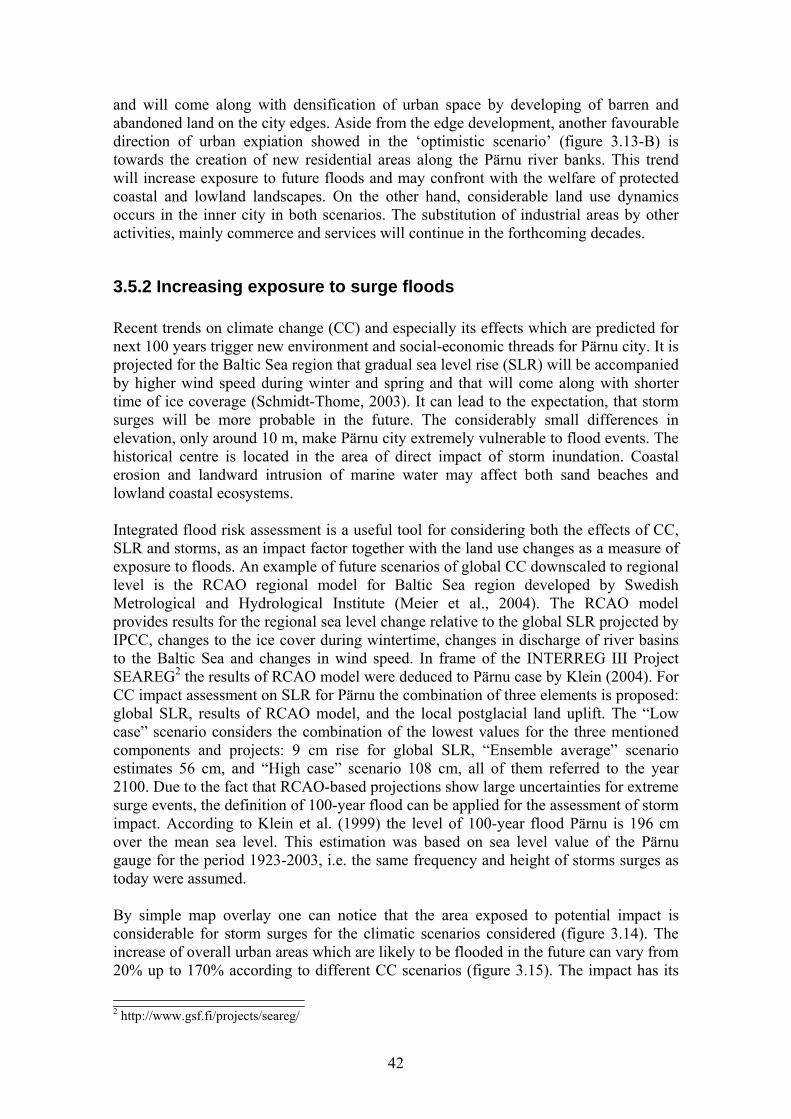
42
and will come along with densification of urban space by developing of barren and abandoned land on the city edges. Aside from the edge development, another favourable direction of urban expiation showed in the ‘optimistic scenario’ (figure 3.13-B) is towards the creation of new residential areas along the Pärnu river banks. This trend will increase exposure to future floods and may confront with the welfare of protected coastal and lowland landscapes. On the other hand, considerable land use dynamics occurs in the inner city in both scenarios. The substitution of industrial areas by other activities, mainly commerce and services will continue in the forthcoming decades.
3.5.2 Increasing exposure to surge floods Recent trends on climate change (CC) and especially its effects which are predicted for next 100 years trigger new environment and social-economic threads for Pärnu city. It is projected for the Baltic Sea region that gradual sea level rise (SLR) will be accompanied by higher wind speed during winter and spring and that will come along with shorter time of ice coverage (Schmidt-Thome, 2003). It can lead to the expectation, that storm surges will be more probable in the future. The considerably small differences in elevation, only around 10 m, make Pärnu city extremely vulnerable to flood events. The historical centre is located in the area of direct impact of storm inundation. Coastal erosion and landward intrusion of marine water may affect both sand beaches and lowland coastal ecosystems. Integrated flood risk assessment is a useful tool for considering both the effects of CC, SLR and storms, as an impact factor together with the land use changes as a measure of exposure to floods. An example of future scenarios of global CC downscaled to regional level is the RCAO regional model for Baltic Sea region developed by Swedish Metrological and Hydrological Institute (Meier et al., 2004). The RCAO model provides results for the regional sea level change relative to the global SLR projected by IPCC, changes to the ice cover during wintertime, changes in discharge of river basins to the Baltic Sea and changes in wind speed. In frame of the INTERREG III Project SEAREG2 the results of RCAO model were deduced to Pärnu case by Klein (2004). For CC impact assessment on SLR for Pärnu the combination of three elements is proposed: global SLR, results of RCAO model, and the local postglacial land uplift. The “Low case” scenario considers the combination of the lowest values for the three mentioned components and projects: 9 cm rise for global SLR, “Ensemble average” scenario estimates 56 cm, and “High case” scenario 108 cm, all of them referred to the year 2100. Due to the fact that RCAO-based projections show large uncertainties for extreme surge events, the definition of 100-year flood can be applied for the assessment of storm impact. According to Klein et al. (1999) the level of 100-year flood Pärnu is 196 cm over the mean sea level. This estimation was based on sea level value of the Pärnu gauge for the period 1923-2003, i.e. the same frequency and height of storms surges as today were assumed. By simple map overlay one can notice that the area exposed to potential impact is considerable for storm surges for the climatic scenarios considered (figure 3.14). The increase of overall urban areas which are likely to be flooded in the future can vary from 20% up to 170% according to different CC scenarios (figure 3.15). The impact has its
2 http://www.gsf.fi/projects/seareg/
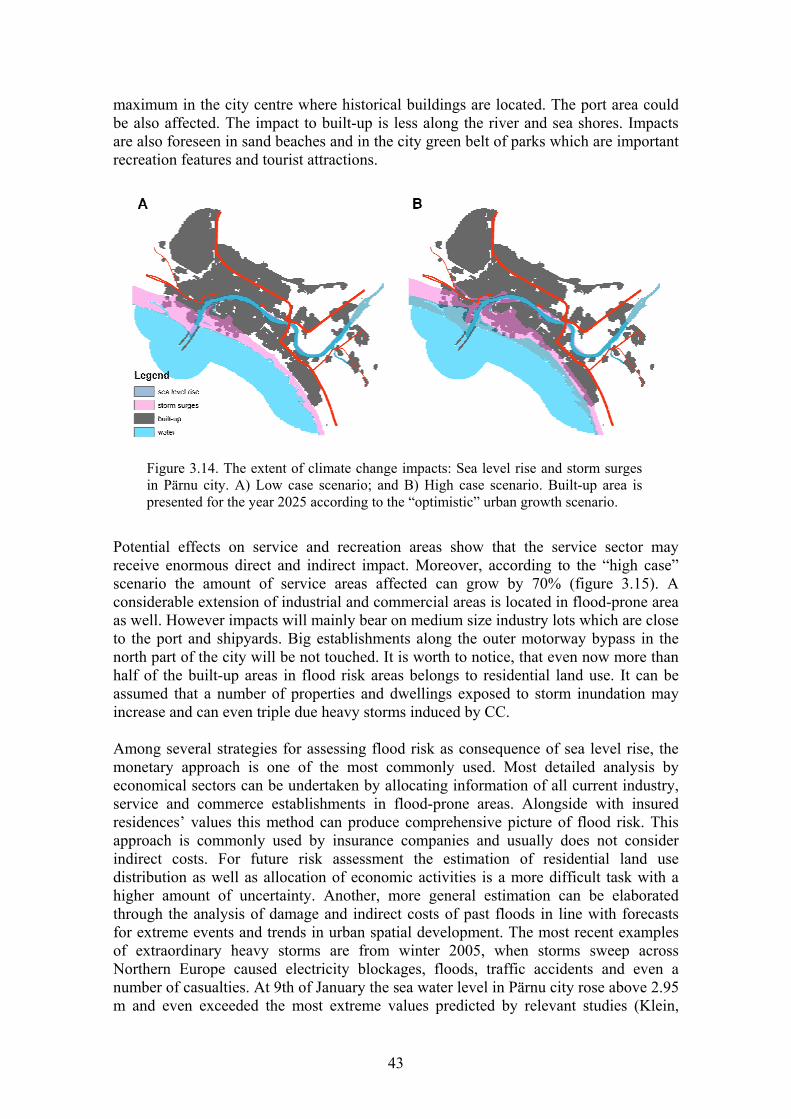
43
maximum in the city centre where historical buildings are located. The port area could be also affected. The impact to built-up is less along the river and sea shores. Impacts are also foreseen in sand beaches and in the city green belt of parks which are important recreation features and tourist attractions.
Potential effects on service and recreation areas show that the service sector may receive enormous direct and indirect impact. Moreover, according to the “high case” scenario the amount of service areas affected can grow by 70% (figure 3.15). A considerable extension of industrial and commercial areas is located in flood-prone area as well. However impacts will mainly bear on medium size industry lots which are close to the port and shipyards. Big establishments along the outer motorway bypass in the north part of the city will be not touched. It is worth to notice, that even now more than half of the built-up areas in flood risk areas belongs to residential land use. It can be assumed that a number of properties and dwellings exposed to storm inundation may increase and can even triple due heavy storms induced by CC. Among several strategies for assessing flood risk as consequence of sea level rise, the monetary approach is one of the most commonly used. Most detailed analysis by economical sectors can be undertaken by allocating information of all current industry, service and commerce establishments in flood-prone areas. Alongside with insured residences’ values this method can produce comprehensive picture of flood risk. This approach is commonly used by insurance companies and usually does not consider indirect costs. For future risk assessment the estimation of residential land use distribution as well as allocation of economic activities is a more difficult task with a higher amount of uncertainty. Another, more general estimation can be elaborated through the analysis of damage and indirect costs of past floods in line with forecasts for extreme events and trends in urban spatial development. The most recent examples of extraordinary heavy storms are from winter 2005, when storms sweep across Northern Europe caused electricity blockages, floods, traffic accidents and even a number of casualties. At 9th of January the sea water level in Pärnu city rose above 2.95 m and even exceeded the most extreme values predicted by relevant studies (Klein,
Figure 3.14. The extent of climate change impacts: Sea level rise and storm surges in Pärnu city. A) Low case scenario; and B) High case scenario. Built-up area is presented for the year 2025 according to the “optimistic” urban growth scenario.
44
2004) for 100-years flood events. The water covered one-third of the historical city centre, caused evacuation of many people, transport and sewage problems. The direct and indirect damage cased by flood events in January 2005 is estimated up to 22.3 million Euros and predicted trends are likely to increase this number.
It is important to underline that winter storms and storm surges are not something new for Pärnu city. The small, approximately 1 m high sea walls established to protect the centre of city as well as port constructions were built taking into account possible floods. But storms in January 2005 showed that existing structural measures would be not enough to cope with future extreme events. By producing several alternative scenarios the awareness about warning trends should be raised among public and authorities. The awareness should lead to a flood defence and urban planning integrated strategy to be implemented in order to mitigate the effects of surge floods.
0
100
200
300
400
500
600
1986 2000 2025a 2025b 2025c
Ha
Urban greenPort areasPublic and private servicesCommercial areasIndustrial areasResidential discontinuous Residential continuous
Figure 3.15. Urban land use classes in sea level rise and surge-prone areas. Historical: 1986; and present: 2000. Land-use map for 2025 comes from the “optimistic” urban growth scenario presented above. Scenarios for climate change are represented as follows: 2025a) corresponds to “Low case” scenario; 2025b) “Ensemble average” scenario; and 2025c) “High case” scenario.
45
4. Final remarks Carlo Lavalle Since the first discussions on the European Spatial Development Perspectives (ESDP) occurred in 1996, the ‘territorial perspective’ is assuming an increasing role in the debate related to the growth of the EU. The European Treaty itself recognises the importance of “territorial” cohesion as evidenced in Article 16 (Principles) which recognizes that citizens should have access to essential services, basic infrastructure and knowledge by highlighting the significance of services of general economic interest for promoting social and territorial cohesion. Therefore, the analysis of the disparities and unbalances of the European territory has assumed a relevant role in the discussions on the future of the EU. Territorial processes cannot be ignored and need to be analysed and properly understood in order to be able to propose solutions and implement policies of cohesion and of sustainable development. Also, it has to be carefully considered that several factors concur simultaneously on the territory, ranging from wide EU development schemes (e.g. CAP, TEN/T, ERDF, etc.) to national and regional plans. From a purely technical and scientific viewpoint, the analysis of territorial features requires that attention is paid to a number of issues: • the scale (geographical level) on which the feature occurs; • the multi-level interactions which define the feature; • the multiplicity of drivers which influence the feature; • the time-scale that characterise the phases of development and setting of the feature; • the direct and indirect impacts of the features with its surrounding world; • the (future) evolution of the feature. The integrated scenario being set up at the Land Management Unit of JRC/IES attempts to tackle these issues in a strategic and continental perspective. ‘Strategic’ because the evaluation of specific development situations is analysed on the basis of wide principles and criteria (e.g. overall urban sprawl, or exposure to hazard, or impact of mobility and accessibility, etc.) and not related to local planning needs (in respect of the subsidiarity principle). ‘Continental’ because the same approach is applied to diverse areas in Europe and, although specific transition rules may adapt to local conditions, the evaluation is comparative and not specific of a single place. The development of the modelling tools has followed a gradual stepwise approach, reflecting the bottom-up approach of the territorial analysis. The first version of the model focused on the ‘urban’ dimension, targeting issues such as urban sprawl and territorial fragmentation. This version has then been upgraded to include a wide range of ‘suitability’ layers related to risk exposure. The regional version allows now to analyse territorial exchanges and migrations flows, an ideal tool for the definition of transborder scenarios. A further characteristic of the adopted approach is the interaction that occurs with local stakeholders, necessary to include the knowledge of the local territory. Currently a

46
number of formal collaborations have been set up to facilitate the exchange of practices and knowledge with regional and local actors. Next steps of progress foresee the development of specific modules to consider respectively:
• an active interface with the LISFLOOD hydrological model; • transport and traffic flows; • feed-back mechanisms with climate change processes; and • a nested approach to interface with econometric models.
47
References Autorità di Bacino dei fiumi dell'Alto Adriatico. (2003). "Progetto di piano stralcio per
la sicurezza idraulica del bacino del Livenza (Extract of the hydrological security plan of the Livenza catchment)". Water Authority for the North Adriatic Rivers, Available at: http://www.adbve.it. Venice.
Barredo, J.I., Kasanko, M., McCormick, N., and Lavalle, C. (2003a). "Modelling dynamic spatial processes: simulation of urban future scenarios through cellular automata". Landscape and Urban Planning, 64(3), 145-160.
Barredo, J.I., Lavalle, C., Demicheli, L., Kasanko, M., and McCormick, N. (2003b). "Sustainable urban and regional planning: The MOLAND activities on urban scenario modelling and forecast". EUR 20673 EN, European Commission, DG-Joint Research Centre. Ispra. Available at: http://natural-hazards.jrc.it/downloads/public/2004_EUR_Barredo_et_al.pdf.
Barredo, J.I., Demicheli, L., Lavalle, C., Kasanko, M., and McCormick, N. (2004a). "Modelling future urban scenarios in developing countries: an application case study in Lagos, Nigeria". Environment and Planning B: Planning and Design, 32, 65-84.
Barredo, J.I., Lavalle, C., Kasanko, M., Sagris, V., Brezger, A.S., and McCormick, N. (2004b). "Climate change impacts on floods in Europe - Towards a set of risk indicators for adaptation". EUR 21472 EN, European Commission, DG-Joint Research Centre. Ispra.
Barredo, J.I., Lavalle, C., and De Roo, A. (2005). "European flood risk mapping". S.P.I.05.151.EN, European Commission, DG-Joint Research Centre. Ispra.
Batty, M., and Longley, P. (1986). "The fractal simulation of urban structure". Environment and Planning A, 18, 1143-1179.
Batty, M., and Longley, P. (1987). "Fractal-based description of urban form". Environment and Planning B: Planning and Design, 14(123-134).
Bessusi, E., Cecchini, A., and Rinaldi, E. (1998). "The diffused city of the Italian North-East: identification of urban dynamics using cellular automata urban models". Computers Environment and Urban Systems, 22, 497-523.
Brezger, A.S. (2004). "Land use forecasting and Natural Hazards: Current and future impacts of flooding in urban areas; Case study: Pordenone Province, Friuli-Venezia Giulia (FVG), Italy". S.P.I.04.177, European Commission, DG-Joint Research Centre. Ispra.
CEC. (2004). "COM(2004)472 final: Flood risk management - Flood prevention, protection and mitigation". Commission of the European Communities, Brussels, 12 July, 2004.
Christensen, J.H., and Christensen, O.B. (2003). "Climate modelling: Severe summertime flooding in Europe". Nature, 421, 805-806.
City Council of Prague. (2005). "Strategic plan for The City of Prague". City Council of Prague. Prague. Available at: http://www.praha-mesto.cz.
Clarke, K.C., Hoppen, S., and Gaydos, L. (1997). "A self-modifying cellular automaton model of historical urbanization in the San Francisco Bay area". Environment and Planning B: Planning and Design, 24, 247-261.
Clarke, K.C., and Gaydos, L. (1998). "Loose coupling a cellular automata model and GIS: long-term growth prediction for San Francisco and Washington/Baltimore". International Journal of Geographical Information Science, 12, 699-714.
48
Couclelis, H. (1986). "Artificial intelligence in geography: conjectures on the shape of the things to come". The Professional Geographer, 38, 1-11.
Couclelis, H. (1988). "Of mice and men: what rodent populations can teach us about complex spatial dynamics". Environment and Planning A, 20, 99-109.
Demicheli, L., Lavalle, C., Barredo, J.I., McCormick, N., Kasanko, M., and Sagris, V. (2003). "Creation of territorial and environmental data sets for the County of Harjuma and the transport corridor Tallinn-Pärnu". European Commission, DG-Joint Research Centre. Ispra.
EEA. (2002). "Environmental Signals 2002, Environmental assessment report 9". European Environment Agency (EEA), Office for Official Publications of the European Communities. Luxembourg.
EEA. (2004). "Environmental Signals 2004". European Environment Agency (EEA), Office for Official Publications of the European Communities. Luxembourg.
EEA. (2005). "European Environmental Outlook". No 4/2005, European Environment Agency (EEA), Office for Official Publications of the European Communities. Luxembourg.
Fotheringham, A.S., and Wegener, M. (2000). Spatial Models and GIS: New Potential and New Models, Taylor and Francis London.
Glass, L. (2001). "Synchronization and rhythmic processes in physiology". Nature, 410, 277-284.
IÖR. (1997). "Euroregion Elbe/Labe – Fallstudie". Institut für Ökologische Raumentwicklung. Dresden. Available at: http://www.ioer.de/PLAIN/er_elbe1.htm.
Kahn, H., and Wiener, A.J. (1967). The Year 2000: A framework of Speculation on the Next Thirty Years, Macmillan, New York.
Kasanko, M., Barredo, J.I., Lavalle, C., McCormick, N., Demicheli, L., Sagris, V., and Brezger, A. (in press). "Are European cities becoming dispersed?: A comparative analysis of 15 European urban areas". Landscape and Urban Planning, In Press, Corrected Proof.
Klein, J., and Nicholls, R. (1999). "Assessment of Coastal Vulnerability to Climate Change". Ambio, 28(2), 182-187.
Klein, J. (2004). "GIS-based Impact Assessment of Sea Level rise on the City of Pärnu, Estonia". Diploma thesis, University of Stuttgart, Stuttgart.
Kleiner, A. (1996). The Age of Heretics: Heroes, Outlaws, and the Forerunners of Corporate Change, Currency Doubleday, New York.
Klosterman, R.E. (1999). "The what if? collaborative planning support system". environment and Planning B: Planning and Design, 26, 393-408.
Kron, W. (2002). "Flood risk = hazard x exposure x vulnerability". Flood Defence, Wu, e. a., ed., Science Press, New York, 82-97.
Lavalle, C., Barredo, J.I., McCormick, N., Engelen, G., White, R., and Uljee, I. (2004). "The MOLAND model for urban and regional growth forecast - A tool for the definition of sustainable development paths". EUR 21480 EN, European Commission, DG-Joint Research Centre. Ispra.
Lindley, S.J. (2001). "Virtual tools for complex problems: an overview of the AtlasNW regional interactive sustainability atlas for planning for sustainable development ". Impact Assessment and Project Appraisal, 19(2), 141-151.
Martelli, A. (2001). "Scenario building and scenario planning: state of the art and prospects of evolution". Future Research Quarterly, 17(2), n.a.
May, R.M. (1976). "Simple mathematical models with very complicated dynamics". Nature, 264, 459-467.
49
Meier, H.E.M., Broman, B., and Kjellström, H. (2004). "Simulated sea level in past and future climates of the Baltic Sea". Climate Research, 27(1), 59-75.
Mietzner, D., and Reger, G. (2004). "Scenario Apporaches – History, Differences, Advantages and Disadvantages". EU-US Seminar: New Technology Foresight, Forecasting & Assessment Methods, Seville.
MOLAND. (2002). "Final Report on Project MOLAND: Development of reference and historical databases for the Region Friuli-Venezia Giulia (Contract Nr. 18332-2001-08 F1SC ISP IT)". European Commission, Directorate-General Joint Research Centre. Ispra.
MURBANDY. (1999a). "Final Report on Project: Murbandy Change - Prague and Bratislava. Development of Land Use Databases for the Prague Area (CZ)". Contract Nr. 14675-1998-12 F1PC ISP DE, European Commission, DG-Joint Research Centre. Ispra.
MURBANDY. (1999b). "Final Report on Project: Murbandy Change - Dresden. Monitoring Urban Dynamics". Contract Nr. 14672-1998-12 F1PC ISP DE, European Commission, DG-Joint Research Centre. Ispra.
Nijkamp, P., and van de Bergh, J.C.J.M. (1997). "New advances in economic modelling and evaluation of environmental issues". European Journal of Operational Research, 99, 180-196.
Prastacos, P., and Diamandakis, M. (2000). "Applying GIS technology in operational urban models". Spatial Models and GIS, New Potential and New Models, Wegener, M. and Fotheringham, A. S., eds., Taylor and Francis, London, 223-233.
Ravetz, J. (1998). "Integrated assessment models: from global to local". Impact Assessment and Project Appraisal, 16(2), 147-157.
Ravetz, J. (2000). "Predict and provide or imagine or invent?" Town and Country Planning, 69(3), 72-74.
Ravetz, J. (2004). "Rural Futures: Scoping Social Science Research Needs". Scenario Workshop for the Rural Economy & Land Use programme.
Regione Autonoma Friuli-Venezia Giulia. (1997). "Progetto di Piano Territoriale Regionale Generale (PTRG: General regional master plan)". Regione Autonoma Friuli-Venezia Giulia. Trieste.
Regione Autonoma Friuli-Venezia Giulia. (n.a.). "Regione Friuli-Venezia Giulia: La regione in cifre".
Robinson, J. (1990). "Futures under glass: a recipe for people who hate to predict". Futures, 22(9), 820-847.
Schmidt-Thome, P. (2003). "SEAREG – Sea Level Change affecting the Spatial Development in the Baltic Sea region, 1st Progress Report of INTERREG III Project SEAREG". Geological Survey of Finland. Espoo, Finland.
Schwartz, P. (1996). The Art of the Long View, Doubleday, New York. Shearer, A.W. (2005). "Approaching scenario-based studies: three perceptions about the
future and considerations for landscape planning". Environment and Planning B: Planning and Design, 32, 67-87.
Slaughter, R.A. (1995). The Foresight Principle, Adamantine, London. The Future Group. (1994). "Scenarios, AC/UNU Millennium Project". The Future
Group. Tobler, W. (1970). "A computer movie simulating urban growth in the Detroit region".
Economic Geography, 46, 234-240. UN. (2004). "Guidelines for Reducing Flood Losses". United Nations, Available at:
http://www.unisdr.org.
50
Van der Heijden, K. (1996). Scenarios: The Art of Strategic Conversation, Wiley, Chichester.
White, R., and Engelen, G. (1993). "Cellular automata and fractal urban form: a cellular modelling approach to the evolution of urban land-use patterns". Environment and Planning A, 25, 1175-1199.
White, R., Engelen, G., and Uljee, I. (1997). "The use of constrained cellular automata for high-resolution modelling of urban land use dynamics". Environment and Planning B: Planning and Design, 24, 323-343.
White, R., Engelen, C., Uljee, I., Lavalle, C., and Erlich, D. (1999). "Developing an Urban Land Use Simulator for European Cities". 5th EC–GIS workshop, European Communities, Italy.
White, R., and Engelen, G. (2000). "High-resolution integrated modelling of the spatial dynamics of urban and regional systems". Computers, Environment and Urban Systems, 24, 383-400.
Wilson, I. (1998). "Mental Maps of the Future". Learning from the future: competitive foresight scenarios, Fahey, L. and Randall, R., eds., John Wiley, New York, 83-94.
Wollenberg, E., Edmunds, D., and Buck, L. (2000). Anticipating Change: Scenarios as a Tool for Adaptive Forest Management, Centre for International Forestry Research, Bogor, Indonesia.

51
The mission of the Joint Research Centre is to provide customer-driven scientific and technical support for the conception, development, implementation and monitoring of European Union policies. As a service of the European Commission, the JRC functions as a reference centre of science and technology for the Community. Close to the policy-making process, it serves the common interest of the Member States, while being independent of special interests, whether private or national.