Embed Size (px)
Citation preview

Toward A Quantitative Method for AssuringCoordinated Autonomy
CMU-RI-TR-13-12
Sagar Chaki1?, John M. Dolan2, and Joseph Andrew Giampapa1
1 Software Engineering Institute, Carnegie Mellon University,4500 Fifth Avenue, Pittsburgh, PA 15213-2612, USA
[email protected] [email protected]
http://www.sei.cmu.edu/
2 Robotics Institute, Carnegie Mellon University,5000 Forbes Avenue, Pittsburgh, PA 15213-3890, USA
http://www.ri.cmu.edu/
Abstract. One of the biggest obstacles to the procurement and deploy-ment of coordinated autonomous systems is the difficulty of assuringthem, that is, to set and manage their performance expectations. Thisarticle introduces a reliability engineering assurance approach based onprobabilistic model checking. It also introduces two models to guide andextend the reliability engineering approach: (1) a characterization of therange of autonomous coordination phenomena and (2) phases of a coordi-nated mission. Two instances of the models are implemented as discretetime Markov chains (DTMC). Results from in-progress validation exper-iments with robots are reported, as well.
Keywords: quantitative assurance method, coordinated autonomy, human-agent-robot teams, reliability engineering, probabilistic model checking
? Authors are listed alphabetically by last name.
2 Chaki, Dolan, Giampapa
NOTICE
NO WARRANTY. THIS CARNEGIE MELLON UNIVERSITY AND SOFT-WARE ENGINEERING INSTITUTE MATERIAL IS FURNISHED ON AN“AS-IS” BASIS. CARNEGIE MELLON UNIVERSITY MAKES NO WAR-RANTIES OF ANY KIND, EITHER EXPRESSED OR IMPLIED, AS TO ANYMATTER INCLUDING, BUT NOT LIMITED TO, WARRANTY OF FIT-NESS FOR PURPOSE OR MERCHANTABILITY, EXCLUSIVITY, OR RE-SULTS OBTAINED FROM USE OF THE MATERIAL. CARNEGIE MELLONUNIVERSITY DOES NOT MAKE ANY WARRANTY OF ANY KIND WITHRESPECT TO FREEDOM FROM PATENT, TRADEMARK, OR COPYRIGHTINFRINGEMENT.
This material has been approved for public release and unlimited distribution.
Internal use:* Permission to reproduce this material and to prepare derivativeworks from this material for internal use is granted, provided the copyright and“No Warranty” statements are included with all reproductions and derivativeworks.
External use:* This material may be reproduced in its entirety, without modi-fication, and freely distributed in written or electronic form without requestingformal permission.
Permission is required for any other external and/or commercial use. Requestsfor permission should be directed to the Software Engineering Institute at [email protected].*
These restrictions do not apply to U.S. government entities.
Carnegie Mellon R©is registered in the U.S. Patent and Trademark Office byCarnegie Mellon University.
DM-0000174

Table of Contents
Quantitatively Assuring Coordinated Autonomy . . . . . . . . . . . . . . . . . . . . . . 1Chaki, Dolan, Giampapa
List of Figures . . . . . . . . . . . . . . . . . . . . . . . . . . . . . . . . . . . . . . . . . . . . . . . . . . . . 3List of Tables . . . . . . . . . . . . . . . . . . . . . . . . . . . . . . . . . . . . . . . . . . . . . . . . . . . . . 31 Introduction . . . . . . . . . . . . . . . . . . . . . . . . . . . . . . . . . . . . . . . . . . . . . . . . . . . 42 General Model . . . . . . . . . . . . . . . . . . . . . . . . . . . . . . . . . . . . . . . . . . . . . . . . . 53 Reliability Engineering and Analysis Techniques . . . . . . . . . . . . . . . . . . . 104 Probabilistic Model Checking . . . . . . . . . . . . . . . . . . . . . . . . . . . . . . . . . . . . 12
4.1 The Scenario: Robotic Demining . . . . . . . . . . . . . . . . . . . . . . . . . . . . 134.2 Experiments . . . . . . . . . . . . . . . . . . . . . . . . . . . . . . . . . . . . . . . . . . . . . . 174.3 Summary. . . . . . . . . . . . . . . . . . . . . . . . . . . . . . . . . . . . . . . . . . . . . . . . . 19
5 Validation Plan . . . . . . . . . . . . . . . . . . . . . . . . . . . . . . . . . . . . . . . . . . . . . . . . 206 Conclusions . . . . . . . . . . . . . . . . . . . . . . . . . . . . . . . . . . . . . . . . . . . . . . . . . . . 23
List of Figures
1 Autonomous Coordination Phenomena . . . . . . . . . . . . . . . . . . . . . . . . . . . 62 Coordinated Mission Phases . . . . . . . . . . . . . . . . . . . . . . . . . . . . . . . . . . . . . 83 The Bathtub Curve . . . . . . . . . . . . . . . . . . . . . . . . . . . . . . . . . . . . . . . . . . . . . 94 Path followed by robots. . . . . . . . . . . . . . . . . . . . . . . . . . . . . . . . . . . . . . . . . 135 Behavior of a robot in each cell. . . . . . . . . . . . . . . . . . . . . . . . . . . . . . . . . . 146 Wheeled (left) and tracked (right) robots in the arena with a
checkerboard terrain. . . . . . . . . . . . . . . . . . . . . . . . . . . . . . . . . . . . . . . . . . . . 207 Four preliminary performance metrics: turning, mine detection
given drift, left-right drift, and forward-backward drift . . . . . . . . . . . . . . 21
List of Tables
1 Success given coordination C1 and N robots . . . . . . . . . . . . . . . . . . . . . . 172 Coverage given C0 vs. C1 and N robots . . . . . . . . . . . . . . . . . . . . . . . . . . 18

4 Chaki, Dolan, Giampapa
1 Introduction
As autonomous robots and agents become ubiquitous, the range of missions towhich they apply will become more complex, as well. Autonomous robots andsoftware agents, designed with highly specialized capabilities, will be applied totasks that when combined, form more varieties of missions, with greater mis-sion longevity, and in more diverse and dynamic environments. Many forms ofcoordination manage the integration of autonomous systems. They range fromsimple biologically inspired algorithms, to long-term team-oriented contractualcommitments that involve conversations about such coordination elements as theformation of the overall team plan, role assignment, plan execution, monitoring,repair and eventual completion. One of the biggest obstacles to the procurementand deployment of coordinated autonomous systems [1] is the difficulty of as-suring them, that is, to set and manage their performance expectations. Thisarticle introduces a reliability engineering (RE) assurance approach based onprobabilistic model checking. Since reliability engineering has not been previ-ously applied to autonomous coordination, this article suggests two models bywhich RE can be extended. The models can be used to guide the selection ofdimensions and principal components by which reliability models can be derived.
In software engineering, assurance is the means by which one makes claimsabout properties of a system and proves them via reasoned arguments until aknowledgeable reviewer can read the assurance claims and arguments to supportthem and have justified confidence in the expected behaviors of the system [5].Testing and evaluation is a synonym for assurance, but when both terms areused together, assurance usually applies more broadly, referring to any form ofclaim or logical argument that is focused on the system. Quantitative methodsfor assuring systems allow numeric measures to be made of them. Such measuresnot only establish the (non-)existence of the property being tested, but assigna number and scale to the property under consideration so that a comparisonwith other techniques for achieving it can be made. While test suites, arenas andfield tests all provide means of quantitatively evaluating coordinated autonomy,they typically are presented in absence of a comprehensive assurance argument.At industrial robotics conferences, there is general public consensus that nobodyknows how to make such an argument. This article is an attempt at respondingto that problem.
The structure of the article is as follows. Section 2 introduces the models bywhich reliability engineering can accommodate coordinated autonomy. Section 3briefly introduces reliability engineering and analysis techniques of relevance toour problem. Probabilistic model checking is introduced in section 4 and appliedin two instances to our models. Our validation plan is described in section 5 andwe conclude with section 6.

CMU-RI-TR-13-12 5
2 General Model
Autonomy is the property of an entity to have persistent, goal-directed behavior.Goal-directed behavior allows for alternative courses of action to achieve a goalin a dynamic and unpredictable environment. The dynamism and unpredictabil-ity of the environment is what makes autonomous systems challenging to assure,test and evaluate. The persistence ensures that the entity will attempt to achievethe goal as long as it can reason that it has a means of achieving it, or an interestin attempting to do so. The reasoning can involve reliance on commitments fromother entities to assist it. Implicit in this description is the assumption of eitheraltruistic or self-interested cooperation, and that the range of possible actionsand consequences is computable, which implies that assurance claims about au-tonomous systems can be modeled and evaluated. Except when noted, we usethe term autonomous agent, or simply agent to refer to a software autonomousentity, autonomous robot, or human in a limited socio-technical context.
To illustrate, consider the following example of altuistic autonomous cooper-ation. A robot might be capable of lifting a 25kg object as long as the object isno more than 2m in length and 30cm in thickness. If the length and weight ofthe object are doubled, the robot might not attempt to move it without the con-temporaneous commitment from another robot with similar capabilities to helpit move the object. The persistent and goal-directed behaviors are to attemptto move the object as long as the robots believe that it is within their collectivecapability to move it. The altruism is that they have no contract to guarantee areward for self-interested participants.
Coordinated autonomy, used interchangeably with autonomous coordination,ensures that a goal can be achieved collectively by a group: (a) if the goal isachievable through the collective actions of the group and not just by one in-dividual, (b) if individuals of a group can contribute capabilities that can helpachieve the goal — be it by altruism, a form of capability-based coordination[14], or by short-termed service contracts, (c) through plan execution monitoring,which allows either (d) the individual to de-commit from the plan or service con-tract if they deem it is no longer achievable or in their interest, (e) the recruitingof additional individuals to collaborate on a team — possibly by short-termedcontract — or (f) the repair of the team plan, which might involve reassigningroles or adopting another plan altogether. Coordination improves the likelihoodto complete a mission by adding and managing redundancy of the resources usedto achieve it. Coordination facilitates the scalability of additional resources bymanaging them: temporal-spatial localization, collision avoidance, synchronizingpower drives, multi-tasking and parallelizing work. There are many forms of co-ordinated behaviors: more than even the missions or tasks that warrant them.For this, it is impossible to exhaustively enumerate them, but to group theminto broad categories and to show how it is possible to derive variants of thosecategories as the situation warrants.
Fig. 1 illustrates such a grouping and a characterization of the range of au-tonomous coordination phenomena. Inexhaustive, it roughly situates the com-mon forms of coordination that are frequently discussed in the Agents Com-

6 Chaki, Dolan, Giampapa
Fig. 1: Characterization of the Range of Autonomous Coordination Phenomena.CE = coordination element
munity. In the order: bottom, middle/green, top, within the arrow are: (coor-dination artifacts) which implement forms of agent coordination and are oftenimplemented in software for software agents and robots, but are also specified bynorms and policies, (coordination types) as the name suggests, a simple taxon-omy of coordination types, and (participants) the nature of the agents that areparticipants in the coordination. The terminated arrow indicates that there is alimit to the complexity of the spectrum at one end of the range, but limitlesscomplexity at the other end. That is, since the arrow-head includes any numberof social sub-organizations of agents, each can create its own normative spacethat has an impact on individual, peer-to-peer, and group behavior.
The assurance of coordinated autonomy involves making and proving as-surance claims about elements of the coordination artifacts layer. We call thoseelements coordination elements (CEs). Coordination elements are situated in thecoordination artifacts layer, but are generalized by the names of the coordinationtypes in the layer above them. Contributions such as norms and policies fromdisciplines such as Economics, Game Theory and Computational MechanismDesign are accommodated by the coordination artifacts layer.
The brown band beneath the arrow situates two common systems engineeringclassifications, cyber-physical systems (CPSs) and socio-technical systems alongthe same axis, as a way of showing how the coordination maps to the respectivesystems engineering disciplines. Considering a cyber-physical system to be asoftware-driven system that has a closed loop with phenomena in the physicalworld, coordination algorithms on the CPS side of the spectrum will requiremore validation of their physical properties than coordination algorithms onthe socio-technical end of the spectrum. This spectrum illustrates intuitionsfor how to balance the effort of validating any system of agents with physicalcharacteristics against a system of agents that must reason and operate withina complex normative space. If an agent has physical properties, then it is likelythat its principal contribution to the mission has something to do with its abilityto perform a role in the physical world, otherwise the physicality, with all itsattendant requirements for maintenance and spatial location, is unnecessary andthe agent is either opportunistically included in a group or a human. If the modelof its physical execution cannot be validated due to whatever reason(s), then evenif its socio-technical properties can be validated, it is unlikely that the agent will

CMU-RI-TR-13-12 7
be deemed suitable for its mission. The risk is too great that it will not be ableto physically execute its role. The reverse of these conditions, by the same logic,where the CPS model is validated but the socio-technical component is not,may not invalidate the agent for the mission. Norms can be violated even if suchviolations are not welcomed by the other agents, and if the agent fills a criticalphysical role, then it justifies its existence in the group.
Returning to Fig. 1, biologically inspired algorithms (coordination artifacts)such as digital ants, swarms and flocking, are forms of emergent coordination(coordination types), in which the individual entities have no explicit notion ofteamwork but the coordination is in the proverbial “eye of the beholder” as anemergent behavior derived from simpler ones which each agent manifests. Theagents that participate in such forms of coordination may be insects, birds, oreven reactive software and robotic systems (participant layer). The programmer-specified coordination behaviors (coordination artifacts) straddle coordinationtype generalizations of both emergent coordination and structured coordinationelements. Systems that implement structured coordination elements, often soft-ware agents and robots (participant layer) are socially aware of other agents,aware of the infrastructure that allows them to discover other agents, and inter-act with them — often in the roles of providing or receiving services [14] and[12]. As agents in the autonomous coordination system become more self-awareand deliberative about their actions, the coordination elements that result intheir assurable behaviors will more likely be drawn from an action plan library:a metaphorical, if not actual, repository of goal-directed behavior specificationsthat are motivated by normative space as much as by the task to be accom-plished. As the socio-technical complexities increase, so too, is there an increasein the number of multiple and highly-interacting coordination elements which arethe result of exposure to agents from multiple normative groups. The partici-pants for such types of coordinated autonomy will be hybrid human-agent-robotteams [13]. Since humans act in a very complex normative and plan space, theupper bound limit on socio-technical complexity that must be assured will bedetermined by the number of normative and plan space interactions of softwareagents and robots.
The coordination elements to which the research described by this articleapplies are those that are selected by the “Structured CE” coordination type.The main coordination elements around which we focus our assurance argumentsare:
Mission Objective which can include multiple objectives of equal or subordi-nate rank with respect to each other. Mission objectives provide the motiva-tion for quantitative assurance claims and the metrics by which the claimsare assessed.
Operating Context includes the physical, computing, and data communica-tions environments, and other possible influences on the outcome.
Individual Capabilities The union of individual agent capabilities across allmembers of the team must satisfy the requirements of a team plan. The

8 Chaki, Dolan, Giampapa
Fig. 2: State Transition Diagram Illustrating Phases of a Coordinated Mission
quantitative evaluation of individual capabilities will contribute to the eval-uation of the quantitative metrics of the team.
Team Plan includes the roles, or sub-plan assignments to individual teammatesor subgroups thereof, against which the individual capabilities will be eval-uated. As mentioned previously, team plans and roles, as coordination ele-ments, ensure that team scalability can be achieved, as well as remediate forindividual deficiencies at achieving the mission objective.
If the above-specified coordination elements are to be evaluated in the con-text of an entire mission, it is necessary to subdivide the mission into principalphases. The criteria for subdivision is based primarily on notions of the operatingcontext, e.g. terrain, and the anticipated coordination needs for the activity thatwill be performed while in that context. Fig. 2 illustrates our characterizationof a coordinated mission. Not all of the phases will be present in every mission.The following enumerations correspond to the edge labels in the figure.
1. Assembly in a Staging Area The assembly area is an important point in arobotic mission, as it is the closest that the support crews can be to the actualtask area. It provides important logistical support to the deployed roboticteam and access to additional resources, such as off-board computation, sparecomponents and fuel resupply. It is also where the robotic team is assembledand prepared for performing their mission in the task area.
2. Travel to Task Area from the Assembly Area The transit of the autonomousteam to the task area imposes constraints on the mission duration as well ason the spatial orientation of the robots for performing their mission. In thecase of air vehicles, those in the air must loiter until all members of theirsquadron are airborn.
3. Ingress into Task Area & Transition to Physical Roles This is the phasewhen the robots prepare themselves for executing the team plan. It has beendocumented that for some robotic coordination missions this can be a criticalmoment that leads to unexpected team configurations. [9]
4. Performance of Task This can be further decomposed into the followingcoordination elements:(a) Monitor Team Performance Applicable to teams of type, stuctured co-
ordination elements, this activity involves determining if any objectiveswill not be met based on how the team is performing its team task. Ifso, then the following coordination elements may be employed.
(b) Detect Failure The team must agree that there is a failure that needs tobe addressed.
(c) OPT: Repair Typically, this refers to the following activities:

CMU-RI-TR-13-12 9
Fig. 3: The bathtub curve, shown as a long-dashed red line, represents the char-acteristic shape of a reliability model. The dotted horizontal line illustrates arandom and constant failure rate.
– Recruit additional team members, either in substitution or to enrichthe performance of the team, and/or
– Adopt a new team plan, and/or– Reassign roles and transition to them.
(d) Consensual Team Plan Termination This can occur due to a detectedteam failure, or due to completion of the team plan.
5. Travel from Task Area to Departure Corridor This is when the robots leavetheir roles and prepare to leave the task area.
6. Return to Staging Area7. Disassembly
This non-exhaustive characterization identifies a segmentation of team activ-ity in which all physical entities must engage, but also some software agents ata metaphorical level. This segmentation situates some of the coordination ele-ments that are interleaved with actual physical processes. As the activities of theteam evolve toward a predominantly socio-technical nature, other team activi-ties would need to be added to account for more negotiation based on normativereasoning. We do not address that phenomena in this paper.

10 Chaki, Dolan, Giampapa
3 Reliability Engineering and Analysis Techniques
Reliability engineering provides quantitative methods and a precise language formeasuring and discussing reliability [11] [7]. Reliability is the probability that asystem will operate without failure for a given time. Failure is usually defined asthe loss of a function. The hazard rate h(t) is the instantaneous rate of failure ofa component at a given time. A reliability model describes how the hazard ratechanges over time. The characteristic shape of a reliability model, known as thebathtub curve, is represented in Fig. 3, which also illustrates the main phases ofthe reliability model [10]:
A - The burn-in period, or the phase of a component’s life cycle when it failsdue to defects introduced during the manufacturing process,
B - The service life, or the phase that corresponds to the component’s expecteduseful work life,
C - The wearout phase: the part of a component’s life in which failures willoccur due to old age.
Manufacturers typically guarantee the service life of their product, that is,phase “B” of the bathtub curve. In the ideal world, the characteristic shape ofthe service life phase of a product’s reliability model is a constant horizontal linewith 0 failure rate. In reality, the failure rate is non-zero, though it may be verysmall, and will often have a non-zero slope. Since the reliability estimate of aproduct’s service life is dependent on the reliability of its constituent parts, anaccurate predictor of service life will be based on the shortest duration that iscompletely in common with the other interacting components.
Reliability analysis involves employing a collection of techniques for estimat-ing the reliability model. The selection of techniques depend on the goals of theanalysis, which could range from cost-tradeoff analysis to critical failure analysisto determining operating temperatures and durability assessments. The selectionof techniques also depends on the availability of data for a particular component,and how multiple components relate to each other for a particular analysis.
A reliability prediction is a quantitative assessment of the level of reliability,or lack of failure, in the design of a product. Since failure is often defined as alack of function, reliability assessments of a product focus on assessments of eachof its constituent functions. For each product function, studied in turn, it is nec-essary to identify the constituent components that comprise it and contribute toits function. Consequently, one of the first steps to analyzing the reliability of asystem is to construct a functional block diagram, which illustrates the relation-ships among parts, assemblies and subsystems. The functional block diagramshows inputs and outputs but does not usually show how system elements arephysically connected or positioned. From the functional block diagram, a reli-ability block diagram (RBD) is derived. The RBD consists of three basic typesof building blocks: series configurations, parallel configurations, and combina-tions of series and parallel configurations. For each of these configurations, thereliability is calculated as follows:

CMU-RI-TR-13-12 11
Series Configuration The reliability of a system, when all the elements inthe system are in a series, is the product of the individual reliabilities. Alsoknown as “Lusser’s law”, the mathematical model is shown in Eq. (1), below.
RS = R1 ×R2 × . . .×Rn =
n∏i=1
Ri (1)
Active parallel configuration (redundancy) When all system elements areconnected in parallel, on at the same time, and can take over in the eventthat any one element fails3, the easiest way to calculate the reliability of theconfiguration is to determine the probability of all elements failing, and thento subtract this probability from 1. The formula is shown in Eq. (2), below.
RS(t) = 1−([1−R1(t)]×[1−R2(t)]×. . .×[1−Rn(t)]) = 1−n∏
i=1
[1−Ri(t)] (2)
Standby parallel configuration (redundancy) One element is performingthe necessary function and another element must be switched on in the eventof failure. The failure detection, switch, and element that must be switchedon, can each and jointly be a source of failure.4
Combined configuration Any combination of series and the above parallelconfigurations. To calculate the system reliability, first calculate the reliabil-ities of each individual configuration [7].
For the purposes of the quantitative assurance of coordinated autonomy,reliability engineering (RE) techniques are highly relevant but need to be ex-tended. The underlying assumption is that the coordinated autonomous systemwill probably depart from a behavior that is being tested. Reliability engineeringhas the assumption of failure, and offers techniques to quantify its likelihood.Depature from an expected behavior for a coordinated autonomous system canbe construed as a “failure”, but if the system continues to function, provide aservice and make progress toward any mission objectives, it really is not a failure.Failure of coordinated autonomy is not as much a focus of investigation as is theability to identify and quantify differences of behavior. RE is applicable becauseindividual behaviors can be modeled as if they were failures: the system eitherexhibits a specific behavior or it does not. Reliability models must be createdfor each individual autonomous coordination element and then tested for howit manifests itself as a behavior. If the question is to quantify which form ofcoordination element is more advantageous for a mission and context, then itis not important that the estimates of all behaviors sum to a probability of 1.Yet, if the question is to reason that the coordinated autonomous system willnot exhibit unexpected behaviors, then equating the sum of the probabilities of
3 Also known as hot standby.4 The formula for modeling this requires introducing terms that are out of scope with
this article.

12 Chaki, Dolan, Giampapa
all likely behaviors — including an “unknown” and undesired behavior — to 1,will be important and necessitate a different RBD.
The “bathtub” characteristic curve for reliability models is applicable, butto very limited contexts of high detail. Interesting to note is the intuitive andaccepted practice of segmenting reliability model phenomena into phases so asto isolate predictable curves to which useful formulas can be applied. The quan-titative description of coordinated autonomous systems will necessarily involvemany levels of reliability modeling, with many segments that do not correspondto the equivalents of burn-in and wearout phases, although the characteristicsof how power varies over time are likely applicable to describe the performanceof individual robots during a mission.
Other contributions of reliability engineering that can be immediately usedwithout modification are the equations for calculating reliabilities. They offerprecise mathematical models of how to combine reliability measures. But inorder to achieve that precision, they need to be applied to very specific contexts.An initial attempt to apply these mathematical models to coordinated autonomyis presented and discussed in Section 4.
4 Probabilistic Model Checking
Probabilistic model checking (PMC) is an algorithmic approach to decide whethera system S satisfies a property ϕ, denoted by S |= ϕ. The key difference be-tween PMC and classical model checking [3] is that both S and ϕ are stochastic.Specifically, S is expressed as a (dicrete or continuous time) Markov chain, aMarkov decision process (MDP), or a probabilistic timed automaton (PTA).The property is expressed in a probabilistic temporal logic such as probabilisticcomputation tree logic (PCTL) [6]. The model checking algorithm then checkswhether S |= ϕ via exhaustive exploration of the statespace of S.
The advantage of probabilistic model checking (compared to simulation) isits exhaustive nature. Since realistic systems have very large (or even infinite)statespaces, simulation provides low coverage, and therefore a correspondinglyhigher margin of error. In contrast, PMC provides sound and precise results.However, successful application of PMC must overcome the statespace explosionproblem – this is the price paid for being exhaustive. State-of-the-art solutionsrely on two complementary approaches to ameliorate this problem.
First, while modeling the problem, manual abstraction is performed to elim-inate details that are irrelevant to the target property ϕ. Second, modern prob-abilistic model checkers, such as prism [8], use symbolic data structures such asMulti-Terminal Binary Decision Diagrams (MTBDDs) [4] to verify systems withvery large statespaces. In the rest of this section, we explore the efficacy of thesetwo techniques for verifying the quality of distributed coordination algorithmsin multi-agent systems by modeling and verifying a robotic demining scneariousing the prism tool.

CMU-RI-TR-13-12 13
START END START Robot 1 END Robot 4
START Robot 2
END Robot 1
END Robot 2 START Robot 3
END Robot 3
START Robot 4
(a) (b)
Fig. 4: Path followed by robots.
4.1 The Scenario: Robotic Demining
We consider a two-dimensional area (modeled as a 10×10 grid of cells) randomlyseeded with mines. A team of N robots must sweep the area, detect each mine,and either defuse it or (failing which) mark it. The mission succeeds if all minesare detected and defused (or marked) within a specified deadline D. The missionis parameterized not only by N and D, but also the capabilities of each robot,the terrain, and coordination algorithm used by the robots.
We model the system using a discrete time Markov chain (DTMC) and useprism to compute the probability of mission success and expected terrain cov-erage under a variety of mission configurations. We use the results to pose andanswer a number of hypotheses related to mission success and terrain coverage,and the number of robots used. Finally, we discuss possible areas of furture work.
Coordination Algorithms. Recall that N is the total number of robots. We con-sider the following two coordination algorithms:
1. C0: Parallel Independent. Each robot is assigned d 100N e cells to deminea-priori. Each cell is allocated to exactly one robot. Each robot works inde-pendently and stops after demining all the cells allocated to it. This is anoperator defined static coordination scheme.
2. C1: Follow the leader. All N robots move together in a team, with a singleleader in the front and the remaining followers maintaining a fixed distancebehind her. The leader performs mine detection, defusing, and path planning.If the leader is disabled by a mine explosion, one of the followers (decidedby a leader election protocol) takes over as the new leader and continues.
Path Planning. We assume that the robots follow a pre-determined path throughthe grid, as shown in Fig. 4(a). In the case of coordination C0, if N = 1, thenthe single robot follows the path shown in Fig. 4(a). If N > 1, then each robotfollows the same path, but only over the cells allocated to it. We assume that a
14 Chaki, Dolan, Giampapa
INITDONE cells > MAX
DETECT_MINETIMEOUTclock + t_detect
> DEADLINE
BLOWNUP
clock + t_sense· DEADLINEclock+=t_sense
p_explode_detect
DEFUSE1
p_detect_mine
NOT_DETECTED
p_false_neg * 0.5
GOTO_NEXT_CELL
1 - p_false_neg
TIMEOUT
clock + t_defuse1> DEADLINE
clock + t_defuse1 · DEADLINEclock += t_defuse1
DEFUSE2
BLOWNUP
DEFUSE3
clock + t_defuse2 · DEADLINEclock += t_defuse2
p_d2 £ p_ed2
p_false_neg * 0.5failed=true
p_d1 £ (1-p_ed1)
clock + t_defuse2> DEADLINE
clock + t_defuse3 · DEADLINEclock += t_defuse3
p_d2 £ (1-p_ed2)p_d3 £ p_ed3
p_d3 £ (1-p_ed3)
MARK
clock + t_defuse3> DEADLINE
clock + t_mark> DEADLINE
1-p_emclock+=t_mark
p_emclock+=t_mark
p_d1 £ p_ed1
GOTO_NEXT_CELL
cells++
Robot moves to next cell and
repeats from INIT
Robot moves to next cell and
repeats from INIT 12
3
4
5
6
7
8
9
10
11
12
13
14
5
15
17
8 16
18
19
2021
2223
24
2526
27
28
29
30
31
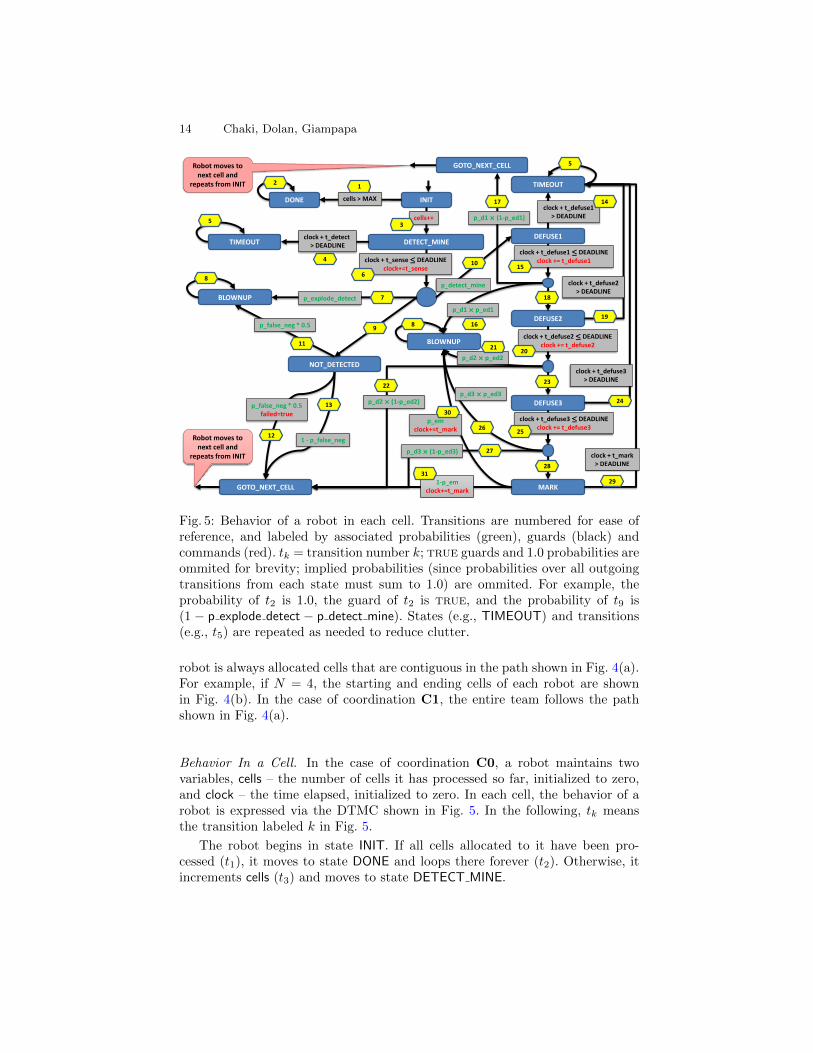
Fig. 5: Behavior of a robot in each cell. Transitions are numbered for ease ofreference, and labeled by associated probabilities (green), guards (black) andcommands (red). tk = transition number k; true guards and 1.0 probabilities areommited for brevity; implied probabilities (since probabilities over all outgoingtransitions from each state must sum to 1.0) are ommited. For example, theprobability of t2 is 1.0, the guard of t2 is true, and the probability of t9 is(1 − p explode detect − p detect mine). States (e.g., TIMEOUT) and transitions(e.g., t5) are repeated as needed to reduce clutter.
robot is always allocated cells that are contiguous in the path shown in Fig. 4(a).For example, if N = 4, the starting and ending cells of each robot are shownin Fig. 4(b). In the case of coordination C1, the entire team follows the pathshown in Fig. 4(a).
Behavior In a Cell. In the case of coordination C0, a robot maintains twovariables, cells – the number of cells it has processed so far, initialized to zero,and clock – the time elapsed, initialized to zero. In each cell, the behavior of arobot is expressed via the DTMC shown in Fig. 5. In the following, tk meansthe transition labeled k in Fig. 5.
The robot begins in state INIT. If all cells allocated to it have been pro-cessed (t1), it moves to state DONE and loops there forever (t2). Otherwise, itincrements cells (t3) and moves to state DETECT MINE.

CMU-RI-TR-13-12 15
From DETECT MINE, it either exceeds the deadline (t4) and loops forever instate TIMEOUT (t5), or proceeds with detecting a mine (t6). The result of minedetection is either an explosion with probability p explode detect (t7), a minefound with probability p detect mine (t10), or no mine found (t9). If there is anexplosion, the robot loops forever in state BLOWNUP (t8).
If no mine was detected (state NOT DETECTED), then we assume that withprobability p false neg, there is actually a mine. In this case, with equal likeli-hood, the robot either explodes (t11) or moves to the next cell (t12). In the lattercase, we indicate mission failure (since a mine has been missed) by setting theflag failed to true. Finally, with probability (1 - p false neg), the robot movesto the next cell (t13), continuing with its mission. The probability p false neg isa function of both the robot’s detecting capability and the terrain, as discussedlater.
If a mine was detected, the robot attempts to defuse it. We assume thatthe robot is in one of three defusing situations with increasing difficulty – easy,medium and hard. Initially (DEFUSE1), the robot assumes that it is in theeasy defusing situation. From this state, it either times out (t14), or updatesits clock and proceeds with the defusing operation (t15). The result is either anexplosion with probability (p d1×p ed1) (t16), successful defusal of the mine withprobability (p d1 × (1 − p ed1)) (t17), or a decision to move on to the mediumdefusal scenario (t18). Here, p d1 is the probability that the robot is actually inan easy defusing situation, and p ed1 is the probability that there is an explosiongiven that the robot is trying to defuse in an easy situation. As discussed later,while p d1 is a function of the terrain, p ed1 is a function of the robot’s defusingcapability.
In the medium defusal scenario (DEFUSE2), the robot either: (a) times out(t19), or (b) updates its clock (t20) and then probabilistically blows up (t21),successfully defuses the mine (t22), or moves to the hard defusal scenario (t23).The probabilities involved in this step are: p d2 – the terrain-dependent proba-bility that the robot is actually in a medium defusing situation, and p ed1 – theprobability (dependendent on the robot’s defusing capability) that there is anexplosion given that the robot is trying to defuse in a medium situation.
In the hard defusal scenario (DEFUSE3), the robot either: (a) times out(t24), or (b) updates its clock (t25) and then probabilistically blows up (t26),successfully defuses the mine (t27), or attempts to mark the cell (t28) as beingmined. The probabilities involved in this step are: p d3 – the terrain-dependentprobability that the robot is actually in a hard defusing situation, and p ed3 –the probability (dependendent on the robot’s defusing capability) that there isan explosion given that the robot is trying to defuse in a hard situation.
Finally, when the robot attempts to mark the cell, it either: (a) times out(t29), or (b) updates its clock and then either blows up (t30) with probabilityp em, or succeeds (t31) and continues to the next cell. The probability p em ofan explosion during the marking operation is a function of the robot’s defusingcapability, as discussed later.
Model Parameters. The DTMC in Fig. 5 is parameterized by the following:

16 Chaki, Dolan, Giampapa
1. The number of robots N . Note that, in Fig. 5, MAX = d 100N e since the cellsare allocated equally to each robot.
2. The deadline D. Note, in Fig. 5, that DEADLINE = D. Depending on theexperiment, D was either fixed or varied.
3. The time required for detecting a mine (t detect), defusing a mine (t defuse1,t defuse2 or t defuse3 depending on the level of difficulty), and to mark a cell(t mark). For our experiments, we assigned them fixed values.
4. The probability (p detect mine) of detecting a mine in a cell. For our exper-iments, this was fixed.
5. The remaining probabilities in Fig. 5 were computed from the terrain andthe robot’s capabilities as discussed next.
Modeling Terrain and Robot Capabilities. The robot’s mine detection capabilitywas modeled by a parameter DET with three possible values – LOW, MEDIUMand HIGH. The robot’s mine defusing capability was modeled by a parameterDEF with three possible values – LOW, MEDIUM and HIGH. The terrain wasmodeled by six independent parameters: (i) p fn dc0, p fn dc1 and p fn dc2 arethe probabilities of a false negative (i.e., mine present but not detected) giventhat DET = LOW, MEDIUM and HIGH, respectively; and (ii) p d1, p d2 andp d3 are the probabilities of being in an easy, medium, or hard defusing situa-tion, respectively. For our experiments, all six terrain parameters were assignedconstant values, but in future experiments we plan to use these to represent theperformance capabilities of individual robots to move precisely over the terrain.
Remaining Probabilities. The probability of a false negative in Fig. 5 are com-puted as follows:
p false neg =
p fn dc0 if DET = LOW,p fn dc1 if DET = MEDIUM,p fn dc2 if DET = HIGH.
The probability of an explosion while detecting a mine is computed as follows:
p explode detect =
10−4 if DET = LOW,10−5 if DET = MEDIUM,10−6 if DET = HIGH.
Finally, the probabilities of an explosion while defusing or marking a cell arecomputed as follows:
p ed1 = p ed2 = p ed3 = p em =
10−2 if DEF = LOW,10−3 if DEF = MEDIUM,10−4 if DEF = HIGH.
Leader Election. In the case of coordination C1, we have the additional complex-ity of electing a new leader in case there is an explosion. To this end, we modifythe model in Fig. 5 as follows. First, we add a variable team sz that indicates

CMU-RI-TR-13-12 17
the current size of the team. We initialize team sz to N , the number of robots.In addition, whenever there is an explosion (i.e., we reach state BLOWNUP inFig. 5), we first check the current value of team sz. If the value is 1 (i.e., the lastrobot exploded), we loop in state BLOWNUP. Otherwise, we either timeout, orwe update the clock (by t elect leader), decrement team sz, and either proceedto the next cell (state GOTO NEXT CELL) with probability p elect leader – thismeans that a new leader was elected successfully – or loop in state BLOWNUP– this means that leader election failed. For our experiments, the paramaterst elect leader (time for leader election) and p elect leader (probability of success-ful leader election) were assigned constant values.
4.2 Experiments
We experimented with two metrics of mission success: (i) succ = probabilityof covering all the cells without blowing up or missing a single mine; (ii) cov= expected number of cells defused or marked. The goal of these experimentsis to demonstrate the suitability of using probabilistic model checking to makeappropriate tradeoff decisions when designing robotic missions, and to form andvalidate specific hypotheses in the context of such missions. All our experimentswere performed on an Intel Core i7 machine with four cores (each running at2.7GHz) and 8GB of RAM. We used prism version 4.0.3, which was the latestversion available at the start of this project. All our prism models, results, aswell as instructions to reproduce them are available at http://goo.gl/nC5DF.
succ
N A0 A1 A2 A3
1 1.51E-05 2.62E-05 0.3659 0.6026
2 1.08E-04 1.72E-04 0.6430 0.7570
3 3.90E-04 5.73E-04 0.7468 0.7766
4 9.57E-04 1.30E-03 0.7724 0.7782
5 1.80E-03 2.29E-03 0.7771 0.7783
6 2.80E-03 3.34E-03 0.7778 0.7783
7 3.77E-03 4.27E-03 0.7779 0.7783
8 4.58E-03 4.96E-03 0.7779 0.7783
9 5.15E-03 5.41E-03 0.7779 0.7783
10 5.51E-03 5.67E-03 0.7779 0.7783
Table 1: Results for succ with increasing N and coordination C1 and the fol-lowing assignments to DET and DEF:A0 = (DET=LOW, DEF=LOW); A1 = (DET=LOW,DEF=HIGH);A2 = (DET=HIGH,DEF=LOW); A3 = (DET=HIGH,DEF=HIGH).

18 Chaki, Dolan, Giampapa
Experiments with succ. Note that if we use coordination C0, increasing N hasno effect on succ. Therefore, we first evaluated the effect of increasing N (from1 to 10) on succ using coordination C1. Table 1 summarizes the results for fourassignments – A0, A1, A2 and A3 – to parameters DET and DEF. In each case,succ increases with N . For both A0 and A1, succ is quite small, and does notseem to saturate even for N = 10. Indeed, the difference between A0 and A1 ismarginal, indicating that an improvement in defusing capability alone providesvery little benefit in terms of mission success. In contrast, for A2, succ is ordersof magnitude higher and seems to saturate around N = 5. This suggests thatimproving a robot’s mine detection capability alone provides a big boost to theprobability of mission success, all else being equal. Finally, even though A2 andA3 saturate to similar succ values, A3 enables us to achieve the same missionsuccess rate using fewer robots. For example, A3 provides 75% mission successwith 2 robots, while A2 only provides this rate with at least 4 robots.
cov
C0 C1
N A0 A1 A2 A3 A0 A1 A2 A3
1 18.089 19.827 70.525 88.362 18.089 19.827 70.525 88.362
2 34.168 36.841 83.646 93.997 35.794 39.022 93.573 99.057
3 45.613 48.455 88.558 95.903 52.427 56.595 98.881 99.931
4 54.998 57.728 91.495 96.997 67.037 71.392 99.813 99.984
5 61.538 64.077 93.184 97.613 78.799 82.646 99.945 99.987
6 66.028 68.388 94.218 97.984 87.380 90.316 99.960 99.987
7 69.289 71.497 94.916 98.233 93.029 94.996 99.962 99.987
8 72.788 74.812 95.620 98.483 96.388 97.559 99.962 99.987
9 74.631 76.551 95.975 98.608 98.195 98.825 99.962 99.987
10 78.522 80.204 96.691 98.859 99.079 99.392 99.962 99.987
Table 2: Results for cov with increasing N and coordination C0 andC1 and the following assignments to DET and DEF: A0 = (DET=LOW,DEF=LOW); A1 = (DET=LOW,DEF=HIGH); A2 = (DET=HIGH,DEF=LOW);A3 = (DET=HIGH,DEF=HIGH).
Experiments with cov. Next, we evaluated the effect of increasing N (from 1to 10) on cov using both coordinations – C0 and C1. Table 2 summarizes theresults for four assignments – A0, A1, A2 and A3 – to parameters DET and DEF.In each case, cov increases with N . In addition, cov increases more if detectioncapability is increased, compared to an increase in defusing capability. This isthe same trend as in the case of succ. Finally, coordination C1 always providesequal or more coverage compared to C0, indicating that the more sophisticatedcoordination embodied by C1 leads to improved coverage (in addition to a higherlikelihood of success, as seen earlier). For example, in the case of A3, both coor-

CMU-RI-TR-13-12 19
dinations provide equal coverage with N = 1. However, the coverage producedwith C1 jumps rapidly to more than 99% with even N = 2. In contrast, thecoverage with C0 ramps up much more slowly, crossing 98% with only N = 7,and never reaching 99%.
4.3 Summary
In this section, we presented an approach that uses probabilistic model check-ing to provide quantitative assurance for a system of coordinated autonomousrobots. We demonstrated our approach by modeling and analysing a roboticdemining scenario using the prism tool. Our results indicate that the approachis promising. Our models are simple, and this enables us to avoid the statespaceexplosion problem. At the same time, the models are rich enough to providequantitative feedback for judging the likelihood of mission success, as well as tomake informed tradeoffs between mission configurations.
Our ongoing and future work is building on this work in several directions.One issue is that our models are based on a-priori probabilities (e.g., the proba-bility of finding a mine in any cell). We assume that these probabilities are avail-able with sufficient accuracy. Otherwise, the predictions made via probabilisticmodel checking will be correspondingly inaccurate. As part of our ongoing work,we are developing ways to estimate these probabilities via field experiments.
Another problem is the fidelity of our models, and the validity of our as-sumptions. For example, we assume that every robot has perfect ability to movebetween cells, and that every robot has identical capability. In practice, theseassumptions may not hold. To address this issue, we are working on making ourmodels richer, while at the same time avoiding the statespace explosion problem.
Finally, the work presented here is non-generative. It does not design anoptimal mission given a set of mission parameters, and associated constraints.It would be interesting to look into whether probabilistic model checking tech-niques can be adapted to create a more generative approach that can handle anexpressive range of mission configurations and constraints.

20 Chaki, Dolan, Giampapa
Fig. 6: Wheeled (left) and tracked (right) robots in the arena with a checkerboardterrain.
5 Validation Plan
Our validation plan is to test our models and the quantitative estimates asso-ciated with the modeled states and state transitions by constructing a varietyof demining robotic missions. Fig. 6 shows our test arena is 108” × 96”, with aprinted “terrain pattern” that can be changed with others, altered with printedoverlays, and arranged with obstacles to simulate a variety of terrain conditions.For the purposes of testing our current set of probabilistic models, the terrainis a printed checkerboard pattern of 17 × 17 squares, each 5” × 5”. A checker-board terrain pattern of 5”×4” provides buffer space to give the robots room tomaneuver without colliding with the protective wooden wall that surrounds thearena. Each square of checkerboard pattern is designed to correspond to one cellof the prism model terrain pattern. The dimension of the cell corresponds to theconfiguration space around an individual robot. Mines are drawn in a square ascolored particle clouds of varying densities to represent mines of diverse difficul-ties to detect and disarm. The best color saturation for a mine is in the center ofthe square. Navigation errors that cause the robot to drive over any part but thecenter of a square increase the likelihood of the robot not detecting the mine,and of possibly detonating it.
Three comodity Mindstorm NXT robots are configured for a coordinateddemining mission. One robot has four wheels, a second has two and a skid, thethird has two tracks. All have a color sensor in the center of their chassis, pointingdownward, to detect mines, a forward-looking optical camera for recognizinglandmarks and other robots, and a forward-looking range-finding IR sensor.
The robots were programmed to follow proposed scan patterns of the terrainso that their performance could be matched with the prism model and encodedto quantify the likelihood of the reproducibility of their behaviors. The twowheeled robots behaved alike and differed somewhat from the tracked robot, but

CMU-RI-TR-13-12 21
(a) (b)
(c) (d)
Fig. 7: Fig. 7a summarizes wheeled vs. tracked performance when turning 90-degrees. Fig. 7b illustrates the probability of detecting a mine due to naviga-tional correctness when moving from one square to the next. Fig. 7c and Fig. 7ddecompose that probability according to the tendency of the robot to drift left-right or over- or under-shoot the 5” distance of moving from one square to thenext. A step corresponds to a “start” followed by the traversal of a variable num-ber of squares, followed by a “stop”. As the summaries indicate, performancesometimes varies according to the number of squares traversed in a step.
all three deviated from their paths very quickly. This is because the mechanicsand control of the robots is very simple — using odometer readings to deadreckon robot location. More sophisticated forms of dead reckoning are plannedfor the future based on [2], but whatever the sophistication of the robot, weknow that the models must account for their imprecisions in whatever form theyappear. A series of atomistic performance tests were run to characterize theirperformance, and are summarized in Fig. 7.
In the first set of characterizing experiments, see Fig. 7a, wheeled and trackedrobots were compared on their ability to execute 90-degree turns. The wheeledrobots demonstrated repeatable and consistent fidelity at turning three consec-utive times without any error. On the fourth turn, a slight error was noticeable,which appeared to accumulate by the same amount — 3.5 degrees from comple-tion — in each successive turn. That is, the fourth turn would be 86.5 degrees,fifth 83 degrees from a right angle, and so-on. The tracked vehicles, on the otherhand, overshoot every turn by approximately 8.5 degrees (e.g. 98.5, 107, 115.5,etc.). For the first missions, each robot must complete two 90-degree turns in

22 Chaki, Dolan, Giampapa
order to move from one scan row to the other. This first evaluation leads one tounderstand that the tracked robots will be very poor performers in being ableto execute their roles in any plan. Nonetheless, this experience revealed that ourprism model must be updated to include performance measures of the robot inthe mechanical execution of all aspects of its role — such as locomotion — andnot just the application-specific aspects of its role, such as mine detection. Ifthe robot cannot reliably navigate a scan path, its role in addressing the overallproblem is similarly limited.
Fig. 7c and 7d summarize the tendencies of the robots to deviate from thecontrolled navigation of a path consisting of a row or column of squares. A stepcorresponds to a “start” followed by the traversal of a variable number of squares,followed by a “stop”. The mechanical inertia of the tracked robots equalizes anydifferences between left and right traction motor start/stop conditions, render-ing the tracked robots the more stable and reliable variety for traversing shortdistances during each step. Due to the large and variable contact area betweenthe tracks and the smooth, flat terrain, vehicles with tracks tend to drift whentraversing more squares during a movement step. Wheeled robots, however, aremore sensitive to differences in drive motor timing, power, encoder errors, andsometimes to the “terrain effects” of the paper terrain pattern pillowing andbunching under the wheels. This causes their motion to vary more widely. Sim-ilarly, wheeled vehicles have more difficulty stopping and frequently roll beyondtheir targeted stopping position, whereas tracked robots “stop dead in theirtracks”. The immediate impact of both forms of drift is that the robot scanscells unevenly, will begin to form holes in its search pattern and not approachthe mine from an angle that will maximize its likelihood of detection. By nothaving a model to indicate the effects of navigation on performance, we crudelymapped such performance characteristics to the metric, the probability of detect-ing a mine given motion drift by the robot. This is summarized by Fig. 7b. Theformula for calculating this metric is:
Pr(d) = 1− |Dlr ×Dfb| (3)
where
Pr(d) is the probability of detecting a mine given left-right and front-back drift in the robot’s motion,
Dlr is the probability of the robot to drift left (-) or right (+), andDfb is the probability of the robot to pass (+) or fall short (-) of its
target travel distance.
The estimates will be applied to the model that is used to calculate the proba-bility of a mine detection in a given terrain square. Their effects are cumulative.

CMU-RI-TR-13-12 23
6 Conclusions
The contribution of this paper is to offer a strategy by which coordinated au-tonomous systems can be assured, tested and evaluated. We do this by adaptingtechniques from the reliability engineering discipline, which offers precise ter-minology and quantitative methods for evaluating reliable system performance.Reliability engineering is a mature discipline and is presently used for assessingcomplex engineered, mission-critical and safety-critical systems, but has not yetbeen applied to coordinated autonomy. We propose models by which reliabilityengineering can be so extended: a characterization of the range of autonomouscoordination phenomena and the phases of a coordinated mission. We imple-mented two instances of those models as discrete time Markov chains (DTMCs)using a novel probabilistic model checking technology, prism. In an effort to val-idate our theoretical models, we began constructing robots and a test arena, andshow how partial results can map to and be used by the probabilistic models. Wedemonstrate by these examples how this technique can be one of the anticipatedand many new techniques that can be used to quantitatively assure coordinatedautonomy.
Acknowledgment
The authors thank David S. Kyle and John F. Porter for their contributions tothis research.
This material is based upon work funded and supported by the Departmentof Defense under Contract No. FA8721-05-C-0003 with Carnegie Mellon Univer-sity for the operation of the Software Engineering Institute, a federally fundedresearch and development center.

24 Chaki, Dolan, Giampapa
References
1. The role of autonomy in DoD systems. Task force report, Department of DefenseDefense Science Board (July 2012)
2. Chong, K.S., Kleeman, L.: Accurate odometry and error modelling for a mobilerobot. In: ICRA. vol. 4, pp. 2783–2788 (1997)
3. Clarke, E.M., Grumberg, O., Peled, D.: Model Checking. MIT Press, Cambridge,MA (2000)
4. Fujita, M., McGeer, P.C., Yang, J.C.Y.: Multi-Terminal Binary Decision Diagrams:An Efficient Data Struct. for Matrix Repres. FMSD 10(2/3), 149–169 (04 1997)
5. Goodenough, J.B.: System of systems software assurance (2 November 2009), www.sei.cmu.edu, accessed 2013-02
6. Hansson, H., Jonsson, B.: A Logic for Reasoning about Time and Reliability. For-mal Aspects of Computing (FACJ) 6(5), 512–535 (December 1994)
7. Headquarters, Department of the Army: Technical Manual No. 5-698-3 (2005),approved for public release: distribution is unlimited, accessed 2013-02
8. Kwiatkowska, M., Norman, G., Parker, D.: PRISM 4.0: Verification of probabilisticreal-time systems. In: (CAV 2011). LNCS, vol. 6806, pp. 585–591. Springer (2011)
9. Scerri, P., Vincent, R., Mailler, R.: Coordination of Large-Scale MASs, chap. Com-paring Three Approaches to Large-Scale Coordination, pp. 53–71. Springer (2006)
10. Stancliff, S.B.: Planning to Fail: Incorporating Reliability into Design and MissionPlanning for Mobile Robots. PhD thesis, RI, CMU (2009)
11. Stancliff, S.B., Dolan, J.M., Trebi-Ollennu, A.: Towards a predictive model of mo-bile robot reliability. TR CMU-RI-TR-05-38, RI, CMU (August 2005)
12. Sycara, K., Giampapa, J.A., Langley, B.K., Paolucci, M.: The RETSINA MAS, acase study. In: SELMAS, vol. LNCS 2603, pp. 232–250. Springer-Verlag (2003)
13. Sycara, K., Lewis, M.: Integrating intelligent agents into human teams. Team Cog-nition: The Factors that Drive Process and Performance pp. 203–232 (2004)
14. Sycara, K., Paolucci, M., Velsen, M.V., Giampapa, J.A.: The RETSINA MASinfrastructure. JAAMAS 7(1), 29–48 (July 2003)