Embed Size (px)
Citation preview

DEA RESEARCH DISCUSSION PAPER Number 15 March 1997
___________________________________________________________________________
Tourists' willingness to pay for wildlife viewing and wildlife conservation in Namibia
J.I. Barnes1, C. Schier2, G. van Rooy2
___________________________________________________________________________
1 WWF LIFE Programme, Directorate of Environmental Affairs, Ministry of Environment and Tourism, 2 Social Sciences Division, Multidisciplinary Research Centre, University of Namibia Directorate of Environmental Affairs Ministry of Environment and Tourism Private Bag 13306 Windhoek, Namibia
This series of Research Discussion Papers is intended to present preliminary, new, or topical information and ideas for discussion and debate. The contents are not necessarily the final views or firm positions of the Ministry of Environment and Tourism. Comments and feedback will be welcomed.

1
___________________________________________________________________________
Abstract A contingent valuation approach was used to survey tourists viewing wildlife in Namibia.
Expenditures on, and willingness to pay for, wildlife viewing trips, park admission, a wildlife
conservation fund and a community fund were elicited. Results indicate that each wildlife
viewing tourist in Namibia in 1995, contributed an estimated N$907 to net national income at
economic prices, or N$250.3 million in aggregate. In addition Namibian tourists benefitted from
consumer surpluses: they were willing to pay N$362 per tourist, or N$30.0 million per annum in
aggregate, more than they actually did pay for wildlife viewing. Foreign wildlife viewing tourists
also experienced consumer surpluses which amounted to N$627 per tourist or N$121.0 million
per annum in aggregate. Ways in which Namibia could extract foreign consumer surplus
warrant investigation. The survey showed that introduction of higher, daily park admission fees
(foreign tourists are willing to pay N$17 per day) could result in the capture of some N$18.2
million per annum. The average tourist is willing to pay N$104 into a wildlife conservation fund
for Namibia. If this could be captured nationally, some N$28.7 million per annum could be
available for investment in the wildlife sector. In addition, the average tourist is willing to pay
N$26 into a community trust fund aimed at furthering community-the welfare of rural
communities in Namibia. If this could be captured, some N$7.2 million per annum could be
available for investment in community development. Prices for use of parks by foreign tourists
should be raised to market levels, while Namibians should receive discounts. A conservation
fund should be established, drawing on donations or levies from tourists, and aimed at funding
wildlife and community-based conservation.
____________________________________________________________________________

2
Table of contents
Page
Abstract 1 1. Introduction 3 2. Methods 4 3. Results 8
3.1 Tourist profiles 8 3.2 Willingness to pay for wildlife viewing visits 8 3.3 Willingness to pay for park entry 11 3.4 Willingness to pay for wildlife conservation 14 3.5 Willingness to pay for community welfare 15
4. Discussion 16 4.1 Willingness to pay for wildlife viewing visits 16 4.2 Willingness to pay for park entry 19 4.3 Willingness to pay for wildlife conservation 21 4.4 Willingness to pay for community welfare 22
5. Policy implications 22 References 23
Tables
Table 1: Main attractions inducing wildlife-based tourism visits in Namibia
(named by 750 tourists surveyed) 9 Table 2: Means for annual incomes, trip expenditures, and estimated cons
-umer surpluses for all wildlife viewing tourists in Namibia and those of Namibian and foreign origin 10
Table 3: Means for annual incomes, trip expenditures, and estimated cons -umer surpluses for foreign wildlife viewing tourists in Namibia of southern African and overseas origin 12
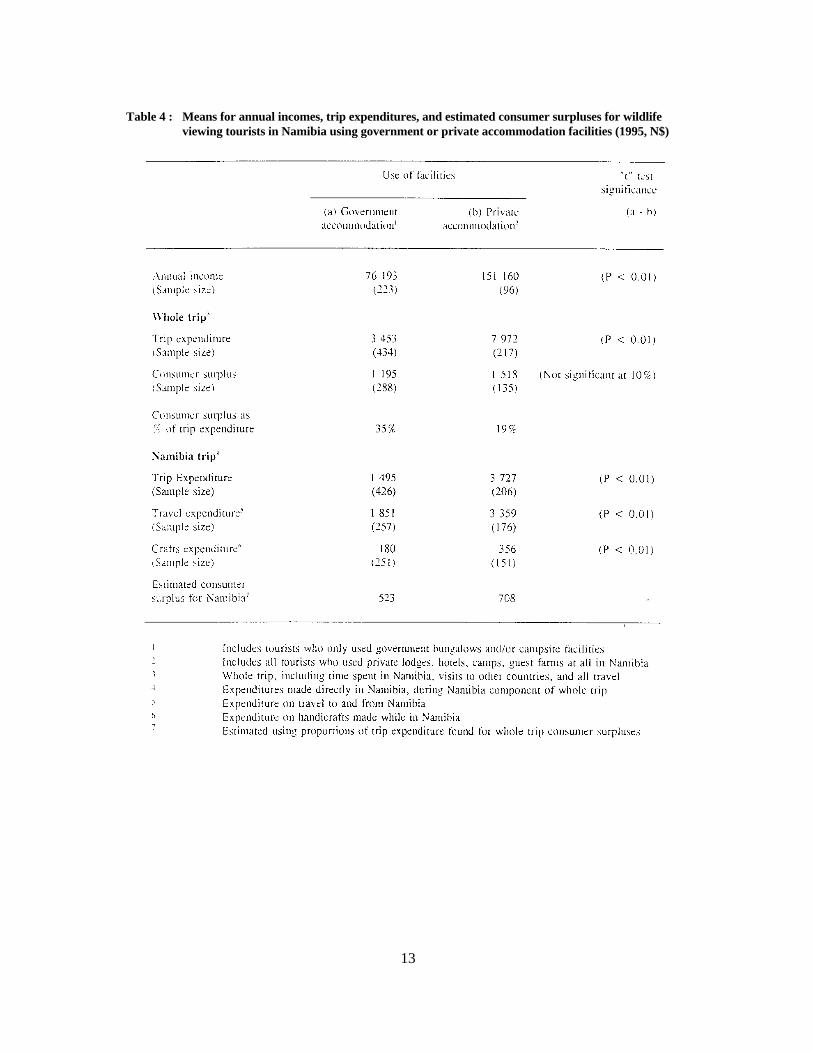
Table 4: Means for annual incomes, trip expenditures, and estimated cons -umer surpluses for wildlife viewing tourists in Namibia using government or private accommodation facilities 13
Table 5: A summary of direct economic use values associated with wildlife viewing tourism in Namibia in 1995 20
Figures
Figure 1: Hypothetical demand and supply functions for wildlife viewing
tourism showing total willingness to pay and it's components 18
Acknowledgements This study was made possible through funding from the United States Agency for International Development (USAID), through the World Wildlife Fund (US) LIFE Programme, under terms of Agreement No. 623-0251-A-00-3135-00. Opinions expressed herein do not necessarily reflect those of USAID. We thank enumerators, S. Nghikembua, H. Mouton, R. Olivier, F. Olivier, M. Morkel, J. Diedericks, E. Xoagus, C. Hagen and B. Bock, who worked on the survey, and all the respondents who completed questionnaires. Caroline Ashley assisted greatly with questionnaire design, enumerator training and comments. Erik Holm-Petersen, Jan-Bjarni Bjarnason, Stephen Turner, Chris Weaver, Chris Brown, all provided valuable advice and support, but any mistakes are our own.

3
Introduction This study was undertaken to determine some characteristics of expenditure and willingness to pay among wildlife viewing tourists in Namibia. The objective was specifically to derive quantitative data on expenditure on, and willingness to pay for, wildlife viewing trips, willingness to pay for park entry and willingness to support wildlife conservation and community-based tourism initiatives. It was also to find out how these data could be used to tailor plans for development of tourism and the supply of tourism services. The study is based on a questionnaire survey carried out among wildlife viewing tourists in Namibia between December 1994 and July 1995. The study complements current work estimating demand functions for tourism. Tourism is one of the most important sectors in the economy of Namibia. It is considered, along with fisheries and fish processing, to be a sector with significant growth potential (Government of the Republic of Namibia 1996). Some 13% of the country is set aside as parks for nature conservation. Wildlife stocks and scenic attributes are considerable, within these protected areas and outside them, on both communal and private land. Within parks, government has provided tourism amenities: including bungalow accommodation and campsites. Outside government-run parks and resorts, the private sector operates guest farm services, lodges and mobile safaris. Namibia's semi-arid to arid climate makes habitats sensitive to over-use by tourists. There is, however, potential for expansion and intensification of wildlife-based tourism on both communal land (Barnes 1995a, 1995b) and in the country as a whole (Hoff and Overgaard, Ltd 1993). While safari hunting is important, most potential involves non-consumptive tourism (Ashley and Barnes 1996). In the past the development of tourism tended to be determined by factors not economic. In 1992/93 the Ministry of Environment and Tourism commissioned a tourism development plan (Hoff and Overgaard, Ltd 1993) and this is in the process of being implemented. Now a framework is being developed for rational, long term decision making, and policy will be influenced by the characteristics of demand for tourism. A knowledge of the willingness to pay among tourists for wildlife viewing and preservation will be of great value in planning investments and pricing in tourism, to ensure optimal allocation of resources. Most research on tourism demand in southern Africa has been focused on the preferences of tourists (Preston and Fuggle 1988; Hoff and Overgaard, Ltd 1993). Wells (1996), in a review of the literature, confirmed that research on the economics of demand for wildlife viewing in Africa has been restricted to a few studies. Brown et al (1994), Moran (1994), and Navrud and Mungatana (1994), all undertook studies in Kenya, using contingent valuation and travel cost methods. They were able to derive estimates of consumer surpluses associated with wildlife viewing trips to Kenya and the Nakuru National Park. Brown et al 1995 and Barnes (1996) undertook studies in Zimbabwe and Botswana, and used travel cost and/or contingent valuation methods to derive estimates of expenditures and consumer surpluses associated with tourists use of parks.
[1] Consumer surplus is the difference between the maximum amount a consumer is willing to pay for a product and what they actually pay - a component of economic value
4
Similarly, little published work exists on the willingness to pay for entry to parks in southern Africa. Jansen (1993) and Barnes (1996) analysed available results, and made limited recommendations. Clark et al (1995) used contingent valuation to determine tourists' willingness to pay for entry to Tarangire National Park in Tanzania. The willingness of tourists to pay for preservation of wildlife and natural features has been studied briefly by Brown and Henry (1990) in Kenya, and in more detail by Holland (1990) and Barnes (1996) within southern Africa. Other studies on the willingness to pay for wildlife preservation include those of Oellerman et al (1993) in relation to a wetland and Turpie (1996) in relation to a nature reserve. There appear to be no published results on the willingness of tourists to pay a premium to assist the development of rural communities in and around the wildlife areas of southern Africa. It must be noted that in this paper we refer to the economic value as opposed to the economic impact of wildlife viewing tourism. Value essentially means all willingness to pay for use and non-use of the resource, exclusive of all economic costs/leakages; while impact means the flows of expenditures through the economy resulting from use of the resource, inclusive of multiplier effects and exclusive of leakages. Tourists' willingness to pay for wildlife viewing tourism is a measure of the direct economic use value of wildlife, as defined within the broader context of total economic value by Pearce and Turner (1990). Direct use values are manifested in income earned through direct use of the resource or environmental asset in question. A tourist's willingness to pay for wildlife conservation can be part of his/her direct use value but can also reflect non-use values. Non-use value (option, bequest and existence value) occurs when someone perceives value in the existence of an asset, even though they might not be making any use of it. Methods In this study a representative selection of visitors using wildlife-based tourism amenities throughout the country was sampled using a questionnaire similar to that used by Barnes (1996) for Botswana. Contingent valuation, as espoused by Mitchell and Carson (1989) was applied. This uses survey questions to elicit peoples' preferences and/or willingness to pay for goods where no markets for them exist or where markets are imperfect. The approach we used to apply contingent valuation is slightly unusual in that it does not involve the currently widely used dichotomous choice method (Brown et al 1994; Moran 1994; Navrud and Mungatana 1994; Brown et al 1995). We used payment card and open-ended approaches to elicit direct measures of each individual respondent's willingness to pay. These have the advantage of not requiring the sophisticated statistical techniques involved when dichotomous choice is applied. We consider our method more appropriate and sufficiently rigorous to assist with the policy questions in hand. Development of the sampling method and the final questionnaire design was based on a similar survey in Botswana during 1992 involving some 200 returns (Barnes 1996), and a pilot survey in Namibia in early 1994, involving 200 distributed questionnaires and 45 returns. During two sampling periods, December 1994 to January 1995, and June to July 1995, a team of six University of Namibia students, specialising in economics or other social sciences, was provided with brief training and deployed in selected tourism destinations. Their task was to distribute questionnaires, to assist respondents where needed, and to collect completed questionnaires. Piles of questionnaires were also left at destinations for distribution to respondents and later mailing in. Sampling was not systematic or random but non-selective at sites, with the aim of obtaining the

5
highest possible number of responses. Stratification of sampling between sites was undertaken to achieve adequate coverage of market segments, including lodge users, bungalow users, campers, tourists from Namibia, overseas, and the southern African region. Sampling took place at government resorts in and outside parks, private lodges or camps on both private and communal (or state) land, and to a lesser extent at community-run campsites on communal land. The Etosha National Park, Namib Naukluft Park, West Coast Tourist Recreation Area, Skeleton Coast Park, Waterberg Plateau Park and Mudumo National Park were covered as well as surrounding land in the Kunene, Tsumeb, Caprivi, Otjozondjupa and Hardap regions. The questionnaire was made available in both English and German. Refusal rate was estimated to be less than 10%. Seven hundred and fifty two usable questionnaires were returned by September 1995, and these were coded and then entered on an SPSS/PC software statistical package for analysis. Data on tourist entry to the country through airport and border post, differentiated by country of origin (Ministry of Environment and Tourism 1995a), combined with data on the ratio of Namibian citizens to foreigners among users of park resorts (Ministry of Environment and Tourism 1995b), were used to weight the data to correct for sample bias. Generally, foreign tourists had been over-represented in the sample. In the questionnaire, respondents were first informed that the Ministry of Environment and Tourism requires information on the demand for tourism to help it effectively plan wildlife and biodiversity conservation and facilitate utilisation of wildlife. Among questions about their origin, the characteristics of their trip, and their preferences, respondents were asked for information on income, expenditures and willingness to pay. All estimates were converted to Namibia dollars (in 1995, N$1.00 was equal to US$0.27). Respondents were asked what their annual income was, what their total holiday was costing, how much of this they were personally spending within Namibia, how much their travel to and from Namibia (by any mode) was costing, and how much they were spending on handicrafts. In the introduction to a section on expenditures respondents were informed that their answers were to assist with planning and could not affect actual prices. To try to determine any consumer surplus being realised by tourists a payment card technique was used to ask respondents what they would be willing to pay for a similar return trip. They were first asked whether their current trip was value for money and then whether they would be willing to return on a similar trip. If they said "yes" (94% did), they were asked to identify the cost level (in relation to their present or actual cost) which would prevent them from returning. If they said "no" they were asked to identify the cost level (also in relation to their actual cost) that would induce them to return. The aggregate of positive differences between willingness to pay for return trips and actual trip cost was taken as an estimate of the actual consumer surplus. Within the sample of tourists some paid park entry and camping fees themselves, while for others these were inclusive in package costs. Similarly, some tourists paid travel costs and accommodation or camping tariffs separately and some paid these as part of a package. The overall trip cost was the only one common to all and most respondents seemed able to make a good estimate of this themselves. Respondents were thus asked first their actual cost and willingness to pay for the overall trip before they were asked to value or comment on specific components of the trip such as travel, park entry or contributions to funds. Other workers,

6
notably in Kenya (Moran 1994; Navrud and Mungatana 1994), also deemed it best to focus on the overall trip cost in their willingness to pay surveys. This approach is thought to reduce the potential for both budget constraint bias (as described by Mitchell and Carson, 1989), and also embedding or part-whole bias (as described by Navrud and Mungatana, 1994). Getting respondents to focus on return trips in their consideration of willingness to pay was thought to reduce confusion between actual and maximum estimates, which might arise if they were to focus on the actual trip. In as much as desire for return trips is likely to be less than that for first time trips the estimates of actual demand and consumer surplus are likely to be conservative. We consider this of value in reducing any effects of avidity bias, as described by Thomson (1991), which might be expected. The way the question was worded (using the words "prevent" and "induce") was thought to reduce the possibility of strategic bias as described by Mitchell and Carson (1989). Using the actual tourism experience as the reference point for the valuation of a return trip was considered to minimise the risk of various forms of miss-specification bias and reduce the risk of other possible sources of bias defined by Mitchell and Carson, such as compliance bias, starting point bias, range bias, relational bias and positional bias. To determine their willingness to pay for park entry, respondents were presented with the relatively high, specific, current daily admission fee to Botswana parks (N$66.00) and asked whether they considered it too high, too low or just right. Then they were asked the same question regarding the relatively low (pre-January 1995) single entry admission fee for Etosha National Park (N$8.00). Next respondents were asked how their visit(s) to Namibian parks would be affected if admission fees were raised to the level of Botswana: whether they would no
[2] Where the respondent answers within a budget constraint which differs from that which the researcher intends to invoke.
[3] Where a respondent values a larger or smaller entity than the researcher's intended good
[4] Where the survey attracts respondents who are more avid or enthusiastic than the average
[5] Where a respondent gives an answer that differs from his/her true amount in an attempt to influence the provision of the good and/or the respondent's level of payment for the good
[6] Biases of this type occur when a respondent does not respond to the correct contingent scenario
[7] Where a respondent gives an answer that differs from his or her true one in an attempt to comply with the presumed expectations of the sponsor/researcher, or to please, or to gain status in the eyes of the researcher/interviewer
[8] Where the elicitation method or payment vehicle directly or indirectly introduces a potential answer that influences the answer given by the respondent
[9] Where the elicitation method presents a range of potential answers that influences the respondent's answer
[10] Where the description of the good presents information about it's relationship to other public or private commodities that influences a respondent's answer
[11] Where the position of, or order in which, different valuation questions for different goods, or levels of a good, suggest to the respondent how those levels should be valued

7
longer visit parks, whether it would not effect their visit(s) or whether it would shorten their stay in the parks, and if so by how much. Respondents who answered "too low" or "too high" with regard to the pre-January 1995, single entry admission fee for Etosha National Park, were asked what amount they thought a fair fee would be in terms of both a single fee (on admission to the park) and daily fee (for each day spent in the park). Initial reference to the relatively high Botswana fee was aimed at reducing the risk of starting point and/or strategic bias. Respondents were informed that Namibia's wildlife was under threat from competing land uses and they were asked whether they would be willing to donate money to a conservation trust fund which would be used directly in conserving and protecting wildlife in Namibia and, if so, how much. If they answered "yes", they were asked whether they would pay once only, each time they came on a trip, or once per year as a membership subscription. All amounts offered with "yes" answers were used to determine the willingness to pay per tourist trip. Under a specific section titled, "local people and tourism" respondents were informed of initiatives to encourage local communities in communal land to be involved in tourism, specifically the development of community-managed campsites and the development of lodges within community-private sector joint ventures, and to derive benefits from these. In view of these initiatives (aimed at enhancing incomes within communities and giving them incentives for wildlife conservation) respondents were asked whether they would be willing to donate money to a community fund which would be used for the benefit of rural people living in the area used by tourists and wildlife. If they answered "yes", they were asked whether they would pay once only, each night they spent in the community area, each time they came on a trip, or once per year as a membership subscription. All amounts offered with "yes" answers were used to determine the willingness to pay per tourist trip. A section in the questionnaire on tourist preferences included a question asking respondents what the main attraction was that had induced them to undertake the trip in Namibia. The open ended nature of this question was considered important in avoiding starting point bias. Respondents were also asked for general comments and whether they would like to receive a summary of the survey results.

8
Results Tourist profiles The composition by origin of the general leisure tourist population (derived from data on airport and border post entry and resort use) between 1992 and 1993 in Namibia was as follows: Namibia, 30%; South Africa, 38%; other Africa (almost exclusively southern Africa), 10%; Germany, 12%; other Europe, 7%; and other (predominantly Australasia and America), 3%. The three main segments by origin: Namibia, southern Africa and Overseas are represented respectively: 30%, 48% and 22%. These proportions were used to weight the data, resulting in the following descriptive statistics. Mean age of respondents was 38 years (n = 740, sd = 13) and 60% were male. The mean duration of their whole trip was 28 days (n = 737, sd = 46). Most (67%) were visiting Namibia only, but the remainder (33%) were also visiting other countries on their trip. Among these 16% were visiting one other and 3% were visiting more than four other countries. The other countries most frequently mentioned as visited were Botswana (26%), Zimbabwe (22%), South Africa (19%) Zambia (6%), Kenya (5%) and Tanzania (3%). Mean number of days spent within Namibia was 17.3 (n = 685, sd = 25). Mean number of days spent within Namibian parks and reserves was 7.4 (n = 584, sd = 48). Mean size of tourist party was 5.7 (n = 693, sd = 28). Among foreign tourists, 26% arrived by air. Within Namibia, 82% of all tourists were self driven, and of these 46% used four wheel drive vehicles. Of all respondents 36% made use of camping facilities only, 24% made use of government bungalows (either exclusively or with camping facilities), and 40% made use of private lodges, hotels, pensions, guest farms and/or safari camps (either exclusively or with bungalows and/or campsites). Of all respondents 96% considered their trip to represent value for money, and 94% said they would return on a similar visit. In the section on preferences, respondents were asked to name the main attraction(s) that had induced them to take the trip in Namibia and produced 977 responses, involving 45 named attractions. Table 1 shows the results which suggest that the naturalness of Namibia's landscapes and wildlife is an important attribute. Willingness to pay for wildlife viewing visits Table 2 shows the means for annual income, trip expenditure and the estimated consumer surpluses among all respondents. Means were calculated after weighting for sample bias and inclusion of zero responses. The mean annual income for all tourists was N$99 524. The mean amount tourists, as individuals, spent on their whole trip was N$4 892. They derived additional benefit (consumer surplus) from their trips of mean amount, N$1 295, or some 26% of their trip cost. Tourist trip expenditures attributable to the Namibia component of their whole trip had an estimated mean of N$2 184, or 45% of their whole trip cost. Among foreign tourists the mean cost of travel to and from Namibia was around N$2 470, or 40% of their whole trip cost. Among all tourists in Namibia expenditure on handicrafts had a mean of N$247, which was some 11% of their cost of trip within Namibia. By direct inference the proportion of consumer surplus attributable to the Namibian component of tourists' trips was calculated at N$568.

9
Table 1 : Main attractions inducing wildlife-based tourism visits in Namibia (named by 752 tourists
surveyed)
Attraction named
No. responses
Percent
Unique, unspoiled nature/landscape
252
26.8%
Wildlife/animals
161
16.5%
Etosha National Park
88
9.0%
Dunes/Namib desert
77
7.9%
Game parks/natural resorts
31
3.2%
Others (40 other attractions: each with < 30 responses)
368
36.6%
Totals
977
100.0%

10
Table 2 : Means for annual incomes, trip expenditures, and estimated consumer surpluses for all wildlife
viewing tourists in Namibia and those of Namibian and foreign origin (1995, N$)

11
Table 2 also shows a comparison between the means for tourists who are Namibian citizens and those who are not. Values for the foreign segment are significantly higher than those for Namibians in all cases. Annual incomes are 1.5 times as high. Whole trip expenditures are more than four times as high (but where costs of travel to and from Namibia are removed this drops to 2.5 times as high). The consumer surplus of foreigners is nearly four times as high as that of Namibians, but as a percentage of whole trip cost it is similar. Within Namibia, foreigners' trip expenditures are nearly two times as high as those of Namibians. Foreigners' expenditure on handicrafts is more than 1.5 times as high as that for Namibians and so is that part of their consumer surplus which is attributable to Namibia. Table 3 shows a comparison between the means for foreign visitors from southern Africa and those from overseas. As might be expected, values for the overseas segment are significantly higher than those for southern African visitors in all cases. Annual incomes are some 1.8 times as high. Whole trip expenditures are more than four times as high even when costs of travel to and from Namibia are removed. The consumer surplus of overseas visitors is over three times as high as that of southern African visitors, but as a percentage of whole trip cost it is lower (23% as opposed to 30%). Given that whole trip expenditure is only 4% of annual income for southern Africans and 8% of annual income for overseas visitors, this is to be expected. Within Namibia, overseas visitors' trip expenditures are 2.5 times as high as those of southern African visitors, and their expenditure on handicrafts is 2.3 times as high. The estimated consumer surplus attributable to Namibia is similar for both segments. Table 4 compares the means for tourists who used government campsites and/or bungalows (but not private accommodation facilities) and tourists who used private accommodation facilities (even though they may have also used government facilities). Apart from the consumer surplus, which does not differ significantly between segments, the mean values for users of private facilities are significantly higher than those for users of government facilities. This is reasonable, since private facilities offer more upscale services at market prices whereas government facilities service the lower end of the market and have subsidised prices. Willingness to pay for park entry Among all respondents a statistically significant majority (73%) considered the Botswana park admission fee for foreign tourists (N$66 per day) too high. Only 3% considered it too low and 24% considered it just right. Conversely, a statistically significant majority (54%, chi-square P < 0.05) considered the Etosha National Park admission fee (N$8 single fee on entry) too low. Only 3% considered it too high and 43% considered it just right. When asked how their visit(s) to Namibian parks would be affected if admission fees were raised to the level of Botswana, 24% of all respondents said they would no longer visit parks, 29% said it would not affect their visit(s) and 47% said it would shorten their stay in the parks, by a mean amount of 51% of days. This response was used to calculate a simple weighted mean of willingness to pay for entry (with the assumption that "no more visits" meant N$0; "no effect on visits" meant N$66; and "shortened visits" meant 51% of N$66, i.e. N$34). The weighted mean was N$35. Respondents who considered the Etosha National Park admission fee too low or too high were asked to suggest appropriate admission fees; first a single fee (on entry) and second a daily fee, for the park. The mean alternative amount suggested for a single admission fee

12
Table 3 : Means for annual incomes, trip expenditures, and estimated consumer surpluses for foreign
wildlife viewing tourists in Namibia of southern African and oversaes origin (1995, N$)
13
Table 4 : Means for annual incomes, trip expenditures, and estimated consumer surpluses for wildlife
viewing tourists in Namibia using government or private accommodation facilities (1995, N$)
14
was N$38 (n = 297, sd = 37). There was no significant difference (P > 0.1) between the mean amount suggested by Namibians and foreign tourists. Among foreign tourists, however, there was a significant difference (P < 0.01) between the mean amount suggested by southern African visitors (N$33, n = 137, sd = 22) and that suggested by overseas visitors (N$53, n = 68, sd = 46). Similarly, among all tourists, there was a significant difference (P < 0.01) between the mean amount offered by tourists using only government accommodation facilities (N$34, n = 183, sd = 32) and those using private accommodation facilities (N$47, n = 108, sd = 45). The mean alternative amount suggested for a daily admission fee was N$24 (n = 274, sd = 33). There was no significant difference (P > 0.1) between the mean amount suggested by Namibians and that suggested by foreign tourists. Similarly among foreign tourists, there was no significant difference between the mean amount suggested by southern African visitors and that suggested by overseas visitors. Furthermore, among all tourists, there was also no significant difference between the mean amount offered by tourists using only government accommodation facilities and those using private accommodation facilities. Of further interest, and in conformation with Botswana results (Barnes, 1996), is the lack of significant difference in mean amount suggested between tourists using government campsites only and those using private accommodation facilities. More useful estimates of mean willingness to pay for park admission are adjusted to also include the 43% of respondents who considered the current admission fee just right. Means for a single fee, thus weighted, are N$25 for all tourists, N$22 for southern African visitors, N$33 for overseas visitors, N$23 for users of government accommodation facilities only, and N$30 for users of private accommodation facilities. The mean amount all tourists were willing to pay for a daily fee, weighted in a similar way, was N$17. Willingness to pay for wildlife conservation Out of all respondents, a statistically significant majority (72%) was willing to contribute to a wildlife conservation trust fund. With the outliers eliminated, the mean amount this majority was willing to pay was N$144 (n = 331, sd = 162). There was no significant difference (P > 0.1) between the mean amount offered by Namibians and foreign tourists. Among foreign tourists, however, there was a significant difference (P < 0.01) between the mean amount offered by southern African visitors (N$114, n = 145, sd = 110) and overseas visitors (N$186, n = 88, sd = 145). Similarly, among all tourists, there was a significant difference (P < 0.01) between the mean amount offered by tourists using only government campsites and/or bungalows (N$122, n = 195, sd = 155) and those using private accommodation facilities (N$182, n = 131, sd = 174). Of further interest, for comparison with the results of Barnes (1996) from Botswana, is a significant difference (P < 0.01) in mean amount offered between tourists using government campsites only (N$124, n = 134, sd = 164) and those using private accommodation facilities (N$182, n = 131, sd = 174). The results from Botswana showed no significant difference in the amount offered between these two categories. A more useful estimate of mean willingness to pay to a conservation fund includes the 28% of respondents who will pay nothing to a fund. The mean, weighted to include non-payers, for all tourists is N$104 and this amounts to 4.8% of their mean trip expenditure (Namibia component). Similarly adjusted means for various segments are N$73 for southern African visitors, N$ 147 for

15
overseas visitors, N$81 for users of government accommodation facilities only, and N$148 for users of private accommodation facilities. As a percentage of their trip expenditure (Namibia component) the adjusted means are 4.2% for southern African visitors, 3.4% for overseas visitors, 5.4% for users of government accommodation facilities only, and 4.0% for users of private accommodation facilities. Willingness to pay for community welfare Out of all respondents, a significant majority (57%) was willing to contribute to a community fund. With the outliers eliminated the mean amount this majority was willing to pay was N$46 (n = 259, sd = 64). There was no significant difference (P > 0.1) between the mean amount offered by Namibians and that of foreign visitors. Among foreign tourists, there was also no significant difference (P > 0.1) between the mean amount offered by southern African and overseas visitors. However, among all tourists, there was a significant difference (P < 0.01) between the mean amount offered by those using only government accommodation facilities (N$36, n = 155, sd = 41) and those using private accommodation facilities (N$65, n = 99, sd = 88). A more useful estimate of the mean willingness to pay includes the 43% respondents who will not pay anything to a fund. The mean, weighted to include non-payers, for all tourists is N$26 and this amounts to 1.2% of their mean trip expenditure (Namibia component). Similarly, adjusted means for various segments are N$19 for users of government accommodation facilities only, and N$42 for users of private accommodation facilities. As a percentage of their trip expenditure (Namibia component) this adjusted mean is 1.3% for users of government accommodation facilities only, and 1.1% for users of private accommodation facilities. A significant majority of all respondents (76%) said they would be willing to stay at a community run campsite. However, only a minority of all respondents (10%) said they would be willing to do so even if it was more expensive than other campsites. Differences in the proportions of respondents not willing to stay in a community campsite, willing to stay but not pay more, and willing to pay a premium to stay, between three different segments: government campsite users, government bungalow users and private accommodation users, were significant (chi-square P < 0.05). The proportion willing to pay a premium on community campsite price varied from 11% among campsite and private accommodation users to 7% among bungalow users. Similarly, a statistically significant majority of all respondents (83%) said they would be willing to stay at a community-private sector joint venture lodge. However, again, only a minority of all respondents (8%) said they would be so even if it was more expensive than other lodges. A chi-square test on the proportions of respondents not willing to stay in a joint venture lodge, those willing to stay in one but not pay more, and those willing to pay a premium, between three different segments: government campsite users, government bungalow users and private accommodation users, was significant (P < 0.05). The proportion willing to pay a premium on community joint venture price was 11% among private accommodation users, 7% among campsite users and 6% among bungalow users.
16
Discussion Willingness to pay for wildlife viewing visits When results from other studies on consumer surplus in southern Africa are adjusted using appropriate exchange and inflation rates, and compared with the data in Tables 2, 3 and 4, several similarities emerge. Brown et al (1995) used completely different methods to measure expenditure and consumer surplus among visitors to Hwange and Mana Pools National Parks in Zimbabwe. They found values for total tourist expenditures and consumer surpluses among visitors from Africa and overseas, that were remarkably similar to those for the two segments in Table 3. They found the region of origin of visitors (African and overseas) to be a statistically significant determinant of value for the consumer surplus. Their estimate of consumer surplus as percentage of total tourist expenditure for all tourists was 23%, again, similar to the 26% in Table 2, above. They also found that consumer surplus as percentage of total tourist expenditure for African visitors was higher (46%) than that for overseas visitors (20%). This pattern is also evident in Table 3. In Botswana, Barnes (1996) in a similar survey, found very similar significant differences in means for annual income and whole trip expenditure between southern African wildlife viewing visitors and those from overseas. The data suggests, however, that in both segments, tourists visiting Botswana are slightly more wealthy, with annual incomes some 1.5 times as high. Consumer surplus for all visitors in Botswana was 17% of whole trip expenditure. This figure was also 17% for both overseas and southern African visitors. It is possible that the relatively high prices for accommodation in both government campsites and private facilities, as well as the high park admission fees, in Botswana are reducing consumer surplus for southern African visitors to Botswana. This is despite the indication that they are wealthier than southern Africans visiting Namibia and Zimbabwe. Moran (1994) used the dichotomous choice method with contingent valuation to estimate consumer surpluses for foreign (nearly all overseas) visitors to protected areas in Kenya. The surplus per trip converts to some N$2 400 in 1995; comparable to our estimate of N$3 050, in Table 3. Turpie (1996) used travel-cost analysis to develop a preliminary demand function for use of the De Hoop Nature Reserve in Western Cape, South Africa. South African nationals made up 78% of the reserve's visitors and their consumer surplus was estimated to be some 55% of their trip expenditures. This lends support to our finding that wildlife viewing tourists of southern African origin enjoy proportionally large consumer surpluses. Gross visitor numbers applied to the results give an indication of aggregate values for wildlife viewing tourism in Namibia. The most recent official annual visitor arrival statistics (Ministry of Environment and Tourism 1995a) record that in 1993, there were 180 955 foreign tourist arrivals in Namibia for leisure, recreation and holiday purposes. Namibian tourists numbered an additional 30%, or 54 287. Statistics recorded by the Resorts Division in the Directorate of Tourism reveal that numbers of tourists booking into accommodation facilities in government-owned resorts grew from 198 000 to 272 000 between 1991 and 1993 (J. Scheepers 1996, pers. comm.). The average growth rate was 8.3%. If, as is likely, the annual visitation numbers for all leisure, recreation and holiday tourists in Namibia continued to grow at this rate then, by 1995, there would have been 275 912, including 193 138 foreigners and 82 774 Namibians. A small proportion of leisure,

17
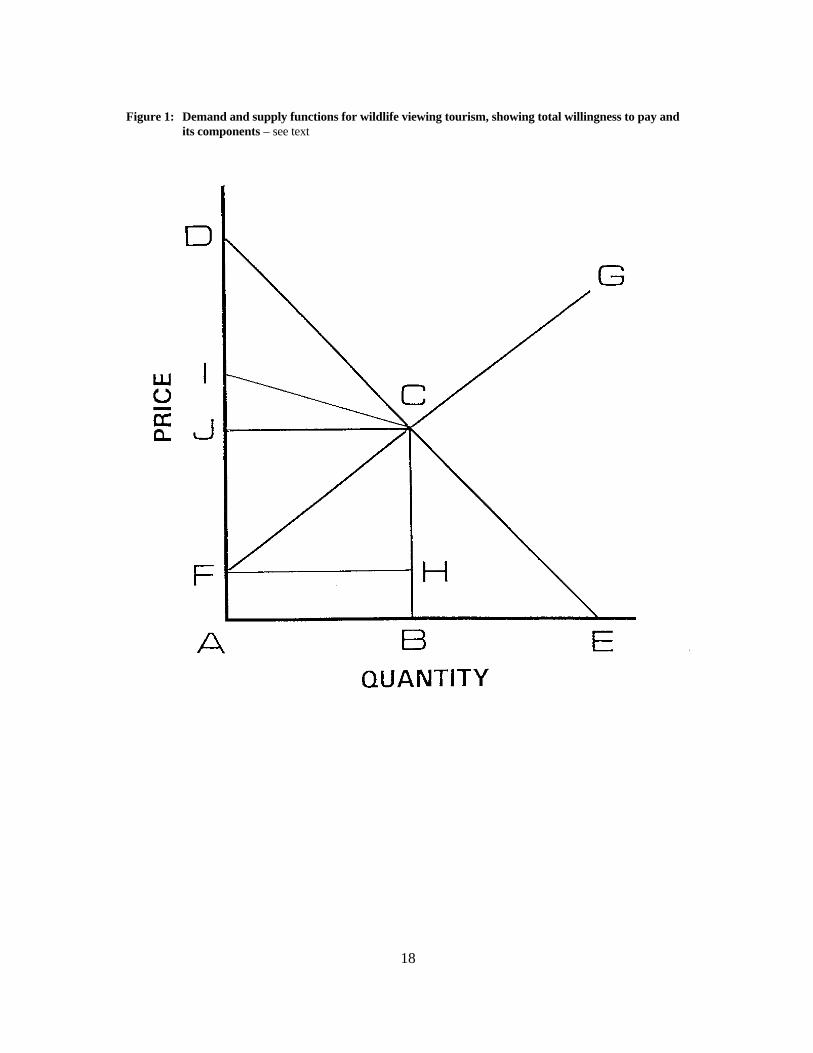
recreation and holiday tourists visit family and friends exclusively and do not engage in wildlife related activities. However, a proportion of the business tourists coming to Namibia also visit wildlife areas, and we consider the numbers of leisure, recreation and holiday tourists to adequately represent the numbers of wildlife viewing tourists. The total tourists' willingness to pay for wildlife viewing in Namibia includes both their expenditures and their consumer surplus associated with the experience. This is a measure of the gross direct economic use value of Namibian wildlife viewing in global terms. A measure of the total economic direct use value of tourism to Namibia is the total tourist expenditure plus Namibian tourists' consumer surplus, less leakage and economic costs of supplying the tourism services. This is similar to the measure described by Brown et al (1995) and Wells (1996), except that we subtract economic production (supply) costs. Detailed financial and economic cost-benefit, investment models developed for private sector and community wildlife-based tourism enterprises (Ashley and Garland 1994; Barnes 1995; Ashley 1995; Barnes and de Jager 1996) estimate gross income for each enterprise and its net contribution to national income, at economic prices. A mean of the net contributions (as percentages of gross income) for eight representative enterprises models (four of lodges on public land, two of lodges on private ranches, and two of community campsites on communal land) was 41%. This percentage is likely to apply to most economic activities associated with tourism, so that of every N$ spent by tourists within Namibia we can assume that some 59% is lost to Namibia as economic costs and/or leakage. The concepts described above are illustrated hypothetically in Figure 1. In the graph in Figure 1, DE represents the demand function, and FG represent the supply function, for Namibia's wildlife viewing tourism industry. C is the equilibrium point at which demand equals supply and the equilibrium number, B, of tourist trips are undertaken for the price J. Total tourist willingness to pay (global direct economic use value) of Namibian wildlife viewing amounts to the area ABCD in the graph. This is made up of actual tourist expenditure (ABCJ) and consumer surplus (JCD). Of the total tourist expenditure, some is lost as income leakage (ABHF) and the economic costs of supplying tourism services (FHC), leaving FCJ as the net contribution to national income. Of the consumer surplus, a part (say JCI) accrues to Namibians, and thus benefits the nation, while another part (say ICD) accrues to foreigners, and is lost to the nation. The total economic benefit for Namibia of its wildlife tourism activities amounts to FCI. If 275 912 tourists each spent N$2 184 in Namibia (Table 2) and each experienced a consumer surplus of N$547 (Table 2), then the total gross global direct economic use value of Namibian wildlife viewing tourism in 1995 was N$753.5 million. The tourists gross expenditures would have been N$602.5 million and their consumer surplus would have been N$ 151.0 million. Of gross expenditures 41%, or N$247.0 million, represents the net annual contribution to Namibia's national income. In accordance with our shadow pricing criteria (described by Barnes & de Jager 1996) we would apply a foreign exchange premium of 6% to all foreign contributions from, and foreign cost/leakages to, countries outside the rand monetary area (the Namibia dollar is on parity with, and freely convertible with the South African rand). The net effect of this adjustment amounts to an additional N$3.3 million per annum. The consumer surplus attributable to foreigners is N$121.0 million per annum, and
18
Figure 1: Demand and supply functions for wildlife viewing tourism, showing total willingness to pay and
its components – see text

19
it represents use value which is lost to the Namibian economy because it does not accrue to nationals. Our estimate of the total economic direct use value of wildlife viewing tourism in 1995 for Namibia is thus N$280.3 million. It is made up of the consumer surplus accruing to Namibians, which amounts to N$30.0 million per annum in aggregate and the N$250.3 million per annum in contribution to national income at economic prices. Mechanisms whereby some of the consumer surplus attributable to foreigners (N$121.0 million) might be captured for Namibia should be examined. Table 5 provides a summary breakdown of some of the values associated with wildlife viewing in 1995 as derived from this study. Willingness to pay for park entry The results of the survey suggest that in 1995 respondents were willing to pay more for admission to parks in Namibia. Their suggestion for an appropriate single fee for Etosha National Park was N$25, representing a three fold increase over 1994 fees. However, they also considered a daily fee of N$17 appropriate. Given the mean number of days spent in parks and game reserves (7.4) this fee would generate N$126 per tourist, and, assuming that the average number of different parks visited by each visitor is 2.5, then this would result in a more than six fold increase over 1994 fees. Clearly a daily fee is preferable. The proposed daily fee of N$17 is notably only a quarter of that currently charged to foreigners in Botswana. Our result may thus reflect some strategic bias. The estimate of foreign tourists who visited parks in 1995 is 193 138. If each of these tourists visited parks for 7.4 days, and the current two tier differential between destinations is retained, then introduction of daily admission fees (of N$17 for Etosha National Park and Sesriem/Sossuvlei, and N$8.50 for other parks/entry points) would allow capture of some N$18.2 million per annum of the foreign consumer surplus referred to above. In Botswana, Barnes (1996) found that demand for park entry through a one-time 900% increase in park admission fees for foreigners, was price inelastic. This meant that growth in tourist numbers was not affected by the price increase. More detailed examination suggested that this applied to overseas visitors, and there was a case for charging a lower fee to southern African visitors. Child and Heath (1990) were of the opinion that the Zimbabwe's state-owned parks and wildlife estate was being undersold to the detriment of investment in the sector. Jansen (1993) after analysis of park entry fees in Zimbabwe suggested increases, the introduction of a daily fee, and also the introduction of a differential between citizens and foreigners. With changes, however, Zimbabwe's park entry fees remain among the lowest in southern Africa. In Tarangire National Park in Tanzania, Clark et al (1995) found that tourists were willing to pay almost double the current level of park entry fees, despite the fact that the current fees are as high as those now applicable in Botswana. In Namibia, we found that the mean daily fees proposed did not differ significantly between tourist categories, which means there is no case for entry price differentiation on willingness to pay grounds. However, we suggest that there is a case for discounts for Namibians, both to foster national conservation sentiment and equity, and because Namibians pay for parks through taxes.
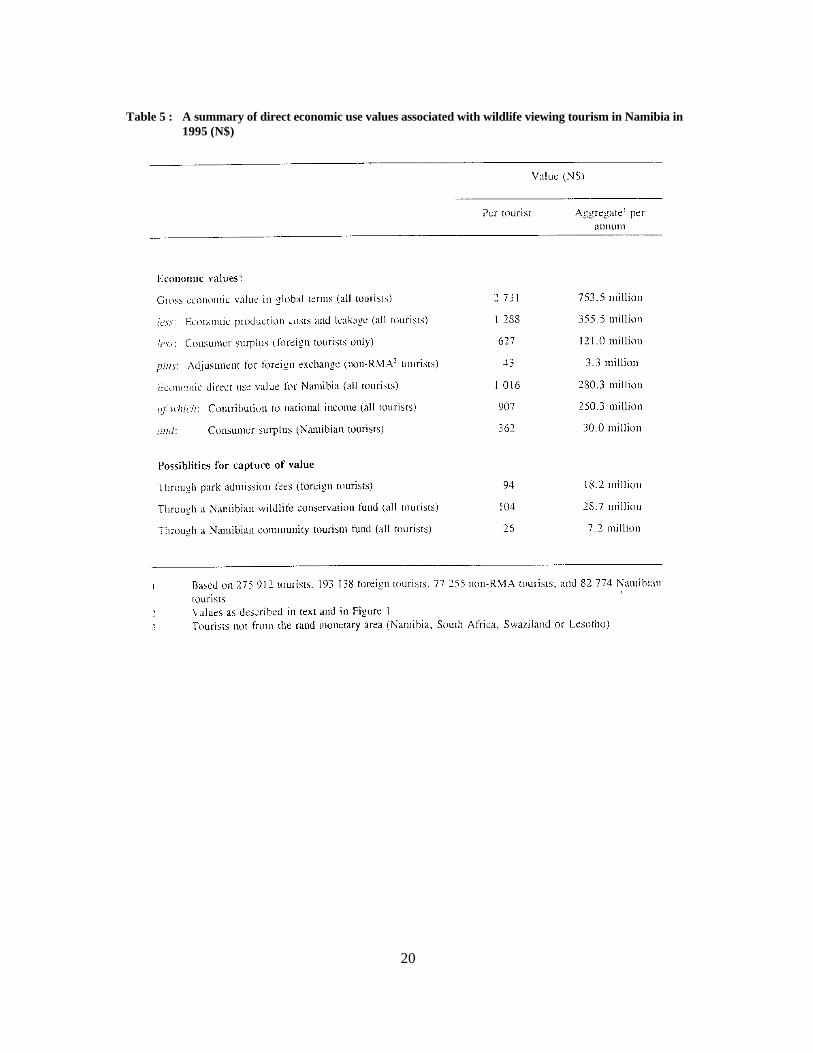
20
Table 5 : A summary of direct economic use values associated with wildlife viewing tourism in Namibia in
1995 (N$)

21
Willingness to pay for wildlife conservation In Botswana, Barnes (1996) found that tourists were willing to donate 4% of their in-country (Botswana) trip expenditure to a conservation fund. For Namibia (this study) the percentage is 4.8%. The Botswana findings show a remarkably consistent pattern when compared with those for Namibia. The willingness to donate as a percentage of Botswana in-country trip costs was, for southern African visitors, 4.6% (Namibia = 4.2%), for overseas visitors 3.8% (Namibia = 3.4%), for government accommodation users, 6.1% (Namibia = 5.4%), and for private accommodation users 3% (Namibia = 4%). As stated, within the framework of total economic value (Pearce and Turner 1990), natural resources are recognised as having direct use value, option value and existence value (among others). The latter two are termed non-use or preservation values since they are not associated with use of the resource but are commonly reflected as willingness to pay for it's preservation. Tourists' consumer surplus is direct use value in that tourists will pay it for use of the resource, but tourists' willingness to donate to a conservation fund can be considered to be primarily non-use or preservation value. Donations to a conservation fund may, to an unknown extent, come out of (i.e. reduce) a tourist's consumer surplus. In any case they represent value not captured by Namibia. Some research on natural resource preservation values has been done in South Africa. Oellermann et al (1994) used a bidding technique to survey the willingness to pay to prevent flooding of the small Wakkerstroom wetland in Mpumalanga province, South Africa, among 50 members of the local Wakkerstroom Natural Heritage Association. Median willingness to pay for option values was between N$17 and N$20 per month. For existence and bequest the median willingness to pay was between N$15 and N$17.50 per month. There was a positive relationship between willingness to pay and income levels, and a negative relationship between willingness to pay and family size. Holland (1993) conducted a detailed survey of 246 visitors to four protected areas (recreation areas and game reserves) in KwaZulu-Natal Province, South Africa, using a bidding technique to elicit their preservation values for the sites. For one of these sites (Royal Natal National Park) results indicated that visitors were willing to pay N$15, N$12, and N$12 per month to a fund for the option to use, bequest value and existence (respectively) of this park. The total annual non-use value perceived by visitors was calculated to be N$389,000, and this amounted to N$43 per hectare of park, or N$4 300 per square kilometre. Turpie (1996) reported on a contingent valuation study in which willingness to pay for preservation of the De Hoop Nature reserve in Western Cape, South Africa was solcited from local and provincial capital residents. The annual non-use value for the reserve was estimated to be N$724 000 in the local population near the reserve, and N$13 389 000 for the city of Cape Town. The study showed interesting patterns of variation in respondents' willingness to pay, according to their locality, ethnicity and levels of information/experience about the reserve. Our finding here is that wildlife preservation value among tourists amounts to some N$28.7 million (275 912 tourists @ N$104 each) per annum and that values per tourist are highest among

22
overseas visitors and those who make use of private facilities. It behoves Namibia to try and capture this value for investment in the wildlife sector. Willingness to pay for community welfare The results indicate that the current population of tourists is less willing to pay for community welfare and development than it is for wildlife conservation. Without rural development, wildlife is unlikely to survive on communal land in Namibia, so that to some extent tourists may perceive their offers for this fund as representing wildlife preservation value. On the other hand their offers may be motivated simply by sentiment for development. The values offered by tourists may have been influenced by positional bias as described above, because in the survey the question on a community fund followed that relating to a conservation fund. Offers might have been higher if the sequence was reversed. In any case the aggregate value amounts to some N$7.2 million per annum and this is value not currently captured by Namibia. Development of community-run campsites and community-private sector joint ventures carries significant transaction costs (Ashley and Garland 1994). The extent to which these can be recovered through the market, with a premium on price for these facilities, is limited at present. We suggest, however, that with information and marketing, tourists' willingness to pay for community projects can be enhanced. Policy implications Namibia derives considerable direct use value from its wildlife and wildland resources. It stands to gain still more through the development of appropriate mechanisms to capture consumer surplus and non-use value among visiting wildlife viewing tourists. There are several ways in which this can be achieved and wildlife viewing tourism in Namibia can be made more economically efficient. - Prices for government accommodation facilities should be raised to market levels, at least for foreign tourists and at least for the higher value products which tend to compete with private facilities. This would allow the capture for Namibia of some of the foreign consumer surplus referred to above. - Daily fees for park admission should be introduced at levels suggested by the results of survey with Namibians eligible for discounts. There is no evidence to suggest that admission fees should be differentiated between tourists of southern African and overseas origin. - A conservation fund should be established and a mechanism developed to draw donations or levies from tourists for the fund. A similar fund aimed at community development through tourism should be developed, or combined with the conservation fund. The results suggest that if levies are used there is some scope for application of differentials between tourists categories. Levies might thus be higher for users of government accommodation facilities than for users of private ones.
23
References Ashley, C. 1995. Tourism, communities, and the potential impacts on local incomes and conservation. Research Discussion Paper No. 10, Directorate of Environmental Affairs, Ministry of Environment and Tourism, Windhoek, Namibia. 50pp. Ashley, C. & Barnes, J. 1996. Wildlife use for economic gain: the potential for wildlife to contribute to development in Namibia. In: Smith, F.D.M. (Ed.). Environmental sustainability: practical global implications. St. Lucie Press, Delray Beach, Florida, USA (in press). 24pp. Ashley, C. & Garland, E. 1994. Promoting community-based tourism development: why, what and how?. Research Discussion Paper No. 4, Directorate of Environmental Affairs, Ministry of Environment and Tourism. 54pp. Barnes, J.I. 1995a. Current and potential use values for natural resources in some Namibian communal areas: a planning tool. Unpublished Working Document, Directorate of Environmental Affairs, Ministry of Environment and Tourism, Windhoek, Namibia. 60pp. Barnes, J.I. 1995b. The value of non-agricultural land use in some Namibian communal areas: a data base for planning. Research Discussion Paper No. 6, Directorate of Environmental Affairs, Ministry of Environment and Tourism, Windhoek, Namibia. 21pp. Barnes, J.I. 1996. Economic characteristics of the demand for wildlife viewing tourism in Botswana. Development Southern Africa 13: 377-397. Barnes, J.I. & de Jager, J.L.V. 1996. Economic and financial incentives for wildlife use on private land in Namibia and the implications for policy. South African Journal of Wildlife Research 26: 37-46. Brown, G. & Henry, W., 1990. The economic value of elephants. LEEC Paper No. 89-12, London: IIED/UCL London Environmental Economics Centre. Brown, G., Ward, M. & Jansen, D.J. 1995. Economic value of national parks in Zimbabwe: Hwange and Mana Pools. ZWLMEC Project Report, World Bank, Washington, DC, USA. 55pp. Brown, G., Swanson, T., Ward, M. & Moran, D., 1994. Optimally pricing game parks in Kenya. London: Centre for Social and Economic Research on the Global Environment (CSERGE), University College, University of London. Child, G.F.T. & Heath, R.A., 1990. Underselling national parks in Zimbabwe: the implications for rural sustainability. Society and Natural Resources, 3: 215-227. Clark, C., Davenport, L. and Mkanga, P. 1995. Designing policies for setting park user fees and allocating proceeds among stakeholders: the case of Tarangire National Park Tanzania. Unpublished Paper, World Bank, Washington, DC, USA. 115pp. Government of the Republic of Namibia. 1996. First National Development Plan: 1995/1996 - 1999/2000 (NDP1) (2 volumes). National Planning Commission, Windhoek, Namibia. 846pp. Hoff and Overgaard, Ltd. 1993. Namibia tourism development study (3 volumes). Ministry of Wildlife, Conservation and Tourism and Commission of the European Communities, Windhoek, Namibia. 388pp. Holland, J.D. 1993. A determination and analysis of preservation values for protected areas. Ph.D. Thesis, Department of Economics, University of Natal, Pietermaritzburg, South Africa. 217pp. Jansen, D.J. 1993. Investigation and recommendations on access, pricing and control over resources and services of Dept. of National Parks and Wildlife Management (DNPWM). Unpublished Report, Wildlife Management and Environmental Conservation Project, Ministry of Environment and Tourism, Harare, Zimbabwe. 73pp.

24
Ministry of Environment and Tourism. 1995a. Annual visitor arrival statistics, 1993. Policy, Planning and Management Information Unit, Directorate of Tourism, Ministry of Environment and Tourism, Windhoek, Namibia. 23pp. Ministry of Environment and Tourism. 1995b. Annual accommodation statistics, 1994. Policy, Planning and Management Information Unit, Directorate of Tourism, Ministry of Environment and Tourism, Windhoek, Namibia. 42pp. Mitchell, R.C. & Carson, R.T., 1989. Using surveys to value public goods: the contingent valuation method. Washington, DC: Resources For The Future. Moran, D., 1994. Contingent valuation and biodiversity: measuring the user surplus of Kenyan protected areas. Biodiversity and Conservation 3: 663-684. Navrud, S. & Mungatana, E.D., 1994. Environmental valuation in developing countries: the recreational value of wildlife viewing. Ecological Economics, 11: 135-151. Oellermann, R.G., Darroch, D.A.G. & Klug, J.R. 1994. Valuing preferences for wetland preservation: a Wakkerstroom case study. African Journal of Range and Forage Science 11: 89-95. Pearce, D.W. & Turner, R.K. 1990. Economics of natural resources and the environment. Harvester Wheatsleaf, London, UK. 378pp. Preston, G.R. & Fuggle, R.F. 1988. Profiles and preferences of visitors to three South African nature reserves. South African Journal of Wildlife Research 18: 1-5. Thomson, C.J. 1991. Effects of the avidity bias on survey estimates of fishing effort and economic values. American Fisheries Society Symposium 12: 356-366. Turpie, J.K. 1996. A preliminary economic assessment of De Hoop Nature Reserve. Unpublished Paper, Fitzpatrick Institute, University of Cape Town, Cape Town, South Africa. 91pp. Wells, M.P. 1996. Economic perspectives on nature tourism, conservation and development: a literature review (preliminary draft). Environmental Economics and Pollution Division, Environment Department, The World Bank, Washington, DC, USA. 40pp.