Embed Size (px)
Citation preview

WP/09/176
Tourism Specialization and Economic Development: Evidence from the UNESCO World Heritage List
Rabah Arezki, Reda Cherif, and John Piotrowski

© 2009 International Monetary Fund WP/09/176 IMF Working Paper IMF Institute and Fiscal Affairs Department
Tourism Specialization and Economic Development : Evidence from the UNESCO World Heritage List
Prepared by Rabah Arezki, Reda Cherif, and John Piotrowski 1
Authorized for distribution by Marc Quintyn, Mark Horton, and Robert Gillingham
July 2009
Abstract
This Working Paper should not be reported as representing the views of the IMF. The views expressed in this Working Paper are those of the author(s) and do not necessarily represent those of the IMF or IMF policy. Working Papers describe research in progress by the author(s) and are published to elicit comments and to further debate.
The present paper investigates whether tourism specialization is a viable strategy for development. We estimate standard growth equations augmented with a variable measuring tourism specialization using instrumental variables techniques for a large cross-section of countries for the period 1980–2002. We introduce an instrument for tourism based on the UNESCO World Heritage List. We find that there is a positive relationship between the extent of tourism specialization and economic growth. An increase of one standard deviation in the share of tourism in exports leads to about 0.5 percentage point in additional annual growth, everything else being constant. Our result holds against a large array of robustness checks. JEL Classification Numbers: C21, C82, O11, O41 Keywords: Tourism, economic development and growth and instrumental variables Authors’ E-Mail Addresses: [email protected] ; [email protected] ; [email protected]
1 The authors wish to thank Daron Acemoglu, Thomas Chaney, Decio Coviello, Pierangelo De Pace, Fuad Hasanov, Camelia Minoiu, and Xavier Sala-i-Martin for stimulating discussions and helpful comments. We also thank Mileva Radisavljević and Latoya McDonald for editorial assistance. All remaining errors are ours.

2
Contents Page
I. Introduction ............................................................................................................................3
II. UNESCO World Heritage List as An Instrument for Tourism Specialization .....................5
III. Empirical Investigation......................................................................................................10 A. Data and Specification ............................................................................................10 B. Results .....................................................................................................................11 C. Robustness...............................................................................................................14
IV. Conclusion .........................................................................................................................16 Tables 1. Regional and Historical Distribution of World Heritage Sites (2002) ..................................8 2. Correlation Between Total UNESCO World Heritage Sites and Average UN Voting Coincidence, 1980–2000........................................................................................................9 3. Benchmark Regressions.......................................................................................................13 Figures 1. Economic Growth and Tourism Specialization .....................................................................3 2. UNESCO World Heritage Around the World .......................................................................6 Appendixes I. Data Description and Sources..............................................................................................17 II. Additional Robustness Checks............................................................................................19 Appendix Tables 1. Data Description ..................................................................................................................17 2. Countries Included in the Sample ........................................................................................18 3. Robustness using Various WHL..........................................................................................19 4. Robustness to Using Only Cultural Sites.............................................................................19 5. Robustness to Removing various Centuries from the WHL................................................20 6. Robustness to Using Additional Instruments for Tourism ..................................................20 7. Robustness to using Different Measures of GDP ................................................................21 References................................................................................................................................22

3
I. INTRODUCTION
During the past few decades, many countries have embarked in tourism-oriented policies. Inspired by a number of success stories attributed to tourism specialization, more and more developing countries, including Sub-Saharan African countries, are contemplating such a strategy in order to emerge from the development trap. Figure 1 suggests that there exists a positive relationship between the extent of specialization in tourism and long-term GDP growth.2 This paper tackles a fundamental question in assessing the impact of tourism specialization on economic development. It quantifies the apparent positive relationship in Figure 1 and corrects for bias arising from potential endogeneity in a growth regression that includes tourism specialization.
Figure 1. Economic Growth and Tourism Specialization
-50
5A
vera
ge
Ann
ual G
DP
Gro
wth
(A
vera
ge
ove
r 1
980-
200
2)
0 20 40 60 80Tourism receipt in % Exports ( Average over 1980 - 1990 )
Source: World Bank (2008)
2
0.036x+0.576
R 0.06
y
According to the literature on economic growth and tourism, international tourism may affect growth through several channels beyond the direct revenues from receipts. The foreign direct investment (FDI) associated with tourism can bring managerial skills and technology with
2 The coefficient of correllation associated with Figure 1 is equal to 0.27.

4
potential spillover benefits to other sectors.3 Policies designed to foster tourism, by improving security, stability, and openness, can also enhance growth in other sectors. On the other hand, an expansion of the tourism sector may increase the relative price of nontraded goods, crowding out the factors of production at the expense of the traded goods sector, a phenomenon known as “Dutch disease” (Copeland, 1991 and Chao et al., 2006). More generally, earlier literature on service activities and economic growth suggests that increased services specialization may diminish productivity growth, as resources shift towards this technologically stagnant sector (Baumol, 1967). Some authors have argued that many services are essential intermediate goods, producing positive spillovers and facilitating economic growth (Oulton, 2001). Recently, Acemoglu and Guerrieri (2008) build on the nonbalanced growth literature. They propose a two-sector model where the more capitalistic sector grows faster than the rest of the economy, but because the relative prices move against this sector, its price-weighted value grows slower than the rest of the economy. Empirical studies that investigate the impact of tourism on growth generally find a positive correlation between tourism receipts and the growth rate, especially for poor countries (Sequeria and Nunes, 2008). Most of these studies exploit the time-series variation. We choose to focus instead on the long-term growth of a large cross-section of countries.4 Furthermore, to our knowledge, no study provides a valid instrument to correct the potential endogeneity of the level of tourism specialization in growth regressions. We argue that not addressing this issue could bias the estimation of the coefficient associated with tourism in growth regressions. Unobservable variables like managerial skills, that are crucial inputs in tourism activities, could directly explain both high economic growth and a high level of tourism. This would lead to an upward bias in the estimation of the impact of tourism specialization on economic growth. Moreover, security and health issues, such as political instability, criminality and malaria, are detrimental to both tourism and growth. While associated proxy variables could be controlled, limited data availability for a large cross-section and significant measurements errors (especially in the measurement of institutional quality) could lead to even more bias. This paper fills the gap in the existing literature by providing an instrument to address potential endogeneity issues associated with tourism specialization. To do so, we estimate standard growth models augmented with the extent of specialization in tourism using instrumental variables techniques for a cross-section of up to 127 countries over the period 1980 to 2002. The instrument is based on the number of sites on the
3 For early contributions on the benefits of FDI see, for instance, Aitken, Hanson, and Harrison (1997); Blomstrom and Kokko (1997); and Borensztein, De Gregorio, and Lee (1998).
4 We further discuss the relevance of exploiting the “between” rather than the “within” variation.
5
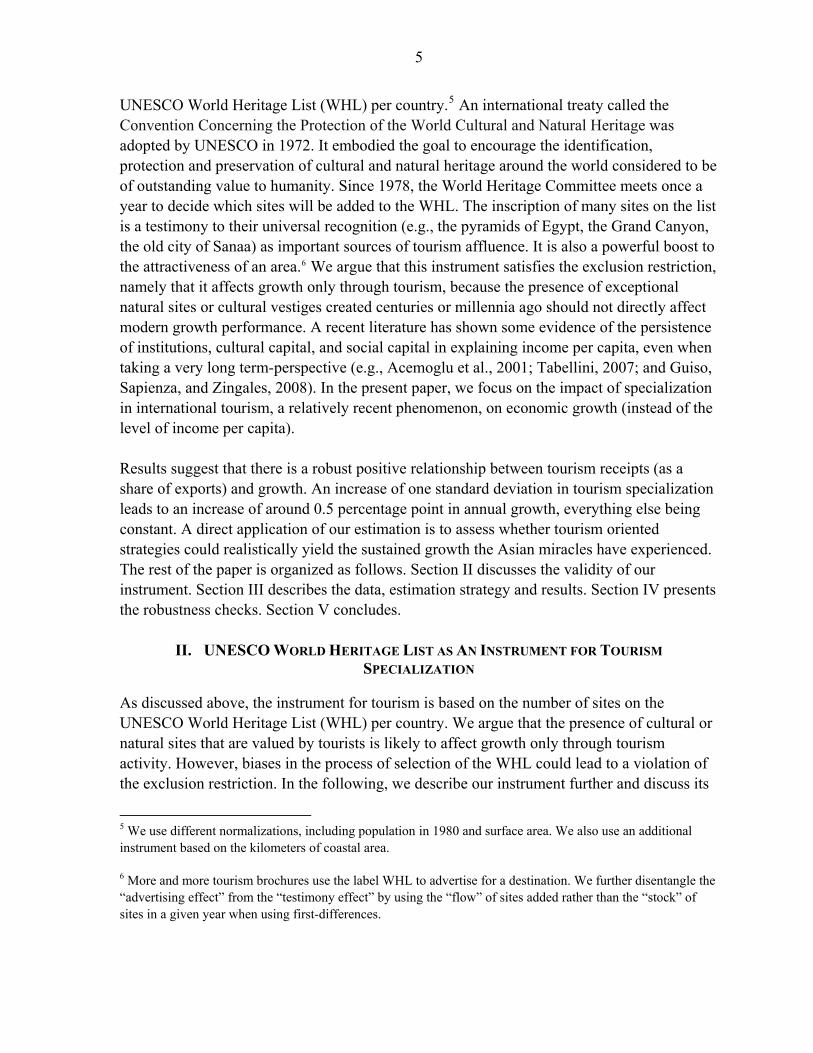
UNESCO World Heritage List (WHL) per country.5 An international treaty called the Convention Concerning the Protection of the World Cultural and Natural Heritage was adopted by UNESCO in 1972. It embodied the goal to encourage the identification, protection and preservation of cultural and natural heritage around the world considered to be of outstanding value to humanity. Since 1978, the World Heritage Committee meets once a year to decide which sites will be added to the WHL. The inscription of many sites on the list is a testimony to their universal recognition (e.g., the pyramids of Egypt, the Grand Canyon, the old city of Sanaa) as important sources of tourism affluence. It is also a powerful boost to the attractiveness of an area.6 We argue that this instrument satisfies the exclusion restriction, namely that it affects growth only through tourism, because the presence of exceptional natural sites or cultural vestiges created centuries or millennia ago should not directly affect modern growth performance. A recent literature has shown some evidence of the persistence of institutions, cultural capital, and social capital in explaining income per capita, even when taking a very long term-perspective (e.g., Acemoglu et al., 2001; Tabellini, 2007; and Guiso, Sapienza, and Zingales, 2008). In the present paper, we focus on the impact of specialization in international tourism, a relatively recent phenomenon, on economic growth (instead of the level of income per capita). Results suggest that there is a robust positive relationship between tourism receipts (as a share of exports) and growth. An increase of one standard deviation in tourism specialization leads to an increase of around 0.5 percentage point in annual growth, everything else being constant. A direct application of our estimation is to assess whether tourism oriented strategies could realistically yield the sustained growth the Asian miracles have experienced. The rest of the paper is organized as follows. Section II discusses the validity of our instrument. Section III describes the data, estimation strategy and results. Section IV presents the robustness checks. Section V concludes.
II. UNESCO WORLD HERITAGE LIST AS AN INSTRUMENT FOR TOURISM
SPECIALIZATION
As discussed above, the instrument for tourism is based on the number of sites on the UNESCO World Heritage List (WHL) per country. We argue that the presence of cultural or natural sites that are valued by tourists is likely to affect growth only through tourism activity. However, biases in the process of selection of the WHL could lead to a violation of the exclusion restriction. In the following, we describe our instrument further and discuss its
5 We use different normalizations, including population in 1980 and surface area. We also use an additional instrument based on the kilometers of coastal area.
6 More and more tourism brochures use the label WHL to advertise for a destination. We further disentangle the “advertising effect” from the “testimony effect” by using the “flow” of sites added rather than the “stock” of sites in a given year when using first-differences.

6
validity in terms of coverage, political clout over the selection process, and the inclusion of natural sites as opposed to only cultural sites. Coverage Countries submit nomination proposals for properties on their territory to be considered for inclusion in UNESCO’s World Heritage List. As of 2006, 181 state parties around the world have signed the convention. The proposed list of sites is first nominated and then independently reviewed by two advisory bodies. A final decision is then made by the World Heritage Committee (see UNESCO (2008) for further details). On average, 30 sites have been added annually between 1978 and 2008. The World Heritage sites are global in geographic coverage, as shown in Figure 2. This is important as it ensures that results based on this instrument are not conditional on belonging to a certain region.
Figure 2. UNESCO World Heritage Around the World
We constructed a dataset recording, for each cultural site, the year it was built.7 Table 1 summarizes our dataset, divided into regions and a historical timeline corresponding to major
7 Sites are dated according to their century of creation. Where specific dates are unavailable, sites are dated according to the corresponding civilization's period of peak influence.

7
civilizations. It indicates that there are relatively few sites built in the 20th century (less than 3 percent of the total) and that the majority of the sites (65 percent) were built more than 5 centuries ago. Furthermore, Table 1 indicates that Western, and in particular European, civilizations have the greatest number of sites compared to other periods and civilizations. This is not a source of violation of the exclusion restriction per se as the existence of sites should only affect growth through the tourism channel. However, there is a potential for our instrument to be correlated with the intensity of social, cultural, and political life in the last 2 to 5 centuries. In turn, it could lead to a correlation between the level of income, as well as the quality of institutions, in the modern period, and the proposed instrument. Acemoglu et al. (2001), Tabellini (2007), and Guiso, Sapienza, and Zingales (2008) provide evidence that formal institutions, cultural capital, and social capital, respectively, are persistent over time and could have long-lasting effects on income per capita. We address this concern by controlling for the initial level of income as well as for the quality of institution and trade openness.8 We also use the dataset we constructed to verify the robustness of our results to the sequential exclusion of recently built sites (XXth, XIXth up to the Xth century B.C.) from the WHL. Finally, world political developments have affected the composition of the WHL. The break up of the USSR resulted in a number of newly created Central Asian countries receiving sites in the early 1990s. We test the robustness of our results to the impact of those political development on our UNESCO based instrument by using different versions of the WHL.
8 Note also that some sites are historic markets or harbors that still have an economic relevance.

8
Table 1. Regional and Historical Distribution of World Heritage Sites (2002)9
Region Cultural Natural 1/ Total
Xth B.C.-XIVth A.D. XVth-XVIIth XVIIIth-XIXth XXth
Africa 13 9 3 0 38 63
(Early man, Islamic) (Zimbabwes) (Colonial)
Asia 68 19 6 2 57 152
(Buddhist, Hindu) (Ming, Mughal) (Qing)
Middle East 47 2 1 0 5 55
(Mesopotamia, Egypt, Islamic) (Ottoman) (North Africa)
Europe 219 53 42 12 74 400
(Greece, Rome, Middle Ages) 2/ (Renaissance) (Enlightenment, Industrial Rev.)
Latin America 24 38 8 2 42 114
(Aztec, Inca, Maya) (Spanish, Portuguese) (Independence)
Total 371 121 60 16 216 784
Source: UNESCO, 2009.
1/ Includes "mixed" sites, i.e. those sites classified under both natural and cultural criteria.
2/ The Middle Ages account for 143 of the 219 European sites during this timeframe. Political Clout If there is a relationship between alliances of various natures (e.g., economic, strategic) and site inscription, then our proposed instrument may not be valid in the sense that it would violate the exclusion restriction. Indeed, the instrument would be correlated with unobserved assistance from rich countries to poor countries in the form of development assistance, FDI, technology transfers, and military and security cooperation. In turn, such assistance is potentially associated with faster growth. To verify whether political clout influences World Heritage designations, we calculate the correlations between each country’s number of World Heritage sites and its voting coincidence with the G7 countries at the UN Security Council. 10 Table 2 presents the results. The correlation between sites and voting coincidence with all G7 countries ranges between 0.17 and 0.28. The upper bound correlation is driven by Western countries, especially European ones. We are primarily interested in a potential systematic bias in the selection of World Heritage sites in developing countries, which could then benefit from different forms of assistance. Therefore, we recalculate the correlation between sites and voting coincidence, excluding OECD countries. In this case, the correlation
9 Following UNESCO classification, North America is part of the European region .
10 We use different methodologies to define voting coincidence amongst all UN General Assembly votes, as shown in Table 2. Thacker (1999) codes votes in agreement as 1, votes in disagreement as 0, and abstentions or absences as 0.5. Barro and Lee (2005) use the fraction of times a country votes in accordance with the country of interest (either both voting yes, both voting no, both abstaining, or both absent). Kegley and Hoock (1991) compute a similar fraction but disregard abstentions and absences. (See Dreher, and Sturm, 2006) for data and a more detailed discussion of these different methodologies).

9
between sites and voting coincidence with all G7 countries decreases to between -0.10 and 0.07. Those correlation coefficients suggest that coincidence of voting between a given country with G7 countries (as a whole or taken individually) is at best not influencing the number of sites added to the WHL for that country. Thus, we find little evidence of political clout of the kind that would invalidate our instrument,11
Table 2. Correlation Between Total UNESCO World Heritage Sites and Average UN Voting Coincidence, 1980–2000
Barro & Lee (2005) Kegley & Hoock (1991) Thacker (1999)
Correlation coefficients for all countries (except G7) with:
Canada 0.29 0.26 0.19France 0.30 0.28 0.19Germany 0.28 0.25 0.19Italy 0.29 0.26 0.20Japan 0.30 0.24 0.20UK 0.28 0.26 0.17USA 0.24 0.20 0.56
G7 0.28 0.26 0.17
Correlation coefficients for non-OECD countries with:
Canada 0.08 0.10 -0.09France 0.10 0.11 -0.09Germany 0.08 0.10 -0.08Italy 0.08 0.10 -0.09Japan 0.10 0.12 -0.08UK 0.07 0.08 -0.11USA 0.01 -0.02 -0.18
G7 0.07 0.09 -0.10
Cultural vs. natural sites Table 1 also indicates that the bulk of the sites are cultural sites, although the number of natural sites has been rising recently. An important aspect in the selection of natural sites is the way governments protect them. Thus, the existence of natural sites on the WHL could be linked to governments’ environment protection efforts, which in turn could signal improved governance. Creating protected areas and biodiversity conservation zones could also have direct consequences on the economy.12 In addition, natural sites could be capturing natural
11 We also look at countries that have been under UN embargo or the target of sanctions. We find that overall these countries have a number of sites greater than the median.
12 A controversy has emerged surrounding the creation of such areas and the resulting rural population displacement and associated land tenure insecurity.

10
capital that could have a direct effect on economic growth not running necessarily through tourism. This could potentially violate the exclusion restriction and invalidate our instrument. Thus, we further verify the robustness of our results by excluding natural sites from the list.
III. E I N
A. Data and Specification
h, we
a
tourism receipts as a share of exports of goods and services for the period 1980 to 1990. 13 14
l S
to
and services in current dollars divided by GDP in PPP constant international US dollars, as
MPIRICAL NVESTIGATIO
In order to quantify the effect of tourism specialization on long-term economic growtestimate standard growth models augmented with a proxy that captures the extent of specialization in tourism (in terms of exports of goods and services). Appendix I contains description of the variables and their sources (Appendix Table 1) as well as the list of the countries included in the sample (Appendix Table 2). The dependent variable is the growth of GDP per capita over the period 1980 to 2002 in Purchasing Power Parity (PPP) constant international US dollars, denoted Growth. Tourism specialization, hereafter denoted Tourism, is measured by the average of
We add other controls to the specification that are standard in the growth literature.15 Initiaincome, denoted Income, is the logarithm of GDP per capita in constant international Udollar in 1980. Average education, denoted Education, is the logarithm of the share of population with primary education in 1980, taken from Barro and Lee (2005). We also use distance to the equator, denoted Distance, as a proxy for geography. It controls for malaria prevalence that could have direct impact on growth, as suggested by Sachs (2003), but also for the distance to countries that are sources of tourists. The price of capital goods relativeconsumption goods, denoted Kprice, is taken from Heston, Summers, and Aten (2006).16 Real trade openness, denoted Trade, is proxied by the sum of exports plus imports of goods
13 Tourism arrivals is also available from World Tourism Organization. However, the economic impact of tourism arrival can differ radically depending on the source and destination countries of tourism (e.g., regioversus international tourism). The focus of the paper being to quantify the impact of international tourism specialization on economic growth, we use tourism receipts to be able to measure the reliance of a country on tourism in its exports of goods and services. For robustn
nal
ess, we also define Tourism as the average of tourism receipts as a share of GDP and obtain similar results.
the average of tourism receipts over the whole period instead of the first ten years yields similar results.
esian averaging methodology. The independent variables we chose are based on the top 5 variables of this list.
that a high relative price of investment goods can be an impediment to economic growth and development.
14 Taking
15 For instance, Sala-i-Martin et al. (2004) determine a ranking of variables according to their significance in growth regressions using a Bay
16 Klenow and Hsieh (2007) provide some evidence

11
suggested by Alcala and Ciconne (2004).17 The quality of institutions, hereafter denoted Institution, is measured by the average law and order index over the period 1980–2002 taken from Political Risk Services (2009). The instrument for Tourism is the number of UNESCO sites per 100,000 inhabitants in the year 2002. 18 We also use kilometers of coastal area, hereafter denoted coastal, and related interactions as additional instruments for Tourism. The instrument for Trade is the logarithm of trade predicted by a gravity-based equation, denoted lnfrinstex, as suggested by Frankel and Romer (1999). The instrument for Institution is the fraction of individuals speaking English as a primary language, from Hall and Jones (1999). We alternatively use the fraction of individuals speaking a European language as a primary language, also from Hall and Jones (1999), and the logarithm of settlers’ mortality, hereafter lnsetmort, suggested by Acemoglu, Johnson, and Robinson (2001).
B. Results
Growth regressions are estimated using instrumental variables techniques (IV). The first and the second stage of the various IV regressions performed are shown in Table 3. Standard errors for the second stage and first stage are corrected for heteroskedasticity using standard White correction. Regressions (1) through (3) are growth regressions augmented with Tourism but excluding other endogenous variables. Regressions (4) and (5) control for Trade and Institution, respectively, using their associated instruments. Regression (6) includes both Trade and Institution. Results of the second stage regressions, shown in the lower panel of Table 3, point to a remarkably robust coefficient associated with Tourism. The coefficient ranges from 0.012 to 0.017 and is always significant across all specifications. Overall, the signs and magnitudes of the coefficients of the common regressors for economic growth are consistent with standard growth regressions. The sign associated with Income is always negative, supporting the convergence hypothesis, albeit not always significant. The regressions also provide evidence of the positive impact of Education, the negative effect of Kprice and a positive impact of Institution on economic growth, as expected. Trade has the expected positive sign but is not significant in most regressions. This result could be explained partly by the inclusion of Distance in our benchmark specification. Equation (2) constitutes our benchmark specification. Our results suggest that a ceteris paribus increase in tourism by one sample standard deviation, that is 8 percentage points (where Tourism is measured in percentage), implies an increase in growth per capita by 17 We substract tourism receipt from the numerator of Trade.
18 We further test the robustness of our results by using different versions of the WHL.

12
10.4 percent. Such an increase over a 22 year period corresponds to an annualized additional growth of about 0.5 percentage point per year. This is a significant number but should be put in perspective with the required expansion in tourism receipts. The upper panel in Table 3 shows the results of the first stage IV regressions. UNESCO is significant in all the first stage regressions of Tourism. The p-value associated with the F-test indicates that the instrument used for Tourism is not weak in all the first stage regressions. Excluding regression (1), its coefficient ranges from 29 to 32. In addition, engfrac has a positive coefficient in the first stage regression of Institution but the F-test indicates that the instrument tends to be weak, as shown in equation (5) and (6). In contrast, the coefficient associated with lnfrinstex in the first stage regression for Trade has the right sign and is significant (equations (4) and (6)). The F-test for the instrument used for Trade indicates that the instrument is not weak. Overall, Kleibergen-Paap statistics shown in the lower panel of Table 3 are greater than the Stock and Yogo 10 or 15 percent critical values for most of the regressions except for equation (5) and (6). That result indicates that the introduction of the instruments used for Institution weakens the identification. The main result related to Tourism holds when we used eurfrac and lnsetmort individually and/or in combination with engfrac as instruments for Institution.19 We now turn to testing the robustness of our main results.
19 The results are available from the authors upon request. The Hansen-J test associated with those regressions indicates that the overidentifying restrictions are not valid when all those instruments are used. In addition, F-tests also indicate that the instruments are weak.

13
Table 3. Benchmark Regressions
First Stage (1) (2) (3)VARIABLES Tourism Tourism Tourism Tourism Trade Tourism Institution Tourism Trade Institution
Unesco 13.768*** 29.982*** 29.408*** 27.939*** -3.814 32.055*** -0.133 29.289*** 7.963 -0.042[2.851] [6.751] [7.066] [6.863] [23.662] [7.066] [0.400] [7.464] [22.756] [0.443]
Income -1.042* -1.494* -1.375** 8.072** -0.679 0.551*** -1.539 10.810** 0.554***[0.551] [0.772] [0.605] [3.725] [0.620] [0.130] [0.988] [4.533] [0.132]
Education 1.096 1.549 1.318 3.715 0.574 -0.100 1.435 -2.563 -0.126[1.224] [1.383] [1.206] [3.803] [1.301] [0.157] [1.445] [3.725] [0.162]
Distance 0.028 0.036 0.027 -0.031 0.004 0.038*** 0.004 -0.125 0.040***[0.038] [0.039] [0.042] [0.248] [0.035] [0.008] [0.040] [0.262] [0.007]
Kprice 1.304 1.592 -2.549 -0.382[2.376] [2.328] [8.539] [0.285]
lnfrinstex_dk 1.421* 24.110*** 1.694 26.157*** 0.115[0.834] [5.786] [1.059] [7.126] [0.161]
engfrac_dk 1.495 0.446 3.541 8.815 0.628*[3.842] [0.306] [4.175] [9.332] [0.336]
Constant 8.162*** 10.827** 7.415 17.327*** 36.735* 9.613* -1.677* 12.305 51.242 0.232[1.028] [5.053] [9.414] [6.304] [20.294] [5.206] [0.860] [10.729] [37.186] [1.606]
F test 23.32 19.72 17.32 10.62 14.97 10.53 1.25 6.54 10.39 1.18P value 0.000 0.000 0.0001 0.0001 0.000 0.0001 0.2906 0.0005 0.000 0.3236
Observations 127 96 93 94 94 88 88 84 84 84R-squared 0.180 0.194 0.216 0.208 0.411 0.223 0.685 0.278 0.490 0.719
Second Stage (1) (2) (3)VARIABLES Growth Growth Growth
Tourism 0.015*** 0.013** 0.017**[0.005] [0.006] [0.007]
Income -0.082 -0.008[0.069] [0.074]
Education 0.158** 0.112*[0.066] [0.060]
Distance 0.013*** 0.012***[0.004] [0.004]
Kprice -0.255**[0.118]
Trade
Institution
Constant 0.100 -0.027 0.572[0.067] [0.433] [0.497]
Kleibergen-Paap rk Wald F statistic 23.316 19.724 17.32Stock-Yogo weak ID test critical values (10% maximal IV size) 16.38 16.38 16.38Stock-Yogo weak ID test critical values (15% maximal IV size) 8.96 8.96 8.96Stock-Yogo weak ID test critical values (20% maximal IV size) 6.66 6.66 6.66
Observations 127 96 93R-squared 0.056 0.212 0.256Robust standard errors in brackets
(4) (5) (6)
(4) (6)Growth
0.012**
0.157
[0.006]
0.003[0.003]
-0.139**[0.069]0.163**[0.071]
0.015***[0.004]
0.245[0.423]
940.266 0.334
88
[0.609]0.481
[0.203]0.295
[0.008]0.002
[0.075]0.205***[0.143]
(5)
-0.258*[0.006]
0.015***
Growth
4.583.95
4.583.95
4.7457.03
1.197.03
0.388**[0.186]
-0.163
[0.087]-0.002
0.004[0.003]
1.400*[0.754]
84
0.971………
[0.140]0.214**
[0.144]
[0.008]
Growth
0.013*[0.008]-0.337**

14
C. Robustness20
We first conduct a number of robustness checks on the instrument. We use various versions of the WHL in the IV regressions, as shown in Appendix Table 3 in Appendix II. Results are virtually unchanged whether we use the list from 1997 or 1992. The coefficients associated with Tourism in the second stage regressions range between 0.013 and 0.015. We then use exclusively the number of cultural sites as an instrument for Tourism in the IV growth regressions. As discussed in section II, the process of selection of natural sites is a potential source of endogeneity. Once again our results are virtually unchanged. Indeed, the coefficient associated with Tourism in equation (2) of Appendix Table 4 when using only cultural sites equals 0.015 (compared to 0.013 in our benchmark regression). Further, in Appendix Table 5 we show results of the regressions (1)-(8) where sites built in the XXth, XIXth-XXth, etc. up to Vth century BC were respectively substracted. The sign, magnitude (ranging from 0.013 to 0.016) and significance of the coefficients associated with Tourism are all in line with our main result. We also use, in addition to the UNESCO World Heritage sites, kilometers of coastal area, the square of the latter variable, and its interaction with the distance to the equator. Indeed, coastal area is likely to exogenously drive tourism activity. Controlling for Trade, this provides a valid instrument in the sense that it satisfies the exclusion restriction. Once again, our results hold. The coefficient associated with Tourism ranges from 0.013 in our benchmark regressions to 0.016, as shown in Appendix Table 6. The Hansen-J test indicates that the overidentifying restrictions are valid. The Kleibergen-Paap statistics indicates that the instruments are not weak albeit at the 10 percent level. We now check the robustness of our results using different definitions and data sources for the dependent variable, namely economic growth. Computation of GDP data in purchasing power parity differs between the World Bank (2008) and Heston and et al. (2006) datasets.21 Also, using per capita GDP versus per worker is likely to alter our results given the large size of the unemployed population in many countries. Appendix Table 7 shows the results using various PPP GDP data from Penn World Table 6.2 (PWT). Results are qualitatively unchanged, but the coefficients associated with Tourism now range from 0.013 to 0.024. The method of computation of PPP used in PWT and the use of GDP per worker instead of per capita increase the marginal effect of Tourism on growth.
20 Results discussed in this section but not presented are available from the authors upon request.
21 See Johnson, Larson, Papageorgiou, and Subramanian (2009) for a thorough discussion on the computation of PPP GDP in Penn World Table (PWT) and the differences between the various versions of PWT.

15
We also tested the robustness of our results to the presence of outliers. Our main results hold when excluding observations with a relatively high leverage.22 We also suspect that the size of a country matters. A look at Figure 1 shows that small tourism oriented islands (most of the points in the upper-right hand corner) have grown faster than the average. Yet, control variables like education are not available for most of these countries and hence they are excluded from the regression sample (the smallest country we have in our benchmark regression, equation (2) in Table 3, is Iceland corresponding the the bottom 15th percentile). Thus, our result is not driven by this group, and we might expect a bigger effect of tourism on growth if we could include them. Further, we find that excluding the biggest countries in terms of population yields a greater coefficient of tourism on growth.23 Therefore, big countries in the sample seem to decrease the size of the effect.24 Big countries are “over-represented” in the sample because of data availability.25 To check, we remove countries belonging to the top 15th percentile. The results are similar in magnitude and significance. Finally, we re-estimated our model using first-differences, using 10-year and 5-year spans to estimate the impact of the change in tourism on the change in growth, as in Dollar and Kraay (2003). Naturally, this method increases the sample size and exploits mainly the time-series variation. Our results are twofold. First, we find that the change in tourism has no statistically significant impact on the change in growth when using both OLS and IV. Second, the various instruments used in the IV regressions appear to be weak when exploiting the within variation. The lack of consistency of these results with our cross-sectional approach can be explained by the fact that the within variation of Tourism is about 3 times smaller that the between variation. This justifies the cross-sectional approach adopted in the present paper. Moreover, the tests performed indicate that the various instruments used, including the number of sites added to the WHL between two periods, are weak, as seen in the first stage regressions.26
22 See Davidson and MacKinnon, (1993), pp. 32–9, and Besley, Kuh, and Welsch (1980) for details on the
methodology. The total number of observations dropped is less than 5 percent of the total sample.
23 We tested for non-linearities along countries’ population size.We found no such evidence.
24 Both tails of the distribution of countries' populations pull the result in a different direction.
25 One has to be cautious not to exclude small population countries from the regression sample without considering the population distribution.
26 We use as instrument for change in Tourism the change in the number of sites added to the WHL, thus only capturing the “advertising effect” as opposed to the “testimony effect.”

16
IV. CONCLUSION
The aim of this study is to quantify the relationship between tourism specialization and growth while correcting for endogeneity. We suggest an instrument to correct for the endogeneity of variables measuring tourism specialization in growth regressions based on the UNESCO WHL. We estimate growth equations augmented with the share of tourism receipts in total exports using instrumental variables techniques for a large cross-section of countries. We show that the gain from tourism specialization can be significant, and that this result holds against a large array of robustness checks. An increase of one standard deviation in tourism activity would lead to an annualized additional growth of about 0.5 percentage point per year, ceteris paribus. Additional annual growth of this magnitude is not to be ignored. However, one has to think about the opportunity cost of a tourism based strategy given other paths for development, most noticeably the “Asian miracles”. On one hand, it is likely that developing tourism requires less capital, infrastructure and skilled labor when compared to a manufacturing, export-oriented strategy. On the other hand, it seems to rule out the type of growth record in the Asian miracles (on the order of 6 percent per year over 20 years). To illustrate this point, let us consider the “typical” developing country in the sample. It would have about 1 percent expected annual growth and an 8 percent tourism share of exports of goods and services. To reach growth of 6 percent per year, it would need to increase tourism receipts as a share of exports by more than 70 percent, or 10 times the standard deviation. It is, to say the least, very unlikely to achieve such a target for most countries. In theory, we can explain why a tourism-based strategy cannot “make a miracle”. In Lucas (1993), sustained high growth stems from the ability to constantly enter new technologies and quickly reallocate labor in the production of these new goods, as the productivity gains from learning-by-doing are highest in the first stages of production. By nature, tourism industry presents different features. It relies on a limited set of services produced with little room for expansion and labor reallocation.

17
Appendix I. Data Description and Sources
Table 1. Data Description
Database Units Descriptor Code
Growth variables:
World Bank (2008) 1/ PPP constant international US dollars GDP per capita growth between 1980 to 2002 (natural logarithm difference) Growth
World Bank (2004) 2/ Percentage of total exports of goods and services Average annual tourism receipts Tourism
World Bank (2008)Logarithim of GDP per capita in PPP constant international US dollars in 1980 Initial income Income
Barro and Lee (2000) Logarithim of fraction of population in 1980 Initial primary school attainment Education
Dollar & Kraay (2003) Latitude of capital city Distance to the equator Distance
Heston, Summers, & Aten (2006) Ratio of price indices Price of capital goods relative to consumption goods Kprice
World Bank (2008)Nominal imports plus exports divided by GDP in PPP constant international US dollars Real openness, as described by Alcala & Ciccone (2004) Trade
ICRG (2009) Index value Average annual law and order index Institution
Instruments:
UNESCO (2009) & World Bank (2008) Number of sites per 100,000 inhabitants 3/ UNESCO World Heritage Sites Unesco
Dollar & Kraay (2003) Logarithim of predicted trade share of GDPPredicted trade, based on a gravity model using population and geography, as described by Frankel & Romer (1999) lnfrinstex
Dollar & Kraay (2003) Fraction of total populationFraction of a country's population speaking a European language as a mother tongue, as described by Hall & Jones (1999) eurfrac
Dollar & Kraay (2003) Fraction of total populationFraction of a country's population speaking a English as a mother tongue, as described by Hall & Jones (1999) engfrac
Dollar & Kraay (2003) Logarithim of mortality rateColonial settler mortality, as described by Acemoglu, Johnson, & Robinson (2001) lnsetmort
CIA (2009) Kilometers Coastline coastal
1/ For robustness, also calculated using Heston, Summers, and Aten (2006). See Table 10 for exact definitions.
2/ Provides longest consistent time series for tourism.3/ For robustness, also calculated per surface area.

18
Table 2. Countries Included in the Sample
Africa Asia & Pacific EuropeLatin America &
Caribbean Middle EastBenin Australia Albania Antigua & Barbuda AlgeriaBotswana Bangladesh Austria Argentina BahrainBurkina Faso Bhutan Belgium Belize EgyptBurundi China Bulgaria Bolivia JordanCameroon Fiji Canada Brazil KuwaitCentral African Rep. Hong Kong Cyprus Chile LibyaChad India Denmark Colombia MauritaniaComoros Indonesia Finland Costa Rica MoroccoCongo, Dem. Rep. of Iran France Dominica OmanCongo, Rep. of Japan Germany Dominican Rep. Saudi ArabiaCote d'Ivoire Kiribati Greece Ecuador SudanGabon Malaysia Hungary El Salvador SyriaGambia Myanmar Iceland Grenada TunisiaGhana Nepal Ireland GuatemalaGuinea New Zealand Israel GuyanaKenya Pakistan Italy HaitiLesotho Papua New Guinea Malta HondurasLiberia Philippines Netherlands JamaicaMadagascar Singapore Norway MexicoMalawi Solomon Islands Portugal NicaraguaMali South Korea Romania PanamaMauritius Sri Lanka Spain ParaguayNamibia Thailand Sweden PeruNiger Vanuatu Switzerland St. Kitts & NevisNigeria Turkey St. LuciaRwanda United Kingdom St. Vincent & Gren.Senegal United States SurinameSeychelles Trinidad & TobagoSierra Leone UruguaySouth Africa VenezuelaSwazilandTogoZambia
Number of countries: Total:33 24 27 30 13 127

19
Appendix II. Additional Robustness Checks
Table 3. Robustness using Various WHL (1) (2) (3)
VARIABLES growth growth growth
Tourism 0.013** 0.013* 0.015**[0.006] [0.007] [0.006]
Income -0.082 -0.083 -0.081[0.069] [0.070] [0.070]
Education 0.158** 0.158** 0.156**[0.066] [0.067] [0.066]
Distance 0.013*** 0.013*** 0.013***[0.004] [0.004] [0.004]
Constant -0.027 -0.026 -0.037[0.433] [0.435] [0.435]
Cut-off year for instrument 2002 1997 1992
Kleibergen-Paap rk Wald F statistic 19.724 10.759 10.161
Stock-Yogo weak ID test critical values (10% maximal IV size) 16.38 16.38 16.38
Stock-Yogo weak ID test critical values (15% maximal IV size) 8.96 8.96 8.96Observations 96 96 96R-squared 0.212 0.212 0.204Robust standard errors in brackets*** p<0.01, ** p<0.05, * p<0.1
Table 4. Robustness to Using Only Cultural Sites
(1) (2)VARIABLES growth growth
Tourism 0.013** 0.015***[0.006] [0.005]
Income -0.082 -0.082[0.069] [0.070]
Education 0.158** 0.156**[0.066] [0.067]
Distance 0.013*** 0.013***[0.004] [0.004]
Constant -0.027 -0.036[0.433] [0.437]
Instrument coverage overall cultural only
Kleibergen-Paap rk Wald F statistic 19.72 18.33
Stock-Yogo weak ID test critical values (10% maximal IV size) 16.38 16.38
Stock-Yogo weak ID test critical values (15% maximal IV size) 8.96 8.96
Observations 96 96R-squared 0.212 0.205Robust standard errors in brackets*** p<0.01, ** p<0.05, * p<0.1

20
Table 5. Robustness to Removing various Centuries from the WHL
(1) (2) (3) (4) (5) (6) (7) (8)
VARIABLES growth growth growth growth growth growth growth growth
Tourism 0.015*** 0.015*** 0.016*** 0.017*** 0.017*** 0.018*** 0.019*** 0.022***[0.005] [0.005] [0.005] [0.005] [0.005] [0.005] [0.005] [0.006]
Income -0.082 -0.081 -0.081 -0.080 -0.079 -0.079 -0.078 -0.076[0.070] [0.070] [0.070] [0.070] [0.070] [0.071] [0.071] [0.071]
Education 0.156** 0.156** 0.154** 0.152** 0.151** 0.150** 0.148** 0.145**[0.067] [0.067] [0.066] [0.066] [0.066] [0.067] [0.067] [0.067]
Distance 0.013*** 0.013*** 0.013*** 0.013*** 0.013*** 0.013*** 0.013*** 0.013***[0.004] [0.004] [0.004] [0.004] [0.004] [0.004] [0.004] [0.004]
Constant -0.037 -0.038 -0.047 -0.054 -0.058 -0.064 -0.073 -0.090[0.437] [0.437] [0.438] [0.439] [0.439] [0.442] [0.442] [0.445]
Century Cut-off Point for Cultural Sites: All XX XVIII XV XIII X V V B.C.
Kleibergen-Paap rk Wald F statistic 19.72 18.23 18.20 65.439 66.91 17.28 17.77 18.92
Stock-Yogo weak ID test critical values (10% maximal IV size) 16.38 16.38 16.38 16.38 16.38 16.38 16.38 16.38
Stock-Yogo weak ID test critical values (15% maximal IV size) 8.96 8.96 8.96 8.96 8.96 8.96 8.96 8.96
Stock-Yogo weak ID test critical values (20% maximal IV size) 6.66 6.66 6.66 6.66 6.66 6.66 6.66 6.66
Observations 96 96 96 96 96 96 96 96R-squared 0.205 0.204 0.196 0.190 0.187 0.181 0.171 0.152Robust standard errors in brackets*** p<0.01, ** p<0.05, * p<0.1
Table 6. Robustness to Using Additional Instruments for Tourism
(1) (2) (3) (4)VARIABLES growth growth growth growth
Tourism 0.013** 0.015** 0.016** 0.015**[0.006] [0.006] [0.006] [0.006]
Income -0.082 -0.081 -0.081 -0.081[0.069] [0.070] [0.069] [0.069]
Education 0.158** 0.155** 0.154** 0.155**[0.066] [0.066] [0.066] [0.066]
Distance 0.013*** 0.013*** 0.013*** 0.013***[0.004] [0.004] [0.004] [0.004]
Constant -0.027 -0.038 -0.044 -0.040[0.433] [0.434] [0.432] [0.429]
Instrument coverage unesco unesco, coastlineunesco, coastline,
coastline interacted with distance
unesco, coastline, coastline interacted with distance, and
coastline squared
Kleibergen-Paap rk Wald F statistic … 11.45 9.04 8.58
Stock-Yogo weak ID test critical values (5% maximal IV size) … … 13.91 16.85
Stock-Yogo weak ID test critical values (10% maximal IV size) … 19.93 9.08 10.27
Stock-Yogo weak ID test critical values (20% maximal IV size) … 8.75 6.46 6.71
Hansen J test (p value) 0.31 0.58 0.78
Observations 96 96 96 96R-squared 0.212 0.203 0.199 0.202Robust standard errors in brackets*** p<0.01, ** p<0.05, * p<0.1

21
Table 7. Robustness to using Different Measures of GDP (1) (2) (3) (4) (5)
Describtion
GDP, PPP (constant 2005 international $)
World Bank
Real GDP Chain per worker unit: I$ per worker in 2000 Constant Prices,
PWT 6.2
Real GDP per capita (Constant Prices:
Laspeyres) unit: I$ in 2000 Constant Prices, PWT 6.2
Real GDP per capita (Constant Prices: Chain series) unit: I$ in 2000 Constant Prices, PWT
6.2
Real GDP Chain per equivalent adult unit: I$
per eq. adult in 2000 Constant Prices
VARIABLES growth growth_rgdpwok_pwt growth_rgdpl_pwt growth_rgdpch_pwt growth_rgdpeqa_pwt
Tourism 0.013** 0.024*** 0.021*** 0.021*** 0.022***[0.006] [0.007] [0.007] [0.007] [0.007]
Income -0.082[0.069]
Income_rgdpwok_pwt -0.162**[0.070]
Income_rgdpl_pwt -0.075[0.081]
Income_rgdpch_pwt -0.079[0.081]
Income_rgdpeqa_pwt -0.093[0.082]
Education 0.158** 0.093 0.148* 0.149* 0.139*[0.066] [0.071] [0.079] [0.079] [0.079]
Distance 0.013*** 0.015*** 0.012*** 0.012*** 0.012***[0.004] [0.004] [0.004] [0.004] [0.004]
Constant -0.027 0.767 -0.107 -0.086 0.035[0.433] [0.511] [0.562] [0.561] [0.586]
Kleibergen-Paap rk Wald F statistic 19.72 16.28 16.36 16.36 16.45
Stock-Yogo weak ID test critical values (10% maximal IV size) 16.38 16.38 16.38 16.38 16.38
Stock-Yogo weak ID test critical values (15% maximal IV size) 8.96 8.96 8.96 8.96 8.96
Stock-Yogo weak ID test critical values (20% maximal IV size) 6.66 6.66 6.66 6.66 6.66
Observations 96 97 98 98 98R-squared 0.212 0.127 0.161 0.162 0.150Robust standard errors in brackets*** p<0.01, ** p<0.05, * p<0.1

22
References
Acemoglu, Daron, and Veronica Guerrieri, 2008, “Capital Deepening and Nonbalanced Economic Growth,” Journal of Political Economy, Vol. 116, No. 3, pp. 467–98, 06 (Chicago: University of Chicago Press).
———, Simon Johnson, and James Robinson, 2001, “The Colonial Origins of
Comparative Development: An Empirical Investigation,” American Economic Review, Vol. 91, No. 5, pp. 1369–401.
Aitken, B., G. Hanson, and A.E. Harrison, 1997, “Spillovers, Foreign Investment, and Export Behavior,” Journal of International Economics, Vol. 43, No. 1–, pp. 103–32. Alcala, Francisco, and Antonio Ciccone, 2004, “Trade and Productivity,” Quarterly Journal of Economics, Vol. 119, No. 2, pp. 612–45. Barro, Robert J., and Jong-Wha Lee, 2000, “International Data on Educational Attainment:
Updates and Implications,” CID Working Paper No. 42 (Boston: Harvard University).
———, 2005, “IMF Programs: Who is Chosen and What are the Effects?,” Journal of
Monetary Economics, Vol. 52, pp.1245–69. Baumol, William, 1967, “Macroeconomics of Unbalanced Growth: the Anatomy of Urban
Crisis,” American Economic Review, Vol. 57, pp. 415–26. Besley, David A., Edwin Kuh, and Roy E. Welch, 1980, Regression Diagnostics: Identifying
Influential Data and Sources of Collinearity, John Wiley (New York: John Wiley)
Blomstrom, M., and A. Kokko, 1997, “How Foreign Investment Affects Host Countries,”
World Bank Policy Research Working Paper No. 1745 (Washington: World Bank).
Borensztein, E., J. De Gregorio, and J-W. Lee, 1998, “How Does Foreign Direct Investment
Affect Economic Growth,” Journal of International Economics, Vol. 45, No. 1, pp. 115–35. Chao, Chi-Chur, Bharat R. Hazari, Jean-Pierre Laffargue, Pasquale M. Sgro, and Eden S.H.
Yu, 2006, “Tourism, Dutch Disease, and Welfare in an Open Dynamic Economy,” Japanese Economic Review, Vol. 57, No. 4, pp. 501–15. Copeland, B.R., 1991, “Tourism, Welfare, and De-Industrialization in a Small Open
Economy,” Economica, Vol. 58, pp. 515–29.

23
Davidson, Russell, and James G. MacKinnon, 1993, Estimation and Inference in Econometrics (New York: Oxford University Press). Dollar, David, and Art Kraay, 2003, “Institutions, Trade, and Growth,” Journal of Monetary Economics, Vol. 50, pp. 133–62. Dreher, Axel, and Jan-Egbert Sturm, 2006, “Do IMF and World Bank Influence Voting in the UN General Assembly?” KOF Swiss Economic Institute, Working Paper No. 137 (Zurich : ETH). Frankel, Jeffrey A., and David Romer, 1999, “Does Trade Cause Growth?” American Economic Review, Vol. 89, No. 3, pp. 379–99. Guiso, Luigi, Paola Sapienza, and Luigi Zingales, 2008, “Long Term Persistence,” NBER
Working Paper No. 14278. Hall, Robert E., and Charles I. Jones, 1999, “Why Do Some Countries Produce So Much More Output Per Worker Than Others?” Quarterly Journal of Economics, Vol. 113, No. 4, pp. 1119–135. Heston, Alan, Robert Summers, and Bettina Aten, 2006, Penn World Table Version 6.2,
Center for International Comparisons of Production, Income and Prices (Pennsylvania, University of Pennsylvania).
Johnson, Simon, William Larson, Chris Papageorgiou, and Arvind Subramanian, 2009, “Is
Newer Better?: the Penn World Table Revisions and the Cross-Country Growth Literature” mimeo.
Kegley, Charles W., Jr., and Steven W. Hook, 1991, “U.S. Foreign Aid and UN Voting: Did
Reagan’s Linkage Strategy Buy Defense or Defiance?” International Studies Quarterly, Vol. 35, No. 3, pp. 295–312.
Klenow, Peter J., and Chang-Tai Hsieh, 2007, “Relative Prices and Relative Prosperity,”
American Economic Review, Vol. 97, No. 3, pp. 562–85. Lucas, Robert E., Jr., 1993, "Making a Miracle," Econometrica, Vol. 61, No. 2, pp. 251–72 (March). Oulton, Nicholas, 2001, “Must the Growth Rate Decline?: Baumol’s Unbalanced Growth Revisited,” Oxford Economic Papers, Vol. 53, pp. 605–27. Political Risk Services, 2009, International Country Risk Guide. Sachs, Jeffrey, 2003, “Institutions Don’t Rule: Direct Effects of Geography on Per Capita
Income,” NBER Working Paper No. 9490 (February).

24
Sala-i-Martin, Xavier, Gernot Doppelhofer, and Ronald I. Miller, 2004, “Determinants of Long-Term Growth: A Bayesian Averaging of Classical Estimates (BACE) Approach,” American Economic Review, Vol. 94, No. 4, pp. 813–35. Sequeira, Tiago Neves, and Paulo Macas Nunes, 2008, “Does Tourism Influence Economic
Growth?: A dynamic panel data approach,” Applied Economics, Vol. 40, pp. 2431–41.
Stock, James H., and Motohiro Yogo, 2002, “Testing for Weak Instruments in Linear IV
Regression,” NBER Technical Working Paper No. 284 (November). Tabellini, Guido, 2007, “Culture and Institutions,” CEPR Discussion Papers 6589. Thacker, Strom C., 1999, “The High Politics of IMF Lending,” World Politics, Vol. 52,
No. 3, pp.181–205. UNESCO, 2008, “Operational Guidelines for the Implementation of the World Heritage
Convention,” UNESCO World Heritage Center (Paris: UNESCO World Heritage Center).
World Bank, 2004, World Development Indicators. World Bank, 2008, World Development Indicators.