Embed Size (px)
Citation preview
TOURISM RICHMOND 2017 ANNUAL REPORT
THE BIG PICTURE
2017
8.0M2017
1.8B
2017
33,0522017
83.2%
VISITORS TO RICHMOND 1 VISITOR SPEND1
MEETING & EVENTS ROOM NIGHT LEADS 3 OCCUPANCY RATE 4
2015
7.4M 8.2%
2016
29,993 10.2%2016
81.1% 2.1%
2015
1.5B 22.7%2
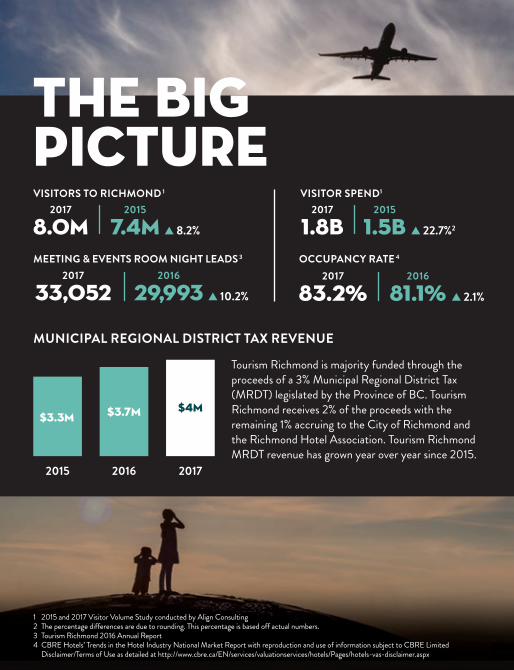
Tourism Richmond is majority funded through the proceeds of a 3% Municipal Regional District Tax (MRDT) legislated by the Province of BC. Tourism Richmond receives 2% of the proceeds with the remaining 1% accruing to the City of Richmond and the Richmond Hotel Association. Tourism Richmond MRDT revenue has grown year over year since 2015.
MUNICIPAL REGIONAL DISTRICT TAX REVENUE
1 2015 and 2017 Visitor Volume Study conducted by Align Consulting2 The percentage differences are due to rounding. This percentage is based off actual numbers.3 Tourism Richmond 2016 Annual Report4 CBRE Hotels’ Trends in the Hotel Industry National Market Report with reproduction and use of information subject to CBRE Limited
Disclaimer/Terms of Use as detailed at http://www.cbre.ca/EN/services/valuationservices/hotels/Pages/hotels-vas-disclaimer.aspx
20162015
$3.3M $3.7M
2017
$4M
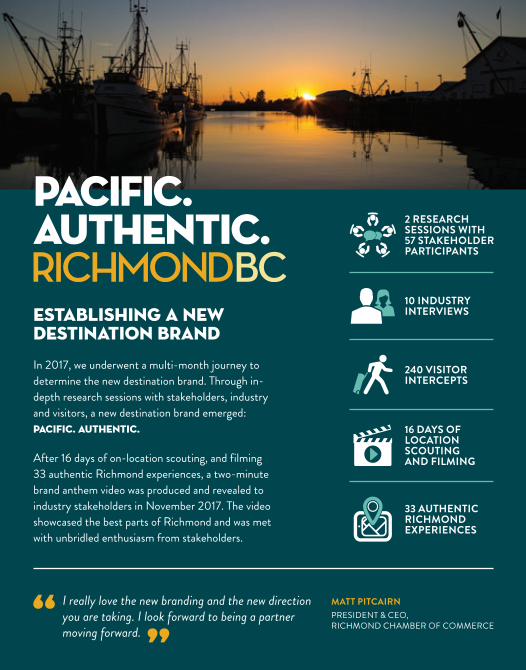
Establishing A New Destination BrandIn 2017, we underwent a multi-month journey to determine the new destination brand. Through in-depth research sessions with stakeholders, industry and visitors, a new destination brand emerged: PACIFIC. AUTHENTIC.
After 16 days of on-location scouting, and filming 33 authentic Richmond experiences, a two-minute brand anthem video was produced and revealed to industry stakeholders in November 2017. The video showcased the best parts of Richmond and was met with unbridled enthusiasm from stakeholders.
2 RESEARCH SESSIONS WITH 57 STAKEHOLDER PARTICIPANTS
10 INDUSTRY INTERVIEWS
16 DAYS OF LOCATION SCOUTING AND FILMING
33 AUTHENTIC RICHMOND EXPERIENCES
240 VISITOR INTERCEPTS
I really love the new branding and the new direction you are taking. I look forward to being a partner moving forward.
MATT PITCAIRNPRESIDENT & CEO, RICHMOND CHAMBER OF COMMERCE
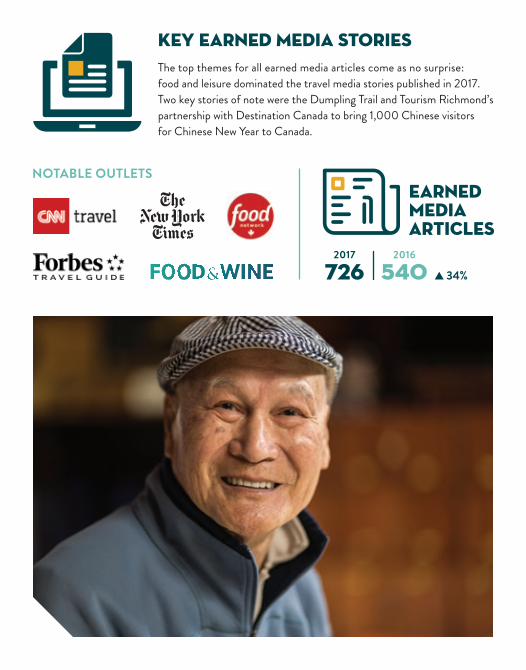
NOTABLE OUTLETS
Key Earned Media StoriesThe top themes for all earned media articles come as no surprise: food and leisure dominated the travel media stories published in 2017. Two key stories of note were the Dumpling Trail and Tourism Richmond’s partnership with Destination Canada to bring 1,000 Chinese visitors for Chinese New Year to Canada.
Earned media articles
2017
7262016
540 34%
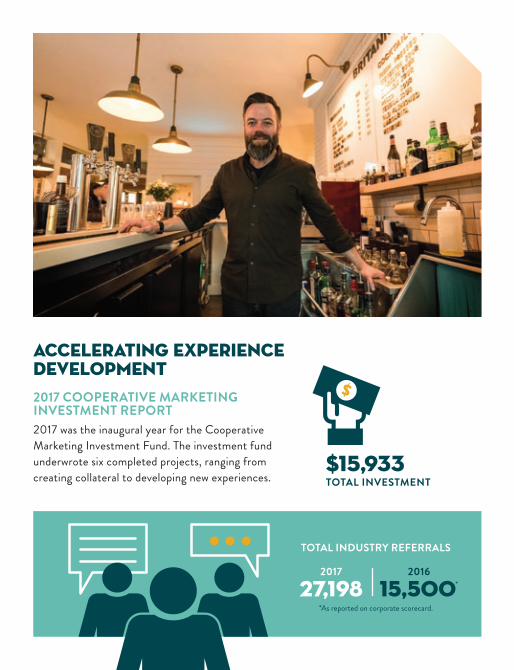
Accelerating Experience Development2017 COOPERATIVE MARKETING INVESTMENT REPORT2017 was the inaugural year for the Cooperative Marketing Investment Fund. The investment fund underwrote six completed projects, ranging from creating collateral to developing new experiences.
$15,933TOTAL INVESTMENT
TOTAL INDUSTRY REFERRALS
2017
27,1982016
15,500*
*As reported on corporate scorecard.
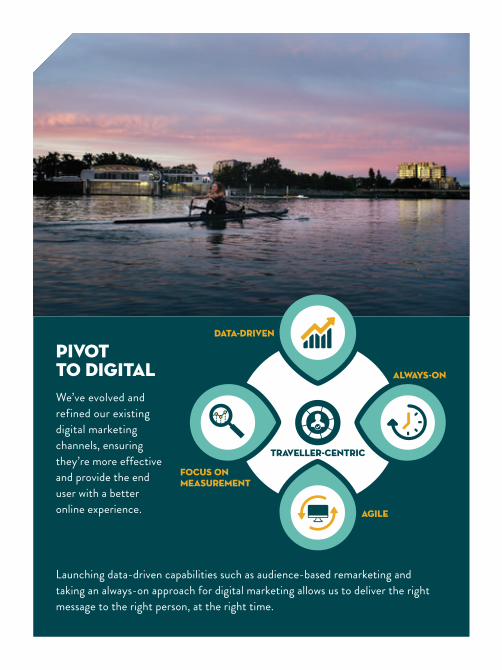
Pivot to digitalWe’ve evolved and refined our existing digital marketing channels, ensuring they’re more effective and provide the end user with a better online experience.
TRAVELLER-CENTRIC
DATA-DRIVEN
ALWAYS-ON
FOCUS ON MEASUREMENT
AGILE
Launching data-driven capabilities such as audience-based remarketing and taking an always-on approach for digital marketing allows us to deliver the right message to the right person, at the right time.
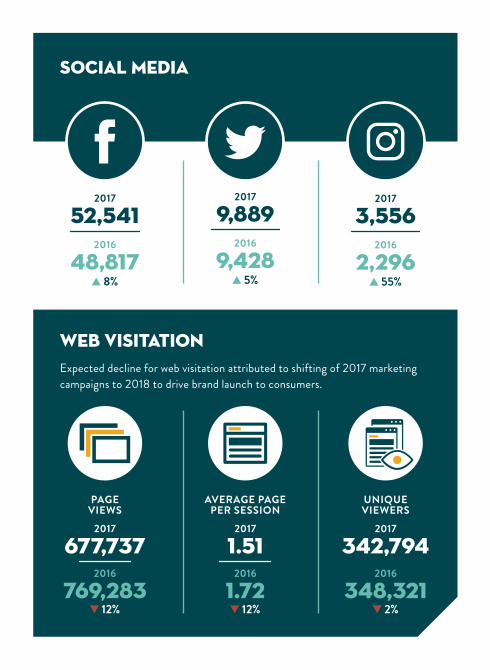
Web VisitationExpected decline for web visitation attributed to shifting of 2017 marketing campaigns to 2018 to drive brand launch to consumers.
2017
677,7372016
769,283
PAGE VIEWS
12%
2017
1.512016
1.72
AVERAGE PAGE PER SESSION
12%
2017
342,7942016
348,321
UNIQUE VIEWERS
2%
Social Media
2017
52,5412016
48,817 8%
2017
9,8892016
9,428 5%
2017
3,5562016
2,296 55%
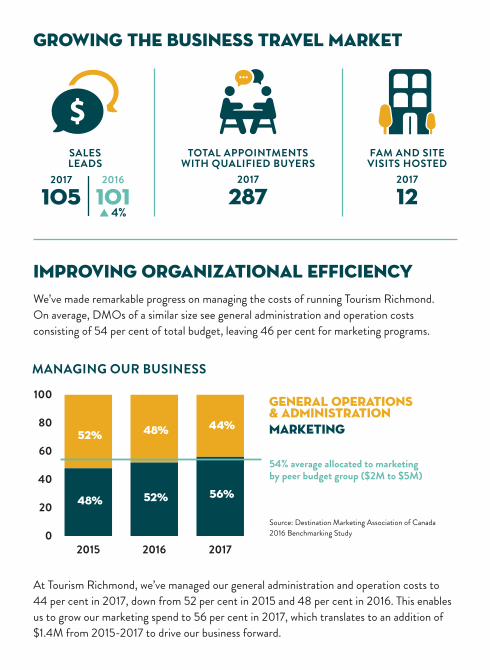
Growing the Business Travel Market
Improving Organizational EfficiencyWe’ve made remarkable progress on managing the costs of running Tourism Richmond. On average, DMOs of a similar size see general administration and operation costs consisting of 54 per cent of total budget, leaving 46 per cent for marketing programs.
At Tourism Richmond, we’ve managed our general administration and operation costs to 44 per cent in 2017, down from 52 per cent in 2015 and 48 per cent in 2016. This enables us to grow our marketing spend to 56 per cent in 2017, which translates to an addition of $1.4M from 2015-2017 to drive our business forward.
General Operations & Administrationmarketing
2015 2016 20170
20
40
60
80
100
48% 52% 56%
52% 48% 44%
MANAGING OUR BUSINESS
Source: Destination Marketing Association of Canada 2016 Benchmarking Study
54% average allocated to marketing by peer budget group ($2M to $5M)
2017
287
TOTAL APPOINTMENTS WITH QUALIFIED BUYERS
2017
1052016
101 4%
SALES LEADS
FAM AND SITE VISITS HOSTED
2017
12
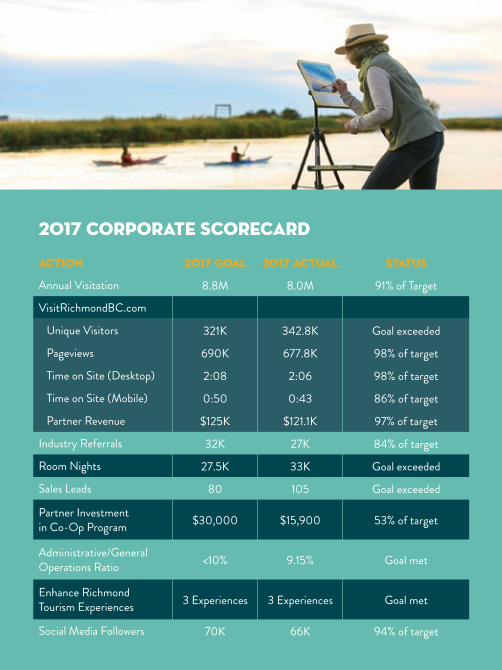
2017 Corporate Scorecard
ACTION 2017 GOAL 2017 ACTUAL STATUS
Annual Visitation 8.8M 8.0M 91% of Target
VisitRichmondBC.com
Unique Visitors 321K 342.8K Goal exceeded
Pageviews 690K 677.8K 98% of target
Time on Site (Desktop) 2:08 2:06 98% of target
Time on Site (Mobile) 0:50 0:43 86% of target
Partner Revenue $125K $121.1K 97% of target
Industry Referrals 32K 27K 84% of target
Room Nights 27.5K 33K Goal exceeded
Sales Leads 80 105 Goal exceeded
Partner Investment in Co-Op Program $30,000 $15,900 53% of target
Administrative/General Operations Ratio <10% 9.15% Goal met
Enhance Richmond Tourism Experiences 3 Experiences 3 Experiences Goal met
Social Media Followers 70K 66K 94% of target