Embed Size (px)
Citation preview
Simone Salotti, Letizia Montinari, Antonio F. Amores, José M. Rueda-Cantuche
Total expenditure elasticity of non-durable consumption of European households
2015
EUR 27081 EN

Total expenditure elasticity of non-durable consumption of European households
This publication is a Technical report by the Joint Research Centre, the European Commission’s in-house science
service. It aims to provide evidence-based scientific support to the European policy-making process. The scientific
output expressed does not imply a policy position of the European Commission. Neither the European
Commission nor any person acting on behalf of the Commission is responsible for the use which might be made
of this publication.
JRC Science Hub
https://ec.europa.eu/jrc
JRC94405
EUR 27081 EN
ISBN 978-92-79-45242-0 (PDF)
ISSN 1831-9424 (online)
doi:10.2791/625913 (online)
© European Union, 2015
Reproduction is authorised provided the source is acknowledged.
All images © European Union 2015, except: cover, Piotr Adamowicz, #68320496, 2014. Source: Fotolia.com.
How to cite: Salotti, S., Montinari, L., Amores, A.F., Rueda-Cantuche, J.M. (2015). Total expenditure elasticity of
non durable consumption of European households. JRC Technical Report EUR 27081 EN, doi:10.2791/625913

2
Table of contents
Acknowledgements ................................................................................................ 3
Abstract ............................................................................................................... 4
1. Introduction ................................................................................................... 5
2. Literature review ............................................................................................ 7
2.1 Energy consumption ................................................................................... 7
2.2 Non-energy consumption ............................................................................ 8
3. The empirical model and the data ..................................................................... 9
3.1 The energy consumption model ................................................................... 9
3.2 The non-energy consumption model ........................................................... 10
3.3 The data ................................................................................................. 11
4. Results ........................................................................................................ 13
4.1 Energy-consumption results ...................................................................... 13
4.2 Non-energy consumption results ................................................................ 17
4.3 EU-level expenditure elasticities ................................................................. 21
5. Conclusions .................................................................................................. 22
References ......................................................................................................... 23
List of abbreviations and definitions ....................................................................... 25
List of tables ....................................................................................................... 26

3
Acknowledgements
The authors are very grateful for the useful comments received from Kurt Kratena and
Ignazio Mongelli. The usual disclaimer applies.

4
Abstract
This document presents the results of an empirical analysis carried out in order to
estimate total expenditure elasticities for the household consumption module of the
FIDELIO model. The estimates are based on survey data for the following six European
countries: Austria, France, Italy, Slovakia, Spain, and the UK. The analysis deals with
twelve categories of non-durable consumption: four energy- and eight non-energy-
related goods and services. Results appear to be in line with the comparable elasticity
estimates of the existing literature. Socio-demographic controls related to both
household characteristics and housing conditions offer interesting additional results that
may be useful at a later stage of the analysis with the FIDELIO model.

5
1. Introduction
The work illustrated in this document has been carried out within the CARBON CAP
project1 which makes use of the FIDELIO model, an input-output demand-driven model
(see Kratena et al. 2013 for more details on the first version of the model).2 The latest
version of it features a rich module for household consumption in need of several
parameters to characterise the behaviour of European households. The present
document illustrates the empirical analysis that has been done in order to produce the
total expenditure elasticity (which is routinely interpreted as the income elasticity, see
e.g. Browning and Crossley 2000) for the consumption of various non-durable goods and
services for the purposes of the household consumption module of FIDELIO.
It has become standard to use general equilibrium model such as Computable General
Equilibrium (CGE) and input-output models to carry out analyses on policy relevant
issues such as international trade and environmental developments. General equilibrium
models normally rely on microeconomic foundations specifying the behaviour of agents.
Among the many parameters used in such models, price and expenditure/income
elasticities for consumption are particularly important. The values of such parameters
normally arise from econometric estimates using information on how the consumption of
certain goods responds to both price and total expenditure changes.3
The goods and services which constitute the object of interest of the present analysis all
pertain to the non-durables' domain and can be classified into energy and non-energy
consumption. The four categories of energy-related goods and services are the
following: electricity, heating fuel, fuel for private transport, and public transport
services. The eight non-energy-related goods and services are the following: food,
clothing, furniture and equipment 4 , health, communication, recreation and
accommodation, financial services, and other (the latter is a residual category). The
FIDELIO model focuses on the European Union (EU) countries (some non-EU regions are
included in the model, but with simplified structures and equations), therefore in
principle data from all the EU countries should be used in order to estimate the
elasticities needed. However, appropriate household-level (survey) data are only
available for six countries, therefore the information extracted from those surveys has
been extended to all the other EU countries featured in the model as explained in more
details below.
The results of the analysis are the following. The estimated expenditure elasticities
appear to be in line with those available in the literature. Although a full comparison is
not feasible (since the existing articles and papers all focus on different countries and
time periods, and make use of varying definitions of the variables at stake), numbers are
mostly within the ranges of previously estimated coefficients. All the energy-related
commodities appear to be necessities, i.e. normal goods with positive income elasticity
smaller than one. Of the eight non-energy related commodities, food and communication
appear to be necessities, while clothing, furniture, health, and recreation are all
1 The idea behind this project is that growing consumption is an important driver behind
rising greenhouse gas emissions and that the world economy is highly integrated. Thus,
the project considers Consumption-based Accounting Policy (CAP) because it is thought
to be able to complement existing policies (such as the Kyoto protocol) which are based
on territorial emissions adopting a consumption oriented perspective. 2 The acronym FIDELIO stands for Fully Interregional Dynamic Econometric Long-term
Input-Output. The present document refers to the second version of the model. 3 The present analysis only deals with the estimation of total expenditure elasticities, but
not of price elasticities. Time series have been used to estimate the latter separately for
FIDELIO-related purposes. 4 Furniture and equipment are in fact durable goods, but within the context of the
FIDELIO model non-durable goods are defined as goods that cannot constitute collateral
for debt.

6
estimated to be superior goods (that is, normal goods with income elasticity above one).
The estimates are unable to shed light on the nature of financial services and of the
residual category ('other'). Finally, the use of a large number of socio-demographic
controls related to both household characteristics and housing conditions yields
additional results that could turn out to be useful at a later stage of the analysis with the
FIDELIO model.
The remainder of the document is organised as follows. Section 2 contains a very brief
review of the literature dealing with the estimation of income elasticities related to
household consumption of both energy- and non-energy-related commodities. Section 3
illustrates the empirical models used in our analysis and presents an overview of the
data. Section 4 shows the results, and section 5 briefly concludes.
7
2. Literature review
The studies on energy-related commodities differ significantly from those of other types
of commodities. This is the reason why this literature review section is organised in two
sub-sections, the first (2.1) dealing with energy consumption, and the second (2.2) on
non-energy-related spending.
2.1 Energy consumption
The existing literature offers a number of studies dealing with the estimation of the price
and income elasticity for the four categories of energy-related goods and services
included in the FIDELIO model (electricity, heating fuel, fuel for private transport, and
public transport services). The studies differ in terms of data used, country and time
coverage, and econometric techniques employed. In fact, all those dimensions are
interrelated, as the choice of the econometric technique depends on the characteristics
of the available data (for example, household-level vs aggregate consumption data, and
cross-sectional vs panel data). Thus, data availability plays a crucial role for identifying
the empirical strategy capable of delivering the needed elasticity.
Consumption of electricity and heating fuel are often studied jointly, given that they can
be considered, at least partially, as substitutes. Country-specific studies are very
common, and examples dealing with EU countries include the following: Hondroyiannis
(2004) on Greece; Tiezzi (2005) on Italy; Labanderia et al. (2006) using both cross-
sectional and time series data for Spain; Rehdanz (2007) studying space heating
expenditure in Germany; Druckman and Jackson (2008) and Meier and Rehdanz (2010)
concentrating on the UK.5 According to the literature, the income elasticity for electricity
and heating fuel consumption ranges between -0.27 and 0.61, although most estimates
lie in the [0.08, 0.27] range.6
Measuring the price and income elasticity of fuel/gasoline/diesel consumption has always
proven to be a popular exercise in the economics literature due the relevance of the
related policy implications. As for the case of electricity and heating fuel consumption,
systems of equations have sometimes been used to account for the potential
substitutability with public transport spending as well. The survey by Graham and
Glaister (2002) on the elasticities related to automobile fuel is a reasonable starting
point for a look at the literature. According to the evidence based on aggregate data for
developed countries, the short-run income elasticity is above 0.15 and below 1.00, while
the long-run elasticity is substantially higher but never above 2.00. Empirical studies
employing micro-data suggest that numbers should be revised downwards, with an
estimated elasticity between zero and 0.54. More recent studies (see, among others,
Wadud et al. 2009, Dahl 2012) substantially confirm those findings.
The literature on public transport offers a significantly lower number of studies than that
on automobile fuel. Also, the variable of interest in such studies is normally the number
of public transport trips, rather than public transport expenditure. Since the data used in
5 Other related articles include the early studies by Dubin and McFadden (1984) on the
US, Baker et al. (1989) on the UK, as well as those by Filippini (1995) on Switzerland,
García-Cerruti (2000) on California, Halvorsen and Larsen (2001) and Larsen and
Nesbakken (2004) on Norway, Filippini and Pachauri (2004) on India, Holtendahl and
Joutz (2004) on Taiwan, Kamerschen and Porter (2004) on the US, and Haas and
Schipper (1998) on OECD countries. 6 A positive income elasticity is associated with normal goods whose demand increases
as income increases, as opposed to inferior goods. Values above one characterise
superior/luxury goods (the increase in consumption is more than proportional to an
increase in total expenditure), and values below one are associated with necessary
goods instead (the increase is less than proportional in this case).
8
our empirical analysis only permit the estimation of an empirical model with the latter
rather than the former as the dependent variable, the relationship with the literature's
findings is less straight-forward than in the cases treated above. Most studies find
negative income elasticity for public transport, and explain it with individuals turning to
private transport as their income rise (see, e.g., Johansson-Stenman 2002, Paulley et al.
2006). On the other hand, FitzRoy and Smith (1998) claim that the income elasticity for
public transport is positive (suggesting that public transport is not an inferior good),
although their study applies to the specific case of the German city of Freiburg. As an
anticipation of our results, we also find a positive income elasticity, possibly because
public transport is not an inferior good, or maybe simply because of the type of variable
that we use, i.e. spending, differs from what is routinely used in the literature on the
topic.
A full review of the vast literature dealing with the estimation of the income elasticity for
the energy-related commodities mentioned in this section is beyond the scope of the
present document. All that should matter for the reader is the literature range of such
elasticities in order to better frame the results arising from the empirical analysis carried
out for the purposes of the FIDELIO model which is explained in the remainder of the
present document.
2.2 Non-energy consumption
In the latest version of FIDELIO the consumption of the eight non-energy related non-
durable goods and services mentioned in the introduction (food, clothing, furniture and
equipment, health, communication, recreation and accommodation, financial services,
and other) is modelled within a simplified version of an Almost Ideal Demand System
(AIDS). Deaton and Muellbauer (1980) provide the seminal contribution for the demand
system analysis with the AIDS which rapidly gained popularity and became a workhorse
model (Buse 1994). There are numerous examples in the literature of analyses of non-
durables' consumption using the AIDS, particularly for food products (see, among
others, Abdulai 2002, and Tiffin and Arnoult 2010).
The AIDS is normally used to estimate own and cross price elasticities, as well as total
consumption elasticity. Our analysis makes use of a simplified AIDS, without prices, due
to the cross-sectional nature of the data used in our analysis. Basically, the expenditure
shares of the eight non-durable commodities are regressed on total expenditure and on
a number of socio-demographic controls. The total expenditure coefficient is then used
to recover the elasticity to be interpreted as the one estimated in the other part of the
analysis. Once again, a positive elasticity's value below one means that the expenditure
share for that particular commodity shrinks as total expenditure increases (this happens
in the case of necessary goods). On the other hand, elasticity values above one mean
the opposite: the share of expenditure used to buy that commodity increases as total
expenditure increases (this is the case for superior/luxury goods).
It is hard to find examples in the literature utilising the same commodities featured in
our analysis, therefore it is difficult to compare our numerical results with existing ones.
However, theoretical and practice-based priors suggest that food, communication, and
health-related goods may be necessary goods (characterised by positive elasticity below
1.00); clothing, furniture and equipment, recreation and accommodation, and financial
services may be superior goods (positive elasticity and above 1.00); the 'other' category
is used as a residual and its construction makes it hard to state a clear prior.
9
3. The empirical model and the data
Sub-section 3.1 illustrates the empirical models used to estimate the total expenditure
elasticity for the energy-related goods and services: electricity and heating fuel first, and
private and public transportation consumption second. Sub-section 3.2 deals with the
eight non-energy goods and services whose total expenditure elasticity is estimated with
a simplified AIDS. The third sub-section (3.3) presents the survey data used in the
analysis.
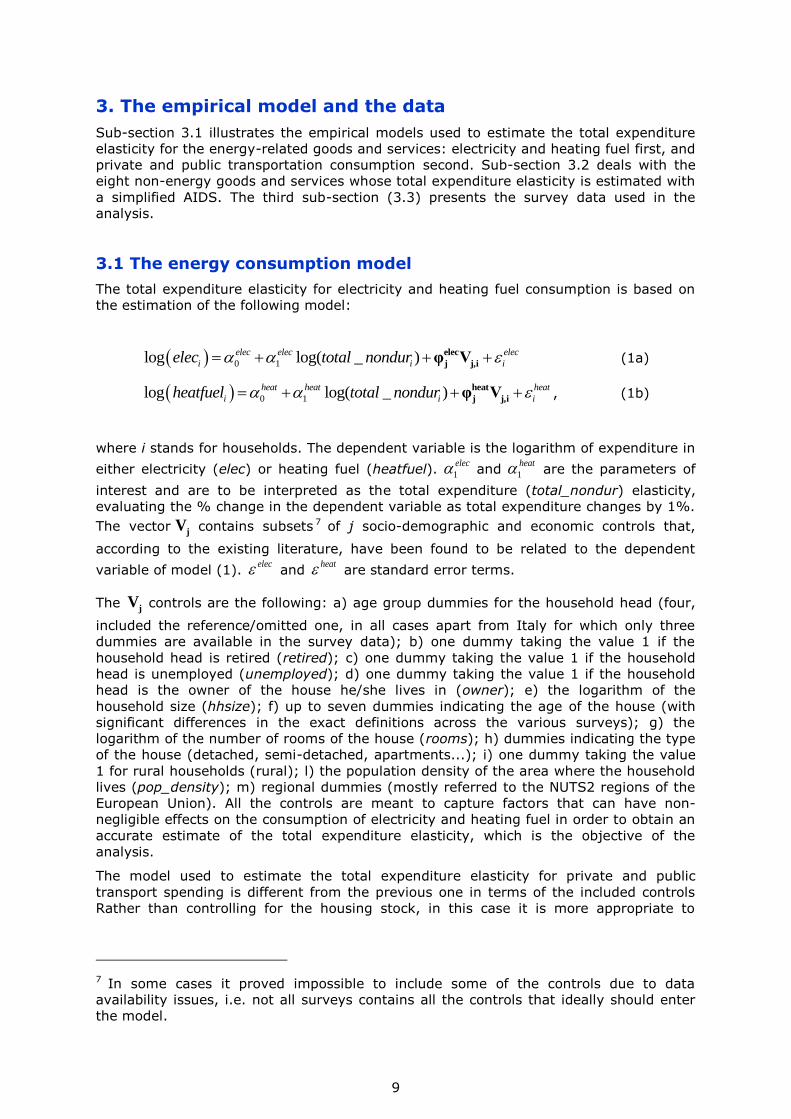
3.1 The energy consumption model
The total expenditure elasticity for electricity and heating fuel consumption is based on
the estimation of the following model:
0 1log log( _ )elec elec elec
i i ielec total nondur elec
j j,iφ V (1a)
0 1log log( _ )heat heat heat
i i iheatfuel total nondur heat
j j,iφ V , (1b)
where i stands for households. The dependent variable is the logarithm of expenditure in
either electricity (elec) or heating fuel (heatfuel). 1
elec and 1
heat are the parameters of
interest and are to be interpreted as the total expenditure (total_nondur) elasticity,
evaluating the % change in the dependent variable as total expenditure changes by 1%.
The vector jV contains subsets 7 of j socio-demographic and economic controls that,
according to the existing literature, have been found to be related to the dependent
variable of model (1). elec and
heat are standard error terms.
The jV controls are the following: a) age group dummies for the household head (four,
included the reference/omitted one, in all cases apart from Italy for which only three
dummies are available in the survey data); b) one dummy taking the value 1 if the
household head is retired (retired); c) one dummy taking the value 1 if the household
head is unemployed (unemployed); d) one dummy taking the value 1 if the household
head is the owner of the house he/she lives in (owner); e) the logarithm of the
household size (hhsize); f) up to seven dummies indicating the age of the house (with
significant differences in the exact definitions across the various surveys); g) the
logarithm of the number of rooms of the house (rooms); h) dummies indicating the type
of the house (detached, semi-detached, apartments...); i) one dummy taking the value
1 for rural households (rural); l) the population density of the area where the household
lives (pop_density); m) regional dummies (mostly referred to the NUTS2 regions of the
European Union). All the controls are meant to capture factors that can have non-
negligible effects on the consumption of electricity and heating fuel in order to obtain an
accurate estimate of the total expenditure elasticity, which is the objective of the
analysis.
The model used to estimate the total expenditure elasticity for private and public
transport spending is different from the previous one in terms of the included controls
Rather than controlling for the housing stock, in this case it is more appropriate to
7 In some cases it proved impossible to include some of the controls due to data
availability issues, i.e. not all surveys contains all the controls that ideally should enter
the model.

10
control for the vehicles' stock as this is what affects the demand for transportation
services. The model is the following:
0 1log log( _ )fuel fuel fuel
i i ifuel total nondur fuel
j j,iν N (2a)
0 1log log( _ )transport transport transport
i i itransport total nondur transport
j j,iν N , (2b)
where again i stands for households, and fuel and
transport are error terms. As
anticipated above, models (2a) and (2b) differ from models (1a) and (1b) in terms of
their dependent variables (in the former it is either expenditure for fuel for private
vehicles or for public transport, fuel and transport respectively) and for the vector of
controls. Note that public transport stands for train, bus, and coach transportation only,
and does not include expenditure for flights: the idea is to capture travels for which a
private car could be a viable alternative. 1
fuel and 1
transport are the parameters of
interest, and their interpretation is analogous to that of 1
elec and 1
heat in models (1a)
and (1b). The jN vector contains the following j variables: a) age group dummies for
the household head; b) one dummy taking the value 1 if the household head is retired
(retired); c) one dummy taking the value 1 if the household head is unemployed
(unemployed); d) one dummy taking the value 1 if the household head is the owner of
the house he/she lives in (owner); e) the logarithm of the household size (hhsize); f) a
dummy taking the value 1 when the household owns one car (one car); g) a dummy
taking the value 1 if the household owns two or more cars (more than one car)8; h) one
dummy taking the value 1 for rural households (rural); i) the population density of the
area where the household lives (pop_density); l) the regional dummies introduced
above.
3.2 The non-energy consumption model
The simplified AIDS that we use to estimate the total expenditure elasticity of the eight
non-energy commodities is the following (and it is in fact very close to the Working-
Leser model without prices - Working 1943, Leser 1963):
0 1 log( _ )x x x
i i iw total nonenergy x
k k,iθ M , (3)
where i stands for households and xw is the expenditure share of the xth commodity. 1
x
is the parameter of interest, but cannot be interpreted directly as the expenditure
elasticity like 1 and 1 in models (1) and (2) above. The total expenditure elasticity
has to be calculated as follows (Leser 1963):
11x
x
xelasticity
w
, (4)
8 Note that results are not affected when the number of vehicles is used instead: only a
tiny minority of households own more than two vehicles.

11
where xw is the sample average of the expenditure share of the xth commodity. The k
M
vector contains k variables: all those of vector jV above - see equations (1a) and (1b) -
plus those of the vector jN - see equations (2a) and (2b) - not included in j
V . is an
error term.
3.3 The data
The data used in the analysis come from household-level surveys conducted in the
2004/2006 period. While the main objective of most of those surveys is to obtain data
for the construction of the national Consumer Price Index (CPI) by the national statistical
institutions, the information gathered in the process permits us to conduct our analysis
using high-quality household-level datasets. Data for Austria, France, Italy, Slovakia,
Spain, and the UK are used separately to estimate the required expenditure elasticities
for the various commodities illustrated above. Then, a weighted average of those
elasticities (with GDP per capita as a weighting factor) is chosen as the value to be
utilised as a parameter in the FIDELIO model as explained in detail in sub-section 4.3
below.
Data for Austria are taken from the 2004/2005 Household Budget Survey produced by
Statistics Austria (Statistik Austria). This survey provides information on the
consumption expenditure of private households, and it contains information on
household income, on key characteristics of the household members (such as age and
occupation), as well as on the house the household lives in and the existing household
equipment. The Household Budget Survey is currently carried out once every five years.
Data for French households are taken from the 2006 Household Budget Survey (BDF)
produced by the National Institute of Statistics and Economic Studies (INSEE). The BDF
puts together the entire household accounts: expenditure and resources of households in
France (mainland and overseas departments). The study of expenditure is the traditional
and central purpose of the survey: all household spending is recorded, and the amount
and nature of these expenses is broken down into a classification of about 900
budgetary items compatible with the classification used in the national accounts. All
expenses are covered, including those not associated with the consumption of goods and
services (in the sense of the national accounts): taxes and contributions, insurance
premiums, major home renovation expenditure, inter-household transfers, purchase of
second-hand goods, loan repayments. This makes this survey the perfect instrument for
our analysis, also because the survey collects information on household socio-
demographic characteristics and equipment.
The Italian data come from the 2006 Household Budget Survey (Indagine sui Consumi
delle Famiglie) produced by the Italian National Institute for Statistics (ISTAT). This
survey contains data on household expenditures for consumption and on socio-
demographic characteristics useful for our analysis. However, its monthly nature
requires to be accounted for in the econometric specifications with month-specific
dummies included in order to avoid seasonality issues. For example, and all else being
equal, one household's heating fuel expenditure recorded in August will certainly differ
from another household's expenditure for the same item recorded in January. The
inclusion of monthly dummies controls for such differences due to the time of the year in
which ISTAT carried out the interviews.
Slovak data are taken from the 2005 Household Budget Survey (HBS) which, like those
above, contains information on household expenditure as well as on the household
structure and on features of housing and other equipment. The Statistical Office of the
Slovak Republic (Štatistický Úrad Slovenskej Republiky) is responsible for the publication
of the HBS. In producing the 2005 wave of that survey, the Statistical Office has taken

12
on board the Eurostat methodological recommendations in order to facilitate the creation
of a harmonised system of household-level datasets at the European Union level.
Data for Spanish household are contained in the 2004 Household Budget Continuous
Survey (Encuesta Continua de Presupuestos Familiares) produced by the National
Statistics Institute (INE). The survey includes many thousands of households in its
sample and provides quarterly and annual information that is essential both for
estimating the Spanish National Accounts household expenditure on consumption, and
for updating the CPI weightings. The consumption expenditure that is recorded in the
survey refers both to the monetary flow that the household pays for certain final
consumption goods and services, and to the value of certain non-monetary household
consumption. Household socio-demographic characteristics are recorded as well.
Finally, the 2004/2005 Expenditure and Food Survey (EFS, now called LCF) published by
the Office for National Statistics is the source of the UK data. The EFS/LCF is primarily
used to provide information for the Retail Prices Index (the British equivalent to CPI),
National Accounts estimates of household expenditure, analysis of the effect of taxes and
benefits, and trends in nutrition. The results are multi-purpose, however, providing a
rich supply of economic and social data, and in fact the survey proves to be a good
source of data for our analysis. The fact that the observations refer to two-weeks-long
periods is a drawback that we try to minimise in the econometric estimates by including
in the models appropriate period dummies (similarly to what we do for the Italian data).

13
4. Results
This section contains the results of the analysis and it is organised as follows: sub-
section 4.1 reports the results arising from the energy consumption equations; sub-
section 4.2 contains the results of the non-energy commodities' models. In all cases,
only the households for which non-zero total non-durables' expenditure and non-zero
values of the dependent variables have been used in the analysis (and the top 1.5% of
the distribution of the latter has been excluded in order to avoid the presence of outliers
in the sample). The sample is restricted to households whose head is between 20 and 85
years old, and survey weights have been used in all estimations. Sub-section 4.3
explains how the country-specific results are combined in order to produce the EU-level
estimates of the expenditure elasticities used in the FIDELIO model.
4.1 Energy-consumption results
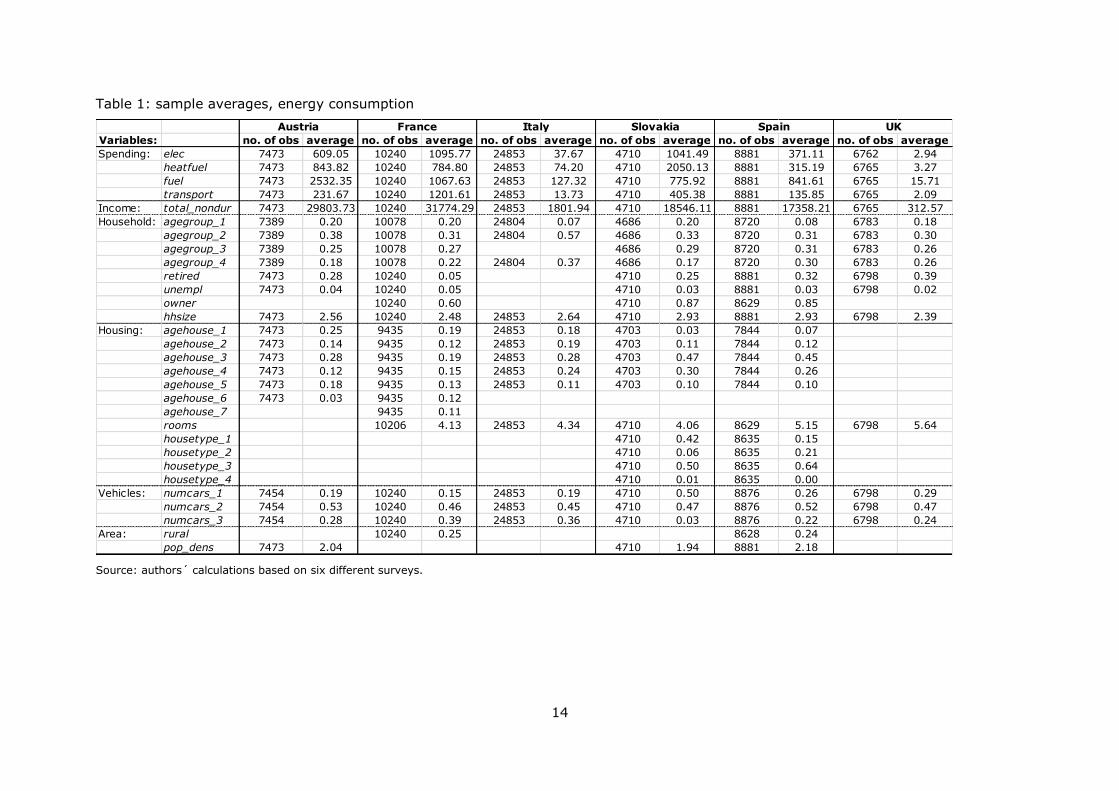
Table 1 contains the sample averages and the number of observations of the variables
used in the energy-related goods and services of the analysis. Each column of the table
refers to the data of each one of the six surveys used separately in the analysis. Since
not all variables are recorded in all surveys, there are empty cells in the table. Note that
the expenditure values are not directly comparable across countries due to the fact that
Italian figures are monthly and UK figures are referred to periods of two weeks (and are
expressed in pounds rather than in euros).
Tables 2 and 3 contain the results arising from the estimation of models (1a) and (1b)
for electricity consumption and for heating fuel consumption, respectively. Results are
mostly consistent across the various surveys. The estimated total expenditure elasticities
are always significant and within the range of the existing literature estimates. 9 The
expenditure elasticity for electricity consumption ranges from 0.05 (UK) to 0.33 (Spain),
while the elasticity for heating fuel lies between 0.12 (France) and 0.47 (Spain). As a
reminder, note that the existing literature point towards such elasticity to lie between
0.08 and 0.27, therefore it is compatible with our results.
Results for the controls are also mostly consistent across countries. Older households
appear to spend more on both electricity and heating fuel than younger ones, and the
larger the household size, the higher the expenditure for both commodities. Larger
houses (in terms of number of rooms) call for higher electricity and heating fuel
consumption. In the case of electricity consumption, the rural dummy and population
density both offer consistent results, with households living in rural areas and less-
densely populated consuming less than the others. The same does not hold for heating
fuel consumption. As for the rest of the controls, in some cases results are not
significant, and in others they are not consistent across countries, therefore it is harder
to draw neat conclusions.
Tables 4 and 5 contain the estimates of models (2a) and (2b) for fuel for private
transport and for public transport spending, respectively. Results are again reassuringly
consistent across the various surveys. The estimated expenditure elasticities are always
significant and within the range of the available literature estimates in the case of fuel
for private transport. The expenditure elasticity of the latter ranges from 0.33 (UK) to
0.94 (Austria), which is again compatible with the available evidence of the literature.
The expenditure elasticities for public transport consumption are not directly comparable
to those of the literature (for the reasons explained in sub-section 2.1), and lie between
0.29 (UK) and 0.58 (Austria).
9 Since both the dependent variable and the total expenditure variable are expressed in
logarithmic form, those numbers are to be interpreted as elasticities directly.
14
Table 1: sample averages, energy consumption
Source: authors´ calculations based on six different surveys.
Variables: no. of obs average no. of obs average no. of obs average no. of obs average no. of obs average no. of obs average
Spending: elec 7473 609.05 10240 1095.77 24853 37.67 4710 1041.49 8881 371.11 6762 2.94
heatfuel 7473 843.82 10240 784.80 24853 74.20 4710 2050.13 8881 315.19 6765 3.27
fuel 7473 2532.35 10240 1067.63 24853 127.32 4710 775.92 8881 841.61 6765 15.71
transport 7473 231.67 10240 1201.61 24853 13.73 4710 405.38 8881 135.85 6765 2.09
Income: total_nondur 7473 29803.73 10240 31774.29 24853 1801.94 4710 18546.11 8881 17358.21 6765 312.57
Household: agegroup_1 7389 0.20 10078 0.20 24804 0.07 4686 0.20 8720 0.08 6783 0.18
agegroup_2 7389 0.38 10078 0.31 24804 0.57 4686 0.33 8720 0.31 6783 0.30
agegroup_3 7389 0.25 10078 0.27 4686 0.29 8720 0.31 6783 0.26
agegroup_4 7389 0.18 10078 0.22 24804 0.37 4686 0.17 8720 0.30 6783 0.26
retired 7473 0.28 10240 0.05 4710 0.25 8881 0.32 6798 0.39
unempl 7473 0.04 10240 0.05 4710 0.03 8881 0.03 6798 0.02
owner 10240 0.60 4710 0.87 8629 0.85
hhsize 7473 2.56 10240 2.48 24853 2.64 4710 2.93 8881 2.93 6798 2.39
Housing: agehouse_1 7473 0.25 9435 0.19 24853 0.18 4703 0.03 7844 0.07
agehouse_2 7473 0.14 9435 0.12 24853 0.19 4703 0.11 7844 0.12
agehouse_3 7473 0.28 9435 0.19 24853 0.28 4703 0.47 7844 0.45
agehouse_4 7473 0.12 9435 0.15 24853 0.24 4703 0.30 7844 0.26
agehouse_5 7473 0.18 9435 0.13 24853 0.11 4703 0.10 7844 0.10
agehouse_6 7473 0.03 9435 0.12
agehouse_7 9435 0.11
rooms 10206 4.13 24853 4.34 4710 4.06 8629 5.15 6798 5.64
housetype_1 4710 0.42 8635 0.15
housetype_2 4710 0.06 8635 0.21
housetype_3 4710 0.50 8635 0.64
housetype_4 4710 0.01 8635 0.00
Vehicles: numcars_1 7454 0.19 10240 0.15 24853 0.19 4710 0.50 8876 0.26 6798 0.29
numcars_2 7454 0.53 10240 0.46 24853 0.45 4710 0.47 8876 0.52 6798 0.47
numcars_3 7454 0.28 10240 0.39 24853 0.36 4710 0.03 8876 0.22 6798 0.24
Area: rural 10240 0.25 8628 0.24
pop_dens 7473 2.04 4710 1.94 8881 2.18
UKAustria France Italy Slovakia Spain

Table 2: electricity consumption estimates, model (1a)
Note: standard errors in parenthesis. ***, **, * indicate significance at 1, 5, and 10% respectively. Survey weights are used in all cases. Period dummies are included in the Italian and the UK estimates due to the non-yearly frequency of the data. The age group dummies in the Italian data are different from the rest and the two categories for the older households are merged into one.
Table 3: heating fuel consumption estimates, model (1b)
Note: standard errors in parenthesis. ***, **, * indicate significance at 1, 5, and 10% respectively. Survey weights are used in all cases. Period dummies are included in the Italian and the UK estimates due to the non-yearly frequency of the data. The age group dummies in the Italian data are different from the rest and the two categories for the older households are merged into one.
Variables Austria France Italy Slovakia Spain UK
log(total_nondur) 0.18*** 0.30*** 0.18*** 0.17*** 0.33*** 0.05***
age(35-49) 0.13*** 0.03 0.10*** 0.04** 0.03 0.04*
age(50-64) 0.23*** 0.18*** 0.06*** 0.06** 0.10***
age(65+) 0.15*** 0.18*** 0.11*** -0.01 0.09** 0.03
retired -0.03 -0.06 -0.02 -0.03* 0.01
unemployed 0.07* 0.01 0.04 -0.02 0.06
owner -0.52*** 0.03 0.04
log(hhsize) 0.46*** 0.19*** 0.50*** 0.28*** 0.17*** 0.33***
agehouse_2 0.08*** 0.02 -0.03** 0.19** -0.02
agehouse_3 0.03 0.01 -0.05*** 0.15* -0.03
agehouse_4 0.04 0.07** -0.08*** 0.12 0.03
agehouse_5 0.06** 0.16*** 0.11 0.06*
agehouse_6 -0.02 0.24***
agehouse_7 0.18***
log(rooms) 0.21*** 0.36*** 0.32*** 0.20*** 0.17***
housetype_2 -0.21*** 0.02
housetype_3 -0.27*** 0.01
housetype_4 -0.34** -0.08
rural -0.09*** -0.06***
pop_dens -0.08*** -0.08*** -0.02**
Regional dummies YES YES YES NO YES YES
Constant 4.10*** 3.30*** 0.77*** 4.48*** 2.02*** 0.96***
No. of obs. 6336 8977 24657 4058 7545 2844
R20.32 0.17 0.27 0.31 0.33 0.20
Variables Austria France Italy Slovakia Spain UK
log(total_nondur) 0.33*** 0.12*** 0.33*** 0.23*** 0.47*** 0.14***
age(35-49) 0.06* 0.06 0.11*** 0.00 0.00 0.08*
age(50-64) 0.16** 0.11*** 0.03 0.05 0.14***
age(65+) 0.22*** 0.32*** 0.26*** 0.04 0.12** 0.18***
retired 0.02 -0.14** 0.02 0.02 0.02
unemployed 0.13*** -0.05 -0.02 0.05 -0.10
owner 0.15*** 0.20*** 0.09***
log(hhsize) 0.31*** 0.08*** 0.12*** 0.04 0.08** 0.08*
agehouse_2 0.05 0.09** -0.02 0.25** 0.11**
agehouse_3 0.07** -0.11*** -0.04* 0.34*** 0.14***
agehouse_4 0.07* -0.15*** 0.05** 0.38*** 0.17***
agehouse_5 -0.03 -0.19*** 0.05* 0.21** 0.29***
agehouse_6 -0.04 -0.35***
agehouse_7 -0.18***
log(rooms) 0.76*** 0.59*** 0.67*** 0.36*** 0.68***
housetype_2 -0.12** -0.03
housetype_3 -0.02 -0.16***
housetype_4 -0.15 0.01
rural 0.20*** -0.06*
pop_dens -0.03 0.10*** -0.05***
Regional dummies YES YES YES NO YES YES
Constant 3.05*** 3.73*** 0.89*** 3.56*** -0.38** -0.46***
No. of obs. 6272 6587 22752 3875 7075 2413
R20.18 0.17 0.30 0.18 0.37 0.25

16
Table 4: consumption of fuel for private transport estimates, model (2a)
Note: standard errors in parenthesis. ***, **, * indicate significance at 1, 5, and 10% respectively. Survey weights are used in all cases. Period dummies are included in the Italian and the UK estimates due to the non-yearly frequency of the data. The age group dummies in the Italian data are different from the rest and the two categories for the older households are merged into one.
Table 5: public transport consumption estimates, model (2b)
Note: standard errors in parenthesis. ***, **, * indicate significance at 1, 5, and 10% respectively. Survey weights are used in all cases. Period dummies are included in the Italian and the UK estimates due to the non-yearly frequency of the data. The age group dummies in the Italian data are different from the rest and the two categories for the older households are merged into one.
Results for the controls are also mostly consistent across countries. For both types of
expenditure, the households whose heads are older than 65 years old and/or are retired
spend less than those whose heads are below 35 years old (which is the reference
category in the econometric specification). Households owning one car obviously
consume more fuel than those with no cars, and having more than one car also impacts
positively on fuel consumption. The other side of this is reflected in the negative
coefficients of the car dummies in the public transport model: owning one or more cars
lowers the expenditure for public transport. Living in rural areas impacts positively on
fuel consumption and negatively on public transport spending, possibly due to the fact
that rural areas are poorly served by public transport services and rural households rely
more on their private vehicles to move (the same result arises from the coefficients
associated with population density). As for the rest of the controls, in some cases
coefficients are not significant, and in others they are not consistent across surveys,
therefore it is more problematic to draw neat conclusions.
Variables Austria France Italy Slovakia Spain UK
log(total_nondur) 0.94*** 0.34*** 0.47*** 0.68*** 0.83*** 0.33***
age(35-49) -0.02 -0.02 -0.04** -0.15*** -0.08** 0.03
age(50-64) -0.11** -0.01 -0.23*** -0.07 0.02
age(65+) -0.24*** -0.14*** -0.10*** -0.19** -0.08 -0.11***
retired -0.08 -0.08 -0.10* -0.01 -0.10***
unemployed 0.12* -0.15*** -0.14 -0.01 -0.07
log(hhsize) -0.26*** -0.06* -0.04** -0.10* 0.02** -0.01
one car 0.26*** 0.49*** 0.38*** 0.40*** 0.21*** 0.14***
more than one car 0.59*** 0.73*** 0.54*** 0.59*** 0.29*** 0.45***
rural 0.08*** 0.12***
pop_dens -0.06*** 0.02 -0.03*
Regional dummies YES YES YES NO YES YES
Constant -1.84*** 3.21*** 1.11*** 0.22 -1.49*** 0.85***
No. of obs. 6128 6250 17811 2157 5649 4091
R20.26 0.20 0.27 0.25 0.29 0.26
Variables Austria France Italy Slovakia Spain UK
log(total_nondur) 0.58*** 0.49*** 0.50*** 0.56*** 0.45*** 0.29***
age(35-49) -0.18** -0.22*** 0.02 0.15** -0.05 -0.19***
age(50-64) 0.03 -0.21*** 0.12* -0.07 -0.04
age(65+) -0.11 -0.38*** -0.14* -0.42*** -0.27** -0.21***
retired -0.17 -0.01 -0.48*** 0.06 -0.12**
unemployed 0.15 -0.01 -0.17 -0.15 0.09
log(hhsize) -0.37*** 0.14*** 0.10 0.43*** -0.00 0.11
one car -0.35*** 0.34*** -0.24*** -0.31*** -0.45*** -0.23***
more than one car -0.55*** 0.64*** -0.21*** -0.50*** -0.55*** -0.27***
rural -0.14*** -0.14*
pop_dens 0.17*** 0.02 0.41***
Regional dummies YES YES YES NO YES YES
Constant -0.04 1.39*** -0.24 0.04 -0.33*** -0.11
No. of obs. 2854 9166 5990 2737 4852 1934
R20.13 0.33 0.11 0.28 0.15 0.12

17
4.2 Non-energy consumption results
Table 6 contains the sample averages and the number of observations available in each
survey for the non-energy-related expenditure shares used as dependent variables in
the simplified AIDS illustrated in Sub-section 3.2. Table 6 also reports the same
information for total non-energy non-durables' expenditure, which is the main variable of
interest and whose coefficient will constitute the basis for the calculations of the
expenditure elasticities in this case.
It is interesting to note that the food expenditure share (food) is in all cases substantial,
as well as the share devoted to recreation and accommodation (recreation). Additionally,
the magnitude of the various shares across countries is somewhat comparable (with
some exceptions, such as the extremely large financial share in France). Tables 7-12
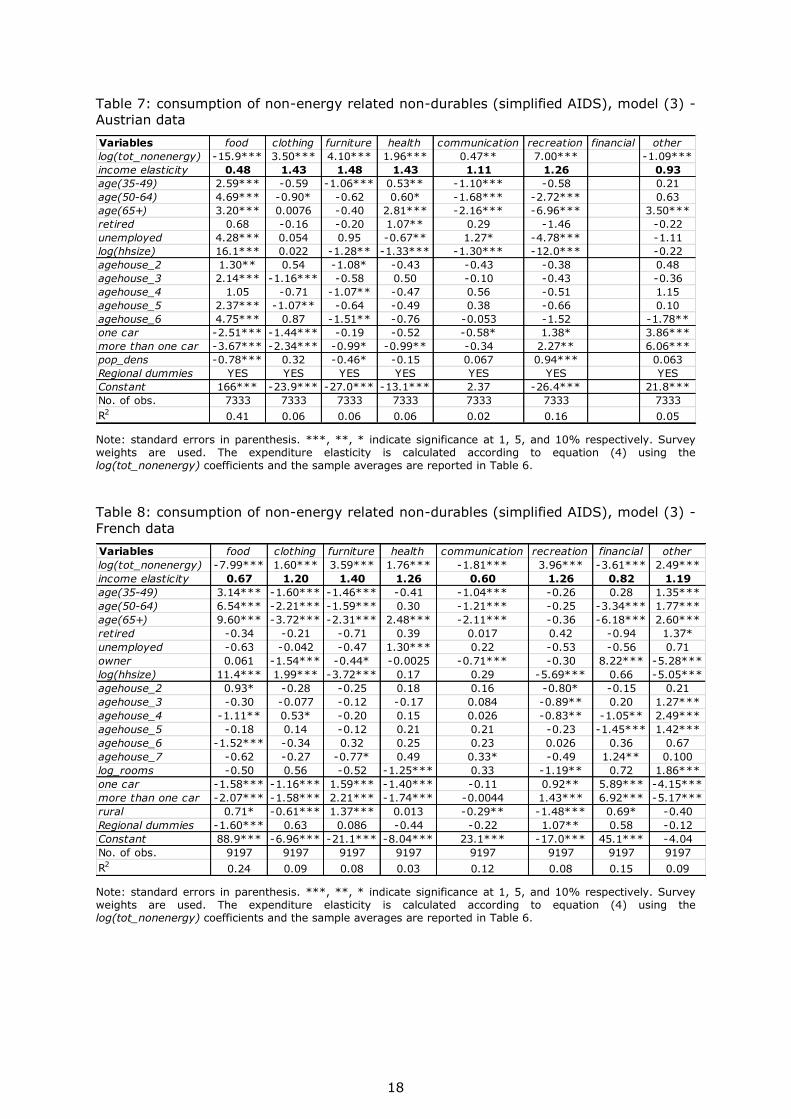
present the estimates of equation (3) above (since the set of controls is the same for all
commodity shares, organising the tables on a country-by-country basis seems the most
sensible thing to do in this case). The first row contains the estimated coefficients
associated with total expenditure, and the second row presents (in bold) the resulting
elasticity obtained by applying equation (4) above.
The estimates offer interesting results, with the overwhelming majority of the
expenditure elasticities being statistically significant and with a number of controls also
associated with significant coefficients. An overall consistent picture emerges from the
results contained in Tables 7-12: food and communication turn out to be necessary
goods (with expenditure elasticities below one, apart from the case of communication in
Austria). On the other hand, clothing, furniture, health, and recreation seem to be
superior/luxury goods (the only exception being the elasticity below one for health with
the Slovakian data). financial and other are the two only commodities for which our
estimates do not permit to draw neat conclusions, and the latter case at least is
understandable on the ground that other is a residual category containing a wide variety
of expenditures that differ across the six surveys.
Table 6: sample averages, non-energy consumption
Source: authors´ calculations based on six different surveys (see section 3.3 for details).
Variables: Austria France Italy Slovakia Spain UK
food 30.89 23.89 36.94 44.94 30.64 24.43
clothing 8.02 8.04 9.83 7.22 10.04 6.80
furniture 8.51 8.94 7.23 8.02 14.75 26.58
health 4.59 6.71 10.92 8.59 3.20 4.60
communication 4.42 4.47 4.24 6.67 4.34 4.70
recreation 27.10 15.07 12.86 13.64 19.50 28.66
financial missing 19.98 7.01 2.66 4.46 0.49
other 16.47 12.89 10.98 8.26 13.08 3.72
Income: total_nonenergy 19401.07 26601.17 1501.87 13939.40 15694.45 292.65
Number of obs. 7436 10240 24727 4686 8881 6556
Spending shares:
18
Table 7: consumption of non-energy related non-durables (simplified AIDS), model (3) -
Austrian data
Note: standard errors in parenthesis. ***, **, * indicate significance at 1, 5, and 10% respectively. Survey weights are used. The expenditure elasticity is calculated according to equation (4) using the log(tot_nonenergy) coefficients and the sample averages are reported in Table 6.
Table 8: consumption of non-energy related non-durables (simplified AIDS), model (3) -
French data
Note: standard errors in parenthesis. ***, **, * indicate significance at 1, 5, and 10% respectively. Survey weights are used. The expenditure elasticity is calculated according to equation (4) using the log(tot_nonenergy) coefficients and the sample averages are reported in Table 6.
Variables food clothing furniture health communication recreation financial other
log(tot_nonenergy) -15.9*** 3.50*** 4.10*** 1.96*** 0.47** 7.00*** -1.09***
income elasticity 0.48 1.43 1.48 1.43 1.11 1.26 0.93
age(35-49) 2.59*** -0.59 -1.06*** 0.53** -1.10*** -0.58 0.21
age(50-64) 4.69*** -0.90* -0.62 0.60* -1.68*** -2.72*** 0.63
age(65+) 3.20*** 0.0076 -0.40 2.81*** -2.16*** -6.96*** 3.50***
retired 0.68 -0.16 -0.20 1.07** 0.29 -1.46 -0.22
unemployed 4.28*** 0.054 0.95 -0.67** 1.27* -4.78*** -1.11
log(hhsize) 16.1*** 0.022 -1.28** -1.33*** -1.30*** -12.0*** -0.22
agehouse_2 1.30** 0.54 -1.08* -0.43 -0.43 -0.38 0.48
agehouse_3 2.14*** -1.16*** -0.58 0.50 -0.10 -0.43 -0.36
agehouse_4 1.05 -0.71 -1.07** -0.47 0.56 -0.51 1.15
agehouse_5 2.37*** -1.07** -0.64 -0.49 0.38 -0.66 0.10
agehouse_6 4.75*** 0.87 -1.51** -0.76 -0.053 -1.52 -1.78**
one car -2.51*** -1.44*** -0.19 -0.52 -0.58* 1.38* 3.86***
more than one car -3.67*** -2.34*** -0.99* -0.99** -0.34 2.27** 6.06***
pop_dens -0.78*** 0.32 -0.46* -0.15 0.067 0.94*** 0.063
Regional dummies YES YES YES YES YES YES YES
Constant 166*** -23.9*** -27.0*** -13.1*** 2.37 -26.4*** 21.8***
No. of obs. 7333 7333 7333 7333 7333 7333 7333
R20.41 0.06 0.06 0.06 0.02 0.16 0.05
Variables food clothing furniture health communication recreation financial other
log(tot_nonenergy) -7.99*** 1.60*** 3.59*** 1.76*** -1.81*** 3.96*** -3.61*** 2.49***
income elasticity 0.67 1.20 1.40 1.26 0.60 1.26 0.82 1.19
age(35-49) 3.14*** -1.60*** -1.46*** -0.41 -1.04*** -0.26 0.28 1.35***
age(50-64) 6.54*** -2.21*** -1.59*** 0.30 -1.21*** -0.25 -3.34*** 1.77***
age(65+) 9.60*** -3.72*** -2.31*** 2.48*** -2.11*** -0.36 -6.18*** 2.60***
retired -0.34 -0.21 -0.71 0.39 0.017 0.42 -0.94 1.37*
unemployed -0.63 -0.042 -0.47 1.30*** 0.22 -0.53 -0.56 0.71
owner 0.061 -1.54*** -0.44* -0.0025 -0.71*** -0.30 8.22*** -5.28***
log(hhsize) 11.4*** 1.99*** -3.72*** 0.17 0.29 -5.69*** 0.66 -5.05***
agehouse_2 0.93* -0.28 -0.25 0.18 0.16 -0.80* -0.15 0.21
agehouse_3 -0.30 -0.077 -0.12 -0.17 0.084 -0.89** 0.20 1.27***
agehouse_4 -1.11** 0.53* -0.20 0.15 0.026 -0.83** -1.05** 2.49***
agehouse_5 -0.18 0.14 -0.12 0.21 0.21 -0.23 -1.45*** 1.42***
agehouse_6 -1.52*** -0.34 0.32 0.25 0.23 0.026 0.36 0.67
agehouse_7 -0.62 -0.27 -0.77* 0.49 0.33* -0.49 1.24** 0.100
log_rooms -0.50 0.56 -0.52 -1.25*** 0.33 -1.19** 0.72 1.86***
one car -1.58*** -1.16*** 1.59*** -1.40*** -0.11 0.92** 5.89*** -4.15***
more than one car -2.07*** -1.58*** 2.21*** -1.74*** -0.0044 1.43*** 6.92*** -5.17***
rural 0.71* -0.61*** 1.37*** 0.013 -0.29** -1.48*** 0.69* -0.40
Regional dummies -1.60*** 0.63 0.086 -0.44 -0.22 1.07** 0.58 -0.12
Constant 88.9*** -6.96*** -21.1*** -8.04*** 23.1*** -17.0*** 45.1*** -4.04
No. of obs. 9197 9197 9197 9197 9197 9197 9197 9197
R20.24 0.09 0.08 0.03 0.12 0.08 0.15 0.09

19
Table 9: consumption of non-energy related non-durables (simplified AIDS), model (3) -
Italian data
Note: standard errors in parenthesis. ***, **, * indicate significance at 1, 5, and 10% respectively. Survey weights are used. Period dummies are included due to the non-yearly frequency of the data. The expenditure elasticity is calculated according to equation (4) using the log(tot_nonenergy) coefficients and the sample averages are reported in Table 6.
Table 10: consumption of non-energy related non-durables (simplified AIDS), model (3)
- Slovakian data
Note: standard errors in parenthesis. ***, **, * indicate significance at 1, 5, and 10% respectively. Survey weights are used. The expenditure elasticity is calculated according to equation (4) using the
log(tot_nonenergy) coefficients and the sample averages are reported in Table 6 (in the other case it is set to 1.00 due to the not significant estimated coefficient).
Variables food clothing furniture health communication recreation financial other
log(tot_nonenergy) -13.6*** 3.26*** 4.69*** 2.55*** -2.13*** 5.64*** -3.31*** 2.92***
income elasticity 0.63 1.33 1.67 1.23 0.50 1.44 0.53 1.27
age(35-49) 2.31*** -0.94*** -0.59* 0.20 0.53*** -1.10*** -0.44** 0.025
age(50+) 6.14*** -3.16*** 0.70** 3.53*** 0.26** -5.00*** -1.55*** -0.92**
log(hhsize) 13.8*** -1.97*** -2.83*** -1.15*** 0.44*** -7.04*** -0.45*** -0.78**
agehouse_2 -0.17 0.20 0.24 -0.57** -0.028 0.16 -0.21 0.37
agehouse_3 -0.34 0.26 0.38* -0.22 0.040 -0.21 -0.17 0.27
agehouse_4 -0.39 0.40* 0.19 0.054 0.11 -0.19 -0.088 -0.082
agehouse_5 -1.95*** 0.57* 0.93*** 0.026 -0.057 0.31 0.19 -0.023
log_rooms -1.35*** 0.66* 0.049 -1.15*** 0.66*** 0.38 1.17*** -0.43
one car -4.63*** 0.038 -1.71*** -3.77*** 0.11 1.80*** 8.34*** -0.19
more than one car -7.51*** 0.68** -2.60*** -4.59*** 0.43*** 2.02*** 12.0*** -0.42
Regional dummies 0.37 -0.55* 0.017 -0.47 -0.18 1.10** 0.29 -0.57
Constant 119*** -10.2*** -22.6*** -2.12** 17.3*** -17.5*** 22.8*** -6.28***
No. of obs. 24658 24658 24658 24658 24658 24658 24658 24658
R20.45 0.09 0.09 0.07 0.13 0.19 0.33 0.05
Variables food clothing furniture health communication recreation financial other
log(tot_nonenergy) -14.8*** 3.97*** 6.95*** -0.54** -1.11*** 4.17*** 1.07*** 0.30
income elasticity 0.67 1.55 1.87 0.94 0.83 1.31 1.40 1.00
age(35-49) 1.58*** -1.04*** -0.50 -0.50* -0.13 -0.12 -0.35 1.06***
age(50-64) 5.68*** -2.19*** -0.20 -0.56* -0.70** -2.28*** -0.22 0.47
age(65+) 7.73*** -2.44*** -0.097 1.00 -2.40*** -3.08*** -0.39 -0.32
retired 2.64*** -0.27 1.53** 1.50*** -0.65* -3.83*** -0.35 -0.57
unemployed 2.14 -0.90 0.44 0.19 -1.37** -3.62*** -0.052 3.16***
owner 0.36 -0.30 0.58 -0.37 -0.36 0.45 0.10 -0.46
log(hhsize) 15.4*** -1.84*** -6.28*** -1.50*** -0.49 -3.98*** -0.57* -0.76
agehouse_2 -1.04 0.65 0.50 1.56* 0.56 -1.69 0.63 -1.17
agehouse_3 -0.96 1.33** 0.43 1.15* 0.59 -1.71 0.32 -1.16
agehouse_4 -2.04 1.29** 0.085 1.32** 0.93 -1.22 0.32 -0.67
agehouse_5 -3.82** 2.08*** 0.98 1.35** 0.94 -1.11 0.19 -0.62
log_rooms -0.44 -0.71 -0.42 0.019 0.91** 0.69 0.79** -0.83
housetype_2 -0.93 -0.69 -1.48** 0.24 -0.16 1.10 -0.40 2.31***
housetype_3 -1.95*** -0.30 -1.11** 0.093 0.59** 0.55 -0.034 2.16***
housetype_4 -2.10 -0.072 -2.47 0.69 1.00 6.56*** -0.86* -2.74**
one car -1.83*** -0.31 -0.77** 0.053 0.66*** 0.90** 1.74*** -0.44
more than one car 0.18 -1.48** -2.71*** 0.63 1.01** 0.61 1.71** 0.047
pop_dens -1.41*** 0.078 -1.50*** 0.00093 0.28* 1.38*** 0.18 0.99***
Regional dummies NO NO NO NO NO NO NO NO
Constant 166*** -25.7*** -45.3*** 14.4*** 15.6*** -21.3*** -9.10*** 5.85
No. of obs. 4655 4655 4655 4655 4655 4655 4655 4655
R20.38 0.11 0.11 0.06 0.05 0.14 0.06 0.06

20
Table 11: consumption of non-energy related non-durables (simplified AIDS), model (3)
- Spanish data
Note: standard errors in parenthesis. ***, **, * indicate significance at 1, 5, and 10% respectively. Survey weights are used. The expenditure elasticity is calculated according to equation (4) using the log(tot_nonenergy) coefficients and the sample averages are reported in Table 6.
Table 12: consumption of non-energy related non-durables (simplified AIDS), model (3)
- UK data
Note: standard errors in parenthesis. ***, **, * indicate significance at 1, 5, and 10% respectively. Survey weights are used. Period dummies are included due to the non-yearly frequency of the data. The expenditure elasticity is calculated according to equation (4) using the log(tot_nonenergy) coefficients and the sample averages are reported in Table 6 (in the health and other cases it is set to 1.00 due to the not significant estimated coefficient).
Variables food clothing furniture health communication recreation financial other
log(tot_nonenergy) -8.78*** 0.78*** 4.64*** 0.45*** -1.52*** 6.76*** -1.20*** -1.12***
income elasticity 0.71 1.08 1.31 1.14 0.65 1.35 0.73 0.91
age(35-49) 1.85*** 0.061 0.14 0.46*** -0.82*** -1.48** -0.21 0.0037
age(50-64) 4.25*** -0.56 0.038 0.88*** -0.90*** -3.28*** 0.079 -0.52
age(65+) 7.36*** -0.77 0.81 0.49* -1.29*** -6.53*** 0.45 -0.54
retired 0.12 -0.58** 0.064 0.12 -0.23** 0.93** -0.18 -0.25
unemployed 0.31 -0.84* 0.69 -0.27 0.090 -0.22 0.48 -0.23
owner -0.87* 0.050 1.34*** 0.021 -0.32** -1.03** 0.047 0.77**
log(hhsize) 9.03*** -0.77** -3.11*** -0.88*** 0.011 -2.61*** -0.77*** -0.90**
agehouse_2 2.78*** 0.63 0.39 -0.71** -0.078 -2.82*** 0.087 -0.27
agehouse_3 1.97** 0.043 0.89 -0.52 0.20 -2.31*** 0.24 -0.50
agehouse_4 1.66** -0.022 0.45 -0.47 0.25 -2.46*** 0.70** -0.10
agehouse_5 1.53* 0.56 0.53 -0.40 -0.0036 -3.09*** 0.54* 0.33
log_rooms -1.60* 0.29 -1.40* 0.12 0.48** -1.96** 0.50* 3.56***
housetype_2 0.14 -0.20 -0.33 -0.057 0.10 0.71 -0.13 -0.23
housetype_3 -0.74 0.040 -2.32*** -0.088 0.31** 1.07** -0.33 2.06***
housetype_4 -5.27 1.48 0.99 -1.60*** -0.021 1.23 -0.40 3.60
one car -2.96*** -0.40 3.19*** -0.41** 0.11 0.076 1.80*** -1.41***
more than one car -4.26*** -0.67** 2.95*** -0.32 0.29** 0.48 2.81*** -1.28***
rural -0.61 -0.30 2.30*** -0.040 -0.090 0.55 -0.17 -1.64***
pop_dens -0.75** -0.50*** -0.32 -0.13 0.19*** 0.28 0.31*** 0.92***
Regional dummies YES YES YES YES YES YES YES YES
Constant 104*** 5.62** -25.0*** 0.42 18.2*** -32.1*** 13.3*** 16.0***
No. of obs. 7658 7658 7658 7658 7658 7658 7658 7658
R20.24 0.04 0.12 0.02 0.13 0.19 0.09 0.10
Variables food clothing furniture health communication recreation financial other
log(tot_nonenergy) -9.96*** 1.26*** 8.42*** 0.10 -2.61*** 2.66*** 0.22*** -0.10
income elasticity 0.59 1.19 1.32 1.02 0.45 1.09 1.45 1.00
age(35-49) 2.25*** -0.75** -0.26 -0.42** -0.26 0.14 -0.34*** -0.37
age(50-64) 5.62*** -1.13*** -2.47*** 0.23 -0.57*** -1.03* -0.59*** -0.06
age(65+) 6.96*** -1.68*** -0.52 1.30*** -1.16*** -2.10*** -0.15 -2.66***
retired -0.81* 0.28 2.54*** -0.18 -0.28 -2.28*** -0.03 0.76**
unemployed 3.13** -0.28 -2.60* -1.12*** -1.64*** 0.50 -0.29** 2.30**
log(hhsize) 9.86*** 3.27*** -11.82*** 0.16 1.48*** -4.36*** 0.29*** 1.11***
one car -0.37 -0.43 -0.88 0.22 -0.04 2.79*** -0.17** -1.12***
more than one car -1.08** -1.01*** -1.14 0.19 0.24 4.09*** -0.16 -1.13***
Regional dummies (3.33) (3.13) (4.03) (5.88) (1.09) (2.02) (0.27) (2.24)
Constant 64.98*** -0.46 -3.66 0.48 16.74*** 19.63*** -0.61** 2.91**
No. of obs. 6541 6541 6541 6541 6541 6541 6541 6541
R20.32 0.06 0.11 0.02 0.18 0.06 0.02 0.03

21
4.3 EU-level expenditure elasticities
The ideal way to proceed for the estimation of the expenditure elasticities to be used for
all the EU27 countries featured in the FIDELIO model would have been to use country-
specific household-level panel data. Such a procedure would have also permitted the
contemporary estimation of the price elasticities with a unique model. Unfortunately,
such dataset simply does not exist, therefore cross-sectional data have to be used. This
implies that the expenditure elasticities need to be estimated separately from the price
elasticities (for which macro-aggregate time series data are in fact used and whose
illustration is beyond the scope of the present document). An additional complication
stems from the fact that cross-sectional data on non-durables' consumption of
households are not available for all the EU27 countries. Thus, we used the existing data,
only available for six of those countries, to produce credible estimates of the expenditure
elasticities for the 27 European countries of the latest version of the FIDELIO model as
explained below.
In all cases but two, i.e. financial and other, results are consistent across countries,
although magnitudes vary as reported above. In principle, using the simple average of
the elasticities arising from the six surveys for all the European countries in FIDELIO
would be a viable way to proceed. However, we decided to use a weighted average
based on GDP per capita in order to have values as representative as possible of the EU
countries in terms of their incomes. Table 13 shows that the differences between the
simple averages and the weighted averages of the elasticities are far from being
dramatic. As for financial and other, we simply set the elasticity equal to one in order to
define them as normal goods without taking a stand on whether they should be
considered necessary or superior goods.
Table 13: EU-level total expenditure elasticities for the four energy-related non-durables
and for the eight non-energy related non-durables
Note: the financial and the other income elasticities are set to 1.00 due to the inconsistent results across the various surveys.
Energy income elasticitiesAustria France Italy Slovakia Spain UK
Simple
average
Weighted
average
elec 0.18 0.30 0.18 0.17 0.33 0.05 0.20 0.20
heatfuel 0.33 0.12 0.33 0.23 0.47 0.14 0.27 0.26
fuel 0.94 0.34 0.47 0.68 0.83 0.33 0.60 0.58
transport 0.58 0.49 0.50 0.56 0.45 0.29 0.48 0.47
Non-energy income elasticitiesAustria France Italy Slovakia Spain UK
Simple
average
Weighted
average
food 0.48 0.67 0.63 0.67 0.71 0.59 0.63 0.61
clothing 1.44 1.20 1.33 1.55 1.08 1.19 1.30 1.27
furniture 1.48 1.40 1.67 1.87 1.31 1.32 1.51 1.46
health 1.43 1.26 1.23 0.94 1.14 1.00 1.17 1.20
communication 1.11 0.60 0.50 0.83 0.65 0.45 0.69 0.68
recreation 1.26 1.26 1.44 1.31 1.35 1.09 1.29 1.27
financial missing 0.82 0.53 1.40 0.73 1.45 1.00 1.00
other 0.93 1.19 1.27 1.00 0.91 1.00 1.00 1.00

22
5. Conclusions
This document presents the estimates of the total expenditure elasticity for four energy-
related and eight non-energy-related non-durable goods and services used in the latest
version of the FIDELIO model. The estimates are based on survey data for the following
six European countries: Austria, France, Italy, Slovakia, Spain, and the UK. The
document illustrates the empirical analysis carried out in order to obtain the required
results, and demonstrates that results are comparable to those of the existing literature,
when available. The energy commodities appear to be necessary goods, with positive
elasticities smaller than one; of the eight non-energy related commodities, two appear to
be necessary goods as well (food and communication), four appear to be superior goods
(clothing, furniture, recreation, and health), and two are set to be normal goods with an
expenditure elasticity equal to one due to the lack of significant econometric results.

23
References
Abdulai, A. (2002). Household demand for food in Switzerland. A quadratic almost ideal
demand system. Swiss Journal of Economics and Statistics 138(I), 1-18.
Baker, P, Blundell, R.W., Micklewright, J. (1989). Modelling household energy
expenditures using micro-data. Economic Journal 99, 720-738.
Browning, M., Crossley, T.F. (2000). Luxuries are easier to postpone: a proof. Journal of
Political Economy 108(5), 1022-1026.
Buse, A. (1994). Evaluating the linearized Almost Ideal Demand System. American
Journal of Agricultural Economics 74, 781-793.
Dahl, C.A. (2012). Measuring global gasoline and diesel price and income elasticities.
Energy Policy 41, 2-13.
Deaton, A., Muelbauer, J. (1980). An Almost Ideal Demand System. American Economic
Review 70(3), 312-326.
Druckman , A., Jackson, T. (2008). Household energy consumption in the UK: a highly
geographically and socio-economically disaggregated model. Energy Policy 36, 3167-
3182.
Dubin, J., McFadden, D. (1984). An econometric analysis of residential electric appliance
holdings and consumption. Econometrica 52, 345-362.
Filippini, M. (1995). Swiss residential demand for electricity by time-of-use. Resource
and Energy Economics 17, 281-290.
Filippini, M., Pachauri, S. (2004). Elasticities of electricity demand in urban Indian
households. Energy Policy 32, 429-436.
FitzRoy, F., Smith, I. (1998). Public transport demand in Freiburg: why did patronage
double in a decade? Transport policy 5(3), 163-173.
García-Cerruti, L. (2000). Estimating elasticities of residential energy demand from panel
county data using dynamic random variables models with heteroskedastic and correlated
error terms. Resource and Energy Economics 22, 355-366.
Graham, D.J., Glaister, S. (2002). The demand for automobile fuel - A survey of
elasticities. Journal of Transport Economics and Policy 36(1), 1-26.
Haas, R., Schipper, L. (1998). Residential energy demand in OECD countries and the role
of irreversible efficiency improvements. Energy Economics 20, 421-442.
Halvorsen, B., Larsen, B. (2001). The flexibility of household electricity demand over
time. Resource and Energy Economics 23, 1-18.
Holtedahl, P., Joutz, F. (2004). Residential electricity demand in Taiwan. Energy
Economics 26, 201-224.
Hondroyiannis, G. (2004). Estimating residential demand for electricity in Greece.
Energy Economics 26, 319-334.
Johanssen-Stenman, O. (2002). Estimating individual driving distance by car and public
transport use in Sweden. Applied Economics 34(8), 959-967.
Kamerschen, D., Porter, D. (2004). The demand for residential, industrial and total
electricity 1973-1998. Energy Economics 26, 87-100.
Kratena, K., Streicher, G., Temurshoev, U., Amores, A.F., Arto, I., Mongelli, I., Neuwahl,
F., Rueda-Cantuche, J.M., Andreoni, V. (2013). FIDELIO 1: Fully Interregional Dynamic
Econometric Long-term Input-Output model for the EU27. JRC Scientific and Policy
Report EUR 25985 EN.

24
Labanderia, X., Labeaga, J.M., Rodriguez, M. (2006). A residential energy demand
system for Spain. The Energy Journal 27(2), 87-111.
Larsen, B., Nesbakken, R. (2004). Household electricity end-use consumption: results
from econometric and engineering models. Energy Economics 26, 179-200.
Leser, C.E.V. (1963). Forms of Engel functions. Econometrica 31, 694-703.
Meier, H., Rehdanz, K. (2010). Determinants of residential space heating expenditures in
Great Britain. Energy Economics 32, 949-959.
Paulley, N., Balcombe, R., Mackett, R., Titheridge, H., Preston, J., Wardman, M., Shires,
J., White, P. (2006). The demand for public transport: the effects of fares, quality of
service, income and car ownership. Transport Policy 13, 295-306.
Rehdanz, K. (2007). Determinants of residential space heating expenditures in Germany.
Energy Economics 29, 167-182.
Tiezzi, S. (2005). The welfare effects and the distributive impact of carbon taxation on
Italian households. Energy Policy 33, 1597-1612.
Tiffin, R., Arnoult., M. (2010). The demand for a healthy diet: estimating the almost
ideal demand system with infrequency of purchase. European Review of Agricultural
Economics 37(4), 501-521.
Wadud, Z., Graham, D.J., Noland, R.B. (2009). Modelling fuel demand for different
socio-economic groups. Applied Energy 86, 2740-2749.
Working, H. (1943). Statistical laws of family expenditures. Journal of the American
Statistical Association 38, 43-56.

25
List of abbreviations and definitions
AIDS: Almost Ideal Demand System.
BDF: Household Budget Survey (France).
CARBON CAP: carbon Consumption-based Accounting Policy.
CGE: Computable General Equilibrium.
CPI: Consumer Price Index.
EFS: Expenditure and Food Survey (UK).
EU: European Union.
FIDELIO: Fully Interregional Dynamic Econometric Long-term Input-Output.
GDP: Gross Domestic Product.
HBS: Household Budget Survey (Slovakia).
INE: National Statistics Institute (Spain).
INSEE: National Institute of Statistics and Economic Studies (France).
ISTAT: National Institute for Statistics (Italy).
NUTS: Nomenclature of Territorial Units for Statistics.
OECD: Organisation for Economic Cooperation and Development.
26
List of tables
Table 1: sample averages, energy consumption
Table 2: electricity consumption estimates, model (1a)
Table 3: heating fuel consumption estimates, model (1b)
Table 4: consumption of fuel for private transport estimates, model (2a)
Table 5: public transport consumption estimates, model (2b)
Table 6: sample averages, non-energy consumption
Table 7: consumption of non-energy related non-durables (simplified AIDS), model (3) -
Austrian data
Table 8: consumption of non-energy related non-durables (simplified AIDS), model (3) -
French data
Table 9: consumption of non-energy related non-durables (simplified AIDS), model (3) -
Italian data
Table 10: consumption of non-energy related non-durables (simplified AIDS), model (3)
- Slovakian data
Table 11: consumption of non-energy related non-durables (simplified AIDS), model (3)
- Spanish data
Table 12: consumption of non-energy related non-durables (simplified AIDS), model (3)
- UK data
Table 13: EU-level total expenditure elasticities for the four energy-related non-durables
and for the eight non-energy related non-durables

How to obtain EU publications
Our publications are available from EU Bookshop (http://bookshop.europa.eu),
where you can place an order with the sales agent of your choice.
The Publications Office has a worldwide network of sales agents.
You can obtain their contact details by sending a fax to (352) 29 29-42758.
Europe Direct is a service to help you find answers to your questions about the European Union
Free phone number (*): 00 800 6 7 8 9 10 11
(*) Certain mobile telephone operators do not allow access to 00 800 numbers or these calls may be billed.
A great deal of additional information on the European Union is available on the Internet.
It can be accessed through the Europa server http://europa.eu

28
doi:10.2791/625913
ISBN 978-92-79-45242-0
LF-N
A-2
7081-E
N-N
JRC Mission
As the Commission’s
in-house science service,
the Joint Research Centre’s
mission is to provide EU
policies with independent,
evidence-based scientific
and technical support
throughout the whole
policy cycle.
Working in close
cooperation with policy
Directorates-General,
the JRC addresses key
societal challenges while
stimulating innovation
through developing
new methods, tools
and standards, and sharing
its know-how with
the Member States,
the scientific community
and international partners.
Serving society Stimulating innovation Supporting legislation