Embed Size (px)
Citation preview
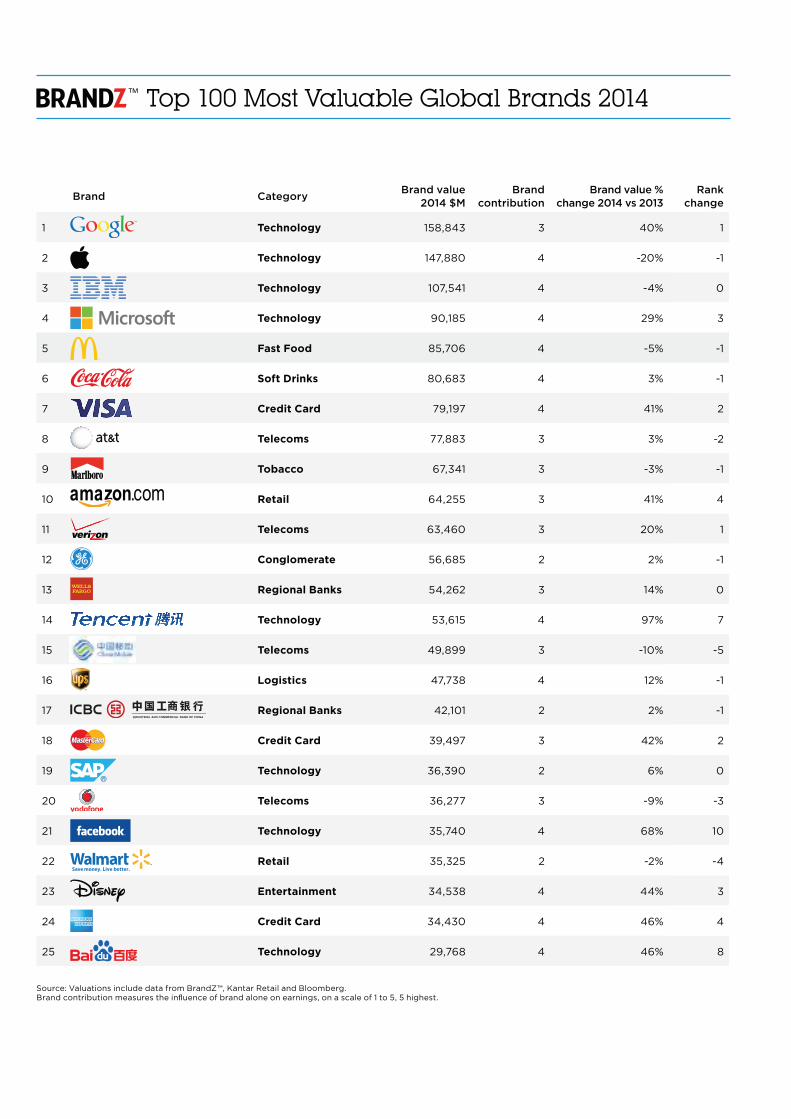
Top 100 Most Valuable Global Brands 2014
Brand CategoryBrand value
2014 $MBrand
contributionBrand value %
change 2014 vs 2013Rank
change
1 Technology 158,843 3 40% 1
2 Technology 147,880 4 -20% -1
3 Technology 107,541 4 -4% 0
4 Technology 90,185 4 29% 3
5 Fast Food 85,706 4 -5% -1
6 Soft Drinks 80,683 4 3% -1
7 Credit Card 79,197 4 41% 2
8 Telecoms 77,883 3 3% -2
9 Tobacco 67,341 3 -3% -1
10 Retail 64,255 3 41% 4
11 Telecoms 63,460 3 20% 1
12 Conglomerate 56,685 2 2% -1
13 Regional Banks 54,262 3 14% 0
14 Technology 53,615 4 97% 7
15 Telecoms 49,899 3 -10% -5
16 Logistics 47,738 4 12% -1
17 Regional Banks 42,101 2 2% -1
18 Credit Card 39,497 3 42% 2
19 Technology 36,390 2 6% 0
20 Telecoms 36,277 3 -9% -3
21 Technology 35,740 4 68% 10
22 Retail 35,325 2 -2% -4
23 Entertainment 34,538 4 44% 3
24 Credit Card 34,430 4 46% 4
25 Technology 29,768 4 46% 8
Source: Valuations include data from BrandZ™, Kantar Retail and Bloomberg. Brand contribution measures the influence of brand alone on earnings, on a scale of 1 to 5, 5 highest.
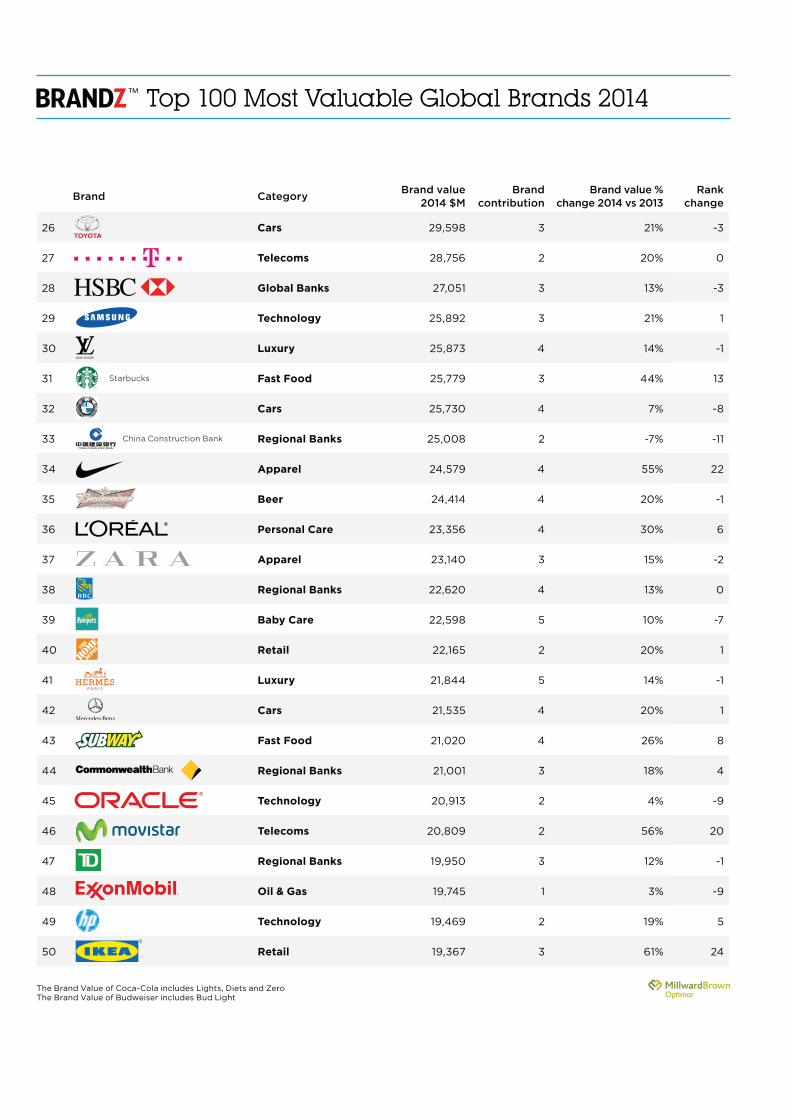
Top 100 Most Valuable Global Brands 2014
Brand CategoryBrand value
2014 $MBrand
contributionBrand value %
change 2014 vs 2013Rank
change
26 Cars 29,598 3 21% -3
27 Telecoms 28,756 2 20% 0
28 Global Banks 27,051 3 13% -3
29 Technology 25,892 3 21% 1
30 Luxury 25,873 4 14% -1
31 Fast Food 25,779 3 44% 13
32 Cars 25,730 4 7% -8
33 Regional Banks 25,008 2 -7% -11
34 Apparel 24,579 4 55% 22
35 Beer 24,414 4 20% -1
36 Personal Care 23,356 4 30% 6
37 Apparel 23,140 3 15% -2
38 Regional Banks 22,620 4 13% 0
39 Baby Care 22,598 5 10% -7
40 Retail 22,165 2 20% 1
41 Luxury 21,844 5 14% -1
42 Cars 21,535 4 20% 1
43 Fast Food 21,020 4 26% 8
44 Regional Banks 21,001 3 18% 4
45 Technology 20,913 2 4% -9
46 Telecoms 20,809 2 56% 20
47 Regional Banks 19,950 3 12% -1
48 Oil & Gas 19,745 1 3% -9
49 Technology 19,469 2 19% 5
50 Retail 19,367 3 61% 24
The Brand Value of Coca-Cola includes Lights, Diets and Zero The Brand Value of Budweiser includes Bud Light
China Construction Bank
Starbucks
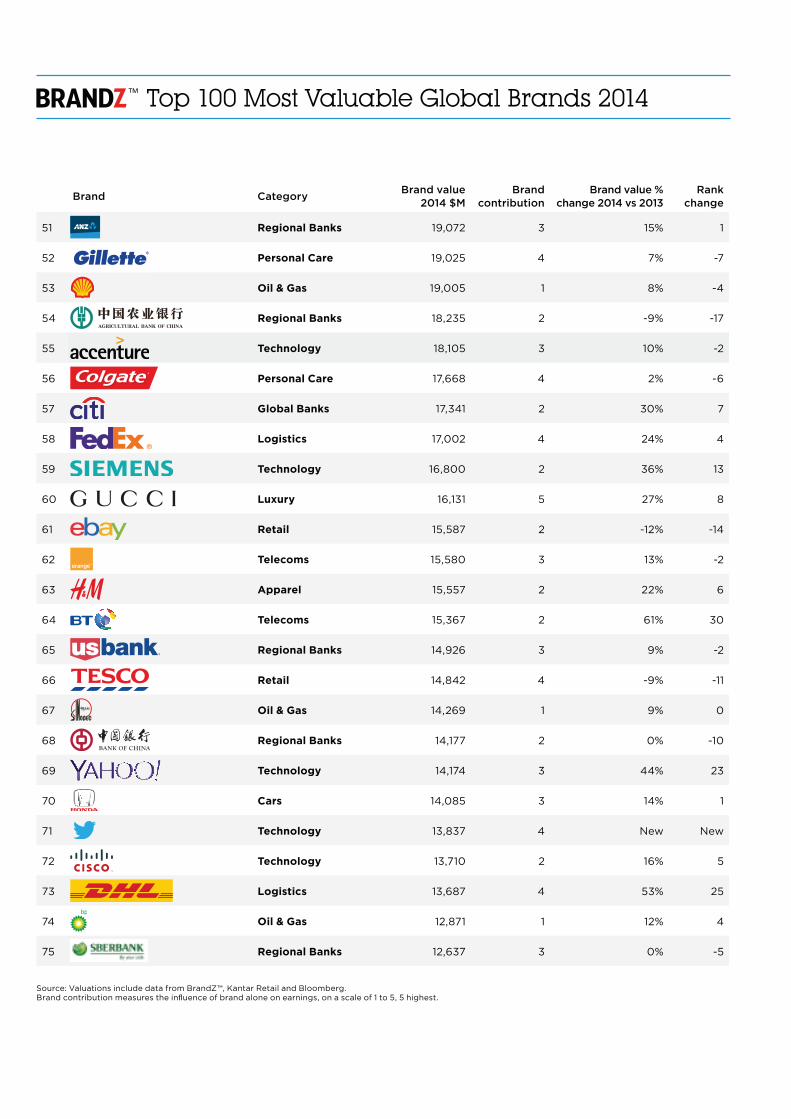
Brand CategoryBrand value
2014 $MBrand
contributionBrand value %
change 2014 vs 2013Rank
change
51 Regional Banks 19,072 3 15% 1
52 Personal Care 19,025 4 7% -7
53 Oil & Gas 19,005 1 8% -4
54 Regional Banks 18,235 2 -9% -17
55 Technology 18,105 3 10% -2
56 Personal Care 17,668 4 2% -6
57 Global Banks 17,341 2 30% 7
58 Logistics 17,002 4 24% 4
59 Technology 16,800 2 36% 13
60 Luxury 16,131 5 27% 8
61 Retail 15,587 2 -12% -14
62 Telecoms 15,580 3 13% -2
63 Apparel 15,557 2 22% 6
64 Telecoms 15,367 2 61% 30
65 Regional Banks 14,926 3 9% -2
66 Retail 14,842 4 -9% -11
67 Oil & Gas 14,269 1 9% 0
68 Regional Banks 14,177 2 0% -10
69 Technology 14,174 3 44% 23
70 Cars 14,085 3 14% 1
71 Technology 13,837 4 New New
72 Technology 13,710 2 16% 5
73 Logistics 13,687 4 53% 25
74 Oil & Gas 12,871 1 12% 4
75 Regional Banks 12,637 3 0% -5
Source: Valuations include data from BrandZ™, Kantar Retail and Bloomberg. Brand contribution measures the influence of brand alone on earnings, on a scale of 1 to 5, 5 highest.
Top 100 Most Valuable Global Brands 2014
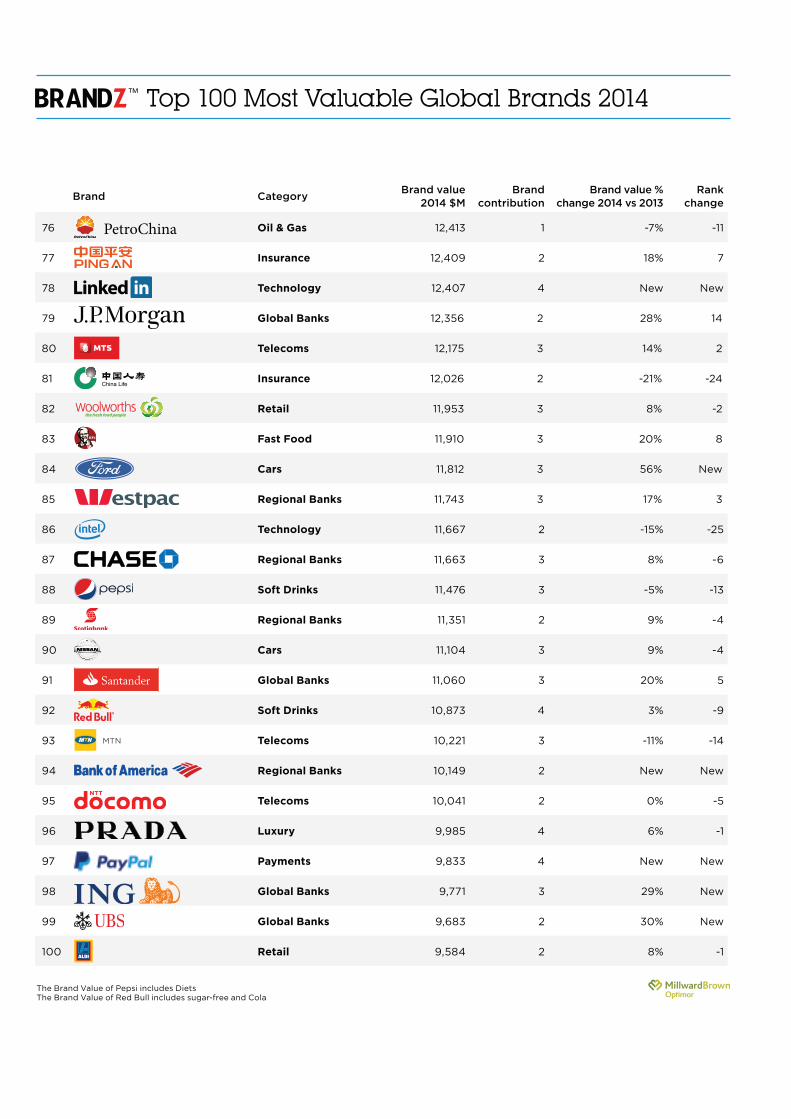
Brand CategoryBrand value
2014 $MBrand
contributionBrand value %
change 2014 vs 2013Rank
change
76 Oil & Gas 12,413 1 -7% -11
77 Insurance 12,409 2 18% 7
78 Technology 12,407 4 New New
79 Global Banks 12,356 2 28% 14
80 Telecoms 12,175 3 14% 2
81 Insurance 12,026 2 -21% -24
82 Retail 11,953 3 8% -2
83 Fast Food 11,910 3 20% 8
84 Cars 11,812 3 56% New
85 Regional Banks 11,743 3 17% 3
86 Technology 11,667 2 -15% -25
87 Regional Banks 11,663 3 8% -6
88 Soft Drinks 11,476 3 -5% -13
89 Regional Banks 11,351 2 9% -4
90 Cars 11,104 3 9% -4
91 Global Banks 11,060 3 20% 5
92 Soft Drinks 10,873 4 3% -9
93 Telecoms 10,221 3 -11% -14
94 Regional Banks 10,149 2 New New
95 Telecoms 10,041 2 0% -5
96 Luxury 9,985 4 6% -1
97 Payments 9,833 4 New New
98 Global Banks 9,771 3 29% New
99 Global Banks 9,683 2 30% New
100 Retail 9,584 2 8% -1
The Brand Value of Pepsi includes Diets The Brand Value of Red Bull includes sugar-free and Cola
PetroChina
MTN
Top 100 Most Valuable Global Brands 2014