Embed Size (px)
Citation preview
Journal of International Economics 88 (2012) 407–421
Contents lists available at SciVerse ScienceDirect
Journal of International Economics
j ourna l homepage: www.e lsev ie r .com/ locate / j i e
Tools for managing financial-stability risks from capital inflows☆
Jonathan D. Ostry, Atish R. Ghosh, Marcos Chamon ⁎, Mahvash S. QureshiResearch Department, International Monetary Fund, 700 19th Street NW, Washington DC, 20431, USA
☆ We are grateful to Olivier Blanchard, Luc Laeveinar participants at the IMF, and at the NBER-SloaFinancial Crisis in Bretton Woods, New Hampshire,and to our discussant, Andrés Velasco. Views expthors, and should not be attributed to the IMF,management.⁎ Corresponding author.
E-mail addresses: [email protected] (J.D. Ostry), [email protected] (M. Chamon), [email protected] (M
0022-1996/$ – see front matter © 2012 International Mdoi:10.1016/j.jinteco.2012.02.002
a b s t r a c t
a r t i c l e i n f oArticle history:Received 5 August 2011Received in revised form 1 February 2012Accepted 2 February 2012Available online 11 February 2012
JEL classification:F21F32
Keywords:Capital inflowsCapital controlsPrudential toolsCurrency mismatches
We examine whether macroprudential policies and capital controls can enhance financial stability in the faceof the risks typically associated with large capital inflows. We construct new indices of foreign currency (FX)-related prudential measures, domestic prudential measures, and financial-sector specific capital controls for51 emerging market economies over the period 1995–2008. Our results indicate that both capital controlsand FX-related prudential measures are associated with a lower proportion of FX lending in total domesticbank credit, and with a lower proportion of portfolio debt in total external liabilities. Other prudential policiesappear to help restrain the intensity of aggregate credit booms. Experience from the global financial crisissuggests that prudential and capital control policies in place during the boom enhanced economic resilienceduring the bust.
© 2012 International Monetary Fund. Published by Elsevier B.V. All rights reserved.
1. Introduction
The strong recovery in capital inflows to emerging marketeconomies (EMEs) since the sudden stop in late 2008–early2009 gave rise to (at least) two sets of concerns. The first relatesto macroeconomic challenges, especially the intense pressure ona number of emerging-market currencies, which, if not sus-tained, may create costly dislocations when exchange ratescome down. The second relates to financial-stability risks, espe-cially the possibility that some of the flows may not be chan-neled toward productive uses, and may result in fragileexternal liability structures, excessive foreign currency exposure
n, three referees, and sem-n conference on the Globalespecially to Kristin Forbes,ressed are those of the au-its Executive Board, or its
@imf.org (A.R. Ghosh),.S. Qureshi).
onetary Fund. Published by Elsevie
on domestic balance sheets, or fuel credit booms and assetprice bubbles.1
Such concerns have led to renewed interest in the effective-ness and design of macroprudential policies and the possibleuse of capital controls–that is, measures that treat transactionsbetween residents and nonresidents less favorably than thoseamong residents–in helping to manage financial-stability risks as-sociated with inflows. But, to date, a systematic look at the impact ofmacroprudential policies and capital controls on the financial-stability
1 Mendoza and Terrones (2008) find that capital inflows are significantly associatedwith credit booms, while Basso et al. (2007) and Rosenberg and Tirpak (2009) showthat the availability of foreign funding significantly raises the share of FX lending in to-tal lending. The correlation between private capital flows and domestic credit booms/FX lending is statistically strong in our dataset as well—a 10 percentage point increasein net private capital flows to GDP is associated with about 5–7 percentage points larg-er credit booms, and a 1–3 percentage points higher share of FX lending (conditionalon country-specific and time effects). On the riskiness of debt liabilities, Furceri et al.(2011) find that large debt-driven capital inflows significantly raise the probability ofbanking and balance of payments crises (whereas those driven by equity portfolioand FDI have a negligible effect on crisis probability). Similarly, Bordo et al. (2009) findthat a higher share of foreign currency debt in total debt is associated with an increasedlikelihood of debt crises after large foreign capital inflows (which significantly increaseexternal debt burdens).
r B.V. All rights reserved.
3 On altering the composition (lengthening maturities) of inflows, see De Gregorio etal. (2000) on Chile, and Cardenas and Barrera (1997) on Colombia. On monetary policyautonomy, De Gregorio et al. (2000) find that capital controls allowed Chile's centralbank to target a higher domestic interest rate over a period of 6 to12 months; Maand McCauley (2008), and Hutchison et al. (2011) find that interest differentials aresignificant and persistent in China and India, which maintain more extensive capital
408 J.D. Ostry et al. / Journal of International Economics 88 (2012) 407–421
risks associated with inflows has been lacking.2 This paper thus aims tofill a gap in the existing literature by examining the nexus between var-ious macroprudential policies, controls on capital inflows, and econom-ic and financial stability. As regards capital controls, we focusexclusively on inflow controls.
For the purpose of our analysis, we group the available policy toolsinto four broad categories: (i) domestic prudential regulations, (ii)foreign currency (FX)-related prudential measures, (iii) financial-sector specific capital controls, and (iv) economy-wide capital con-trols. We then assess the relationship between these variousmeasures on the structure of external liabilities; the growth of do-mestic banking system credit; and the currency composition of do-mestic bank lending. To the extent that portfolio debt is the riskiesttype of external liability, and credit booms–especially in foreign cur-rency–can exacerbate financial fragilities, measures that reducethese vulnerabilities should be associated with greater resilience ofthe economy to financial crises. To test this hypothesis, we exploitthe “natural experiment” afforded by the recent (2008–09) globalfinancial crisis, which triggered downturns of varying intensitiesacross emerging market economies, and see whether countries thathad prudential measures and capital controls in place before thecrisis also fared better during the crisis (controlling for other charac-teristics). We also test this idea using a panel dataset of EME financialcrises over the period 1995–2008.
While several indices of economy-wide capital controls have been putforward in the recent literature, composite measures of financial sector-specific capital controls, and prudential regulations for a wide range ofemergingmarket economies, have hitherto been unavailable. Using infor-mation from the International Monetary Fund's (IMF) Annual Report onExchange Arrangements and Exchange Restrictions (AREAER), we con-struct new indices for the regulation of FX transactions in the domestic fi-nancial sector, and for financial-sector specific capital controls. We alsoconstruct an index of domestic prudential regulations based on a surveyof IMF desk economists. These three indices, together with Schindler's(2009) index of economy-wide controls on inflows, are used in our em-pirical analysis.
Our results suggest that FX-related prudential measures as well ascapital controls are associated with a lower proportion of FX loans indomestic bank lending. Second, other prudential regulations (i.e.,measures that do not discriminate either on the basis of currencydenomination or the residency of the parties to the transaction) areassociatedwith smaller aggregate credit booms. Third, capital controlsand FX-related prudential measures are associated with a shift awayfrom portfolio debt flows toward portfolio equity and FDI flowswithinthe country's overall external liability structure. The estimated effectspresented below, moreover, are not only statistically significant, butalso economically relevant. For instance, moving from the 25th tothe 75th percentile of capital controls restrictiveness or FX-relatedprudential measures lowers the share of portfolio debt in external lia-bilities by about 7 percentage points (against a sample average ofabout 46%) and the share of FX credit in the domestic banking sectorby 20–28 percentage points (against a sample average of 38%). Consis-tent with these results, we also find reasonably strong associations be-tween pre-crisis policies and the extent of economic resilience duringthe period of sudden stop—suggesting that capital controls and pru-dential measures can indeed reduce financial fragilities.
Our findings dovetail nicely with the existing literature, which hasmostly focused on possible macroeconomic effects of capital controls—on the aggregate volume of flows, the exchange rate, and monetary
2 Several studies examine the impact of overall institutional quality on the compositionof the external liability structure (for example, Razin et al., 1998, 2000; Wei, 2001), andthe association between financial regulatory quality and credit booms (for example,Dell'Ariccia and Marquez, 2006; Barajas, 2007; Mendoza and Terrones, 2008; Bakkerand Gulde, 2010). A few recent studies, particularly in the context of Central and EasternEuropean economies, also investigate the impact of policies related to foreign currencyborrowing on foreign currency lending (for example, Rosenberg and Tirpak, 2009).
policy autonomy. By and large, evidence on this is mixed. The surveyandmeta-analysis of Magud et al. (2006) points to capital controls hav-ing only limited effectiveness in altering the overall volume of capital in-flows (and hence the level of the exchange rate). Consistent with ourfindings, evidence that capital controls may affect the composition ofcapital flows is stronger, with at least some studies finding that capitalcontrols have managed to lengthen the maturity of inflows.3
Previous studies on capital controls have not, however, examinedother aspects of financial stability–for example, the share of foreigncurrency lending and the riskiness of the external liability struc-ture–that we consider here. Further, the mixed evidence of the effec-tiveness of capital controls on the aggregate volume of flows (andhence on the exchange rate) has been taken to imply a severe limita-tion on their use in practice. It is worth pointing out, however, thatfrom a financial-stability perspective, altering the composition ofinflows without affecting the aggregate level would be the ideal out-come. One of the contributions of our paper, therefore, is to highlightthis distinction, and show that while capital controls may be of limit-ed (or only temporary) use in affecting the aggregate volume of flows,inflow controls (together with FX-related and other prudential mea-sures) can form an important part of the policy toolkit to reduce thefinancial-stability risks associated with inflow surges.
The remainder of the paper is organized as follows. Section 2 pre-sents an overview of the instruments in the policy toolkit to managethe financial-stability risks posed by capital inflows and describes theconstruction of indices of financial sector capital controls, FX-relatedprudential measures, and domestic prudential policies. Section 3 pre-sents our empirical results on the association between the variouspolicy measures and reduced financial fragilities and greater crisisresilience. Section 4 concludes.
2. The prudential toolkit
2.1. Defining the toolkit
Beyond purely macroeconomic policies, policy makers have attheir disposal a number of tools to help mitigate financial-stabilityrisks associated with capital inflows. It is convenient to group theseaccording to whether they discriminate in terms of the residency ofthe parties to the capital transaction (capital controls), the denomina-tion of the currency of the transaction (FX-related prudential mea-sures), or neither (other prudential measures). By definition,prudential measures apply only to the regulated domestic financialsystem (notably banks, but sometimes also other financial institu-tions), whereas capital controls can apply to all residents (thoughthey can also be applied selectively to specific sectors).
Capital controls are measures that restrict capital transactions (ortransfers and payments necessary to effect them) by virtue of the resi-dency of the parties to the transaction.4 Controls may be economy-wide, sector-specific (usually the financial sector), or industry specific(for example, “strategic” industries in the case of controls on FDI). Mea-sures may apply to all flows, or may differentiate by type or duration ofthe flow (debt, equity, direct investment; short-term vs. medium- and
controls. However, Ghosh et al. (2010) find significantly lower monetary autonomyin countries with fixed exchange rates compared with more flexible regimes, even incountries with relatively closed capital accounts.
4 There is no unique generally accepted legal definition of capital controls. In thebroadest sense, they are measures meant to affect the cross-border movement of cap-ital. In its Code of Liberalization of Capital Movements, the Organization for Economic Co-operation and Development (2009) considers measures to be capital controls subjectto liberalization obligations if they discriminate between residents and nonresidents.
409J.D. Ostry et al. / Journal of International Economics 88 (2012) 407–421
long-term). Since much of our analysis focuses on the financial-sector,we distinguish between financial-sector and economy-wide capitalcontrols below.
FX-related prudential measures discriminate by virtue of the cur-rency denomination of the capital transaction, not the residency ofthe parties to the transaction. These measures are applied to domesticfinancial institutions, primarily to banks. Limits on banks' open FX po-sition (as a proportion of their capital) are common, as are limits onbanks' investments in FX assets.5 Other measures may seek to limitFX lending by domestic banks, especially to borrowers that lack a nat-ural hedge—including, for example, differential reserve requirementson liabilities in local currency and FX. These types of measures will af-fect the composition of liabilities, and may also affect the volume ofcross border flows to the extent that forcing foreigners to bear thecurrency risk affects their willingness to lend.
Other prudential measures are all other prudential regulations that dis-criminate neither on the basis of the currency of the transaction nor theresidency of the parties to the transaction. Typicalmeasures includemax-imum loan-to-value (LTV) ratios, limits on domestic credit growth, assetclassification andprovisioning rules, sectoral limits on loan concentration,dynamic loan-loss provisions, and counter-cyclical capital requirements.
While this categorization is analytically convenient, one shouldbear in mind that policies in one group can also affect risks that aremore directly related to another group of policies. For example, capi-tal controls may have the effect of reducing FX-denominated domes-tic bank lending (and, likewise, FX-related measures may have theeffect of reducing resident/non-resident transactions), even if that isnot their primary intent.
2.2. Measuring capital controls and prudential regulations
Like most discrete policy variables, capital controls and prudentialmeasures are difficult to quantify. Commonly used de jure measures(which are based on the IMF's AREAER) include Chinn and Ito(2008), and Quinn and Toyoda (2008), who provide an index of over-all capital account restrictiveness (combining both inflow and out-flow controls), and Schindler (2009), who differentiates between(economy-wide) inflow and outflow controls. Some studies haveresorted to de facto measures or outcome variables to proxy for thede jure regulation, but clearly that cannot be done here as we are in-terested in the effect of policy measures on outcomes.
We therefore develop three new indices of de jure measures of(i) capital controls specific to thefinancial sector; (ii) FX-related pruden-tial measures, and (iii) other prudential measures. For financial sectorspecific controls and FX-related measures, we obtain information fromthe IMF's AREAER for 51 EMEs over the period 1995–2008. For other pru-dentialmeasures,we conduct a survey of IMF country teams and compileinformation for 42 EMEs for the years 2005 and 2007.6 For economy-wide capital controls, we rely on the index provided by Schindler(2009), which, importantly for our purposes, and unlike the other indi-ces, differentiates between controls on inflows and those on outflows.7
5 In some currency-board or fixed-exchange-rate countries, exposures in the pegcurrency are excluded in the calculation of the open position. In our empirical analysis,asymmetric open position limits, which introduce different limits on short and longpositions, are categorized as FX-related measures—even though these could be consid-ered a form of capital control inasmuch as they act to discourage inflows (e.g., a lowershort position limit could limit capital inflows).
6 The constructed indices are available online at: http://www.imf.org/external/np/res/docs/2012/data/020112.xlsx. See Table A1, in the online appendix, for the list ofcountries in the sample, which is based on the sample of EMEs covered in the IMF'sEarly Warning Exercise (IMF, 2010).
7 Schindler (2009) constructs subindices for restrictions on inflows and outflowsbased on six asset categories (equities, bonds/other debt securities, money market in-struments, collective instruments, and financial credits). The respective subindices areaveraged to construct inflow and outflow restrictiveness indices (which are then aver-aged to create an overall index of capital account restrictiveness). For a comparison ofresults using the Schindler and the other indices, see Section 3.2.
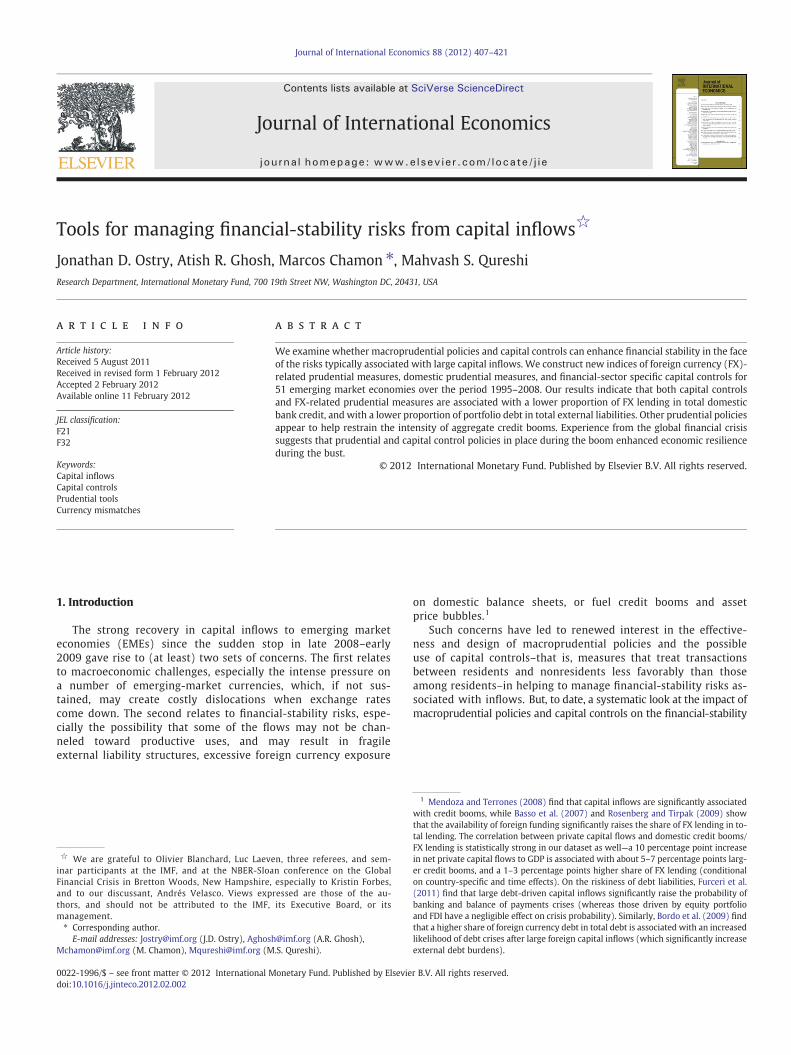
2.2.1. Financial sector capital controlsOur measure of financial sector-specific capital controls (Fincont) is
based onwhether the AREAER documents provisions that apply only tothe financial sector, and that discriminate based on the residency of theparties to the transaction. Specifically, whether measures exist that (i)impose limits on financial sector borrowing from abroad; (ii) restrictthe maintenance of accounts abroad; or (iii) impose differential treat-ment of accounts held by nonresidents (e.g., different reserve/liquidasset requirements, interest rate, or credit controls). Each type of re-striction, if it exists, is assigned a value of one (and zero otherwise),and this information is used to create two composite measures—a sim-ple average of restrictions on (i) the financial sector's borrowing fromabroad, and (ii) differential treatment of accounts held by nonresidents(labeled Fincont1), and an average of all the three components: (i) dif-ferential treatment of accounts held by nonresidents; (ii) limits on bor-rowing from abroad; and (iii) restrictions on maintenance of accountsabroad (denoted as Fincont2).8
Fig. 1(a) plots the composite Fincont2 index over 1995–2008across different regions, and gives an indication of how financialsector-specific controls have evolved over time. On average, both Eu-rope and Latin America appear to be the least restrictive in terms ofcapital controls on the financial sector, while Asia is the most restric-tive. This pattern mimics that of economy-wide capital controls on in-flows, as measured by Schindler's (2009) index (labeled here asKcont). Fig. 1(b) shows that Asia is more intensive in economy-wide capital account restrictions on inflows than either Europe orLatin America. Interestingly, while the average intensity ofeconomy-wide capital controls has been falling somewhat in EMEsover the years as countries have moved toward capital account liber-alization, the prevalence of financial sector-specific capital controlsincreased in the second half of 2000s, presumably in response to per-ceived risks associated with inflow surges.
2.2.2. Foreign currency-related prudential measuresOur index of FX-related prudential regulations is based on wheth-
er measures exist to (i) limit local lending in foreign currency; (ii)limit purchase of locally issued securities denominated in foreign cur-rency; (iii) impose differential treatment of deposit accounts in for-eign exchange; and (iv) limit open foreign exchange positions.9 Asbefore, a score of one is assigned when such restrictions exist (andzero otherwise). Based on this information, we create two indices:FXreg1, which is a simple average of restrictions on lending locallyin foreign exchange, and differential treatment of deposit accountsin foreign exchange; and FXreg2, which is an average of all four com-ponents.10 Fig. 1(c) shows that while FX-related regulations are morecommon in Asia, their adoption has increased over the years in bothAsia and Latin America. By contrast, FX regulations are the least prev-alent in emerging Europe, and seem to have been relaxed graduallyover the years.
8 Ideally, the index and its subcomponents would capture the intensity, rather thanjust the existence, of the various restrictions, but in practice this is almost impossible todo for administrative measures without making arbitrary choices. The index is there-fore coded based on binary variables for the presence of restrictions (as is the case ofother indices in the literature constructed from the AREAER).
9 If the limits on open FX positions differentiate between residents and nonresidents,they would constitute a capital control on the financial sector. However, disaggregateddata on residents versus nonresidents open foreign exchange position limits is rela-tively limited, and where such information is available, there are only a handful ofcases where limits existed on nonresidents' but not on the residents' assets andliabilities.10 Typically, countries with a currency board exclude the anchor currency from thecomputation of limits on FX positions; we code such cases as not having limits on openFX positions.
0
0.1
0.2
0.3
0.4
0.5
0.6
0.71995-19992000-20042005-2008
* Average of binary variables indicating restrictions onborrowing from abroad, maintenance of accounts abroad,and differential treatment of nonresident deposit accounts.
(a) Financial Sector Capital Controls Index*
0
0.1
0.2
0.3
0.4
0.5
0.6
0.7
0.81995-19992000-20042005-2008
* Schindler's (2009) capital controls on inflow index.
(b) Economy Wide Capital Controls on Inflow Index*
0
0.1
0.2
0.3
0.4
0.5
0.6
0.7
0.8
0.9
Asia Europe LatinAmerica
Other EMEaverage
Asia Europe LatinAmerica
Other EMEaverage
Asia Europe LatinAmerica
Other EMEaverage
Asia Europe LatinAmerica
Other EMEaverage
(c) Foreign Currency Regulations Index*
1995-19992000-20042005-2008
* Average of restrictions on lending locally in foreign currency,purchase of locally issued securities denominated in foreigncurrency, differential treatment of deposit accounts in foreignexchange, and open foreign exchange position limits.
0.0
0.1
0.2
0.3
0.4
0.52005
2007
(d) Domestic Prudential Regulations Index*
*Average of reserve requirements, LTV limit, and limit oncredit concentration to specific sectors.
Source: Authors’ estimates based on IMF’s AREAER and Schindler (2009).
Fig. 1. Capital controls and prudential measures in EMEs, 1995–2008.
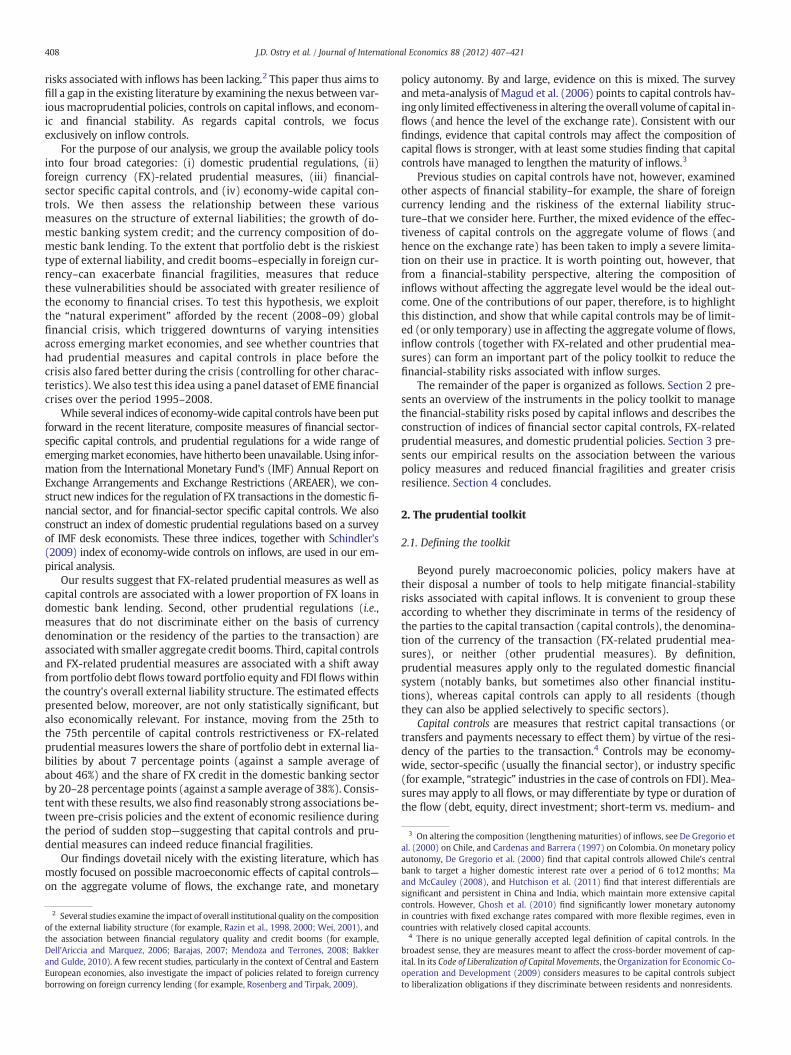
0 50 100
Source:IMF's AREAER, Schindler (2009), and IMF country desk survey.*Numbers reflect the share of countries with a measure in 2007.
BondsEquity
FDI
Borrowing abroad
Maintenance of acc.abroadDifferent treatment of nonresident accounts
Lending locallyin FX
Purchaseof local FX sec.
Different treatment of FXacc.Open FX position limits
Credit concentration in specific sectors
Loan to value ratio
Reserve requirements
Capital controls
Economy wide
Financial sector
FX-related measures
Other prudential measures
(in percent of total observations)
Fig. 2. Frequency distribution of pre-crisis policy measures*.
410 J.D. Ostry et al. / Journal of International Economics 88 (2012) 407–421
2.2.3. Domestic prudential regulationsOur measures of domestic prudential regulations cover three as-
pects of macroprudential policy: maximum loan-to-value (LTV) ra-tios; existence of reserve requirements; and limits on creditconcentration to specific sectors. While the existence of maximumLTV ratios and sector-specific credit concentration limits are codedby binary variables, the reserve requirement measure is coded as0 if the reserve requirement ratio is below 10%; 0.5 if it is in therange of 10–20%; and 1 if it is greater than 20%. As above, we createtwo measures to capture domestic prudential regulations—Domreg1,which is an average of the reserve requirement variable, and limit oncredit concentration to specific sectors; and Domreg2, which also in-cludes the LTV limit. Fig. 1(d) shows that, between 2005 and 2007,the prevalence of domestic prudential regulations increased acrossall regions. Nevertheless, Asian EMEs appear to rely the most on do-mestic macroprudential measures, while European EMEs the least.
2.2.4. Measures in the run-up to the global financial crisisHow prevalent were these measures in the years leading up to the
2008 global financial crisis? Fig. 2 provides a detailed snapshot of theindividual measures comprising the various indices that were in placein our sample of emerging market economies in 2007.
Around one half of the countries had controls on bond inflows, withslightly fewer having controls on portfolio equity and even fewer on FDI
0
0.1
0.2
0.3
0.4
0.5
0.6
0.7
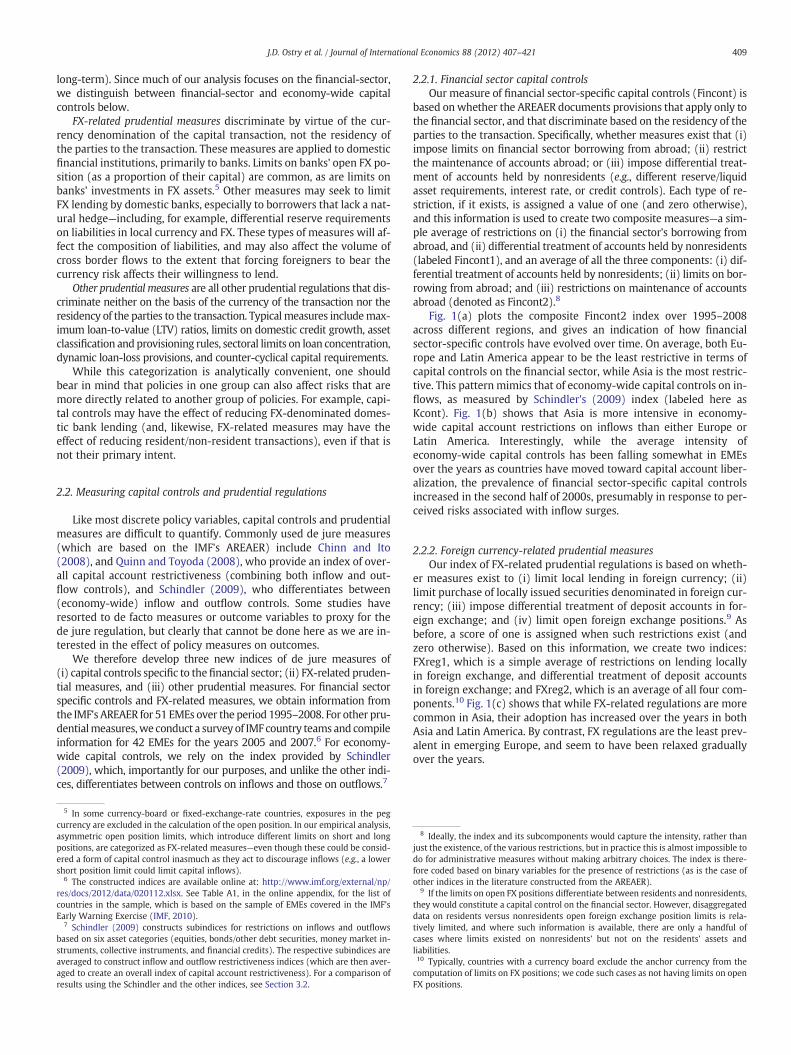
Kcont-Fincont
Kcont-Fxreg
Kcont-Domreg
Fincont-Fxreg
Fincont-Domreg
Fxreg-Domreg
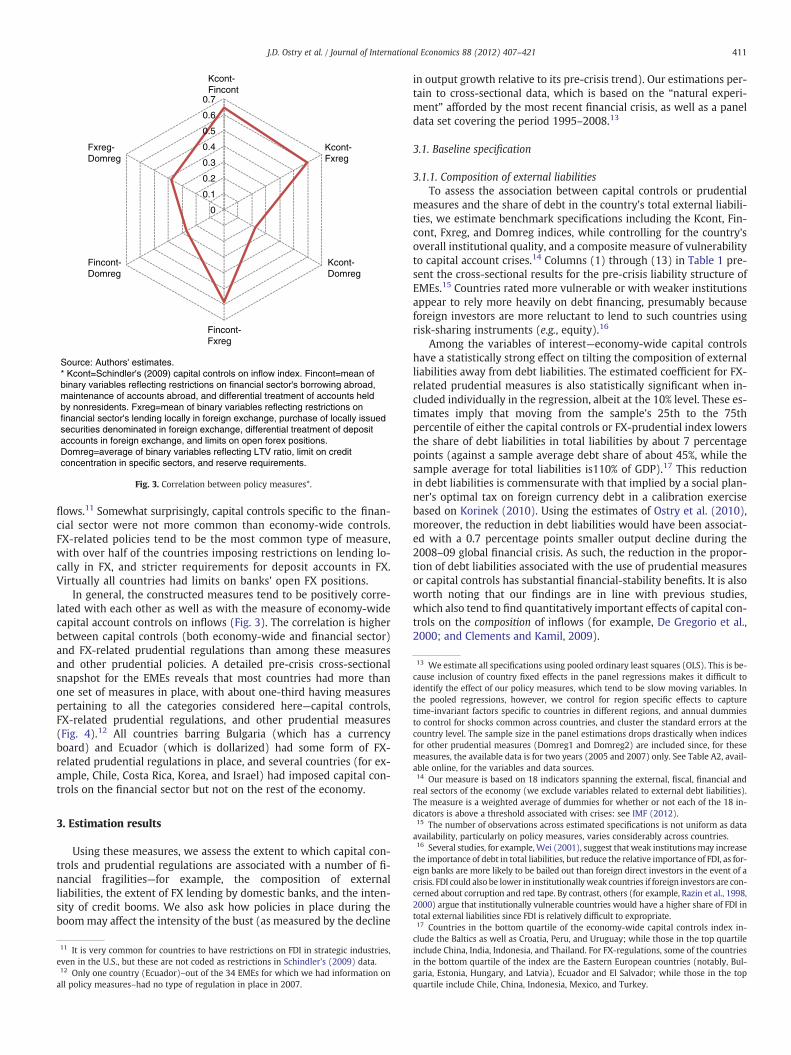
Source: Authors' estimates.* Kcont=Schindler's (2009) capital controls on inflow index. Fincont=mean ofbinary variables reflecting restrictions on financial sector's borrowing abroad,maintenance of accounts abroad, and differential treatment of accounts heldby nonresidents. Fxreg=mean of binary variables reflecting restrictions onfinancial sector's lending locally in foreign exchange, purchase of locally issuedsecurities denominated in foreign exchange, differential treatment of depositaccounts in foreign exchange, and limits on open forex positions.Domreg=average of binary variables reflecting LTV ratio, limit on creditconcentration in specific sectors, and reserve requirements.
Fig. 3. Correlation between policy measures*.
13 We estimate all specifications using pooled ordinary least squares (OLS). This is be-cause inclusion of country fixed effects in the panel regressions makes it difficult toidentify the effect of our policy measures, which tend to be slow moving variables. Inthe pooled regressions, however, we control for region specific effects to capturetime-invariant factors specific to countries in different regions, and annual dummiesto control for shocks common across countries, and cluster the standard errors at thecountry level. The sample size in the panel estimations drops drastically when indicesfor other prudential measures (Domreg1 and Domreg2) are included since, for thesemeasures, the available data is for two years (2005 and 2007) only. See Table A2, avail-able online, for the variables and data sources.14 Our measure is based on 18 indicators spanning the external, fiscal, financial andreal sectors of the economy (we exclude variables related to external debt liabilities).The measure is a weighted average of dummies for whether or not each of the 18 in-dicators is above a threshold associated with crises: see IMF (2012).15 The number of observations across estimated specifications is not uniform as dataavailability, particularly on policy measures, varies considerably across countries.16 Several studies, for example,Wei (2001), suggest that weak institutionsmay increasethe importance of debt in total liabilities, but reduce the relative importance of FDI, as for-eign banks are more likely to be bailed out than foreign direct investors in the event of acrisis. FDI could also be lower in institutionally weak countries if foreign investors are con-cerned about corruption and red tape. By contrast, others (for example, Razin et al., 1998,2000) argue that institutionally vulnerable countries would have a higher share of FDI intotal external liabilities since FDI is relatively difficult to expropriate.17 Countries in the bottom quartile of the economy-wide capital controls index in-
411J.D. Ostry et al. / Journal of International Economics 88 (2012) 407–421
flows.11 Somewhat surprisingly, capital controls specific to the finan-cial sector were not more common than economy-wide controls.FX-related policies tend to be the most common type of measure,with over half of the countries imposing restrictions on lending lo-cally in FX, and stricter requirements for deposit accounts in FX.Virtually all countries had limits on banks' open FX positions.
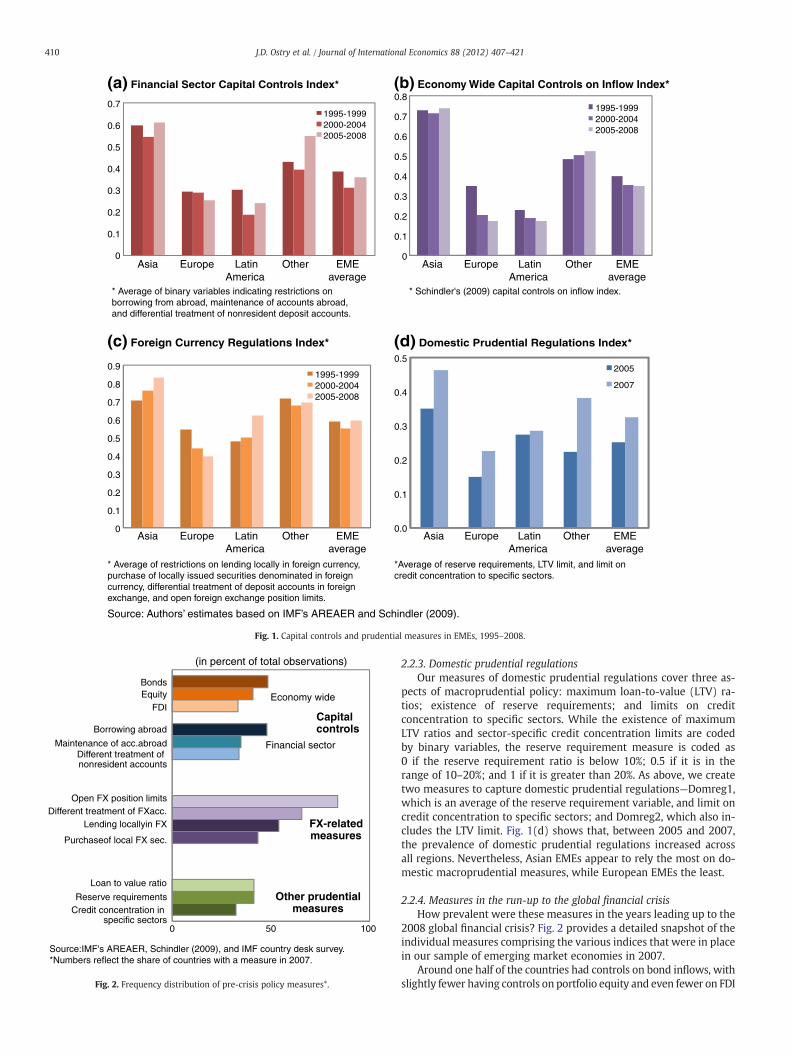
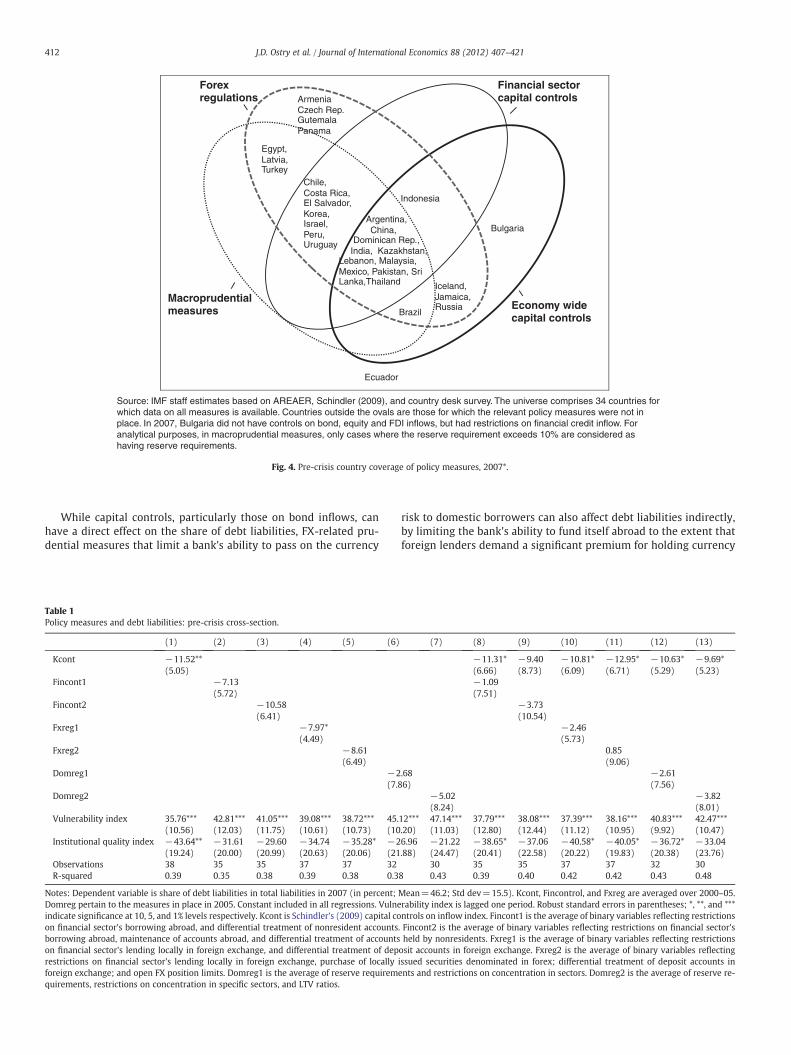
In general, the constructed measures tend to be positively corre-lated with each other as well as with the measure of economy-widecapital account controls on inflows (Fig. 3). The correlation is higherbetween capital controls (both economy-wide and financial sector)and FX-related prudential regulations than among these measuresand other prudential policies. A detailed pre-crisis cross-sectionalsnapshot for the EMEs reveals that most countries had more thanone set of measures in place, with about one-third having measurespertaining to all the categories considered here—capital controls,FX-related prudential regulations, and other prudential measures(Fig. 4).12 All countries barring Bulgaria (which has a currencyboard) and Ecuador (which is dollarized) had some form of FX-related prudential regulations in place, and several countries (for ex-ample, Chile, Costa Rica, Korea, and Israel) had imposed capital con-trols on the financial sector but not on the rest of the economy.
3. Estimation results
Using these measures, we assess the extent to which capital con-trols and prudential regulations are associated with a number of fi-nancial fragilities—for example, the composition of externalliabilities, the extent of FX lending by domestic banks, and the inten-sity of credit booms. We also ask how policies in place during theboommay affect the intensity of the bust (as measured by the decline
11 It is very common for countries to have restrictions on FDI in strategic industries,even in the U.S., but these are not coded as restrictions in Schindler's (2009) data.12 Only one country (Ecuador)–out of the 34 EMEs for which we had information onall policy measures–had no type of regulation in place in 2007.
in output growth relative to its pre-crisis trend). Our estimations per-tain to cross-sectional data, which is based on the “natural experi-ment” afforded by the most recent financial crisis, as well as a paneldata set covering the period 1995–2008.13
3.1. Baseline specification
3.1.1. Composition of external liabilitiesTo assess the association between capital controls or prudential
measures and the share of debt in the country's total external liabili-ties, we estimate benchmark specifications including the Kcont, Fin-cont, Fxreg, and Domreg indices, while controlling for the country'soverall institutional quality, and a composite measure of vulnerabilityto capital account crises.14 Columns (1) through (13) in Table 1 pre-sent the cross-sectional results for the pre-crisis liability structure ofEMEs.15 Countries rated more vulnerable or with weaker institutionsappear to rely more heavily on debt financing, presumably becauseforeign investors are more reluctant to lend to such countries usingrisk-sharing instruments (e.g., equity).16
Among the variables of interest—economy-wide capital controlshave a statistically strong effect on tilting the composition of externalliabilities away from debt liabilities. The estimated coefficient for FX-related prudential measures is also statistically significant when in-cluded individually in the regression, albeit at the 10% level. These es-timates imply that moving from the sample's 25th to the 75thpercentile of either the capital controls or FX-prudential index lowersthe share of debt liabilities in total liabilities by about 7 percentagepoints (against a sample average debt share of about 45%, while thesample average for total liabilities is110% of GDP).17 This reductionin debt liabilities is commensurate with that implied by a social plan-ner's optimal tax on foreign currency debt in a calibration exercisebased on Korinek (2010). Using the estimates of Ostry et al. (2010),moreover, the reduction in debt liabilities would have been associat-ed with a 0.7 percentage points smaller output decline during the2008–09 global financial crisis. As such, the reduction in the propor-tion of debt liabilities associated with the use of prudential measuresor capital controls has substantial financial-stability benefits. It is alsoworth noting that our findings are in line with previous studies,which also tend to find quantitatively important effects of capital con-trols on the composition of inflows (for example, De Gregorio et al.,2000; and Clements and Kamil, 2009).
clude the Baltics as well as Croatia, Peru, and Uruguay; while those in the top quartileinclude China, India, Indonesia, and Thailand. For FX-regulations, some of the countriesin the bottom quartile of the index are the Eastern European countries (notably, Bul-garia, Estonia, Hungary, and Latvia), Ecuador and El Salvador; while those in the topquartile include Chile, China, Indonesia, Mexico, and Turkey.
Ecuador
ArmeniaCzech Rep.GutemalaPanama
BulgariaArgentina,China,
Dominican Rep.,India, Kazakhstan,
Lebanon, Malaysia, Mexico, Pakistan, Sri Lanka,Thailand
Indonesia
Chile, Costa Rica, El Salvador,Korea, Israel, Peru, Uruguay
Egypt,Latvia,Turkey
Brazil
Iceland,Jamaica,Russia Economy wide
capital controls
Financial sector capital controls
Forex regulations
Macroprudential measures
Source: IMF staff estimates based on AREAER, Schindler (2009), and country desk survey. The universe comprises 34 countries forwhich data on all measures is available. Countries outside the ovals are those for which the relevant policy measures were not inplace. In 2007, Bulgaria did not have controls on bond, equity and FDI inflows, but had restrictions on financial credit inflow. Foranalytical purposes, in macroprudential measures, only cases where the reserve requirement exceeds 10% are considered ashaving reserve requirements.
Fig. 4. Pre-crisis country coverage of policy measures, 2007*.
412 J.D. Ostry et al. / Journal of International Economics 88 (2012) 407–421
While capital controls, particularly those on bond inflows, canhave a direct effect on the share of debt liabilities, FX-related pru-dential measures that limit a bank's ability to pass on the currency
Table 1Policy measures and debt liabilities: pre-crisis cross-section.
(1) (2) (3) (4) (5) (6)
Kcont −11.52**(5.05)
Fincont1 −7.13(5.72)
Fincont2 −10.58(6.41)
Fxreg1 −7.97*(4.49)
Fxreg2 −8.61(6.49)
Domreg1 −2(7.8
Domreg2
Vulnerability index 35.76*** 42.81*** 41.05*** 39.08*** 38.72*** 45.(10.56) (12.03) (11.75) (10.61) (10.73) (10
Institutional quality index −43.64** −31.61 −29.60 −34.74 −35.28* −2(19.24) (20.00) (20.99) (20.63) (20.06) (21
Observations 38 35 35 37 37 32R-squared 0.39 0.35 0.38 0.39 0.38 0.3
Notes: Dependent variable is share of debt liabilities in total liabilities in 2007 (in percent;Domreg pertain to the measures in place in 2005. Constant included in all regressions. Vulneindicate significance at 10, 5, and 1% levels respectively. Kcont is Schindler's (2009) capital coon financial sector's borrowing abroad, and differential treatment of nonresident accountsborrowing abroad, maintenance of accounts abroad, and differential treatment of accountson financial sector's lending locally in foreign exchange, and differential treatment of deprestrictions on financial sector's lending locally in foreign exchange, purchase of locallyforeign exchange; and open FX position limits. Domreg1 is the average of reserve requiremquirements, restrictions on concentration in specific sectors, and LTV ratios.
risk to domestic borrowers can also affect debt liabilities indirectly,by limiting the bank's ability to fund itself abroad to the extent thatforeign lenders demand a significant premium for holding currency
(7) (8) (9) (10) (11) (12) (13)
−11.31* −9.40 −10.81* −12.95* −10.63* −9.69*(6.66) (8.73) (6.09) (6.71) (5.29) (5.23)−1.09(7.51)
−3.73(10.54)
−2.46(5.73)
0.85(9.06)
.68 −2.616) (7.56)
−5.02 −3.82(8.24) (8.01)
12*** 47.14*** 37.79*** 38.08*** 37.39*** 38.16*** 40.83*** 42.47***.20) (11.03) (12.80) (12.44) (11.12) (10.95) (9.92) (10.47)6.96 −21.22 −38.65* −37.06 −40.58* −40.05* −36.72* −33.04.88) (24.47) (20.41) (22.58) (20.22) (19.83) (20.38) (23.76)
30 35 35 37 37 32 308 0.43 0.39 0.40 0.42 0.42 0.43 0.48
Mean=46.2; Std dev=15.5). Kcont, Fincontrol, and Fxreg are averaged over 2000–05.rability index is lagged one period. Robust standard errors in parentheses; *, **, and ***ntrols on inflow index. Fincont1 is the average of binary variables reflecting restrictions. Fincont2 is the average of binary variables reflecting restrictions on financial sector'sheld by nonresidents. Fxreg1 is the average of binary variables reflecting restrictionsosit accounts in foreign exchange. Fxreg2 is the average of binary variables reflectingissued securities denominated in forex; differential treatment of deposit accounts inents and restrictions on concentration in sectors. Domreg2 is the average of reserve re-
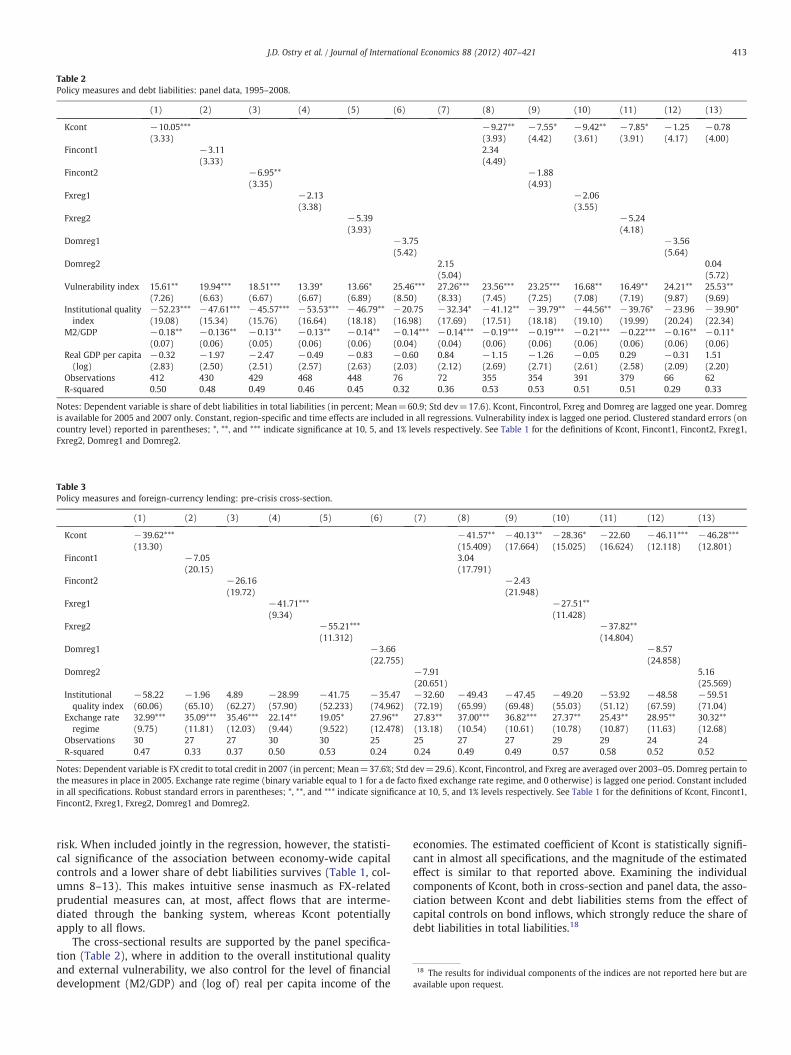
Table 3Policy measures and foreign-currency lending: pre-crisis cross-section.
(1) (2) (3) (4) (5) (6) (7) (8) (9) (10) (11) (12) (13)
Kcont −39.62*** −41.57** −40.13** −28.36* −22.60 −46.11*** −46.28***(13.30) (15.409) (17.664) (15.025) (16.624) (12.118) (12.801)
Fincont1 −7.05 3.04(20.15) (17.791)
Fincont2 −26.16 −2.43(19.72) (21.948)
Fxreg1 −41.71*** −27.51**(9.34) (11.428)
Fxreg2 −55.21*** −37.82**(11.312) (14.804)
Domreg1 −3.66 −8.57(22.755) (24.858)
Domreg2 −7.91 5.16(20.651) (25.569)
Institutionalquality index
−58.22 −1.96 4.89 −28.99 −41.75 −35.47 −32.60 −49.43 −47.45 −49.20 −53.92 −48.58 −59.51(60.06) (65.10) (62.27) (57.90) (52.233) (74.962) (72.19) (65.99) (69.48) (55.03) (51.12) (67.59) (71.04)
Exchange rateregime
32.99*** 35.09*** 35.46*** 22.14** 19.05* 27.96** 27.83** 37.00*** 36.82*** 27.37** 25.43** 28.95** 30.32**(9.75) (11.81) (12.03) (9.44) (9.522) (12.478) (13.18) (10.54) (10.61) (10.78) (10.87) (11.63) (12.68)
Observations 30 27 27 30 30 25 25 27 27 29 29 24 24R-squared 0.47 0.33 0.37 0.50 0.53 0.24 0.24 0.49 0.49 0.57 0.58 0.52 0.52
Notes: Dependent variable is FX credit to total credit in 2007 (in percent; Mean=37.6%; Std dev=29.6). Kcont, Fincontrol, and Fxreg are averaged over 2003–05. Domreg pertain tothe measures in place in 2005. Exchange rate regime (binary variable equal to 1 for a de facto fixed exchange rate regime, and 0 otherwise) is lagged one period. Constant includedin all specifications. Robust standard errors in parentheses; *, **, and *** indicate significance at 10, 5, and 1% levels respectively. See Table 1 for the definitions of Kcont, Fincont1,Fincont2, Fxreg1, Fxreg2, Domreg1 and Domreg2.
Table 2Policy measures and debt liabilities: panel data, 1995–2008.
(1) (2) (3) (4) (5) (6) (7) (8) (9) (10) (11) (12) (13)
Kcont −10.05*** −9.27** −7.55* −9.42** −7.85* −1.25 −0.78(3.33) (3.93) (4.42) (3.61) (3.91) (4.17) (4.00)
Fincont1 −3.11 2.34(3.33) (4.49)
Fincont2 −6.95** −1.88(3.35) (4.93)
Fxreg1 −2.13 −2.06(3.38) (3.55)
Fxreg2 −5.39 −5.24(3.93) (4.18)
Domreg1 −3.75 −3.56(5.42) (5.64)
Domreg2 2.15 0.04(5.04) (5.72)
Vulnerability index 15.61** 19.94*** 18.51*** 13.39* 13.66* 25.46*** 27.26*** 23.56*** 23.25*** 16.68** 16.49** 24.21** 25.53**(7.26) (6.63) (6.67) (6.67) (6.89) (8.50) (8.33) (7.45) (7.25) (7.08) (7.19) (9.87) (9.69)
Institutional qualityindex
−52.23*** −47.61*** −45.57*** −53.53*** −46.79** −20.75 −32.34* −41.12** −39.79** −44.56** −39.76* −23.96 −39.90*(19.08) (15.34) (15.76) (16.64) (18.18) (16.98) (17.69) (17.51) (18.18) (19.10) (19.99) (20.24) (22.34)
M2/GDP −0.18** −0.136** −0.13** −0.13** −0.14** −0.14*** −0.14*** −0.19*** −0.19*** −0.21*** −0.22*** −0.16** −0.11*(0.07) (0.06) (0.05) (0.06) (0.06) (0.04) (0.04) (0.06) (0.06) (0.06) (0.06) (0.06) (0.06)
Real GDP per capita(log)
−0.32 −1.97 −2.47 −0.49 −0.83 −0.60 0.84 −1.15 −1.26 −0.05 0.29 −0.31 1.51(2.83) (2.50) (2.51) (2.57) (2.63) (2.03) (2.12) (2.69) (2.71) (2.61) (2.58) (2.09) (2.20)
Observations 412 430 429 468 448 76 72 355 354 391 379 66 62R-squared 0.50 0.48 0.49 0.46 0.45 0.32 0.36 0.53 0.53 0.51 0.51 0.29 0.33
Notes: Dependent variable is share of debt liabilities in total liabilities (in percent; Mean=60.9; Std dev=17.6). Kcont, Fincontrol, Fxreg and Domreg are lagged one year. Domregis available for 2005 and 2007 only. Constant, region-specific and time effects are included in all regressions. Vulnerability index is lagged one period. Clustered standard errors (oncountry level) reported in parentheses; *, **, and *** indicate significance at 10, 5, and 1% levels respectively. See Table 1 for the definitions of Kcont, Fincont1, Fincont2, Fxreg1,Fxreg2, Domreg1 and Domreg2.
18 The results for individual components of the indices are not reported here but areavailable upon request.
413J.D. Ostry et al. / Journal of International Economics 88 (2012) 407–421
risk. When included jointly in the regression, however, the statisti-cal significance of the association between economy-wide capitalcontrols and a lower share of debt liabilities survives (Table 1, col-umns 8–13). This makes intuitive sense inasmuch as FX-relatedprudential measures can, at most, affect flows that are interme-diated through the banking system, whereas Kcont potentiallyapply to all flows.
The cross-sectional results are supported by the panel specifica-tion (Table 2), where in addition to the overall institutional qualityand external vulnerability, we also control for the level of financialdevelopment (M2/GDP) and (log of) real per capita income of the
economies. The estimated coefficient of Kcont is statistically signifi-cant in almost all specifications, and the magnitude of the estimatedeffect is similar to that reported above. Examining the individualcomponents of Kcont, both in cross-section and panel data, the asso-ciation between Kcont and debt liabilities stems from the effect ofcapital controls on bond inflows, which strongly reduce the share ofdebt liabilities in total liabilities.18
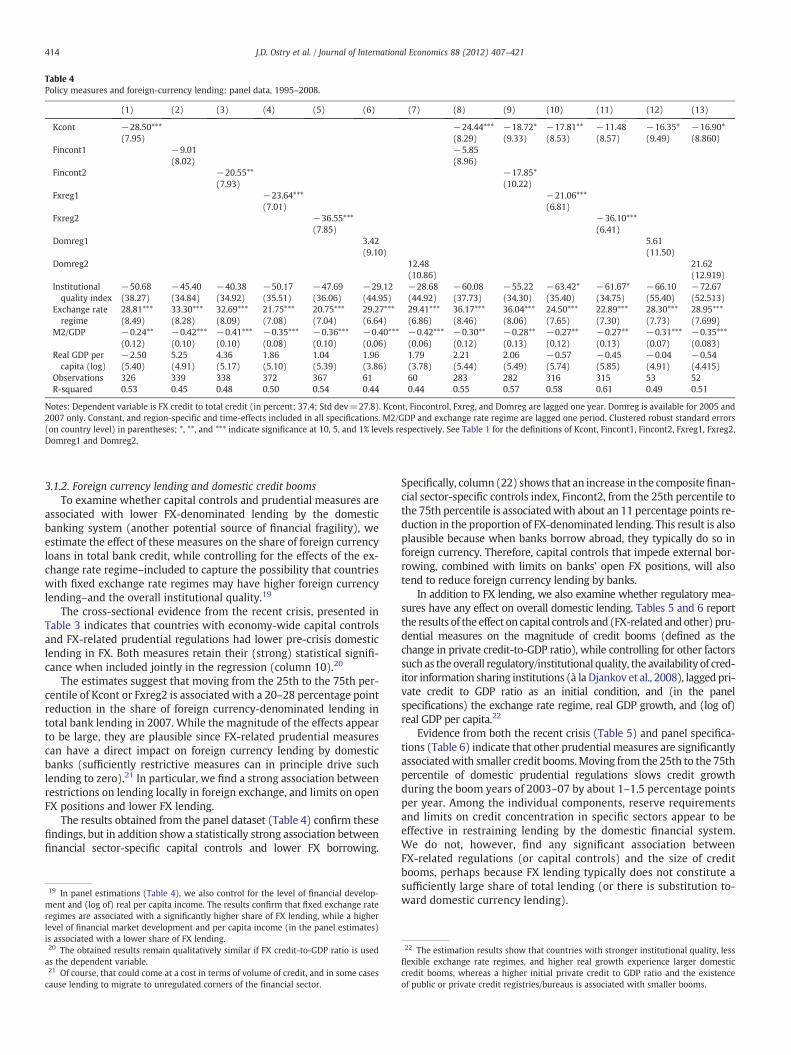
Table 4Policy measures and foreign-currency lending: panel data, 1995–2008.
(1) (2) (3) (4) (5) (6) (7) (8) (9) (10) (11) (12) (13)
Kcont −28.50*** −24.44*** −18.72* −17.81** −11.48 −16.35* −16.90*(7.95) (8.29) (9.33) (8.53) (8.57) (9.49) (8.860)
Fincont1 −9.01 −5.85(8.02) (8.96)
Fincont2 −20.55** −17.85*(7.93) (10.22)
Fxreg1 −23.64*** −21.06***(7.01) (6.81)
Fxreg2 −36.55*** −36.10***(7.85) (6.41)
Domreg1 3.42 5.61(9.10) (11.50)
Domreg2 12.48 21.62(10.86) (12.919)
Institutionalquality index
−50.68 −45.40 −40.38 −50.17 −47.69 −29.12 −28.68 −60.08 −55.22 −63.42* −61.67* −66.10 −72.67(38.27) (34.84) (34.92) (35.51) (36.06) (44.95) (44.92) (37.73) (34.30) (35.40) (34.75) (55.40) (52.513)
Exchange rateregime
28.81*** 33.30*** 32.69*** 21.75*** 20.75*** 29.27*** 29.41*** 36.17*** 36.04*** 24.50*** 22.89*** 28.30*** 28.95***(8.49) (8.28) (8.09) (7.08) (7.04) (6.64) (6.86) (8.46) (8.06) (7.65) (7.30) (7.73) (7.699)
M2/GDP −0.24** −0.42*** −0.41*** −0.35*** −0.36*** −0.40*** −0.42*** −0.30** −0.28** −0.27** −0.27** −0.31*** −0.35***(0.12) (0.10) (0.10) (0.08) (0.10) (0.06) (0.06) (0.12) (0.13) (0.12) (0.13) (0.07) (0.083)
Real GDP percapita (log)
−2.50 5.25 4.36 1.86 1.04 1.96 1.79 2.21 2.06 −0.57 −0.45 −0.04 −0.54(5.40) (4.91) (5.17) (5.10) (5.39) (3.86) (3.78) (5.44) (5.49) (5.74) (5.85) (4.91) (4.415)
Observations 326 339 338 372 367 61 60 283 282 316 315 53 52R-squared 0.53 0.45 0.48 0.50 0.54 0.44 0.44 0.55 0.57 0.58 0.61 0.49 0.51
Notes: Dependent variable is FX credit to total credit (in percent; 37.4; Std dev=27.8). Kcont, Fincontrol, Fxreg, and Domreg are lagged one year. Domreg is available for 2005 and2007 only. Constant, and region-specific and time-effects included in all specifications. M2/GDP and exchange rate regime are lagged one period. Clustered robust standard errors(on country level) in parentheses; *, **, and *** indicate significance at 10, 5, and 1% levels respectively. See Table 1 for the definitions of Kcont, Fincont1, Fincont2, Fxreg1, Fxreg2,Domreg1 and Domreg2.
414 J.D. Ostry et al. / Journal of International Economics 88 (2012) 407–421
3.1.2. Foreign currency lending and domestic credit boomsTo examine whether capital controls and prudential measures are
associated with lower FX-denominated lending by the domesticbanking system (another potential source of financial fragility), weestimate the effect of these measures on the share of foreign currencyloans in total bank credit, while controlling for the effects of the ex-change rate regime–included to capture the possibility that countrieswith fixed exchange rate regimes may have higher foreign currencylending–and the overall institutional quality.19
The cross-sectional evidence from the recent crisis, presented inTable 3 indicates that countries with economy-wide capital controlsand FX-related prudential regulations had lower pre-crisis domesticlending in FX. Both measures retain their (strong) statistical signifi-cance when included jointly in the regression (column 10).20
The estimates suggest that moving from the 25th to the 75th per-centile of Kcont or Fxreg2 is associated with a 20–28 percentage pointreduction in the share of foreign currency-denominated lending intotal bank lending in 2007. While the magnitude of the effects appearto be large, they are plausible since FX-related prudential measurescan have a direct impact on foreign currency lending by domesticbanks (sufficiently restrictive measures can in principle drive suchlending to zero).21 In particular, we find a strong association betweenrestrictions on lending locally in foreign exchange, and limits on openFX positions and lower FX lending.
The results obtained from the panel dataset (Table 4) confirm thesefindings, but in addition show a statistically strong association betweenfinancial sector-specific capital controls and lower FX borrowing.
19 In panel estimations (Table 4), we also control for the level of financial develop-ment and (log of) real per capita income. The results confirm that fixed exchange rateregimes are associated with a significantly higher share of FX lending, while a higherlevel of financial market development and per capita income (in the panel estimates)is associated with a lower share of FX lending.20 The obtained results remain qualitatively similar if FX credit-to-GDP ratio is usedas the dependent variable.21 Of course, that could come at a cost in terms of volume of credit, and in some casescause lending to migrate to unregulated corners of the financial sector.
Specifically, column (22) shows that an increase in the composite finan-cial sector-specific controls index, Fincont2, from the 25th percentile tothe 75th percentile is associatedwith about an 11 percentage points re-duction in the proportion of FX-denominated lending. This result is alsoplausible because when banks borrow abroad, they typically do so inforeign currency. Therefore, capital controls that impede external bor-rowing, combined with limits on banks' open FX positions, will alsotend to reduce foreign currency lending by banks.
In addition to FX lending, we also examine whether regulatory mea-sures have any effect on overall domestic lending. Tables 5 and 6 reportthe results of the effect on capital controls and (FX-related andother) pru-dential measures on the magnitude of credit booms (defined as thechange in private credit-to-GDP ratio), while controlling for other factorssuch as the overall regulatory/institutional quality, the availability of cred-itor information sharing institutions (à la Djankov et al., 2008), lagged pri-vate credit to GDP ratio as an initial condition, and (in the panelspecifications) the exchange rate regime, real GDP growth, and (log of)real GDP per capita.22
Evidence from both the recent crisis (Table 5) and panel specifica-tions (Table 6) indicate that other prudential measures are significantlyassociatedwith smaller credit booms.Moving from the 25th to the 75thpercentile of domestic prudential regulations slows credit growthduring the boom years of 2003–07 by about 1–1.5 percentage pointsper year. Among the individual components, reserve requirementsand limits on credit concentration in specific sectors appear to beeffective in restraining lending by the domestic financial system.We do not, however, find any significant association betweenFX-related regulations (or capital controls) and the size of creditbooms, perhaps because FX lending typically does not constitute asufficiently large share of total lending (or there is substitution to-ward domestic currency lending).
22 The estimation results show that countries with stronger institutional quality, lessflexible exchange rate regimes, and higher real growth experience larger domesticcredit booms, whereas a higher initial private credit to GDP ratio and the existenceof public or private credit registries/bureaus is associated with smaller booms.
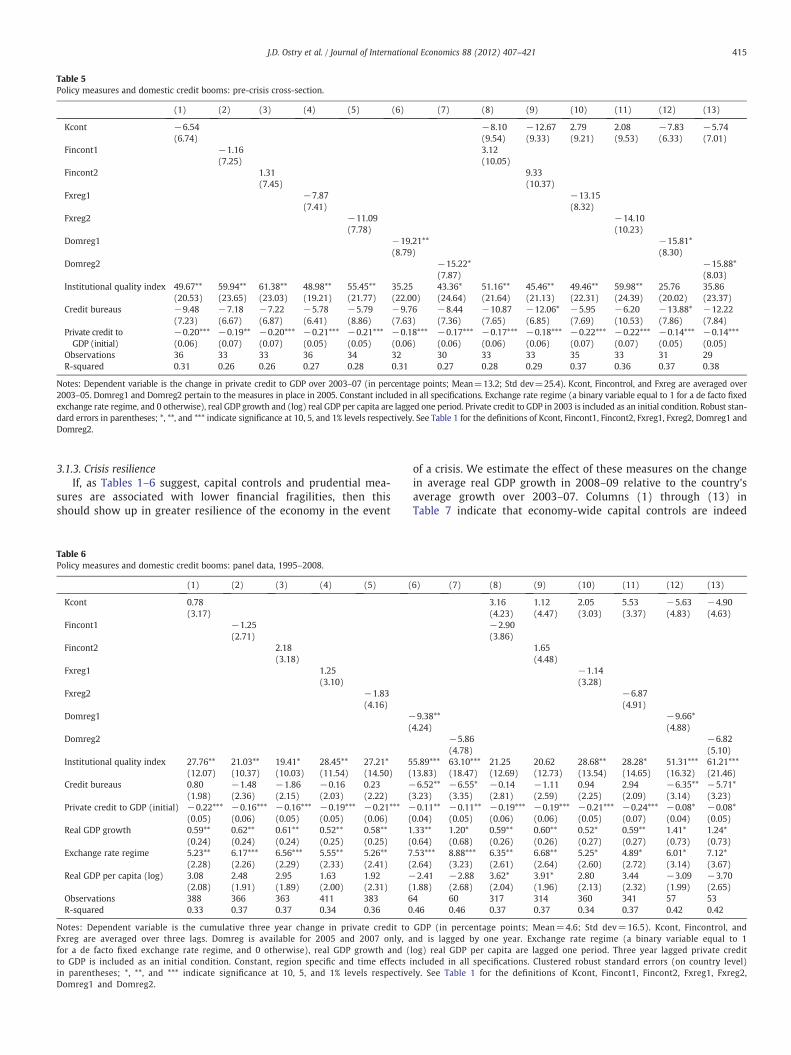
Table 5Policy measures and domestic credit booms: pre-crisis cross-section.
(1) (2) (3) (4) (5) (6) (7) (8) (9) (10) (11) (12) (13)
Kcont −6.54 −8.10 −12.67 2.79 2.08 −7.83 −5.74(6.74) (9.54) (9.33) (9.21) (9.53) (6.33) (7.01)
Fincont1 −1.16 3.12(7.25) (10.05)
Fincont2 1.31 9.33(7.45) (10.37)
Fxreg1 −7.87 −13.15(7.41) (8.32)
Fxreg2 −11.09 −14.10(7.78) (10.23)
Domreg1 −19.21** −15.81*(8.79) (8.30)
Domreg2 −15.22* −15.88*(7.87) (8.03)
Institutional quality index 49.67** 59.94** 61.38** 48.98** 55.45** 35.25 43.36* 51.16** 45.46** 49.46** 59.98** 25.76 35.86(20.53) (23.65) (23.03) (19.21) (21.77) (22.00) (24.64) (21.64) (21.13) (22.31) (24.39) (20.02) (23.37)
Credit bureaus −9.48 −7.18 −7.22 −5.78 −5.79 −9.76 −8.44 −10.87 −12.06* −5.95 −6.20 −13.88* −12.22(7.23) (6.67) (6.87) (6.41) (8.86) (7.63) (7.36) (7.65) (6.85) (7.69) (10.53) (7.86) (7.84)
Private credit toGDP (initial)
−0.20*** −0.19** −0.20*** −0.21*** −0.21*** −0.18*** −0.17*** −0.17*** −0.18*** −0.22*** −0.22*** −0.14*** −0.14***(0.06) (0.07) (0.07) (0.05) (0.05) (0.06) (0.06) (0.06) (0.06) (0.07) (0.07) (0.05) (0.05)
Observations 36 33 33 36 34 32 30 33 33 35 33 31 29R-squared 0.31 0.26 0.26 0.27 0.28 0.31 0.27 0.28 0.29 0.37 0.36 0.37 0.38
Notes: Dependent variable is the change in private credit to GDP over 2003–07 (in percentage points; Mean=13.2; Std dev=25.4). Kcont, Fincontrol, and Fxreg are averaged over2003–05. Domreg1 and Domreg2 pertain to the measures in place in 2005. Constant included in all specifications. Exchange rate regime (a binary variable equal to 1 for a de facto fixedexchange rate regime, and 0 otherwise), real GDP growth and (log) real GDP per capita are lagged one period. Private credit to GDP in 2003 is included as an initial condition. Robust stan-dard errors in parentheses; *, **, and *** indicate significance at 10, 5, and 1% levels respectively. See Table 1 for the definitions of Kcont, Fincont1, Fincont2, Fxreg1, Fxreg2, Domreg1 andDomreg2.
415J.D. Ostry et al. / Journal of International Economics 88 (2012) 407–421
3.1.3. Crisis resilienceIf, as Tables 1–6 suggest, capital controls and prudential mea-
sures are associated with lower financial fragilities, then thisshould show up in greater resilience of the economy in the event
Table 6Policy measures and domestic credit booms: panel data, 1995–2008.
(1) (2) (3) (4) (5) (
Kcont 0.78(3.17)
Fincont1 −1.25(2.71)
Fincont2 2.18(3.18)
Fxreg1 1.25(3.10)
Fxreg2 −1.83(4.16)
Domreg1 −(
Domreg2
Institutional quality index 27.76** 21.03** 19.41* 28.45** 27.21* 5(12.07) (10.37) (10.03) (11.54) (14.50) (
Credit bureaus 0.80 −1.48 −1.86 −0.16 0.23 −(1.98) (2.36) (2.15) (2.03) (2.22) (
Private credit to GDP (initial) −0.22*** −0.16*** −0.16*** −0.19*** −0.21*** −(0.05) (0.06) (0.05) (0.05) (0.06) (
Real GDP growth 0.59** 0.62** 0.61** 0.52** 0.58** 1(0.24) (0.24) (0.24) (0.25) (0.25) (
Exchange rate regime 5.23** 6.17*** 6.56*** 5.55** 5.26** 7(2.28) (2.26) (2.29) (2.33) (2.41) (
Real GDP per capita (log) 3.08 2.48 2.95 1.63 1.92 −(2.08) (1.91) (1.89) (2.00) (2.31) (
Observations 388 366 363 411 383 6R-squared 0.33 0.37 0.37 0.34 0.36 0
Notes: Dependent variable is the cumulative three year change in private credit toFxreg are averaged over three lags. Domreg is available for 2005 and 2007 only, afor a de facto fixed exchange rate regime, and 0 otherwise), real GDP growth and (to GDP is included as an initial condition. Constant, region specific and time effects iin parentheses; *, **, and *** indicate significance at 10, 5, and 1% levels respectiveDomreg1 and Domreg2.
of a crisis. We estimate the effect of these measures on the changein average real GDP growth in 2008–09 relative to the country'saverage growth over 2003–07. Columns (1) through (13) inTable 7 indicate that economy-wide capital controls are indeed
6) (7) (8) (9) (10) (11) (12) (13)
3.16 1.12 2.05 5.53 −5.63 −4.90(4.23) (4.47) (3.03) (3.37) (4.83) (4.63)−2.90(3.86)
1.65(4.48)
−1.14(3.28)
−6.87(4.91)
9.38** −9.66*4.24) (4.88)
−5.86 −6.82(4.78) (5.10)
5.89*** 63.10*** 21.25 20.62 28.68** 28.28* 51.31*** 61.21***13.83) (18.47) (12.69) (12.73) (13.54) (14.65) (16.32) (21.46)6.52** −6.55* −0.14 −1.11 0.94 2.94 −6.35** −5.71*
3.23) (3.35) (2.81) (2.59) (2.25) (2.09) (3.14) (3.23)0.11** −0.11** −0.19*** −0.19*** −0.21*** −0.24*** −0.08* −0.08*
0.04) (0.05) (0.06) (0.06) (0.05) (0.07) (0.04) (0.05).33** 1.20* 0.59** 0.60** 0.52* 0.59** 1.41* 1.24*0.64) (0.68) (0.26) (0.26) (0.27) (0.27) (0.73) (0.73).53*** 8.88*** 6.35** 6.68** 5.25* 4.89* 6.01* 7.12*2.64) (3.23) (2.61) (2.64) (2.60) (2.72) (3.14) (3.67)2.41 −2.88 3.62* 3.91* 2.80 3.44 −3.09 −3.70
1.88) (2.68) (2.04) (1.96) (2.13) (2.32) (1.99) (2.65)4 60 317 314 360 341 57 53.46 0.46 0.37 0.37 0.34 0.37 0.42 0.42
GDP (in percentage points; Mean=4.6; Std dev=16.5). Kcont, Fincontrol, andnd is lagged by one year. Exchange rate regime (a binary variable equal to 1log) real GDP per capita are lagged one period. Three year lagged private creditncluded in all specifications. Clustered robust standard errors (on country level)ly. See Table 1 for the definitions of Kcont, Fincont1, Fincont2, Fxreg1, Fxreg2,
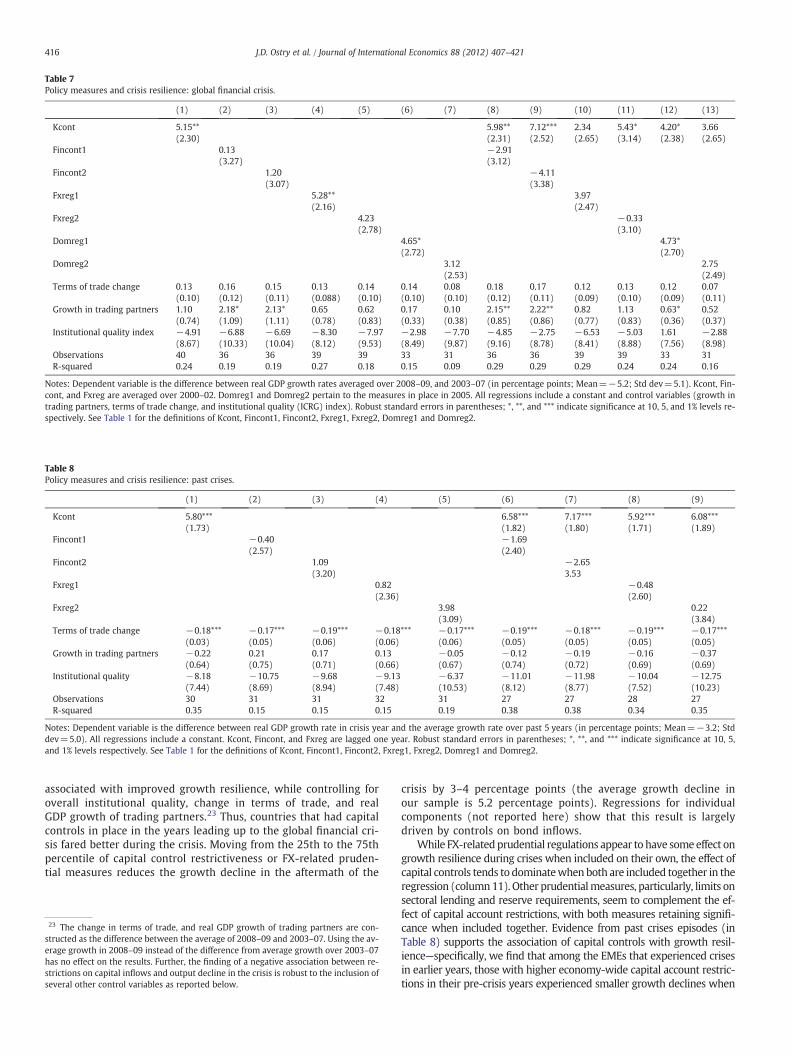
Table 7Policy measures and crisis resilience: global financial crisis.
(1) (2) (3) (4) (5) (6) (7) (8) (9) (10) (11) (12) (13)
Kcont 5.15** 5.98** 7.12*** 2.34 5.43* 4.20* 3.66(2.30) (2.31) (2.52) (2.65) (3.14) (2.38) (2.65)
Fincont1 0.13 −2.91(3.27) (3.12)
Fincont2 1.20 −4.11(3.07) (3.38)
Fxreg1 5.28** 3.97(2.16) (2.47)
Fxreg2 4.23 −0.33(2.78) (3.10)
Domreg1 4.65* 4.73*(2.72) (2.70)
Domreg2 3.12 2.75(2.53) (2.49)
Terms of trade change 0.13 0.16 0.15 0.13 0.14 0.14 0.08 0.18 0.17 0.12 0.13 0.12 0.07(0.10) (0.12) (0.11) (0.088) (0.10) (0.10) (0.10) (0.12) (0.11) (0.09) (0.10) (0.09) (0.11)
Growth in trading partners 1.10 2.18* 2.13* 0.65 0.62 0.17 0.10 2.15** 2.22** 0.82 1.13 0.63* 0.52(0.74) (1.09) (1.11) (0.78) (0.83) (0.33) (0.38) (0.85) (0.86) (0.77) (0.83) (0.36) (0.37)
Institutional quality index −4.91 −6.88 −6.69 −8.30 −7.97 −2.98 −7.70 −4.85 −2.75 −6.53 −5.03 1.61 −2.88(8.67) (10.33) (10.04) (8.12) (9.53) (8.49) (9.87) (9.16) (8.78) (8.41) (8.88) (7.56) (8.98)
Observations 40 36 36 39 39 33 31 36 36 39 39 33 31R-squared 0.24 0.19 0.19 0.27 0.18 0.15 0.09 0.29 0.29 0.29 0.24 0.24 0.16
Notes: Dependent variable is the difference between real GDP growth rates averaged over 2008–09, and 2003–07 (in percentage points; Mean=−5.2; Std dev=5.1). Kcont, Fin-cont, and Fxreg are averaged over 2000–02. Domreg1 and Domreg2 pertain to the measures in place in 2005. All regressions include a constant and control variables (growth intrading partners, terms of trade change, and institutional quality (ICRG) index). Robust standard errors in parentheses; *, **, and *** indicate significance at 10, 5, and 1% levels re-spectively. See Table 1 for the definitions of Kcont, Fincont1, Fincont2, Fxreg1, Fxreg2, Domreg1 and Domreg2.
Table 8Policy measures and crisis resilience: past crises.
(1) (2) (3) (4) (5) (6) (7) (8) (9)
Kcont 5.80*** 6.58*** 7.17*** 5.92*** 6.08***(1.73) (1.82) (1.80) (1.71) (1.89)
Fincont1 −0.40 −1.69(2.57) (2.40)
Fincont2 1.09 −2.65(3.20) 3.53
Fxreg1 0.82 −0.48(2.36) (2.60)
Fxreg2 3.98 0.22(3.09) (3.84)
Terms of trade change −0.18*** −0.17*** −0.19*** −0.18*** −0.17*** −0.19*** −0.18*** −0.19*** −0.17***(0.03) (0.05) (0.06) (0.06) (0.06) (0.05) (0.05) (0.05) (0.05)
Growth in trading partners −0.22 0.21 0.17 0.13 −0.05 −0.12 −0.19 −0.16 −0.37(0.64) (0.75) (0.71) (0.66) (0.67) (0.74) (0.72) (0.69) (0.69)
Institutional quality −8.18 −10.75 −9.68 −9.13 −6.37 −11.01 −11.98 −10.04 −12.75(7.44) (8.69) (8.94) (7.48) (10.53) (8.12) (8.77) (7.52) (10.23)
Observations 30 31 31 32 31 27 27 28 27R-squared 0.35 0.15 0.15 0.15 0.19 0.38 0.38 0.34 0.35
Notes: Dependent variable is the difference between real GDP growth rate in crisis year and the average growth rate over past 5 years (in percentage points; Mean=−3.2; Stddev=5.0). All regressions include a constant. Kcont, Fincont, and Fxreg are lagged one year. Robust standard errors in parentheses; *, **, and *** indicate significance at 10, 5,and 1% levels respectively. See Table 1 for the definitions of Kcont, Fincont1, Fincont2, Fxreg1, Fxreg2, Domreg1 and Domreg2.
416 J.D. Ostry et al. / Journal of International Economics 88 (2012) 407–421
associated with improved growth resilience, while controlling foroverall institutional quality, change in terms of trade, and realGDP growth of trading partners.23 Thus, countries that had capitalcontrols in place in the years leading up to the global financial cri-sis fared better during the crisis. Moving from the 25th to the 75thpercentile of capital control restrictiveness or FX-related pruden-tial measures reduces the growth decline in the aftermath of the
23 The change in terms of trade, and real GDP growth of trading partners are con-structed as the difference between the average of 2008–09 and 2003–07. Using the av-erage growth in 2008–09 instead of the difference from average growth over 2003–07has no effect on the results. Further, the finding of a negative association between re-strictions on capital inflows and output decline in the crisis is robust to the inclusion ofseveral other control variables as reported below.
crisis by 3–4 percentage points (the average growth decline inour sample is 5.2 percentage points). Regressions for individualcomponents (not reported here) show that this result is largelydriven by controls on bond inflows.
While FX-relatedprudential regulations appear to have someeffect ongrowth resilience during crises when included on their own, the effect ofcapital controls tends to dominatewhen both are included together in theregression (column11). Other prudentialmeasures, particularly, limits onsectoral lending and reserve requirements, seem to complement the ef-fect of capital account restrictions, with both measures retaining signifi-cance when included together. Evidence from past crises episodes (inTable 8) supports the association of capital controls with growth resil-ience—specifically, we find that among the EMEs that experienced crisesin earlier years, those with higher economy-wide capital account restric-tions in their pre-crisis years experienced smaller growth declines when
417J.D. Ostry et al. / Journal of International Economics 88 (2012) 407–421
the crises occurred.24 Thus our hypothesis is not that prudentialmeasuresand controls on capital flows are necessarily good for growth in “normal”times, but rather that such measures–by reducing financial vulnerabil-ities–can help countries avoid some of the worst outcomes in the eventof a crisis. Our findings support those of some earlier studies, for example,Gupta et al. (2007), who find that the fall in output during crisis episodesis significantly lower if capital controls were in place in the years runningup to the crisis.25
26 In addition to the overall institutional quality and polity indices, we also test the
3.2. New vs. old capital account openness measures
The estimation results presented above show that capital controlson inflows are associated with a less vulnerable external liabilitystructure (in terms of a smaller share of debt liabilities in total liabil-ities), lower FX lending, and greater crisis resilience. How wouldthese results fare if we use the more commonly used capital accountopenness measures that combine restrictions on inflows and out-flows? Tables A3 and A4, which are available online, present the re-sults for our baseline specification for the recent crisis cross-sectionand panel data, respectively, using two well known financial open-ness indices: Chinn and Ito (2008), and Quinn and Toyoda (2008),where higher values indicate more liberalized economies.
The evidence obtained from these indices is somewhat mixed. Forpanel data (Table A4, panel [A]), we do not find that capital accountopenness–as measured by Chinn–Ito and Quinn–Toyoda indices–hasa statistically significant impact on the share of debt in total liabilities.For the recent crisis cross-section, however, the results are largelysimilar to those reported in Table 1 (columns 1–7), and show thatgreater pre-crisis capital account openness was associated with agreater reliance on debt financing (Table A3, panel [A]).
The results for FX lending are more uniform—for both panel andcross-section data, the estimated coefficients of the indices arestrongly positive, indicating that more financially open economieshave higher foreign currency denominated lending (Tables A3 andA4, panel [B]). Moving from the 25th to the 75th percentile of bothindices implies an increase in FX lending of about 22 percentagepoints (in panel data). On domestic credit booms, capital accountopenness generally has a negligible impact (panel [C])—though forthe recent crisis cross section, we obtain a (somewhat counterintu-itive) result with the Chinn-Ito index that more financially liberal-ized economies had significantly smaller pre-financial crisis creditbooms.
Turning to the crisis resilience regressions (panel [D])—with theChinn-Ito index, greater capital account openness is associated withlarger output declines in both the past and recent crises, but the esti-mated effect is statistically insignificant. The Quinn–Toyoda indexalso indicates a positive but insignificant impact of capital accountopenness in the recent financial crisis, but shows that greater open-ness was associated with significantly larger output declines in pastcrises.
Overall, the results using the older indices of capital account open-ness are not inconsistent with those using our indices (Tables 1–8),but the findings are generally more mixed and less clear cut. Thishighlights the importance of using our finer measures and of distin-guishing between controls on capital inflows and controls on capitaloutflows—as the Schindler measure does, but previously available in-dices do not.
24 Past crises are those identified by the IMF (2012) database over 1995–2008.Growth decline for these crises cases is computed as the difference between realGDP growth rate in the crisis year and the average past 5 year growth rate. Domreg1and Domreg2 are not included in these regressions (Table 4, columns 14–24) becauseof insufficient observations.25 The sample of Gupta et al. (2007) comprises about 200 crisis episodes in 90 coun-tries over 1970–2007.
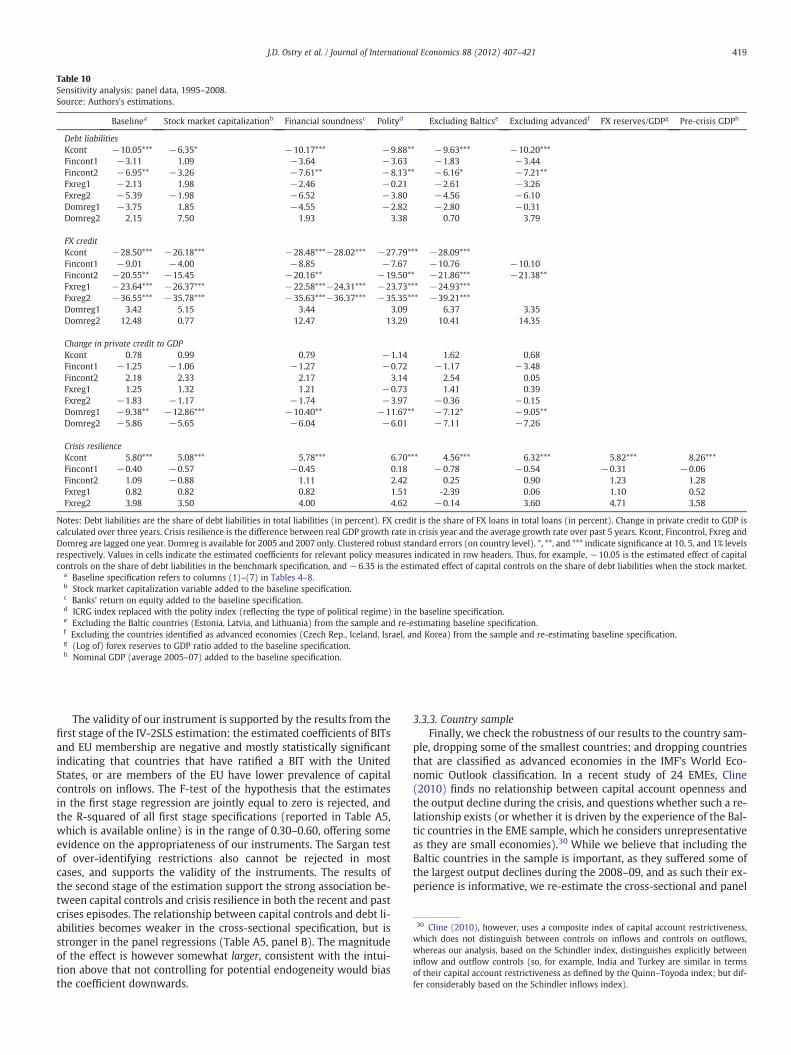
3.3. Sensitivity analysis
The results presented in Tables 1–8 suggest that both capital con-trols and prudential measures are strongly associated–in the cross-sectional and panel data–with reduced financial vulnerabilities. Wenow examine the robustness of our results to model specification,alternative indices of policy measures, estimation methods, and coun-try sample.
3.3.1. Model specificationWhile the regressions reported in Tables 1–8 include several rele-
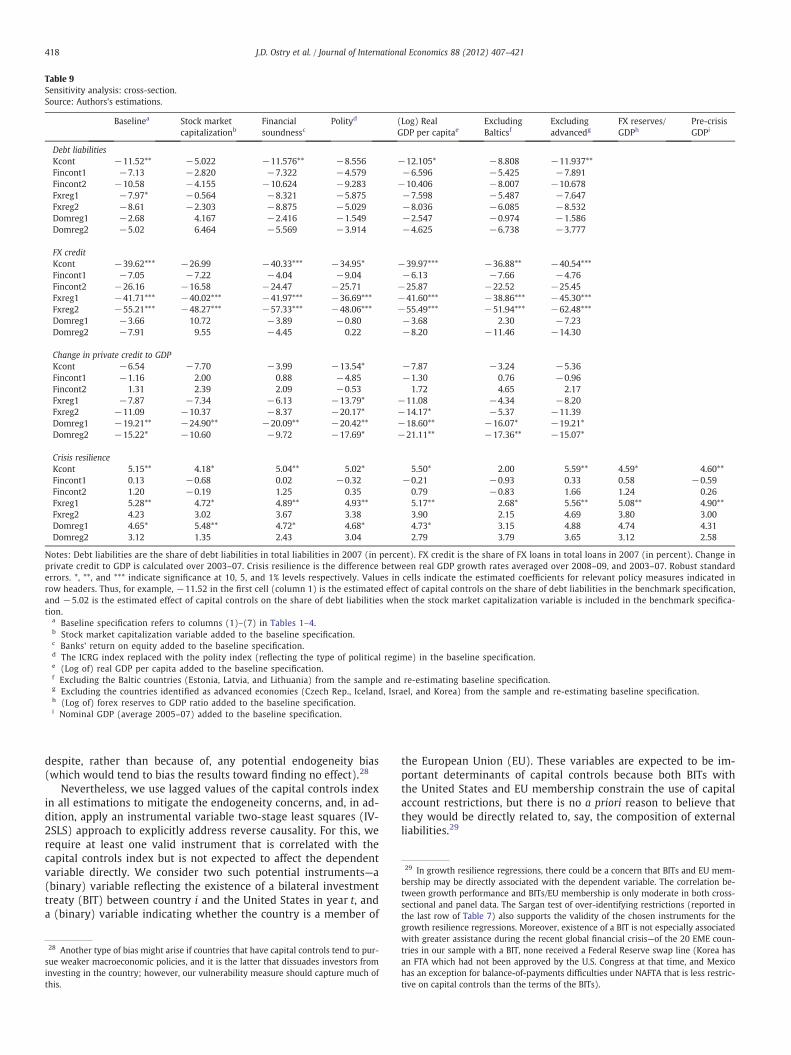
vant control variables, to ensure that the strong association betweenour policy measures and financial fragilities/crisis resilience is notdriven by omitted variables, we also estimate alternative specifica-tions with additional control variables to capture country characteris-tics such as the level of financial development (as proxied by stockmarket capitalization), soundness of the financial system (proxiedby bank return on equity), and the type of political regime in place(proxied by the polity index). In addition, in the crisis resilience re-gressions, we also include the pre-crisis foreign exchange reservesto GDP ratio as an additional control variable.26
Tables 9 and 10 report the results with these additional variablesadded to both the cross-section and panel specifications for debtliabilities, FX lending, domestic credit booms, and crisis resilience,respectively. We find that the results reported in Tables 1–8 generallysurvive the addition of other control variables—specifically, economy-wide capital controls remain associated with a lower proportion ofdebt liabilities, lower FX lending, and improved crisis resilience; FX-related prudential measures have a strong dampening effect on FX-lending; and other domestic prudential measures lead to smalleraggregate credit booms.
In addition to model specification, we check the sensitivity ofour results to the construction of policy indices. Specifically, we re-place our financial sector-specific capital controls and prudentialindices (which are simple averages of the individual components,as discussed in Section 2) with the first principal components ofthe individual sub-indices. The results (not reported here) usingthese alternative measures are very similar to those obtained inTables 1–8, both in terms of statistical significance and the estimat-ed magnitude of the association between policy measures and fi-nancial/economic vulnerabilities.
3.3.2. EndogeneityOne concern when estimating the effect of capital controls on the
aggregate stock or flow of external liabilities relates to reverse cau-sality—that is, countries may strengthen capital account restrictionsin response to a surge in capital inflows, which could give rise to aspurious positive association between controls and inflows. Whilesuch endogeneity concerns may be less pertinent when consideringthe impact of controls on the composition, rather than on the overalllevel or flow of liabilities, endogeneity bias–if it exists–would tend toreduce the estimated effects of capital controls and other prudentialmeasures.27 The relatively strong findings above are therefore
sensitivity of our results to including rule-of-law variable. Further, in the crisis resil-ience regressions, we also control for other policy variables such as the pre-crisis ex-change rate regime, and the monetary policy and fiscal policy stance over the crisis(proxied by the change in interest rates and cyclically adjusted fiscal balance to GDPratio in the crisis year relative to the previous five years, respectively). These modifica-tions to the specification do not, however, have any appreciable effect on the estimatedcoefficient of the economy-wide capital controls variable (results available uponrequest).27 The lack of association between capital controls and capital inflows in some studiesis often attributed to econometric identification (see Ostry et al., 2010).
29 In growth resilience regressions, there could be a concern that BITs and EU mem-bership may be directly associated with the dependent variable. The correlation be-tween growth performance and BITs/EU membership is only moderate in both cross-sectional and panel data. The Sargan test of over-identifying restrictions (reported inthe last row of Table 7) also supports the validity of the chosen instruments for the
Table 9Sensitivity analysis: cross-section.Source: Authors's estimations.
Baselinea Stock marketcapitalizationb
Financialsoundnessc
Polityd (Log) RealGDP per capitae
ExcludingBalticsf
Excludingadvancedg
FX reserves/GDPh
Pre-crisisGDPi
Debt liabilitiesKcont −11.52** −5.022 −11.576** −8.556 −12.105* −8.808 −11.937**Fincont1 −7.13 −2.820 −7.322 −4.579 −6.596 −5.425 −7.891Fincont2 −10.58 −4.155 −10.624 −9.283 −10.406 −8.007 −10.678Fxreg1 −7.97* −0.564 −8.321 −5.875 −7.598 −5.487 −7.647Fxreg2 −8.61 −2.303 −8.875 −5.029 −8.036 −6.085 −8.532Domreg1 −2.68 4.167 −2.416 −1.549 −2.547 −0.974 −1.586Domreg2 −5.02 6.464 −5.569 −3.914 −4.625 −6.738 −3.777
FX creditKcont −39.62*** −26.99 −40.33*** −34.95* −39.97*** −36.88** −40.54***Fincont1 −7.05 −7.22 −4.04 −9.04 −6.13 −7.66 −4.76Fincont2 −26.16 −16.58 −24.47 −25.71 −25.87 −22.52 −25.45Fxreg1 −41.71*** −40.02*** −41.97*** −36.69*** −41.60*** −38.86*** −45.30***Fxreg2 −55.21*** −48.27*** −57.33*** −48.06*** −55.49*** −51.94*** −62.48***Domreg1 −3.66 10.72 −3.89 −0.80 −3.68 2.30 −7.23Domreg2 −7.91 9.55 −4.45 0.22 −8.20 −11.46 −14.30
Change in private credit to GDPKcont −6.54 −7.70 −3.99 −13.54* −7.87 −3.24 −5.36Fincont1 −1.16 2.00 0.88 −4.85 −1.30 0.76 −0.96Fincont2 1.31 2.39 2.09 −0.53 1.72 4.65 2.17Fxreg1 −7.87 −7.34 −6.13 −13.79* −11.08 −4.34 −8.20Fxreg2 −11.09 −10.37 −8.37 −20.17* −14.17* −5.37 −11.39Domreg1 −19.21** −24.90** −20.09** −20.42** −18.60** −16.07* −19.21*Domreg2 −15.22* −10.60 −9.72 −17.69* −21.11** −17.36** −15.07*
Crisis resilienceKcont 5.15** 4.18* 5.04** 5.02* 5.50* 2.00 5.59** 4.59* 4.60**Fincont1 0.13 −0.68 0.02 −0.32 −0.21 −0.93 0.33 0.58 −0.59Fincont2 1.20 −0.19 1.25 0.35 0.79 −0.83 1.66 1.24 0.26Fxreg1 5.28** 4.72* 4.89** 4.93** 5.17** 2.68* 5.56** 5.08** 4.90**Fxreg2 4.23 3.02 3.67 3.38 3.90 2.15 4.69 3.80 3.00Domreg1 4.65* 5.48** 4.72* 4.68* 4.73* 3.15 4.88 4.74 4.31Domreg2 3.12 1.35 2.43 3.04 2.79 3.79 3.65 3.12 2.58
Notes: Debt liabilities are the share of debt liabilities in total liabilities in 2007 (in percent). FX credit is the share of FX loans in total loans in 2007 (in percent). Change inprivate credit to GDP is calculated over 2003–07. Crisis resilience is the difference between real GDP growth rates averaged over 2008–09, and 2003–07. Robust standarderrors. *, **, and *** indicate significance at 10, 5, and 1% levels respectively. Values in cells indicate the estimated coefficients for relevant policy measures indicated inrow headers. Thus, for example, −11.52 in the first cell (column 1) is the estimated effect of capital controls on the share of debt liabilities in the benchmark specification,and −5.02 is the estimated effect of capital controls on the share of debt liabilities when the stock market capitalization variable is included in the benchmark specifica-tion.
a Baseline specification refers to columns (1)–(7) in Tables 1–4.b Stock market capitalization variable added to the baseline specification.c Banks' return on equity added to the baseline specification.d The ICRG index replaced with the polity index (reflecting the type of political regime) in the baseline specification.e (Log of) real GDP per capita added to the baseline specification.f Excluding the Baltic countries (Estonia, Latvia, and Lithuania) from the sample and re-estimating baseline specification.g Excluding the countries identified as advanced economies (Czech Rep., Iceland, Israel, and Korea) from the sample and re-estimating baseline specification.h (Log of) forex reserves to GDP ratio added to the baseline specification.i Nominal GDP (average 2005–07) added to the baseline specification.
418 J.D. Ostry et al. / Journal of International Economics 88 (2012) 407–421
despite, rather than because of, any potential endogeneity bias(which would tend to bias the results toward finding no effect).28
Nevertheless, we use lagged values of the capital controls indexin all estimations to mitigate the endogeneity concerns, and, in ad-dition, apply an instrumental variable two-stage least squares (IV-2SLS) approach to explicitly address reverse causality. For this, werequire at least one valid instrument that is correlated with thecapital controls index but is not expected to affect the dependentvariable directly. We consider two such potential instruments—a(binary) variable reflecting the existence of a bilateral investmenttreaty (BIT) between country i and the United States in year t, anda (binary) variable indicating whether the country is a member of
28 Another type of bias might arise if countries that have capital controls tend to pur-sue weaker macroeconomic policies, and it is the latter that dissuades investors frominvesting in the country; however, our vulnerability measure should capture much ofthis.
the European Union (EU). These variables are expected to be im-portant determinants of capital controls because both BITs withthe United States and EU membership constrain the use of capitalaccount restrictions, but there is no a priori reason to believe thatthey would be directly related to, say, the composition of externalliabilities.29
growth resilience regressions. Moreover, existence of a BIT is not especially associatedwith greater assistance during the recent global financial crisis—of the 20 EME coun-tries in our sample with a BIT, none received a Federal Reserve swap line (Korea hasan FTA which had not been approved by the U.S. Congress at that time, and Mexicohas an exception for balance-of-payments difficulties under NAFTA that is less restric-tive on capital controls than the terms of the BITs).
30 Cline (2010), however, uses a composite index of capital account restrictiveness,which does not distinguish between controls on inflows and controls on outflows,whereas our analysis, based on the Schindler index, distinguishes explicitly betweeninflow and outflow controls (so, for example, India and Turkey are similar in termsof their capital account restrictiveness as defined by the Quinn–Toyoda index; but dif-fer considerably based on the Schindler inflows index).
Table 10Sensitivity analysis: panel data, 1995–2008.Source: Authors's estimations.
Baselinea Stock market capitalizationb Financial soundnessc Polityd Excluding Balticse Excluding advancedf FX reserves/GDPg Pre-crisis GDPh
Debt liabilitiesKcont −10.05*** −6.35* −10.17*** −9.88** −9.63*** −10.20***Fincont1 −3.11 1.09 −3.64 −3.63 −1.83 −3.44Fincont2 −6.95** −3.26 −7.61** −8.13** −6.16* −7.21**Fxreg1 −2.13 1.98 −2.46 −0.21 −2.61 −3.26Fxreg2 −5.39 −1.98 −6.52 −3.80 −4.56 −6.10Domreg1 −3.75 1.85 −4.55 −2.82 −2.80 −0.31Domreg2 2.15 7.50 1.93 3.38 0.70 3.79
FX creditKcont −28.50*** −26.18*** −28.48***−28.02*** −27.79*** −28.09***Fincont1 −9.01 −4.00 −8.85 −7.67 −10.76 −10.10Fincont2 −20.55** −15.45 −20.16** −19.50** −21.86*** −21.38**Fxreg1 −23.64*** −26.37*** −22.58***−24.31*** −23.73*** −24.93***Fxreg2 −36.55*** −35.78*** −35.63***−36.37*** −35.35*** −39.21***Domreg1 3.42 5.15 3.44 3.09 6.37 3.35Domreg2 12.48 0.77 12.47 13.29 10.41 14.35
Change in private credit to GDPKcont 0.78 0.99 0.79 −1.14 1.62 0.68Fincont1 −1.25 −1.06 −1.27 −0.72 −1.17 −3.48Fincont2 2.18 2.33 2.17 3.14 2.54 0.05Fxreg1 1.25 1.32 1.21 −0.73 1.41 0.39Fxreg2 −1.83 −1.17 −1.74 −3.97 −0.36 −0.15Domreg1 −9.38** −12.86*** −10.40** −11.67** −7.12* −9.05**Domreg2 −5.86 −5.65 −6.04 −6.01 −7.11 −7.26
Crisis resilienceKcont 5.80*** 5.08*** 5.78*** 6.70*** 4.56*** 6.32*** 5.82*** 8.26***Fincont1 −0.40 −0.57 −0.45 0.18 −0.78 −0.54 −0.31 −0.06Fincont2 1.09 −0.88 1.11 2.42 0.25 0.90 1.23 1.28Fxreg1 0.82 0.82 0.82 1.51 -2.39 0.06 1.10 0.52Fxreg2 3.98 3.50 4.00 4.62 −0.14 3.60 4.71 3.58
Notes: Debt liabilities are the share of debt liabilities in total liabilities (in percent). FX credit is the share of FX loans in total loans (in percent). Change in private credit to GDP iscalculated over three years. Crisis resilience is the difference between real GDP growth rate in crisis year and the average growth rate over past 5 years. Kcont, Fincontrol, Fxreg andDomreg are lagged one year. Domreg is available for 2005 and 2007 only. Clustered robust standard errors (on country level). *, **, and *** indicate significance at 10, 5, and 1% levelsrespectively. Values in cells indicate the estimated coefficients for relevant policy measures indicated in row headers. Thus, for example, −10.05 is the estimated effect of capitalcontrols on the share of debt liabilities in the benchmark specification, and −6.35 is the estimated effect of capital controls on the share of debt liabilities when the stock market.
a Baseline specification refers to columns (1)–(7) in Tables 4–8.b Stock market capitalization variable added to the baseline specification.c Banks' return on equity added to the baseline specification.d ICRG index replaced with the polity index (reflecting the type of political regime) in the baseline specification.e Excluding the Baltic countries (Estonia, Latvia, and Lithuania) from the sample and re-estimating baseline specification.f Excluding the countries identified as advanced economies (Czech Rep., Iceland, Israel, and Korea) from the sample and re-estimating baseline specification.g (Log of) forex reserves to GDP ratio added to the baseline specification.h Nominal GDP (average 2005–07) added to the baseline specification.
419J.D. Ostry et al. / Journal of International Economics 88 (2012) 407–421
The validity of our instrument is supported by the results from thefirst stage of the IV-2SLS estimation: the estimated coefficients of BITsand EU membership are negative and mostly statistically significantindicating that countries that have ratified a BIT with the UnitedStates, or are members of the EU have lower prevalence of capitalcontrols on inflows. The F-test of the hypothesis that the estimatesin the first stage regression are jointly equal to zero is rejected, andthe R-squared of all first stage specifications (reported in Table A5,which is available online) is in the range of 0.30–0.60, offering someevidence on the appropriateness of our instruments. The Sargan testof over-identifying restrictions also cannot be rejected in mostcases, and supports the validity of the instruments. The results ofthe second stage of the estimation support the strong association be-tween capital controls and crisis resilience in both the recent and pastcrises episodes. The relationship between capital controls and debt li-abilities becomes weaker in the cross-sectional specification, but isstronger in the panel regressions (Table A5, panel B). The magnitudeof the effect is however somewhat larger, consistent with the intui-tion above that not controlling for potential endogeneity would biasthe coefficient downwards.
3.3.3. Country sampleFinally, we check the robustness of our results to the country sam-
ple, dropping some of the smallest countries; and dropping countriesthat are classified as advanced economies in the IMF's World Eco-nomic Outlook classification. In a recent study of 24 EMEs, Cline(2010) finds no relationship between capital account openness andthe output decline during the crisis, and questions whether such a re-lationship exists (or whether it is driven by the experience of the Bal-tic countries in the EME sample, which he considers unrepresentativeas they are small economies).30 While we believe that including theBaltic countries in the sample is important, as they suffered some ofthe largest output declines during the 2008–09, and as such their ex-perience is informative, we re-estimate the cross-sectional and panel
420 J.D. Ostry et al. / Journal of International Economics 88 (2012) 407–421
specifications without the three Baltic countries (Estonia, Latvia, andLithuania) in the sample.
As shown in Table 9, excluding the Baltic countries from the sam-ple leaves the sign of the effect of economy-wide capital controls,Kcont, the same, but reduces the magnitude of the coefficient,which now becomes statistically insignificant.31 This is scarcely sur-prising, however, as the Baltic countries suffered the largest outputdeclines in the 2008–09 crisis—excluding them means throwing outhighly informative observations. In particular, as noted above, our hy-pothesis is not that controls on capital inflows are beneficial forgrowth in normal times, but rather that by reducing the build-up offinancial fragilities, such measures can help avoid the worst outcomesin the event of crisis. Once countries that suffered the worst crises areexcluded from the sample, therefore, it is natural that this effect can-not be identified in the data.
Rather than simply exclude the Baltic countries on grounds thatthey are small economies, therefore, it is preferable to retain themin the sample but control explicitly for the size of the economy (lestthat be the cause of their larger output decline). This is done inTables 9 and 10 (last column), where the pre-crisis U.S. dollar-valueof GDP is added as a regressor; doing so leave the coefficient oneconomy-wide capital controls largely unchanged, positive, and sta-tistically significant. Moreover, in the panel regressions of past crises(where the Baltics are not so important because other countries in thesample also suffered severe crises), excluding the Baltics makes littledifference to the results, with Kcont again positive and statisticallysignificant—regardless of whether one controls for foreign currencyreserves or the economic size of the country (Table 10).
Finally, we also try excluding countries that may be identified asadvanced economies otherwise (specifically, Czech Republic, Iceland,Israel, and Korea). This does not change the estimated sign and mag-nitude of the coefficients; and capital controls remain strongly associ-ated with a lower share of debt liabilities, less FX lending, and greatercrisis resilience in both cross-section and panel specifications.
32 For example, when Croatia imposed “speed limits” on credit growth in 2003, banks
4. Conclusion
This paper analyzes the effects of prudential policies and capital con-trols on the financial-stability risks associatedwith capital inflow surgesand the extent towhich policies in place during boomsmay help tomit-igate the damage that can occur during busts.We construct new indicesfor prudentialmeasures and for financial sector-specific capital controlsfor 51 emerging market economies over the period 1995–2008.
Our findings suggest that capital controls and various prudentialpolicies can help reduce the riskiness of external liability structuresand the extent of risky foreign-currency lending in the economy. Pru-dential policies that do not discriminate on the basis either of curren-cy or residency can also help to mitigate the intensity of domesticcredit booms. By helping to reduce the buildup of financial fragilitiesduring the boom phase, prudential policies and capital controls canhelp to enhance economic resilience during the bust when foreigncapital dries up and flows out. Our empirical results suggest the ben-efits from appropriate pre-crisis policies are both statistically signifi-cant and economically relevant.
Our paper has not discussed potential costs associated with use ofprudential policies and capital controls. Micro-level studies haveshown that capital controls can make access to financing relativelymore difficult to small and medium enterprises (Forbes, 2007) anddomestically-owned firms (Harrison et al., 2004). However, if thechoice is between capital controls and prudential policies, the issue is
31 It is noteworthy, however, that using Schindler's sub-index of capital controls spe-cific to debt liabilities (rather than the overall capital control index) yields a statistical-ly significant association between the growth decline in the 2008–09 global financialcrisis and the controls that were in place prior to the crisis even excluding the threeBaltic countries from the sample.
not completely clear-cut. While capital controls may indeed make fi-nancing for small and medium enterprises (SMEs) more difficult,these firms typically rely more on domestic bank financing than on for-eign flows, whereas larger and internationally-known firms are morelikely to be able to access foreign financing. Therefore, prudential mea-sures on the domestic banking system are also likely to disproportion-ately affect the availability of finance to SMEs. Further, excessive limitson banks could lead to disintermediation and proliferation of non-regulated financial institutions (Wakeman-Linn, 2007). Although be-yond the scope of this paper (which looks at the financial-stabilityrisks associated with capital flows, rather than the magnitude of theflows themselves), a further consideration in the use of capital controls(or prudential measures that may act like them) concerns their multi-lateral impact—including possible diversion of flows toward otherEMEs that may be less able to absorb them without incurring theirown financial-stability risks (Forbes et al., 2011).
By definition, prudential measures can only have traction on flowsthat are intermediated through the regulated financial institutions. Di-rect borrowing fromabroad, through branches of foreign banks, or inter-mediated through unregulated institutions such as finance companies,may not be subject to domestic prudential regulation. Moreover, apply-ing prudential measures to domestic banks may cause flows to migrateto unregulated corners of the financial system as a result of regulatoryarbitrage.32 This can also create an un-level playing field for domesticbanks relative to foreign competitors and non-banks. While it may bepossible to widen the perimeter of regulation, this normally takestime, and at least in the interim, capital controls may have a useful role.
Beyond a fuller treatment of the relative costs and benefits of thevarious measures, future research might usefully consider a numberof issues related to their design, including how they can be gearedto temporary versus more persistent capital flows, whether theyshould be broad or narrowly targeted, and whether they should beprice or quantity-based.
Appendix A. Supplementary data
Supplementary data to this article can be found online at doi:10.1016/j.jinteco.2012.02.002.
References
Bakker, B., Gulde, A., 2010. The credit boom in the EU new member states: bad luck orbad policies? IMF Working Paper 10/130. IMF, Washington DC.
Barajas, A., Dell'Ariccia, G., Levchenko, A., 2007. Credit booms: the good, the bad, andthe ugly. Mimeo, IMF.
Basso, H.S., Calvo-Gonzalez, O., Jurgilas, M., 2007. Financial dollarization and the role ofbanks and interest rates. ECB Working Paper 748. European Central Bank,Frankfurt.
Bordo, M., Meissnner, C., Stuckler, D., 2009. Foreign currency debt, financial crises andeconomic growth: a long run view. NBER Working Paper 15534. NBER, Cambridge,MA.
Cardenas, M., Barrera, F., 1997. On the effectiveness of capital controls: the experienceof Colombia during the 1990s. Journal of Development Economics 54 (1), 27–57.
Clements, B., Kamil, H., 2009. Are Capital Controls Effective in the 21st Century? TheRecent Experience of Colombia. IMF Working Paper No. 09/30.
Chinn, M., Ito, H., 2008. A new measure of financial openness. Journal of ComparativePolicy Analysis 10 (3), 309–322.
Cline, W., 2010. Financial Globalization, Economic Growth, and the Crisis of 2007–09.Peterson Institute for International Economics, Washington DC.
De Gregorio, J., Edwards, Valdés, R., 2000. Controls on capital inflows: do they work?Journal of Development Economics 63 (1), 59–83 October.
Dell'Ariccia, G., Marquez, R., 2006. Lending booms and lending standards. Journal of Fi-nance 51 (5), 2511–2546.
moved part of their loan portfolio to affiliated leasing companies. That speed limit waslater replaced by higher marginal reserve requirements on foreign liabilities, with reg-ulations being continuously refined to close loopholes exploited by the banks. Their ex-perience suggests that targeted controls may lead to migration to unregulated cornersof the financial sector, and a shift toward direct borrowing from abroad; see Ostry et al.(2011).
421J.D. Ostry et al. / Journal of International Economics 88 (2012) 407–421
Djankov, S., Hart, O., McLiesh, C., Shleifer, A., 2008. Debt enforcement around the world.Journal of Political Economy 116 (6), 1105–1149.
Forbes, K., 2007. One cost of the Chilean capital controls: increased financial constraintsfor smaller traded firms. Journal of International Economics 71 (2), 294–323.
Forbes, K., Fratzscher, M., Kostka, T., and Straub, R., 2011. Bubble thy neighbor: directand spillover effects of capital controls. Mimeo, Massachusetts Institute ofTechnology.
Furceri, D., Guichard, S., Rusticelli, E., 2011. Episodes of large capital inflows and thelikelihood of banking and currency crises and sudden stops. OECD Economics De-partment Working Paper 865. OECD, Paris.
Ghosh, A.R., Ostry, J.D., Tsangarides, C., 2010. Exchange rate regimes and the stability ofthe international monetary system. IMF Occasional Paper 270. IMF, WashingtonDC.
Gupta, P., Mishra, D., Sahay, R., 2007. Behavior of output during currency crises. Journalof International Economics 72 (2), 428–450.
Harrison, A., Love, I., McMillian, M., 2004. Global capital flows and financing con-straints. Journal of Development Economics 75 (1), 269–301.
Hutchison,M., Pasricha, G., Singh, N., 2011. Effectiveness of capital controls in India: evidencefrom the offshore NDF market. Working Paper 2011-29. Bank of Canada, Ottawa.
IMF, 2012. The IMF–FSB Early Warning Exercise: Design and Methodological Toolkit.IMF Occasional Paper, forthcoming. IMF, Washington DC.
Korinek, A., 2010. Excessive dollar borrowing in emerging markets: balance sheet ef-fects and macroeconomic externalities. Mimeo, University of Maryland.
Ma, G., McCauley, R.N., 2008. Efficacy of China's capital controls: evidence from priceand flow data. Pacific Economic Review 13 (1), 104–123.
Magud, N., Reinhart, C., Rogoff, K., 2006. Capital controls: myth and reality. a portfoliobalance approach to capital controls. Mimeo, Harvard University.
Mendoza, E., Terrones, M.E., 2008. An anatomy of credit booms: evidence from macroaggregates and micro data. NBER Working Paper 14049. NBER, Cambridge.
OECD, 2009. Code of Liberalization of Capital Movements. OECD, Paris.Ostry, J.D., Ghosh, A.R., Habermeier, K., Chamon, M., Qureshi, M.S., Reinhardt, D.B.S.,
2010. Capital inflows: the role of controls. IMF Staff Position Note SPN/10/04.IMF, Washington DC.
Ostry, J.D., Ghosh, A.R., Habermeier, K., Laeven, L., Chamon, M., Qureshi, M.S., Kokenyne,A., 2011. Managing Capital Inflows: What Tools to Use? IMF Staff Discussion NoteSDN/11/06. IMF, Washington DC.
Quinn, D.P., Toyoda, A.M., 2008. Does capital account liberalization lead to economicgrowth? Review of Financial Studies 21 (3), 1403–1449.
Razin, A., Sadka, E., Yuen, C., 1998. A pecking order of capital inflows and internationaltax principles. Journal of International Economics 44 (1), 45–68.
Razin, A., Sadka, E., Yuen, C., 2000. Do debt flows crowd out equity flows or the otherway round? Annals of Economics and Finance 1 (1), 33–47.
Rosenberg, C., Tirpak, M., 2009. Determinants of foreign currency borrowing in the newmember states of the EU. Czech Journal of Economics and Finance 59 (3), 216–228.
Schindler, M., 2009. Measuring financial integration: a new data set. IMF Staff Papers56 (1), 222–238.
Wakeman-Linn, J., 2007. Managing large scale foreign exchange inflows: internationalexperiences. Mimeo, IMF.
Wei, S.J., 2001. Domestic crony capitalism and international fickle capital: is there aconnection? International Finance 4 (1), 15–45.


![OFR_ Financial Stability Risks Remain Moderate [CHARTS]](https://img.dokumen.tips/doc/110x75/55cf8612550346484b93fdd8/ofr-financial-stability-risks-remain-moderate-charts.jpg)

