Embed Size (px)
Citation preview
Tools and Tools and ChartsCharts
Language ArtsLanguage ArtsAugust 3, 2006August 3, 2006
Summer 2006 PreschoolSummer 2006 PreschoolCSDCCSDC
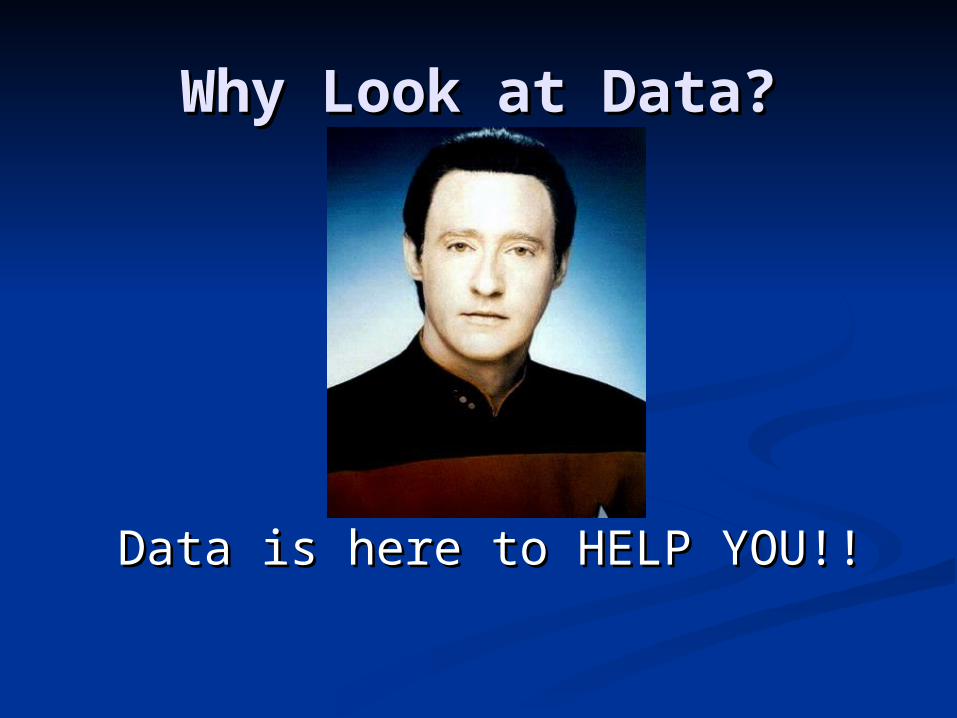
Why Look at Data?Why Look at Data?
Data is here to HELP YOU!!Data is here to HELP YOU!!
Who or What is Data?Who or What is Data? Data is an android –in Data is an android –in
Star Trek: The Next GenerationStar Trek: The Next Generation. . He was He was a sentient a sentient artificial artificial lifeformlifeform designed to designed to resemble a resemble a humanhuman. He has a . He has a positronicpositronic brain brain for computational capabilities. Late for computational capabilities. Late in his life, Data discovered an "emotion in his life, Data discovered an "emotion chip", and he felt emotions like we do. chip", and he felt emotions like we do.
We are androids and humanoids from the We are androids and humanoids from the planet TECHNOLOGIA, this planet is not planet TECHNOLOGIA, this planet is not situated in the Outer Browder Galaxy, but situated in the Outer Browder Galaxy, but can be found in the Louder Browder can be found in the Louder Browder Galaxy.Galaxy.
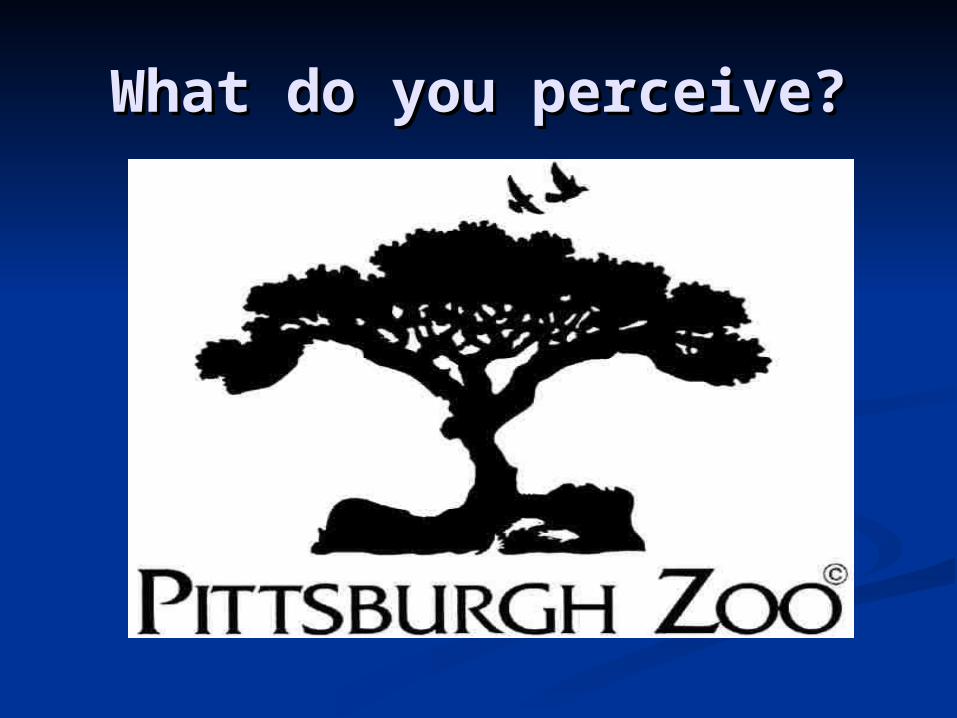
What do you perceive?What do you perceive?
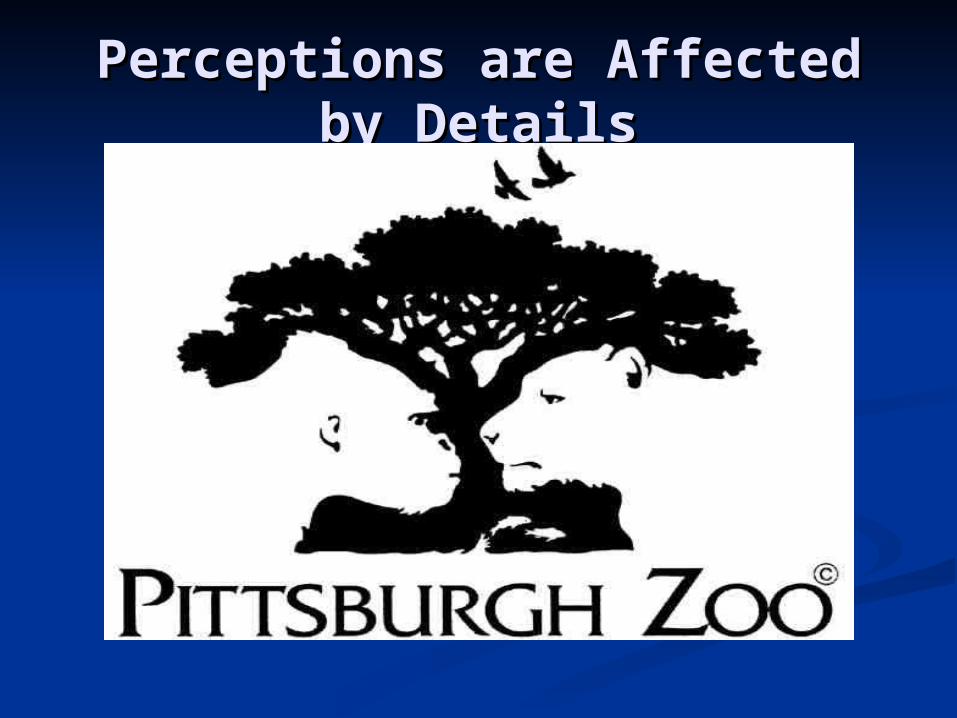
Perceptions are Affected by Perceptions are Affected by DetailsDetails
What details do you know What details do you know about your students? How about your students? How do those details affect your do those details affect your
students’ grades?students’ grades? Scatter Diagrams show CAUSE and Scatter Diagrams show CAUSE and
EFFECT.EFFECT. Use a Scatter diagram to determine if there Use a Scatter diagram to determine if there
is a relationship between your student is a relationship between your student scores and how much you know about your scores and how much you know about your students.students.
Plot the number of facts you know about a Plot the number of facts you know about a student against his/her student score. Then student against his/her student score. Then draw a line through the middle of the dots. draw a line through the middle of the dots. The line bisecting the dots is the Trend Line.The line bisecting the dots is the Trend Line.
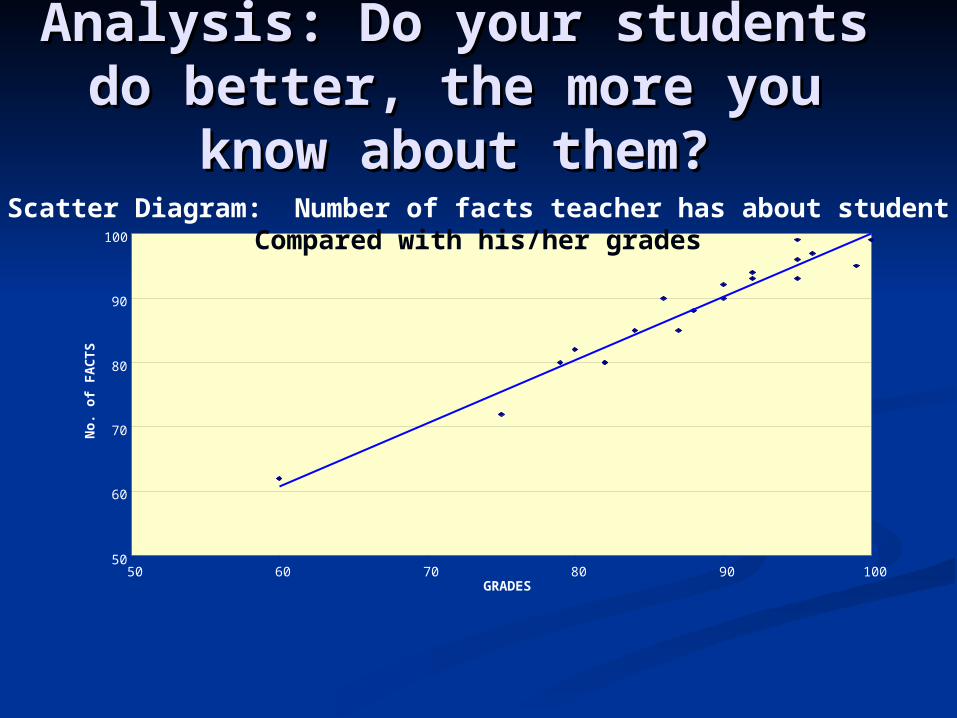
Analysis: Do your students Analysis: Do your students do better, the more you do better, the more you
know about them?know about them?Scatter Diagram: Number of facts teacher has about student
Compared with his/her grades
50
60
70
80
90
100
50 60 70 80 90 100GRADES
No
. of
FA
CT
S
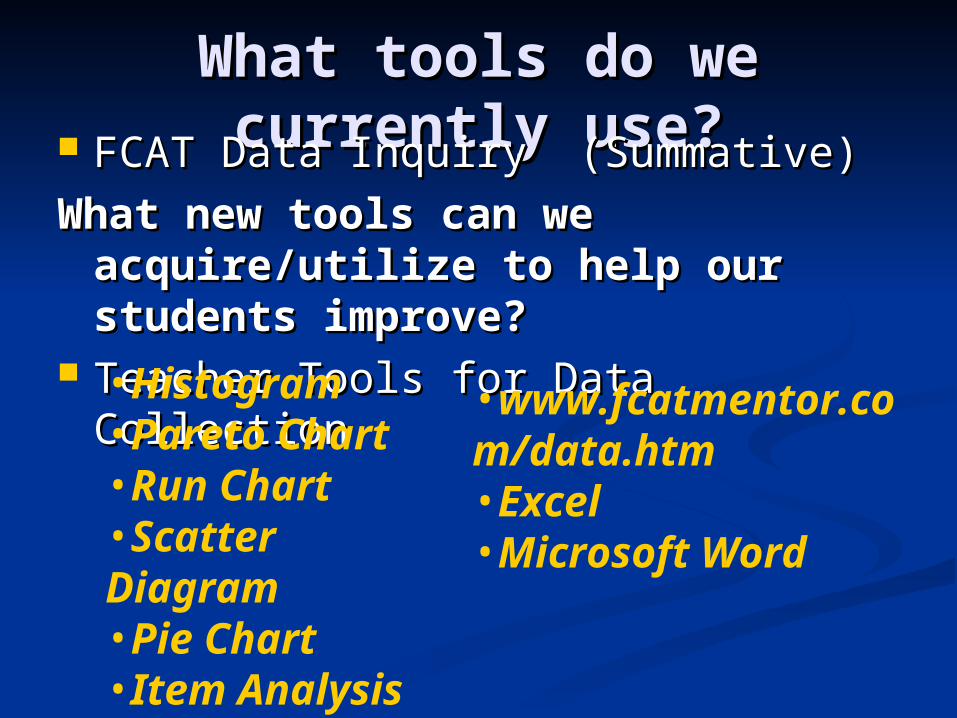
What tools do we What tools do we currently use?currently use? FCAT Data Inquiry (Summative)FCAT Data Inquiry (Summative)
What new tools can we What new tools can we acquire/utilize to help our acquire/utilize to help our students improve?students improve?
Teacher Tools for Data CollectionTeacher Tools for Data Collection•Histogram•Pareto Chart•Run Chart•Scatter Diagram•Pie Chart•Item Analysis
•www.fcatmentor.com/data.htm•Excel•Microsoft Word
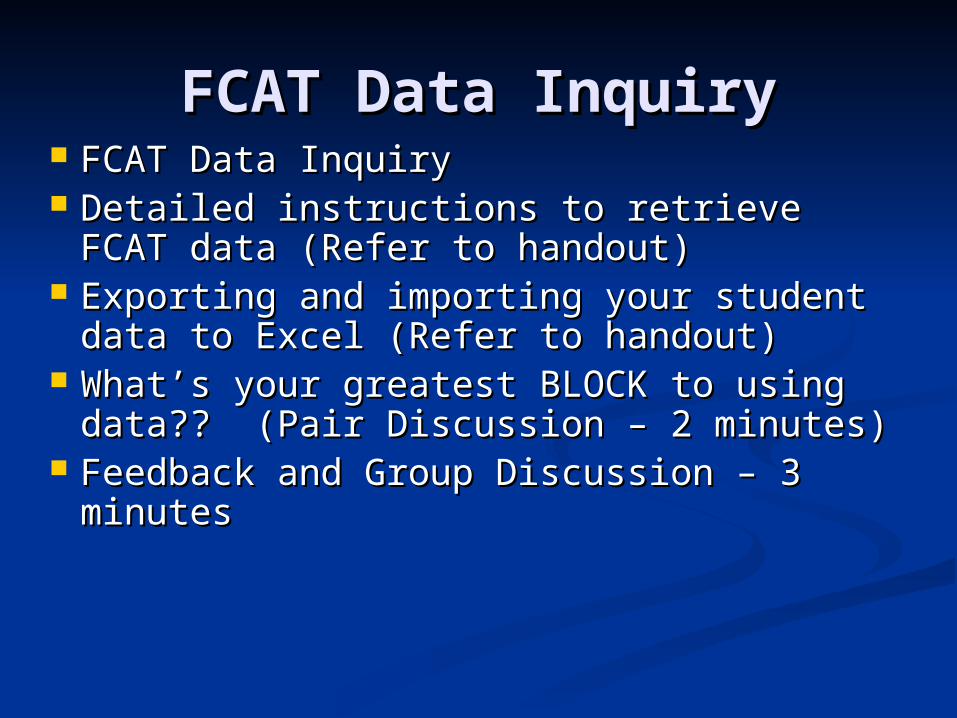
FCAT Data InquiryFCAT Data Inquiry FCAT Data Inquiry FCAT Data Inquiry Detailed instructions to retrieve FCAT Detailed instructions to retrieve FCAT
data (Refer to handout)data (Refer to handout) Exporting and importing your student Exporting and importing your student
data to Excel (Refer to handout)data to Excel (Refer to handout) What’s your greatest BLOCK to using What’s your greatest BLOCK to using
data?? (Pair Discussion – 2 minutes) data?? (Pair Discussion – 2 minutes) Feedback and Group Discussion – 3 Feedback and Group Discussion – 3
minutesminutes
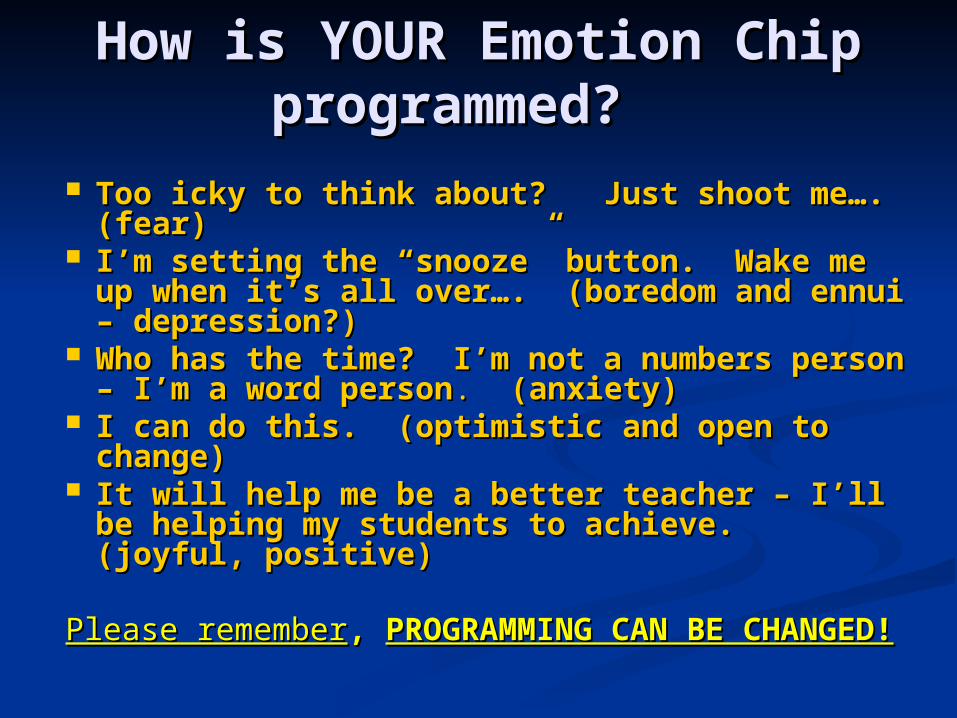
How is YOUR Emotion Chip How is YOUR Emotion Chip programmed? programmed?
Too icky to think about? Just shoot me…. Too icky to think about? Just shoot me…. (fear)(fear)
I’m setting the “snooze” button. Wake me I’m setting the “snooze” button. Wake me up when it’s all over…. (boredom and ennui – up when it’s all over…. (boredom and ennui – depression?)depression?)
Who has the time? I’m not a numbers person Who has the time? I’m not a numbers person – I’m a word person– I’m a word person. . (anxiety)(anxiety)
I can do this. (optimistic and open to change) I can do this. (optimistic and open to change)
It will help me be a better teacher – I’ll be It will help me be a better teacher – I’ll be helping my students to achieve. (joyful, helping my students to achieve. (joyful, positive)positive)
Please rememberPlease remember, , PROGRAMMING CAN BE PROGRAMMING CAN BE CHANGED!CHANGED!
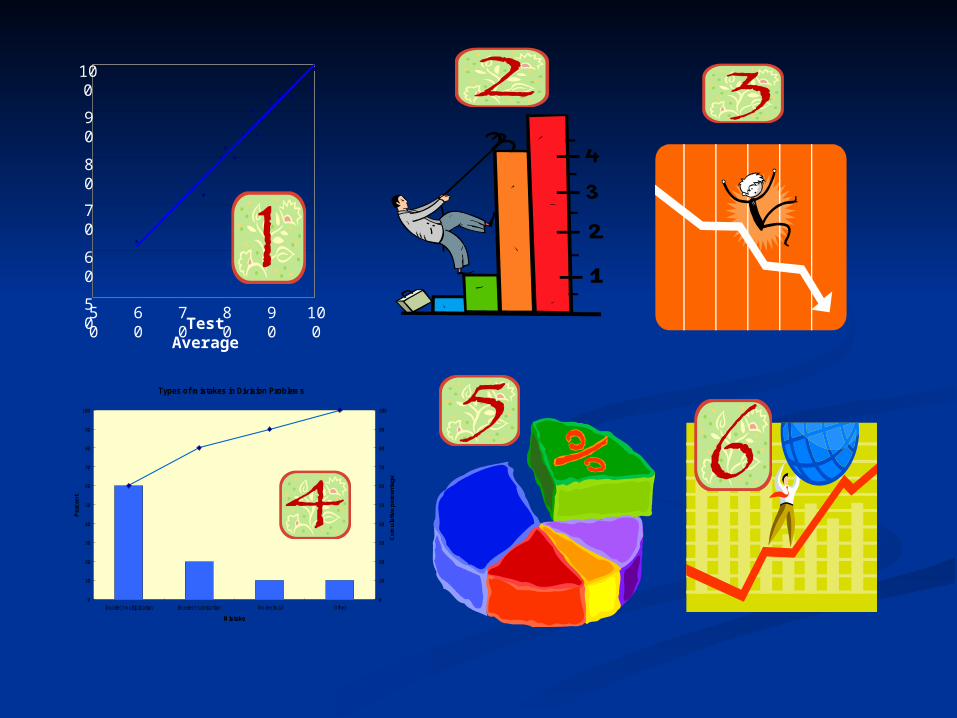
Pre-TestPre-Test
Please look at the next slide Please look at the next slide and study the charts.and study the charts.
Can you identify them?Can you identify them?Please number your paper Please number your paper
from 1-6 and identify each from 1-6 and identify each chart. chart. (Keep it clean, people!)
50
60
70
80
90
100
50
60
70
80
90
100Test
Average
Types of mistakes in Division Problems
0
10
20
30
40
50
60
70
80
90
100
Incorrect multiplication Incorrect subtraction No decimal Other
Mistake
Per
cen
t
0
10
20
30
40
50
60
70
80
90
100
Cu
mu
lativ
e p
erce
nta
ge
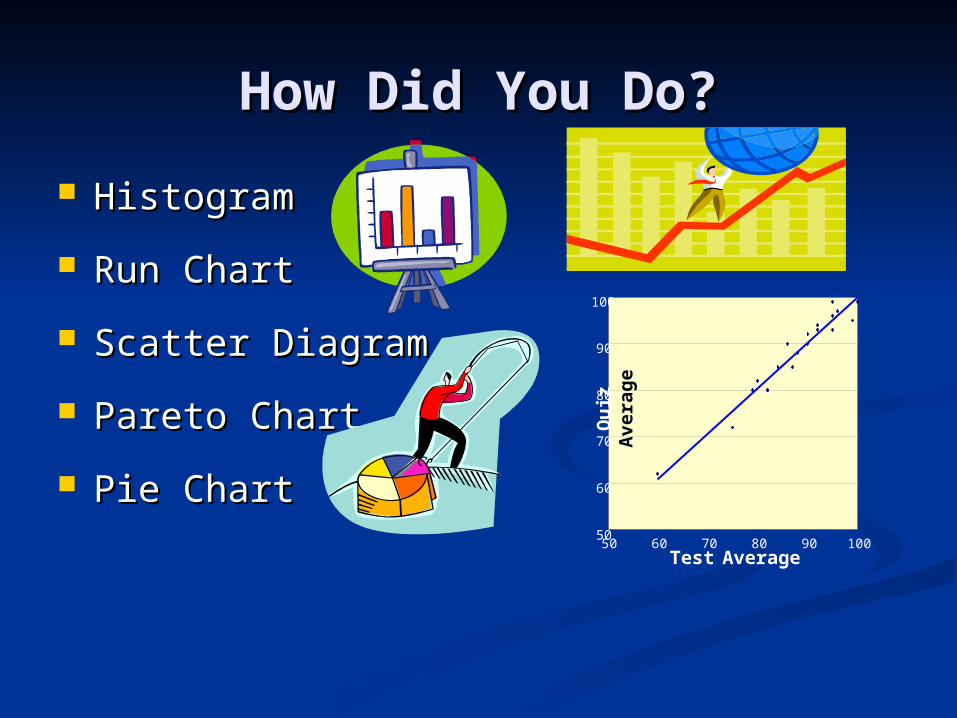
How Did You Do?How Did You Do?
HistogramHistogram
Run ChartRun Chart
Scatter DiagramScatter Diagram
Pareto ChartPareto Chart
Pie ChartPie Chart50
60
70
80
90
100
50 60 70 80 90 100Test Average
Qu
iz
Ave
rag
e
Pareto LimerickPareto Limerick
There once was a man named There once was a man named Alfredo --Alfredo --
He invented a chart called He invented a chart called “Pareto.”“Pareto.”
The man was no fool ---The man was no fool --- It’s a heck of a tool!It’s a heck of a tool! And it’s better than eating a And it’s better than eating a
potato!potato!
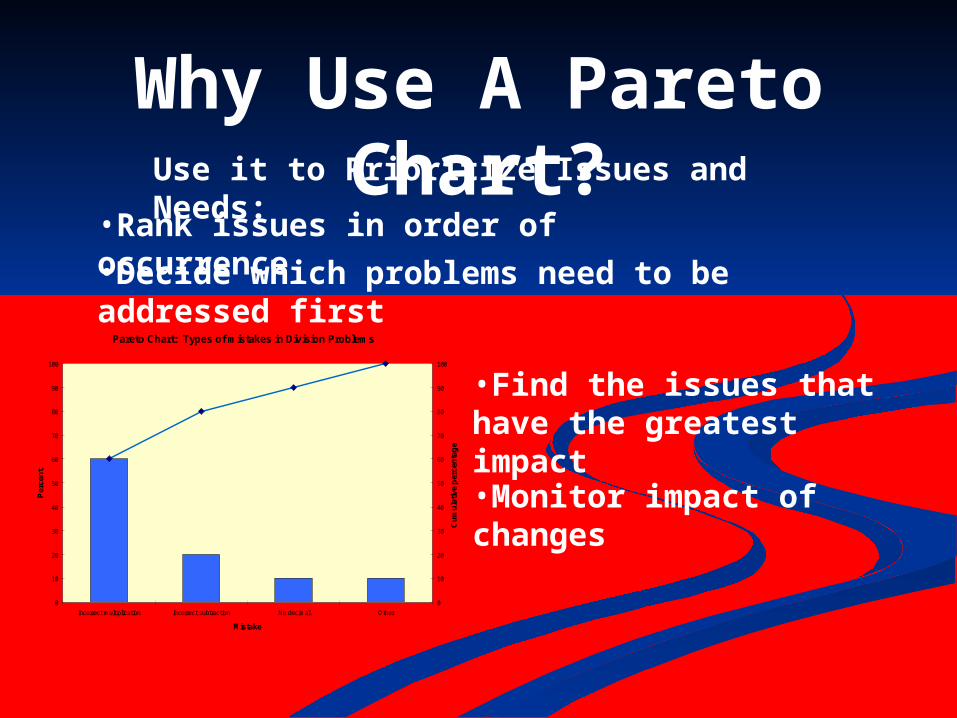
Why Use A Pareto Chart?Use it to Prioritize Issues and Needs:
•Rank issues in order of occurrence
•Decide which problems need to be addressed first
•Find the issues that have the greatest impact
•Monitor impact of changes
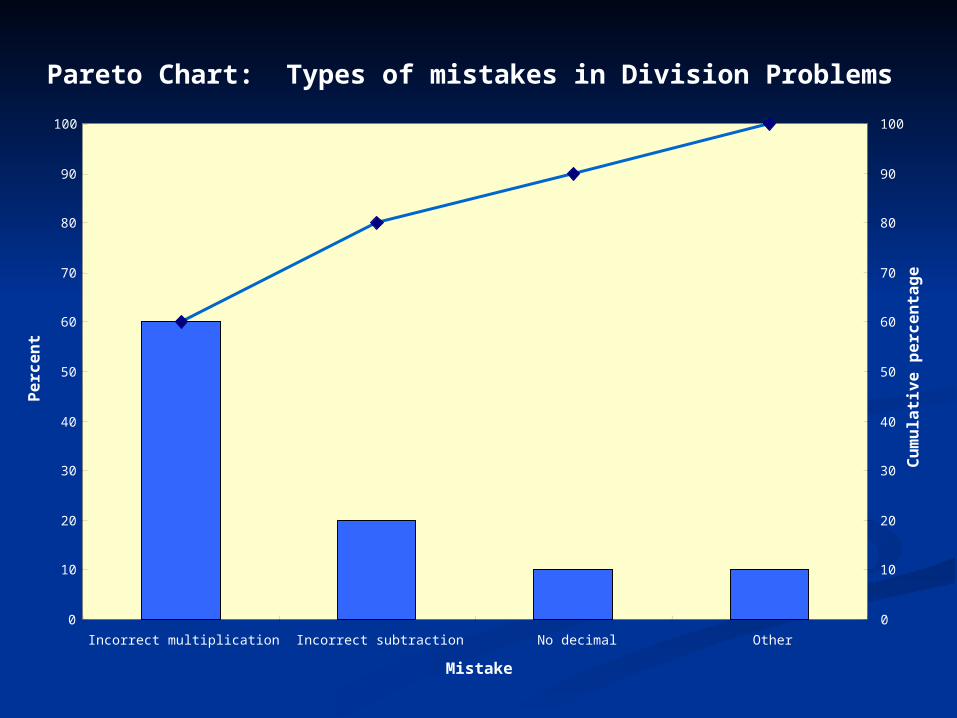
Pareto Chart: Types of mistakes in Division Problems
0
10
20
30
40
50
60
70
80
90
100
Incorrect multiplication Incorrect subtraction No decimal Other
Mistake
Per
cen
t
0
10
20
30
40
50
60
70
80
90
100
Cu
mu
lativ
e p
erce
nta
ge
Pareto Chart: Types of mistakes in Division Problems
0
10
20
30
40
50
60
70
80
90
100
Incorrect multiplication Incorrect subtraction No decimal Other
Mistake
Pe
rce
nt
0
10
20
30
40
50
60
70
80
90
100
Cu
mu
lati
ve
pe
rce
nta
ge
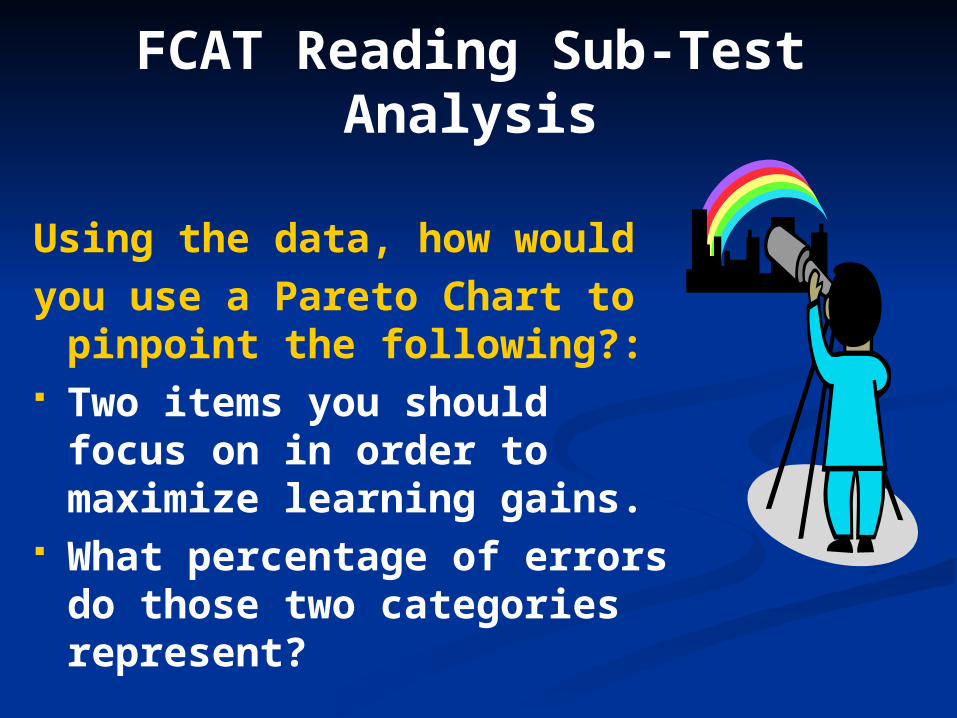
FCAT Reading Sub-Test Analysis
Using the data, how wouldyou use a Pareto Chart to
pinpoint the following?: Two items you should
focus on in order to maximize learning gains.
What percentage of errors do those two categories represent?
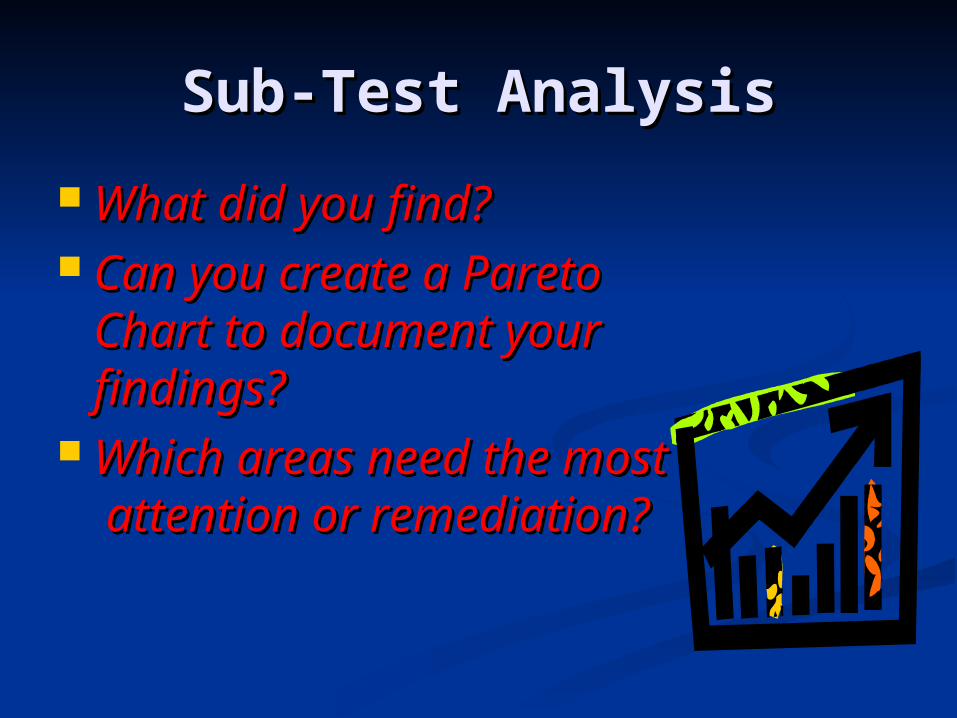
Sub-Test AnalysisSub-Test Analysis
What did you find?What did you find? Can you create a Pareto Can you create a Pareto
Chart to document your Chart to document your findings? findings?
Which areas need the Which areas need the most attention or most attention or remediation?remediation?
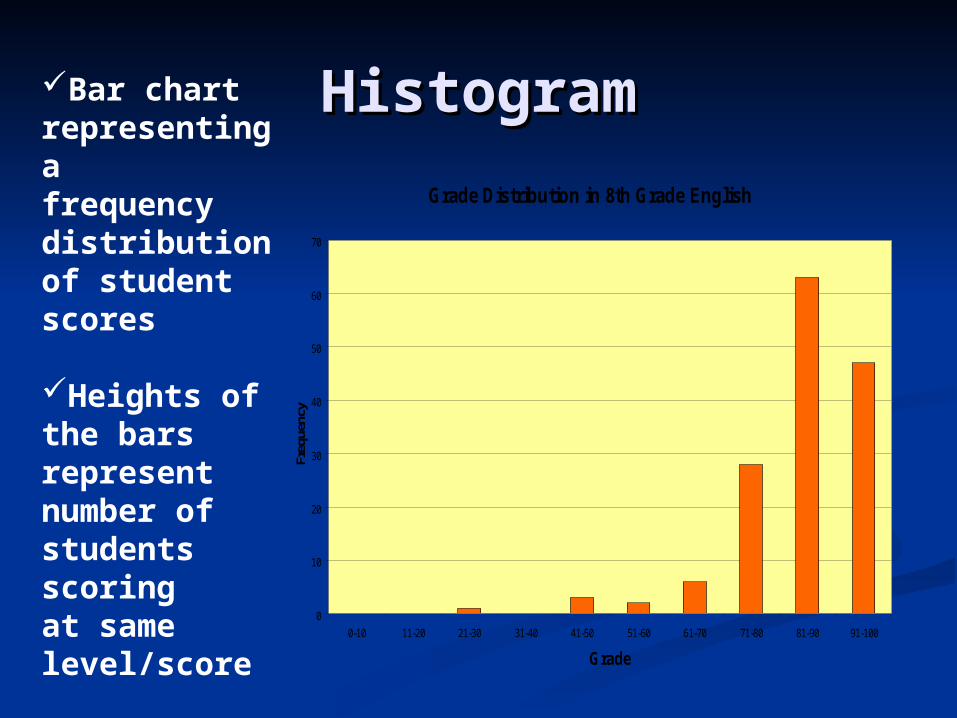
HistogramHistogram
Grade Distribution in 8th Grade English
0
10
20
30
40
50
60
70
0-10 11-20 21-30 31-40 41-50 51-60 61-70 71-80 81-90 91-100
Grade
Freq
uenc
y
Bar chart representing a frequency distribution of student scores
Heights of the bars represent number of students scoring at same level/score
Used to Monitor progress
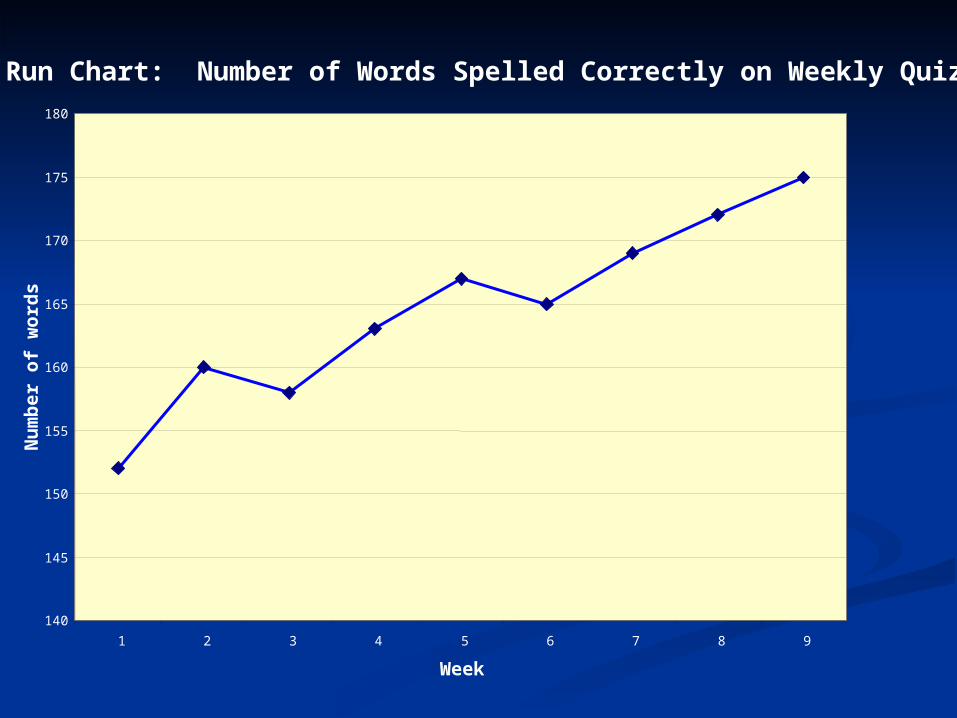
Run Chart: Number of Words Spelled Correctly on Weekly Quiz
140
145
150
155
160
165
170
175
180
1 2 3 4 5 6 7 8 9
Week
Nu
mb
er o
f w
ord
s
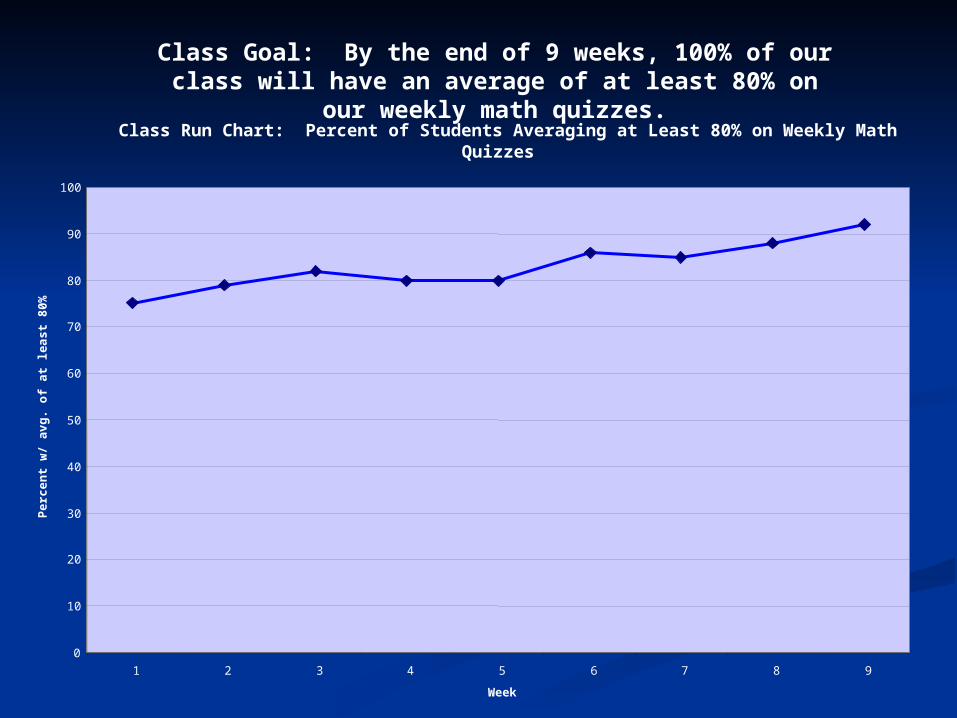
Class Goal: By the end of 9 weeks, 100% of our class will have an average of at least 80% on our
weekly math quizzes.Class Run Chart: Percent of Students Averaging at Least 80% on Weekly Math
Quizzes
0
10
20
30
40
50
60
70
80
90
100
1 2 3 4 5 6 7 8 9
Week
Per
ce
nt
w/
avg
. o
f a
t le
as
t 8
0%
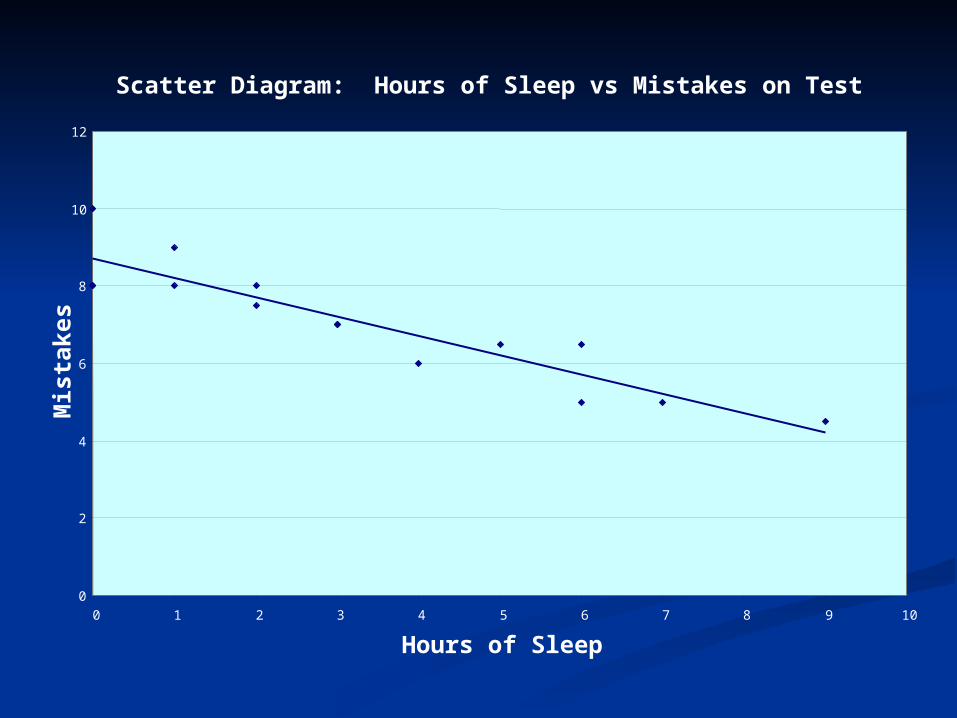
Scatter Diagram: Hours of Sleep vs Mistakes on Test
0
2
4
6
8
10
12
0 1 2 3 4 5 6 7 8 9 10
Hours of Sleep
Mis
take
s
Data analysis provides:
Insight
and
Questions
Adapted from Getting Excited About Data, Edie Holcombwww.corwinpress.com
• What’s the question?• What can you tell from the data?• What can you NOT tell from the
data? • Celebrate the good data!• Improve the problems indicated
by the data.
Ask yourself….
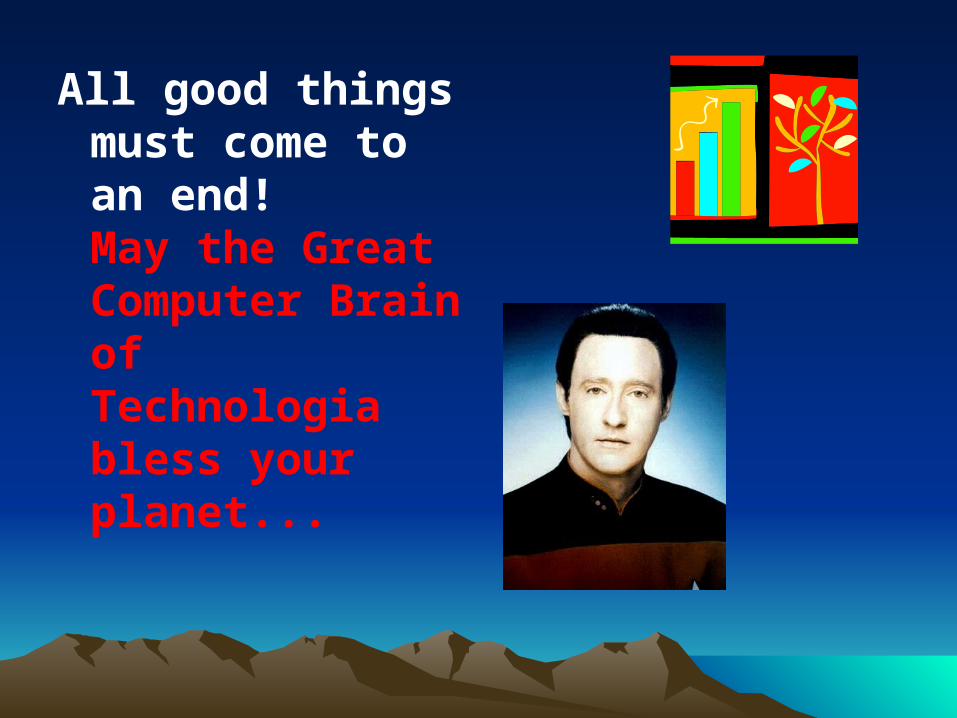
All good things must come to an end!May the Great Computer Brain of Technologia bless your planet...