Embed Size (px)
Citation preview
Tool: Activity Tracking
This interactive spreadsheet permits your school to articulately describe the scope and depth of
activities you choose to uniquely implement and offer your students through your farm to school
program during one school year.
Because farm to school is implemented differently in each community, the spreadsheet is designed to
be customizable to your site. The Activity Tracking spreadsheet can track activity in school gardens,
classrooms, and cafeterias. Activity tracking can be completed at the school level (elementary-middle-
high), at the grade level, or at the classroom level. It also could include tracking activities specific to an
after-school group if that meets your needs.
The User Guide follows, here, for a detailed description of how to use and complete the Activity Tracking
spreadsheet.
Introduction Farm to school programs seek to connect schools with local producers to facilitate use of locally-
grown foods in school cafeterias, in combination with nutrition and agricultural education through
classroom lessons, engagement activities, and gardens. Farm to school programs vary considerably
between communities. The unique ideas developed and fostered within each community make farm to
school programs a rich experience for the students (and teachers!) involved. However, this diversity
makes it difficult to compare programs and ascertain program effectiveness. Demonstrating that
programs are effective is one way to communicate with administrators and policymakers, to garner
broader support and funding for programming.
Farm to school program evaluators believe that capturing program activity in the face of broad
diversity is an important undertaking. Accurate activity tracking can accomplish two main goals. First, it
can serve as a means for summarizing and describing the scope of activities taking place in a school or
community over the course of a school year (with longer-term tracking, it can also chart the course of
program development). Second, it can provide insight into any specific activities, or groups of activities,
that may have greater or lesser influence on students’ learning experiences and corresponding
outcomes. This insight can improve understanding of the impact of current activities, and may help
inform future programming.
In essence, this tool helps you describe the “dose” or intensity of the programming happening at
your school. It will give insight into the frequency, duration, and variety of activities incorporated in
your farm to school program. It is particularly important to track activities across an entire school year
since programming typically varies across that time to align with seasonal differences. An even better
approach is tracking activities multiple school years (using new copies of the tracker each year) to track

program development. Sustainability of effort, though challenging, is important to consider when
choosing to use this tool.
“Excel 101” This Activity Tracking tool uses Microsoft Excel. There are multiple tabs (worksheets); they are
named according to the major sections of this User Guide. You can see the tab/worksheet names across
the bottom of your screen:
There are different colors of cells to help guide you through the worksheets. The key colors are:
● uncolored cells - for entering activity tracking data
● blue cells - for entering group names (i.e., school name/level; grade; or classroom)
● peach cells - contain formulas that will automatically (a) calculate scores based on information
(numbers) in the white cells or (b) label group names by drawing from what you enter in the
blue cells.
Another note about using Excel: The spreadsheet is currently set, on most pages, to show the gridlines
that are the boundaries to each cell. If you prefer to use the worksheet without seeing these
boundaries, you can turn off the gridlines (each worksheet page separately) by doing the following:
● Go to the “View” menu tab at the top of the screen
● Towards the left-hand side of the screen is a group of check boxes including formula bar, ruler,
headings, and gridlines. UNCHECK the box next to “gridlines” and that will remove the cell
boundary lines.
● You may change this setting at any time.

Activity Domains In this activity tracker, activities are categorized into four broad domains: Local Food Offerings
in School Meals, Classroom Education, Engagement Activities, and Gardens. For each domain, it is
important to document the activities that apply and some additional information regarding the number
of activities, the amount of time spent on activities, and which school(s), grade(s), or classroom(s)
participated. In this section of the User Guide, you will learn the information needed for each domain
and which cells to complete in the Excel document/activity tracking tool.
Domain: Local Food Offerings in School Meals
Tab: School Meals
In this domain, document locally-sourced items that appear on the school meal menu.
Cells to complete:
● B1 (School Name), B2 (School Year), B4 (Last Updated). School Name and School Year will copy
into the other worksheets.
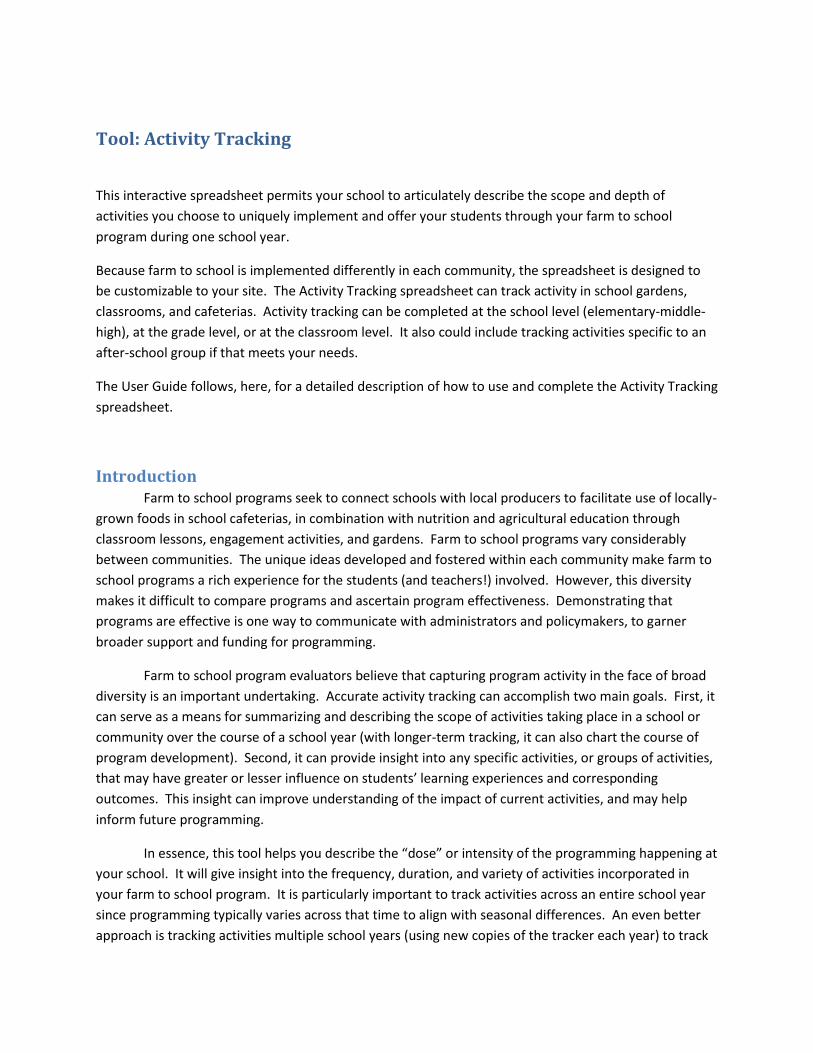
● Blue-colored cells (row 8) say School/Grade/Class. For each group of students for which you are
tracking activities, type the title in one of these cells. Thirteen sets are prepared with the
appropriate columns and formulas.
○ Note: For this domain, it may be feasible to track at the school level (elementary,
middle, high). For the other domains, it may be more appropriate to track activities
specific to a grade, or even a classroom.
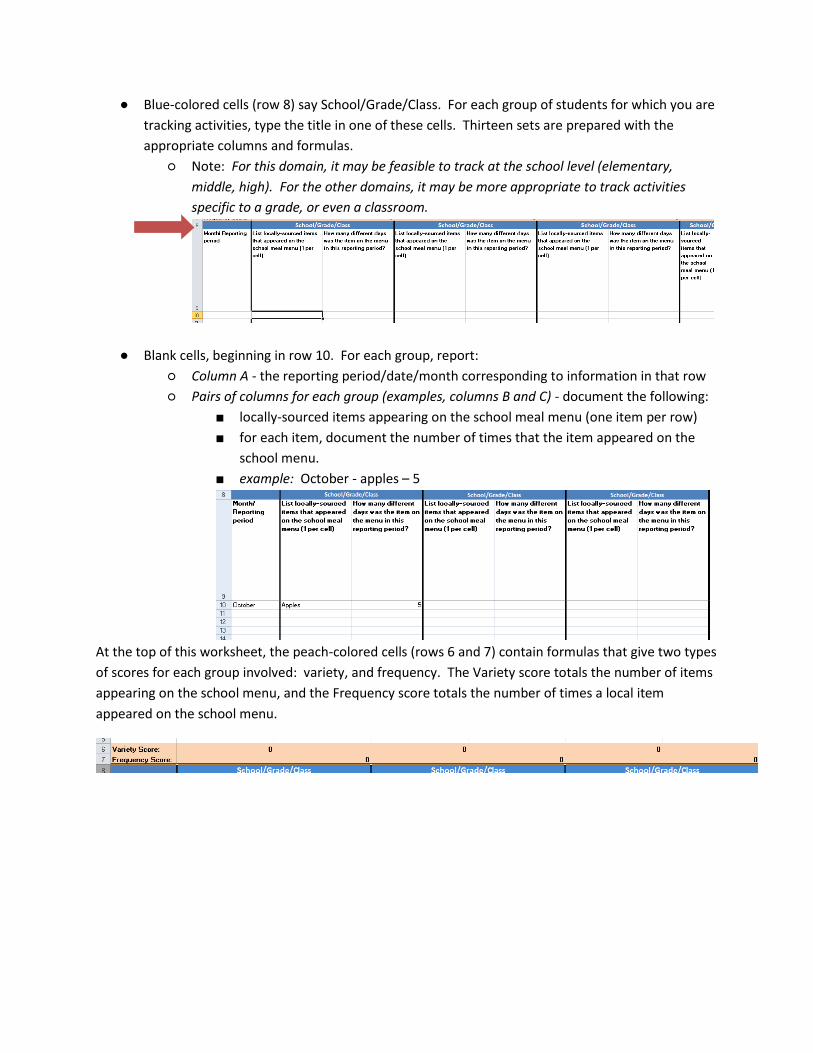
● Blank cells, beginning in row 10. For each group, report:
○ Column A - the reporting period/date/month corresponding to information in that row
○ Pairs of columns for each group (examples, columns B and C) - document the following:
■ locally-sourced items appearing on the school meal menu (one item per row)
■ for each item, document the number of times that the item appeared on the
school menu.
■ example: October - apples – 5
At the top of this worksheet, the peach-colored cells (rows 6 and 7) contain formulas that give two types
of scores for each group involved: variety, and frequency. The Variety score totals the number of items
appearing on the school menu, and the Frequency score totals the number of times a local item
appeared on the school menu.

Domain: Classroom Education
Tab: ClassroomEducation
In this domain, document the classroom lessons that focus on farm to school themes but are integrated
into a traditional lesson plan format.
Cells to complete:
● B4 (last updated)
● Blue-colored cells (row 9), with the name of each group of students for which you are tracking
activities. This will most likely be a grade level (i.e., 4th grade) or a classroom (i.e., Mr Smith’s
classroom).

● Blank cells, beginning in row 13. For each entry, report:
○ Column A – Month (or reporting period, or date)
○ Column B - a brief description of the lesson theme
■ Suggestions are included in row 12
○ Groups of two columns for each student group (example, columns C and D):
■ number of lessons received by the group of students
■ number of minutes per lesson received by the group of students
At the top of this worksheet, above each group (rows 7 and 8), the peach-colored cells contain formulas
that give two types of scores. The F2S - Number of Contacts score totals the number of unique lessons
related to Farm to School received by each student group. The F2S - Duration of Contact score totals the
number of minutes spent in Farm to School-related classroom lessons by each student group (# lessons x
# minutes).
Domain: Engagement Activities
Tab: Engagement Activities
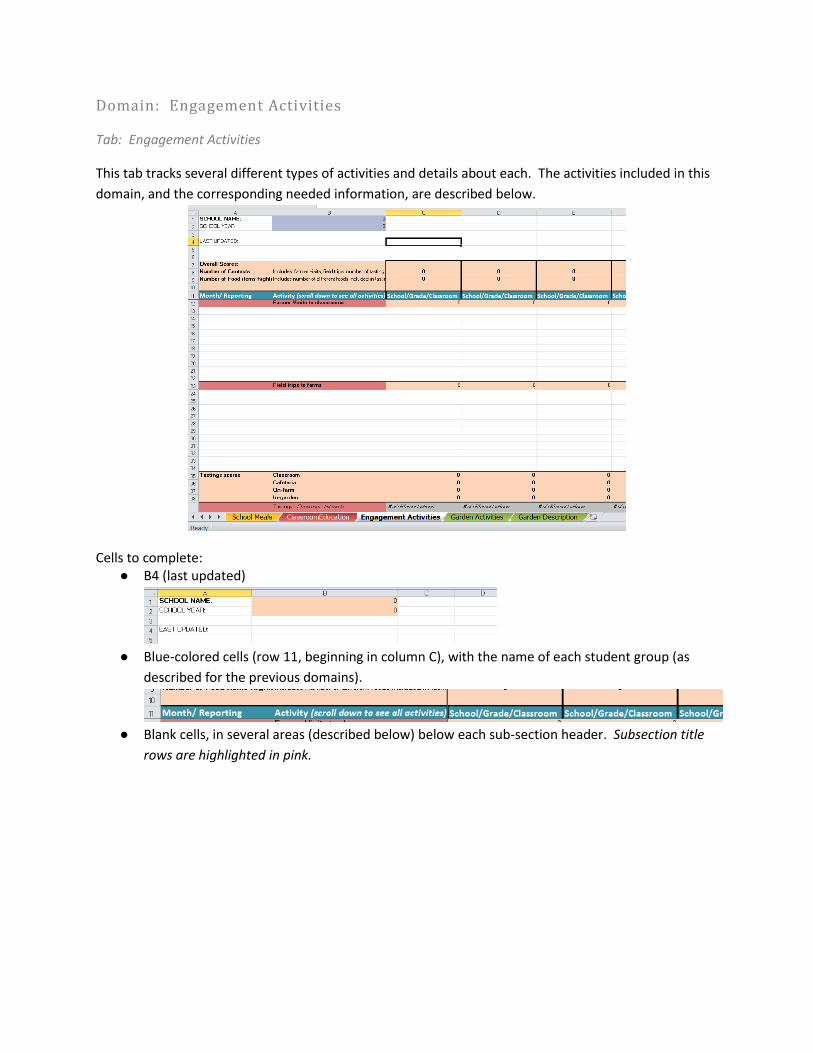
This tab tracks several different types of activities and details about each. The activities included in this
domain, and the corresponding needed information, are described below.
Cells to complete: ● B4 (last updated)
● Blue-colored cells (row 11, beginning in column C), with the name of each student group (as
described for the previous domains).
● Blank cells, in several areas (described below) below each sub-section header. Subsection title
rows are highlighted in pink.

Farmer Visits (lines 13-22)
● Grouped according to student groups you assign (row 11, blue cells)
● In Column A, type the month/date
● In Column B, make a brief note about the visit (i.e., topic of the farmer’s presentation)
● In Columns C/D/E/(etc), note the number of visits received by a student group for the reporting
period
● The peach cells in row 12 sum (with formulas) the total number of farmer visits received by each
student group over the course of the school year.
Field Trips to Farms (lines 24-34)
● In Column A, report the month/date
● In Column B, make a brief note about the field trip
● In Column C/D/E/(etc), enter the number of field trips received by a student group.
● The peach cells in row 23 sum (with formulas) the total number of field trips received by each
student group over the course of the school year.
Tastings (rows 35-82)
● Tasting activities are categorized into four groups: Classroom, Cafeteria, On-farm, and In-
garden. Each has their own set of rows, starting with a pink row. Peach cells at the top of this
section (rows 35-38) sum the number of tasting activities in each sub-location. For each group,
document the following:
○ Column A - month/date
○ Column B - list the food tasted
○ Column C/D/E/(etc) - list the number of tasting activities received by a student group
over the course of the school year.
**See screen shot next page**

Information sent home to parents (rows 84-94)
● Examples: Farm to School Newsletter, web site, Facebook page, emails, other.
○ In Column A - month/date
○ In Column B - list the format(s) disseminated in the reporting period
○ In Column C/D/E/(etc) - enter the total number of pieces sent home/communicated to
parents in the reporting period.
● Peach cells (row 83) give the total number of pieces of information sent home/communicated to
parents (formulas) over the course of the school year.
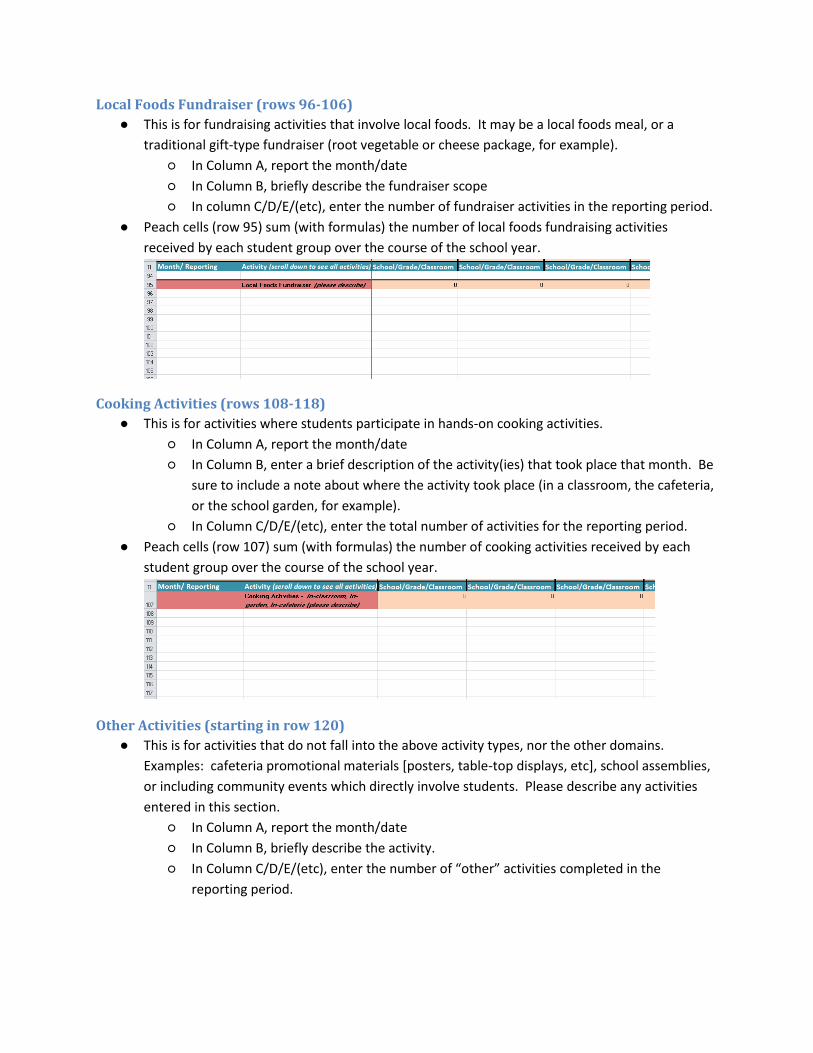
Local Foods Fundraiser (rows 96-106)
● This is for fundraising activities that involve local foods. It may be a local foods meal, or a
traditional gift-type fundraiser (root vegetable or cheese package, for example).
○ In Column A, report the month/date
○ In Column B, briefly describe the fundraiser scope
○ In column C/D/E/(etc), enter the number of fundraiser activities in the reporting period.
● Peach cells (row 95) sum (with formulas) the number of local foods fundraising activities
received by each student group over the course of the school year.
Cooking Activities (rows 108-118)
● This is for activities where students participate in hands-on cooking activities.
○ In Column A, report the month/date
○ In Column B, enter a brief description of the activity(ies) that took place that month. Be
sure to include a note about where the activity took place (in a classroom, the cafeteria,
or the school garden, for example).
○ In Column C/D/E/(etc), enter the total number of activities for the reporting period.
● Peach cells (row 107) sum (with formulas) the number of cooking activities received by each
student group over the course of the school year.
Other Activities (starting in row 120)
● This is for activities that do not fall into the above activity types, nor the other domains.
Examples: cafeteria promotional materials [posters, table-top displays, etc], school assemblies,
or including community events which directly involve students. Please describe any activities
entered in this section.
○ In Column A, report the month/date
○ In Column B, briefly describe the activity.
○ In Column C/D/E/(etc), enter the number of “other” activities completed in the
reporting period.

● The peach cells (row 119) sum (with formulas) the number of “other” activities received by each
student group over the course of the school year.
At the top of the Engagement Activities worksheet, the peach cells (rows 7-9) contain formulas that sum, for each student group (over the course of the school year):
● Number of Contacts (number of activities) - farmer visits; field trips; number of tasting activities;
information sent home; local foods fundraisers; cooking activities; "other"
● Number of Foods Highlighted - number of different foods included in tasting activities
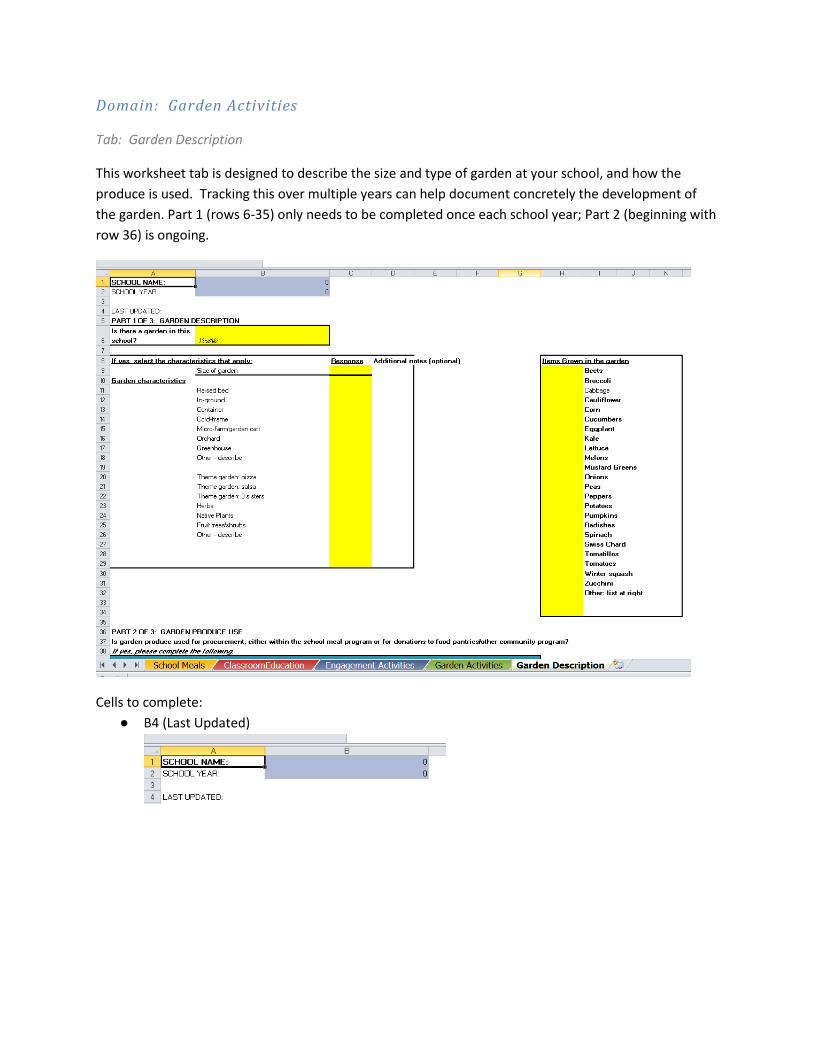
Domain: Garden Activities
Tab: Garden Description
This worksheet tab is designed to describe the size and type of garden at your school, and how the
produce is used. Tracking this over multiple years can help document concretely the development of
the garden. Part 1 (rows 6-35) only needs to be completed once each school year; Part 2 (beginning with
row 36) is ongoing.
Cells to complete:
● B4 (Last Updated)

Part 1: Garden Description
● B6: Is there a school garden (yes/no)
● Column C, rows 9-26: describe the size of the garden and select (for example, with an X) any
garden characteristics that apply to your school’s garden.
● Column H, rows 9-34: select which items are grown in the garden.
Part 2: Garden Produce Use
● This part of the Garden Description tab documents how produce grown in the garden is used.
● In Column A, enter the month/date (beginning with row 41)
● In Column B, list one item (per row) grown in the garden that is used for:
○ School meals (mark with an x or a 1 in Column D)
○ School snacks (mark with an x or a 1 in Column E)
○ Other school activity educational use (mark with an x or a 1 in Column F)
■ examples: taste tests, cooking activity, during classroom lessons, science
projects, or other similar activities
○ OR Donating (mark with an x or a 1 in Column G)
■ examples: to a food pantry or other community organization, or sharing with
families in the school community (teachers, parents, etc.)
● In Column C, enter the estimated weight of the produce harvested and used/donated in that
reporting period.

● The peach-colored cells (row 40; see above screenshot image) sum:
○ Column C - total pounds of produce grown in the garden
○ Column D - percent of items being used for school meals
○ Column E - percent of items being used for school snacks
○ Column F - percent of items being used in educational activities
○ Column G - percent of items being donated
○ Note: Columns D-G are calculated according to the number of items entered in Column
B, not according to the total pounds.
Tab: Garden Activities (Garden Domain, Part 3)
This worksheet documents activities taking place in the garden for each student group.
Cells to complete:
● B4 (Last Updated)
● Blue cells, row 7: student group names (as described for the other domains)

● Blank cells, beginning row 12.
○ Column A - enter the month/reporting period
○ Column B - enter the general time of the activity: School day, after-school, summer, or
lunchtime
○ Column C - enter a brief description of the activity
○ Pairs of columns (one pair for each student group; example, columns D and E):
■ number of visits (i.e., that an individual student within the group would receive)
■ number of minutes per visit
Peach-colored cells (row 11) contain formulas to calculate the total number of visits and the total
number of minutes received by each student group over the course of the school year.
A Caveat This tool can provide valuable information about the number and types of activities taking place
in your farm to school program. It is clear that this farm to school Activity Tracking tool requires
significant effort and time on the parts of personnel who are admirably committed to students while
working on extremely limited financial and time budgets. We provide this tool as an opportunity for
schools who are committed to more comprehensive evaluation efforts, who have ample capacity for
collecting this information, or who may be participating in more formal research or evaluation efforts.
If your school is concerned about sustainability of tracking, perhaps consider using individual
sections of the Activity Tracker depending on your own evaluation priorities - for example, perhaps it is
most important to you to track garden use and activities, or to track procurement of local foods and
their use in school meals. As mentioned above, be sure that your school has sustainable capacity for
tracking across an entire school year (or more) in order to obtain meaningful information describing
your farm to school program activities.