Embed Size (px)
Citation preview

SDT: 47 - 41
TONGA 2016
CENSUS OF POPULATION AND HOUSING
VOLUME 1:
BASIC TABLES AND ADMINISTRATIVE REPORT
Tonga Statistics Department
PO BOX 149 Nuku’alofa Tonga
October 2017
Tonga 2016 Census of Population and Housing
© 2017 Tonga Statistics Department
All rights for commercial/ for profit reproduction or translation, in any form, reserved. TDS authorises the partial reproduction or translation of this material for scientific, educational or research purposes, provided that TDS and the source document are properly acknowledged.
This report was prepared by the staff of Tonga Statistics Department – Census Team with the assistance of SPC, and printed by the Tonga Fast Print Limited.
More information
For more information about the Tonga 2016 Census of Population and Housing, or request additional statistical information from the Census not included in this Volume, please contact the Tonga Statistics Department
Tonga Statistics Department PO Box 149 Nuku’alofa Tonga Telephone: + (676) 23300 Facsimile: + (676)24303 Email: [email protected] http://tonga.prism.spc.int

Tonga 2016 Census of Population and Housing
Preface This report is the 8th population census report of the kingdom since 1956, and the 6th census conducted by the Statistics Department. It provides administrative information and basic statistical tabulation of the 2016 Population and Housing Census of Tonga. The census date was midnight, the 30th of November 2016. Information incorporated in this report will facilitate the decision makers in Tonga with respect to the current and future socio-economic conditions in the Kingdom.
The substantive information of this report is presented in three parts. Part 1 presents the statistical tables (General Tables and Household Tables) itemizing the data provided in the Analytical report. Part 2 provides the background information on Census 2016. Part 3 contains the Appendices which include: the Questionnaire Forms.
The 2016 Census was carried out with the support and efforts of many people. These include: Minister of Finance, under whose authority the Census was undertaken: the Chairperson of the Steering Committee, the Secretary of Finance for his leadership and coordination of the Steering Committee, thus making all census activities possible. Thanks also to all the members of the steering committee for their valuable contributions and suggestions in making the census operations work efficiently.
My appreciation is extended to the Secretariat of the Pacific Community (SPC) for all the technical assistance they provided. I also wish to acknowledge to the Government of Tonga for the financial assistance because without their support the census would not have happened. Special thank you to Tonga Health Promotion Foudation for the financial assistance that was directed to the census operational. I would like to further extend my appreciation to the UNICEF for the kind donation of equipments.
My sincere gratitude to the Director of Education for allowing education officers and teachers to enumerate and supervise the 2016 Census, and to all these peoples, your hard work is highly appreciated. I also wish to thank the Census team and the rest of the staff of the Statistics Department for their valuable contributions offered throughout the 2016 Census. Finally, to all the people of Tonga for their generous responses to the questionnaires, your contributions are of vital importance in making Tonga’s 2016 Population and Housing Census a success.
Since the improvement of statistical data base of the Kingdom is a continuous function of the Statistics Department, it would welcome any constructive comments and suggestions from user for future improvement of the contents, coverage and the quality of the population census report.
Malo ‘Aupito
Dr. Viliami Konifelenisi Fifita Government Statistician Tonga Statistics Department
3

Tonga 2016 Census of Population and Housing
4

Tonga 2016 Census of Population and Housing
4
Table of Contents Preface ........................................................................................................................................ 2
Abbreviations .............................................................................................................................. 7
Glossary ....................................................................................................................................... 8
Key Indicators ............................................................................................................................ 10
Executive summary .................................................................................................................... 13
Part 1: Statistical Tables ............................................................................................................. 16
Part 2: Census 2016 Background ............................................................................................... 248 2.1 Introduction ...................................................................................................................................... 248
2.2 Census History .................................................................................................................................. 248
2.3 Computer-Assisted Personal Interview (CAPI) ................................................................................. 249
2.4 Administrative Framework .............................................................................................................. 250
PART 1: STATISTICAL TABLES
General Tables and Population trends TABLE G 1: TOTAL POPULATION BY SEX, DIVISION AND DISTRICT (2006, 2011 AND 2016) ................................................................... 16 TABLE G 2: TOTAL HOUSEHOLDS (PRIVATE AND INSTITUTION) AND POPULATION BY SEX, DIVISION, DISTRICT AND VILLAGE............................ 17 TABLE G 3: POPULATION GROWTH BY REGION, DIVISION, DISTRICT AND VILLAGE (2011-2016) .............................................................. 20 TABLE G 4: POPULATION DENSITY BY DIVISION, REGION AND SEX....................................................................................................... 23 TABLE G 5: TOTAL HOUSEHOLDS AND POPULATION BY AGE GROUPS, REGION, DIVISION, DISTRICT AND VILLAGE .......................................... 24 TABLE G 6: TOTAL POPULATION BY SINGLE YEAR OF AGE, SEX, DIVISION .............................................................................................. 31 TABLE G 7: TOTAL POPULATION BY SINGLE YEAR OF AGE, SEX AND REGION .......................................................................................... 34 TABLE G 8: TONGAN (TONGAN & PART-TONGAN ETHNIC ORIGIN) BY SINGLE YEAR OF AGE, SEX AND DIVISION .......................................... 36 TABLE G 9: TOTAL POPULATION BY 5-YEAR AGE GROUPS, SEX BY DIVISION AND REGION ........................................................................ 40 TABLE G 10: TOTAL POPULATION BY ETHNIC ORIGIN, SEX, REGION AND DIVISION .................................................................................. 41 TABLE G 11: TOTAL POPULATION BY ETHNIC ORIGIN AND HOUSEHOLD TYPE ........................................................................................ 41 TABLE G 12: TOTAL POPULATION BY ETHNIC ORIGIN, 5 YEAR AGE GROUPS AND SEX .............................................................................. 42 TABLE G 13: PRIVATE HOUSEHOLDS’ POPULATION BY SINGLE YEAR OF AGE, SEX AND DIVISION ................................................................ 43 TABLE G 14: TOTAL POPULATION BY MARITAL STATUS, 5 YEAR AGE GROUPS AND SEX............................................................................ 47 TABLE G 15: TONGAN (TONGAN/PART-TONGAN ETHNIC ORIGIN) POPULATION BY MARITAL STATUS, 5 YEAR AGE GROUPS AND SEX ............... 48 TABLE G 16: PRIVATE HOUSEHOLD POPULATION BY MARITAL STATUS, 5 YEAR AGE GROUP AND SEX ......................................................... 49 TABLE G 17: TOTAL POPULATION BY RELIGIOUS AFFILIATION, SEX AND DIVISION ................................................................................... 50 TABLE G 18: TOTAL POPULATION BY RELIGIOUS AFFILIATION, DIVISION AND DISTRICT ........................................................................... 51 TABLE G 19: TOTAL POPULATION BY RELIGIOUS AFFILIATION, BY DIVISION, DISTRICT AND VILLAGE............................................................ 52 TABLE G 20: RELIGIOUS AFFILIATION BY SEX AND ETHNIC GROUP....................................................................................................... 57 TABLE G 21: POPULATION BY PLACE OF RESIDENCE (DIVISION) IN 2016 AND PLACE OF BIRTH (LIFE TIME MIGRATION), TONGA 2016 ............. 59 TABLE G 22: INTERREGIONAL (DIVISIONAL) LIFETIME MIGRATION, TONGA: 2016 ................................................................................ 59 TABLE G 23: POPULATION BY PLACE OF RESIDENCE (DISTRICT) IN 2016 AND PLACE OF BIRTH (LIFE TIME MIGRATION), TONGA 2016 ............. 60 TABLE G 24: INTER-DISTRICT MIGRATION BY PLACE OF BIRTH DURING THE 2016 CENSUS, TONGA 2016 .................................................. 61 TABLE G 25: POPULATION BY PLACE OF ENUMERATION (DIVISION) AND USUAL RESIDENCE ONE YEARS AGO, TONGA: 2016 ......................... 61 TABLE G 26: INTERREGIONAL (DIVISIONAL) DURING THE ONE YEAR PERIOD PRIOR TO 2016 CENSUS, TONGA: 2016 ................................... 62 TABLE G 27: POPULATION BY PLACE OF RESIDENCE (DISTRICT), DURING THE ONE YEAR PERIOD PRIOR TO 2016 CENSUS, TONGA 2016 .......... 63 TABLE G 28: INTER-DISTRICT MIGRATION, DURING ONE YEAR PERIOD 2016 CENSUS, TONGA 2016 ........................................................ 64 TABLE G 29: POPULATION BY PLACE OF ENUMERATION (DIVISION) AND USUAL RESIDENCE FIVE YEARS AGO, TONGA: 2016.......................... 64 TABLE G 30: INTERREGIONAL (DIVISIONAL) DURING THE FIVE YEARS PERIOD PRIOR TO 2016 CENSUS, TONGA: 2016 .................................. 65 TABLE G 31: POPULATION BY PLACE OF RESIDENCE (DISTRICT), DURING THE FIVE YEARS PERIOD PRIOR TO 2016 CENSUS, TONGA 2016 ........ 66 TABLE G 32: INTER-DISTRICT MIGRATION, DURING FIVE YEAR PERIOD 2016 CENSUS, TONGA 2016 ........................................................ 67 TABLE G 33: POPULATION AGED 2 AND ABOVE BY LEVEL OF DIFFICULTIES AND SEX. .............................................................................. 68 TABLE G 34: POPULATION AGED 2 AND ABOVE WITH TYPE AND LEVEL OF DIFFICULTIES, DEGREE AND SEX, BY REGION ................................ 69

Tonga 2016 Census of Population and Housing
Tonga Statistics Department
5
TABLE G 35: POPULATION WITH THREE LEVEL OF DIFFICULTIES (SOME, AND A LOT OF DIFFICULTY, CANNOT DO AT ALL) BY AGE GROUPS, DIVISION, AND REGION .................................................................................................................................................................. 71
TABLE G 36: POPULATION WITH TWO LEVEL OF DIFFICULTIES (A LOT OF DIFFICULTY AND CANNOT DO AT ALL) BY 5 YEAR-AGE GROUPS ............ 73 TABLE G 37: POPULATION (5 YEARS +) EXPERIENCING MENTALLY ILLNESS BY ISLAND, DISTRICT, AND REGION ............................................ 74 TABLE G 38: PRIVATE HOUSEHOLD WITH HEALTH COMPLAINT, ILLNESS OR INJURY BY SEX, DIVISION AND DISTRICT ...................................... 75 TABLE G 39: TOTAL POPULATION WITH HEALTH COMPLAINT, ILLNESS OR INJURY WHO SOUGHT CARE BY SEX, DIVISION, REGION .................... 76 TABLE G 40: POPULATION (10 YEARS +) SMOKING CIGARETTES OR TOBACCO ON A DAILY BASIS BY 5-YEAR AGE AND SEX .............................. 77 TABLE G 41: POPULATION (10 YEARS +) SMOKING CIGARETTES AND LOCAL TOBACCO ON A DAILY BASIS BY 5-YEAR AGE GROUP AND SEX ........ 78 TABLE G 42: POPULATION (10 YEARS +) SMOKING IMPORTED CIGARETTES AND LOCAL TOBACCO BY ISLAND, DISTRICT, AND REGION. .......... 79 TABLE G 43: POPULATION (10 YEARS +) AND HOW OFTEN THEY DRINK ALCOHOLO AND KAVA TONGA BY ISLAND, DISTRICT AND REGION ...... 81 TABLE G 44: TOTAL POPULATION (3 YEARS +) CURRENTLY ATTENDING SCHOOL OR OTHER EDUCATION BY TYPE OF SCHOOL, AGE AND SEX ....... 82 TABLE G 45: TOTAL POPULATION (3 YEAR +) CURRENTLY ATTENDING SCHOOL OR OTHER EDUCATION BY TYPE OF SCHOOL, AGE, AND REGION. . 83 TABLE G 46: HIGHEST LEVEL OF SCHOOLING (3 YEARS +) BY 5 YEAR AGE GROUP, DIVISION AND REGION. .................................................. 86 TABLE G 47: CURRENTLY ATTENDING SCHOOL OR OTHER EDUCATION (3 YEARS +) BY HIGHEST LEVEL AND GRADE OF SCHOOLING, BY 5 YEAR AGE
GROUP AND SEX ............................................................................................................................................................. 90 TABLE G 48: TERTIARY QUALIFICATION ACHIEVED (15 YEARS +) BY SEX, DIVISION, DISTRICT, VILLAGE AND REGION. .................................... 92 TABLE G 49: TERTIARY QUALIFICATION ACHIEVED (POPULATION 15 YEARS +) BY AGE AND SEX ................................................................ 97 TABLE G 50: TOTAL POPULATION AGED 5 AND OLDER BY LEVEL OF READING AND WRITING IN TONGAN, ENGLISH AND OTHER
LANGUAGES, AGE GROUPS AND SEX ................................................................................................................................... 99 TABLE G 51: TONGAN POPULATION AGED 5 AND OLDER BY LEVEL OF READING AND WRITING IN TONGAN, ENGLISH AND OTHER
LANGUAGES, AGE GROUPS AND SEX ................................................................................................................................. 102 TABLE G 52: TOTAL POPULATION AGED 5 AND OLDER BY LITERACY, AGE GROUPS, DIVISION AND SEX ...................................................... 105 TABLE G 53: LABOUR MARKET ACTIVITY (POPULATION 15 YEARS+) BY DIVISION AND REGION ............................................................... 109 TABLE G 54: LABOUR MARKET ACTIVITY (POPULATION 15 +) BY 5 YEAT AGE GROUP ........................................................................... 110 TABLE G 55: DETAILED TYPE OF WORK (EMPLOYED POPULATIN 15 YEARS+) BY 5-YEAR AGE GROUPS AND SEX .......................................... 111 TABLE G 56: PRINCIPAL OCCUPATION (POPULATION 15 YEARS+) BY REGION AND DIVISON ................................................................... 113 TABLE G 57: PRINCIPAL OCCUPATION (POPULATION 15 YEARS +) BY 5 YEAR AGE GROUPS .................................................................. 113 TABLE G 58: PRINCIPAL OCCUPATION (EMPLOYED POPULATION 15 YEARS +) BY 5 YEAR AGE GROUPS AND SEX ...................................... 114 TABLE G 59: PRINCIPAL OCCUPATION (EMPLOYED POPULATION 15 YEARS +) BY SEX, DIVISION, AND REGION ......................................... 116 TABLE G 60: MAIN ACTIVITY OF EMPLOYEES’ EMPLOYER (POPULATION 15 YEARS +) BY DIVISION, URBAN/RURAL AREAS AND GREATER
NUKU'ALOFA ............................................................................................................................................................... 117 TABLE G 61: MAIN ACTIVITY OF EMPLOYEES’ EMPLOYER (FOR EMPLOYED POPULATION 15 YEARS +) BY 5 YEAR AGE GROUPS .................. 118 TABLE G 62: POPULATION (15 YEARS +) WHO ARE ECONOMICALLY AND NOT ECONOMICALLY ACTIVE, INCLUDING UNEMPLOYMENT, SEX,
DIVISION, AND REGION .................................................................................................................................................. 119 TABLE G 63: POPULATION (15 YEARS +) WHO ARE ECONOMICALLY AND NOT ECONOMICALLY ACTIVE, INCLUDING UNEMPLOYMENT, SEX,
DIVISION, AND REGION .................................................................................................................................................. 130 TABLE G 64: VOTING STATUS (21YEARS+) BY DIVISION AND REGION ............................................................................................... 140 TABLE G 65: VOTING STATUS (21 YEARS +) BY 5 YEAR AGE GROUPS ................................................................................................ 140 TABLE G 66: POPULATION (10 YEARS +) ACCESSING AND LOCATION OF INTERNET BY ISLAND, DISTRICT AND REGION ............................... 141 TABLE G 67: POPULATION (10 YEARS +) HAVE A MOBILE PHONE AND USE MOBILE DATA WITH INTERNET PROVIDER AND PURPOSE OF USING
MOBILE DATA BY ISLAND, DISTRICT AND REGION ................................................................................................................ 142 TABLE G 68: NUMBER OF FEMALE EVER GIVEN BIRTH (15 YEARS +) BY 5-YEARS AGE GROUP AND DIVISION ............................................. 143 TABLE G 69: NUMBER OF CHILDREN EVER BORN WERE IN HOUSEHOLD, ELSEWHERE IN TONGA OR OVERSEAS, AND NUMBER OF CHILDREN DIED
TO FEMALE POPULATION (15 YEARS+) BY DIVISION.............................................................................................................. 144
Household Tables TABLE H 1: NUMBER OF HOUSEHOLDS BY TYPE, SEX OF HEAD BY DIVISION, DISTRICT, VILLAGE AND REGION ............................................. 146 TABLE H 2: PRIVATE HOUSEHOLDS BY SIZE, SEX AND ETHNIC ORIGIN OF HEAD, BY DIVISION AND REGION ................................................. 150 TABLE H 3: PRIVATE HOUSEHOLDS BY SIZE AND SEX AND ETHNIC ORIGIN OF HEAD, BY DIVISION ............................................................. 153 TABLE H 4: PRIVATE HOUSEHOLDS’ POPULATIONS BY HOUSEHOLD COMPOSITION (RELATIONSHIP TO HEAD OF HOUSEHOLD) ...................... 156 TABLE H 5: PRIVATE HOUSEHOLDS CONSTRUCTION MATERIAL USED FOR OUTSIDE WALL OF MAIN DWELLING, BY DIVISION, DISTRICT, VILLAGE AND
REGION. ..................................................................................................................................................................... 162 TABLE H 6: PRIVATE HOUSEHOLDS’ CONSTRUCTION MATERIAL USED FOR THE ROOF AND FLOOR OF MAIN DWELLING BY DIVISION, DISTRICT,
VILLAGE AND REGION .................................................................................................................................................... 166 TABLE H 7: PRIVATE HOUSEHOLDS SOURCE OF DRINKING WATER AND WATER APART FROM DRINKING WATER BY DIVISION, DISTRICT, VILLAGE AND
REGION ...................................................................................................................................................................... 172

Tonga 2016 Census of Population and Housing
Tonga Statistics Department
6
TABLE H 8: HOUSEHOLDS MAIN TOILET FACILITY, LOCATION AND SHARED TOILET FACILITY BY DIVISION, DISTRICT, VILLAGE AND REGION ........ 178 TABLE H 9: HOUSEHOLDS’ MAIN TOILET FACILITY, LOCATION AND SHARED TOILET FACILITY BY DIVISION, DISTRICT, VILLAGE AND REGION ....... 184 TABLE H 10: PRIVATE HOUSEHOLDS’ MAIN SOURCE OF ENERGY FOR COOKING BY DIVISION, DISTRICT, VILLAGE AND REGION ....................... 188 TABLE H 11: PRIVATE HOUSEHOLDS MAIN SOURCE OF LIGHTING BY DIVISION, DISTRICT, VILLAGE AND REGION ......................................... 194 TABLE H 12: HOUSEHOLDS’ GOODS IN THE HOUSEHOLD BY DIVISION AND REGION .............................................................................. 200 TABLE H 13: HOUSEHOLD ACCESS TO INTERNET AND HAVE BATTERY RADIO BY DIVISION, DISTRICT AND REGION ....................................... 201 TABLE H 14: MAIN MEANS OF WASTE DISPOSAL BY DIVISION, DISTRICT, VILLAGE AND REGION............................................................... 202 TABLE H 15: HOUSEHOLD TENURE BY DISTRICT AND REGION .......................................................................................................... 203 TABLE H 16: MAIN SOURCE OF HOUSEHOLD INCOME BY DIVISION, DISTRICT AND REGION .................................................................... 204 TABLE H 17: MAIN SOURCE OF HOUSEHOLD INCOME BY DIVISION, DISTRICT AND VILLAGE .................................................................... 205 TABLE H 18: MAIN SOURCE OF INCOME BY SEX AND ETHNIC ORIGIN OF HEAD OF HOUSEHOLD, BY DIVISION AND REGION ........................... 209 TABLE H 19: HOUSEHOLDS RECEIVING REMITTANCES BY ISLAND, DISTRICT AND REGION. ...................................................................... 212 TABLE H 20: FREQUENCY OF REMITTANCES RECEIVED BY SEX AND ETHNIC ORIGIN OF HEAD OF HOUSEHOLD BY DIVISION AND REGION ........... 216 TABLE H 21: PURPOSE OF GROWING CROPS BY DIVISION, DISTRICT, VILLAGE AND REGION .................................................................... 218 TABLE H 22: TYPE OF CROPS GROWN BY DIVISION, DISTRICT, VILLAGE AND REGION ............................................................................. 222 TABLE H 23: PURPOSE OF FISHING BY DIVISION, DISTRICT, VILLAGE AND REGION ................................................................................ 227 TABLE H 24: MODE OF FISHING BY DIVISION AND DISTRICT ............................................................................................................ 232 TABLE H 25: PURPOSE OF RAISING LIVESTOCK BY DIVISION, DISTRICT AND VILLAGE ............................................................................. 233 TABLE H 26: PRIVATE HOUSEHOLD WHO RAISED LIVESTOCK BY DIVISION, DISTRICT AND VILLAGE ........................................................... 238 TABLE H 27: PRIVATE HOUSEHOLDS WHO PRODUCED HANDICRAFTS BY DIVISION, DISTRICT AND VILLAGE ................................................ 243

Tonga 2016 Census of Population and Housing
Tonga Statistics Department
7
Abbreviations CAPI Computer Assisted Personal Interview EBC Electoral Boundary Commission EA Enumeration Area GIS Geographic Information System GPS Global Positioning System Grt.Nuku Greater Nuku’alofa GS Government Statistician Hhld Household
ID Identification ISIC International Standard Industrial Classification ISCO International Standard Idustrial Classification MLSNR Ministry of Land, Survey and Natural Resources NGO Non-Government Organization PC Population Census PICT Pacific Island Countries and Territories PMO Prime Minister’s Office PopGIS Population Geographic Information System SD Statistics Department SDD Statistics for Development Division SPC Secretariat of the Pacific Community TL Team Leaders TVET Technical and Vocational Education and Training

Tonga 2016 Census of Population and Housing
Tonga Statistics Department
8
Glossary
Census The total process of collecting, compiling, evaluating, analyzing and publishing or otherwise, disseminating demographic, economic and social data pertaining, at a specified time, to all persons in a country or in a well-delimited part of a country.
Disability People with disability categorise as compilation of two level of difficulties - a lot of difficulties and canot do at all specified as disability.
Island Division The five ‘main islands’ (Tongatapu, Vava’u, Ha’apai, ‘Eua and Ongo Niua) in Tonga. Each division is divided into districts and each district is divided into villages.
Economic activity The main activity each person aged 15 years and older did during the reference week.
Economically active People who were either engaged in a full or part-time job or in a business, engaged mainly in farming, fishing or handicrafts making, or mainly in housework with some gardening or farming, fishing or making handicrafts, who had a job but were on leave or temporary absent for some reason, and the unemployed.
Employed Population Those who ‘work for pay’ or ‘work to support the household by producing goods for sale’, or ‘work to support the household for own consumption.
Ethnic origin Relates to the ethnic group a person belongs to, (i.e. the ancestry with which he/she is identified).
Greater Nuku’alofa Greater Nuku’alofa includes the districts of Kolofo’ou and Kolomotu’a.
Household Consists of persons who usually eat together and share the work of preparing the food and/or the cost of work of providing it. Generally, household members live and sleep in the same building although this is not always the case. Hence, the definition is based on eating together rather than on living or sleeping in the same building or dwelling.
Household head The person with the primary authority and responsibility for household affairs. This person is usually designated by the members of the household.
Industry The main activity undertaken by the establishment or place where a person worked. Industry affiliation was classified according to the International Standard Industrial Classification (ISIC) Revision 4_2004.
Institution A place of residence apart from private household, such as hotel/motels, hospital and prison.
Internal migration the movement of people from one place to another with in Tonga estimated by comparing place of residence of place of birth, one and five years prior to the census with the place of residence during the census enumeration. Several types of population flows between and within division, district, and village or the so called inter - and intra - migration.
Literacy Measured as a respondents’ ability to read and write a simple sentence in Tongan, English or another language.
Non-resident institution
Includes non-residents or visitor occupying an institution on Census night.

Tonga 2016 Census of Population and Housing
Tonga Statistics Department
9
Not economically active
People who were neither employed nor unemployed. This includes those engaged in housework only, full time students, the retired, the disabled and other.
Paid work The work a person carries out in order to gain wages, salaries or cash.
Place of birth The village in which a person was born. Where a mother travels to another area, e.g. to a hospital, or another country to give birth, the village or country in which she usually resided at the time she gives birth is the child’s place of birth.
Place of usual residence
The geographic place where the enumerated person (a) has lived for the past six months or more, or (b) having arrived in that geographic area during the last six months and intends to stay for at least six months.
Region The term is used to represent Urban, Rural and Greater Nuku’alofa.
Remittances Money sent to households from friends or relatives living overseas or within Tonga. Resident institution
Includes Tongan residents who were occupying an institution on Census night.
Rural All villages except Kolofo’ou, Kolomotu’a and Ma’ufanga villages.
Total population Census night population, i.e. including residents and non-residents in private households, residents in institutions and non-residents in institutions.
Unpaid work Any work a person voluntarily did whether it be for the family, church or the community, or any other related organization and for which no compensation was paid.
Urban or Nuku’alofa Urban area or what is called the three villages of Nuku’alofa – Kolofo’ou, Kolomotu’a and Ma’ufanga.
Urban population Total population of the villages of Kolofo’ou, Ma’ufanga and Kolomotu’a. Urban boundaries are defined based on the size of village population i.e. villages with a population size of at least 5,000 people.
Unemployed population
Census 2016 defined and estimate unemployed population comprises persons aged 15 and
above specified for measurement of the economically active population during the
reference period were: without work, or other words, were not paid employment of self-
employment and currently available for work, in other words, were available for paid
employment.
International Conference of Labour statistician (ICLS) recommendations that looking and
seeking for work are of limited relevance, because the labour market is largely unorganized
or of limited scope, where labor absorption is, at the time, inadequate, or where the labour
force is largely self-employed, the standard definition of unemployment may be applied by
relaxing the criterion of seeking work. Such a relaxation is aimed primarily at those
developing countries including Tonga, where the criterion does not capture the extent of
unemployment in its totality. With this relaxation of the criterion of seeking work, which
permits in extreme cases the criterion’s complete suppression, the two basic criteria that
remain applicable are “without work” and “currently available for work”( 2.271 & 2.272 of
the Principles and Recommendations for Population and Housing Censuses Revision 2).

Tonga 2016 Census of Population and Housing
Tonga Statistics Department
10
Key Indicators Indicator TONGA Tongatapu Vava'u Ha'apai 'Eua
Ongo Niua
Urban Rural Grt.
Nukualofa
Population
Total population 100,651 74,611 13,738 6,125 4,945 1,232 23,221 77,430 35,184
Male 50,255 37,135 6,866 3,118 2,486 650 11,529 38,726 17,490
Female 50,396 37,476 6,872 3,007 2,459 582 11,692 38,704 17,694
Population change
2011 - 2016 (no.) -2,601 -805 -1,184 -491 -71 -50 -1,008 -1,593 -861
2011 - 2016 (%) -2.5 -1.1 -7.9 -7.4 -1.4 -3.9 -4.2 -2.0 -2.4
Average Annual Growth -0.5 -0.2 -1.7 -1.5 -0.3 -0.8 -0.9 -0.4 -0.5
Population density (number of people per square km 155 286 114 56 57 17 2,035 121 1,010
Total number of people living in households (private & Ins. Res) 100,266 74,291 13,687 6,111 4,945 1,232 23,103 77,163 34,853
Male 49,983 36,905 6,831 3,111 2,486 650 11,289 38,694 17,254
Female 50,283 37,386 6,856 3,000 2,459 582 11,587 38,696 17,599
Total number of people living (non-resident) in Institution 385 320 51 14 0 0 286 99 301
Male 272 230 35 7 0 0 210 62 220
Female 113 90 16 7 0 0 76 37 81
Total Tongan and part Tongan population 98,455 72,723 13,540 6,053 4,911 1,228 22,062 76,393 33,737
Male 49,008 36,057 6,752 3,080 2,471 648 10,870 38,138 16,663
Female 49,447 36,666 6,788 2,973 2,440 580 11,192 38,255 17,074
Household type
Total Households 18,198 13,096 2,745 1,193 889 275 4,175 14,023 6,240
Total Number of Private household 18,005 12,953 2715 1179 885 273 4080 13925 6134
Total Number of Institution occupied by Tongans & non- Tongans 193 143 30 14 4 2 95 98 106
Average household size 5.5 5.7 5 5.2 5.6 4.5 5.6 5.5 5.6
Population age structure
Less than 1 year of age 2,279 1,708 303 141 110 17 485 1,794 773
Male 1,190 915 143 65 58 9 264 926 424
Female 1,089 793 160 76 52 8 221 868 349
Children (1-14 years of age) 34,255 25,062 4,864 2,103 1,815 411 7,216 27,039 11,264
Male 17,806 12,991 2,574 1,107 918 216 3,678 14,128 5,791
Female 16,449 12,071 2,290 996 897 195 3,538 12,911 5,473
Youth (15-24 years of age) 18,736 14,268 2,393 1,032 844 199 4,427 14,309 6,746
Male 9,555 7,249 1,182 562 445 117 2,266 7,289 3,443
Female 9,181 7,019 1,211 470 399 82 2,161 7,020 3,303
Working age (15 - 59 years of age) 55,305 41,631 7,157 3,276 2,580 661 13,430 41,875 20,149
Male 27,188 20,412 3,478 1,662 1,285 351 6,649 20,539 9,928
Female 28,117 21,219 3,679 1,614 1,295 310 6,781 21,336 10,221
Older population (60 years and older) 8,771 6,169 1,414 605 440 143 1,992 6,779 2,929
Male 4,048 2,794 671 284 225 74 887 3,161 1,309
Female 4,723 3,375 743 321 215 69 1,105 3,618 1,620
Median age 22 22 21 22 20 24 23 21 23
Male 21 21 20 21 20 23 22 20 22
Female 23 23 23 24 21 26 24 23 24
Total Dependancy Ratio 82 80 92 87 92 86 73 85 75
Youth Dependency Ratio 66 65 73 69 75 65 58 69 60
Aged Dependency Ratio 16 15 20 18 17 22 15 16 15
Sex ratio (number of males per 100 females) 99 99 100 104 101 112 97 100 98
Indicator TONGA Tongat-
apu Vava'u Ha'apai 'Eua
Ongo Niua
Urban Rural Grt.
Nukualofa
Labour force-Economically Active 40,623 29,379 5,715 2,828 2,143 558 9,196 31,427 13,877
Males 22,058 15,990 3,046 1,505 1,210 307 4,929 17,129 7,506
Females 18,565 13,389 2,669 1,323 933 251 4,267 14,298 6,371
Employed population 33,973 24,104 4,908 2,554 1,877 530 7,468 26,505 11,362
Males 20,390 14,683 2,829 1,426 1,157 295 4,416 15,974 6,782
Females 13,583 9,421 2,079 1,128 720 235 3,052 10,531 4,580
Paid workers 23,323 18,119 2,515 1,410 933 346 6,573 16,750 9,639
Males 14,008 10,944 1,533 778 584 169 3,873 10,135 5,775
Females 9,315 7,175 982 632 349 177 2,700 6,615 3,864
Subsistence workers 7,470 3,878 1,850 918 717 107 418 7,052 910
Males 4,493 2,505 987 501 419 81 272 4,221 570
Females 2,977 1,373 863 417 298 26 146 2,831 340
Unpaid family worker 2,672 1,712 485 191 212 72 359 2,313 623
Males 1,535 962 266 119 146 42 188 1,347 311
Females 1,137 750 219 72 66 30 171 966 312
Volunteer worker 508 395 58 35 15 5 137 371 198
Males 354 272 43 28 8 3 99 255 132
Females 154 123 15 7 7 2 38 116 66
Unemployment No. 6,650 5,275 807 274 266 28 1,728 4,922 2,515
Males 1,668 1,307 217 79 53 12 513 1,155 724
Females 4,982 3,968 590 195 213 16 1,215 3,767 1,791
Unemployment rate (%) * 16.4 18 14.1 9.7 12.4 5 18.8 15.7 18.1
Males 7.6 8.2 7.1 5.2 4.4 3.9 10.4 6.7 9.6
Females 26.8 29.6 22.1 14.7 22.8 6.4 28.5 26.3 28.1
Tonga 2016 Census of Population and Housing
Tonga Statistics Department
11
Indicator TONGA Tongatapu Vava'u Ha'apai 'Eua Ongo Niua
Urban Rural Grt.
Nukualofa
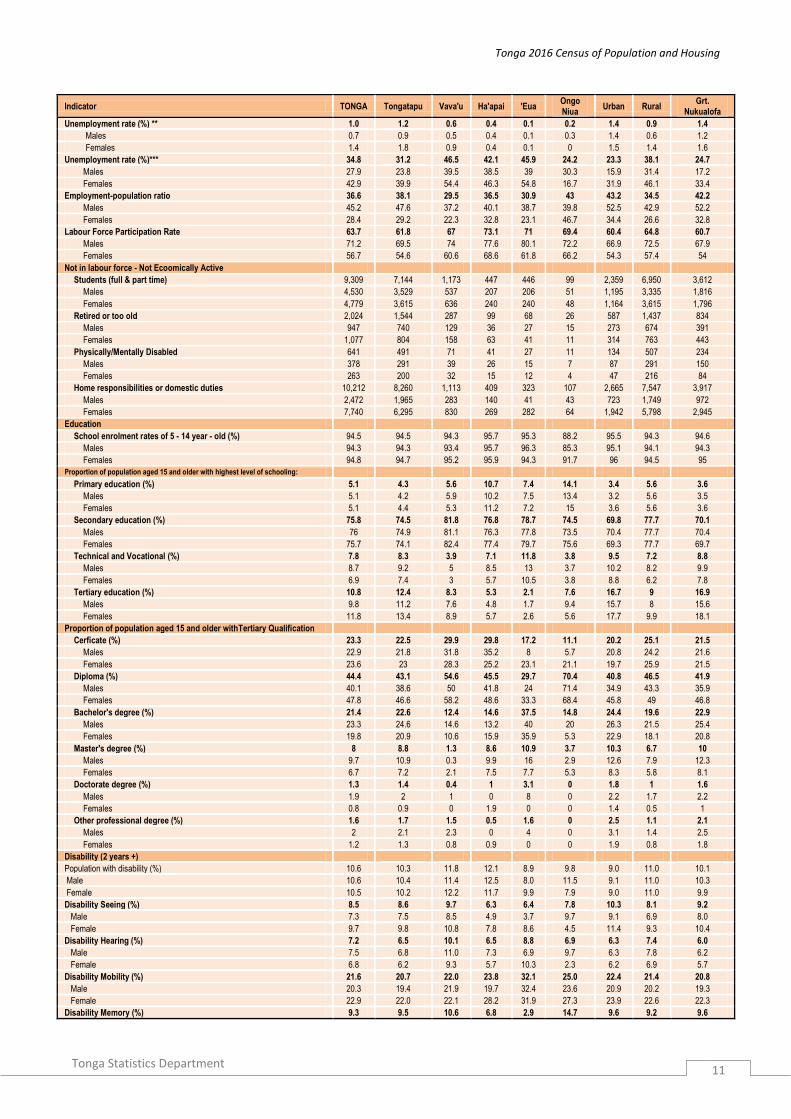
Unemployment rate (%) ** 1.0 1.2 0.6 0.4 0.1 0.2 1.4 0.9 1.4
Males 0.7 0.9 0.5 0.4 0.1 0.3 1.4 0.6 1.2
Females 1.4 1.8 0.9 0.4 0.1 0 1.5 1.4 1.6
Unemployment rate (%)*** 34.8 31.2 46.5 42.1 45.9 24.2 23.3 38.1 24.7
Males 27.9 23.8 39.5 38.5 39 30.3 15.9 31.4 17.2
Females 42.9 39.9 54.4 46.3 54.8 16.7 31.9 46.1 33.4
Employment-population ratio 36.6 38.1 29.5 36.5 30.9 43 43.2 34.5 42.2
Males 45.2 47.6 37.2 40.1 38.7 39.8 52.5 42.9 52.2
Females 28.4 29.2 22.3 32.8 23.1 46.7 34.4 26.6 32.8
Labour Force Participation Rate 63.7 61.8 67 73.1 71 69.4 60.4 64.8 60.7
Males 71.2 69.5 74 77.6 80.1 72.2 66.9 72.5 67.9
Females 56.7 54.6 60.6 68.6 61.8 66.2 54.3 57.4 54
Not in labour force - Not Ecoomically Active
Students (full & part time) 9,309 7,144 1,173 447 446 99 2,359 6,950 3,612
Males 4,530 3,529 537 207 206 51 1,195 3,335 1,816
Females 4,779 3,615 636 240 240 48 1,164 3,615 1,796
Retired or too old 2,024 1,544 287 99 68 26 587 1,437 834
Males 947 740 129 36 27 15 273 674 391
Females 1,077 804 158 63 41 11 314 763 443
Physically/Mentally Disabled 641 491 71 41 27 11 134 507 234
Males 378 291 39 26 15 7 87 291 150
Females 263 200 32 15 12 4 47 216 84
Home responsibilities or domestic duties 10,212 8,260 1,113 409 323 107 2,665 7,547 3,917
Males 2,472 1,965 283 140 41 43 723 1,749 972
Females 7,740 6,295 830 269 282 64 1,942 5,798 2,945
Education
School enrolment rates of 5 - 14 year - old (%) 94.5 94.5 94.3 95.7 95.3 88.2 95.5 94.3 94.6
Males 94.3 94.3 93.4 95.7 96.3 85.3 95.1 94.1 94.3
Females 94.8 94.7 95.2 95.9 94.3 91.7 96 94.5 95
Proportion of population aged 15 and older with highest level of schooling:
Primary education (%) 5.1 4.3 5.6 10.7 7.4 14.1 3.4 5.6 3.6
Males 5.1 4.2 5.9 10.2 7.5 13.4 3.2 5.6 3.5
Females 5.1 4.4 5.3 11.2 7.2 15 3.6 5.6 3.6
Secondary education (%) 75.8 74.5 81.8 76.8 78.7 74.5 69.8 77.7 70.1
Males 76 74.9 81.1 76.3 77.8 73.5 70.4 77.7 70.4
Females 75.7 74.1 82.4 77.4 79.7 75.6 69.3 77.7 69.7
Technical and Vocational (%) 7.8 8.3 3.9 7.1 11.8 3.8 9.5 7.2 8.8
Males 8.7 9.2 5 8.5 13 3.7 10.2 8.2 9.9
Females 6.9 7.4 3 5.7 10.5 3.8 8.8 6.2 7.8
Tertiary education (%) 10.8 12.4 8.3 5.3 2.1 7.6 16.7 9 16.9
Males 9.8 11.2 7.6 4.8 1.7 9.4 15.7 8 15.6
Females 11.8 13.4 8.9 5.7 2.6 5.6 17.7 9.9 18.1
Proportion of population aged 15 and older withTertiary Qualification
Cerficate (%) 23.3 22.5 29.9 29.8 17.2 11.1 20.2 25.1 21.5
Males 22.9 21.8 31.8 35.2 8 5.7 20.8 24.2 21.6
Females 23.6 23 28.3 25.2 23.1 21.1 19.7 25.9 21.5
Diploma (%) 44.4 43.1 54.6 45.5 29.7 70.4 40.8 46.5 41.9
Males 40.1 38.6 50 41.8 24 71.4 34.9 43.3 35.9
Females 47.8 46.6 58.2 48.6 33.3 68.4 45.8 49 46.8
Bachelor's degree (%) 21.4 22.6 12.4 14.6 37.5 14.8 24.4 19.6 22.9
Males 23.3 24.6 14.6 13.2 40 20 26.3 21.5 25.4
Females 19.8 20.9 10.6 15.9 35.9 5.3 22.9 18.1 20.8
Master's degree (%) 8 8.8 1.3 8.6 10.9 3.7 10.3 6.7 10
Males 9.7 10.9 0.3 9.9 16 2.9 12.6 7.9 12.3
Females 6.7 7.2 2.1 7.5 7.7 5.3 8.3 5.8 8.1
Doctorate degree (%) 1.3 1.4 0.4 1 3.1 0 1.8 1 1.6
Males 1.9 2 1 0 8 0 2.2 1.7 2.2
Females 0.8 0.9 0 1.9 0 0 1.4 0.5 1
Other professional degree (%) 1.6 1.7 1.5 0.5 1.6 0 2.5 1.1 2.1
Males 2 2.1 2.3 0 4 0 3.1 1.4 2.5
Females 1.2 1.3 0.8 0.9 0 0 1.9 0.8 1.8
Disability (2 years +)
Population with disability (%) 10.6 10.3 11.8 12.1 8.9 9.8 9.0 11.0 10.1
Male 10.6 10.4 11.4 12.5 8.0 11.5 9.1 11.0 10.3
Female 10.5 10.2 12.2 11.7 9.9 7.9 9.0 11.0 9.9
Disability Seeing (%) 8.5 8.6 9.7 6.3 6.4 7.8 10.3 8.1 9.2
Male 7.3 7.5 8.5 4.9 3.7 9.7 9.1 6.9 8.0
Female 9.7 9.8 10.8 7.8 8.6 4.5 11.4 9.3 10.4
Disability Hearing (%) 7.2 6.5 10.1 6.5 8.8 6.9 6.3 7.4 6.0
Male 7.5 6.8 11.0 7.3 6.9 9.7 6.3 7.8 6.2
Female 6.8 6.2 9.3 5.7 10.3 2.3 6.2 6.9 5.7
Disability Mobility (%) 21.6 20.7 22.0 23.8 32.1 25.0 22.4 21.4 20.8
Male 20.3 19.4 21.9 19.7 32.4 23.6 20.9 20.2 19.3
Female 22.9 22.0 22.1 28.2 31.9 27.3 23.9 22.6 22.3
Disability Memory (%) 9.3 9.5 10.6 6.8 2.9 14.7 9.6 9.2 9.6

Tonga 2016 Census of Population and Housing
Tonga Statistics Department
12
Indicator TONGA Tongatapu Vava'u Ha'apai 'Eua Ongo Niua
Urban Rural Grt.
Nukualofa
Male 9.6 9.9 10.9 7.3 2.1 13.9 10.1 9.5 9.9
Female 8.9 9.1 10.4 6.3 3.4 15.9 9.1 8.9 9.2
Disability_Selfcare (%) 34.2 34.7 31.2 37.4 35.2 23.3 32.3 34.7 32.7
Male 34.7 35.5 30.0 37.0 37.8 22.2 33.2 35.1 33.8
Female 33.8 33.9 32.3 37.8 33.2 25.0 31.4 34.4 31.7
Disability_Communication (%) 19.2 20.0 16.4 19.2 14.5 22.4 19.2 19.2 21.8
Male 20.5 20.9 17.6 23.8 17.0 20.8 20.3 20.5 22.8
Female 17.9 19.1 15.3 14.1 12.5 25.0 18.0 17.9 20.7
Alcohol (10 years +)
Not drinking alcohol (%)
Total 85.9 85.2 88.5 88.2 85.9 84.1 81.9 87.1 83.2
Male 76.5 75.7 80.0 78.5 76.2 74.6 71.8 77.9 73.5
Female 94.9 94.3 96.8 98.1 95.6 95.1 91.3 96.1 92.4
Drinking alcohol (%)
Total 14.1 14.8 11.5 11.8 14.1 15.9 18.1 12.9 16.8
Male 23.5 24.3 20.0 21.5 23.8 25.4 28.2 22.1 26.5
Female 5.1 5.7 3.2 1.9 4.4 4.9 8.7 3.9 7.6
Kava Tonga (10 years +)
No drinking kava tonga (%)
Total 82.2 83.6 79.4 76.4 78.3 69.9 84.7 81.4 84.2
Male 64.3 67.1 58.8 53.7 56.7 44.5 69.6 62.7 68.5
Female 99.4 99.3 99.3 99.8 99.7 99.1 98.9 99.5 99.1
Drinking kava tonga (%)
Total 17.8 16.4 20.6 23.6 21.7 30.1 15.3 18.6 15.8
Male 35.7 32.9 41.2 46.3 43.3 55.5 30.4 37.3 31.5
Female 0.6 0.7 0.7 0.2 0.3 0.9 1.1 0.5 0.9
Smoking – imported and local tobacco (10 years +)
No smoking import tobacco (%)
Total 82.9 82.3 84.9 83.8 84.9 87.0 82.3 83.1 82.1
Male 72.2 71.4 73.8 72.3 77.5 81.2 72.1 72.3 71.6
Female 93.2 92.7 95.7 95.6 92.2 93.8 92.0 93.6 92.2
Smoking Import tobacco (%)
Total 17.1 17.7 15.1 16.2 15.1 13.0 17.7 16.9 17.9
Male 27.8 28.6 26.2 27.7 22.5 18.8 27.9 27.7 28.4
Female 6.8 7.3 4.3 4.4 7.8 6.3 8.0 6.4 7.8
No smoking local tobacco (%)
Total 86.3 87.9 85.0 78.8 76.5 75.0 90.5 85.0 89.5
Male 75.1 78.0 72.2 61.6 62.3 59.2 82.6 72.9 80.8
Female 97.0 97.4 97.4 96.5 90.7 93.1 98.0 96.7 97.6
Smoking local tobacco (%)
Total 13.7 12.1 15.0 21.2 23.5 25.0 9.5 15.0 10.5
Male 24.9 22.0 27.8 38.4 37.7 40.8 17.4 27.1 19.2
Female 3.0 2.6 2.6 3.5 9.3 6.9 2.0 3.3 2.4
Household access to internet (%) 13.2 15.2 8.7 11.6 5.2 0.0 22.3 10.6 20.4
Electorial Vote ( 21 years +)
Registered to vote
Total 85.4 84.2 89.9 87.9 88.3 90.5 82.1 86.5 82.7
Male 83.9 82.6 88.6 86.3 87.1 88.4 80.5 85.0 81.2
Female 86.8 85.6 91.0 89.5 89.5 92.8 83.6 87.8 84.1
Not Registered to vote
Total 14.6 15.8 10.1 12.1 11.7 9.5 17.9 13.5 17.3
Male 16.1 17.4 11.4 13.7 12.9 11.6 19.5 15.0 18.8
Female 13.2 14.4 9.0 10.5 10.5 7.2 16.4 12.2 15.9
Mental Health Illness
Total Response 87,774 65016 12,036 5,349 4,281 1,092 20,291 67,483 30,681
Affected behaviour 2,324 1783 199 241 48 53 453 1,871 748
% of behaviouralaffected 2.6 2.7 1.7 4.5 1.1 4.9 2.2 2.8 2.4
Affected Mentally (%) 16.9 15.9 27.6 11.2 31.3 22.6 17.2 16.8 20.5
Affected by Evil Spirit (%) 3.3 3.1 4.5 2.9 10.4 1.9 2.0 3.6 5.3
Mental Retardation (%) 10.8 9.4 21.6 11.2 10.4 17.0 10.2 11.0 10.3
Affected by Drugs (%) 46.1 51.4 3.0 51.5 4.2 43.4 58.7 43.0 50.8
Affected by Being Elderly (%) 22.9 20.2 43.2 23.2 43.8 15.1 11.9 25.5 13.1
Note: * Equates fom the total unemployment (6,650 peoples) - people who did not work during the reference week but were available and willing to start work ** Equates from the total unemployment (348 peoples) - people who did not work during the reference week, but were available and willing to start work and looking for work *** Equates from the total unemployment (14,120 peoples) - if subsistence workers were also included as unemployed The dependency ratio is a measure showing the number of dependents, aged zero to 14 and over the age of 60, to the total population, aged 15 to 59. It is also refered to as the "total dependency ratio" The young dependency ratio is a measure showing the number of dependents, aged zero to 14, to the total population, and aged 15 to 59. It is also refered to as the "youth dependency ratio" The aged dependency ratio is a measure showing the number of dependents, aged 60 and over, to the total population, age15 to 59. The median age is the age that divides a population into two numerically equal groups, i.e half the population is younger than this age and half is older The sex ratio is the number of males per 100 females. Employment population ratio indicates the ratio of the labor force currently employed (work for cash), to the total population of the same age 15 and over The labor force participation rate is the percentage of the population in the labor force (employed & unemployed), by the total population of the same age 15 and over People with disability categorise as compilation of two level of difficulties - a lot of difficulties and canot do at all specified as disability.
Tonga 2016 Census of Population and Housing
Tonga Statistics Department
13
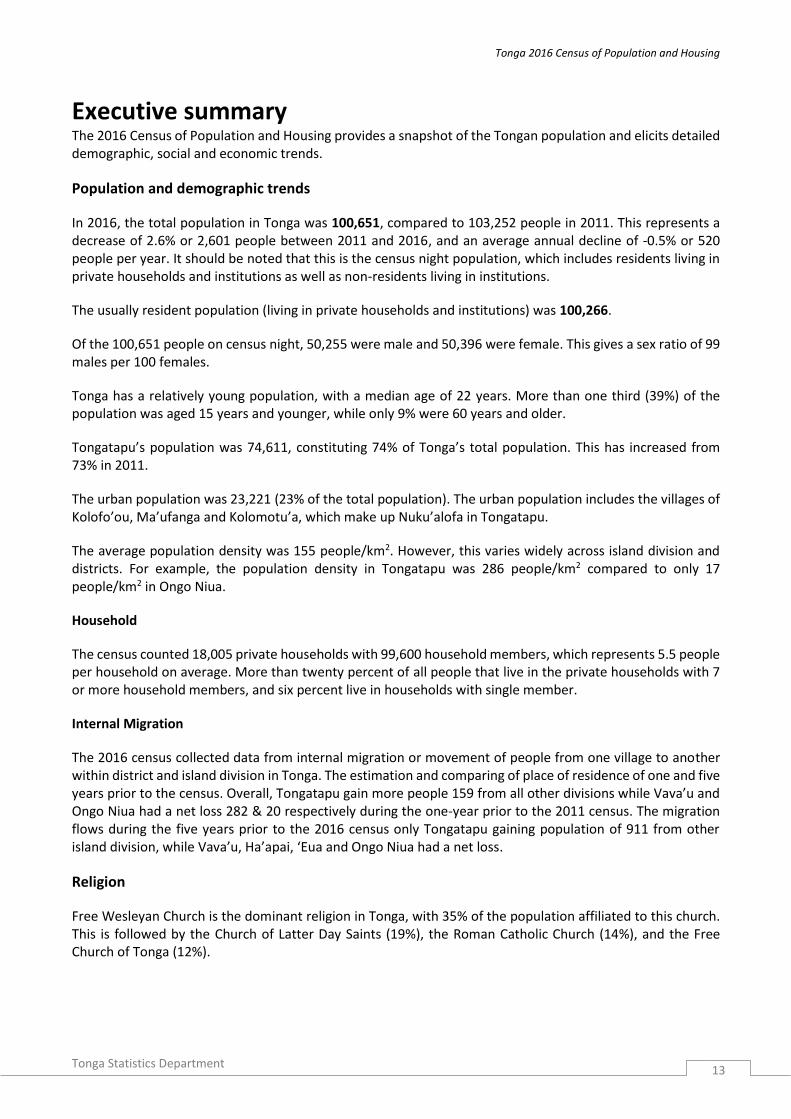
Executive summary The 2016 Census of Population and Housing provides a snapshot of the Tongan population and elicits detailed demographic, social and economic trends.
Population and demographic trends
In 2016, the total population in Tonga was 100,651, compared to 103,252 people in 2011. This represents a decrease of 2.6% or 2,601 people between 2011 and 2016, and an average annual decline of -0.5% or 520 people per year. It should be noted that this is the census night population, which includes residents living in private households and institutions as well as non-residents living in institutions.
The usually resident population (living in private households and institutions) was 100,266.
Of the 100,651 people on census night, 50,255 were male and 50,396 were female. This gives a sex ratio of 99 males per 100 females.
Tonga has a relatively young population, with a median age of 22 years. More than one third (39%) of the population was aged 15 years and younger, while only 9% were 60 years and older.
Tongatapu’s population was 74,611, constituting 74% of Tonga’s total population. This has increased from 73% in 2011.
The urban population was 23,221 (23% of the total population). The urban population includes the villages of Kolofo’ou, Ma’ufanga and Kolomotu’a, which make up Nuku’alofa in Tongatapu.
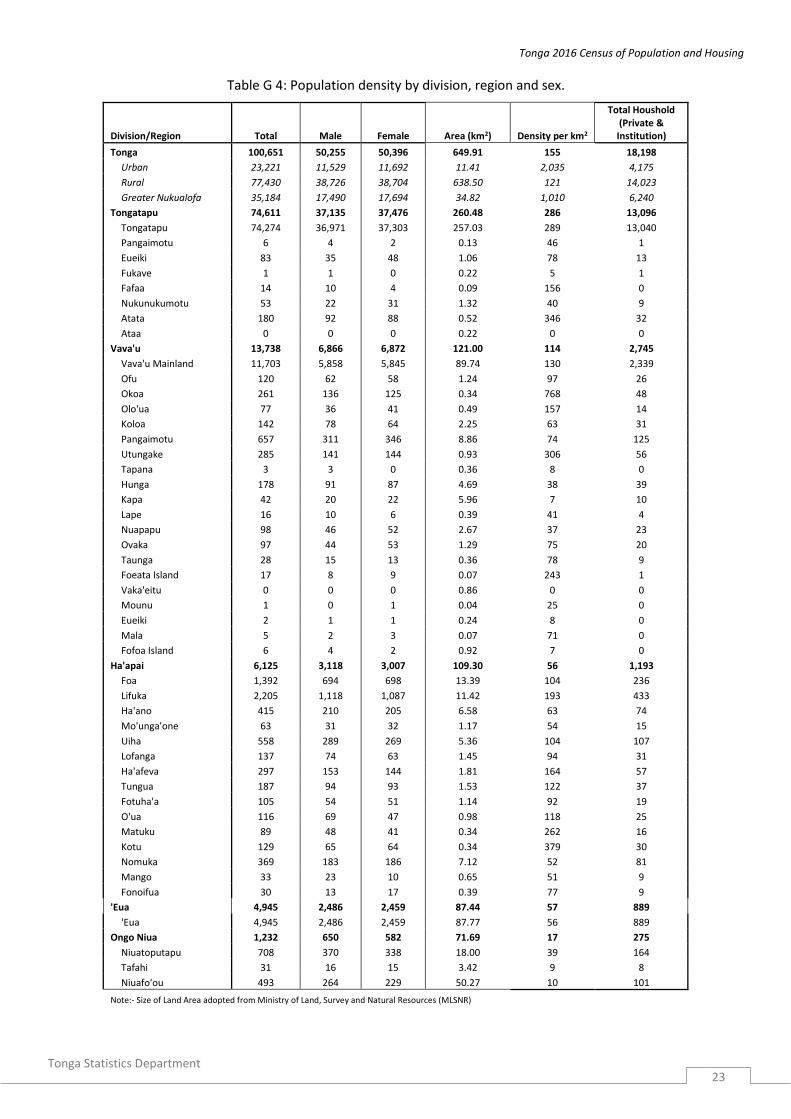
The average population density was 155 people/km2. However, this varies widely across island division and districts. For example, the population density in Tongatapu was 286 people/km2 compared to only 17 people/km2 in Ongo Niua.
Household
The census counted 18,005 private households with 99,600 household members, which represents 5.5 people per household on average. More than twenty percent of all people that live in the private households with 7 or more household members, and six percent live in households with single member.
Internal Migration
The 2016 census collected data from internal migration or movement of people from one village to another within district and island division in Tonga. The estimation and comparing of place of residence of one and five years prior to the census. Overall, Tongatapu gain more people 159 from all other divisions while Vava’u and Ongo Niua had a net loss 282 & 20 respectively during the one-year prior to the 2011 census. The migration flows during the five years prior to the 2016 census only Tongatapu gaining population of 911 from other island division, while Vava’u, Ha’apai, ‘Eua and Ongo Niua had a net loss.
Religion
Free Wesleyan Church is the dominant religion in Tonga, with 35% of the population affiliated to this church. This is followed by the Church of Latter Day Saints (19%), the Roman Catholic Church (14%), and the Free Church of Tonga (12%).

Tonga 2016 Census of Population and Housing
Tonga Statistics Department
14
Health
During the three week period prior to the census, 3,033 (or 3%) of the total usually resident population reported having a health complaint (illness or injury). Of these people, 94% sought care, while 6% (197 people) did not seek care. Of those who sought care, the majority went to a public hospital. The main reasons for not seeking care were not ill enough, too busy, could not afford treatment, too far to travel and service at provider is poor.
Disability Data on disabilities (functioning) collected from a different level of difficulties such as seeing, hearing, walking, remembering, self-care and communicating. Overall, 10 % of the total population reported a disability. This was 2 % higher than for the 2011 census. The proportion of the population with a disability increases with age. The disability that was most commonly revealed was difficulty with self-care (3,449). This was followed by difficulties with walking and climbing (2,178), difficulties with communicating (1,932), difficulties remembering (933), difficulties seeing (858) and difficulties in hearing (722).
Smoking
17% of those 10 years of age and above were reported to smoke imported tobacco (cigarette). Out of the population smoking import tobacco 9% on average smokes more than one pack per day and 21% on average smokes one pack per day. Highest proportion of imported tobacco smokers are from the age group 20-24.
14% of those 10 years of age and above were reported to smoke local tobacco (tapaka tonga). Out of the population smoking local tobacco 14% on average smokes fifthteen cigarettes per day and 24% on average smokes ten cigarettes per day.
Education
94.5% of the usually resident populations aged 5 - 14 years were enrolled in school on census night. School attendance rates decreased rapidly after the age of 15, with 29% of those aged 15-19 years not attending school on census night. In general, female school attendance rates were higher than male attendance rates across all age groups.
Of the usually resident population aged 15 years and over, 5% had only achieved primary school education. Three quarters of the population had secondary level education, and 19% had a higher level eduation (including technical/vocational and university). Higher education levels were higher in urban areas compared to rural areas.
Economic Activity Sixty three percent of Tonga population aged 15 years and older was in the labor force or economically active, 36.6% received paid income; this group comprised of 45.2% male and only 28.4% females. Employed population comprised of 53.3%, 65.8% males and 41% females. Subsistence work, such as producing goods for own and or family consumption generated 14.5% of Tongan males and only 9.1% of females. About 11% of the population aged 15 and older in rural areas where subsistence workers compared with only one percent of the population aged 15 and older in urban areas.
Tonga 2016 Census of Population and Housing
Tonga Statistics Department
15
Unemployment Only 6,650 people were categorized as being unemployed. The number of people aged 15 and older who did not work during the reference week but were available and willing to start work. This equates to an unemployment rate of 16.4%. If subsistence workers were also included as part of the unemployed – the total unemployment level would increase to 14,120 people, or an unemployment rate of 34.8% (27.9% for males and 42.9% for females, and 23.3% for the urban area and 38.1% in rural areas). If the number of people aged 15 and older who did not work during the reference week, but were available and willing to work, and looking for work, was only 348 people or 1.0 unemployment rate.
Tonga 2016 Census of Population and Housing
Tonga Statistics Department
16
Part 1: Statistical Tables
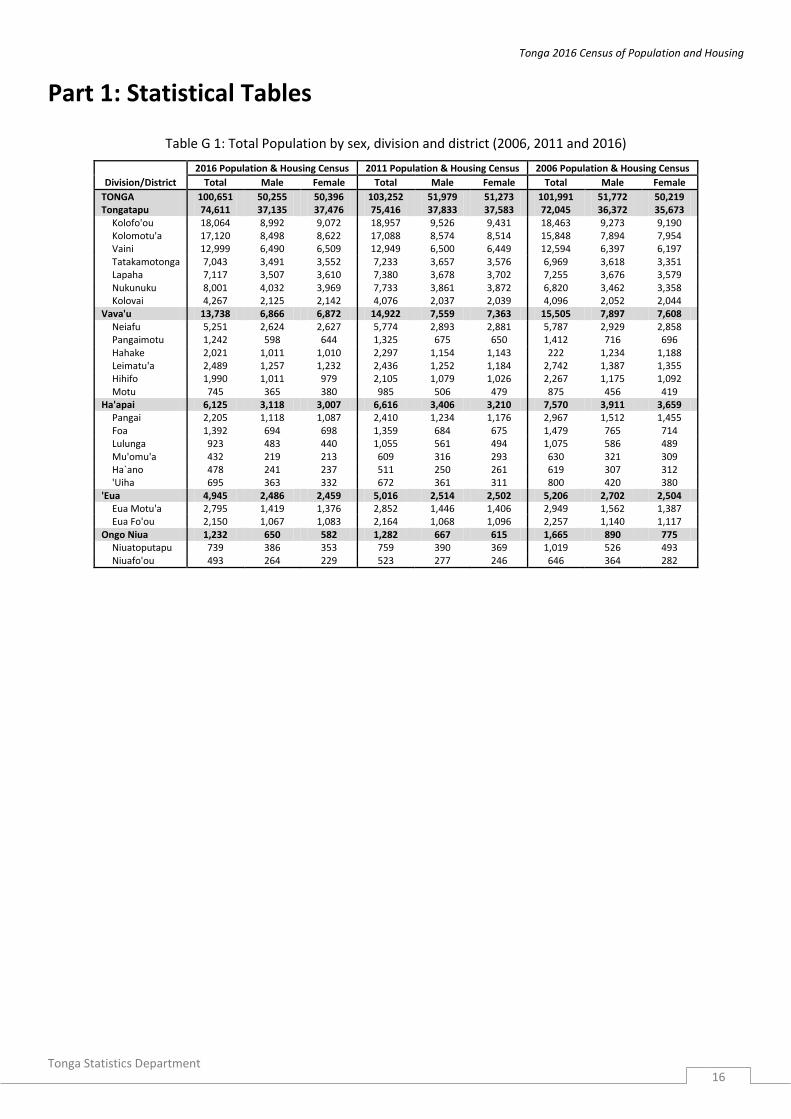
Table G 1: Total Population by sex, division and district (2006, 2011 and 2016)
Division/District
2016 Population & Housing Census 2011 Population & Housing Census 2006 Population & Housing Census
Total Male Female Total Male Female Total Male Female
TONGA 100,651 50,255 50,396 103,252 51,979 51,273 101,991 51,772 50,219 Tongatapu 74,611 37,135 37,476 75,416 37,833 37,583 72,045 36,372 35,673
Kolofo'ou 18,064 8,992 9,072 18,957 9,526 9,431 18,463 9,273 9,190 Kolomotu'a 17,120 8,498 8,622 17,088 8,574 8,514 15,848 7,894 7,954 Vaini 12,999 6,490 6,509 12,949 6,500 6,449 12,594 6,397 6,197 Tatakamotonga 7,043 3,491 3,552 7,233 3,657 3,576 6,969 3,618 3,351 Lapaha 7,117 3,507 3,610 7,380 3,678 3,702 7,255 3,676 3,579 Nukunuku 8,001 4,032 3,969 7,733 3,861 3,872 6,820 3,462 3,358 Kolovai 4,267 2,125 2,142 4,076 2,037 2,039 4,096 2,052 2,044
Vava'u 13,738 6,866 6,872 14,922 7,559 7,363 15,505 7,897 7,608 Neiafu 5,251 2,624 2,627 5,774 2,893 2,881 5,787 2,929 2,858 Pangaimotu 1,242 598 644 1,325 675 650 1,412 716 696 Hahake 2,021 1,011 1,010 2,297 1,154 1,143 222 1,234 1,188 Leimatu'a 2,489 1,257 1,232 2,436 1,252 1,184 2,742 1,387 1,355 Hihifo 1,990 1,011 979 2,105 1,079 1,026 2,267 1,175 1,092 Motu 745 365 380 985 506 479 875 456 419
Ha'apai 6,125 3,118 3,007 6,616 3,406 3,210 7,570 3,911 3,659 Pangai 2,205 1,118 1,087 2,410 1,234 1,176 2,967 1,512 1,455 Foa 1,392 694 698 1,359 684 675 1,479 765 714 Lulunga 923 483 440 1,055 561 494 1,075 586 489 Mu'omu'a 432 219 213 609 316 293 630 321 309 Ha`ano 478 241 237 511 250 261 619 307 312 'Uiha 695 363 332 672 361 311 800 420 380
'Eua 4,945 2,486 2,459 5,016 2,514 2,502 5,206 2,702 2,504 Eua Motu'a 2,795 1,419 1,376 2,852 1,446 1,406 2,949 1,562 1,387 Eua Fo'ou 2,150 1,067 1,083 2,164 1,068 1,096 2,257 1,140 1,117
Ongo Niua 1,232 650 582 1,282 667 615 1,665 890 775 Niuatoputapu 739 386 353 759 390 369 1,019 526 493 Niuafo'ou 493 264 229 523 277 246 646 364 282

Tonga 2016 Census of Population and Housing
17 Tonga Statistics Department
Table G 2: Total households (Private and Institution) and population by sex, division, district and village
Division / district / village
2016 Population & Housing Census
2011 Population & Housing Census
Total Households
Male
Female
Total Persons
Total Households
Male
Female
Total persons
TONGA 18,198 50,255 50,396 100,651 18,156 51,979 51,273 103,252 Tongatapu 13,096 37,135 37,476 74,611 12,904 37,833 37,583 75,416
Kolofo'ou 3,188 8,992 9,072 18,064 3,246 9,526 9,431 18,957 Kolofo'ou 1,524 4141 4124 8,265 1,610 4,485 4,375 8,860 Ma'ufanga 1,266 3642 3719 7,361 1,214 3,771 3,743 7,514 Nukunukumotu 8 21 29 50 6 13 15 28 Popua 313 945 935 1880 316 958 978 1,936 Tukutonga 75 229 259 488 95 273 305 578 Pangaimotu 1 4 2 6 2 9 5 14 Fafaa Island 1 10 4 14 2 13 10 23 Ata Island 0 0 0 0 1 4 0 4
Kolomotu'a 3,057 8,498 8,622 17,120 3,009 8,574 8,514 17,088 Kolomotu'a 1,394 3746 3849 7,595 1,442 3,900 3,955 7,855 Havelu 617 1712 1764 3,476 588 1,736 1,729 3,465 Tofoa 598 1741 1748 3,489 585 1,785 1,741 3,526 Hofoa 194 610 563 1,173 165 498 479 977 Puke 156 442 485 927 116 369 362 731 Sia'atoutai 98 247 213 460 113 286 248 534
Vaini 2,216 6,490 6,509 12,999 2,095 6,500 6,449 12,949 Vaini 585 1739 1622 3,361 537 1,675 1,560 3,235 Malapo 107 292 284 576 109 362 326 688 Longoteme 103 295 308 603 100 321 301 622 Folaha 162 454 498 952 144 431 465 896 Nukuhetulu 63 154 186 340 61 171 187 358 Veitongo 179 607 592 1,199 190 661 633 1,294 Ha'ateiho 451 1279 1385 2,664 414 1,246 1,315 2,561 Pea 346 1046 982 2,028 349 1,030 1,049 2,079 Tokomololo 220 624 652 1,276 191 603 613 1,216
Tatakamotonga 1,252 3,491 3,552 7,043 1,224 3,657 3,576 7,233 Tatakamotonga 324 973 930 1,903 302 896 867 1,763 Holonga 89 239 249 488 93 306 276 582 Pelehake 150 388 408 796 132 403 433 836 Fua'amotu 312 813 824 1,637 312 904 818 1,722 Nakolo 65 204 202 406 73 231 232 463 Ha'asini/Hamula 158 424 459 883 147 405 438 843 Lavengatonga 65 175 184 359 70 197 204 401 Haveluliku 26 85 90 175 28 96 78 174 Fatumu 63 190 206 396 67 219 230 449
Lapaha 1,238 3,507 3,610 7,117 1,275 3,678 3,702 7,380 Lapaha 334 966 1014 1,980 344 1,021 1,056 2,077 Talasiu 58 175 188 363 44 133 154 287 Hoi 75 215 210 425 80 231 219 450 Nukuleka 45 130 120 250 51 127 139 266 Makaunga 58 195 184 379 70 197 193 390 Talafo'ou 74 197 171 368 5 194 192 386 Manuka 46 144 128 272 47 181 157 338 Navutoka 118 328 384 712 129 379 410 789 Kolonga 216 546 599 1,145 230 580 588 1,168 Afa 71 237 237 474 70 208 193 401 Niutoua 130 341 330 671 119 385 355 740 Eueiki Island 12 32 45 77 15 41 46 87 Fukave Island 1 1 0 1 1 1 0 1
Nukunuku 1,399 4,032 3,969 8,001 1,347 3,861 3,872 7,733 Nukunuku 371 1015 995 2,010 343 902 879 1,781 Matahau 105 295 286 581 105 305 323 628 Matafonua 45 122 111 233 36 85 86 171 Fatai 60 154 160 314 61 151 161 312 Lakepa 54 158 155 313 53 178 187 365 Vaotu'u 81 245 248 493 84 229 224 453 Utulau 98 284 330 614 113 344 336 680 Ha'alalo 103 307 303 610 84 235 237 472 Ha'akame 116 395 352 747 118 384 351 735 Houma 366 1057 1029 2,086 350 1,048 1,088 2,136
Kolovai 746 2,125 2,142 4,267 708 2,037 2,039 4,076 Kolovai 118 306 312 618 121 284 323 607 Te'ekiu 104 293 277 570 100 295 257 552 Masilamea 34 128 93 221 39 122 121 243 Fahefa 72 204 211 415 62 221 194 415

Tonga 2016 Census of Population and Housing
18 Tonga Statistics Department
Division / district / village
2016 Population & Housing Census 2011 Population & Housing Census
Total Households
Male
Female
Total Persons
Total Households
Male
Female
Total persons
Ha'utu 39 113 155 268 29 84 103 187 Kala'au 26 76 76 152 20 57 65 122 Fo'ui 106 344 313 657 93 292 280 572 Ha'avakatolo 40 91 104 195 44 129 130 259 Ahau 61 183 210 393 62 199 196 395 Kanokupolu 68 157 175 332 55 149 164 313 Ha'atafu 47 140 129 269 42 107 115 222 Atataa Island 31 90 87 177 41 98 91 189
Vava'u 2,745 6,866 6,872 13,738 2,834 7,559 7,363 14,922 Neiafu 1,059 2,624 2,627 5,251 1,087 2,893 2,881 5,774
Neiafu 761 1857 1874 3,731 771 2,059 1,992 4,051 Makave 72 199 182 381 88 202 241 443 Toula 83 184 197 381 83 204 207 411 Utui 55 150 150 300 46 147 155 302 Ofu 26 62 58 120 27 86 75 161 Okoa 48 136 125 261 50 128 138 266 Olo'ua 14 36 41 77 22 67 73 140
Pangaimotu 235 598 644 1,242 244 675 650 1,325 Pangaimotu 125 311 346 657 125 342 319 661 Utulei 24 56 60 116 26 71 61 132 Nga'unoho 28 87 94 181 34 109 109 218 Utungake 57 141 144 285 57 151 160 311 Tapana 1 3 0 3 2 2 1 3
Hahake 403 1,011 1,010 2,021 418 1,154 1,143 2,297 Ha'alaufuli 84 186 186 372 82 201 211 412 Ha'akio 23 57 68 125 28 65 74 139 Houma 17 52 51 103 25 69 67 136 Mangia 17 52 50 102 19 49 55 104 Ta'anea 128 310 334 644 121 348 358 706 Tu'anekivale 82 214 189 403 86 257 230 487 Koloa 31 78 64 142 37 103 94 197 Holeva 21 62 68 130 20 62 54 116
Leimatu'a 482 1,257 1,232 2,489 466 1,252 1,184 2,436 Leimatu'a 235 594 621 1215 218 555 550 1,105 Holonga 83 223 164 387 81 267 186 453 Feletoa 58 179 184 363 65 179 209 388 Mataika 106 261 263 524 102 251 239 490
Hihifo 386 1,011 979 1,990 405 1,079 1,026 2,105 Longomapu 110 286 262 548 121 312 301 613 Taoa 98 256 281 537 89 236 260 496 Tefisi 102 282 250 532 113 308 280 588 Vaimalo 23 54 58 112 20 49 46 95 Tu'anuku 53 133 128 261 62 174 139 313
Motu 180 365 380 745 214 506 479 985 Kapa 10 20 22 42 14 34 35 69 Falevai 20 34 45 79 23 55 58 113 Otea 24 50 47 97 29 64 61 125 Lape 5 13 11 24 6 13 11 24 Matamaka 23 40 39 79 29 75 72 147 Nuapapu 23 46 52 98 24 66 69 135 Ovaka 20 44 53 97 21 42 43 85 Taunga 9 15 13 28 9 20 19 39 Hunga 39 91 87 178 52 125 104 229 Foeata 1 3 0 3 1 4 2 6 Vaka'eitu 2 2 4 6 0 0 0 0 Mounu 1 0 1 1 2 1 2 3 Eueiki 1 1 1 2 1 1 1 2 Mala 1 2 3 5 1 1 0 1 Fofoa 1 4 2 6 2 5 2 7
Ha'apai 1,193 3,118 3,007 6,125 1,266 3,406 3,210 6,616 Pangai 444 1,118 1,087 2,205 469 1,234 1,176 2,410
Pangai 223 574 512 1,086 239 642 569 1,211 Hihifo 161 396 391 787 166 434 410 844 Holopeka 22 58 68 126 27 65 76 141 Koulo 38 90 116 206 37 93 121 214
Foa 238 694 698 1,392 231 684 675 1,359 Fangale'ounga 24 70 70 140 30 89 85 174 Fotua 42 132 127 259 36 113 113 226 Lotofoa 70 209 204 413 67 213 197 410 Faleloa 66 187 193 380 61 163 179 342

Tonga 2016 Census of Population and Housing
19 Tonga Statistics Department
Division / district / village
2016 Population & Housing Census 2011 Population & Housing Census
Total Households
Male
Female
Total Persons Total Households
Male
Female
Total persons
Ha'afakahenga 17 41 49 90 18 52 50 102 Ha'ateiho Si'i 19 55 55 110 19 54 51 105
Lulunga 184 483 440 923 204 561 494 1,055 Ha'afeva 57 153 144 297 47 141 120 261 Tungua 37 94 93 187 43 121 111 232 Fotuha'a 19 54 51 105 27 69 62 131 'O'ua 25 69 47 116 28 83 61 144 Matuku 16 48 41 89 23 56 53 109 Kotu 30 65 64 129 36 91 87 178
Mu'omu'a 99 219 213 432 111 316 293 609 Nomuka 81 183 186 369 86 242 235 477 Mango 8 21 10 31 10 31 19 50 Fonoifua 10 15 17 32 15 43 39 82
Ha`ano 89 241 237 478 106 250 261 511 Fakakai 25 76 74 150 33 93 83 176 Pukotala 18 41 48 89 17 42 49 91 Ha'ano 24 71 52 123 27 61 54 115 Muitoa 7 22 31 53 9 17 20 37 Mo'unga'one 15 31 32 63 20 37 55 92
'Uiha 139 363 332 695 145 361 311 672 Uiha 76 208 170 378 78 228 187 415 Felemea 31 81 99 180 35 74 63 137 Lofanga 32 74 63 137 33 59 61 120
‘Eua 889 2,486 2,459 4,945 870 2,514 2,502 5,016 ‘Eua Motu'a 510 1,419 1,376 2,795 511 1,446 1,406 2,852
Ohonua 222 632 616 1248 266 768 760 1,528 Tufuvai 41 110 121 231 37 114 117 231 Pangai 59 176 150 326 59 177 156 333 Houma 55 130 148 278 58 141 129 270 Ha'atu'a/Kolomaile 97 265 257 522 91 246 244 490 Ta'anga 36 106 84 190 - - - -
'Eua fo'ou 379 1067 1083 2150 359 1,068 1,096 2,164 Angaha 65 185 202 387 72 199 202 401 Futu 51 122 142 264 43 126 136 262 Esia 37 103 122 225 32 99 113 212 Sapa'ata 24 90 81 171 23 75 75 150 Fata'ulua 36 121 106 227 34 122 103 225 Mu'a 28 76 79 155 29 89 85 174 Tongamama'o 29 81 98 179 26 76 82 158 Petani 58 149 128 277 52 148 165 313 Mata'aho 51 140 125 265 48 134 135 269
Ongo Niua 275 650 582 1,232 282 667 615 1,282 Niuatoputapu 174 386 353 739 168 390 369 759
Hihifo 72 165 137 302 67 154 130 284 Vaipoa 38 89 94 183 42 101 100 201 Falehau 56 116 107 223 46 112 119 231 Tafahi 8 16 15 31 113 23 20 43
Niuafo'ou 101 264 229 493 114 277 246 523 Esia 26 70 57 127 29 73 64 137 Kolofo'ou 11 21 22 43 13 36 23 59 Sapaata 26 81 64 145 24 55 51 106 Fata'ulua 13 35 29 64 12 27 29 56 Mata'aho 3 9 7 16 5 10 13 23 Mu'a 6 4 11 15 7 10 15 25 Tongamama'o 2 10 5 15 9 31 18 49 Petani 14 34 34 68 15 35 33 68
Note: In 2011 Census, Ta’anga village was included in ‘Ohonua

Tonga 2016 Census of Population and Housing
Tonga Statistics Department
20
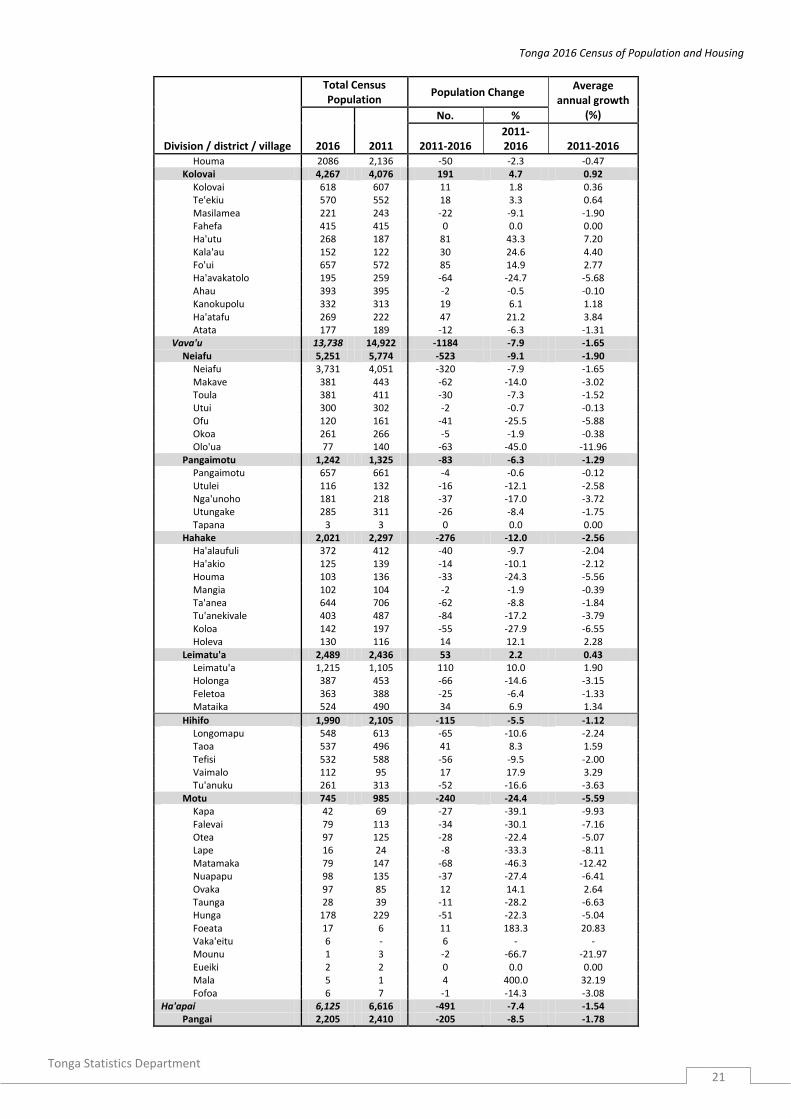
Table G 3: Population growth by region, division, district and village (2011-2016)
Division / district / village
Total Census Population
Population Change Average
annual growth (%)
2016 2011
No. %
2011-2016 2011-2016 2011-2016
TONGA 100,651 103,252 -2601 -2.5 -0.51 Urban 23,221 24,229 -1008 -4.2 -0.85 Rural 77,430 79,023 -1593 -2.0 -0.41 Greater Nukualofa 35,184 36,045 -861 -2.4 -0.48 Tongatapu 74,611 75,416 -805 -1.1 -0.21
Kolofo'ou 18,064 18,957 -893 -4.7 -0.97 Kolofo'ou 8,265 8,860 -595 -6.7 -1.39 Ma'ufanga 7,361 7,514 -153 -2.0 -0.41 Nukunukumotu 50 28 22 78.6 11.60 Popua 1,880 1,936 -56 -2.9 -0.59 Tukutonga 488 578 -90 -15.6 -3.39 Pangaimotu 6 14 -8 -57.1 -16.95 Fafaa 14 23 -9 -39.1 -9.93 Ata Island 0 4 -4 -100.0 -
Kolomotu'a 17,120 17,088 32 0.2 0.04 Kolomotu'a 7,595 7,855 -260 -3.3 -0.67 Havelu 3,476 3,465 11 0.3 0.06 Tofoa 3,489 3,526 -37 -1.0 -0.21 Hofoa 1,173 977 196 20.1 3.66 Puke 927 731 196 26.8 4.75 Sia'atoutai 460 534 -74 -13.9 -2.98
Vaini 12,999 12,949 50 0.4 0.08 Vaini 3,361 3,235 126 3.9 0.76 Malapo 576 688 -112 -16.3 -3.55 Longoteme 603 622 -19 -3.1 -0.62 Folaha 952 896 56 6.3 1.21 Nukuhetulu 340 358 -18 -5.0 -1.03 Veitongo 1,199 1,294 -95 -7.3 -1.53 Ha'ateiho 2,664 2,561 103 4.0 0.79 Pea 2,028 2,079 -51 -2.5 -0.50 Tokomololo 1,276 1,216 60 4.9 0.96
Tatakamotonga 7,043 7,233 -190 -2.6 -0.53 Tatakamotonga 1903 1,763 140 7.9 1.53 Holonga 488 582 -94 -16.2 -3.52 Pelehake 796 836 -40 -4.8 -0.98 Fua'amotu 1637 1,722 -85 -4.9 -1.01 Nakolo 406 463 -57 -12.3 -2.63 Ha'asini 883 843 40 4.7 0.93 Lavengatonga 359 401 -42 -10.5 -2.21 Haveluliku 175 174 1 0.6 0.11 Fatumu 396 449 -53 -11.8 -2.51
Lapaha 7,117 7,380 -263 -3.6 -0.73 Lapaha 1980 2,077 -97 -4.7 -0.96 Talasiu 363 287 76 26.5 4.70 Hoi 425 450 -25 -5.6 -1.14 Nukuleka 250 266 -16 -6.0 -1.24 Makaunga 379 390 -11 -2.8 -0.57 Talafo'ou 368 386 -18 -4.7 -0.96 Manuka 272 338 -66 -19.5 -4.34 Navutoka 712 789 -77 -9.8 -2.05 Kolonga 1145 1,168 -23 -2.0 -0.40 Afa 474 401 73 18.2 3.34 Niutoua 671 740 -69 -9.3 -1.96 Eueiki 77 87 -10 -11.5 -2.44 Fukave 1 1 0 0.0 0.00
Nukunuku 8,001 7,733 268 3.5 0.68 NUkunuku 2010 1,781 229 12.9 2.42 Matahau 581 628 -47 -7.5 -1.56 Matafonua 233 171 62 36.3 6.19 Fatai 314 312 2 0.6 0.13 Lakepa 313 365 -52 -14.2 -3.07 Vaotu'u 493 453 40 8.8 1.69 Utulau 614 680 -66 -9.7 -2.04 Ha'alalo 610 472 138 29.2 5.13 Ha'akame 747 735 12 1.6 0.32
Tonga 2016 Census of Population and Housing
Tonga Statistics Department
21
Division / district / village
Total Census Population
Population Change Average
annual growth (%)
2016 2011
No. %
2011-2016 2011-2016 2011-2016
Houma 2086 2,136 -50 -2.3 -0.47 Kolovai 4,267 4,076 191 4.7 0.92
Kolovai 618 607 11 1.8 0.36 Te'ekiu 570 552 18 3.3 0.64 Masilamea 221 243 -22 -9.1 -1.90 Fahefa 415 415 0 0.0 0.00 Ha'utu 268 187 81 43.3 7.20 Kala'au 152 122 30 24.6 4.40 Fo'ui 657 572 85 14.9 2.77 Ha'avakatolo 195 259 -64 -24.7 -5.68 Ahau 393 395 -2 -0.5 -0.10 Kanokupolu 332 313 19 6.1 1.18 Ha'atafu 269 222 47 21.2 3.84 Atata 177 189 -12 -6.3 -1.31
Vava'u 13,738 14,922 -1184 -7.9 -1.65 Neiafu 5,251 5,774 -523 -9.1 -1.90
Neiafu 3,731 4,051 -320 -7.9 -1.65 Makave 381 443 -62 -14.0 -3.02 Toula 381 411 -30 -7.3 -1.52 Utui 300 302 -2 -0.7 -0.13 Ofu 120 161 -41 -25.5 -5.88 Okoa 261 266 -5 -1.9 -0.38 Olo'ua 77 140 -63 -45.0 -11.96
Pangaimotu 1,242 1,325 -83 -6.3 -1.29 Pangaimotu 657 661 -4 -0.6 -0.12 Utulei 116 132 -16 -12.1 -2.58 Nga'unoho 181 218 -37 -17.0 -3.72 Utungake 285 311 -26 -8.4 -1.75 Tapana 3 3 0 0.0 0.00
Hahake 2,021 2,297 -276 -12.0 -2.56 Ha'alaufuli 372 412 -40 -9.7 -2.04 Ha'akio 125 139 -14 -10.1 -2.12 Houma 103 136 -33 -24.3 -5.56 Mangia 102 104 -2 -1.9 -0.39 Ta'anea 644 706 -62 -8.8 -1.84 Tu'anekivale 403 487 -84 -17.2 -3.79 Koloa 142 197 -55 -27.9 -6.55 Holeva 130 116 14 12.1 2.28
Leimatu'a 2,489 2,436 53 2.2 0.43 Leimatu'a 1,215 1,105 110 10.0 1.90 Holonga 387 453 -66 -14.6 -3.15 Feletoa 363 388 -25 -6.4 -1.33 Mataika 524 490 34 6.9 1.34
Hihifo 1,990 2,105 -115 -5.5 -1.12 Longomapu 548 613 -65 -10.6 -2.24 Taoa 537 496 41 8.3 1.59 Tefisi 532 588 -56 -9.5 -2.00 Vaimalo 112 95 17 17.9 3.29 Tu'anuku 261 313 -52 -16.6 -3.63
Motu 745 985 -240 -24.4 -5.59 Kapa 42 69 -27 -39.1 -9.93 Falevai 79 113 -34 -30.1 -7.16 Otea 97 125 -28 -22.4 -5.07 Lape 16 24 -8 -33.3 -8.11 Matamaka 79 147 -68 -46.3 -12.42 Nuapapu 98 135 -37 -27.4 -6.41 Ovaka 97 85 12 14.1 2.64 Taunga 28 39 -11 -28.2 -6.63 Hunga 178 229 -51 -22.3 -5.04 Foeata 17 6 11 183.3 20.83 Vaka'eitu 6 - 6 - - Mounu 1 3 -2 -66.7 -21.97 Eueiki 2 2 0 0.0 0.00 Mala 5 1 4 400.0 32.19 Fofoa 6 7 -1 -14.3 -3.08
Ha'apai 6,125 6,616 -491 -7.4 -1.54 Pangai 2,205 2,410 -205 -8.5 -1.78

Tonga 2016 Census of Population and Housing
Tonga Statistics Department
22
Division / district / village
Total Census Population
Population Change Average
annual growth (%)
2016 2011
No. %
2011-2016 2011-2016 2011-2016
Pangai 1,086 1,211 -125 -10.3 -2.18 Hihifo 787 844 -57 -6.8 -1.40 Holopeka 126 141 -15 -10.6 -2.25 Koulo 206 214 -8 -3.7 -0.76
Foa 1,392 1,359 33 2.4 0.48 Fangale'ounga 140 174 -34 -19.5 -4.35 Fotua 259 226 33 14.6 2.73 Lotofoa 413 410 3 0.7 0.15 faleloa 380 342 38 11.1 2.11 Ha'afakahenga 90 102 -12 -11.8 -2.50 Ha'ateiho 110 105 5 4.8 0.93
Lulunga 923 1,055 -132 -12.5 -2.67 Ha'afeva 297 261 36 13.8 2.58 Tungua 187 232 -45 -19.4 -4.31 Fotuha'a 105 131 -26 -19.8 -4.42 'O'ua 116 144 -28 -19.4 -4.32 Matuku 89 109 -20 -18.3 -4.05 Kotu 129 178 -49 -27.5 -6.44
Mu'omu'a 432 609 -177 -29.1 -6.87 Nomuka 369 477 -108 -22.6 -5.13 Mango 31 50 -19 -38.0 -9.56 Fonoifua 32 82 -50 -61.0 -18.82
Ha`ano 478 511 -33 -6.5 -1.34 Fakakai 150 176 -26 -14.8 -3.20 Pukotala 89 91 -2 -2.2 -0.44 Ha'ano 123 115 8 7.0 1.35 Muitoa 53 37 16 43.2 7.19 Mo'unga'one 63 92 -29 -31.5 -7.57
'Uiha 695 672 23 3.4 0.67 Uiha 378 415 -37 -8.9 -1.87 Felemea 180 137 43 31.4 5.46 Lofanga 137 120 17 14.2 2.65
Eua 4,945 5,016 -71 -1.4 -0.29 Eua Motu'a 2,795 2,852 -57 -2.0 -0.40
Ohonua 1,248 1,528 -280 -18.3 -4.05 Tufuvai 231 231 0 0.0 0.00 Pangai 326 333 -7 -2.1 -0.42 Houma 278 270 8 3.0 0.58 Ha'atu'a / Kolomaile 522 490 32 6.5 1.27 Ta'anga 190 - - - -
Eua Fo'ou 2,150 2,164 -14 -0.6 -0.13 Angaha 387 401 -14 -3.5 -0.71 Futu 264 262 2 0.8 0.15 Esia 225 212 13 6.1 1.19 Sapa'ata 171 150 21 14.0 2.62 Fata'ulua 227 225 2 0.9 0.18 Mu'a 155 174 -19 -10.9 -2.31 Tongamama'o 179 158 21 13.3 2.50 Petani 277 313 -36 -11.5 -2.44 Mata'aho 265 269 -4 -1.5 -0.30
Ongo Niua 1,232 1,282 -50 -3.9 -0.80 Niuatoputapu 739 759 -20 -2.6 -0.53
Hihifo 302 284 18 6.3 1.23 Vaipoa 183 201 -18 -9.0 -1.88 Falehau 223 231 -8 -3.5 -0.70 Tafahi 31 43 -12 -27.9 -6.54
Niuafo'ou 493 523 -30 -5.7 -1.18 Esia 127 137 -10 -7.3 -1.52 Kolofo'ou 43 59 -16 -27.1 -6.33 Sapaata 145 106 39 36.8 6.27 Fata'ulua 64 56 8 14.3 2.67 Mata'aho 16 23 -7 -30.4 -7.26 Mu'a 15 25 -10 -40.0 -10.22 Tongamama'o 15 49 -34 -69.4 -23.68 Petani 68 68 0 0.0 0.00
Note: In 2011 Census Ta’anga village was included in ‘Ohonua
Tonga 2016 Census of Population and Housing
Tonga Statistics Department
23
Table G 4: Population density by division, region and sex.
Division/Region Total Male Female Area (km2) Density per km2
Total Houshold (Private & Institution)
Tonga 100,651 50,255 50,396 649.91 155 18,198
Urban 23,221 11,529 11,692 11.41 2,035 4,175
Rural 77,430 38,726 38,704 638.50 121 14,023
Greater Nukualofa 35,184 17,490 17,694 34.82 1,010 6,240
Tongatapu 74,611 37,135 37,476 260.48 286 13,096
Tongatapu 74,274 36,971 37,303 257.03 289 13,040
Pangaimotu 6 4 2 0.13 46 1
Eueiki 83 35 48 1.06 78 13
Fukave 1 1 0 0.22 5 1
Fafaa 14 10 4 0.09 156 0
Nukunukumotu 53 22 31 1.32 40 9
Atata 180 92 88 0.52 346 32
Ataa 0 0 0 0.22 0 0
Vava'u 13,738 6,866 6,872 121.00 114 2,745
Vava'u Mainland 11,703 5,858 5,845 89.74 130 2,339
Ofu 120 62 58 1.24 97 26
Okoa 261 136 125 0.34 768 48
Olo'ua 77 36 41 0.49 157 14
Koloa 142 78 64 2.25 63 31
Pangaimotu 657 311 346 8.86 74 125
Utungake 285 141 144 0.93 306 56
Tapana 3 3 0 0.36 8 0
Hunga 178 91 87 4.69 38 39
Kapa 42 20 22 5.96 7 10
Lape 16 10 6 0.39 41 4
Nuapapu 98 46 52 2.67 37 23
Ovaka 97 44 53 1.29 75 20
Taunga 28 15 13 0.36 78 9
Foeata Island 17 8 9 0.07 243 1
Vaka'eitu 0 0 0 0.86 0 0
Mounu 1 0 1 0.04 25 0
Eueiki 2 1 1 0.24 8 0
Mala 5 2 3 0.07 71 0
Fofoa Island 6 4 2 0.92 7 0
Ha'apai 6,125 3,118 3,007 109.30 56 1,193
Foa 1,392 694 698 13.39 104 236
Lifuka 2,205 1,118 1,087 11.42 193 433
Ha'ano 415 210 205 6.58 63 74
Mo'unga'one 63 31 32 1.17 54 15
Uiha 558 289 269 5.36 104 107
Lofanga 137 74 63 1.45 94 31
Ha'afeva 297 153 144 1.81 164 57
Tungua 187 94 93 1.53 122 37
Fotuha'a 105 54 51 1.14 92 19
O'ua 116 69 47 0.98 118 25
Matuku 89 48 41 0.34 262 16
Kotu 129 65 64 0.34 379 30
Nomuka 369 183 186 7.12 52 81
Mango 33 23 10 0.65 51 9
Fonoifua 30 13 17 0.39 77 9
'Eua 4,945 2,486 2,459 87.44 57 889
'Eua 4,945 2,486 2,459 87.77 56 889
Ongo Niua 1,232 650 582 71.69 17 275
Niuatoputapu 708 370 338 18.00 39 164
Tafahi 31 16 15 3.42 9 8
Niuafo'ou 493 264 229 50.27 10 101
Note:- Size of Land Area adopted from Ministry of Land, Survey and Natural Resources (MLSNR)

Tonga 2016 Census of Population and Housing
Tonga Statistics Department
24
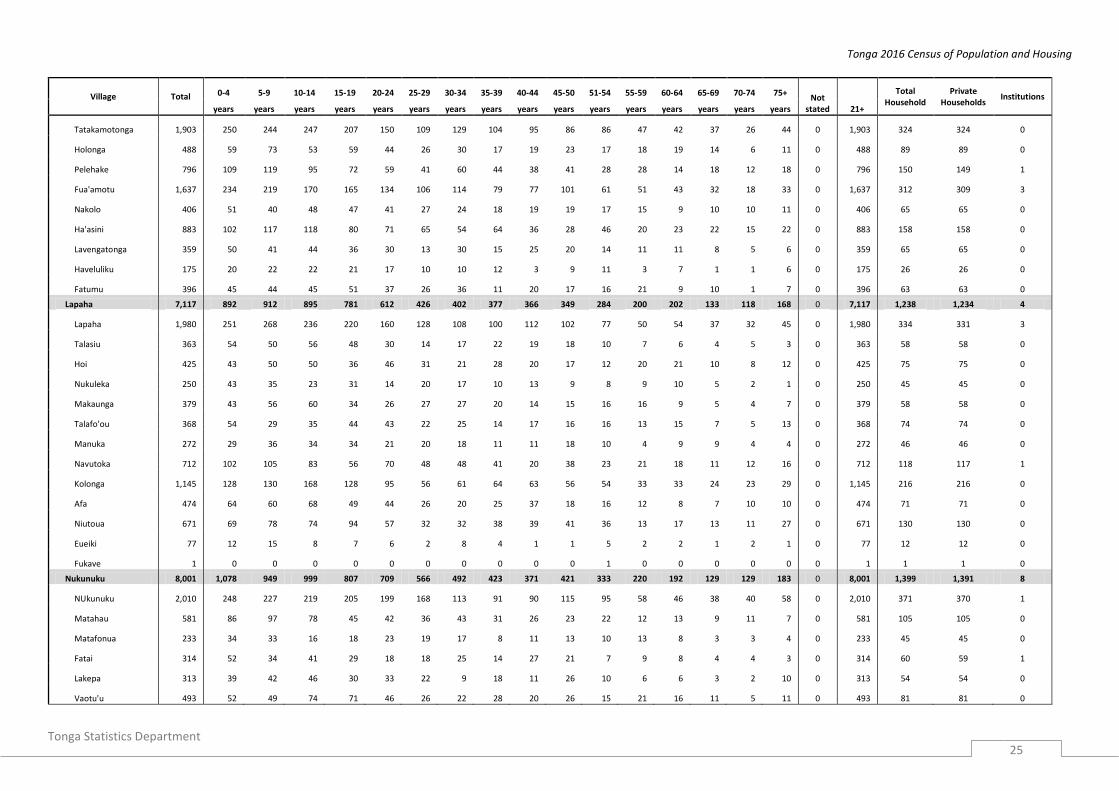
Table G 5: Total households and population by age groups, region, division, district and village
Village Total 0-4 5-9 10-14 15-19 20-24 25-29 30-34 35-39 40-44 45-50 51-54 55-59 60-64 65-69 70-74 75+ Not
stated 21+
Total Household
Private Households
Institutions
years years years years years years years years years years years years years years years years
TONGA 100,651 12,499 12,153 11,882 10,502 8,234 6,629 6,521 5,645 5,189 5,181 4,150 3,254 2,696 2,030 1,601 2,444 41 51,839 18,198 18,005 193
Urban 23,221 2,648 2,557 2,518 2,374 2,070 1,762 1,641 1,368 1,209 1,220 1,012 803 628 474 345 551 41 12651 4,184 4,089 95
Rural 77,430 9,851 9,596 9,364 8,128 6,164 4,867 4,880 4,277 3,980 3,961 3,138 2,451 2,068 1,556 1,256 1,893 0 39188 14,014 13,916 98
Greater Nuku'alofa 35,184 4,206 3,963 3,881 3,605 3,143 2,606 2,481 2,086 1,817 1,783 1,468 1,171 925 686 519 803 41 25,426 6,245 6,139 106
Tongatapu 74,611 9,281 8,868 8,621 7,774 6,494 5,154 5,015 4,258 3,797 3,776 3,017 2,346 1,931 1,404 1,133 1,701 41 38,653 13,096 12,953 143
Kolofo'ou 18,064 2,156 2,013 1,980 1,828 1,659 1,363 1,247 1,037 930 953 782 604 475 337 270 424 6 18,064 3,188 3,108 80
Kolofo'ou 8,265 869 880 906 808 749 601 598 505 402 462 389 303 239 176 141 233 4 8,265 1,524 1,475 49
Ma'ufanga 7,361 936 847 804 766 671 578 477 405 416 375 307 225 171 129 97 155 2 7,361 1,266 1,237 29
Nukumotu 50 16 11 2 4 2 5 0 3 3 0 1 0 3 0 0 0 0 50 8 8 0
Popua 1,880 255 212 204 193 182 146 141 101 84 96 67 63 51 27 28 30 0 1,880 313 312 1
Tukutonga 488 80 63 64 57 52 32 28 20 21 19 17 12 11 4 2 6 0 488 75 75 0
Pangaimotu 6 0 0 0 0 1 1 0 0 0 1 0 0 0 1 2 0 0 6 1 1 0
Fafaa 14 0 0 0 0 2 0 3 3 4 0 1 1 0 0 0 0 0 14 1 0 1
Kolomotu'a 17,120 2,050 1,950 1,901 1,777 1,484 1,243 1,234 1,049 887 830 686 567 450 349 249 379 35 17,120 3,057 3,031 26
Kolomotu'a 7,595 843 830 808 800 650 583 566 458 391 383 316 275 218 169 107 163 35 7,595 1,394 1,377 17
Havelu 3,476 434 437 377 371 287 240 273 207 183 157 121 97 76 69 52 95 0 3,476 617 617 0
Tofoa 3,489 451 385 373 341 326 262 238 219 174 164 144 123 88 68 56 77 0 3,489 598 590 8
Hofoa 1,173 144 128 168 126 108 71 68 74 59 61 45 27 31 18 18 27 0 1,173 194 193 1
Puke 927 111 111 120 100 81 56 62 59 47 39 37 29 30 19 12 14 0 927 156 156 0
Sia'atoutai 460 67 59 55 39 32 31 27 32 33 26 23 16 7 6 4 3 0 460 98 98 0
Vaini 12,999 1,652 1,607 1,504 1,430 1,086 862 903 756 676 646 478 404 315 216 182 282 0 12,999 2,216 2,201 15
Vaini 3,361 445 380 351 376 295 232 244 184 186 162 138 120 92 44 41 71 0 3,361 585 576 9
Malapo 576 92 67 60 54 33 47 33 42 27 27 22 17 16 17 7 15 0 576 107 106 1
Longoteme 603 75 80 81 59 56 30 49 30 36 29 20 12 12 6 13 15 0 603 103 101 2
Folaha 952 119 131 121 100 87 48 57 53 48 55 26 25 19 16 18 29 0 952 162 162 0
Nukuhetulu 340 52 38 39 36 28 13 17 25 21 16 15 11 4 11 2 12 0 340 63 63 0
Veitongo 1,199 153 167 144 141 71 66 78 78 64 55 40 46 29 23 20 24 0 1,199 179 179 0
Ha'ateiho 2,664 296 319 331 288 228 190 199 150 126 135 103 76 64 54 44 61 0 2,664 451 449 2
Pea 2,028 260 246 226 233 187 146 139 108 109 101 72 68 47 28 22 36 0 2,028 346 345 1
Tokomololo 1,276 160 179 151 143 101 90 87 86 59 66 42 29 32 17 15 19 0 1,276 220 220 0
Tatakamotonga 7,043 920 919 842 738 583 423 487 364 332 344 296 214 177 152 94 158 0 7,043 1,252 1,248 4
Tonga 2016 Census of Population and Housing
Tonga Statistics Department
25
Village Total 0-4 5-9 10-14 15-19 20-24 25-29 30-34 35-39 40-44 45-50 51-54 55-59 60-64 65-69 70-74 75+ Not
stated 21+
Total Household
Private Households
Institutions
years years years years years years years years years years years years years years years years
Tatakamotonga 1,903 250 244 247 207 150 109 129 104 95 86 86 47 42 37 26 44 0 1,903 324 324 0
Holonga 488 59 73 53 59 44 26 30 17 19 23 17 18 19 14 6 11 0 488 89 89 0
Pelehake 796 109 119 95 72 59 41 60 44 38 41 28 28 14 18 12 18 0 796 150 149 1
Fua'amotu 1,637 234 219 170 165 134 106 114 79 77 101 61 51 43 32 18 33 0 1,637 312 309 3
Nakolo 406 51 40 48 47 41 27 24 18 19 19 17 15 9 10 10 11 0 406 65 65 0
Ha'asini 883 102 117 118 80 71 65 54 64 36 28 46 20 23 22 15 22 0 883 158 158 0
Lavengatonga 359 50 41 44 36 30 13 30 15 25 20 14 11 11 8 5 6 0 359 65 65 0
Haveluliku 175 20 22 22 21 17 10 10 12 3 9 11 3 7 1 1 6 0 175 26 26 0
Fatumu 396 45 44 45 51 37 26 36 11 20 17 16 21 9 10 1 7 0 396 63 63 0
Lapaha 7,117 892 912 895 781 612 426 402 377 366 349 284 200 202 133 118 168 0 7,117 1,238 1,234 4
Lapaha 1,980 251 268 236 220 160 128 108 100 112 102 77 50 54 37 32 45 0 1,980 334 331 3
Talasiu 363 54 50 56 48 30 14 17 22 19 18 10 7 6 4 5 3 0 363 58 58 0
Hoi 425 43 50 50 36 46 31 21 28 20 17 12 20 21 10 8 12 0 425 75 75 0
Nukuleka 250 43 35 23 31 14 20 17 10 13 9 8 9 10 5 2 1 0 250 45 45 0
Makaunga 379 43 56 60 34 26 27 27 20 14 15 16 16 9 5 4 7 0 379 58 58 0
Talafo'ou 368 54 29 35 44 43 22 25 14 17 16 16 13 15 7 5 13 0 368 74 74 0
Manuka 272 29 36 34 34 21 20 18 11 11 18 10 4 9 9 4 4 0 272 46 46 0
Navutoka 712 102 105 83 56 70 48 48 41 20 38 23 21 18 11 12 16 0 712 118 117 1
Kolonga 1,145 128 130 168 128 95 56 61 64 63 56 54 33 33 24 23 29 0 1,145 216 216 0
Afa 474 64 60 68 49 44 26 20 25 37 18 16 12 8 7 10 10 0 474 71 71 0
Niutoua 671 69 78 74 94 57 32 32 38 39 41 36 13 17 13 11 27 0 671 130 130 0
Eueiki 77 12 15 8 7 6 2 8 4 1 1 5 2 2 1 2 1 0 77 12 12 0
Fukave 1 0 0 0 0 0 0 0 0 0 0 1 0 0 0 0 0 0 1 1 1 0
Nukunuku 8,001 1,078 949 999 807 709 566 492 423 371 421 333 220 192 129 129 183 0 8,001 1,399 1,391 8
NUkunuku 2,010 248 227 219 205 199 168 113 91 90 115 95 58 46 38 40 58 0 2,010 371 370 1
Matahau 581 86 97 78 45 42 36 43 31 26 23 22 12 13 9 11 7 0 581 105 105 0
Matafonua 233 34 33 16 18 23 19 17 8 11 13 10 13 8 3 3 4 0 233 45 45 0
Fatai 314 52 34 41 29 18 18 25 14 27 21 7 9 8 4 4 3 0 314 60 59 1
Lakepa 313 39 42 46 30 33 22 9 18 11 26 10 6 6 3 2 10 0 313 54 54 0
Vaotu'u 493 52 49 74 71 46 26 22 28 20 26 15 21 16 11 5 11 0 493 81 81 0

Tonga 2016 Census of Population and Housing
Tonga Statistics Department
26
Village Total 0-4 5-9 10-14 15-19 20-24 25-29 30-34 35-39 40-44 45-50 51-54 55-59 60-64 65-69 70-74 75+ Not
stated 21+
Total Household
Private Households
Institutions
years years years years years years years years years years years years years years years years
Utulau 614 85 66 75 62 54 39 37 29 39 27 23 19 12 15 17 15 0 614 98 98 0
Ha'alalo 610 93 85 72 63 53 44 36 35 26 24 24 18 16 6 7 8 0 610 103 103 0
Ha'akame 747 114 95 92 82 62 49 55 47 32 29 24 15 23 13 6 9 0 747 116 116 0
Houma 2,086 275 221 286 202 179 145 135 122 89 117 103 49 44 27 34 58 0 2,086 366 360 6
Kolovai 4,267 533 518 500 413 361 271 250 252 235 233 158 137 120 88 91 107 0 4,267 746 740 6
Kolovai 618 60 75 68 65 46 34 37 35 36 34 30 24 17 18 15 24 0 618 118 118 0
Te'ekiu 570 54 57 79 70 59 35 26 34 36 34 26 17 8 6 15 14 0 570 104 104 0
Masilamea 221 33 24 29 23 21 13 13 12 10 12 9 6 4 3 4 5 0 221 34 34 0
Fahefa 415 48 61 50 41 20 31 24 18 27 21 19 9 10 12 13 11 0 415 72 71 1
Ha'utu 268 40 34 34 30 18 9 26 16 16 12 7 5 7 4 4 6 0 268 39 39 0
Kala'au 152 29 20 15 13 17 15 10 6 4 6 5 1 1 3 4 3 0 152 26 26 0
Fo'ui 657 87 89 88 58 58 49 42 34 30 39 25 14 16 6 15 7 0 657 106 104 2
Ha'avakatolo 195 22 11 17 18 20 9 13 18 8 10 7 12 9 7 6 8 0 195 40 40 0
Ahau 393 52 61 34 34 38 25 24 23 18 18 8 15 17 11 8 7 0 393 61 61 0
Kanokupolu 332 39 42 33 28 29 19 18 25 20 18 7 16 19 7 1 11 0 332 68 65 3
Ha'atafu 269 32 33 40 20 11 18 12 20 22 22 8 6 8 8 4 5 0 269 47 47 0
Atata 177 37 11 13 13 24 14 5 11 8 7 7 12 4 3 2 6 0 177 31 31 0
Vava'u 13,738 1,652 1,760 1,755 1,466 927 732 769 691 742 756 611 463 397 353 246 418 0 6,913 2,745 2,715 30
Neiafu 5,251 575 634 668 590 356 308 319 268 275 291 277 179 152 125 88 146 0 5,251 1,059 1,041 18
Neiafu 3,731 396 451 478 424 255 224 230 189 202 217 195 124 91 86 69 100 0 3,731 761 743 18
Makave 381 39 46 46 53 19 16 19 26 18 21 20 13 15 14 4 12 0 381 72 72 0
Toula 381 43 36 46 38 25 23 30 17 20 13 26 21 20 6 8 9 0 381 83 83 0
Utui 300 45 35 37 37 24 22 11 10 13 18 17 7 4 5 2 13 0 300 55 55 0
Ofu 120 13 19 12 13 9 6 5 5 9 3 11 4 4 3 1 3 0 120 26 26 0
Okoa 261 28 32 40 23 21 12 15 18 9 15 6 7 13 10 4 8 0 261 48 48 0
Olo'ua 77 11 15 9 2 3 5 9 3 4 4 2 3 5 1 0 1 0 77 14 14 0
Pangaimotu 1,242 166 150 168 123 88 70 60 55 62 84 50 47 35 36 18 30 0 1,242 235 232 3
Pangaimotu 657 87 85 91 58 44 30 34 30 27 53 25 28 18 18 11 18 0 657 125 125 0
Utulei 116 18 13 11 6 6 7 7 4 10 8 4 5 2 5 4 6 0 116 24 24 0
Nga'unoho 181 23 19 33 23 18 10 8 10 10 6 8 2 6 2 2 1 0 181 28 27 1
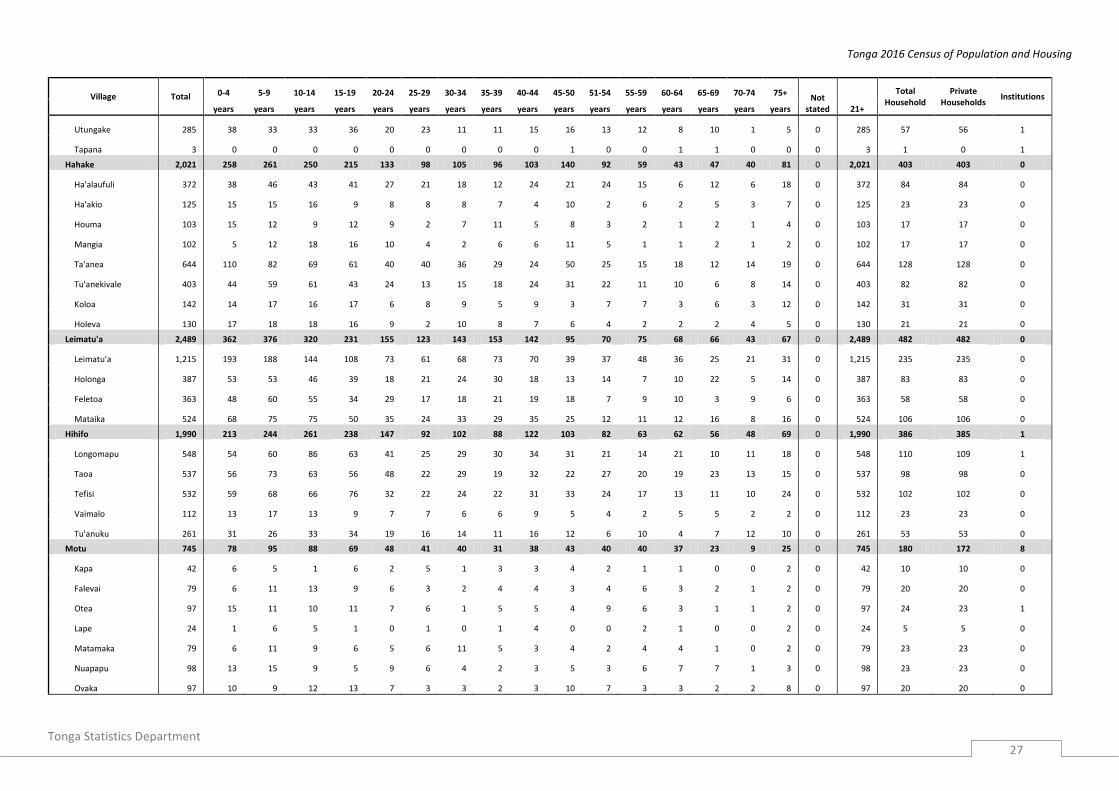
Tonga 2016 Census of Population and Housing
Tonga Statistics Department
27
Village Total 0-4 5-9 10-14 15-19 20-24 25-29 30-34 35-39 40-44 45-50 51-54 55-59 60-64 65-69 70-74 75+ Not
stated 21+
Total Household
Private Households
Institutions
years years years years years years years years years years years years years years years years
Utungake 285 38 33 33 36 20 23 11 11 15 16 13 12 8 10 1 5 0 285 57 56 1
Tapana 3 0 0 0 0 0 0 0 0 0 1 0 0 1 1 0 0 0 3 1 0 1
Hahake 2,021 258 261 250 215 133 98 105 96 103 140 92 59 43 47 40 81 0 2,021 403 403 0
Ha'alaufuli 372 38 46 43 41 27 21 18 12 24 21 24 15 6 12 6 18 0 372 84 84 0
Ha'akio 125 15 15 16 9 8 8 8 7 4 10 2 6 2 5 3 7 0 125 23 23 0
Houma 103 15 12 9 12 9 2 7 11 5 8 3 2 1 2 1 4 0 103 17 17 0
Mangia 102 5 12 18 16 10 4 2 6 6 11 5 1 1 2 1 2 0 102 17 17 0
Ta'anea 644 110 82 69 61 40 40 36 29 24 50 25 15 18 12 14 19 0 644 128 128 0
Tu'anekivale 403 44 59 61 43 24 13 15 18 24 31 22 11 10 6 8 14 0 403 82 82 0
Koloa 142 14 17 16 17 6 8 9 5 9 3 7 7 3 6 3 12 0 142 31 31 0
Holeva 130 17 18 18 16 9 2 10 8 7 6 4 2 2 2 4 5 0 130 21 21 0
Leimatu'a 2,489 362 376 320 231 155 123 143 153 142 95 70 75 68 66 43 67 0 2,489 482 482 0
Leimatu'a 1,215 193 188 144 108 73 61 68 73 70 39 37 48 36 25 21 31 0 1,215 235 235 0
Holonga 387 53 53 46 39 18 21 24 30 18 13 14 7 10 22 5 14 0 387 83 83 0
Feletoa 363 48 60 55 34 29 17 18 21 19 18 7 9 10 3 9 6 0 363 58 58 0
Mataika 524 68 75 75 50 35 24 33 29 35 25 12 11 12 16 8 16 0 524 106 106 0
Hihifo 1,990 213 244 261 238 147 92 102 88 122 103 82 63 62 56 48 69 0 1,990 386 385 1
Longomapu 548 54 60 86 63 41 25 29 30 34 31 21 14 21 10 11 18 0 548 110 109 1
Taoa 537 56 73 63 56 48 22 29 19 32 22 27 20 19 23 13 15 0 537 98 98 0
Tefisi 532 59 68 66 76 32 22 24 22 31 33 24 17 13 11 10 24 0 532 102 102 0
Vaimalo 112 13 17 13 9 7 7 6 6 9 5 4 2 5 5 2 2 0 112 23 23 0
Tu'anuku 261 31 26 33 34 19 16 14 11 16 12 6 10 4 7 12 10 0 261 53 53 0
Motu 745 78 95 88 69 48 41 40 31 38 43 40 40 37 23 9 25 0 745 180 172 8
Kapa 42 6 5 1 6 2 5 1 3 3 4 2 1 1 0 0 2 0 42 10 10 0
Falevai 79 6 11 13 9 6 3 2 4 4 3 4 6 3 2 1 2 0 79 20 20 0
Otea 97 15 11 10 11 7 6 1 5 5 4 9 6 3 1 1 2 0 97 24 23 1
Lape 24 1 6 5 1 0 1 0 1 4 0 0 2 1 0 0 2 0 24 5 5 0
Matamaka 79 6 11 9 6 5 6 11 5 3 4 2 4 4 1 0 2 0 79 23 23 0
Nuapapu 98 13 15 9 5 9 6 4 2 3 5 3 6 7 7 1 3 0 98 23 23 0
Ovaka 97 10 9 12 13 7 3 3 2 3 10 7 3 3 2 2 8 0 97 20 20 0

Tonga 2016 Census of Population and Housing
Tonga Statistics Department
28
Village Total 0-4 5-9 10-14 15-19 20-24 25-29 30-34 35-39 40-44 45-50 51-54 55-59 60-64 65-69 70-74 75+ Not
stated 21+
Total Household
Private Households
Institutions
years years years years years years years years years years years years years years years years
Taunga 28 4 5 1 1 1 2 2 2 3 1 3 2 0 1 0 0 0 28 9 9 0
Hunga 178 17 20 24 17 8 8 16 7 7 10 9 8 10 9 4 4 0 178 39 39 0
Foeata 3 0 0 0 0 2 0 0 0 0 0 0 0 1 0 0 0 0 3 1 0 1
Vaka'eitu 6 0 0 0 0 1 0 0 0 1 2 0 1 1 0 0 0 0 6 2 0 2
Mounu 1 0 0 0 0 0 0 0 0 1 0 0 0 0 0 0 0 0 1 1 0 1
Eueiki 2 0 0 0 0 0 0 0 0 0 0 1 0 1 0 0 0 0 2 1 0 1
Mala 5 0 2 1 0 0 1 0 0 0 0 0 0 1 0 0 0 0 5 1 0 1
Fofoa 6 0 0 3 0 0 0 0 0 1 0 0 1 1 0 0 0 0 6 1 0 1
Ha'apai 6,125 762 786 696 616 416 384 375 373 340 313 243 216 183 146 118 158 0 3,185 1,193 1,179 14
Pangai 2,205 218 230 275 270 174 148 129 130 133 122 99 86 53 46 37 55 0 2,205 444 433 11
Pangai 1,086 107 107 137 137 98 77 56 61 75 61 37 46 27 18 16 26 0 1,086 223 214 9
Hihifo 787 69 82 103 96 58 51 47 45 44 43 48 34 20 18 13 16 0 787 161 159 2
Holopeka 126 17 15 12 11 8 8 12 9 5 6 2 2 6 5 1 7 0 126 22 22 0
Koulo 206 25 26 23 26 10 12 14 15 9 12 12 4 0 5 7 6 0 206 38 38 0
Foa 1,392 189 198 160 147 85 89 96 82 68 58 50 41 46 32 22 29 0 1,392 238 236 2
Fangale'ounga 140 14 17 20 21 10 12 8 1 5 12 13 2 4 0 1 0 0 140 24 24 0
Fotua 259 38 38 34 28 17 11 17 18 10 11 11 6 6 4 3 7 0 259 42 42 0
Lotofoa 413 56 53 35 48 25 33 33 23 20 13 15 13 16 15 7 8 0 413 70 70 0
faleloa 380 54 59 41 35 20 21 22 31 21 17 6 12 14 7 8 12 0 380 66 64 2
Ha'afakahenga 90 12 13 15 7 5 6 6 7 7 2 3 1 1 2 1 2 0 90 17 17 0
Ha'ateiho 110 15 18 15 8 8 6 10 2 5 3 2 7 5 4 2 0 0 110 19 19 0
Lulunga 923 145 146 79 55 57 55 63 65 52 42 31 38 31 27 14 23 0 923 184 184 0
Ha'afeva 297 52 46 28 12 12 16 24 26 19 10 5 9 13 10 5 10 0 297 57 57 0
Tungua 187 26 31 20 14 20 10 6 11 15 10 6 7 5 4 1 1 0 187 37 37 0
Fotuha'a 105 20 15 4 5 7 10 12 8 2 3 4 5 2 5 1 2 0 105 19 19 0
'O'ua 116 12 17 13 11 7 9 4 8 4 5 5 6 8 2 2 3 0 116 25 25 0
Matuku 89 14 17 5 7 7 4 7 1 2 9 3 3 0 4 1 5 0 89 16 16 0
Kotu 129 21 20 9 6 4 6 10 11 10 5 8 8 3 2 4 2 0 129 30 30 0
Mu'omu'a 432 57 67 55 32 13 22 26 29 23 27 13 11 22 12 14 9 0 432 99 99 0
Nomuka 369 49 60 44 29 11 20 19 26 20 24 10 8 19 10 13 7 0 369 81 81 0

Tonga 2016 Census of Population and Housing
Tonga Statistics Department
29
Village Total 0-4 5-9 10-14 15-19 20-24 25-29 30-34 35-39 40-44 45-50 51-54 55-59 60-64 65-69 70-74 75+ Not
stated 21+
Total Household
Private Households
Institutions
years years years years years years years years years years years years years years years years
Mango 31 1 4 8 1 2 2 1 1 3 2 1 1 1 2 0 1 0 31 8 8 0
Fonoifua 32 7 3 3 2 0 0 6 2 0 1 2 2 2 0 1 1 0 32 10 10 0
Ha`ano 478 64 57 61 46 40 24 21 27 29 25 25 16 7 12 9 15 0 478 89 89 0
Fakakai 150 21 16 20 14 19 9 4 6 6 6 10 8 1 2 3 5 0 150 25 25 0
Pukotala 89 10 14 10 13 2 6 2 6 8 6 3 2 0 2 4 1 0 89 18 18 0
Ha'ano 123 16 16 12 8 13 5 12 7 6 4 5 5 4 7 0 3 0 123 24 24 0
Muitoa 53 10 7 6 5 2 1 0 5 7 3 3 0 1 0 0 3 0 53 7 7 0
Mo'unga'one 63 7 4 13 6 4 3 3 3 2 6 4 1 1 1 2 3 0 63 15 15 0
'Uiha 695 89 88 66 66 47 46 40 40 35 39 25 24 24 17 22 27 0 695 139 138 1
Uiha 378 51 55 36 34 22 26 21 20 20 21 11 13 12 9 11 16 0 378 76 76 0
Felemea 180 24 20 16 21 12 9 9 11 10 11 8 9 6 3 6 5 0 180 31 31 0
Lofanga 137 14 13 14 11 13 11 10 9 5 7 6 2 6 5 5 6 0 137 32 31 1
EUA 4,945 664 610 651 521 323 286 303 254 245 272 211 165 141 98 74 127 0 2,425 889 885 4
Eua Motu'a 2,795 378 365 366 277 175 155 175 148 152 159 115 83 85 50 44 68 0 2,795 510 508 2
Ohonua 1,248 141 157 181 141 65 65 81 67 74 65 54 35 41 28 21 32 0 1,248 222 221 1
Tufuvai 231 33 29 31 27 13 17 15 12 12 11 8 7 6 1 4 5 0 231 41 41 0
Pangai 326 43 37 42 38 24 14 17 18 20 27 8 10 7 4 8 9 0 326 59 59 0
Houma 278 46 44 27 19 13 13 19 13 15 14 9 13 14 10 2 7 0 278 55 55 0
Ha'atu'a / Kolomaile 522 85 70 65 39 50 30 31 27 24 30 21 14 13 5 7 11 0 522 97 96 1
Ta'anga 190 30 28 20 13 10 16 12 11 7 12 15 4 4 2 2 4 0 190 36 36 0
'Eua fo'ou 2,150 286 245 285 244 148 131 128 106 93 113 96 82 56 48 30 59 0 2,150 379 377 2
Angaha 387 58 51 48 50 26 18 27 17 12 17 18 14 9 8 3 11 0 387 65 65 0
Futu 264 28 24 30 37 27 12 13 16 15 15 9 10 8 7 3 10 0 264 51 51 0
Esia 225 22 21 42 25 16 16 13 12 6 13 8 9 7 3 5 7 0 225 37 37 0
Sapa'ata 171 23 24 26 20 5 12 13 7 17 5 4 3 2 4 2 4 0 171 24 24 0
Fata'ulua 227 31 29 30 21 14 18 15 6 8 14 14 13 6 3 1 4 0 227 36 36 0
Mu'a 155 23 15 16 15 13 7 11 9 4 10 6 7 4 6 3 6 0 155 28 28 0
Tongamama'o 179 23 19 18 23 13 11 8 7 11 7 13 7 2 6 2 9 0 179 29 29 0
Petani 277 29 38 41 29 19 16 14 17 10 16 17 6 8 4 8 5 0 277 58 57 1
Mata'aho 265 49 24 34 24 15 21 14 15 10 16 7 13 10 7 3 3 0 265 51 50 1
Ongo Niua 1,232 140 129 159 125 74 73 59 69 65 64 68 64 44 29 30 40 0 663 275 273 2

Tonga 2016 Census of Population and Housing
Tonga Statistics Department
30
Village Total 0-4 5-9 10-14 15-19 20-24 25-29 30-34 35-39 40-44 45-50 51-54 55-59 60-64 65-69 70-74 75+ Not
stated 21+
Total Household
Private Households
Institutions
years years years years years years years years years years years years years years years years
Niuatoputapu 739 85 83 91 61 45 42 37 48 37 31 40 44 33 21 21 20 0 739 174 172 2
Hihifo 302 34 32 41 26 16 13 14 24 12 15 20 12 14 5 7 17 0 302 72 71 1
Vaipoa 183 17 24 23 17 11 15 5 10 11 11 7 7 10 7 6 2 0 183 38 37 1
Falehau 223 29 24 25 16 16 13 16 14 13 3 10 20 7 8 8 1 0 223 56 56 0
Tafahi 31 5 3 2 2 2 1 2 0 1 2 3 5 2 1 0 0 0 31 8 8 0
Niuafo'ou 493 55 46 68 64 29 31 22 21 28 33 28 20 11 8 9 20 0 493 101 101 0
Esia 127 11 11 19 16 8 9 5 4 8 8 8 4 4 2 5 5 0 127 26 26 0
Kolofo'ou 43 4 0 2 11 2 5 1 1 1 3 5 6 1 0 1 0 0 43 11 11 0
Sapaata 145 21 12 21 19 13 9 6 6 9 9 8 3 3 2 0 4 0 145 26 26 0
Fata'ulua 64 6 6 10 7 3 2 2 1 2 6 5 3 1 2 2 6 0 64 13 13 0
Mata'aho 16 4 2 3 1 0 0 2 2 2 0 0 0 0 0 0 0 0 16 3 3 0
Mu'a 15 2 1 0 1 1 3 0 0 1 1 1 0 1 1 0 2 0 15 6 6 0
Tongamama'o 15 2 1 5 3 0 0 0 1 2 1 0 0 0 0 0 0 0 15 2 2 0
Petani 68 5 13 8 6 2 3 6 6 3 5 1 4 1 1 1 3 0 68 14 14 0

Tonga 2016 Census of Population and Housing
Tonga Statistics Department
31
Table G 6: Total population by single year of age, sex, division
Age
TONGA Tongatapu Vava'u Ha'apai Eua Ongo Niua
Total Male Female Total Male Female Total Male Female Total Male Female Total Male Female Total Male Female
Total 100,651 50,255 50,396 74,611 37,135 37,476 13,738 6,866 6,872 6,125 3,118 3,007 4,945 2,486 2,459 1,232 650 582 <1 2,279 1,190 1,089 1,708 915 793 303 143 160 141 65 76 110 58 52 17 9 8 1 2,556 1,335 1,221 1,919 991 928 318 172 146 158 87 71 128 69 59 33 16 17 2 2,589 1,362 1,227 1,913 1,014 899 355 179 176 152 72 80 154 91 63 15 6 9 3 2,556 1,298 1,258 1,887 957 930 349 189 160 157 70 87 127 64 63 36 18 18 4 2,519 1,255 1,264 1,854 938 916 327 160 167 154 73 81 145 64 81 39 20 19 5 2,468 1,289 1,179 1,819 945 874 343 188 155 166 93 73 117 52 65 23 11 12 6 2,711 1,493 1,218 1,961 1,074 887 387 225 162 186 102 84 137 75 62 40 17 23 7 2,319 1,239 1,080 1,691 903 788 341 181 160 152 83 69 116 64 52 19 8 11 8 2,336 1,189 1,147 1,704 884 820 354 163 191 134 77 57 113 46 67 31 19 12 9 2,319 1,207 1,112 1,693 877 816 335 169 166 148 78 70 127 72 55 16 11 5
10 2,443 1,281 1,162 1,780 940 840 351 171 180 145 79 66 129 70 59 38 21 17 11 2,384 1,224 1,160 1,706 862 844 363 188 175 162 94 68 129 64 65 24 16 8 12 2,382 1,207 1,175 1,718 844 874 351 205 146 138 76 62 137 63 74 38 19 19 13 2,374 1,232 1,142 1,735 886 849 342 185 157 137 69 68 124 68 56 36 24 12 14 2,299 1,195 1,104 1,682 876 806 348 199 149 114 54 60 132 56 76 23 10 13 15 2,228 1,161 1,067 1,634 856 778 321 169 152 138 70 68 114 55 59 21 11 10 16 2,367 1,213 1,154 1,710 884 826 348 166 182 145 78 67 128 67 61 36 18 18 17 2,078 1,089 989 1,540 803 737 296 148 148 117 65 52 102 60 42 23 13 10 18 2,011 1,046 965 1,509 783 726 262 137 125 107 57 50 105 52 53 28 17 11 19 1,818 940 878 1,381 715 666 239 124 115 109 58 51 72 30 42 17 13 4 20 1,735 879 856 1,373 687 686 192 98 94 80 39 41 74 46 28 16 9 7 21 1,765 867 898 1,389 677 712 193 89 104 99 56 43 67 35 32 17 10 7 22 1,613 790 823 1,286 627 659 189 89 100 71 37 34 53 26 27 14 11 3 23 1,612 797 815 1,271 618 653 181 80 101 90 57 33 58 35 23 12 7 5 24 1,509 773 736 1,175 599 576 172 82 90 76 45 31 71 39 32 15 8 7 25 1,384 663 721 1,084 535 549 134 57 77 86 39 47 63 26 37 17 6 11 26 1,461 710 751 1,166 570 596 156 75 81 79 40 39 51 23 28 9 2 7 27 1,261 586 675 968 457 511 140 58 82 75 32 43 62 29 33 16 10 6 28 1,292 619 673 1,009 491 518 147 61 86 74 40 34 44 18 26 18 9 9 29 1,231 584 647 927 450 477 155 68 87 70 30 40 66 31 35 13 5 8 30 1,395 637 758 1,083 488 595 159 74 85 86 43 43 52 25 27 15 7 8 31 1,308 610 698 1,002 465 537 144 65 79 82 37 45 68 37 31 12 6 6 32 1,287 576 711 986 451 535 156 67 89 65 27 38 66 26 40 14 5 9 33 1,322 597 725 1,004 453 551 167 81 86 81 32 49 63 27 36 7 4 3 34 1,209 574 635 940 455 485 143 56 87 61 25 36 54 31 23 11 7 4 35 1,127 519 608 845 379 466 131 69 62 76 38 38 59 25 34 16 8 8 36 1,218 611 607 899 445 454 163 82 81 92 55 37 50 18 32 14 11 3 37 1,138 546 592 892 423 469 121 59 62 62 30 32 49 28 21 14 6 8 38 1,121 533 588 846 412 434 138 61 77 78 33 45 47 21 26 12 6 6 39 1,041 495 546 776 362 414 138 71 67 65 34 31 49 24 25 13 4 9 40 1,078 511 567 804 375 429 140 73 67 66 30 36 58 28 30 10 5 5 41 1,031 507 524 752 362 390 151 77 74 68 37 31 46 27 19 14 4 10 42 1,029 494 535 763 377 386 133 60 73 74 28 46 47 23 24 12 6 6
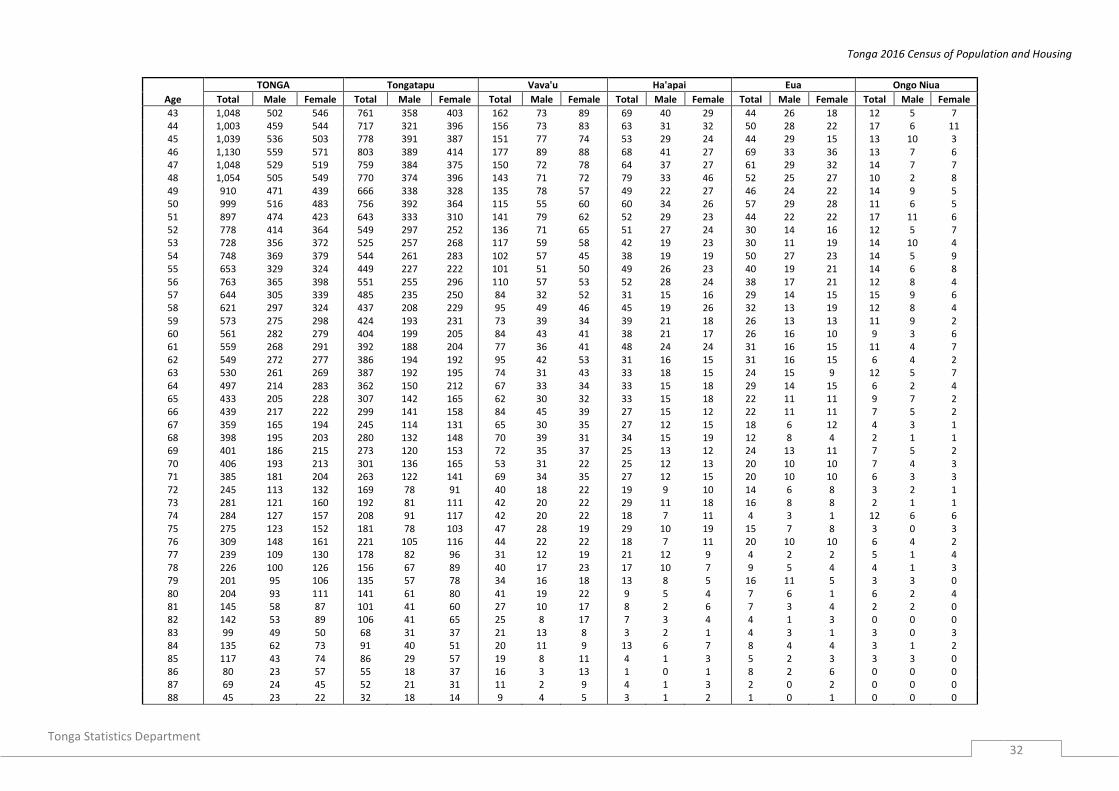
Tonga 2016 Census of Population and Housing
Tonga Statistics Department
32
Age
TONGA Tongatapu Vava'u Ha'apai Eua Ongo Niua
Total Male Female Total Male Female Total Male Female Total Male Female Total Male Female Total Male Female
43 1,048 502 546 761 358 403 162 73 89 69 40 29 44 26 18 12 5 7 44 1,003 459 544 717 321 396 156 73 83 63 31 32 50 28 22 17 6 11 45 1,039 536 503 778 391 387 151 77 74 53 29 24 44 29 15 13 10 3 46 1,130 559 571 803 389 414 177 89 88 68 41 27 69 33 36 13 7 6 47 1,048 529 519 759 384 375 150 72 78 64 37 27 61 29 32 14 7 7 48 1,054 505 549 770 374 396 143 71 72 79 33 46 52 25 27 10 2 8 49 910 471 439 666 338 328 135 78 57 49 22 27 46 24 22 14 9 5 50 999 516 483 756 392 364 115 55 60 60 34 26 57 29 28 11 6 5 51 897 474 423 643 333 310 141 79 62 52 29 23 44 22 22 17 11 6 52 778 414 364 549 297 252 136 71 65 51 27 24 30 14 16 12 5 7 53 728 356 372 525 257 268 117 59 58 42 19 23 30 11 19 14 10 4 54 748 369 379 544 261 283 102 57 45 38 19 19 50 27 23 14 5 9 55 653 329 324 449 227 222 101 51 50 49 26 23 40 19 21 14 6 8 56 763 365 398 551 255 296 110 57 53 52 28 24 38 17 21 12 8 4 57 644 305 339 485 235 250 84 32 52 31 15 16 29 14 15 15 9 6 58 621 297 324 437 208 229 95 49 46 45 19 26 32 13 19 12 8 4 59 573 275 298 424 193 231 73 39 34 39 21 18 26 13 13 11 9 2 60 561 282 279 404 199 205 84 43 41 38 21 17 26 16 10 9 3 6 61 559 268 291 392 188 204 77 36 41 48 24 24 31 16 15 11 4 7 62 549 272 277 386 194 192 95 42 53 31 16 15 31 16 15 6 4 2 63 530 261 269 387 192 195 74 31 43 33 18 15 24 15 9 12 5 7 64 497 214 283 362 150 212 67 33 34 33 15 18 29 14 15 6 2 4 65 433 205 228 307 142 165 62 30 32 33 15 18 22 11 11 9 7 2 66 439 217 222 299 141 158 84 45 39 27 15 12 22 11 11 7 5 2 67 359 165 194 245 114 131 65 30 35 27 12 15 18 6 12 4 3 1 68 398 195 203 280 132 148 70 39 31 34 15 19 12 8 4 2 1 1 69 401 186 215 273 120 153 72 35 37 25 13 12 24 13 11 7 5 2 70 406 193 213 301 136 165 53 31 22 25 12 13 20 10 10 7 4 3 71 385 181 204 263 122 141 69 34 35 27 12 15 20 10 10 6 3 3 72 245 113 132 169 78 91 40 18 22 19 9 10 14 6 8 3 2 1 73 281 121 160 192 81 111 42 20 22 29 11 18 16 8 8 2 1 1 74 284 127 157 208 91 117 42 20 22 18 7 11 4 3 1 12 6 6 75 275 123 152 181 78 103 47 28 19 29 10 19 15 7 8 3 0 3 76 309 148 161 221 105 116 44 22 22 18 7 11 20 10 10 6 4 2 77 239 109 130 178 82 96 31 12 19 21 12 9 4 2 2 5 1 4 78 226 100 126 156 67 89 40 17 23 17 10 7 9 5 4 4 1 3 79 201 95 106 135 57 78 34 16 18 13 8 5 16 11 5 3 3 0 80 204 93 111 141 61 80 41 19 22 9 5 4 7 6 1 6 2 4 81 145 58 87 101 41 60 27 10 17 8 2 6 7 3 4 2 2 0 82 142 53 89 106 41 65 25 8 17 7 3 4 4 1 3 0 0 0 83 99 49 50 68 31 37 21 13 8 3 2 1 4 3 1 3 0 3 84 135 62 73 91 40 51 20 11 9 13 6 7 8 4 4 3 1 2 85 117 43 74 86 29 57 19 8 11 4 1 3 5 2 3 3 3 0 86 80 23 57 55 18 37 16 3 13 1 0 1 8 2 6 0 0 0 87 69 24 45 52 21 31 11 2 9 4 1 3 2 0 2 0 0 0 88 45 23 22 32 18 14 9 4 5 3 1 2 1 0 1 0 0 0

Tonga 2016 Census of Population and Housing
Tonga Statistics Department
33
Age
TONGA Tongatapu Vava'u Ha'apai Eua Ongo Niua
Total Male Female Total Male Female Total Male Female Total Male Female Total Male Female Total Male Female
89 47 14 33 31 9 22 7 2 5 3 1 2 6 2 4 0 0 0 90 32 9 23 15 3 12 10 4 6 2 0 2 4 1 3 1 1 0 91 21 6 15 13 3 10 6 2 4 0 0 0 1 0 1 1 1 0 92 25 6 19 17 5 12 4 0 4 1 0 1 3 1 2 0 0 0 93 12 3 9 8 2 6 2 1 1 1 0 1 1 0 1 0 0 0 94 9 1 8 6 0 6 2 1 1 1 0 1 0 0 0 0 0 0
95+ 12 6 6 8 3 5 2 1 1 0 0 0 2 2 0 0 0 0 Not Stated 41 23 18 41 23 18 0 0 0 0 0 0 0 0 0 0 0 0

Tonga 2016 Census of Population and Housing
Tonga Statistics Department
34
Table G 7: Total population by single year of age, sex and region
Age
TONGA Urban Rural Greater Nuku'alofa
Total Male Female Total Male Female Total Male Female Total Male Female
Total 100,651 50,255 50,396 23,221 11,529 11,692 77,430 38,726 38,704 35,184 17,490 17,694 <1 2,279 1,190 1,089 485 264 221 1,794 926 868 773 424 349 1 2,556 1,335 1,221 549 268 281 2,007 1,067 940 864 440 424 2 2,589 1,362 1,227 542 281 261 2,047 1,081 966 859 445 414 3 2,556 1,298 1,258 541 270 271 2,015 1,028 987 862 441 421 4 2,519 1,255 1,264 531 274 257 1,988 981 1,007 848 424 424 5 2,468 1,289 1,179 499 268 231 1,969 1,021 948 802 420 382 6 2,711 1,493 1,218 575 327 248 2,136 1,166 970 865 485 380 7 2,319 1,239 1,080 498 259 239 1,821 980 841 769 391 378 8 2,336 1,189 1,147 516 273 243 1,820 916 904 784 419 365 9 2,319 1,207 1,112 469 224 245 1,850 983 867 743 381 362 10 2,443 1,281 1,162 504 243 261 1,939 1,038 901 793 400 393 11 2,384 1,224 1,160 482 232 250 1,902 992 910 755 374 381 12 2,382 1,207 1,175 520 238 282 1,862 969 893 795 381 414 13 2,374 1,232 1,142 527 274 253 1,847 958 889 800 404 396 14 2,299 1,195 1,104 485 257 228 1,814 938 876 738 393 345 15 2,228 1,161 1,067 501 251 250 1,727 910 817 750 378 372 16 2,367 1,213 1,154 491 250 241 1,876 963 913 755 392 363 17 2,078 1,089 989 495 270 225 1,583 819 764 717 378 339 18 2,011 1,046 965 452 252 200 1,559 794 765 700 377 323 19 1,818 940 878 435 223 212 1,383 717 666 683 345 338 20 1,735 879 856 432 212 220 1,303 667 636 680 344 336 21 1,765 867 898 449 226 223 1,316 641 675 656 322 334 22 1,613 790 823 394 194 200 1,219 596 623 633 314 319 23 1,612 797 815 412 200 212 1,200 597 603 613 305 308 24 1,509 773 736 383 197 186 1,126 576 550 561 289 272 25 1,384 663 721 334 177 157 1,050 486 564 518 269 249 26 1,461 710 751 407 203 204 1,054 507 547 604 308 296 27 1,261 586 675 340 170 170 921 416 505 492 239 253 28 1,292 619 673 349 177 172 943 442 501 502 239 263 29 1,231 584 647 332 161 171 899 423 476 490 232 258 30 1,395 637 758 360 175 185 1,035 462 573 529 245 284 31 1,308 610 698 338 159 179 970 451 519 498 237 261 32 1,287 576 711 322 154 168 965 422 543 496 240 256 33 1,322 597 725 318 150 168 1,004 447 557 496 237 259 34 1,209 574 635 303 152 151 906 422 484 462 231 231 35 1,127 519 608 267 133 134 860 386 474 400 201 199 36 1,218 611 607 280 129 151 938 482 456 439 209 230 37 1,138 546 592 291 122 169 847 424 423 433 189 244 38 1,121 533 588 286 141 145 835 392 443 431 212 219 39 1,041 495 546 244 116 128 797 379 418 383 181 202 40 1,078 511 567 258 112 146 820 399 421 387 169 218 41 1,031 507 524 237 114 123 794 393 401 365 184 181 42 1,029 494 535 243 129 114 786 365 421 366 199 167 43 1,048 502 546 254 124 130 794 378 416 375 180 195 44 1,003 459 544 217 98 119 786 361 425 324 146 178 45 1,039 536 503 237 124 113 802 412 390 366 185 181 46 1,130 559 571 257 117 140 873 442 431 361 164 197 47 1,048 529 519 250 120 130 798 409 389 358 178 180 48 1,054 505 549 249 124 125 805 381 424 365 165 200 49 910 471 439 227 120 107 683 351 332 333 173 160 50 999 516 483 224 112 112 775 404 371 361 183 178 51 897 474 423 217 114 103 680 360 320 306 151 155 52 778 414 364 193 112 81 585 302 283 280 155 125 53 728 356 372 192 91 101 536 265 271 267 125 142 54 748 369 379 186 90 96 562 279 283 254 123 131 55 653 329 324 156 76 80 497 253 244 223 110 113 56 763 365 398 202 95 107 561 270 291 281 127 154 57 644 305 339 141 67 74 503 238 265 218 103 115 58 621 297 324 159 68 91 462 229 233 229 104 125 59 573 275 298 145 63 82 428 212 216 220 97 123 60 561 282 279 122 56 66 439 226 213 186 80 106 61 559 268 291 128 61 67 431 207 224 199 89 110 62 549 272 277 137 67 70 412 205 207 181 92 89 63 530 261 269 128 64 64 402 197 205 191 101 90 64 497 214 283 113 53 60 384 161 223 168 77 91 65 433 205 228 98 47 51 335 158 177 147 68 79 66 439 217 222 101 47 54 338 170 168 149 69 80 67 359 165 194 89 36 53 270 129 141 123 57 66 68 398 195 203 94 42 52 304 153 151 135 65 70 69 401 186 215 92 43 49 309 143 166 132 57 75

Tonga 2016 Census of Population and Housing
Tonga Statistics Department
35
Age
TONGA Urban Rural Greater Nuku'alofa
Total Male Female Total Male Female Total Male Female Total Male Female
70 406 193 213 105 47 58 301 146 155 146 72 74 71 385 181 204 74 36 38 311 145 166 120 53 67 72 245 113 132 43 21 22 202 92 110 67 31 36 73 281 121 160 64 30 34 217 91 126 100 44 56 74 284 127 157 59 20 39 225 107 118 86 33 53 75 275 123 152 57 28 29 218 95 123 93 41 52 76 309 148 161 68 36 32 241 112 129 97 49 48 77 239 109 130 53 21 32 186 88 98 76 31 45 78 226 100 126 46 18 28 180 82 98 70 26 44 79 201 95 106 45 18 27 156 77 79 72 33 39 80 204 93 111 45 17 28 159 76 83 67 29 38 81 145 58 87 31 17 14 114 41 73 47 20 27 82 142 53 89 39 15 24 103 38 65 54 18 36 83 99 49 50 25 7 18 74 42 32 33 11 22 84 135 62 73 35 14 21 100 48 52 44 18 26 85 117 43 74 31 7 24 86 36 50 43 11 32 86 80 23 57 13 3 10 67 20 47 22 7 15 87 69 24 45 14 3 11 55 21 34 24 9 15 88 45 23 22 12 7 5 33 16 17 14 8 6 89 47 14 33 8 3 5 39 11 28 13 5 8 90 32 9 23 10 2 8 22 7 15 11 2 9 91 21 6 15 8 2 6 13 4 9 10 3 7 92 25 6 19 3 0 3 22 6 16 3 0 3 93 12 3 9 4 1 3 8 2 6 4 1 3 94 9 1 8 2 0 2 7 1 6 2 0 2 95+ 12 6 6 2 1 1 10 5 5 4 1 3 Not Stated 41 23 18 41 23 18 0 0 0 41 23 18
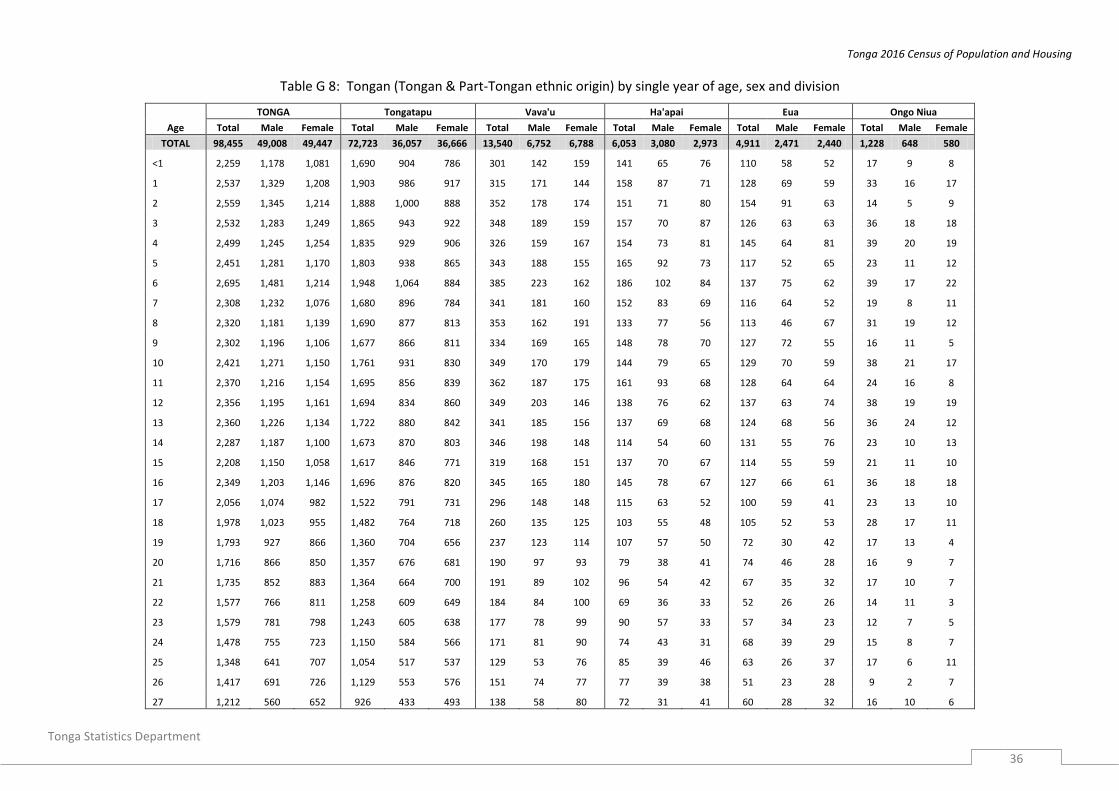
Tonga 2016 Census of Population and Housing
Tonga Statistics Department
36
Table G 8: Tongan (Tongan & Part-Tongan ethnic origin) by single year of age, sex and division
Age
TONGA Tongatapu Vava'u Ha'apai Eua Ongo Niua
Total Male Female Total Male Female Total Male Female Total Male Female Total Male Female Total Male Female
TOTAL 98,455 49,008 49,447 72,723 36,057 36,666 13,540 6,752 6,788 6,053 3,080 2,973 4,911 2,471 2,440 1,228 648 580
<1 2,259 1,178 1,081 1,690 904 786 301 142 159 141 65 76 110 58 52 17 9 8
1 2,537 1,329 1,208 1,903 986 917 315 171 144 158 87 71 128 69 59 33 16 17
2 2,559 1,345 1,214 1,888 1,000 888 352 178 174 151 71 80 154 91 63 14 5 9
3 2,532 1,283 1,249 1,865 943 922 348 189 159 157 70 87 126 63 63 36 18 18
4 2,499 1,245 1,254 1,835 929 906 326 159 167 154 73 81 145 64 81 39 20 19
5 2,451 1,281 1,170 1,803 938 865 343 188 155 165 92 73 117 52 65 23 11 12
6 2,695 1,481 1,214 1,948 1,064 884 385 223 162 186 102 84 137 75 62 39 17 22
7 2,308 1,232 1,076 1,680 896 784 341 181 160 152 83 69 116 64 52 19 8 11
8 2,320 1,181 1,139 1,690 877 813 353 162 191 133 77 56 113 46 67 31 19 12
9 2,302 1,196 1,106 1,677 866 811 334 169 165 148 78 70 127 72 55 16 11 5
10 2,421 1,271 1,150 1,761 931 830 349 170 179 144 79 65 129 70 59 38 21 17
11 2,370 1,216 1,154 1,695 856 839 362 187 175 161 93 68 128 64 64 24 16 8
12 2,356 1,195 1,161 1,694 834 860 349 203 146 138 76 62 137 63 74 38 19 19
13 2,360 1,226 1,134 1,722 880 842 341 185 156 137 69 68 124 68 56 36 24 12
14 2,287 1,187 1,100 1,673 870 803 346 198 148 114 54 60 131 55 76 23 10 13
15 2,208 1,150 1,058 1,617 846 771 319 168 151 137 70 67 114 55 59 21 11 10
16 2,349 1,203 1,146 1,696 876 820 345 165 180 145 78 67 127 66 61 36 18 18
17 2,056 1,074 982 1,522 791 731 296 148 148 115 63 52 100 59 41 23 13 10
18 1,978 1,023 955 1,482 764 718 260 135 125 103 55 48 105 52 53 28 17 11
19 1,793 927 866 1,360 704 656 237 123 114 107 57 50 72 30 42 17 13 4
20 1,716 866 850 1,357 676 681 190 97 93 79 38 41 74 46 28 16 9 7
21 1,735 852 883 1,364 664 700 191 89 102 96 54 42 67 35 32 17 10 7
22 1,577 766 811 1,258 609 649 184 84 100 69 36 33 52 26 26 14 11 3
23 1,579 781 798 1,243 605 638 177 78 99 90 57 33 57 34 23 12 7 5
24 1,478 755 723 1,150 584 566 171 81 90 74 43 31 68 39 29 15 8 7
25 1,348 641 707 1,054 517 537 129 53 76 85 39 46 63 26 37 17 6 11
26 1,417 691 726 1,129 553 576 151 74 77 77 39 38 51 23 28 9 2 7
27 1,212 560 652 926 433 493 138 58 80 72 31 41 60 28 32 16 10 6

Tonga 2016 Census of Population and Housing
Tonga Statistics Department
37
Age
TONGA Tongatapu Vava'u Ha'apai Eua Ongo Niua
Total Male Female Total Male Female Total Male Female Total Male Female Total Male Female Total Male Female
28 1,233 591 642 960 465 495 142 60 82 71 39 32 42 18 24 18 9 9
29 1,184 565 619 888 432 456 153 67 86 68 30 38 62 31 31 13 5 8
30 1,345 613 732 1,039 467 572 154 72 82 85 42 43 52 25 27 15 7 8
31 1,260 588 672 959 446 513 140 63 77 82 37 45 67 36 31 12 6 6
32 1,237 552 685 944 430 514 151 65 86 65 27 38 63 25 38 14 5 9
33 1,272 567 705 962 430 532 162 77 85 79 30 49 62 26 36 7 4 3
34 1,165 550 615 903 434 469 138 54 84 60 25 35 53 30 23 11 7 4
35 1,084 497 587 810 360 450 130 68 62 72 37 35 58 25 33 14 7 7
36 1,178 586 592 867 427 440 159 78 81 89 53 36 49 17 32 14 11 3
37 1,096 519 577 853 397 456 119 59 60 61 29 32 49 28 21 14 6 8
38 1,071 504 567 799 384 415 136 60 76 78 33 45 46 21 25 12 6 6
39 993 466 527 732 336 396 135 68 67 64 34 30 49 24 25 13 4 9
40 1,031 491 540 761 357 404 138 72 66 65 30 35 57 27 30 10 5 5
41 989 485 504 719 346 373 144 72 72 66 36 30 46 27 19 14 4 10
42 994 470 524 731 354 377 132 59 73 72 28 44 47 23 24 12 6 6
43 1,002 477 525 719 334 385 159 72 87 68 40 28 44 26 18 12 5 7
44 960 438 522 678 302 376 153 72 81 62 30 32 50 28 22 17 6 11
45 990 509 481 734 365 369 149 77 72 51 29 22 43 28 15 13 10 3
46 1,086 530 556 768 365 403 171 86 85 65 39 26 69 33 36 13 7 6
47 1,011 503 508 725 360 365 148 70 78 64 37 27 60 29 31 14 7 7
48 1,009 481 528 731 352 379 139 70 69 77 32 45 52 25 27 10 2 8
49 876 444 432 641 319 322 128 72 56 47 20 27 46 24 22 14 9 5
50 961 487 474 719 364 355 114 54 60 60 34 26 57 29 28 11 6 5
51 861 451 410 612 313 299 137 77 60 52 29 23 43 21 22 17 11 6
52 742 394 348 516 278 238 135 71 64 50 26 24 29 14 15 12 5 7
53 703 341 362 503 243 260 114 58 56 42 19 23 30 11 19 14 10 4
54 721 352 369 519 246 273 100 55 45 38 19 19 50 27 23 14 5 9
55 622 313 309 426 217 209 93 45 48 49 26 23 40 19 21 14 6 8
56 727 346 381 519 240 279 107 54 53 51 27 24 38 17 21 12 8 4
57 620 291 329 464 222 242 81 31 50 31 15 16 29 14 15 15 9 6
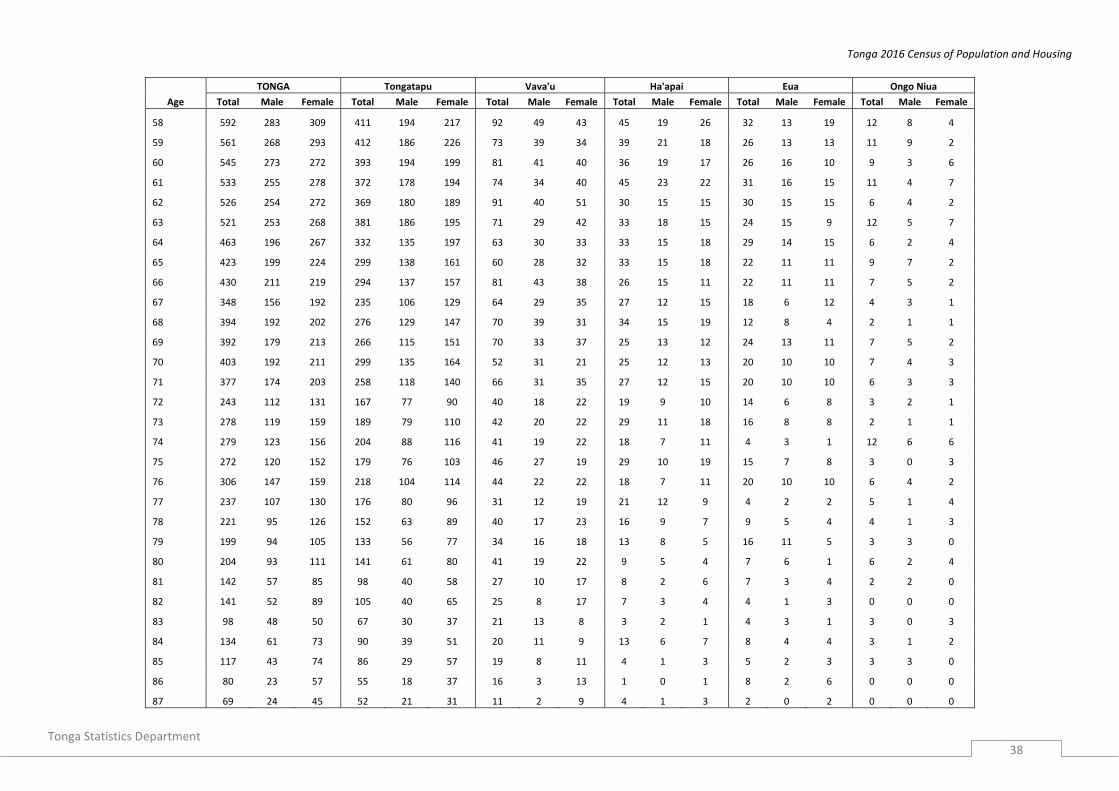
Tonga 2016 Census of Population and Housing
Tonga Statistics Department
38
Age
TONGA Tongatapu Vava'u Ha'apai Eua Ongo Niua
Total Male Female Total Male Female Total Male Female Total Male Female Total Male Female Total Male Female
58 592 283 309 411 194 217 92 49 43 45 19 26 32 13 19 12 8 4
59 561 268 293 412 186 226 73 39 34 39 21 18 26 13 13 11 9 2
60 545 273 272 393 194 199 81 41 40 36 19 17 26 16 10 9 3 6
61 533 255 278 372 178 194 74 34 40 45 23 22 31 16 15 11 4 7
62 526 254 272 369 180 189 91 40 51 30 15 15 30 15 15 6 4 2
63 521 253 268 381 186 195 71 29 42 33 18 15 24 15 9 12 5 7
64 463 196 267 332 135 197 63 30 33 33 15 18 29 14 15 6 2 4
65 423 199 224 299 138 161 60 28 32 33 15 18 22 11 11 9 7 2
66 430 211 219 294 137 157 81 43 38 26 15 11 22 11 11 7 5 2
67 348 156 192 235 106 129 64 29 35 27 12 15 18 6 12 4 3 1
68 394 192 202 276 129 147 70 39 31 34 15 19 12 8 4 2 1 1
69 392 179 213 266 115 151 70 33 37 25 13 12 24 13 11 7 5 2
70 403 192 211 299 135 164 52 31 21 25 12 13 20 10 10 7 4 3
71 377 174 203 258 118 140 66 31 35 27 12 15 20 10 10 6 3 3
72 243 112 131 167 77 90 40 18 22 19 9 10 14 6 8 3 2 1
73 278 119 159 189 79 110 42 20 22 29 11 18 16 8 8 2 1 1
74 279 123 156 204 88 116 41 19 22 18 7 11 4 3 1 12 6 6
75 272 120 152 179 76 103 46 27 19 29 10 19 15 7 8 3 0 3
76 306 147 159 218 104 114 44 22 22 18 7 11 20 10 10 6 4 2
77 237 107 130 176 80 96 31 12 19 21 12 9 4 2 2 5 1 4
78 221 95 126 152 63 89 40 17 23 16 9 7 9 5 4 4 1 3
79 199 94 105 133 56 77 34 16 18 13 8 5 16 11 5 3 3 0
80 204 93 111 141 61 80 41 19 22 9 5 4 7 6 1 6 2 4
81 142 57 85 98 40 58 27 10 17 8 2 6 7 3 4 2 2 0
82 141 52 89 105 40 65 25 8 17 7 3 4 4 1 3 0 0 0
83 98 48 50 67 30 37 21 13 8 3 2 1 4 3 1 3 0 3
84 134 61 73 90 39 51 20 11 9 13 6 7 8 4 4 3 1 2
85 117 43 74 86 29 57 19 8 11 4 1 3 5 2 3 3 3 0
86 80 23 57 55 18 37 16 3 13 1 0 1 8 2 6 0 0 0
87 69 24 45 52 21 31 11 2 9 4 1 3 2 0 2 0 0 0

Tonga 2016 Census of Population and Housing
Tonga Statistics Department
39
Age
TONGA Tongatapu Vava'u Ha'apai Eua Ongo Niua
Total Male Female Total Male Female Total Male Female Total Male Female Total Male Female Total Male Female
88 44 23 21 32 18 14 8 4 4 3 1 2 1 0 1 0 0 0
89 47 14 33 31 9 22 7 2 5 3 1 2 6 2 4 0 0 0
90 32 9 23 15 3 12 10 4 6 2 0 2 4 1 3 1 1 0
91 20 6 14 13 3 10 5 2 3 0 0 0 1 0 1 1 1 0
92 25 6 19 17 5 12 4 0 4 1 0 1 3 1 2 0 0 0
93 12 3 9 8 2 6 2 1 1 1 0 1 1 0 1 0 0 0
94 9 1 8 6 0 6 2 1 1 1 0 1 0 0 0 0 0 0
95+ 12 6 6 8 3 5 2 1 1 0 0 0 2 2 0 0 0 0
Not Stated 1 1 0 1 1 0 0 0 0 0 0 0 0 0 0 0 0 0

Tonga 2016 Census of Population and Housing
Tonga Statistics Department
40
Table G 9: Total Population by 5-year age groups, sex by division and region
Age/Sex Total Tongatapu Vava'u Ha'apai 'Eua Ongo Niua Urban Rural Grt
Nuku'alofa
Total 100,651 74,611 13,738 6,125 4,945 1,232 23,221 77,430 35,184 < 5 12,499 9,281 1,652 762 664 140 2,648 9,851 4,206 5-9 12,153 8,868 1,760 786 610 129 2,557 9,596 3,963 10-14 11,882 8,621 1,755 696 651 159 2,518 9,364 3,881 15-19 10,502 7,774 1,466 616 521 125 2,374 8,128 3,605 20-24 8,234 6,494 927 416 323 74 2,070 6,164 3,143 25-29 6,629 5,154 732 384 286 73 1,762 4,867 2,606 30-34 6,521 5,015 769 375 303 59 1,641 4,880 2,481 35-39 5,645 4,258 691 373 254 69 1,368 4,277 2,086 40-44 5,189 3,797 742 340 245 65 1,209 3,980 1,817 45-49 5,181 3,776 756 313 272 64 1,220 3,961 1,783 50-54 4,150 3,017 611 243 211 68 1,012 3,138 1,468 55-60 3,254 2,346 463 216 165 64 803 2,451 1,171 60-64 2,696 1,931 397 183 141 44 628 2,068 925 65-69 2,030 1,404 353 146 98 29 474 1,556 686 70-74 1,601 1,133 246 118 74 30 345 1,256 519 75+ 2,444 1,701 418 158 127 40 551 1,893 803 Not Stated 41 41 0 0 0 0 41 0 41 Male 50,255 37,135 6,866 3,118 2,486 650 11,529 38,726 17,490 < 5 6,440 4,815 843 367 346 69 1,357 5,083 2,174 5-9 6,417 4,683 926 433 309 66 1,351 5,066 2,096 10-14 6,139 4,408 948 372 321 90 1,244 4,895 1,952 15-19 5,449 4,041 744 328 264 72 1,246 4,203 1,870 20-24 4,106 3,208 438 234 181 45 1,029 3,077 1,574 25-29 3,162 2,503 319 181 127 32 888 2,274 1,287 30-34 2,994 2,312 343 164 146 29 790 2,204 1,190 35-39 2,704 2,021 342 190 116 35 641 2,063 992 40-44 2,473 1,793 356 166 132 26 577 1,896 878 45-49 2,600 1,876 387 162 140 35 605 1,995 865 50-54 2,129 1,540 321 128 103 37 519 1,610 737 55-60 1,571 1,118 228 109 76 40 369 1,202 541 60-64 1,297 923 185 94 77 18 301 996 439 65-69 968 649 179 70 49 21 215 753 316 70-74 735 508 123 51 37 16 154 581 233 75+ 1,048 714 184 69 62 19 220 828 323 Not Stated 23 23 0 0 0 0 23 0 23 Female 50,396 37,476 6,872 3,007 2,459 582 11,692 38,704 17,694 < 5 6,059 4,466 809 395 318 71 1,291 4,768 2,032 5-9 5,736 4,185 834 353 301 63 1,206 4,530 1,867 10-14 5,743 4,213 807 324 330 69 1,274 4,469 1,929 15-19 5,053 3,733 722 288 257 53 1,128 3,925 1,735 20-24 4,128 3,286 489 182 142 29 1,041 3,087 1,569 25-29 3,467 2,651 413 203 159 41 874 2,593 1,319 30-34 3,527 2,703 426 211 157 30 851 2,676 1,291 35-39 2,941 2,237 349 183 138 34 727 2,214 1,094 40-44 2,716 2,004 386 174 113 39 632 2,084 939 45-49 2,581 1,900 369 151 132 29 615 1,966 918 50-54 2,021 1,477 290 115 108 31 493 1,528 731 55-60 1,683 1,228 235 107 89 24 434 1,249 630 60-64 1,399 1,008 212 89 64 26 327 1,072 486 65-69 1,062 755 174 76 49 8 259 803 370 70-74 866 625 123 67 37 14 191 675 286 75+ 1,396 987 234 89 65 21 331 1,065 480 Not Stated 18 18 0 0 0 0 18 0 18

Tonga 2016 Census of Population and Housing
Tonga Statistics Department
41
Table G 10: Total population by ethnic origin, sex, region and division
Sex /Island Total Tongan Part-
Tongan European Fijian Indo-Fijian Chinese
Other Pacific
Other Asia
Not elsewhere Other Not Stated
Total 100,651 97,662 793 251 306 117 731 201 192 70 302 26
Urban 23,221 21,873 244 74 191 80 369 67 133 35 129 26
Rural 77,430 75,789 549 177 115 37 362 134 59 35 173 0
Greater Nuku'alofa 35,184 33,412 357 102 234 95 470 100 159 39 190 26
Tongatapu 74,611 72,057 666 150 285 109 670 168 176 53 251 26
Vava'u 13,738 13,448 92 74 17 3 28 24 10 15 27 0
Ha'apai 6,125 6,028 25 22 2 1 23 4 1 1 18 0
'Eua 4,945 4,903 8 5 2 2 9 4 5 1 6 0
Ongo Niua 1,232 1,226 2 0 0 2 1 1 0 0 0 0
Male 50,255 48,591 417 154 122 67 462 104 133 32 158 15
Urban 11,529 10,762 134 47 68 46 238 32 100 16 71 15
Rural 38,726 37,829 283 107 54 21 224 72 33 16 87 0
Greater Nuku'alofa 17,490 16,498 182 65 89 56 299 49 115 17 105 15
Tongatapu 37,135 35,713 344 95 113 62 423 88 123 24 135 15
Vava'u 6,866 6,698 54 45 8 3 20 12 6 7 13 0
Ha'apai 3,118 3,066 14 11 0 1 14 3 1 1 7 0
'Eua 2,486 2,467 4 3 1 0 4 1 3 0 3 0
Ongo Niua 650 647 1 0 0 1 1 0 0 0 0 0
Female 50,396 49,071 376 97 184 50 269 97 59 38 144 11
Urban 11,692 11,111 110 27 123 34 131 35 33 19 58 11
Rural 38,704 37,960 266 70 61 16 138 62 26 19 86 0
Greater Nuku'alofa 17,694 16,914 175 37 145 39 171 51 44 22 85 11
Tongatapu 37,476 36,344 322 55 172 47 247 80 53 29 116 11
Vava'u 6,872 6,750 38 29 9 0 8 12 4 8 14 0
Ha'apai 3,007 2,962 11 11 2 0 9 1 0 0 11 0
'Eua 2,459 2,436 4 2 1 2 5 3 2 1 3 0
Ongo Niua 582 579 1 0 0 1 0 1 0 0 0 0
Table G 11: Total Population by ethnic origin and household type
Household Type Total Tongan
Part-Tongan European Fijian
Fijian Indian Chinese
Other Pacific Island
Other Asian
Not elsewhere cllasified Other Not Stated
Total 100,651 97,662 793 251 306 117 731 201 192 70 302 26
Private household 99,600 97,080 768 170 287 91 606 184 106 30 278 0
Institution 1,051 582 25 81 19 26 125 17 86 40 24 26

Tonga 2016 Census of Population and Housing
Tonga Statistics Department
42
Table G 12: Total Population by ethnic origin, 5 year age groups and sex
Age Total Tongan Part-
Tongan European Fijian Fijian Indian Chinese
Other Pacific
Other Asian
Not elsewhere classified Other
Not Stated
Total 100,651 97,662 793 251 306 117 731 201 192 70 302 26
0- 4 12,499 12,229 157 9 19 13 40 13 3 1 15 0
5- 9 12,153 11,916 160 12 15 6 9 8 5 2 20 0
10-14 11,882 11,658 136 19 16 4 6 12 4 3 24 0
15-19 10,502 10,294 90 7 15 10 33 14 8 8 23 0
20-24 8,234 8,029 56 17 11 8 58 11 14 6 24 0
25-29 6,629 6,351 43 8 36 13 98 18 27 4 31 0
30-34 6,521 6,249 30 18 45 12 100 25 18 11 13 0
35-39 5,645 5,399 23 18 32 19 96 10 18 6 24 0
40-44 5,189 4,961 15 19 34 7 75 23 29 7 19 0
45-49 5,181 4,961 11 19 32 6 87 15 24 4 22 0
50-54 4,150 3,974 14 14 21 4 84 11 6 6 16 0
55-60 3,254 3,110 12 26 16 7 25 15 15 5 23 0
60-64 2,696 2,574 14 29 7 3 18 17 8 4 22 0
65-69 2,030 1,976 11 17 3 1 0 6 4 1 11 0
70-74 1,601 1,575 5 6 2 1 2 0 5 0 5 0
75+ 2,444 2,406 15 9 1 0 0 3 3 1 6 0
Not Stated 41 0 1 4 1 3 0 0 1 1 4 26
Male 50,255 48,591 417 154 122 67 462 104 133 32 158 15
0- 4 6,440 6,297 83 3 8 7 22 10 3 1 6 0
5- 9 6,417 6,278 93 9 10 2 2 6 3 1 13 0
10-14 6,139 6,017 78 10 7 2 2 8 1 3 11 0
15-19 5,449 5,330 47 4 9 7 19 7 6 4 16 0
20-24 4,106 4,000 20 13 3 5 41 4 12 0 8 0
25-29 3,162 3,036 12 3 15 8 52 6 20 2 8 0
30-34 2,994 2,854 16 12 11 5 64 10 10 3 9 0
35-39 2,704 2,557 15 8 14 10 62 8 15 3 12 0
40-44 2,473 2,352 9 8 14 6 44 9 18 3 10 0
45-49 2,600 2,462 5 11 15 3 64 8 20 2 10 0
50-54 2,129 2,017 8 8 8 4 59 6 3 4 12 0
55-60 1,571 1,495 6 18 1 3 17 8 8 2 13 0
60-64 1,297 1,223 8 20 3 3 12 8 5 3 12 0
65-69 968 930 7 14 2 0 0 4 3 0 8 0
70-74 735 717 3 4 1 1 2 0 4 0 3 0
75+ 1,048 1,026 6 7 0 0 0 2 2 1 4 0
Not Stated 23 0 1 2 1 1 0 0 0 0 3 15
Female 50,396 49,071 376 97 184 50 269 97 59 38 144 11
0- 4 6,059 5,932 74 6 11 6 18 3 0 0 9 0
5- 9 5,736 5,638 67 3 5 4 7 2 2 1 7 0
10-14 5,743 5,641 58 9 9 2 4 4 3 0 13 0
15-19 5,053 4,964 43 3 6 3 14 7 2 4 7 0
20-24 4,128 4,029 36 4 8 3 17 7 2 6 16 0
25-29 3,467 3,315 31 5 21 5 46 12 7 2 23 0
30-34 3,527 3,395 14 6 34 7 36 15 8 8 4 0
35-39 2,941 2,842 8 10 18 9 34 2 3 3 12 0
40-44 2,716 2,609 6 11 20 1 31 14 11 4 9 0
45-49 2,581 2,499 6 8 17 3 23 7 4 2 12 0
50-54 2,021 1,957 6 6 13 0 25 5 3 2 4 0
55-60 1,683 1,615 6 8 15 4 8 7 7 3 10 0
60-64 1,399 1,351 6 9 4 0 6 9 3 1 10 0
65-69 1,062 1,046 4 3 1 1 0 2 1 1 3 0
70-74 866 858 2 2 1 0 0 0 1 0 2 0
75+ 1,396 1,380 9 2 1 0 0 1 1 0 2 0
Not Stated 18 0 0 2 0 2 0 0 1 1 1 11

Tonga 2016 Census of Population and Housing
Tonga Statistics Department
43
Table G 13: Private households’ population by single year of age, sex and division
Age
Total Tongatapu Vava'u Ha'apai 'Eua Ongo Niua
Total Male Female Total Male Female Total Male Female Total Male Female Total Male Female Total Male Female
Total 99,600 49,525 50,075 73,750 36,547 37,203 13,632 6,792 6,840
6,085
3,086 2,999
4,918
2,459 2,459
1,215
641
574
<1 2,271 1,184 1,087 1,701 909 792 303 143 160 141 65 76 110 58 52 16 9 7
1 2,545 1,331 1,214 1,909 987 922 317 172 145 158 87 71 128 69 59 33 16 17
2 2,579 1,358 1,221 1,904 1,011 893 354 178 176 152 72 80 154 91 63 15 6 9
3 2,546 1,290 1,256 1,878 949 929 349 189 160 157 70 87 127 64 63 35 18 17
4 2,510 1,249 1,261 1,845 932 913 327 160 167 154 73 81 145 64 81 39 20 19
5 2,458 1,286 1,172 1,811 944 867 341 186 155 166 93 73 117 52 65 23 11 12
6 2,699 1,488 1,211 1,951 1,070 881 386 224 162 186 102 84 137 75 62 39 17 22
7 2,314 1,236 1,078 1,686 900 786 341 181 160 152 83 69 116 64 52 19 8 11
8 2,329 1,186 1,143 1,700 883 817 352 162 190 134 77 57 113 46 67 30 18 12
9 2,316 1,206 1,110 1,690 876 814 335 169 166 148 78 70 127 72 55 16 11 5
10 2,434 1,277 1,157 1,774 937 837 348 170 178 145 79 66 129 70 59 38 21 17
11 2,380 1,221 1,159 1,703 859 844 363 188 175 162 94 68 129 64 65 23 16 7
12 2,372 1,202 1,170 1,710 840 870 349 204 145 138 76 62 137 63 74 38 19 19
13 2,367 1,229 1,138 1,729 883 846 342 185 157 137 69 68 124 68 56 35 24 11
14 2,291 1,189 1,102 1,675 871 804 347 198 149 114 54 60 132 56 76 23 10 13
15 2,223 1,158 1,065 1,632 855 777 320 168 152 138 70 68 113 54 59 20 11 9
16 2,361 1,210 1,151 1,705 881 824 347 166 181 145 78 67 128 67 61 36 18 18
17 2,071 1,083 988 1,535 799 736 295 147 148 117 65 52 101 59 42 23 13 10
18 2,001 1,038 963 1,503 778 725 259 135 124 107 57 50 104 51 53 28 17 11
19 1,807 930 877 1,372 707 665 239 124 115 108 57 51 71 29 42 17 13 4
20 1,719 867 852 1,361 678 683 189 95 94 80 39 41 74 46 28 15 9 6
21 1,737 844 893 1,371 664 707 191 87 104 94 51 43 65 33 32 16 9 7
22 1,592 777 815 1,270 618 652 185 86 99 71 37 34 52 25 27 14 11 3
23 1,589 781 808 1,252 605 647 178 78 100 90 57 33 57 34 23 12 7 5
24 1,474 743 731 1,147 576 571 172 82 90 70 39 31 70 38 32 15 8 7
25 1,357 640 717 1,064 519 545 130 53 77 84 37 47 62 25 37 17 6 11
26 1,439 694 745 1,147 556 591 154 74 80 78 39 39 51 23 28 9 2 7

Tonga 2016 Census of Population and Housing
Tonga Statistics Department
44
Age
Total Tongatapu Vava'u Ha'apai 'Eua Ongo Niua
Total Male Female Total Male Female Total Male Female Total Male Female Total Male Female Total Male Female
27 1,235 565 670 943 437 506 140 58 82 74 31 43 62 29 33 16 10 6
28 1,256 594 662 978 471 507 146 60 86 74 40 34 41 15 26 17 8 9
29 1,201 562 639 903 433 470 154 68 86 69 29 40 62 27 35 13 5 8
30 1,372 623 749 1,063 476 587 157 73 84 85 42 43 52 25 27 15 7 8
31 1,283 594 689 983 454 529 142 63 79 80 36 44 66 35 31 12 6 6
32 1,263 558 705 966 436 530 153 65 88 65 27 38 66 26 40 13 4 9
33 1,299 579 720 984 438 546 164 78 86 81 32 49 63 27 36 7 4 3
34 1,186 557 629 922 442 480 140 54 86 61 25 36 52 29 23 11 7 4
35 1,112 507 605 836 371 465 128 67 61 74 37 37 59 25 34 15 7 8
36 1,190 590 600 876 428 448 162 81 81 89 53 36 49 17 32 14 11 3
37 1,122 537 585 878 415 463 119 58 61 62 30 32 49 28 21 14 6 8
38 1,102 521 581 828 401 427 137 60 77 78 33 45 47 21 26 12 6 6
39 1,023 479 544 761 348 413 135 69 66 65 34 31 49 24 25 13 4 9
40 1,058 498 560 787 363 424 139 73 66 65 30 35 58 28 30 9 4 5
41 1,015 495 520 739 352 387 149 76 73 67 36 31 46 27 19 14 4 10
42 1,017 486 531 753 369 384 133 60 73 73 28 45 47 23 24 11 6 5
43 1,035 494 541 749 350 399 161 73 88 69 40 29 44 26 18 12 5 7
44 986 448 538 703 312 391 155 73 82 63 31 32 48 26 22 17 6 11
45 1,020 521 499 762 379 383 150 76 74 53 29 24 44 29 15 11 8 3
46 1,106 541 565 784 375 409 175 88 87 67 40 27 67 31 36 13 7 6
47 1,033 517 516 745 373 372 149 71 78 64 37 27 61 29 32 14 7 7
48 1,033 488 545 752 359 393 141 70 71 78 32 46 52 25 27 10 2 8
49 896 461 435 654 330 324 133 76 57 49 22 27 46 24 22 14 9 5
50 982 502 480 743 382 361 113 53 60 58 32 26 57 29 28 11 6 5
51 881 461 420 628 321 307 140 78 62 52 29 23 44 22 22 17 11 6
52 762 404 358 535 288 247 135 71 64 51 27 24 29 13 16 12 5 7
53 713 346 367 514 249 265 115 59 56 41 18 23 30 11 19 13 9 4
54 741 364 377 539 258 281 100 55 45 38 19 19 50 27 23 14 5 9
55 634 316 318 433 216 217 98 49 49 49 26 23 40 19 21 14 6 8

Tonga 2016 Census of Population and Housing
Tonga Statistics Department
45
Age
Total Tongatapu Vava'u Ha'apai 'Eua Ongo Niua
Total Male Female Total Male Female Total Male Female Total Male Female Total Male Female Total Male Female
56 752 356 396 543 249 294 108 55 53 51 27 24 38 17 21 12 8 4
57 634 297 337 476 228 248 83 31 52 31 15 16 29 14 15 15 9 6
58 616 295 321 433 206 227 94 49 45 45 19 26 32 13 19 12 8 4
59 567 271 296 419 190 229 72 38 34 39 21 18 26 13 13 11 9 2
60 554 279 275 398 196 202 83 43 40 38 21 17 26 16 10 9 3 6
61 548 261 287 385 183 202 75 34 41 46 24 22 31 16 15 11 4 7
62 540 265 275 381 190 191 92 40 52 30 15 15 31 16 15 6 4 2
63 526 258 268 384 190 194 73 30 43 33 18 15 24 15 9 12 5 7
64 493 211 282 361 149 212 64 31 33 33 15 18 29 14 15 6 2 4
65 428 201 227 303 139 164 61 29 32 33 15 18 22 11 11 9 7 2
66 434 214 220 296 139 157 83 44 39 26 15 11 22 11 11 7 5 2
67 356 162 194 242 111 131 65 30 35 27 12 15 18 6 12 4 3 1
68 397 195 202 279 132 147 70 39 31 34 15 19 12 8 4 2 1 1
69 397 182 215 271 118 153 70 33 37 25 13 12 24 13 11 7 5 2
70 400 190 210 297 134 163 52 31 21 24 11 13 20 10 10 7 4 3
71 382 179 203 260 120 140 69 34 35 27 12 15 20 10 10 6 3 3
72 245 113 132 169 78 91 40 18 22 19 9 10 14 6 8 3 2 1
73 280 120 160 191 80 111 42 20 22 29 11 18 16 8 8 2 1 1
74 281 126 155 205 90 115 42 20 22 18 7 11 4 3 1 12 6 6
75 274 122 152 180 77 103 47 28 19 29 10 19 15 7 8 3 0 3
76 307 147 160 219 104 115 44 22 22 18 7 11 20 10 10 6 4 2
77 239 109 130 178 82 96 31 12 19 21 12 9 4 2 2 5 1 4
78 224 99 125 155 67 88 40 17 23 16 9 7 9 5 4 4 1 3
79 201 95 106 135 57 78 34 16 18 13 8 5 16 11 5 3 3 0
80 203 93 110 140 61 79 41 19 22 9 5 4 7 6 1 6 2 4
81 145 58 87 101 41 60 27 10 17 8 2 6 7 3 4 2 2 0
82 141 53 88 105 41 64 25 8 17 7 3 4 4 1 3 0 0 0
83 99 49 50 68 31 37 21 13 8 3 2 1 4 3 1 3 0 3
84 132 62 70 88 40 48 20 11 9 13 6 7 8 4 4 3 1 2

Tonga 2016 Census of Population and Housing
Tonga Statistics Department
46
Age
Total Tongatapu Vava'u Ha'apai 'Eua Ongo Niua
Total Male Female Total Male Female Total Male Female Total Male Female Total Male Female Total Male Female
85 116 43 73 85 29 56 19 8 11 4 1 3 5 2 3 3 3 0
86 80 23 57 55 18 37 16 3 13 1 0 1 8 2 6 0 0 0
87 69 24 45 52 21 31 11 2 9 4 1 3 2 0 2 0 0 0
88 45 23 22 32 18 14 9 4 5 3 1 2 1 0 1 0 0 0
89 47 14 33 31 9 22 7 2 5 3 1 2 6 2 4 0 0 0
90 32 9 23 15 3 12 10 4 6 2 0 2 4 1 3 1 1 0
91 21 6 15 13 3 10 6 2 4 0 0 0 1 0 1 1 1 0
92 25 6 19 17 5 12 4 0 4 1 0 1 3 1 2 0 0 0
93 12 3 9 8 2 6 2 1 1 1 0 1 1 0 1 0 0 0
94 9 1 8 6 0 6 2 1 1 1 0 1 0 0 0 0 0 0
95+ 12 6 6 8 3 5 2 1 1 0 0 0 2 2 0 0 0 0
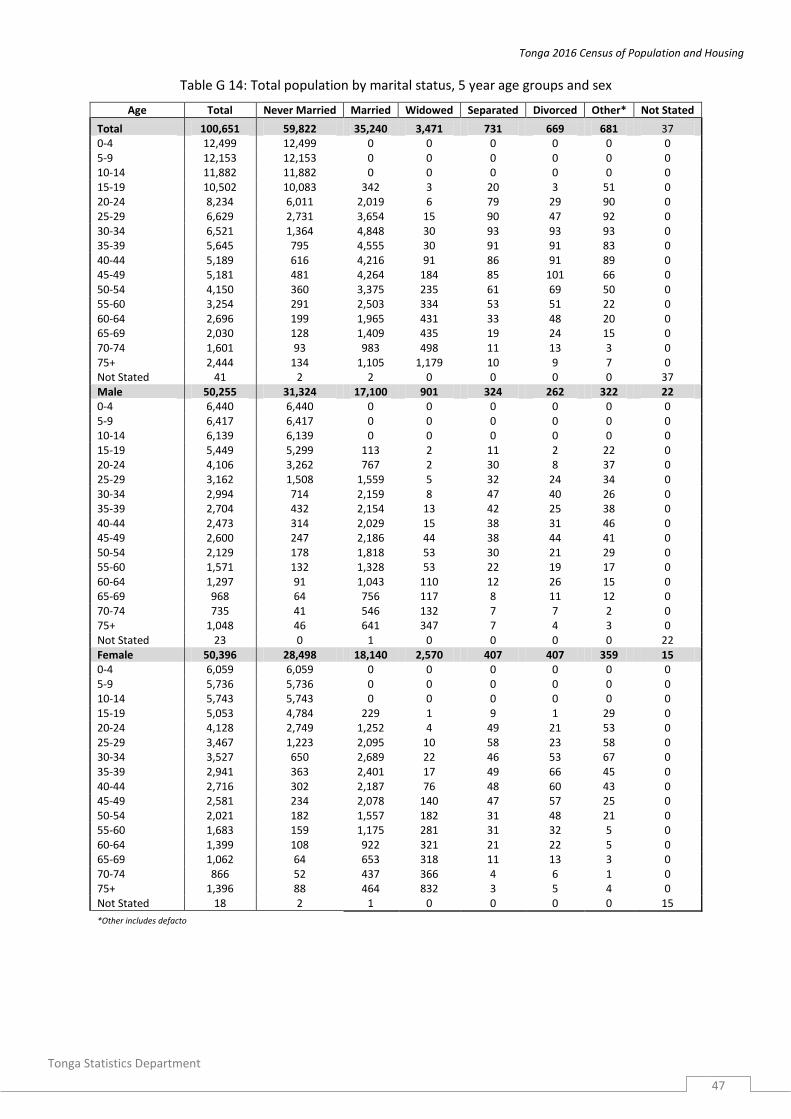
Tonga 2016 Census of Population and Housing
Tonga Statistics Department
47
Table G 14: Total population by marital status, 5 year age groups and sex
Age Total Never Married Married Widowed Separated Divorced Other* Not Stated
Total 100,651 59,822 35,240 3,471 731 669 681 37 0-4 12,499 12,499 0 0 0 0 0 0 5-9 12,153 12,153 0 0 0 0 0 0 10-14 11,882 11,882 0 0 0 0 0 0 15-19 10,502 10,083 342 3 20 3 51 0 20-24 8,234 6,011 2,019 6 79 29 90 0 25-29 6,629 2,731 3,654 15 90 47 92 0 30-34 6,521 1,364 4,848 30 93 93 93 0 35-39 5,645 795 4,555 30 91 91 83 0 40-44 5,189 616 4,216 91 86 91 89 0 45-49 5,181 481 4,264 184 85 101 66 0 50-54 4,150 360 3,375 235 61 69 50 0 55-60 3,254 291 2,503 334 53 51 22 0 60-64 2,696 199 1,965 431 33 48 20 0 65-69 2,030 128 1,409 435 19 24 15 0 70-74 1,601 93 983 498 11 13 3 0 75+ 2,444 134 1,105 1,179 10 9 7 0 Not Stated 41 2 2 0 0 0 0 37 Male 50,255 31,324 17,100 901 324 262 322 22 0-4 6,440 6,440 0 0 0 0 0 0 5-9 6,417 6,417 0 0 0 0 0 0 10-14 6,139 6,139 0 0 0 0 0 0 15-19 5,449 5,299 113 2 11 2 22 0 20-24 4,106 3,262 767 2 30 8 37 0 25-29 3,162 1,508 1,559 5 32 24 34 0 30-34 2,994 714 2,159 8 47 40 26 0 35-39 2,704 432 2,154 13 42 25 38 0 40-44 2,473 314 2,029 15 38 31 46 0 45-49 2,600 247 2,186 44 38 44 41 0 50-54 2,129 178 1,818 53 30 21 29 0 55-60 1,571 132 1,328 53 22 19 17 0 60-64 1,297 91 1,043 110 12 26 15 0 65-69 968 64 756 117 8 11 12 0 70-74 735 41 546 132 7 7 2 0 75+ 1,048 46 641 347 7 4 3 0 Not Stated 23 0 1 0 0 0 0 22 Female 50,396 28,498 18,140 2,570 407 407 359 15 0-4 6,059 6,059 0 0 0 0 0 0 5-9 5,736 5,736 0 0 0 0 0 0 10-14 5,743 5,743 0 0 0 0 0 0 15-19 5,053 4,784 229 1 9 1 29 0 20-24 4,128 2,749 1,252 4 49 21 53 0 25-29 3,467 1,223 2,095 10 58 23 58 0 30-34 3,527 650 2,689 22 46 53 67 0 35-39 2,941 363 2,401 17 49 66 45 0 40-44 2,716 302 2,187 76 48 60 43 0 45-49 2,581 234 2,078 140 47 57 25 0 50-54 2,021 182 1,557 182 31 48 21 0 55-60 1,683 159 1,175 281 31 32 5 0 60-64 1,399 108 922 321 21 22 5 0 65-69 1,062 64 653 318 11 13 3 0 70-74 866 52 437 366 4 6 1 0 75+ 1,396 88 464 832 3 5 4 0 Not Stated 18 2 1 0 0 0 0 15
*Other includes defacto

Tonga 2016 Census of Population and Housing
Tonga Statistics Department
48
Table G 15: Tongan (Tongan/Part-Tongan ethnic origin) population by marital status, 5 year age groups and sex
Age Total Never Married Legally Married Widowed Separated Divorced Other* Not Stated
Total 98,455 59,017 34,034 3,431 710 640 622 1 0-4 12,386 12,386 0 0 0 0 0 0 5-9 12,076 12,076 0 0 0 0 0 0 10-14 11,794 11,794 0 0 0 0 0 0 15-19 10,384 9,968 340 3 20 3 50 0 20-24 8,085 5,902 1,987 5 78 29 84 0 25-29 6,394 2,618 3,545 14 89 46 82 0 30-34 6,279 1,305 4,679 30 91 91 83 0 35-39 5,422 761 4,379 30 87 91 74 0 40-44 4,976 595 4,038 88 83 86 86 0 45-49 4,972 455 4,101 179 81 95 61 0 50-54 3,988 347 3,241 231 59 67 43 0 55-60 3,122 273 2,400 330 53 47 19 0 60-64 2,588 193 1,880 423 31 45 16 0 65-69 1,987 124 1,381 431 18 19 14 0 70-74 1,580 89 969 496 10 13 3 0 75+ 2,421 131 1,094 1,171 10 8 7 0 Not Stated 1 0 0 0 0 0 0 1
Male 49,008 30,864 16,404 886 311 248 294 1 0-4 6,380 6,380 0 0 0 0 0 0 5-9 6,371 6,371 0 0 0 0 0 0 10-14 6,095 6,095 0 0 0 0 0 0 15-19 5,377 5,227 113 2 11 2 22 0 20-24 4,020 3,190 754 1 30 8 37 0 25-29 3,048 1,451 1,506 5 32 23 31 0 30-34 2,870 682 2,072 8 46 39 23 0 35-39 2,572 409 2,053 13 40 25 32 0 40-44 2,361 302 1,937 13 36 28 45 0 45-49 2,467 235 2,076 41 36 41 38 0 50-54 2,025 169 1,730 52 28 21 25 0 55-60 1,501 123 1,273 52 22 17 14 0 60-64 1,231 88 989 109 10 24 11 0 65-69 937 60 733 117 7 9 11 0 70-74 720 38 536 131 6 7 2 0 75+ 1,032 44 632 342 7 4 3 0 Not Stated 1 0 0 0 0 0 0 1
Female 49,447 28,153 17,630 2,545 399 392 328 0 0-4 6,006 6,006 0 0 0 0 0 0 5-9 5,705 5,705 0 0 0 0 0 0 10-14 5,699 5,699 0 0 0 0 0 0 15-19 5,007 4,741 227 1 9 1 28 0 20-24 4,065 2,712 1,233 4 48 21 47 0 25-29 3,346 1,167 2,039 9 57 23 51 0 30-34 3,409 623 2,607 22 45 52 60 0 35-39 2,850 352 2,326 17 47 66 42 0 40-44 2,615 293 2,101 75 47 58 41 0 45-49 2,505 220 2,025 138 45 54 23 0 50-54 1,963 178 1,511 179 31 46 18 0 55-60 1,621 150 1,127 278 31 30 5 0 60-64 1,357 105 891 314 21 21 5 0 65-69 1,050 64 648 314 11 10 3 0 70-74 860 51 433 365 4 6 1 0 75+ 1,389 87 462 829 3 4 4 0 Not Stated 0 0 0 0 0 0 0 0
*Other includes defacto
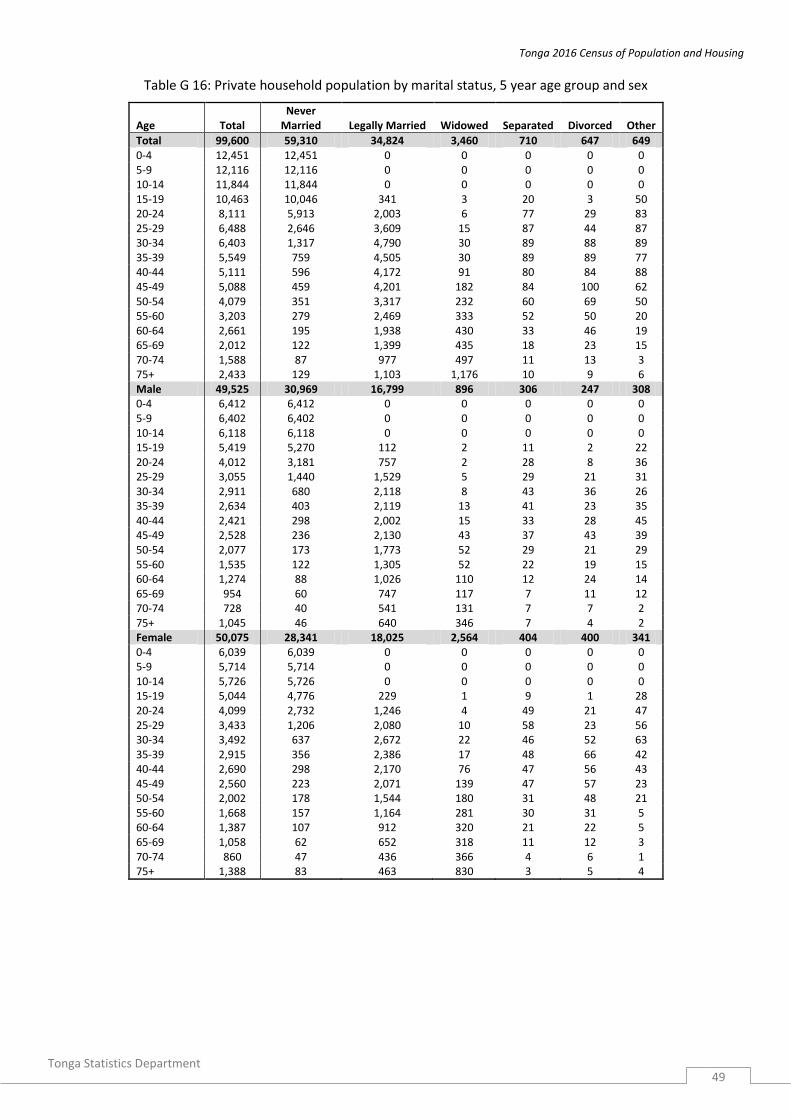
Tonga 2016 Census of Population and Housing
Tonga Statistics Department
49
Table G 16: Private household population by marital status, 5 year age group and sex
Age Total Never
Married Legally Married Widowed Separated Divorced Other
Total 99,600 59,310 34,824 3,460 710 647 649 0-4 12,451 12,451 0 0 0 0 0 5-9 12,116 12,116 0 0 0 0 0 10-14 11,844 11,844 0 0 0 0 0 15-19 10,463 10,046 341 3 20 3 50 20-24 8,111 5,913 2,003 6 77 29 83 25-29 6,488 2,646 3,609 15 87 44 87 30-34 6,403 1,317 4,790 30 89 88 89 35-39 5,549 759 4,505 30 89 89 77 40-44 5,111 596 4,172 91 80 84 88 45-49 5,088 459 4,201 182 84 100 62 50-54 4,079 351 3,317 232 60 69 50 55-60 3,203 279 2,469 333 52 50 20 60-64 2,661 195 1,938 430 33 46 19 65-69 2,012 122 1,399 435 18 23 15 70-74 1,588 87 977 497 11 13 3 75+ 2,433 129 1,103 1,176 10 9 6 Male 49,525 30,969 16,799 896 306 247 308 0-4 6,412 6,412 0 0 0 0 0 5-9 6,402 6,402 0 0 0 0 0 10-14 6,118 6,118 0 0 0 0 0 15-19 5,419 5,270 112 2 11 2 22 20-24 4,012 3,181 757 2 28 8 36 25-29 3,055 1,440 1,529 5 29 21 31 30-34 2,911 680 2,118 8 43 36 26 35-39 2,634 403 2,119 13 41 23 35 40-44 2,421 298 2,002 15 33 28 45 45-49 2,528 236 2,130 43 37 43 39 50-54 2,077 173 1,773 52 29 21 29 55-60 1,535 122 1,305 52 22 19 15 60-64 1,274 88 1,026 110 12 24 14 65-69 954 60 747 117 7 11 12 70-74 728 40 541 131 7 7 2 75+ 1,045 46 640 346 7 4 2 Female 50,075 28,341 18,025 2,564 404 400 341 0-4 6,039 6,039 0 0 0 0 0 5-9 5,714 5,714 0 0 0 0 0 10-14 5,726 5,726 0 0 0 0 0 15-19 5,044 4,776 229 1 9 1 28 20-24 4,099 2,732 1,246 4 49 21 47 25-29 3,433 1,206 2,080 10 58 23 56 30-34 3,492 637 2,672 22 46 52 63 35-39 2,915 356 2,386 17 48 66 42 40-44 2,690 298 2,170 76 47 56 43 45-49 2,560 223 2,071 139 47 57 23 50-54 2,002 178 1,544 180 31 48 21 55-60 1,668 157 1,164 281 30 31 5 60-64 1,387 107 912 320 21 22 5 65-69 1,058 62 652 318 11 12 3 70-74 860 47 436 366 4 6 1 75+ 1,388 83 463 830 3 5 4
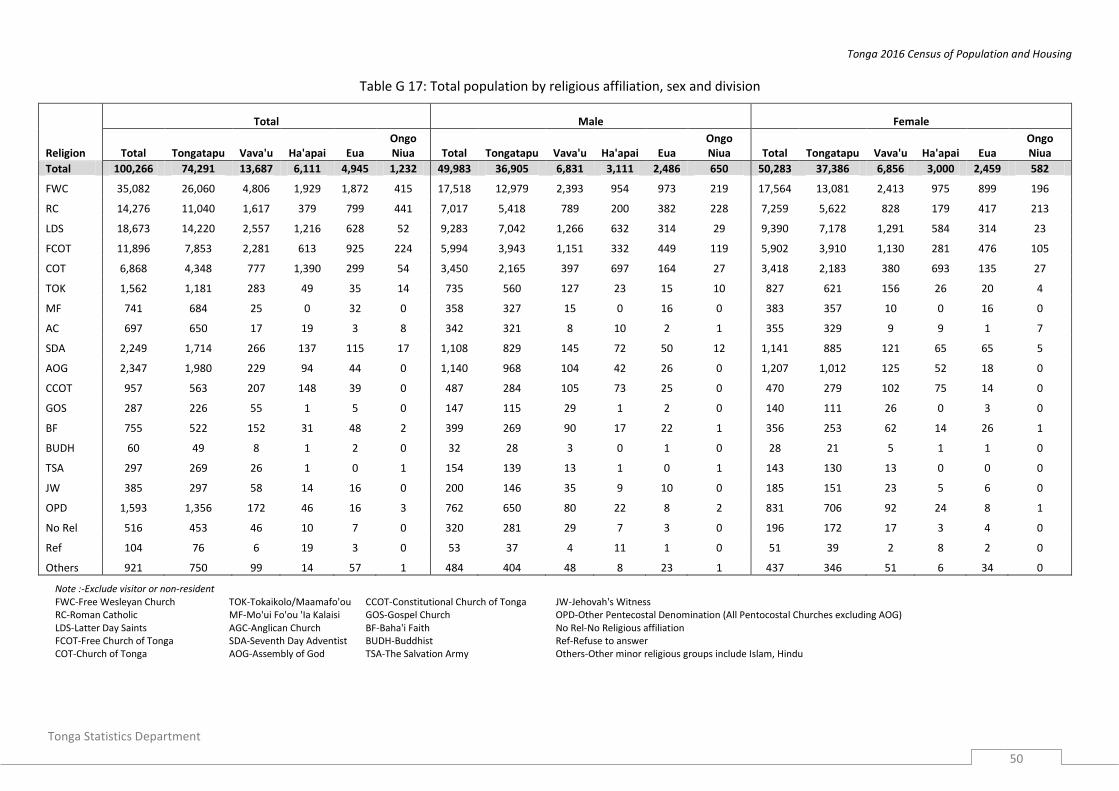
Tonga 2016 Census of Population and Housing
Tonga Statistics Department
50
Table G 17: Total population by religious affiliation, sex and division
Religion
Total Male Female
Total Tongatapu Vava'u Ha'apai Eua Ongo Niua Total Tongatapu Vava'u Ha'apai Eua
Ongo Niua Total Tongatapu Vava'u Ha'apai Eua
Ongo Niua
Total 100,266 74,291 13,687 6,111 4,945 1,232 49,983 36,905 6,831 3,111 2,486 650 50,283 37,386 6,856 3,000 2,459 582
FWC 35,082 26,060 4,806 1,929 1,872 415 17,518 12,979 2,393 954 973 219 17,564 13,081 2,413 975 899 196
RC 14,276 11,040 1,617 379 799 441 7,017 5,418 789 200 382 228 7,259 5,622 828 179 417 213
LDS 18,673 14,220 2,557 1,216 628 52 9,283 7,042 1,266 632 314 29 9,390 7,178 1,291 584 314 23
FCOT 11,896 7,853 2,281 613 925 224 5,994 3,943 1,151 332 449 119 5,902 3,910 1,130 281 476 105
COT 6,868 4,348 777 1,390 299 54 3,450 2,165 397 697 164 27 3,418 2,183 380 693 135 27
TOK 1,562 1,181 283 49 35 14 735 560 127 23 15 10 827 621 156 26 20 4
MF 741 684 25 0 32 0 358 327 15 0 16 0 383 357 10 0 16 0
AC 697 650 17 19 3 8 342 321 8 10 2 1 355 329 9 9 1 7
SDA 2,249 1,714 266 137 115 17 1,108 829 145 72 50 12 1,141 885 121 65 65 5
AOG 2,347 1,980 229 94 44 0 1,140 968 104 42 26 0 1,207 1,012 125 52 18 0
CCOT 957 563 207 148 39 0 487 284 105 73 25 0 470 279 102 75 14 0
GOS 287 226 55 1 5 0 147 115 29 1 2 0 140 111 26 0 3 0
BF 755 522 152 31 48 2 399 269 90 17 22 1 356 253 62 14 26 1
BUDH 60 49 8 1 2 0 32 28 3 0 1 0 28 21 5 1 1 0
TSA 297 269 26 1 0 1 154 139 13 1 0 1 143 130 13 0 0 0
JW 385 297 58 14 16 0 200 146 35 9 10 0 185 151 23 5 6 0
OPD 1,593 1,356 172 46 16 3 762 650 80 22 8 2 831 706 92 24 8 1
No Rel 516 453 46 10 7 0 320 281 29 7 3 0 196 172 17 3 4 0
Ref 104 76 6 19 3 0 53 37 4 11 1 0 51 39 2 8 2 0
Others 921 750 99 14 57 1 484 404 48 8 23 1 437 346 51 6 34 0
Note :-Exclude visitor or non-resident
FWC‐Free Wesleyan Church TOK‐Tokaikolo/Maamafo'ou CCOT‐Constitutional Church of Tonga JW‐Jehovah's Witness RC‐Roman Catholic MF-Mo'ui Fo'ou 'Ia Kalaisi GOS‐Gospel Church OPD‐Other Pentecostal Denomination (All Pentocostal Churches excluding AOG) LDS‐Latter Day Saints AGC‐Anglican Church BF‐Baha'i Faith No Rel‐No Religious affiliation
FCOT‐Free Church of Tonga SDA‐Seventh Day Adventist BUDH‐Buddhist Ref‐Refuse to answer
COT‐Church of Tonga AOG‐Assembly of God TSA‐The Salvation Army Others‐Other minor religious groups include Islam, Hindu

Tonga 2016 Census of Population and Housing
Tonga Statistics Department
51
Table G 18: Total Population by Religious affiliation, division and district
District Total FWC RC LDS FCOT COT TOK MF AGC SDA AOG CCOT GOS BF BUDH TSA JW OPD NO Rel Ref Others
Total 100,266 35,082 14,276 18,673 11,896 6,868 1,562 741 697 2,249 2,347 957 287 755 60 297 385 1,593 516 104 921
Tongatapu 74,291 26,060 11,040 14,220 7,853 4,348 1,181 684 650 1,714 1,980 563 226 522 49 269 297 1,356 453 76 750
Kolofo'ou 17,787 5,255 4,000 2,222 1,591 1,391 221 95 509 388 578 216 107 129 20 54 78 430 181 26 296
Kolomotu'a 17,066 7,506 1,303 2,327 1,684 997 565 221 123 405 489 162 39 158 16 49 115 474 164 25 244
Vaini 12,995 3,570 2,008 3,586 1,409 680 153 195 8 660 172 66 19 70 4 54 53 155 37 16 80
Tatakamotonga 7,034 3,134 732 1,249 822 162 104 35 2 106 245 82 6 78 1 74 2 110 21 4 65
Lapaha 7,122 1,844 1,782 1,460 923 496 22 106 1 69 201 7 47 22 0 36 4 53 28 4 17
Nukunuku 8,008 2,739 1,061 2,536 696 414 46 15 5 23 249 18 0 27 6 0 45 89 7 1 31
Kolovai 4,279 2,012 154 840 728 208 70 17 2 63 46 12 8 38 2 2 0 45 15 0 17
Vava'u 13,687 4,806 1,617 2,557 2,281 777 283 25 17 266 229 207 55 152 8 26 58 172 46 6 99
Neiafu 5,194 1,740 939 833 598 232 66 13 12 169 82 170 3 86 6 9 27 106 27 5 71
Pangaimotu 1,237 320 273 181 256 108 5 0 5 36 9 6 0 16 0 2 0 1 7 0 12
Hahake 2,028 733 127 688 422 21 4 0 0 4 3 0 0 15 0 0 1 7 2 0 1
Leimatu'a 2,503 833 220 424 622 94 61 0 0 13 67 0 52 24 0 8 23 49 0 0 13
Hihifo 1,989 849 49 321 266 247 130 12 0 43 37 0 0 11 0 7 7 9 0 0 1
Motu 736 331 9 110 117 75 17 0 0 1 31 31 0 0 2 0 0 0 10 1 1
Ha'apai 6,111 1,929 379 1,216 613 1,390 49 0 19 137 94 148 1 31 1 1 14 46 10 19 14
Pangai 2,200 708 278 320 173 430 13 0 17 92 49 16 1 13 1 1 14 43 1 19 11
Foa 1,383 412 17 425 149 235 20 0 1 4 33 82 0 4 0 0 0 0 1 0 0
Lulunga 923 167 22 157 104 397 0 0 0 36 5 33 0 0 0 0 0 0 2 0 0
Mu'omu'a 432 227 18 65 35 70 7 0 0 0 4 0 0 0 0 0 0 0 4 0 2
Ha`ano 478 117 1 107 74 164 9 0 0 3 3 0 0 0 0 0 0 0 0 0 0
'Uiha 695 298 43 142 78 94 0 0 1 2 0 17 0 14 0 0 0 3 2 0 1
'Eua 4,945 1,872 799 628 925 299 35 32 3 115 44 39 5 48 2 0 16 16 7 3 57
'Eua Prope 2,800 1,110 106 447 662 207 34 18 1 77 37 38 5 9 2 0 16 11 5 0 15
'Eua fo'ou 2,145 762 693 181 263 92 1 14 2 38 7 1 0 39 0 0 0 5 2 3 42
Ongo Niua 1,232 415 441 52 224 54 14 0 8 17 0 0 0 2 0 1 0 3 0 0 1
Niuatoputapu 739 183 320 35 113 54 7 0 8 14 0 0 0 0 0 1 0 3 0 0 1
Niuafo'ou 493 232 121 17 111 0 7 0 0 3 0 0 0 2 0 0 0 0 0 0 0
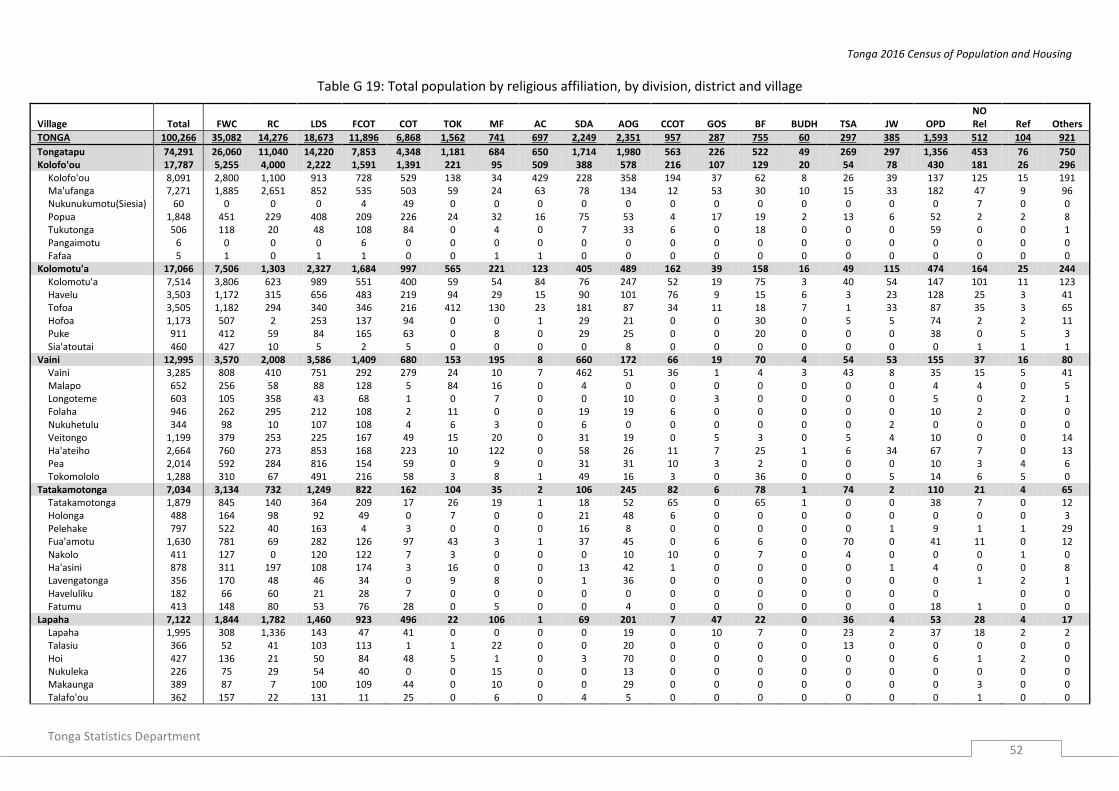
Tonga 2016 Census of Population and Housing
Tonga Statistics Department
52
Table G 19: Total population by religious affiliation, by division, district and village
Village Total FWC RC LDS FCOT COT TOK MF AC SDA AOG CCOT GOS BF BUDH TSA JW OPD NO Rel Ref Others
TONGA 100,266 35,082 14,276 18,673 11,896 6,868 1,562 741 697 2,249 2,351 957 287 755 60 297 385 1,593 512 104 921
Tongatapu 74,291 26,060 11,040 14,220 7,853 4,348 1,181 684 650 1,714 1,980 563 226 522 49 269 297 1,356 453 76 750 Kolofo'ou 17,787 5,255 4,000 2,222 1,591 1,391 221 95 509 388 578 216 107 129 20 54 78 430 181 26 296
Kolofo'ou 8,091 2,800 1,100 913 728 529 138 34 429 228 358 194 37 62 8 26 39 137 125 15 191 Ma'ufanga 7,271 1,885 2,651 852 535 503 59 24 63 78 134 12 53 30 10 15 33 182 47 9 96 Nukunukumotu(Siesia) 60 0 0 0 4 49 0 0 0 0 0 0 0 0 0 0 0 0 7 0 0 Popua 1,848 451 229 408 209 226 24 32 16 75 53 4 17 19 2 13 6 52 2 2 8 Tukutonga 506 118 20 48 108 84 0 4 0 7 33 6 0 18 0 0 0 59 0 0 1 Pangaimotu 6 0 0 0 6 0 0 0 0 0 0 0 0 0 0 0 0 0 0 0 0 Fafaa 5 1 0 1 1 0 0 1 1 0 0 0 0 0 0 0 0 0 0 0 0
Kolomotu'a 17,066 7,506 1,303 2,327 1,684 997 565 221 123 405 489 162 39 158 16 49 115 474 164 25 244 Kolomotu'a 7,514 3,806 623 989 551 400 59 54 84 76 247 52 19 75 3 40 54 147 101 11 123 Havelu 3,503 1,172 315 656 483 219 94 29 15 90 101 76 9 15 6 3 23 128 25 3 41 Tofoa 3,505 1,182 294 340 346 216 412 130 23 181 87 34 11 18 7 1 33 87 35 3 65 Hofoa 1,173 507 2 253 137 94 0 0 1 29 21 0 0 30 0 5 5 74 2 2 11 Puke 911 412 59 84 165 63 0 8 0 29 25 0 0 20 0 0 0 38 0 5 3 Sia'atoutai 460 427 10 5 2 5 0 0 0 0 8 0 0 0 0 0 0 0 1 1 1
Vaini 12,995 3,570 2,008 3,586 1,409 680 153 195 8 660 172 66 19 70 4 54 53 155 37 16 80 Vaini 3,285 808 410 751 292 279 24 10 7 462 51 36 1 4 3 43 8 35 15 5 41 Malapo 652 256 58 88 128 5 84 16 0 4 0 0 0 0 0 0 0 4 4 0 5 Longoteme 603 105 358 43 68 1 0 7 0 0 10 0 3 0 0 0 0 5 0 2 1 Folaha 946 262 295 212 108 2 11 0 0 19 19 6 0 0 0 0 0 10 2 0 0 Nukuhetulu 344 98 10 107 108 4 6 3 0 6 0 0 0 0 0 0 2 0 0 0 0 Veitongo 1,199 379 253 225 167 49 15 20 0 31 19 0 5 3 0 5 4 10 0 0 14 Ha'ateiho 2,664 760 273 853 168 223 10 122 0 58 26 11 7 25 1 6 34 67 7 0 13 Pea 2,014 592 284 816 154 59 0 9 0 31 31 10 3 2 0 0 0 10 3 4 6 Tokomololo 1,288 310 67 491 216 58 3 8 1 49 16 3 0 36 0 0 5 14 6 5 0
Tatakamotonga 7,034 3,134 732 1,249 822 162 104 35 2 106 245 82 6 78 1 74 2 110 21 4 65 Tatakamotonga 1,879 845 140 364 209 17 26 19 1 18 52 65 0 65 1 0 0 38 7 0 12 Holonga 488 164 98 92 49 0 7 0 0 21 48 6 0 0 0 0 0 0 0 0 3 Pelehake 797 522 40 163 4 3 0 0 0 16 8 0 0 0 0 0 1 9 1 1 29 Fua'amotu 1,630 781 69 282 126 97 43 3 1 37 45 0 6 6 0 70 0 41 11 0 12 Nakolo 411 127 0 120 122 7 3 0 0 0 10 10 0 7 0 4 0 0 0 1 0 Ha'asini 878 311 197 108 174 3 16 0 0 13 42 1 0 0 0 0 1 4 0 0 8 Lavengatonga 356 170 48 46 34 0 9 8 0 1 36 0 0 0 0 0 0 0 1 2 1 Haveluliku 182 66 60 21 28 7 0 0 0 0 0 0 0 0 0 0 0 0 0 0 Fatumu 413 148 80 53 76 28 0 5 0 0 4 0 0 0 0 0 0 18 1 0 0
Lapaha 7,122 1,844 1,782 1,460 923 496 22 106 1 69 201 7 47 22 0 36 4 53 28 4 17 Lapaha 1,995 308 1,336 143 47 41 0 0 0 0 19 0 10 7 0 23 2 37 18 2 2 Talasiu 366 52 41 103 113 1 1 22 0 0 20 0 0 0 0 13 0 0 0 0 0 Hoi 427 136 21 50 84 48 5 1 0 3 70 0 0 0 0 0 0 6 1 2 0 Nukuleka 226 75 29 54 40 0 0 15 0 0 13 0 0 0 0 0 0 0 0 0 0 Makaunga 389 87 7 100 109 44 0 10 0 0 29 0 0 0 0 0 0 0 3 0 0 Talafo'ou 362 157 22 131 11 25 0 6 0 4 5 0 0 0 0 0 0 0 1 0 0

Tonga 2016 Census of Population and Housing
Tonga Statistics Department
53
Village Total FWC RC LDS FCOT COT TOK MF AC SDA AOG CCOT GOS BF BUDH TSA JW OPD NO Rel Ref Others
Manuka 272 198 0 24 25 0 0 8 0 0 0 0 15 0 0 0 0 0 2 0 0 Navutoka 717 215 26 204 76 103 0 20 0 28 10 1 13 7 0 0 0 6 3 0 5 Kolonga 1,135 280 213 271 204 73 16 7 1 18 23 0 9 8 0 0 0 4 0 0 8 Afa 478 119 15 159 125 35 0 9 0 2 12 0 0 0 0 0 0 0 0 0 2 Niutoua 671 198 66 194 71 126 0 0 0 14 0 0 0 0 0 0 2 0 0 0 0 Eueiki 83 19 6 27 17 0 0 8 0 0 0 6 0 0 0 0 0 0 0 0 0 Fukave 1 0 0 0 1 0 0 0 0 0 0 0 0 0 0 0 0 0 0 0 0
Nukunuku 8,008 2,739 1,061 2,536 696 414 46 15 5 23 249 18 0 27 6 0 45 89 7 1 31 NUkunuku 1,987 1,075 43 330 194 186 3 2 3 9 56 4 0 10 6 0 3 54 2 0 7 Matahau 570 78 122 360 0 9 0 0 0 0 0 0 0 1 0 0 0 0 0 0 0 Matafonua 235 37 102 47 24 8 0 0 0 10 3 0 0 2 0 0 0 1 1 0 0 Fatai 304 74 29 58 50 17 1 0 0 0 55 0 0 0 0 0 15 0 0 0 5 Lakepa 360 132 14 120 40 19 0 0 0 0 17 10 0 0 0 0 6 0 2 0 0 Vaotu'u 488 260 19 108 76 3 0 0 1 2 0 0 0 12 0 0 5 0 0 0 2 Utulau 622 262 104 166 75 0 0 7 0 2 0 3 0 0 0 0 0 2 0 0 1 Ha'alalo 605 176 117 250 49 0 0 0 0 0 8 1 0 0 0 0 1 0 0 0 3 Ha'akame 742 78 138 432 57 7 9 0 0 0 10 0 0 2 0 0 0 3 2 1 3 Houma 2,095 567 373 665 131 165 33 6 1 0 100 0 0 0 0 0 15 29 0 0 10
Kolovai 4,279 2,012 154 840 728 208 70 17 2 63 46 12 8 38 2 2 0 45 15 0 17 Kolovai 618 359 34 98 68 8 0 7 0 1 4 0 1 0 0 0 0 21 6 0 11 Te'ekiu 577 259 50 182 49 4 6 4 0 0 5 1 0 14 0 0 0 0 1 0 2 Masilamea 228 124 0 18 24 47 6 0 0 0 0 0 0 0 0 0 0 7 2 0 0 Fahefa 431 184 19 67 65 27 6 0 2 45 9 0 7 0 0 0 0 0 0 0 0 Ha'utu 253 113 7 83 17 22 3 0 0 1 5 0 0 0 2 0 0 0 0 0 0 Kala'au 152 63 0 9 2 58 0 0 0 16 4 0 0 0 0 0 0 0 0 0 0 Fo'ui 657 225 3 205 179 1 15 0 0 0 5 11 0 8 0 0 0 3 0 0 2 Ha'avakatolo 195 172 0 14 5 4 0 0 0 0 0 0 0 0 0 0 0 0 0 0 0 Ahau 386 247 24 56 11 6 29 6 0 0 0 0 0 1 0 2 0 3 1 0 0 Kanokupolu 333 129 12 54 91 29 0 0 0 0 13 0 0 0 0 0 0 0 4 0 1 Ha'atafu 269 54 5 45 129 2 5 0 0 0 1 0 0 15 0 0 0 11 1 0 1 Atata 180 83 0 9 88 0 0 0 0 0 0 0 0 0 0 0 0 0 0 0 0
Vava'u 13,687 4,806 1,617 2,557 2,281 777 283 25 17 266 229 207 55 152 8 26 58 172 46 6 99 Neiafu 5,194 1,740 939 833 598 232 66 13 12 169 82 170 3 86 6 9 27 106 27 5 71
Neiafu 3,677 1,102 805 604 424 141 9 13 12 104 57 163 0 72 1 9 27 84 19 5 26 Makave 399 205 75 10 45 2 33 0 0 12 14 3 0 0 0 0 0 0 0 0 0 Toula 357 94 56 44 58 35 24 0 0 1 6 1 0 0 5 0 0 22 8 0 3 Utui 303 108 0 66 35 1 0 0 0 52 0 0 0 0 0 0 0 0 0 0 41 Ofu 120 102 0 10 0 7 0 0 0 0 0 0 0 0 0 0 0 0 0 0 1 Okoa 261 88 1 89 32 26 0 0 0 0 5 3 3 14 0 0 0 0 0 0 0 Olo'ua 77 41 2 10 4 20 0 0 0 0 0 0 0 0 0 0 0 0 0 0 0
Pangaimotu 1,237 320 273 181 256 108 5 0 5 36 9 6 0 16 0 2 0 1 7 0 12 Pangaimotu 657 159 231 75 46 105 0 0 0 9 7 2 0 16 0 2 0 1 4 0 0 Utulei 116 76 33 0 0 0 2 0 5 0 0 0 0 0 0 0 0 0 0 0 0 Nga'unoho 179 44 3 67 61 0 0 0 0 0 0 4 0 0 0 0 0 0 0 0 0 Utungake 283 41 5 39 149 3 3 0 0 27 2 0 0 0 0 0 0 0 2 0 12 Tapana 2 0 1 0 0 0 0 0 0 0 0 0 0 0 0 0 0 0 1 0 0

Tonga 2016 Census of Population and Housing
Tonga Statistics Department
54
Village Total FWC RC LDS FCOT COT TOK MF AC SDA AOG CCOT GOS BF BUDH TSA JW OPD NO Rel Ref Others
Hahake 2,028 733 127 688 422 21 4 0 0 4 3 0 0 15 0 0 1 7 2 0 1 Ha'alaufuli 377 98 1 206 67 0 0 0 0 0 0 0 0 0 0 0 1 4 0 0 0 Ha'akio 125 100 7 18 0 0 0 0 0 0 0 0 0 0 0 0 0 0 0 0 0 Houma 141 110 4 23 3 0 1 0 0 0 0 0 0 0 0 0 0 0 0 0 0 Mangia 102 72 1 17 0 4 0 0 0 4 3 0 0 0 0 0 0 0 0 0 1 Ta'anea 644 163 101 258 110 4 3 0 0 0 0 0 0 0 0 0 0 3 2 0 0 Tu'anekivale 367 137 0 89 126 0 0 0 0 0 0 0 0 15 0 0 0 0 0 0 0 Koloa 142 39 8 50 33 12 0 0 0 0 0 0 0 0 0 0 0 0 0 0 0 Holeva 130 14 5 27 83 1 0 0 0 0 0 0 0 0 0 0 0 0 0 0 0
Leimatu'a 2,503 833 220 424 622 94 61 0 0 13 67 0 52 24 0 8 23 49 0 0 13 Leimatu'a 1,173 552 127 146 147 43 52 0 0 8 41 0 52 0 0 3 1 0 0 0 1 Holonga 401 146 5 74 85 0 8 0 0 2 21 0 0 24 0 0 0 29 0 0 7 Feletoa 402 54 88 99 129 17 0 0 0 0 5 0 0 0 0 0 0 10 0 0 0 Mataika 527 81 0 105 261 34 1 0 0 3 0 0 0 0 0 5 22 10 0 0 5
Hihifo 1,989 849 49 321 266 247 130 12 0 43 37 0 0 11 0 7 7 9 0 0 1 Longomapu 546 323 14 64 2 128 0 0 0 1 0 0 0 0 0 7 7 0 0 0 0 Taoa 516 342 0 39 0 6 117 12 0 0 0 0 0 0 0 0 0 0 0 0 0 Tefisi 532 66 23 139 165 59 10 0 0 23 37 0 0 1 0 0 0 9 0 0 0 Vaimalo 112 46 0 0 53 0 3 0 0 0 0 0 0 10 0 0 0 0 0 0 0 Tu'anuku 283 72 12 79 46 54 0 0 0 19 0 0 0 0 0 0 0 0 0 0 1
Motu 736 331 9 110 117 75 17 0 0 1 31 31 0 0 2 0 0 0 10 1 1 Kapa 42 34 3 0 5 0 0 0 0 0 0 0 0 0 0 0 0 0 0 0 0 Falevai 79 47 0 3 18 11 0 0 0 0 0 0 0 0 0 0 0 0 0 0 0 Otea 96 39 0 57 0 0 0 0 0 0 0 0 0 0 0 0 0 0 0 0 0 Lape 16 16 0 0 0 0 0 0 0 0 0 0 0 0 0 0 0 0 0 0 0 Matamaka 79 14 0 6 26 19 0 0 0 1 13 0 0 0 0 0 0 0 0 0 0 Nuapapu 98 48 0 19 9 4 0 0 0 0 18 0 0 0 0 0 0 0 0 0 0 Ovaka 97 53 1 5 36 0 0 0 0 0 0 0 0 0 0 0 0 0 0 1 1 Taunga 28 28 0 0 0 0 0 0 0 0 0 0 0 0 0 0 0 0 0 0 0 Hunga 178 44 5 15 23 41 17 0 0 0 0 31 0 0 2 0 0 0 0 0 0 Foeata 15 8 0 0 0 0 0 0 0 0 0 0 0 0 0 0 0 0 7 0 0 Mounu 2 0 0 0 0 0 0 0 0 0 0 0 0 0 0 0 0 0 2 0 0 Eueiki 5 0 0 5 0 0 0 0 0 0 0 0 0 0 0 0 0 0 0 0 0 Mala 1 0 0 0 0 0 0 0 0 0 0 0 0 0 0 0 0 0 1 0 0 Fofoa 0 0 0 0 0 0 0 0 0 0 0 0 0 0 0 0 0 0 0 0 0
Ha'apai 6,111 1,929 379 1,216 613 1,390 49 0 19 137 98 148 1 31 1 1 14 46 6 19 14 Pangai 2,200 708 278 320 173 430 13 0 17 92 49 16 1 13 1 1 14 43 1 19 11
Pangai 1,084 285 210 181 88 187 12 0 8 15 28 9 0 13 0 1 14 6 1 19 7 Hihifo 784 299 67 94 62 136 1 0 9 50 21 2 1 0 1 0 0 37 0 0 4 Holopeka 126 44 0 2 4 71 0 0 0 5 0 0 0 0 0 0 0 0 0 0 0 Koulo 206 80 1 43 19 36 0 0 0 22 0 5 0 0 0 0 0 0 0 0 0
Foa 1,383 412 17 425 149 235 20 0 1 4 33 82 0 4 0 0 0 0 1 0 0 Fangale'ounga 140 58 0 24 45 9 0 0 0 0 4 0 0 0 0 0 0 0 0 0 0 Fotua 259 70 0 131 24 34 0 0 0 0 0 0 0 0 0 0 0 0 0 0 0 Lotofoa 413 206 11 94 40 38 6 0 0 0 14 0 0 4 0 0 0 0 0 0 0 Faleloa 371 62 6 97 26 78 14 0 1 4 15 67 0 0 0 0 0 0 1 0 0

Tonga 2016 Census of Population and Housing
Tonga Statistics Department
55
Village Total FWC RC LDS FCOT COT TOK MF AC SDA AOG CCOT GOS BF BUDH TSA JW OPD NO Rel Ref Others
Ha'afakahenga 90 0 0 79 3 8 0 0 0 0 0 0 0 0 0 0 0 0 0 0 0 Ha'ateiho 110 16 0 0 11 68 0 0 0 0 0 15 0 0 0 0 0 0 0 0 0
Lulunga 923 167 22 157 104 397 0 0 0 36 5 33 0 0 0 0 0 0 2 0 0 Ha'afeva 297 63 14 53 39 125 0 0 0 0 0 1 0 0 0 0 0 0 2 0 0 Tungua 187 12 7 11 44 72 0 0 0 36 5 0 0 0 0 0 0 0 0 0 0 Fotuha'a 105 11 0 12 1 81 0 0 0 0 0 0 0 0 0 0 0 0 0 0 0 'O'ua 116 29 1 39 16 31 0 0 0 0 0 0 0 0 0 0 0 0 0 0 0 Matuku 89 7 0 27 0 55 0 0 0 0 0 0 0 0 0 0 0 0 0 0 0 Kotu 129 45 0 15 4 33 0 0 0 0 0 32 0 0 0 0 0 0 0 0 0
Mu'omu'a 440 227 18 65 35 70 7 0 0 0 8 0 0 0 0 0 0 0 8 0 2 Nomuka 369 170 12 65 35 70 7 0 0 0 4 0 0 0 0 0 0 0 4 0 2 Mango 33 33 0 0 0 0 0 0 0 0 0 0 0 0 0 0 0 0 0 0 0 Fonoifua 38 24 6 0 0 0 0 0 0 0 4 0 0 0 0 0 0 0 4 0 0
Ha`ano 478 117 1 107 74 164 9 0 0 3 3 0 0 0 0 0 0 0 0 0 0 Fakakai 150 52 1 17 42 38 0 0 0 0 0 0 0 0 0 0 0 0 0 0 0 Pukotala 89 13 0 29 0 38 9 0 0 0 0 0 0 0 0 0 0 0 0 0 0 Ha'ano 123 19 0 50 22 29 0 0 0 3 0 0 0 0 0 0 0 0 0 0 0 Muitoa 53 20 0 3 1 29 0 0 0 0 0 0 0 0 0 0 0 0 0 0 0 Mo'unga'one 63 13 0 8 9 30 0 0 0 0 3 0 0 0 0 0 0 0 0 0 0
'Uiha 695 298 43 142 78 94 0 0 1 2 0 17 0 14 0 0 0 3 2 0 1 Uiha 378 170 39 69 31 65 0 0 0 0 0 0 0 0 0 0 0 3 1 0 0 Felemea 180 54 0 59 6 27 0 0 0 2 0 16 0 14 0 0 0 0 1 0 1 Lofanga 137 74 4 14 41 2 0 0 1 0 0 1 0 0 0 0 0 0 0 0 0
Eua 4,945 1,872 799 628 925 299 35 32 3 115 44 39 5 48 2 0 16 16 7 3 57 Eua Motu'a 2,800 1,110 106 447 662 207 34 18 1 77 37 38 5 9 2 0 16 11 5 0 15
Ohonua 1,253 364 22 162 362 157 10 14 1 70 18 38 0 8 2 0 7 11 4 0 3 Tufuvai 231 92 8 3 116 3 0 0 0 0 0 0 0 0 0 0 6 0 1 0 2 Pangai 324 132 15 61 72 25 13 0 0 0 0 0 0 0 0 0 3 0 0 0 3 Houma 278 168 31 22 38 0 0 0 0 5 8 0 5 1 0 0 0 0 0 0 0 Ha'atu'a / Kolomaile 522 174 28 189 74 22 11 4 0 2 11 0 0 0 0 0 0 0 0 0 7 Ta'anga 192 180 2 10 0 0 0 0 0 0 0 0 0 0 0 0 0 0 0 0 0
'Eua fo'ou 2,145 762 693 181 263 92 1 14 2 38 7 1 0 39 0 0 0 5 2 3 42 Angaha 382 75 234 13 5 3 0 0 2 35 0 0 0 0 0 0 0 0 0 0 15 Futu 258 61 106 32 6 14 0 0 0 0 0 0 0 7 0 0 0 5 2 2 23 Esia 231 19 166 33 4 0 1 0 0 0 6 0 0 0 0 0 0 0 0 0 2 Sapa'ata 160 45 23 2 88 0 0 0 0 0 0 0 0 0 0 0 0 0 0 0 2 Fata'ulua 231 77 46 27 46 18 0 0 0 0 1 1 0 14 0 0 0 0 0 1 0 Mu'a 161 108 11 17 25 0 0 0 0 0 0 0 0 0 0 0 0 0 0 0 0 Tongamama'o 179 59 28 38 44 0 0 7 0 3 0 0 0 0 0 0 0 0 0 0 0 Petani 277 140 31 19 12 50 0 7 0 0 0 0 0 18 0 0 0 0 0 0 0 Mata'aho 266 178 48 0 33 7 0 0 0 0 0 0 0 0 0 0 0 0 0 0 0
Ongo Niua 1,232 415 441 52 224 54 14 0 8 17 0 0 0 2 0 1 0 3 0 0 1 Niuatoputapu 739 183 320 35 113 54 7 0 8 14 0 0 0 0 0 1 0 3 0 0 1
Hihifo 302 62 83 8 71 44 7 0 8 14 0 0 0 0 0 1 0 3 0 0 1 Vaipoa 183 56 95 9 16 7 0 0 0 0 0 0 0 0 0 0 0 0 0 0 0 Falehau 223 64 115 18 26 0 0 0 0 0 0 0 0 0 0 0 0 0 0 0 0

Tonga 2016 Census of Population and Housing
Tonga Statistics Department
56
Village Total FWC RC LDS FCOT COT TOK MF AC SDA AOG CCOT GOS BF BUDH TSA JW OPD NO Rel Ref Others
Tafahi 31 1 27 0 0 3 0 0 0 0 0 0 0 0 0 0 0 0 0 0 0 Niuafo'ou 493 232 121 17 111 0 7 0 0 3 0 0 0 2 0 0 0 0 0 0 0
Esia 130 82 43 0 5 0 0 0 0 0 0 0 0 0 0 0 0 0 0 0 0 Kolofo'ou 43 4 31 0 6 0 0 0 0 2 0 0 0 0 0 0 0 0 0 0 0 Sapaata 145 59 16 17 46 0 7 0 0 0 0 0 0 0 0 0 0 0 0 0 0 Fata'ulua 61 25 0 0 36 0 0 0 0 0 0 0 0 0 0 0 0 0 0 0 0 Mata'aho 16 9 7 0 0 0 0 0 0 0 0 0 0 0 0 0 0 0 0 0 0 Mu'a 15 8 2 0 4 0 0 0 0 1 0 0 0 0 0 0 0 0 0 0 0 Tongamama'o 15 15 0 0 0 0 0 0 0 0 0 0 0 0 0 0 0 0 0 0 0 Petani 68 30 22 0 14 0 0 0 0 0 0 0 0 2 0 0 0 0 0 0 0
Note:-Exclude visitor or non-resident
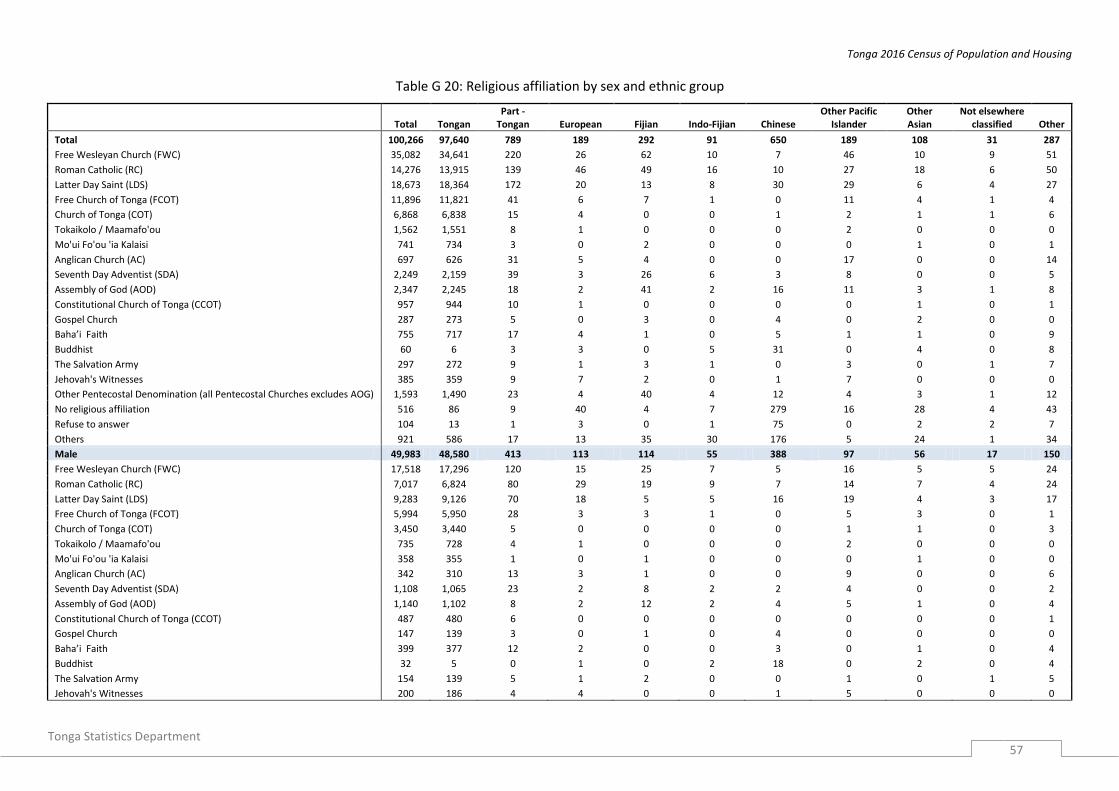
Tonga 2016 Census of Population and Housing
Tonga Statistics Department
57
Table G 20: Religious affiliation by sex and ethnic group
Total Tongan Part -
Tongan European Fijian Indo-Fijian Chinese Other Pacific
Islander Other Asian
Not elsewhere classified Other
Total 100,266 97,640 789 189 292 91 650 189 108 31 287
Free Wesleyan Church (FWC) 35,082 34,641 220 26 62 10 7 46 10 9 51
Roman Catholic (RC) 14,276 13,915 139 46 49 16 10 27 18 6 50
Latter Day Saint (LDS) 18,673 18,364 172 20 13 8 30 29 6 4 27
Free Church of Tonga (FCOT) 11,896 11,821 41 6 7 1 0 11 4 1 4
Church of Tonga (COT) 6,868 6,838 15 4 0 0 1 2 1 1 6
Tokaikolo / Maamafo'ou 1,562 1,551 8 1 0 0 0 2 0 0 0
Mo'ui Fo'ou 'ia Kalaisi 741 734 3 0 2 0 0 0 1 0 1
Anglican Church (AC) 697 626 31 5 4 0 0 17 0 0 14
Seventh Day Adventist (SDA) 2,249 2,159 39 3 26 6 3 8 0 0 5
Assembly of God (AOD) 2,347 2,245 18 2 41 2 16 11 3 1 8
Constitutional Church of Tonga (CCOT) 957 944 10 1 0 0 0 0 1 0 1
Gospel Church 287 273 5 0 3 0 4 0 2 0 0
Baha’i Faith 755 717 17 4 1 0 5 1 1 0 9
Buddhist 60 6 3 3 0 5 31 0 4 0 8
The Salvation Army 297 272 9 1 3 1 0 3 0 1 7
Jehovah's Witnesses 385 359 9 7 2 0 1 7 0 0 0
Other Pentecostal Denomination (all Pentecostal Churches excludes AOG) 1,593 1,490 23 4 40 4 12 4 3 1 12
No religious affiliation 516 86 9 40 4 7 279 16 28 4 43
Refuse to answer 104 13 1 3 0 1 75 0 2 2 7
Others 921 586 17 13 35 30 176 5 24 1 34
Male 49,983 48,580 413 113 114 55 388 97 56 17 150
Free Wesleyan Church (FWC) 17,518 17,296 120 15 25 7 5 16 5 5 24
Roman Catholic (RC) 7,017 6,824 80 29 19 9 7 14 7 4 24
Latter Day Saint (LDS) 9,283 9,126 70 18 5 5 16 19 4 3 17
Free Church of Tonga (FCOT) 5,994 5,950 28 3 3 1 0 5 3 0 1
Church of Tonga (COT) 3,450 3,440 5 0 0 0 0 1 1 0 3
Tokaikolo / Maamafo'ou 735 728 4 1 0 0 0 2 0 0 0
Mo'ui Fo'ou 'ia Kalaisi 358 355 1 0 1 0 0 0 1 0 0
Anglican Church (AC) 342 310 13 3 1 0 0 9 0 0 6
Seventh Day Adventist (SDA) 1,108 1,065 23 2 8 2 2 4 0 0 2
Assembly of God (AOD) 1,140 1,102 8 2 12 2 4 5 1 0 4
Constitutional Church of Tonga (CCOT) 487 480 6 0 0 0 0 0 0 0 1
Gospel Church 147 139 3 0 1 0 4 0 0 0 0
Baha’i Faith 399 377 12 2 0 0 3 0 1 0 4
Buddhist 32 5 0 1 0 2 18 0 2 0 4
The Salvation Army 154 139 5 1 2 0 0 1 0 1 5
Jehovah's Witnesses 200 186 4 4 0 0 1 5 0 0 0
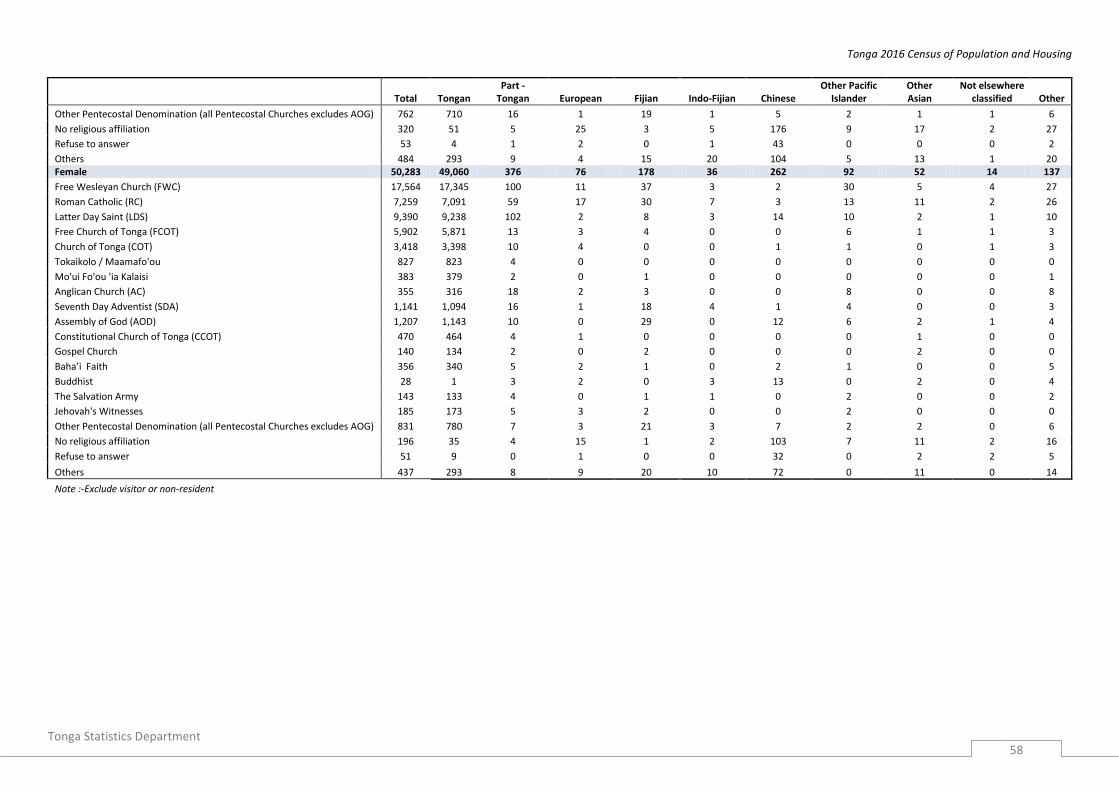
Tonga 2016 Census of Population and Housing
Tonga Statistics Department
58
Total Tongan Part -
Tongan European Fijian Indo-Fijian Chinese Other Pacific
Islander Other Asian
Not elsewhere classified Other
Other Pentecostal Denomination (all Pentecostal Churches excludes AOG) 762 710 16 1 19 1 5 2 1 1 6
No religious affiliation 320 51 5 25 3 5 176 9 17 2 27
Refuse to answer 53 4 1 2 0 1 43 0 0 0 2
Others 484 293 9 4 15 20 104 5 13 1 20 Female 50,283 49,060 376 76 178 36 262 92 52 14 137
Free Wesleyan Church (FWC) 17,564 17,345 100 11 37 3 2 30 5 4 27
Roman Catholic (RC) 7,259 7,091 59 17 30 7 3 13 11 2 26
Latter Day Saint (LDS) 9,390 9,238 102 2 8 3 14 10 2 1 10
Free Church of Tonga (FCOT) 5,902 5,871 13 3 4 0 0 6 1 1 3
Church of Tonga (COT) 3,418 3,398 10 4 0 0 1 1 0 1 3
Tokaikolo / Maamafo'ou 827 823 4 0 0 0 0 0 0 0 0
Mo'ui Fo'ou 'ia Kalaisi 383 379 2 0 1 0 0 0 0 0 1
Anglican Church (AC) 355 316 18 2 3 0 0 8 0 0 8
Seventh Day Adventist (SDA) 1,141 1,094 16 1 18 4 1 4 0 0 3
Assembly of God (AOD) 1,207 1,143 10 0 29 0 12 6 2 1 4
Constitutional Church of Tonga (CCOT) 470 464 4 1 0 0 0 0 1 0 0
Gospel Church 140 134 2 0 2 0 0 0 2 0 0
Baha’i Faith 356 340 5 2 1 0 2 1 0 0 5
Buddhist 28 1 3 2 0 3 13 0 2 0 4
The Salvation Army 143 133 4 0 1 1 0 2 0 0 2
Jehovah's Witnesses 185 173 5 3 2 0 0 2 0 0 0
Other Pentecostal Denomination (all Pentecostal Churches excludes AOG) 831 780 7 3 21 3 7 2 2 0 6
No religious affiliation 196 35 4 15 1 2 103 7 11 2 16
Refuse to answer 51 9 0 1 0 0 32 0 2 2 5
Others 437 293 8 9 20 10 72 0 11 0 14
Note :-Exclude visitor or non-resident
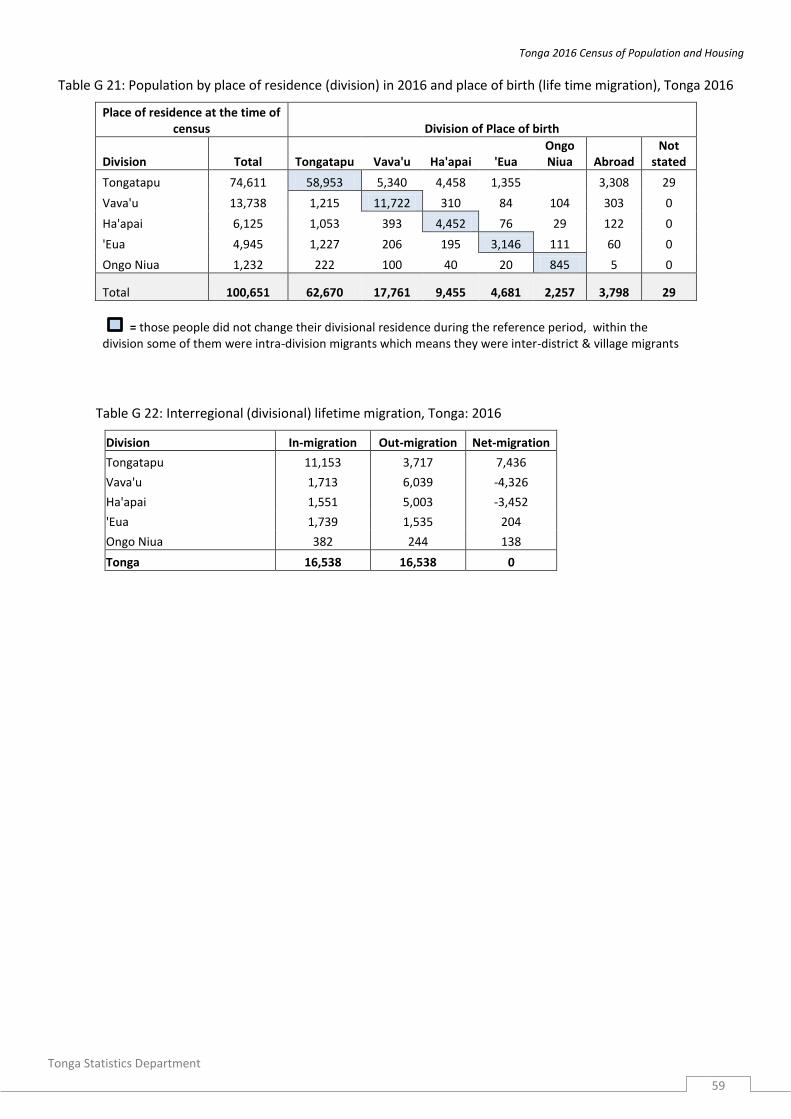
Tonga 2016 Census of Population and Housing
Tonga Statistics Department
59
Table G 21: Population by place of residence (division) in 2016 and place of birth (life time migration), Tonga 2016
Place of residence at the time of census Division of Place of birth
Division Total Tongatapu Vava'u Ha'apai 'Eua Ongo Niua Abroad
Not stated
Tongatapu 74,611 58,953 5,340 4,458 1,355 3,308 29
Vava'u 13,738 1,215 11,722 310 84 104 303 0
Ha'apai 6,125 1,053 393 4,452 76 29 122 0
'Eua 4,945 1,227 206 195 3,146 111 60 0
Ongo Niua 1,232 222 100 40 20 845 5 0
Total 100,651 62,670 17,761 9,455 4,681 2,257 3,798 29
= those people did not change their divisional residence during the reference period, within the division some of them were intra-division migrants which means they were inter-district & village migrants
Table G 22: Interregional (divisional) lifetime migration, Tonga: 2016
Division In-migration Out-migration Net-migration
Tongatapu 11,153 3,717 7,436
Vava'u 1,713 6,039 -4,326
Ha'apai 1,551 5,003 -3,452
'Eua 1,739 1,535 204
Ongo Niua 382 244 138
Tonga 16,538 16,538 0

Tonga 2016 Census of Population and Housing
Tonga Statistics Department
60
Table G 23: Population by place of residence (district) in 2016 and place of birth (life time migration), Tonga 2016
Kolofo'ou Kolomotu'a Vaini
Tatakam
otonga Lapaha
Nukunu
ku Kolovai Neiafu
Pangaim
otu Hahake Leimatu'a Hihifo Motu Pangai Foa Lulunga
Nomuka/
Mu'omu'a Ha'ano Uiha
'Euamotu'a 'Euafo'ou
Niuatoput
apu Niuafo'ou
Kolofo'ou 18,064 11,390 1,042 361 168 284 215 138 601 112 159 216 138 145 528 137 149 161 94 102 189 207 207 155 1,160 6
Kolomotu'a 17,120 1,009 9,664 446 297 307 283 223 680 101 188 362 263 159 643 176 146 171 133 186 196 175 207 69 1,013 23
Vaini 12,999 403 533 8,529 322 289 238 119 285 75 121 189 160 77 256 87 105 92 140 91 101 112 162 82 431 0
Tatakamotonga 7,043 264 242 250 5,036 236 86 68 98 37 39 67 48 25 51 40 40 30 14 45 59 58 35 27 148 0
Lapaha 7,117 184 352 145 139 5,288 100 58 103 21 41 30 41 47 93 22 52 31 37 31 45 29 53 19 156 0
Nukunuku 8,001 194 255 202 117 140 5,679 123 135 39 70 105 86 41 133 51 41 52 48 61 65 42 85 33 204 0
Kolovai 4,267 163 155 110 87 75 119 2,826 66 18 59 45 26 22 59 26 30 25 24 25 35 42 19 15 196 0
Neiafu 5,251 131 184 51 29 42 34 20 3,846 54 78 149 93 171 59 7 14 5 9 13 19 12 33 16 182 0
Pangaimotu 1,242 16 24 8 1 2 16 3 104 924 9 23 22 26 21 4 0 4 0 1 3 0 9 0 22 0
Hahake 2,021 41 31 8 8 11 12 24 97 23 1,576 51 26 20 20 7 10 3 7 5 5 4 7 4 21 0
Leimatu'a 2,489 42 67 61 12 23 22 17 181 14 40 1,827 38 26 24 5 8 0 8 5 6 13 11 6 33 0
Hihifo 1,990 50 44 28 9 19 22 9 58 21 25 58 1,517 28 16 8 4 2 17 10 10 5 13 2 15 0
Motu 745 18 33 6 7 12 8 10 49 10 12 33 18 475 2 1 4 0 6 1 5 2 3 0 30 0
Pangai Hp 2,205 112 135 41 33 21 35 12 75 14 24 32 18 19 1,341 31 73 12 31 51 16 4 8 1 66 0
Foa 1,392 43 49 24 21 14 34 15 25 7 18 20 25 7 50 900 35 5 27 26 11 3 2 2 29 0
Lulunga 923 38 99 13 13 16 18 13 20 6 6 4 2 9 57 5 549 8 3 10 12 4 7 2 9 0
Mu'omu'a 432 28 23 14 2 5 11 3 2 1 2 0 1 3 9 3 8 291 1 8 2 3 2 0 10 0
Ha'ano 478 18 15 17 7 3 7 5 5 0 3 1 3 2 19 9 13 2 328 1 7 11 0 1 1 0
Uiha 695 24 40 7 3 14 6 2 7 2 2 4 13 11 43 18 13 7 10 455 2 1 3 1 7 0
'Eua Motu'a 2,795 159 228 114 39 57 48 48 50 5 9 26 15 15 53 12 19 24 16 10 1,671 114 21 9 33 0
'Eua Fo'ou 2,150 119 127 104 70 59 30 25 21 11 26 9 10 9 21 7 11 6 4 12 57 1,304 7 74 27 0
Niuatoputapu 739 23 29 25 2 13 13 3 17 0 13 26 5 3 10 1 5 3 6 0 5 0 534 1 2 0
Niuafo'ou 493 23 19 31 9 15 5 12 15 0 0 6 13 2 0 1 2 3 2 7 8 7 10 300 3 0
Total 100,651 14,492 13,390 10,595 6,431 6,945 7,041 3,776 6,540 1,495 2,520 3,283 2,581 1,342 3,508 1,558 1,331 937 965 1,156 2,529 2,152 1,438 819 3,798 29
= those people did not change their district residence during the reference period, within the district some of them
were intra-district migrants which means they were inter- village migrants
Abroad Not stated
District of place of birth
Place of residence
at the time of 2016
census (District) Total

Tonga 2016 Census of Population and Housing
Tonga Statistics Department
61
Table G 24: Inter-district migration by place of birth during the 2016 census, Tonga 2016
District In-migration Out-migration Net-migration
Kolofo'ou 5,508 3,102 2,406
Kolomotu'a 6,420 3,726 2,694
Vaini 4,039 2,066 1,973
Tatakamotonga 1,859 1,395 464
Lapaha 1,673 1,657 16
Nukunuku 2,118 1,362 756
Kolovai 1,245 950 295
Neiafu 1,223 2,694 -1,471
Pangaimotu 296 571 -275
Hahake 424 944 -520
Leimatu'a 629 1,456 -827
Hihifo 458 1,064 -606
Motu 240 867 -627
Pangai Hp 798 2,167 -1,369
Foa 463 658 -195
Lulunga 365 782 -417
Mu'omu'a 131 646 -515
Ha'ano 149 637 -488
Uiha 233 701 -468
'Eua Motu'a 1,091 858 233
'Eua Fo'ou 819 848 -29
Niuatoputapu 203 904 -701
Niuafo'ou 190 519 -329
Total 30,574 30,574 0
Table G 25: Population by place of enumeration (division) and usual residence one years ago, Tonga: 2016
Place of residence at the time of 2016 census Usual residential address 1 year ago
Division Total Tongatapu Vava'u Ha'apai 'Eua Ongo Niua Abroad *Not yet
born **Visitors
Tongatapu 74,611 69,857 634 345 165 127 1,455 1,708 320
Vava'u 13,738 403 12,741 27 28 6 179 303 51
Ha'apai 6,125 349 67 5,466 23 9 56 141 14
'Eua 4,945 263 27 10 4,472 5 58 110 0
Ongo Niua 1,232 97 18 4 8 1,084 4 17 0
Tonga 100,651 70,969 13,487 5,852 4,696 1,231 1,752 2,279 385
* people aged less than 1 year could not state their residence one year prior to the census, because they were not yet born then
= those people did not change their divisional residence during the reference period, within the division some of them were intra-division migrants which means they were inter-district & village migrants
** people were in Tonga during the census night enumerated as visitors

Tonga 2016 Census of Population and Housing
Tonga Statistics Department
62
Table G 26: Interregional (divisional) during the one year period prior to 2016 census, Tonga: 2016
Division In-
migration Out-
migration Net-
migration
Tongatapu 1,271 1,112 159
Vava'u 464 746 -282
Ha'apai 448 386 62
'Eua 305 224 81
Ongo Niua 127 147 -20
Tonga 2,615 2,615 0

Tonga 2016 Census of Population and Housing
Tonga Statistics Department
63
Table G 27: Population by place of residence (district), during the one year period prior to 2016 census, Tonga 2016
Kolofo'ou Kolomotu'a Vaini
Tataka-
motonga Lapaha
Nukun-
uku Kolovai Neiafu
Pangai-
motu Hahake Leimatu'a Hihifo Motu Pangai Foa Lulunga
Nomuka/
Mu'omu'a Ha'ano Uiha
'Euamotu'a 'Euafo'ou
Niuatopu-
tapu Niuafo'ou
Kolofo'ou 18,064 16,385 240 71 18 46 41 17 82 5 17 36 26 14 29 8 14 6 1 6 17 9 15 11 323 388 239
Kolomotu'a 17,120 250 15,370 103 43 40 62 35 56 2 27 59 34 17 63 27 9 28 3 10 24 20 15 7 369 385 62
Vaini 12,999 119 129 11,793 94 44 31 23 45 18 17 15 16 2 29 5 5 10 3 1 13 22 12 14 255 284 0
Tatakamotonga 7,043 82 50 47 6,422 35 7 4 15 3 4 12 6 2 8 7 2 4 1 8 12 13 8 3 98 181 9
Lapaha 7,117 60 27 49 27 6,517 26 18 16 1 5 4 2 2 7 4 2 0 5 0 6 0 7 5 149 178 0
Nukunuku 8,001 52 59 47 26 28 7,286 47 22 1 7 21 11 0 9 8 0 4 1 6 19 1 9 1 123 209 4
Kolovai 4,267 21 19 18 22 6 18 3,883 3 3 0 3 0 3 5 2 3 2 0 0 8 1 15 5 138 83 6
Neiafu 5,251 59 79 30 12 10 17 3 4,656 12 23 40 13 47 7 0 0 1 1 0 10 0 3 0 94 99 35
Pangaimotu 1,242 4 7 0 0 0 7 0 5 1,153 0 3 5 0 0 0 0 1 0 0 4 0 2 1 9 36 5
Hahake 2,021 10 11 0 2 1 1 8 11 5 1,896 1 0 6 4 0 0 0 0 0 0 0 0 0 20 45 0
Leimatu'a 2,489 15 14 17 1 3 0 1 28 3 9 2,284 7 1 6 0 0 0 0 0 0 2 0 0 26 72 0
Hihifo 1,990 11 22 11 6 1 7 2 11 0 8 9 1,827 1 1 0 0 0 0 2 5 0 0 0 22 42 2
Motu 745 8 16 0 1 0 3 3 47 0 1 6 13 610 0 1 3 0 0 0 0 7 0 0 8 9 9
Pangai Hp 2,205 38 31 28 12 7 18 3 16 0 7 9 0 14 1,882 8 30 6 5 19 3 0 3 4 18 39 5
Foa 1,392 18 9 4 2 1 7 2 0 0 1 0 6 0 17 1,248 1 0 6 7 0 0 0 0 19 35 9
Lulunga 923 10 32 8 11 10 5 1 0 0 0 2 0 0 5 1 788 1 0 4 8 2 0 0 4 31 0
Mu'omu'a 432 13 9 3 1 0 0 0 0 1 0 0 0 0 0 0 1 386 0 0 3 0 0 0 6 9 0
Ha'ano 478 9 6 1 2 0 2 1 2 0 0 0 0 0 12 6 4 0 411 0 1 6 0 0 0 15 0
Uiha 695 12 17 6 2 1 4 3 0 0 4 0 1 4 17 0 7 1 6 587 0 0 0 2 9 12 0
'Eua Motu'a 2,795 36 34 28 12 9 22 11 2 0 2 2 0 5 2 4 0 0 2 0 2,503 20 1 1 37 62 0
'Eua Fo'ou 2,150 38 12 17 23 11 4 6 0 0 9 1 6 0 2 0 0 0 0 0 13 1,936 3 0 21 48 0
Niuatoputapu 739 11 13 21 0 3 15 0 4 0 5 6 2 0 4 0 0 0 0 0 0 0 642 3 0 10 0
Niuafo'ou 493 15 3 3 4 3 0 6 1 0 0 0 0 0 0 0 0 0 0 0 3 5 0 439 4 7 0
Total 100,651 17,276 16,209 12,305 6,743 6,776 7,583 4,077 5,022 1,207 2,042 2,513 1,975 728 2,109 1,329 869 450 445 650 2,652 2,044 735 496 1,752 2,279 385
= those people did not change their district residence during the reference period, within the district some of them
were intra-district migrants which means they were inter- village migrants
* people aged less than 1 year could not state their residence one year prior to the census, because they were not yet born then
** people were in Tonga during the census night enumerated as visitors
**Visitors
Usual Residential (district) 1 year ago
Total
Place of residence
at the time of 2016
census Abroad
*Not yet
born

Tonga 2016 Census of Population and Housing
Tonga Statistics Department
64
Table G 28: Inter-district migration, during one year period 2016 census, Tonga 2016
District In-migration Out-migration Net-migration
Kolofo'ou 729 891 -162
Kolomotu'a 934 839 95
Vaini 667 512 155
Tatakamotonga 333 321 12
Lapaha 273 259 14
Nukunuku 379 297 82
Kolovai 157 194 -37
Neiafu 367 366 1
Pangaimotu 39 54 -15
Hahake 60 146 -86
Leimatu'a 107 229 -122
Hihifo 97 148 -51
Motu 109 118 -9
Pangai Hp 261 227 34
Foa 81 81 0
Lulunga 100 81 19
Mu'omu'a 31 64 -33
Ha'ano 52 34 18
Uiha 87 63 24
'Eua Motu'a 193 149 44
'Eua Fo'ou 145 108 37
Niuatoputapu 87 93 -6
Niuafo'ou 43 57 -14
Total 5,331 5,331 0
Table G 29: Population by place of enumeration (division) and usual residence five years ago, Tonga: 2016
Place of residence at the time of 2016 census
Usual Residential 5 years ago
Total Tongatapu Vava'u Ha'apai 'Eua Ongo Niua
Abroad *Not yet
born **Visitors
Tongatapu 74,611 60,197 1,245 713 367 191 2,303 9,281 314
Vava'u 13,738 551 11,101 65 59 33 227 1,652 50
Ha'apai 6,125 541 108 4,588 31 12 69 762 14
'Eua 4,945 350 36 30 3,781 23 61 664 0
Ongo Niua 1,232 163 52 10 7 851 9 140 0
Tonga 100,651 61,802 12,542 5,406 4,245 1,110 2,669 12,499 378 = those people did not change their divisional residence during the reference period, within the division some of them were intra-division migrants which means they were inter-district & village migrants.
* People aged less than 5 year could not state their residence one year prior to the census, because they were not yet born then.
** People were in Tonga during the census night enumerated as visitors.
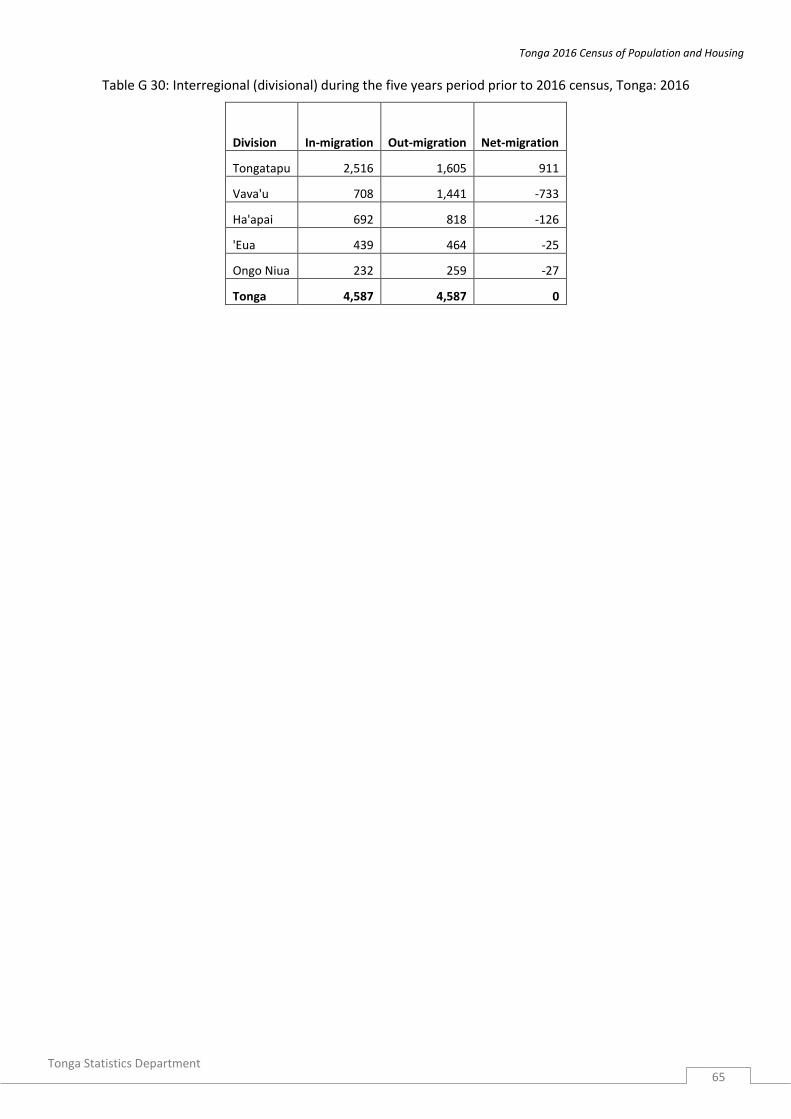
Tonga 2016 Census of Population and Housing
Tonga Statistics Department
65
Table G 30: Interregional (divisional) during the five years period prior to 2016 census, Tonga: 2016
Division In-migration Out-migration Net-migration
Tongatapu 2,516 1,605 911
Vava'u 708 1,441 -733
Ha'apai 692 818 -126
'Eua 439 464 -25
Ongo Niua 232 259 -27
Tonga 4,587 4,587 0

Tonga 2016 Census of Population and Housing
Tonga Statistics Department
66
Table G 31: Population by place of residence (district), during the five years period prior to 2016 census, Tonga 2016
Kolofo'ou Kolomotu'a Vaini
Tataka-
motonga Lapaha
Nukun-
uku Kolovai Neiafu
Pangai-
motu Hahake Leimatu'a Hihifo Motu Pangai Foa Lulunga
Nomuka/
Mu'omu'a Ha'ano Uiha Euamotu'a 'Euafo'ou
Niuatopu-
tapu Niuafo'ou
Kolofo'ou 18,064 13,665 361 151 59 60 104 24 151 8 29 63 35 19 82 24 25 22 3 13 43 41 25 30 634 2,156 237
Kolomotu'a 17,120 521 12,466 215 89 69 132 75 160 20 53 94 67 15 123 40 25 38 7 23 60 35 19 8 656 2,050 60
Vaini 12,999 198 226 9,740 158 118 81 37 70 27 36 29 41 3 60 7 18 17 11 12 27 37 19 14 361 1,652 0
Tatakamotonga 7,043 164 116 101 5,277 66 31 19 20 8 12 13 13 4 16 12 9 10 1 2 25 19 21 4 151 920 9
Lapaha 7,117 77 48 86 58 5,564 46 26 20 9 16 19 8 3 8 5 3 6 7 1 10 2 13 5 185 892 0
Nukunuku 8,001 94 92 51 26 42 6,167 48 36 1 10 22 36 11 18 8 1 9 3 16 25 23 14 9 157 1,078 4
Kolovai 4,267 67 49 38 30 32 36 3,197 9 3 24 8 3 17 8 6 3 10 0 1 13 7 8 2 159 533 4
Neiafu 5,251 98 74 38 16 23 14 9 3,997 8 28 64 28 70 17 0 3 1 1 3 9 5 9 2 125 575 34
Pangaimotu 1,242 6 14 2 0 0 6 0 23 982 2 4 8 0 4 1 0 1 0 1 3 0 2 1 11 166 5
Hahake 2,021 23 16 4 1 2 0 5 16 7 1,617 7 5 14 3 0 0 0 0 0 8 0 0 7 28 258 0
Leimatu'a 2,489 21 16 26 1 8 3 1 32 3 12 1,928 18 3 8 1 2 0 0 4 5 5 0 3 27 362 0
Hihifo 1,990 17 29 17 6 3 9 3 22 11 9 27 1,571 3 1 0 3 0 2 2 6 7 1 1 25 213 2
Motu 745 10 13 2 2 3 0 10 45 1 8 9 11 508 1 1 4 1 0 0 5 6 7 0 11 78 9
Pangai Hp 2,205 61 71 31 16 6 30 4 23 0 8 3 1 11 1,588 24 34 10 6 23 9 0 0 3 20 218 5
Foa 1,392 19 26 11 7 3 9 2 11 1 5 1 7 0 9 1,024 14 0 5 15 1 4 0 0 20 189 9
Lulunga 923 30 26 16 10 9 10 2 5 1 1 2 0 0 17 1 617 3 1 2 9 0 3 0 13 145 0
Mu'omu'a 432 17 17 3 2 2 0 1 0 1 0 0 0 0 1 4 5 311 2 0 2 0 0 0 7 57 0
Ha'ano 478 10 21 9 5 1 8 1 2 0 0 0 3 0 17 11 4 0 309 5 0 5 0 0 3 64 0
Uiha 695 7 25 7 1 1 1 3 0 0 3 0 8 11 31 15 6 1 4 469 0 1 1 5 6 89 0
'Eua Motu'a 2,795 57 54 24 16 20 13 7 12 0 1 1 2 1 5 4 5 0 2 1 2,102 41 10 5 34 378 0
'Eua Fo'ou 2,150 40 40 19 15 17 9 19 6 1 8 2 2 0 6 6 0 1 0 0 35 1,603 6 2 27 286 0
Niuatoputapu 739 17 21 32 0 9 19 3 18 0 11 17 1 0 4 1 0 1 2 0 0 0 493 0 5 85 0
Niuafo'ou 493 16 13 12 10 3 0 8 5 0 0 0 0 0 0 1 0 1 0 0 1 6 0 358 4 55 0
Total 100,651 15,235 13,834 10,635 5,805 6,061 6,728 3,504 4,683 1,092 1,893 2,313 1,868 693 2,027 1,196 781 443 366 593 2,398 1,847 651 459 2,669 12,499 378
= those people did not change their district residence during the reference period, within the district some of them
were intra-district migrants which means they were inter- village migrants
* people aged less than 5 years could not state their residence one year prior to the census, because they were not yet born then
** people were in Tonga during the census night enumerated as visitors
Usual Residential (District) 5 years ago
Total
Place of residence
(district) at the
time of 2016 census Visitors
Not yet
bornAbroad
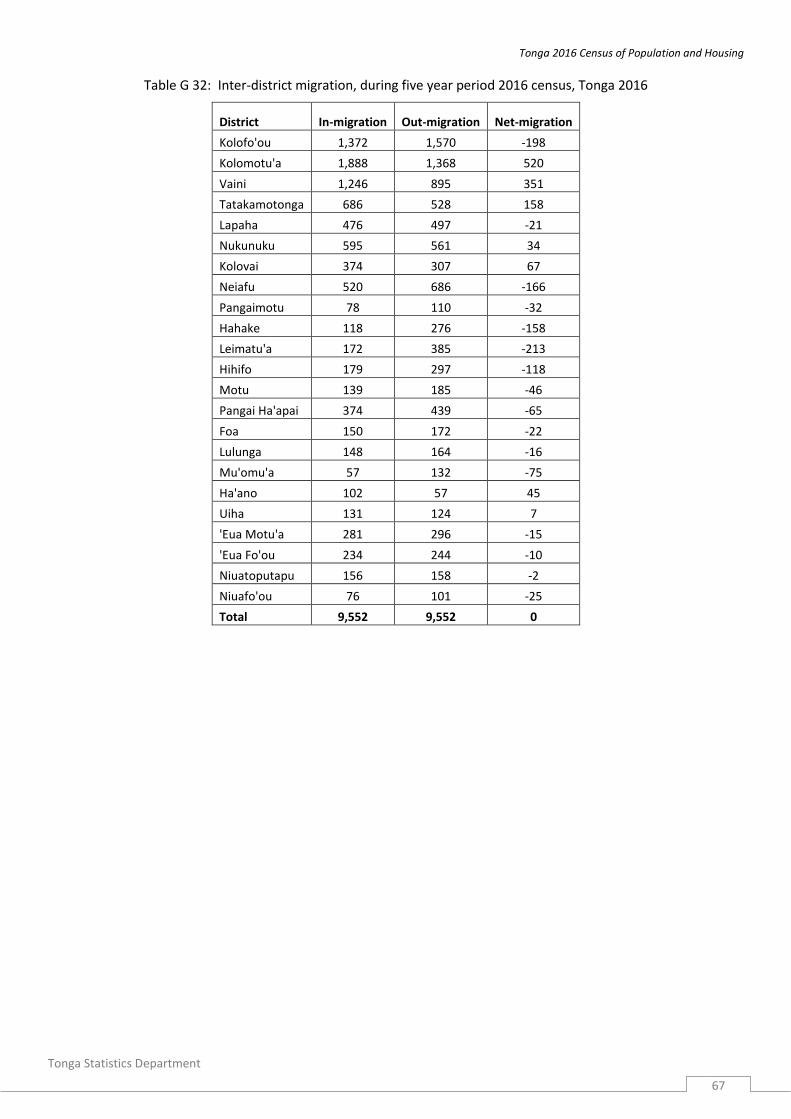
Tonga 2016 Census of Population and Housing
Tonga Statistics Department
67
Table G 32: Inter-district migration, during five year period 2016 census, Tonga 2016
District In-migration Out-migration Net-migration
Kolofo'ou 1,372 1,570 -198
Kolomotu'a 1,888 1,368 520
Vaini 1,246 895 351
Tatakamotonga 686 528 158
Lapaha 476 497 -21
Nukunuku 595 561 34
Kolovai 374 307 67
Neiafu 520 686 -166
Pangaimotu 78 110 -32
Hahake 118 276 -158
Leimatu'a 172 385 -213
Hihifo 179 297 -118
Motu 139 185 -46
Pangai Ha'apai 374 439 -65
Foa 150 172 -22
Lulunga 148 164 -16
Mu'omu'a 57 132 -75
Ha'ano 102 57 45
Uiha 131 124 7
'Eua Motu'a 281 296 -15
'Eua Fo'ou 234 244 -10
Niuatoputapu 156 158 -2
Niuafo'ou 76 101 -25
Total 9,552 9,552 0

Tonga 2016 Census of Population and Housing
Tonga Statistics Department
68
Table G 33: Population aged 2 and above by level of difficulties and sex.
Level of difficulty Total Male Female
Level of difficulty in seeing
No, no difficulty 91,063 45,481 45,582
Yes, some difficulty 3,512 1,609 1,903 Yes, a lot of difficulty 610 251 359
Cannot do at all 248 117 131
Level of difficulty in hearing
No, no difficulty 92,916 46,192 46,724 Yes, some difficulty 1,795 887 908
Yes, a lot of difficulty 483 247 236
Cannot do at all 239 132 107
Difficulty in walking or climbing No, no difficulty 90,004 45,009 44,995
Yes, some difficulty 3,251 1,427 1,824
Yes, a lot of difficulty 1,248 587 661
Cannot do at all 930 435 495 Difficulty remembering
No, no difficulty 92,464 45,997 46,467
Yes, some difficulty 2,036 979 1,057
Yes, a lot of difficulty 653 337 316 Cannot do at all 280 145 135
Difficulty with self-care
No, no difficulty 87,676 43,482 44,194
Yes, some difficulty 4,308 2,233 2,075 Yes, a lot of difficulty 1,752 869 883
Cannot do at all 1,697 874 823
Difficulty in communicating
No, no difficulty 90,946 45,097 45,849 Yes, some difficulty 2,555 1,332 1,223
Yes, a lot of difficulty 1,079 582 497
Cannot do at all 853 447 406
Note: Private household excluding visitors
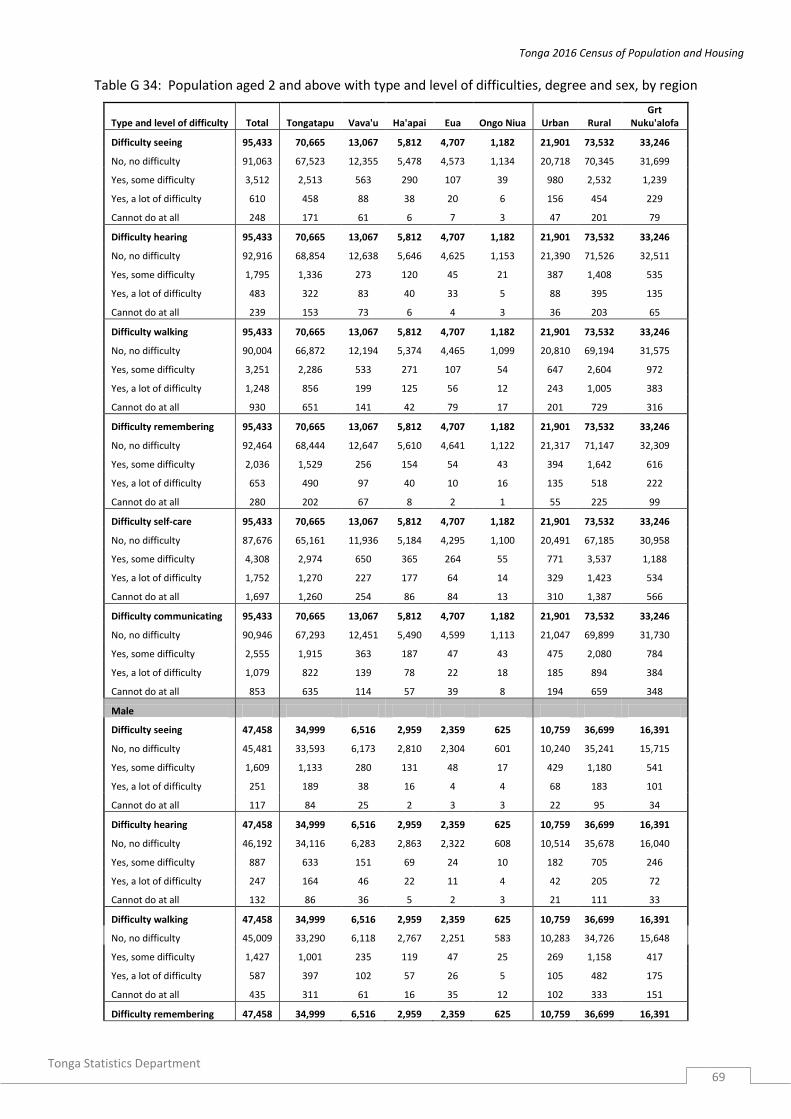
Tonga 2016 Census of Population and Housing
Tonga Statistics Department
69
Table G 34: Population aged 2 and above with type and level of difficulties, degree and sex, by region
Type and level of difficulty Total Tongatapu Vava'u Ha'apai Eua Ongo Niua Urban Rural Grt
Nuku'alofa
Difficulty seeing 95,433 70,665 13,067 5,812 4,707 1,182 21,901 73,532 33,246
No, no difficulty 91,063 67,523 12,355 5,478 4,573 1,134 20,718 70,345 31,699
Yes, some difficulty 3,512 2,513 563 290 107 39 980 2,532 1,239
Yes, a lot of difficulty 610 458 88 38 20 6 156 454 229
Cannot do at all 248 171 61 6 7 3 47 201 79
Difficulty hearing 95,433 70,665 13,067 5,812 4,707 1,182 21,901 73,532 33,246
No, no difficulty 92,916 68,854 12,638 5,646 4,625 1,153 21,390 71,526 32,511
Yes, some difficulty 1,795 1,336 273 120 45 21 387 1,408 535
Yes, a lot of difficulty 483 322 83 40 33 5 88 395 135
Cannot do at all 239 153 73 6 4 3 36 203 65
Difficulty walking 95,433 70,665 13,067 5,812 4,707 1,182 21,901 73,532 33,246
No, no difficulty 90,004 66,872 12,194 5,374 4,465 1,099 20,810 69,194 31,575
Yes, some difficulty 3,251 2,286 533 271 107 54 647 2,604 972
Yes, a lot of difficulty 1,248 856 199 125 56 12 243 1,005 383
Cannot do at all 930 651 141 42 79 17 201 729 316
Difficulty remembering 95,433 70,665 13,067 5,812 4,707 1,182 21,901 73,532 33,246
No, no difficulty 92,464 68,444 12,647 5,610 4,641 1,122 21,317 71,147 32,309
Yes, some difficulty 2,036 1,529 256 154 54 43 394 1,642 616
Yes, a lot of difficulty 653 490 97 40 10 16 135 518 222
Cannot do at all 280 202 67 8 2 1 55 225 99
Difficulty self-care 95,433 70,665 13,067 5,812 4,707 1,182 21,901 73,532 33,246
No, no difficulty 87,676 65,161 11,936 5,184 4,295 1,100 20,491 67,185 30,958
Yes, some difficulty 4,308 2,974 650 365 264 55 771 3,537 1,188
Yes, a lot of difficulty 1,752 1,270 227 177 64 14 329 1,423 534
Cannot do at all 1,697 1,260 254 86 84 13 310 1,387 566
Difficulty communicating 95,433 70,665 13,067 5,812 4,707 1,182 21,901 73,532 33,246
No, no difficulty 90,946 67,293 12,451 5,490 4,599 1,113 21,047 69,899 31,730
Yes, some difficulty 2,555 1,915 363 187 47 43 475 2,080 784
Yes, a lot of difficulty 1,079 822 139 78 22 18 185 894 384
Cannot do at all 853 635 114 57 39 8 194 659 348
Male
Difficulty seeing 47,458 34,999 6,516 2,959 2,359 625 10,759 36,699 16,391
No, no difficulty 45,481 33,593 6,173 2,810 2,304 601 10,240 35,241 15,715
Yes, some difficulty 1,609 1,133 280 131 48 17 429 1,180 541
Yes, a lot of difficulty 251 189 38 16 4 4 68 183 101
Cannot do at all 117 84 25 2 3 3 22 95 34
Difficulty hearing 47,458 34,999 6,516 2,959 2,359 625 10,759 36,699 16,391
No, no difficulty 46,192 34,116 6,283 2,863 2,322 608 10,514 35,678 16,040
Yes, some difficulty 887 633 151 69 24 10 182 705 246
Yes, a lot of difficulty 247 164 46 22 11 4 42 205 72
Cannot do at all 132 86 36 5 2 3 21 111 33
Difficulty walking 47,458 34,999 6,516 2,959 2,359 625 10,759 36,699 16,391
No, no difficulty 45,009 33,290 6,118 2,767 2,251 583 10,283 34,726 15,648
Yes, some difficulty 1,427 1,001 235 119 47 25 269 1,158 417
Yes, a lot of difficulty 587 397 102 57 26 5 105 482 175
Cannot do at all 435 311 61 16 35 12 102 333 151
Difficulty remembering 47,458 34,999 6,516 2,959 2,359 625 10,759 36,699 16,391
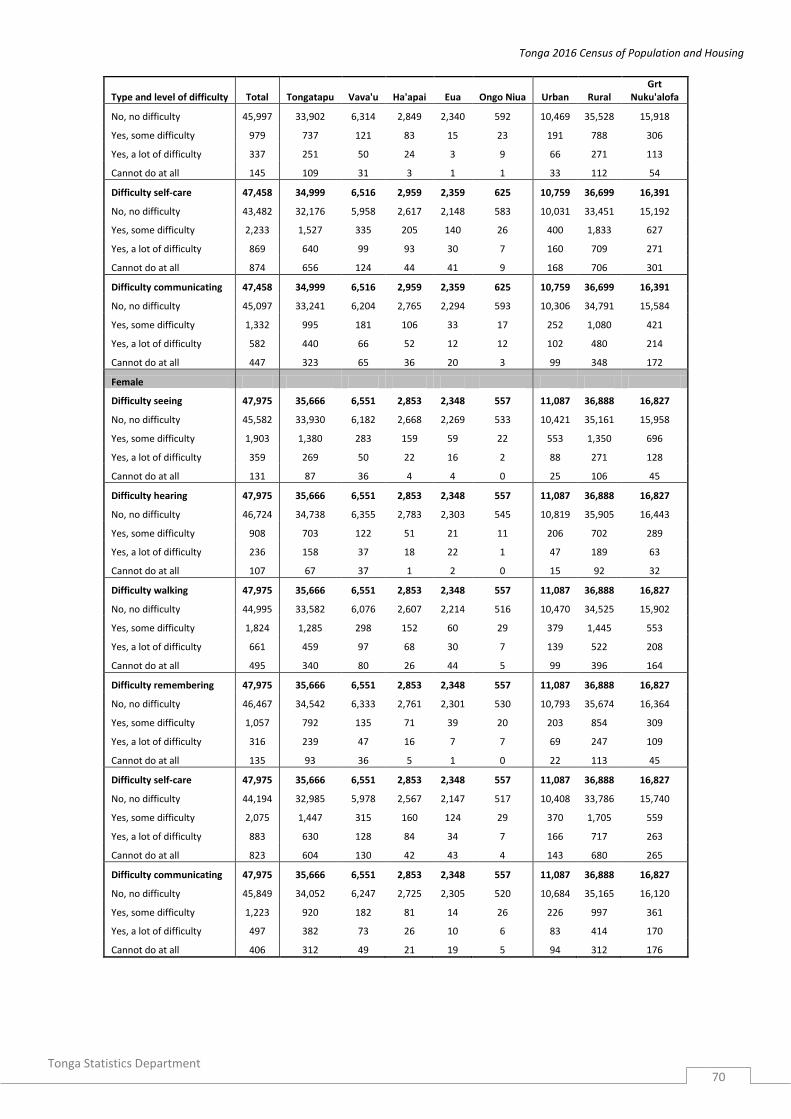
Tonga 2016 Census of Population and Housing
Tonga Statistics Department
70
Type and level of difficulty Total Tongatapu Vava'u Ha'apai Eua Ongo Niua Urban Rural Grt
Nuku'alofa
No, no difficulty 45,997 33,902 6,314 2,849 2,340 592 10,469 35,528 15,918
Yes, some difficulty 979 737 121 83 15 23 191 788 306
Yes, a lot of difficulty 337 251 50 24 3 9 66 271 113
Cannot do at all 145 109 31 3 1 1 33 112 54
Difficulty self-care 47,458 34,999 6,516 2,959 2,359 625 10,759 36,699 16,391
No, no difficulty 43,482 32,176 5,958 2,617 2,148 583 10,031 33,451 15,192
Yes, some difficulty 2,233 1,527 335 205 140 26 400 1,833 627
Yes, a lot of difficulty 869 640 99 93 30 7 160 709 271
Cannot do at all 874 656 124 44 41 9 168 706 301
Difficulty communicating 47,458 34,999 6,516 2,959 2,359 625 10,759 36,699 16,391
No, no difficulty 45,097 33,241 6,204 2,765 2,294 593 10,306 34,791 15,584
Yes, some difficulty 1,332 995 181 106 33 17 252 1,080 421
Yes, a lot of difficulty 582 440 66 52 12 12 102 480 214
Cannot do at all 447 323 65 36 20 3 99 348 172
Female
Difficulty seeing 47,975 35,666 6,551 2,853 2,348 557 11,087 36,888 16,827
No, no difficulty 45,582 33,930 6,182 2,668 2,269 533 10,421 35,161 15,958
Yes, some difficulty 1,903 1,380 283 159 59 22 553 1,350 696
Yes, a lot of difficulty 359 269 50 22 16 2 88 271 128
Cannot do at all 131 87 36 4 4 0 25 106 45
Difficulty hearing 47,975 35,666 6,551 2,853 2,348 557 11,087 36,888 16,827
No, no difficulty 46,724 34,738 6,355 2,783 2,303 545 10,819 35,905 16,443
Yes, some difficulty 908 703 122 51 21 11 206 702 289
Yes, a lot of difficulty 236 158 37 18 22 1 47 189 63
Cannot do at all 107 67 37 1 2 0 15 92 32
Difficulty walking 47,975 35,666 6,551 2,853 2,348 557 11,087 36,888 16,827
No, no difficulty 44,995 33,582 6,076 2,607 2,214 516 10,470 34,525 15,902
Yes, some difficulty 1,824 1,285 298 152 60 29 379 1,445 553
Yes, a lot of difficulty 661 459 97 68 30 7 139 522 208
Cannot do at all 495 340 80 26 44 5 99 396 164
Difficulty remembering 47,975 35,666 6,551 2,853 2,348 557 11,087 36,888 16,827
No, no difficulty 46,467 34,542 6,333 2,761 2,301 530 10,793 35,674 16,364
Yes, some difficulty 1,057 792 135 71 39 20 203 854 309
Yes, a lot of difficulty 316 239 47 16 7 7 69 247 109
Cannot do at all 135 93 36 5 1 0 22 113 45
Difficulty self-care 47,975 35,666 6,551 2,853 2,348 557 11,087 36,888 16,827
No, no difficulty 44,194 32,985 5,978 2,567 2,147 517 10,408 33,786 15,740
Yes, some difficulty 2,075 1,447 315 160 124 29 370 1,705 559
Yes, a lot of difficulty 883 630 128 84 34 7 166 717 263
Cannot do at all 823 604 130 42 43 4 143 680 265
Difficulty communicating 47,975 35,666 6,551 2,853 2,348 557 11,087 36,888 16,827
No, no difficulty 45,849 34,052 6,247 2,725 2,305 520 10,684 35,165 16,120
Yes, some difficulty 1,223 920 182 81 14 26 226 997 361
Yes, a lot of difficulty 497 382 73 26 10 6 83 414 170
Cannot do at all 406 312 49 21 19 5 94 312 176

Tonga 2016 Census of Population and Housing
Tonga Statistics Department
71
Table G 35: Population with three level of difficulties (some, and a lot of difficulty, cannot do at all) by age groups, division, and region
Division 2-5 6-9 10-14 15-19 20-24 25-29 30-34 35-39 40-44 45-49 50-54 55-59 60-64 65-69 70-74 75+
Tonga 6,440 3,449 990 515 431 436 446 449 565 927 1,101 1,323 1,484 1,697 2,084 5,192
Difficulty seeing 94 102 66 53 57 66 65 63 106 306 417 478 512 526 517 942
Difficulty hearing 108 162 115 77 57 59 46 48 58 82 96 110 169 199 301 830
Difficulty walking 868 191 99 78 71 73 83 105 120 205 282 388 447 517 554 1348
Difficulty remembering 536 234 84 78 68 67 68 70 78 99 109 110 118 169 283 798
Difficulty Selfcare 2969 2055 430 82 59 62 52 55 65 106 104 141 154 210 306 907
Difficulty Communication 1865 705 196 147 119 109 132 108 138 129 93 96 84 76 123 367
Tongatapu 4,703 2,531 776 376 312 328 348 320 435 683 794 936 1,053 1,187 1,481 3,580
Difficulty seeing 79 73 52 41 44 54 46 49 80 229 300 338 357 369 370 661
Difficulty hearing 91 121 88 52 41 46 31 31 39 60 65 78 126 147 214 581
Difficulty walking 655 146 80 54 49 57 57 66 86 141 195 258 307 346 389 907
Difficulty remembering 418 185 71 51 47 44 59 51 65 80 82 77 91 126 216 558
Difficulty Selfcare 2095 1469 324 57 41 42 45 36 52 75 78 111 110 147 207 615
Difficulty Communication 1365 537 161 121 90 85 110 87 113 98 74 74 62 52 85 258
Vava'u 883 458 122 89 60 57 53 88 61 140 160 180 227 272 333 998
Difficulty seeing 10 20 9 8 6 8 11 12 17 45 66 67 80 84 85 184
Difficulty hearing 12 28 12 17 7 10 8 12 13 15 19 18 24 30 49 155
Difficulty walking 123 26 10 13 11 9 11 23 12 32 41 61 69 93 85 254
Difficulty remembering 56 35 10 17 12 9 6 16 2 12 11 12 17 21 35 149
Difficulty Selfcare 412 269 54 16 9 10 5 11 5 16 11 15 24 33 58 183
Difficulty Communication 270 80 27 18 15 11 12 14 12 20 12 7 13 11 21 73
Ha'apai 522 284 53 22 45 30 22 14 45 65 79 133 132 151 156 337
Difficulty seeing 2 5 3 2 4 3 6 0 6 23 34 55 53 46 35 57
Difficulty hearing 2 7 9 3 7 2 3 3 5 6 7 11 12 14 22 53
Difficulty walking 66 10 2 4 9 5 6 6 9 18 23 40 44 50 46 100
Difficulty remembering 40 9 2 4 8 8 2 1 9 4 9 14 9 14 19 50
Difficulty Selfcare 249 187 31 6 8 6 1 2 6 9 5 8 10 18 25 57
Difficulty Communication 163 66 6 3 9 6 4 2 10 5 1 5 4 9 9 20
Eua 261 134 32 16 9 7 21 21 22 28 42 44 54 58 76 219
Difficulty seeing 1 1 2 1 1 0 2 2 2 6 12 13 18 21 19 33
Difficulty hearing 2 4 5 1 2 1 3 2 1 1 3 1 6 7 10 33
Difficulty walking 17 6 6 5 2 1 8 8 13 11 17 20 18 17 24 69
Difficulty remembering 7 1 0 3 0 2 1 1 2 2 1 2 1 5 7 31
Difficulty Selfcare 190 113 17 2 0 2 1 5 2 4 5 3 7 7 12 42
Difficulty Communication 44 9 2 4 4 1 6 3 2 4 4 5 4 1 4 11
Ongo Niua 71 42 7 12 5 14 2 6 2 11 26 30 18 29 38 58
Difficulty seeing 2 3 0 1 2 1 0 0 1 3 5 5 4 6 8 7
Difficulty hearing 1 2 1 4 0 0 1 0 0 0 2 2 1 1 6 8
Difficulty walking 7 3 1 2 0 1 1 2 0 3 6 9 9 11 10 18
Difficulty remembering 15 4 1 3 1 4 0 1 0 1 6 5 0 3 6 10
Difficulty Selfcare 23 17 4 1 1 2 0 1 0 2 5 4 3 5 4 10
Difficulty Communication 23 13 0 1 1 6 0 2 1 2 2 5 1 3 4 5
Urban 1,156 586 158 88 83 100 118 78 104 205 275 340 371 428 473 1,076

Tonga 2016 Census of Population and Housing
Tonga Statistics Department
72
Division 2-5 6-9 10-14 15-19 20-24 25-29 30-34 35-39 40-44 45-49 50-54 55-59 60-64 65-69 70-74 75+
Difficulty seeing 24 8 10 10 17 19 19 21 25 84 128 148 153 157 135 227
Difficulty hearing 24 17 12 10 9 16 12 9 9 15 21 31 42 44 65 177
Difficulty walking 163 32 17 12 15 12 20 14 18 37 58 81 104 117 115 278
Difficulty remembering 102 33 11 16 9 16 14 11 17 24 23 26 27 39 62 154
Difficulty Communication 343 127 35 24 22 26 39 17 25 23 22 28 18 16 28 61
Difficulty Selfcare 500 369 73 16 11 11 14 6 10 22 23 26 27 55 68 179
Rural 5,284 2,863 832 427 348 336 328 371 461 722 826 983 1,113 1,269 1,611 4,116
Difficulty seeing 70 94 56 43 40 47 46 42 81 222 289 330 359 369 382 715
Difficulty hearing 84 145 103 67 48 43 34 39 49 67 75 79 127 155 236 653
Difficulty walking 705 159 82 66 56 61 63 91 102 168 224 307 343 400 439 1070
Difficulty remembering 434 201 73 62 59 51 54 59 61 75 86 84 91 130 221 644
Difficulty Communication 1522 578 161 123 97 83 93 91 113 106 71 68 66 60 95 306
Difficulty Selfcare 2469 1686 357 66 48 51 38 49 55 84 81 115 127 155 238 728
Greater Nuku'alofa 2,031 967 283 160 147 151 188 133 194 318 389 476 511 566 671 1,503
Difficulty seeing 42 21 17 13 22 24 27 24 38 115 163 190 189 193 169 298
Difficulty hearing 38 35 22 15 14 22 15 9 18 22 30 37 59 63 93 243
Difficulty walking 299 52 23 19 23 20 30 22 31 56 86 119 149 166 176 397
Difficulty remembering 180 57 20 23 19 23 29 21 32 42 37 42 40 52 97 222
Difficulty Selfcare 877 590 119 27 19 19 25 13 22 34 33 48 43 72 96 251
Difficulty Communication 595 212 82 63 50 43 62 44 53 49 40 40 31 20 40 92

Tonga 2016 Census of Population and Housing
Tonga Statistics Department
73
Table G 36: Population with two level of difficulties (a lot of difficulty and cannot do at all) by 5 year-age groups
Total 2-5 6-9 10-14 15-19 20-24 25-29 30-34 35-39 40-44 45-49 50-54 55-59 60-64 65-69 70-74 75+
SEEING 858 51 53 24 25 24 22 19 22 19 38 35 51 65 72 92 246 Yes a lot of difficulties 610 13 15 13 9 12 8 10 15 10 30 27 40 55 63 79 211
Cannot do at all 248 38 38 11 16 12 14 9 7 9 8 8 11 10 9 13 35
HEARING 722 50 65 38 35 23 33 18 16 17 18 20 20 33 44 54 238
Yes a lot of difficulties 483 11 27 22 18 12 15 8 5 12 9 9 16 26 35 46 212 Cannot do at all 239 39 38 16 17 11 18 10 11 5 9 11 4 7 9 8 26
MOBILITY 2,178 290 82 60 49 45 36 41 57 50 86 94 141 141 170 202 634
Yes a lot of difficulties 1,248 193 21 11 12 16 8 8 17 11 40 47 73 100 122 132 437
Cannot do at all 930 97 61 49 37 29 28 33 40 39 46 47 68 41 48 70 197 MEMORY 933 146 68 39 49 43 48 34 40 41 45 31 35 21 28 53 212
Yes a lot of difficulties 653 99 22 22 23 28 32 24 29 27 35 21 27 14 23 41 186
Cannot do at all 280 47 46 17 26 15 16 10 11 14 10 10 8 7 5 12 26
SELFCARE 3,449 1,797 602 84 40 37 42 23 29 37 58 42 61 58 70 96 373 Yes a lot of difficulties 1,752 834 343 38 11 16 19 8 15 16 35 22 39 35 48 52 221
Cannot do at all 1,697 963 259 46 29 21 23 15 14 21 23 20 22 23 22 44 152
COMMUNICATION 1,932 722 204 101 82 70 73 87 65 95 83 57 56 41 30 38 128
Yes a lot of difficulties 1,079 508 93 39 31 31 39 35 29 45 41 23 21 15 15 21 93
Cannot do at all 853 214 111 62 51 39 34 52 36 50 42 34 35 26 15 17 35

Tonga 2016 Census of Population and Housing
Tonga Statistics Department
74
Table G 37: Population (5 years +) experiencing mentally illness by Island, District, and Region
Division by District Total
response
Total behavioural
affected Affected Mentally
Affected by Evil Spirit
Mental Retardation
Affected by Drugs
Affected by Being Elderly
Tonga 87,774 2,324 392 77 252 1,071 532
Tongatapu 65,016 1,783 283 55 168 916 361
Kolofo'ou 15,671 304 65 14 36 140 49
Kolomotu'a 15,010 444 88 26 41 240 49
Vaini 11,347 134 45 3 29 21 36
Tatakamotonga 6,114 247 20 2 12 152 61
Lapaha 6,225 130 26 6 19 39 40
Nukunuku 6,919 447 29 2 20 318 78
Kolovai 3,730 77 10 2 11 6 48
Vava'u 12,036 199 55 9 43 6 86
Neiafu 4,642 81 34 3 15 4 25
Pangaimotu 1,071 15 1 0 6 1 7
Hahake 1,763 21 6 1 10 0 4
Leimatu'a 2,127 32 7 1 6 0 18
Hihifo 1,775 37 6 3 3 1 24
Motu 658 13 1 1 3 0 8
Ha'apai 5,349 241 27 7 27 124 56
Pangai Hp 1,982 64 11 5 9 30 9
Foa 1,194 33 3 2 3 1 24
Lulunga 778 6 5 0 1 0 0
Mu'omu'a 375 7 4 0 2 0 1
Ha'ano 414 14 3 0 6 0 5
Uiha 606 117 1 0 6 93 17
'Eua 4,281 48 15 5 5 2 21
'Eua Motu'a 2,417 19 6 5 2 0 6
'Eua Fo'ou 1,864 29 9 0 3 2 15
Ongo Niua 1,092 53 12 1 9 23 8
Niuatoputapu 654 27 8 0 8 5 6
Niuafo'ou 438 26 4 1 1 18 2
Urban 20,291 453 78 9 46 266 54
Rural 67,483 1,871 314 68 206 805 478
Greater Nukualofa 30,681 748 153 40 77 380 98
Note: one person can have more than one behavioural or mental illness.

Tonga 2016 Census of Population and Housing
Tonga Statistics Department
75
Table G 38: Private Household with health complaint, illness or injury by sex, division and district
Division/District
Total With Health Complaint Without Health Complaint Not Stated
Total Male Female Total Male Female Total Male Female Total Male Female
TONGA 99,600 49,518 50,064 3,033 1,496 1,537 96,549 48,022 48,527 18 7 11 Tongatapu 73,750 36,540 37,192 2,227 1,092 1,135 71,505 35,448 36,057 18 7 11 Kolofo'ou 17,602 8,667 8,919 474 232 242 17,112 8,435 8,677 16 6 10 Kolomotu'a 16,946 8,395 8,551 546 247 299 16,400 8,148 8,252 0 0 0 Vaini 12,825 6,347 6,476 351 176 175 12,472 6,171 6,301 2 1 1 Tatakamotonga 7,020 3,476 3,544 317 162 155 6,703 3,314 3,389 0 0 0 Lapaha 7,109 3,505 3,604 254 133 121 6,855 3,372 3,483 0 0 0 Nukunuku 7,981 4,020 3,961 187 90 97 7,794 3,930 3,864 0 0 0 Kolovai 4,267 2,130 2,137 98 52 46 4,169 2,078 2,091 0 0 0 Vava'u 13,632 6,792 6,840 410 209 201 13,222 6,583 6,639 0 0 0 Neiafu 5,170 2,566 2,604 140 63 77 5,030 2,503 2,527 0 0 0 Pangaimotu 1,235 592 643 44 17 27 1,191 575 616 0 0 0 Hahake 2,028 1,015 1,013 63 40 23 1,965 975 990 0 0 0 Leimatu'a 2,489 1,257 1,232 90 43 47 2,399 1,214 1,185 0 0 0 Hihifo 1,989 1,010 979 55 34 21 1,934 976 958 0 0 0 Motu 721 352 369 18 12 6 703 340 363 0 0 0 Ha'apai 6,085 3,086 2,999 197 92 105 5,888 2,994 2,894 0 0 0 Pangai 2,187 1,103 1,084 73 38 35 2,114 1,065 1,049 0 0 0 Foa 1,383 690 693 60 27 33 1,323 663 660 0 0 0 Lulunga 923 483 440 23 9 14 900 474 426 0 0 0 Mu'omu'a 432 219 213 14 4 10 418 215 203 0 0 0 Ha`ano 478 241 237 9 4 5 469 237 232 0 0 0 'Uiha 682 350 332 18 10 8 664 340 324 0 0 0 'Eua 4,918 2,459 2,459 164 81 83 4,754 2,378 2,376 0 0 0 'Eua Prope 2,786 1,406 1,380 72 34 38 2,714 1,372 1,342 0 0 0 'Eua fo'ou 2,132 1,053 1,079 92 47 45 2,040 1,006 1,034 0 0 0 Ongo Niua 1,215 641 574 35 22 13 1,180 619 561 0 0 0 Niuatoputapu 722 377 345 29 17 12 693 360 333 0 0 0 Niuafo'ou 493 264 229 6 5 1 487 259 228 0 0 0
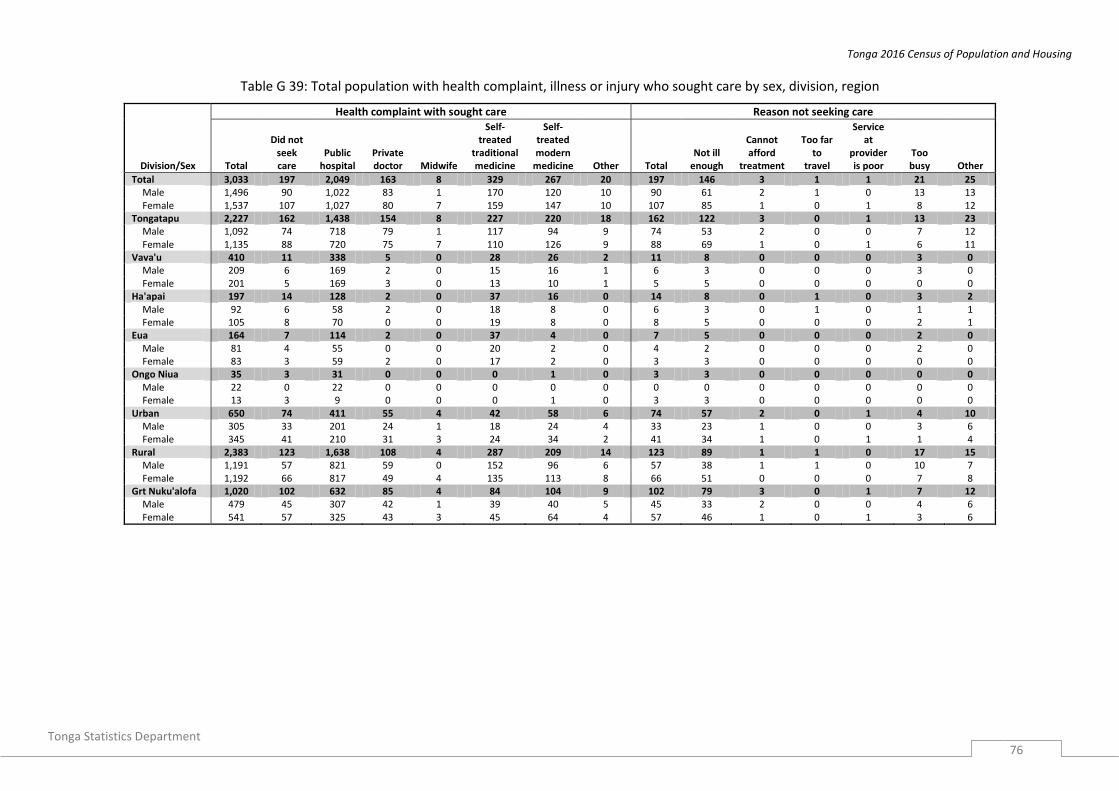
Tonga 2016 Census of Population and Housing
Tonga Statistics Department
76
Table G 39: Total population with health complaint, illness or injury who sought care by sex, division, region
Division/Sex
Health complaint with sought care Reason not seeking care
Total
Did not seek care
Public hospital
Private doctor Midwife
Self-treated
traditional medicine
Self-treated modern
medicine Other Total Not ill
enough
Cannot afford
treatment
Too far to
travel
Service at
provider is poor
Too busy Other
Total 3,033 197 2,049 163 8 329 267 20 197 146 3 1 1 21 25 Male 1,496 90 1,022 83 1 170 120 10 90 61 2 1 0 13 13 Female 1,537 107 1,027 80 7 159 147 10 107 85 1 0 1 8 12
Tongatapu 2,227 162 1,438 154 8 227 220 18 162 122 3 0 1 13 23 Male 1,092 74 718 79 1 117 94 9 74 53 2 0 0 7 12 Female 1,135 88 720 75 7 110 126 9 88 69 1 0 1 6 11
Vava'u 410 11 338 5 0 28 26 2 11 8 0 0 0 3 0 Male 209 6 169 2 0 15 16 1 6 3 0 0 0 3 0 Female 201 5 169 3 0 13 10 1 5 5 0 0 0 0 0
Ha'apai 197 14 128 2 0 37 16 0 14 8 0 1 0 3 2 Male 92 6 58 2 0 18 8 0 6 3 0 1 0 1 1 Female 105 8 70 0 0 19 8 0 8 5 0 0 0 2 1
Eua 164 7 114 2 0 37 4 0 7 5 0 0 0 2 0 Male 81 4 55 0 0 20 2 0 4 2 0 0 0 2 0 Female 83 3 59 2 0 17 2 0 3 3 0 0 0 0 0
Ongo Niua 35 3 31 0 0 0 1 0 3 3 0 0 0 0 0 Male 22 0 22 0 0 0 0 0 0 0 0 0 0 0 0 Female 13 3 9 0 0 0 1 0 3 3 0 0 0 0 0
Urban 650 74 411 55 4 42 58 6 74 57 2 0 1 4 10 Male 305 33 201 24 1 18 24 4 33 23 1 0 0 3 6 Female 345 41 210 31 3 24 34 2 41 34 1 0 1 1 4
Rural 2,383 123 1,638 108 4 287 209 14 123 89 1 1 0 17 15 Male 1,191 57 821 59 0 152 96 6 57 38 1 1 0 10 7 Female 1,192 66 817 49 4 135 113 8 66 51 0 0 0 7 8
Grt Nuku'alofa 1,020 102 632 85 4 84 104 9 102 79 3 0 1 7 12 Male 479 45 307 42 1 39 40 5 45 33 2 0 0 4 6 Female 541 57 325 43 3 45 64 4 57 46 1 0 1 3 6
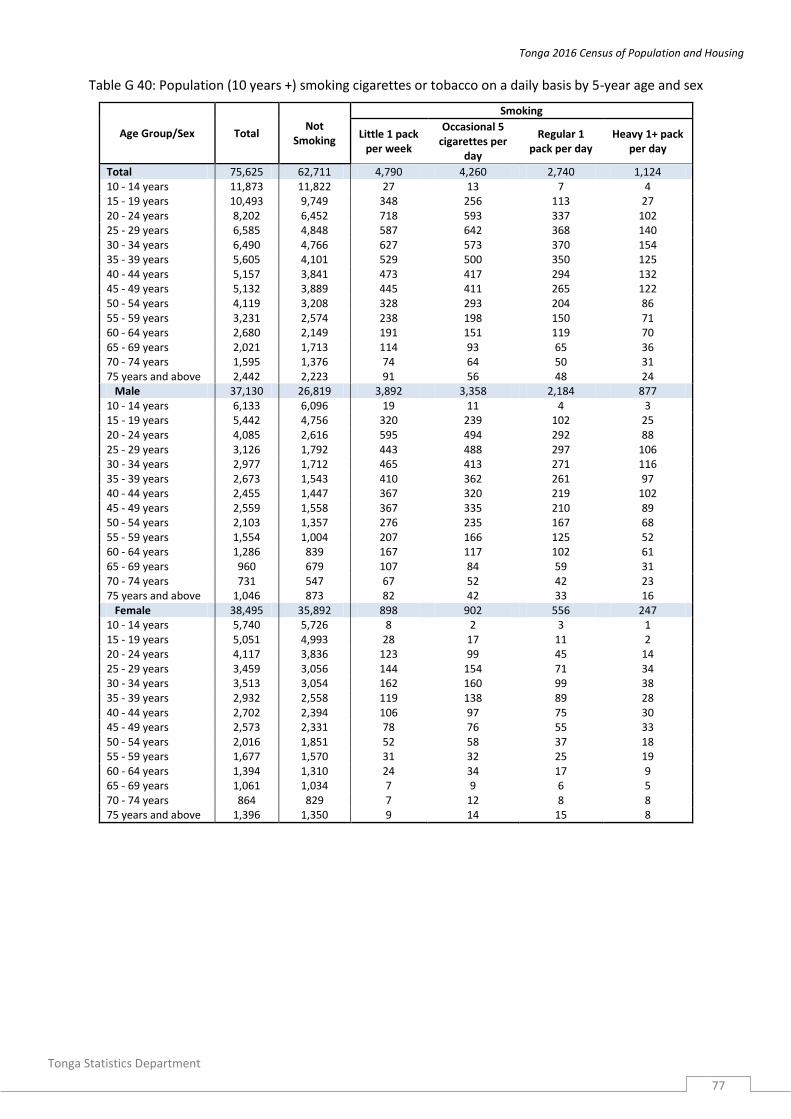
Tonga 2016 Census of Population and Housing
Tonga Statistics Department
77
Table G 40: Population (10 years +) smoking cigarettes or tobacco on a daily basis by 5-year age and sex
Age Group/Sex Total Not
Smoking
Smoking
Little 1 pack per week
Occasional 5 cigarettes per
day
Regular 1 pack per day
Heavy 1+ pack per day
Total 75,625 62,711 4,790 4,260 2,740 1,124 10 - 14 years 11,873 11,822 27 13 7 4 15 - 19 years 10,493 9,749 348 256 113 27 20 - 24 years 8,202 6,452 718 593 337 102 25 - 29 years 6,585 4,848 587 642 368 140 30 - 34 years 6,490 4,766 627 573 370 154 35 - 39 years 5,605 4,101 529 500 350 125 40 - 44 years 5,157 3,841 473 417 294 132 45 - 49 years 5,132 3,889 445 411 265 122 50 - 54 years 4,119 3,208 328 293 204 86 55 - 59 years 3,231 2,574 238 198 150 71 60 - 64 years 2,680 2,149 191 151 119 70 65 - 69 years 2,021 1,713 114 93 65 36 70 - 74 years 1,595 1,376 74 64 50 31 75 years and above 2,442 2,223 91 56 48 24 Male 37,130 26,819 3,892 3,358 2,184 877 10 - 14 years 6,133 6,096 19 11 4 3 15 - 19 years 5,442 4,756 320 239 102 25 20 - 24 years 4,085 2,616 595 494 292 88 25 - 29 years 3,126 1,792 443 488 297 106 30 - 34 years 2,977 1,712 465 413 271 116 35 - 39 years 2,673 1,543 410 362 261 97 40 - 44 years 2,455 1,447 367 320 219 102 45 - 49 years 2,559 1,558 367 335 210 89 50 - 54 years 2,103 1,357 276 235 167 68 55 - 59 years 1,554 1,004 207 166 125 52 60 - 64 years 1,286 839 167 117 102 61 65 - 69 years 960 679 107 84 59 31 70 - 74 years 731 547 67 52 42 23 75 years and above 1,046 873 82 42 33 16 Female 38,495 35,892 898 902 556 247 10 - 14 years 5,740 5,726 8 2 3 1 15 - 19 years 5,051 4,993 28 17 11 2 20 - 24 years 4,117 3,836 123 99 45 14 25 - 29 years 3,459 3,056 144 154 71 34 30 - 34 years 3,513 3,054 162 160 99 38 35 - 39 years 2,932 2,558 119 138 89 28 40 - 44 years 2,702 2,394 106 97 75 30 45 - 49 years 2,573 2,331 78 76 55 33 50 - 54 years 2,016 1,851 52 58 37 18 55 - 59 years 1,677 1,570 31 32 25 19 60 - 64 years 1,394 1,310 24 34 17 9 65 - 69 years 1,061 1,034 7 9 6 5 70 - 74 years 864 829 7 12 8 8 75 years and above 1,396 1,350 9 14 15 8

Tonga 2016 Census of Population and Housing
Tonga Statistics Department
78
Table G 41: Population (10 years +) smoking cigarettes and local tobacco on a daily basis by 5-year age group and sex
Age Group/
Sex
Imported Cigarette Tapaka Tonga
Total Not
Smok-ing
Smoking
Total Not
Smok-ing
Smoking
Little 1 pack
per week
Occasio-nal 5
cigare-ttes per
day
Regu-lar 1 pack per day
Hea-vy 1+ pack per day
Little 1-2
cigare-ttes per
day
Occasio-nal 5
cigare-ttes per
day
Regu-lar 10
cigare-ttes per day
Heavy 15
cigare-ttes per day
Total 75,625 62,711 4,790 4,260 2,740 1,124 75,625 65,228 3,355 3,054 2,483 1,505 10 - 14 11,873 11,822 27 13 7 4 11,873 11,825 20 18 5 5 15 - 19 10,493 9,749 348 256 113 27 10,493 9,818 249 219 152 55 20 - 24 8,202 6,452 718 593 337 102 8,202 6,837 463 392 338 172 25 - 29 6,585 4,848 587 642 368 140 6,585 5,312 421 388 292 172 30 - 34 6,490 4,766 627 573 370 154 6,490 5,161 434 390 331 174 35 - 39 5,605 4,101 529 500 350 125 5,605 4,470 375 313 285 162 40 - 44 5,157 3,841 473 417 294 132 5,157 4,131 325 291 238 172 45 - 49 5,132 3,889 445 411 265 122 5,132 4,116 310 317 247 142 50 - 54 4,119 3,208 328 293 204 86 4,119 3,369 199 245 181 125 55 - 59 3,231 2,574 238 198 150 71 3,231 2,660 193 139 131 108 60 - 64 2,680 2,149 191 151 119 70 2,680 2,216 129 138 104 93 65 - 69 2,021 1,713 114 93 65 36 2,021 1,698 94 93 87 49 70 - 74 1,595 1,376 74 64 50 31 1,595 1,376 74 59 42 44 75+ 2,442 2,223 91 56 48 24 2,442 2,239 69 52 50 32 Male 37,130 26,819 3,892 3,358 2,184 877 37,130 27,897 2,906 2,720 2,257 1,350 10 - 14 6,133 6,096 19 11 4 3 6,133 6,098 13 15 3 4 15 - 19 5,442 4,756 320 239 102 25 5,442 4,801 231 211 145 54 20 - 24 4,085 2,616 595 494 292 88 4,085 2,841 411 358 317 158 25 - 29 3,126 1,792 443 488 297 106 3,126 2,015 356 340 258 157 30 - 34 2,977 1,712 465 413 271 116 2,977 1,849 352 341 287 148 35 - 39 2,673 1,543 410 362 261 97 2,673 1,694 311 271 253 144 40 - 44 2,455 1,447 367 320 219 102 2,455 1,566 274 246 217 152 45 - 49 2,559 1,558 367 335 210 89 2,559 1,658 272 279 229 121 50 - 54 2,103 1,357 276 235 167 68 2,103 1,420 178 220 170 115 55 - 59 1,554 1,004 207 166 125 52 1,554 1,029 175 132 119 99 60 - 64 1,286 839 167 117 102 61 1,286 859 118 125 98 86 65 - 69 960 679 107 84 59 31 960 651 89 90 83 47 70 - 74 731 547 67 52 42 23 731 535 69 51 35 41 75+ 1,046 873 82 42 33 16 1,046 881 57 41 43 24 Female 38,495 35,892 898 902 556 247 38,495 37,331 449 334 226 155 10 - 14 5,740 5,726 8 2 3 1 5,740 5,727 7 3 2 1 15 - 19 5,051 4,993 28 17 11 2 5,051 5,017 18 8 7 1 20 - 24 4,117 3,836 123 99 45 14 4,117 3,996 52 34 21 14 25 - 29 3,459 3,056 144 154 71 34 3,459 3,297 65 48 34 15 30 - 34 3,513 3,054 162 160 99 38 3,513 3,312 82 49 44 26 35 - 39 2,932 2,558 119 138 89 28 2,932 2,776 64 42 32 18 40 - 44 2,702 2,394 106 97 75 30 2,702 2,565 51 45 21 20 45 - 49 2,573 2,331 78 76 55 33 2,573 2,458 38 38 18 21 50 - 54 2,016 1,851 52 58 37 18 2,016 1,949 21 25 11 10 55 - 59 1,677 1,570 31 32 25 19 1,677 1,631 18 7 12 9 60 - 64 1,394 1,310 24 34 17 9 1,394 1,357 11 13 6 7 65 - 69 1,061 1,034 7 9 6 5 1,061 1,047 5 3 4 2 70 - 74 864 829 7 12 8 8 864 841 5 8 7 3 75+ 1,396 1,350 9 14 15 8 1,396 1,358 12 11 7 8

Tonga 2016 Census of Population and Housing
Tonga Statistics Department
79
Table G 42: Population (10 years +) Smoking Imported Cigarettes and Local Tobacco by Island, District, and Region.
Division by District
Imported TOBACCO (Cigarettes) Tapaka Tonga
Total Not Smoking
Smoking
Total Not
Smoking
Smoking
Little 1 pack per
week
Occasional 5 cigarettes per
day
Regular 1 pack per
day
Heavy1 + pack per
day
Little 1 or 2 cigarettes per
day
Occasional 5 cigarettes per
day
Regular 10 cigarettes per
day
Heavy 15 cigarettes
per day
Tonga 75,625 62,711 4,790 4,260 2,740 1,124 75,625 65,228 3,355 3,054 2,483 1,505
Tongatapu 56,151 46,205 3,562 3,292 2,170 922 56,151 49,367 2,618 2,039 1,367 760
Kolofo'ou 13,661 11,178 963 791 531 198 13,661 12,331 587 388 254 101
Kolomotu'a 13,060 10,772 921 705 453 209 13,060 11,575 629 457 253 146
Vaini 9,740 7,994 470 682 393 201 9,740 8,489 468 372 251 160
Tatakamotonga 5,195 4,286 384 262 210 53 5,195 4,470 271 229 132 93
Lapaha 5,313 4,205 368 416 218 106 5,313 4,496 296 253 170 98
Nukunuku 5,970 5,145 313 261 193 58 5,970 5,245 284 219 147 75
Kolovai 3,212 2,625 143 175 172 97 3,212 2,761 83 121 160 87
Vava'u 10,277 8,729 665 494 297 92 10,277 8,733 412 468 447 217
Neiafu 4,009 3,422 257 214 101 15 4,009 3,475 167 209 122 36
Pangaimotu 921 779 73 41 25 3 921 784 21 38 59 19
Hahake 1,502 1,321 62 75 21 23 1,502 1,333 51 35 59 24
Leimatu'a 1,751 1,458 112 71 84 26 1,751 1,458 71 66 101 55
Hihifo 1,531 1,288 114 67 45 17 1,531 1,234 57 91 81 68
Motu 563 461 47 26 21 8 563 449 45 29 25 15
Ha'apai 4,563 3,823 286 251 166 37 4,563 3,597 166 274 376 150
Pangai Hp 1,752 1,476 90 89 81 16 1,752 1,437 57 62 125 71
Foa 996 863 47 54 16 16 996 797 28 67 74 30
Lulunga 632 513 62 37 18 2 632 452 36 47 69 28
Mu'omu'a 308 239 27 19 21 2 308 251 18 16 22 1
Ha'ano 357 289 12 33 23 0 357 261 9 22 52 13
Uiha 518 443 48 19 7 1 518 399 18 60 34 7
'Eua 3,671 3,116 246 171 77 61 3,671 2,809 133 230 236 263
'Eua Motu'a 2,052 1,832 136 42 34 8 2,052 1,623 96 116 145 72
'Eua Fo'ou 1,619 1,284 110 129 43 53 1,619 1,186 37 114 91 191
Ongo Niua 963 838 31 52 30 12 963 722 26 43 57 115

Tonga 2016 Census of Population and Housing
Tonga Statistics Department
80
Division by District
Imported TOBACCO (Cigarettes) Tapaka Tonga
Total Not Smoking
Smoking
Total Not
Smoking
Smoking
Little 1 pack per
week
Occasional 5 cigarettes per
day
Regular 1 pack per
day
Heavy1 + pack per
day
Little 1 or 2 cigarettes per
day
Occasional 5 cigarettes per
day
Regular 10 cigarettes per
day
Heavy 15 cigarettes
per day
Niuatoputapu 571 523 14 16 9 9 571 453 18 9 20 71
Niuafo'ou 392 315 17 36 21 3 392 269 8 34 37 44
Urban 17,737 14,599 1,254 1,006 645 233 17,737 16,052 775 491 301 118
Rural 57,888 48,112 3,536 3,254 2,095 891 57,888 49,176 2,580 2,563 2,182 1,387
Grt Nukualofa 26,721 21,950 1,884 1,496 984 407 26,721 23,906 1,216 845 507 247

Tonga 2016 Census of Population and Housing
Tonga Statistics Department
81
Table G 43: Population (10 years +) and How often they drink Alcoholo and Kava Tonga by Island, District and Region
Division by District
ALCOHOL KAVA
Total No, not drinking
Rarely 1-2 drinks per
week Occassional 3-7 drinks per week
Some 8-14 drinks per
week Regularly 15-21 drinks per week
Frequently 22+ drinks per week Total
No, Not drinking
Special occasions
Once a week
2-3 times per week
4-6 times per week
Every day/night
Tonga 75,625 64,940 7,357 2,449 513 264 102 75,625 62,133 3,598 3,708 4,444 1,137 605
Tongatapu 56,151 47,857 5,668 1,993 343 209 81 56,151 46,940 2,765 2,687 2,787 594 378
Kolofo'ou 13,661 11,179 1,630 622 109 90 31 13,661 11,641 703 625 536 115 41
Kolomotu'a 13,060 11,049 1,461 431 77 27 15 13,060 10,861 652 696 615 132 104
Vaini 9,740 8,429 828 386 49 36 12 9,740 8,105 412 496 517 120 90
Tatakamotonga 5,195 4,520 503 122 32 12 6 5,195 4,243 307 241 306 64 34
Lapaha 5,313 4,424 602 219 43 14 11 5,313 4,415 303 215 283 60 37
Nukunuku 5,970 5,361 432 129 24 20 4 5,970 5,095 247 262 267 41 58
Kolovai 3,212 2,895 212 84 9 10 2 3,212 2,580 141 152 263 62 14
Vava'u 10,277 9,094 891 189 77 19 7 10,277 8,159 439 510 822 275 72
Neiafu 4,009 3,446 415 101 33 11 3 4,009 3,255 164 193 280 91 26
Pangaimotu 921 802 92 15 7 4 1 921 711 16 53 103 32 6
Hahake 1,502 1,409 66 15 11 1 0 1,502 1,240 77 58 105 18 4
Leimatu'a 1,751 1,538 157 36 18 1 1 1,751 1,379 95 79 105 75 18
Hihifo 1,531 1,406 108 10 3 2 2 1,531 1,168 55 93 163 50 2
Motu 563 493 53 12 5 0 0 563 406 32 34 66 9 16
Ha'apai 4,563 4,024 373 116 37 9 4 4,563 3,488 216 276 399 148 36
Pangai Hp 1,752 1,484 167 68 23 8 2 1,752 1,385 76 91 140 46 14
Foa 996 896 83 15 1 0 1 996 776 46 51 84 31 8
Lulunga 632 582 34 12 4 0 0 632 440 37 43 66 45 1
Mu'omu'a 308 279 19 6 2 1 1 308 238 10 18 25 14 3
Ha'ano 357 333 22 1 1 0 0 357 262 28 35 32 0 0
Uiha 518 450 48 14 6 0 0 518 387 19 38 52 12 10
'Eua 3,671 3,155 328 120 39 21 8 3,671 2,873 152 179 328 61 78
'Eua Motu'a 2,052 1,794 202 37 15 2 2 2,052 1,596 83 106 204 42 21
'Eua Fo'ou 1,619 1,361 126 83 24 19 6 1,619 1,277 69 73 124 19 57
Ongo Niua 963 810 97 31 17 6 2 963 673 26 56 108 59 41
Niuatoputapu 571 471 54 22 17 5 2 571 400 10 30 50 46 35
Niuafo'ou 392 339 43 9 0 1 0 392 273 16 26 58 13 6
Urban 17,737 14,519 2,227 756 128 74 33 17,737 15,022 919 871 722 125 78
Rural 57,888 50,421 5,130 1,693 385 190 69 57,888 47,111 2,679 2,837 3,722 1,012 527
Greater Nukualofa 26,721 22,228 3,091 1,053 186 117 46 26,721 22,502 1,355 1,321 1,151 247 145

Tonga 2016 Census of Population and Housing
Tonga Statistics Department
82
Table G 44: Total population (3 years +) currently attending school or other education by type of school, age and sex
School Attendance Total 3-4 5-9 10-14 15-19 20-24 25-29 30-34 35-39 40-44 45-49 50-54 55-60 60-64 65+
Total 92,846 5,072 12,149 11,873 10,493 8,202 6,585 6,490 5,605 5,157 5,132 4,119 3,231 2,680 6,058
Currently attending school 34,119 1,135 11,069 11,652 7,653 1,565 349 228 143 93 72 66 31 22 41
Not currently attending school 58,727 3,937 1,080 221 2,840 6,637 6,236 6,262 5,462 5,064 5,060 4,053 3,200 2,658 6,017
Type of school attending 34,119 1,135 11,069 11,652 7,653 1,565 349 228 143 93 72 66 31 22 41
Government or Public School 20,292 207 9,139 7,128 2,722 680 155 101 43 30 23 25 8 10 21
Private or Church School 13,075 922 1,895 4,489 4,799 597 105 61 70 40 32 28 13 8 16
Overseas school / institution 752 6 35 35 132 288 89 66 30 23 17 13 10 4 4
Male 46,096 2,550 6,416 6,133 5,442 4,085 3,126 2,977 2,673 2,455 2,559 2,103 1,554 1,286 2,737
Currently attending school 17,397 547 5,828 6,009 3,783 718 182 92 74 45 41 37 14 9 18
Not currently attending school 28,699 2,003 588 124 1,659 3,367 2,944 2,885 2,599 2,410 2,518 2,066 1,540 1,277 2,719
Type of school attending 17,397 547 5,828 6,009 3,783 718 182 92 74 45 41 37 14 9 18
Government or Public School 10,722 105 4,842 3,758 1,485 324 83 44 20 17 16 14 1 3 10
Private or Church School 6,370 440 966 2,235 2,248 293 58 21 40 20 18 15 6 4 6
Overseas school / institution 305 2 20 16 50 101 41 27 14 8 7 8 7 2 2
Female 46,750 2,522 5,733 5,740 5,051 4,117 3,459 3,513 2,932 2,702 2,573 2,016 1,677 1,394 3,321
Currently attending school 16,722 588 5,241 5,643 3,870 847 167 136 69 48 31 29 17 13 23
Not currently attending school 30,028 1,934 492 97 1,181 3,270 3,292 3,377 2,863 2,654 2,542 1,987 1,660 1,381 3,298
Type of school attending 16,722 588 5,241 5,643 3,870 847 167 136 69 48 31 29 17 13 23
Government or Public School 9,570 102 4,297 3,370 1,237 356 72 57 23 13 7 11 7 7 11
Private or Church School 6,705 482 929 2,254 2,551 304 47 40 30 20 14 13 7 4 10
Overseas school / institution 447 4 15 19 82 187 48 39 16 15 10 5 3 2 2
Note: Excludes non-residents occupying institutions.

Tonga 2016 Census of Population and Housing
Tonga Statistics Department
83
Table G 45: Total population (3 year +) currently attending school or other education by type of school, age, and region.
Total Currently
attending school
Not currently at
school
Type of school attending
Total Government Church Overseas
Tonga 92,846 34,119 58,727 34,119 20,292 13,075 752
3-4 5,072 1,135 3,937 1,135 207 922 6
5-9 12,149 11,069 1,080 11,069 9,139 1,895 35
10-14 11,873 11,652 221 11,652 7,128 4,489 35
15-19 10,493 7,653 2,840 7,653 2,722 4,799 132
20-24 8,202 1,565 6,637 1,565 680 597 288
25-29 6,585 349 6,236 349 155 105 89
30-34 6,490 228 6,262 228 101 61 66
35-39 5,605 143 5,462 143 43 70 30
40-44 5,157 93 5,064 93 30 40 23
45-49 5,132 72 5,060 72 23 32 17
50-54 4,119 66 4,053 66 25 28 13
55-60 3,231 31 3,200 31 8 13 10
60-64 2,680 22 2,658 22 10 8 4
65+ 6,058 41 6,017 41 21 16 4
Tongatapu 68,754 25,062 43,692 25,062 14,109 10,310 643
3-4 3,738 745 2,993 745 98 642 5
5-9 8,865 8,067 798 8,067 6,428 1,609 30
10-14 8,615 8,466 149 8,466 4,907 3,529 30
15-19 7,767 5,614 2,153 5,614 1,750 3,744 120
20-24 6,466 1,315 5,151 1,315 587 493 235
25-29 5,114 309 4,805 309 138 94 77
30-34 4,990 189 4,801 189 77 52 60
35-39 4,227 117 4,110 117 35 56 26
40-44 3,769 71 3,698 71 23 30 18
45-49 3,734 56 3,678 56 20 22 14
50-54 2,991 49 2,942 49 20 17 12
55-60 2,327 21 2,306 21 5 7 9
60-64 1,924 15 1,909 15 7 5 3
65+ 4,227 28 4,199 28 14 10 4
Vava'u 12,712 4,885 7,827 4,885 3,144 1,678 63
3-4 676 203 473 203 38 164 1
5-9 1,759 1608 151 1608 1448 155 5
10-14 1,752 1705 47 1705 1123 578 4
15-19 1,464 1111 353 1111 445 660 6
20-24 923 143 780 143 45 66 32
25-29 728 23 705 23 10 4 9
30-34 763 21 742 21 13 6 2
35-39 685 14 671 14 4 10 0
40-44 741 12 729 12 4 6 2
45-49 750 9 741 9 2 6 1
50-54 606 15 591 15 4 10 1
55-60 460 5 455 5 1 4 0
60-64 391 6 385 6 3 3 0

Tonga 2016 Census of Population and Housing
Tonga Statistics Department
84
Total Currently
attending school
Not currently at
school
Type of school attending
Total Government Church Overseas
65+ 1,014 10 1004 10 4 6 0
Ha'apai 5,660 2,062 3,598 2,062 1,320 715 27
3-4 311 98 213 98 44 54 0
5-9 786 729 57 729 635 94 0
10-14 696 690 6 690 422 268 0
15-19 616 428 188 428 165 260 3
20-24 416 60 356 60 28 17 15
25-29 384 10 374 10 4 5 1
30-34 375 13 362 13 8 2 3
35-39 370 10 360 10 4 4 2
40-44 337 7 330 7 3 4 0
45-49 312 6 306 6 1 4 1
50-54 243 2 241 2 1 1 0
55-60 215 5 210 5 2 2 1
60-64 180 1 179 1 0 0 1
65+ 419 3 416 3 3 0 0
'Eua 4,553 1,724 2,829 1,724 1,378 328 18
3-4 272 47 225 47 10 37 0
5-9 610 553 57 553 524 29 0
10-14 651 649 2 649 537 111 1
15-19 521 419 102 419 287 129 3
20-24 323 41 282 41 16 19 6
25-29 286 6 280 6 3 2 1
30-34 303 3 300 3 1 1 1
35-39 254 2 252 2 0 0 2
40-44 245 3 242 3 0 0 3
45-49 272 1 271 1 0 0 1
50-54 211 0 211 0 0 0 0
55-60 165 0 165 0 0 0 0
60-64 141 0 141 0 0 0 0
65+ 299 0 299 0 0 0 0
Ongo Niua 1,167 386 781 386 341 44 1
3-4 75 42 33 42 17 25 0
5-9 129 112 17 112 104 8 0
10-14 159 142 17 142 139 3 0
15-19 125 81 44 81 75 6 0
20-24 74 6 68 6 4 2 0
25-29 73 1 72 1 0 0 1
30-34 59 2 57 2 2 0 0
35-39 69 0 69 0 0 0 0
40-44 65 0 65 0 0 0 0
45-49 64 0 64 0 0 0 0
50-54 68 0 68 0 0 0 0
55-60 64 0 64 0 0 0 0
60-64 44 0 44 0 0 0 0

Tonga 2016 Census of Population and Housing
Tonga Statistics Department
85
Total Currently
attending school
Not currently at
school
Type of school attending
Total Government Church Overseas
65+ 99 0 99 0 0 0 0
Urban 21,361 7,659 13,702 7,659 4,353 3,059 247
3-4 1,070 230 840 230 27 201 2
5-9 2,554 2,374 180 2,374 1,875 492 7
10-14 2,513 2,475 38 2,475 1,464 1,001 10
15-19 2,367 1,827 540 1,827 650 1,124 53
20-24 2,045 466 1,579 466 202 169 95
25-29 1,726 106 1,620 106 47 30 29
30-34 1,622 62 1,560 62 29 10 23
35-39 1,342 33 1,309 33 15 13 5
40-44 1,184 25 1,159 25 11 4 10
45-49 1,180 18 1,162 18 8 6 4
50-54 989 16 973 16 9 5 2
55-60 786 9 777 9 4 1 4
60-64 621 7 614 7 4 0 3
65+ 1,362 11 1,351 11 8 3 0
Rural 71,485 26,460 45,025 26,460 15,939 10,016 505
3-4 4,002 905 3,097 905 180 721 4
5-9 9,595 8,695 900 8,695 7,264 1,403 28
10-14 9,360 9,177 183 9,177 5,664 3,488 25
15-19 8,126 5,826 2,300 5,826 2,072 3,675 79
20-24 6,157 1,099 5,058 1,099 478 428 193
25-29 4,859 243 4,616 243 108 75 60
30-34 4,868 166 4,702 166 72 51 43
35-39 4,263 110 4,153 110 28 57 25
40-44 3,973 68 3,905 68 19 36 13
45-49 3,952 54 3,898 54 15 26 13
50-54 3,130 50 3,080 50 16 23 11
55-60 2,445 22 2,423 22 4 12 6
60-64 2,059 15 2,044 15 6 8 1
65+ 4,696 30 4,666 30 13 13 4
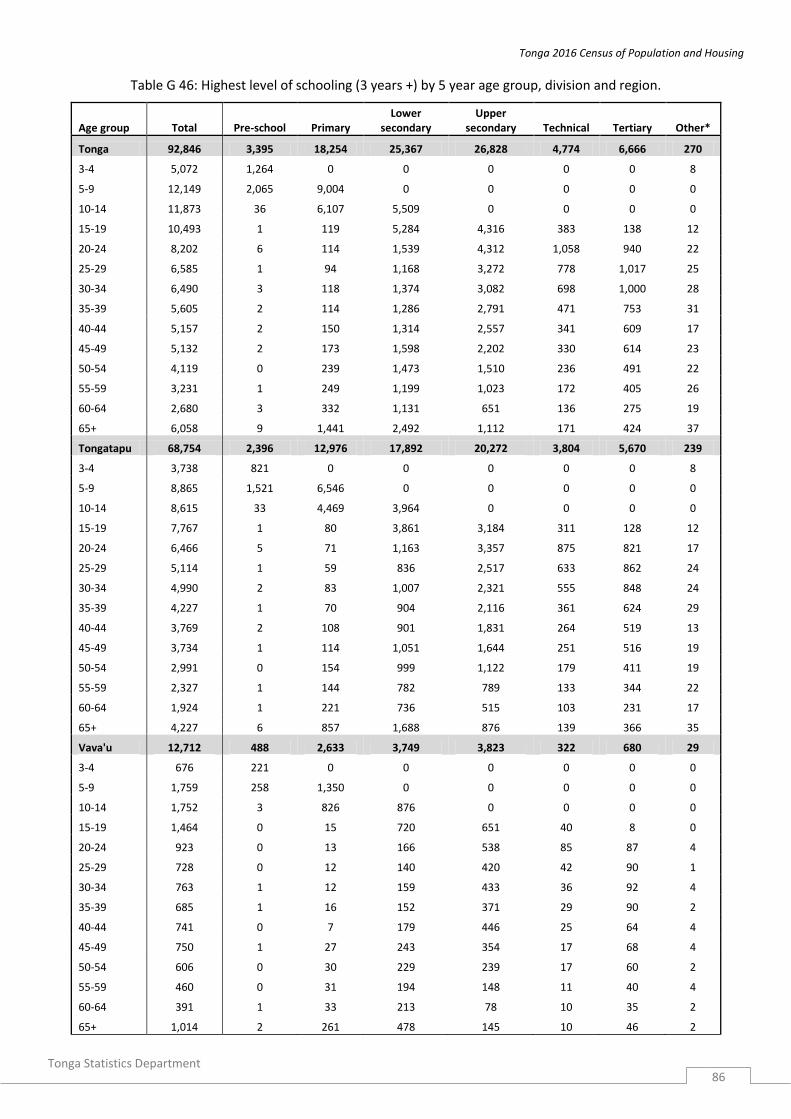
Tonga 2016 Census of Population and Housing
Tonga Statistics Department
86
Table G 46: Highest level of schooling (3 years +) by 5 year age group, division and region.
Age group Total Pre-school Primary Lower
secondary Upper
secondary Technical Tertiary Other*
Tonga 92,846 3,395 18,254 25,367 26,828 4,774 6,666 270
3-4 5,072 1,264 0 0 0 0 0 8
5-9 12,149 2,065 9,004 0 0 0 0 0
10-14 11,873 36 6,107 5,509 0 0 0 0
15-19 10,493 1 119 5,284 4,316 383 138 12
20-24 8,202 6 114 1,539 4,312 1,058 940 22
25-29 6,585 1 94 1,168 3,272 778 1,017 25
30-34 6,490 3 118 1,374 3,082 698 1,000 28
35-39 5,605 2 114 1,286 2,791 471 753 31
40-44 5,157 2 150 1,314 2,557 341 609 17
45-49 5,132 2 173 1,598 2,202 330 614 23
50-54 4,119 0 239 1,473 1,510 236 491 22
55-59 3,231 1 249 1,199 1,023 172 405 26
60-64 2,680 3 332 1,131 651 136 275 19
65+ 6,058 9 1,441 2,492 1,112 171 424 37
Tongatapu 68,754 2,396 12,976 17,892 20,272 3,804 5,670 239
3-4 3,738 821 0 0 0 0 0 8
5-9 8,865 1,521 6,546 0 0 0 0 0
10-14 8,615 33 4,469 3,964 0 0 0 0
15-19 7,767 1 80 3,861 3,184 311 128 12
20-24 6,466 5 71 1,163 3,357 875 821 17
25-29 5,114 1 59 836 2,517 633 862 24
30-34 4,990 2 83 1,007 2,321 555 848 24
35-39 4,227 1 70 904 2,116 361 624 29
40-44 3,769 2 108 901 1,831 264 519 13
45-49 3,734 1 114 1,051 1,644 251 516 19
50-54 2,991 0 154 999 1,122 179 411 19
55-59 2,327 1 144 782 789 133 344 22
60-64 1,924 1 221 736 515 103 231 17
65+ 4,227 6 857 1,688 876 139 366 35
Vava'u 12,712 488 2,633 3,749 3,823 322 680 29
3-4 676 221 0 0 0 0 0 0
5-9 1,759 258 1,350 0 0 0 0 0
10-14 1,752 3 826 876 0 0 0 0
15-19 1,464 0 15 720 651 40 8 0
20-24 923 0 13 166 538 85 87 4
25-29 728 0 12 140 420 42 90 1
30-34 763 1 12 159 433 36 92 4
35-39 685 1 16 152 371 29 90 2
40-44 741 0 7 179 446 25 64 4
45-49 750 1 27 243 354 17 68 4
50-54 606 0 30 229 239 17 60 2
55-59 460 0 31 194 148 11 40 4
60-64 391 1 33 213 78 10 35 2
65+ 1,014 2 261 478 145 10 46 2

Tonga 2016 Census of Population and Housing
Tonga Statistics Department
87
Age group Total Pre-school Primary Lower
secondary Upper
secondary Technical Tertiary Other*
Ha'apai 5,660 257 1,357 1,798 1,432 267 198 2
3-4 311 123 0 0 0 0 0 0
5-9 786 131 598 0 0 0 0 0
10-14 696 0 356 334 0 0 0 0
15-19 616 0 14 295 288 13 1 0
20-24 416 1 24 95 224 36 22 1
25-29 384 0 15 108 167 38 43 0
30-34 375 0 18 102 178 38 33 0
35-39 370 0 17 120 166 45 17 0
40-44 337 0 24 127 130 26 19 0
45-49 312 0 21 142 99 27 18 0
50-54 243 0 32 112 65 17 12 1
55-59 215 0 40 102 42 10 15 0
60-64 180 1 44 93 21 9 7 0
65+ 419 1 154 168 52 8 11 0
Eua 4,553 188 1,019 1,583 1,049 354 64 0
3-4 272 54 0 0 0 0 0 0
5-9 610 134 419 0 0 0 0 0
10-14 651 0 379 270 0 0 0 0
15-19 521 0 7 357 137 18 1 0
20-24 323 0 5 101 151 58 6 0
25-29 286 0 6 69 133 60 15 0
30-34 303 0 5 91 130 64 13 0
35-39 254 0 9 91 110 34 9 0
40-44 245 0 9 90 119 24 3 0
45-49 272 0 10 133 87 33 8 0
50-54 211 0 14 97 75 19 2 0
55-59 165 0 22 86 36 16 5 0
60-64 141 0 19 70 35 14 1 0
65+ 299 0 115 128 36 14 1 0
Ongo Niua 1,167 66 269 345 252 27 54 0
3-4 75 45 0 0 0 0 0 0
5-9 129 21 91 0 0 0 0 0
10-14 159 0 77 65 0 0 0 0
15-19 125 0 3 51 56 1 0 0
20-24 74 0 1 14 42 4 4 0
25-29 73 0 2 15 35 5 7 0
30-34 59 0 0 15 20 5 14 0
35-39 69 0 2 19 28 2 13 0
40-44 65 0 2 17 31 2 4 0
45-49 64 0 1 29 18 2 4 0
50-54 68 0 9 36 9 4 6 0
55-59 64 0 12 35 8 2 1 0
60-64 44 0 15 19 2 0 1 0
65+ 99 0 54 30 3 0 0 0
Urban 21,361 690 3,676 4,853 6,657 1,400 2,459 82

Tonga 2016 Census of Population and Housing
Tonga Statistics Department
88
Age group Total Pre-school Primary Lower
secondary Upper
secondary Technical Tertiary Other*
3-4 1,070 244 0 0 0 0 0 2
5-9 2,554 429 1,945 0 0 0 0 0
10-14 2,513 14 1,232 1,229 0 0 0 0
15-19 2,367 0 23 1,055 1,061 113 66 1
20-24 2,045 2 26 271 1,027 313 349 5
25-29 1,726 0 27 215 810 233 372 9
30-34 1,622 0 16 241 760 199 353 5
35-39 1,342 0 16 217 673 122 268 7
40-44 1,184 0 39 215 574 101 210 4
45-49 1,180 0 29 269 544 93 201 7
50-54 989 0 44 261 388 69 192 2
55-59 786 0 26 194 304 51 161 13
60-64 621 0 44 207 186 40 103 7
65+ 1,362 1 209 479 330 66 184 20
Rural 71,485 2,705 14,578 20,514 20,171 3,374 4,207 188
3-4 4,002 1,020 0 0 0 0 0 6
5-9 9,595 1,636 7,059 0 0 0 0 0
10-14 9,360 22 4,875 4,280 0 0 0 0
15-19 8,126 1 96 4,229 3,255 270 72 11
20-24 6,157 4 88 1,268 3,285 745 591 17
25-29 4,859 1 67 953 2,462 545 645 16
30-34 4,868 3 102 1,133 2,322 499 647 23
35-39 4,263 2 98 1,069 2,118 349 485 24
40-44 3,973 2 111 1,099 1,983 240 399 13
45-49 3,952 2 144 1,329 1,658 237 413 16
50-54 3,130 0 195 1,212 1,122 167 299 20
55-59 2,445 1 223 1,005 719 121 244 13
60-64 2,059 3 288 924 465 96 172 12
65+ 4,696 8 1,232 2,013 782 105 240 17 Grt Nuku'alofa 32,389 975 5,730 7,457 9,821 1,936 3,717 142
3-4 1,708 370 0 0 0 0 0 3
5-9 3,960 588 3,035 0 0 0 0 0
10-14 3,876 14 1,911 1,875 0 0 0 0
15-19 3,598 0 29 1,572 1,625 168 96 6
20-24 3,116 2 34 436 1,566 446 529 11
25-29 2,568 0 32 325 1,200 322 572 13
30-34 2,459 0 34 391 1,114 277 543 11
35-39 2,058 0 30 348 1,021 175 407 17
40-44 1,790 0 61 326 850 142 334 7
45-49 1,743 0 47 402 769 119 320 12
50-54 1,442 0 64 395 552 88 281 7
55-59 1,153 0 42 327 414 73 227 18
60-64 918 0 78 316 261 47 153 10
65+ 2,000 1 333 744 449 79 255 27 Rest of Tonga 60,457 2,420 12,524 17,910 17,007 2,838 2,949 128
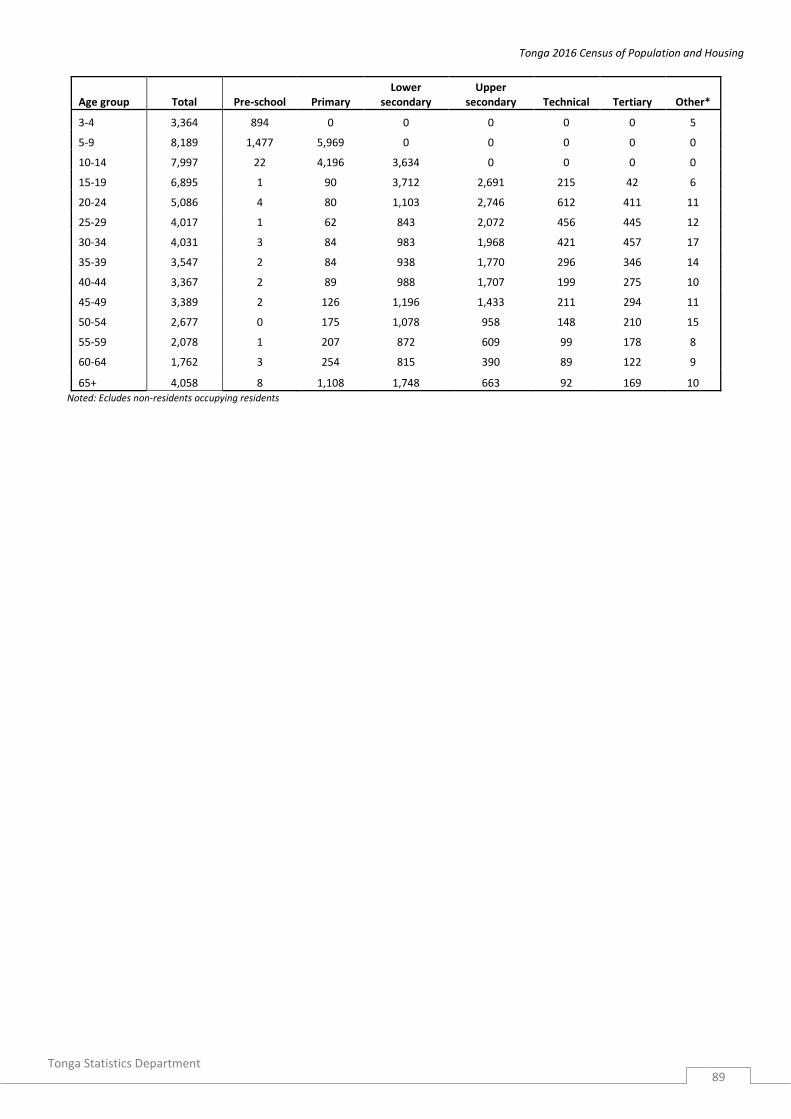
Tonga 2016 Census of Population and Housing
Tonga Statistics Department
89
Age group Total Pre-school Primary Lower
secondary Upper
secondary Technical Tertiary Other*
3-4 3,364 894 0 0 0 0 0 5
5-9 8,189 1,477 5,969 0 0 0 0 0
10-14 7,997 22 4,196 3,634 0 0 0 0
15-19 6,895 1 90 3,712 2,691 215 42 6
20-24 5,086 4 80 1,103 2,746 612 411 11
25-29 4,017 1 62 843 2,072 456 445 12
30-34 4,031 3 84 983 1,968 421 457 17
35-39 3,547 2 84 938 1,770 296 346 14
40-44 3,367 2 89 988 1,707 199 275 10
45-49 3,389 2 126 1,196 1,433 211 294 11
50-54 2,677 0 175 1,078 958 148 210 15
55-59 2,078 1 207 872 609 99 178 8
60-64 1,762 3 254 815 390 89 122 9
65+ 4,058 8 1,108 1,748 663 92 169 10 Noted: Ecludes non-residents occupying residents

Tonga 2016 Census of Population and Housing
Tonga Statistics Department
90
Table G 47: Currently attending school or other education (3 years +) by highest level and grade of schooling, by 5 year age group and sex
Level of school Total 3-4 5-9 10-14 15-19 20-24 25-29 30-34 35+
T M F T M F T M F T M F T M F T M F T M F T M F T M F
Total 34,119 17,397 16,722 1,135 547 588 11,069 5,828 5,241 11,652 6,009 5,643 7,653 3,783 3,870 1,565 718 847 349 182 167 228 92 136 468 238 230
Pre-school 1,849 908 941 1,133 546 587 716 362 354 0 0 0 0 0 0 0 0 0 0 0 0 0 0 0 0 0 0
Primary 15,079 7,954 7,125 0 0 0 10,353 5,466 4,887 4,726 2,488 2,238 0 0 0 0 0 0 0 0 0 0 0 0 0 0 0
CIass 1 2,692 1,463 1,229 0 0 0 2,692 1,463 1,229 0 0 0 0 0 0 0 0 0 0 0 0 0 0 0 0 0 0
CIass 2 2,391 1,323 1,068 0 0 0 2,391 1,323 1,068 0 0 0 0 0 0 0 0 0 0 0 0 0 0 0 0 0 0
CIass 3 2,279 1,171 1,108 0 0 0 2,252 1,159 1,093 27 12 15 0 0 0 0 0 0 0 0 0 0 0 0 0 0 0
CIass 4 2,326 1,175 1,151 0 0 0 2,164 1090 1074 162 85 77 0 0 0 0 0 0 0 0 0 0 0 0 0 0 0
CIass 5 2,341 1,252 1,089 0 0 0 806 403 403 1,535 849 686 0 0 0 0 0 0 0 0 0 0 0 0 0 0 0
CIass 6 3,050 1,570 1,480 0 0 0 48 28 20 3,002 1,542 1,460 0 0 0 0 0 0 0 0 0 0 0 0 0 0 0 Lower secondary 9,457 4,940 4,517 0 0 0 0 0 0 6,869 3,492 3,377 2,582 1,445 1,137 6 3 3 0 0 0 0 0 0 0 0 0
Form 1 2,067 1,054 1,013 0 0 0 0 0 0 2,052 1,048 1,004 15 6 9 0 0 0 0 0 0 0 0 0 0 0 0
Form 2 2,552 1,308 1,244 0 0 0 0 0 0 2,462 1,254 1208 90 54 36 0 0 0 0 0 0 0 0 0 0 0 0
Form 3 2,395 1,295 1,100 0 0 0 0 0 0 1813 942 871 582 353 229 0 0 0 0 0 0 0 0 0 0 0 0
Form 4 2,443 1,283 1,160 0 0 0 0 0 0 542 248 294 1,895 1,032 863 6 3 3 0 0 0 0 0 0 0 0 0 Upper secondary 4,558 2,068 2,490 0 0 0 0 0 0 57 29 28 4,325 1,953 2,372 176 86 90 0 0 0 0 0 0 0 0 0
Form 5 2,475 1164 1,311 0 0 0 0 0 0 56 29 27 2,389 1120 1269 30 15 15 0 0 0 0 0 0 0 0 0
Form 6 1,343 588 755 0 0 0 0 0 0 1 0 1 1276 555 721 66 33 33 0 0 0 0 0 0 0 0 0
Form 7 740 316 424 0 0 0 0 0 0 0 0 0 660 278 382 80 38 42 0 0 0 0 0 0 0 0 0 Technical & Vocational 1390 846 544 0 0 0 0 0 0 0 0 0 478 300 178 582 344 238 123 83 40 68 43 25 139 76 63
Year 1 708 403 305 0 0 0 0 0 0 0 0 0 312 188 124 244 134 110 42 24 18 25 16 9 85 41 44
Year 2 378 237 141 0 0 0 0 0 0 0 0 0 124 80 44 187 116 71 30 20 10 13 7 6 24 14 10
Year 3 304 206 98 0 0 0 0 0 0 0 0 0 42 32 10 151 94 57 51 39 12 30 20 10 30 21 9
Tertiary* 1589 606 983 0 0 0 0 0 0 0 0 0 245 78 167 752 269 483 204 91 113 136 42 94 252 126 126
Certificate 491 194 297 0 0 0 0 0 0 0 0 0 120 34 86 239 89 150 47 29 18 27 9 18 58 33 25
Diploma 585 199 386 0 0 0 0 0 0 0 0 0 83 29 54 308 103 205 74 24 50 43 7 36 77 36 41 Bachelor's degree 439 181 258 0 0 0 0 0 0 0 0 0 39 14 25 192 73 119 72 32 40 55 23 32 81 39 42
Master's degree 48 19 29 0 0 0 0 0 0 0 0 0 1 0 1 7 2 5 7 5 2 9 3 6 24 9 15
Other professional degree 22 11 11 0 0 0 0 0 0 0 0 0 1 1 0 6 2 4 4 1 3 2 0 2 9 7 2

Tonga 2016 Census of Population and Housing
Tonga Statistics Department
91
Level of school Total 3-4 5-9 10-14 15-19 20-24 25-29 30-34 35+
T M F T M F T M F T M F T M F T M F T M F T M F T M F
Doctorate degree 4 2 2 0 0 0 0 0 0 0 0 0 1 0 1 0 0 0 0 0 0 0 0 0 3 2 1
Others 197 75 122 2 1 1 0 0 0 0 0 0 23 7 16 49 16 33 22 8 14 24 7 17 77 36 41
* Refers to the type of tertiary education level which includes certificate, diploma, bachelor's degree, master's degree or doctorate degree.

Tonga 2016 Census of Population and Housing
Tonga Statistics Department
92
Table G 48: Tertiary qualification achieved (15 years +) by sex, division, district, village and region.
Total Certificate Diploma Bachelor's degree Master's degree Other professional
qualifications Doctorate degree
Total M F Total M F Total M F Total M F Total M F Total M F Total M F
TONGA 6,666 2,941 3,725 1,554 674 880 2,962 1,180 1,782 1,424 686 738 534 285 249 106 60 46 86 56 30 Tongatapu 5,670 2,488 3,182 1,275 542 733 2,444 960 1,484 1,279 613 666 499 270 229 94 52 42 79 51 28
Kolofo'ou 1,628 740 888 341 154 187 635 242 393 410 214 196 178 96 82 33 17 16 31 17 14 Kolofo'ou 806 390 416 140 68 72 249 107 142 258 126 132 117 67 50 19 9 10 23 13 10 Ma'ufanga 629 270 359 150 65 85 303 111 192 114 61 53 45 23 22 11 8 3 6 2 4 Popua 187 78 109 48 21 27 81 23 58 38 27 11 15 5 10 3 0 3 2 2 0 Tukutonga 5 1 4 3 0 3 2 1 1 0 0 0 0 0 0 0 0 0 0 0 0 Pangaimotu 1 1 0 0 0 0 0 0 0 0 0 0 1 1 0 0 0 0 0 0 0
Kolomotu'a 2,089 924 1,165 460 206 254 923 356 567 440 209 231 194 109 85 45 24 21 27 20 7 Kolomotu'a 1,024 456 568 206 99 107 452 171 281 229 107 122 91 51 40 31 18 13 15 10 5 Havelu 415 168 247 98 37 61 190 66 124 84 40 44 33 20 13 7 3 4 3 2 1 Tofoa 481 212 269 129 52 77 192 78 114 96 44 52 55 31 24 4 2 2 5 5 0 Hofoa 57 28 29 8 6 2 33 14 19 7 3 4 5 2 3 1 0 1 3 3 0 Puke 47 23 24 8 5 3 25 12 13 9 5 4 3 1 2 1 0 1 1 0 1 Sia'atoutai 65 37 28 11 7 4 31 15 16 15 10 5 7 4 3 1 1 0 0 0 0
Vaini 731 318 413 155 60 95 312 138 174 186 79 107 59 29 30 8 6 2 11 6 5 Vaini 236 105 131 53 23 30 113 50 63 52 20 32 16 10 6 1 1 0 1 1 0 Malapo 25 7 18 3 1 2 12 4 8 8 2 6 2 0 2 0 0 0 0 0 0 Longoteme 13 9 4 4 2 2 5 4 1 1 0 1 2 2 0 1 1 0 0 0 0 Folaha 38 15 23 14 6 8 16 5 11 7 3 4 0 0 0 0 0 0 1 1 0 Nukuhetulu 13 6 7 2 1 1 11 5 6 0 0 0 0 0 0 0 0 0 0 0 0 Veitongo 42 24 18 13 8 5 15 11 4 12 4 8 0 0 0 0 0 0 2 1 1 Ha'ateiho 179 71 108 33 7 26 65 26 39 52 27 25 17 4 13 6 4 2 6 3 3 Pea 122 51 71 17 6 11 51 21 30 39 15 24 14 9 5 0 0 0 1 0 1 Tokomololo 63 30 33 16 6 10 24 12 12 15 8 7 8 4 4 0 0 0 0 0 0
Tatakamotonga 238 118 120 56 27 29 82 41 41 76 36 40 20 12 8 2 1 1 2 1 1 Tatakamotonga 60 29 31 13 5 8 17 7 10 20 9 11 10 8 2 0 0 0 0 0 0 Holonga 10 5 5 1 1 0 0 0 0 6 2 4 2 1 1 0 0 0 1 1 0 Pelehake 14 5 9 3 1 2 0 0 0 9 4 5 1 0 1 0 0 0 1 0 1 Fua'amotu 110 64 46 27 16 11 47 28 19 30 17 13 6 3 3 0 0 0 0 0 0 Nakolo 13 4 9 6 1 5 7 3 4 0 0 0 0 0 0 0 0 0 0 0 0 Ha'asini 10 3 7 2 0 2 4 1 3 3 1 2 0 0 0 1 1 0 0 0 0 Lavengatonga 7 4 3 2 2 0 1 0 1 4 2 2 0 0 0 0 0 0 0 0 0 Haveluliku 0 0 0 0 0 0 0 0 0 0 0 0 0 0 0 0 0 0 0 0 0 Fatumu 14 4 10 2 1 1 6 2 4 4 1 3 1 0 1 1 0 1 0 0 0
Lapaha 221 89 132 48 17 31 107 40 67 45 19 26 18 10 8 1 1 0 2 2 0 Lapaha 75 33 42 22 9 13 26 11 15 18 9 9 8 3 5 0 0 0 1 1 0 Talasiu 2 1 1 1 0 1 0 0 0 1 1 0 0 0 0 0 0 0 0 0 0 Hoi 9 3 6 1 1 0 5 1 4 2 0 2 1 1 0 0 0 0 0 0 0 Nukuleka 1 1 0 0 0 0 1 1 0 0 0 0 0 0 0 0 0 0 0 0 0 Makaunga 3 0 3 1 0 1 1 0 1 1 0 1 0 0 0 0 0 0 0 0 0 Talafo'ou 10 6 4 3 1 2 4 3 1 1 0 1 1 1 0 0 0 0 1 1 0 Manuka 5 1 4 1 0 1 4 1 3 0 0 0 0 0 0 0 0 0 0 0 0

Tonga 2016 Census of Population and Housing
Tonga Statistics Department
93
Total Certificate Diploma Bachelor's degree Master's degree Other professional
qualifications Doctorate degree
Total M F Total M F Total M F Total M F Total M F Total M F Total M F
Navutoka 38 11 27 7 2 5 26 6 20 3 1 2 1 1 0 1 1 0 0 0 0 Kolonga 33 12 21 6 0 6 18 9 9 6 2 4 3 1 2 0 0 0 0 0 0 Afa 4 3 1 0 0 0 2 1 1 1 1 0 1 1 0 0 0 0 0 0 0 Niutoua 41 18 23 6 4 2 20 7 13 12 5 7 3 2 1 0 0 0 0 0 0 Eueiki 0 0 0 0 0 0 0 0 0 0 0 0 0 0 0 0 0 0 0 0 0 Fukave 0 0 0 0 0 0 0 0 0 0 0 0 0 0 0 0 0 0 0 0 0
Nukunuku 505 211 294 127 55 72 256 101 155 89 38 51 24 10 14 3 2 1 6 5 1 Nukunuku 154 63 91 40 15 25 78 32 46 23 8 15 7 3 4 3 2 1 3 3 0 Matahau 17 6 11 3 2 1 11 3 8 3 1 2 0 0 0 0 0 0 0 0 0 Matafonua 10 3 7 4 1 3 6 2 4 0 0 0 0 0 0 0 0 0 0 0 0 Fatai 19 7 12 4 0 4 11 4 7 3 3 0 1 0 1 0 0 0 0 0 0 Lakepa 12 7 5 2 2 0 9 4 5 1 1 0 0 0 0 0 0 0 0 0 0 Vaotu'u 44 18 26 11 7 4 20 7 13 9 1 8 2 2 0 0 0 0 2 1 1 Utulau 60 25 35 14 5 9 33 14 19 10 6 4 3 0 3 0 0 0 0 0 0 Ha'alalo 16 7 9 2 0 2 10 5 5 4 2 2 0 0 0 0 0 0 0 0 0 Ha'akame 27 13 14 5 4 1 15 5 10 7 4 3 0 0 0 0 0 0 0 0 0 Houma 146 62 84 42 19 23 63 25 38 29 12 17 11 5 6 0 0 0 1 1 0
Kolovai 258 88 170 88 23 65 129 42 87 33 18 15 6 4 2 2 1 1 0 0 0 Kolovai 43 14 29 16 4 12 17 5 12 8 4 4 0 0 0 2 1 1 0 0 0 Te'ekiu 40 15 25 11 4 7 20 7 13 5 1 4 4 3 1 0 0 0 0 0 0 Masilamea 6 3 3 3 1 2 1 0 1 2 2 0 0 0 0 0 0 0 0 0 0 Fahefa 19 8 11 7 2 5 10 5 5 2 1 1 0 0 0 0 0 0 0 0 0 Ha'utu 17 6 11 6 2 4 10 3 7 1 1 0 0 0 0 0 0 0 0 0 0 Kala'au 8 2 6 4 1 3 4 1 3 0 0 0 0 0 0 0 0 0 0 0 0 Fo'ui 33 13 20 13 4 9 16 5 11 4 4 0 0 0 0 0 0 0 0 0 0 Ha'avakatolo 32 11 21 5 1 4 23 9 14 3 1 2 1 0 1 0 0 0 0 0 0 Ahau 26 5 21 13 2 11 11 3 8 2 0 2 0 0 0 0 0 0 0 0 0 Kanokupolu 22 6 16 4 0 4 12 2 10 5 3 2 1 1 0 0 0 0 0 0 0 Ha'atafu 8 3 5 4 1 3 3 1 2 1 1 0 0 0 0 0 0 0 0 0 0 Atata 4 2 2 2 1 1 2 1 1 0 0 0 0 0 0 0 0 0 0 0 0
Vava'u 680 302 378 203 96 107 371 151 220 84 44 40 9 1 8 10 7 3 3 3 0 Neiafu 386 171 215 120 57 63 193 73 120 58 33 25 5 1 4 8 5 3 2 2 0
Neiafu 309 141 168 90 44 46 157 60 97 49 30 19 4 1 3 7 4 3 2 2 0 Makave 27 9 18 7 3 4 13 3 10 6 3 3 1 0 1 0 0 0 0 0 0 Toula 21 11 10 9 5 4 9 5 4 2 0 2 0 0 0 1 1 0 0 0 0 Utui 11 6 5 2 1 1 9 5 4 0 0 0 0 0 0 0 0 0 0 0 0 Ofu 9 3 6 7 3 4 1 0 1 1 0 1 0 0 0 0 0 0 0 0 0 Okoa 5 0 5 3 0 3 2 0 2 0 0 0 0 0 0 0 0 0 0 0 0 Olo'ua 4 1 3 2 1 1 2 0 2 0 0 0 0 0 0 0 0 0 0 0 0
Pangaimotu 51 21 30 12 6 6 32 12 20 5 2 3 1 0 1 1 1 0 0 0 0 Pangaimotu 24 9 15 5 4 1 13 3 10 4 1 3 1 0 1 1 1 0 0 0 0 Utulei 9 6 3 3 1 2 6 5 1 0 0 0 0 0 0 0 0 0 0 0 0 Nga'unoho 3 2 1 0 0 0 2 1 1 1 1 0 0 0 0 0 0 0 0 0 0 Utungake 15 4 11 4 1 3 11 3 8 0 0 0 0 0 0 0 0 0 0 0 0 Tapana 0 0 0 0 0 0 0 0 0 0 0 0 0 0 0 0 0 0 0 0 0
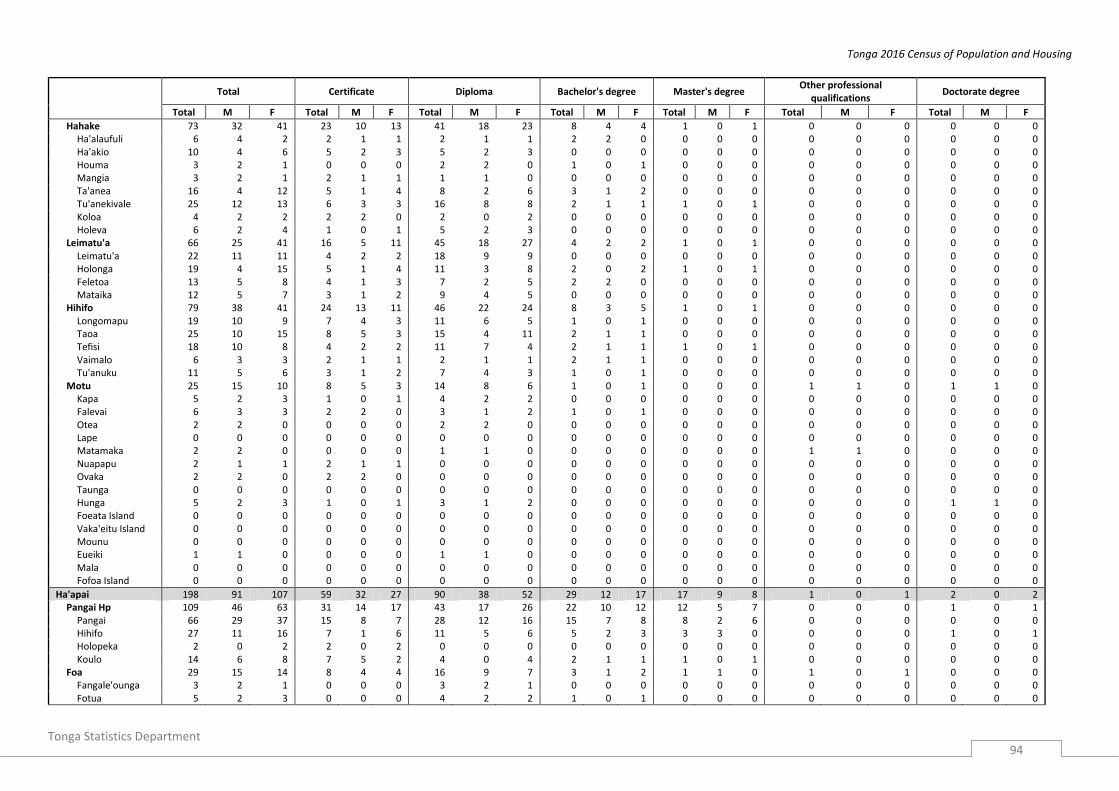
Tonga 2016 Census of Population and Housing
Tonga Statistics Department
94
Total Certificate Diploma Bachelor's degree Master's degree Other professional
qualifications Doctorate degree
Total M F Total M F Total M F Total M F Total M F Total M F Total M F
Hahake 73 32 41 23 10 13 41 18 23 8 4 4 1 0 1 0 0 0 0 0 0 Ha'alaufuli 6 4 2 2 1 1 2 1 1 2 2 0 0 0 0 0 0 0 0 0 0 Ha'akio 10 4 6 5 2 3 5 2 3 0 0 0 0 0 0 0 0 0 0 0 0 Houma 3 2 1 0 0 0 2 2 0 1 0 1 0 0 0 0 0 0 0 0 0 Mangia 3 2 1 2 1 1 1 1 0 0 0 0 0 0 0 0 0 0 0 0 0 Ta'anea 16 4 12 5 1 4 8 2 6 3 1 2 0 0 0 0 0 0 0 0 0 Tu'anekivale 25 12 13 6 3 3 16 8 8 2 1 1 1 0 1 0 0 0 0 0 0 Koloa 4 2 2 2 2 0 2 0 2 0 0 0 0 0 0 0 0 0 0 0 0 Holeva 6 2 4 1 0 1 5 2 3 0 0 0 0 0 0 0 0 0 0 0 0
Leimatu'a 66 25 41 16 5 11 45 18 27 4 2 2 1 0 1 0 0 0 0 0 0 Leimatu'a 22 11 11 4 2 2 18 9 9 0 0 0 0 0 0 0 0 0 0 0 0 Holonga 19 4 15 5 1 4 11 3 8 2 0 2 1 0 1 0 0 0 0 0 0 Feletoa 13 5 8 4 1 3 7 2 5 2 2 0 0 0 0 0 0 0 0 0 0 Mataika 12 5 7 3 1 2 9 4 5 0 0 0 0 0 0 0 0 0 0 0 0
Hihifo 79 38 41 24 13 11 46 22 24 8 3 5 1 0 1 0 0 0 0 0 0 Longomapu 19 10 9 7 4 3 11 6 5 1 0 1 0 0 0 0 0 0 0 0 0 Taoa 25 10 15 8 5 3 15 4 11 2 1 1 0 0 0 0 0 0 0 0 0 Tefisi 18 10 8 4 2 2 11 7 4 2 1 1 1 0 1 0 0 0 0 0 0 Vaimalo 6 3 3 2 1 1 2 1 1 2 1 1 0 0 0 0 0 0 0 0 0 Tu'anuku 11 5 6 3 1 2 7 4 3 1 0 1 0 0 0 0 0 0 0 0 0
Motu 25 15 10 8 5 3 14 8 6 1 0 1 0 0 0 1 1 0 1 1 0 Kapa 5 2 3 1 0 1 4 2 2 0 0 0 0 0 0 0 0 0 0 0 0 Falevai 6 3 3 2 2 0 3 1 2 1 0 1 0 0 0 0 0 0 0 0 0 Otea 2 2 0 0 0 0 2 2 0 0 0 0 0 0 0 0 0 0 0 0 0 Lape 0 0 0 0 0 0 0 0 0 0 0 0 0 0 0 0 0 0 0 0 0 Matamaka 2 2 0 0 0 0 1 1 0 0 0 0 0 0 0 1 1 0 0 0 0 Nuapapu 2 1 1 2 1 1 0 0 0 0 0 0 0 0 0 0 0 0 0 0 0 Ovaka 2 2 0 2 2 0 0 0 0 0 0 0 0 0 0 0 0 0 0 0 0 Taunga 0 0 0 0 0 0 0 0 0 0 0 0 0 0 0 0 0 0 0 0 0 Hunga 5 2 3 1 0 1 3 1 2 0 0 0 0 0 0 0 0 0 1 1 0 Foeata Island 0 0 0 0 0 0 0 0 0 0 0 0 0 0 0 0 0 0 0 0 0 Vaka'eitu Island 0 0 0 0 0 0 0 0 0 0 0 0 0 0 0 0 0 0 0 0 0 Mounu 0 0 0 0 0 0 0 0 0 0 0 0 0 0 0 0 0 0 0 0 0 Eueiki 1 1 0 0 0 0 1 1 0 0 0 0 0 0 0 0 0 0 0 0 0 Mala 0 0 0 0 0 0 0 0 0 0 0 0 0 0 0 0 0 0 0 0 0 Fofoa Island 0 0 0 0 0 0 0 0 0 0 0 0 0 0 0 0 0 0 0 0 0
Ha'apai 198 91 107 59 32 27 90 38 52 29 12 17 17 9 8 1 0 1 2 0 2 Pangai Hp 109 46 63 31 14 17 43 17 26 22 10 12 12 5 7 0 0 0 1 0 1
Pangai 66 29 37 15 8 7 28 12 16 15 7 8 8 2 6 0 0 0 0 0 0 Hihifo 27 11 16 7 1 6 11 5 6 5 2 3 3 3 0 0 0 0 1 0 1 Holopeka 2 0 2 2 0 2 0 0 0 0 0 0 0 0 0 0 0 0 0 0 0 Koulo 14 6 8 7 5 2 4 0 4 2 1 1 1 0 1 0 0 0 0 0 0
Foa 29 15 14 8 4 4 16 9 7 3 1 2 1 1 0 1 0 1 0 0 0 Fangale'ounga 3 2 1 0 0 0 3 2 1 0 0 0 0 0 0 0 0 0 0 0 0 Fotua 5 2 3 0 0 0 4 2 2 1 0 1 0 0 0 0 0 0 0 0 0
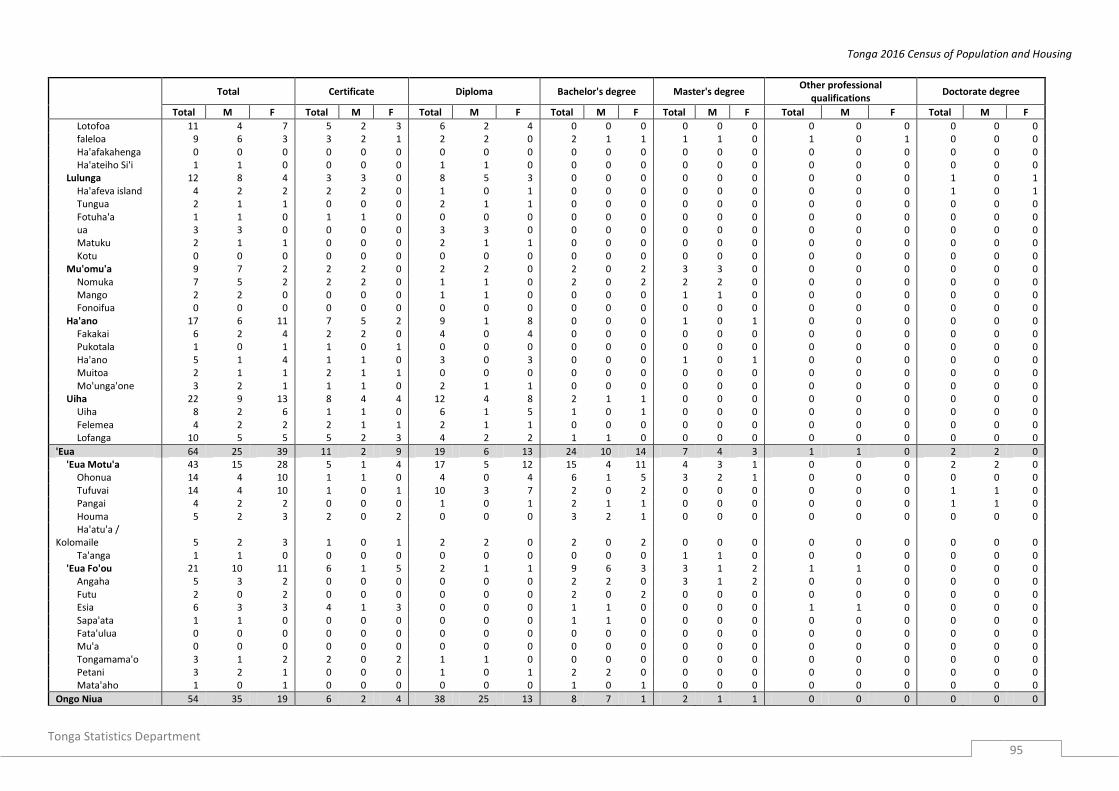
Tonga 2016 Census of Population and Housing
Tonga Statistics Department
95
Total Certificate Diploma Bachelor's degree Master's degree Other professional
qualifications Doctorate degree
Total M F Total M F Total M F Total M F Total M F Total M F Total M F
Lotofoa 11 4 7 5 2 3 6 2 4 0 0 0 0 0 0 0 0 0 0 0 0 faleloa 9 6 3 3 2 1 2 2 0 2 1 1 1 1 0 1 0 1 0 0 0 Ha'afakahenga 0 0 0 0 0 0 0 0 0 0 0 0 0 0 0 0 0 0 0 0 0 Ha'ateiho Si'i 1 1 0 0 0 0 1 1 0 0 0 0 0 0 0 0 0 0 0 0 0
Lulunga 12 8 4 3 3 0 8 5 3 0 0 0 0 0 0 0 0 0 1 0 1 Ha'afeva island 4 2 2 2 2 0 1 0 1 0 0 0 0 0 0 0 0 0 1 0 1 Tungua 2 1 1 0 0 0 2 1 1 0 0 0 0 0 0 0 0 0 0 0 0 Fotuha'a 1 1 0 1 1 0 0 0 0 0 0 0 0 0 0 0 0 0 0 0 0 ua 3 3 0 0 0 0 3 3 0 0 0 0 0 0 0 0 0 0 0 0 0 Matuku 2 1 1 0 0 0 2 1 1 0 0 0 0 0 0 0 0 0 0 0 0 Kotu 0 0 0 0 0 0 0 0 0 0 0 0 0 0 0 0 0 0 0 0 0
Mu'omu'a 9 7 2 2 2 0 2 2 0 2 0 2 3 3 0 0 0 0 0 0 0 Nomuka 7 5 2 2 2 0 1 1 0 2 0 2 2 2 0 0 0 0 0 0 0 Mango 2 2 0 0 0 0 1 1 0 0 0 0 1 1 0 0 0 0 0 0 0 Fonoifua 0 0 0 0 0 0 0 0 0 0 0 0 0 0 0 0 0 0 0 0 0
Ha'ano 17 6 11 7 5 2 9 1 8 0 0 0 1 0 1 0 0 0 0 0 0 Fakakai 6 2 4 2 2 0 4 0 4 0 0 0 0 0 0 0 0 0 0 0 0 Pukotala 1 0 1 1 0 1 0 0 0 0 0 0 0 0 0 0 0 0 0 0 0 Ha'ano 5 1 4 1 1 0 3 0 3 0 0 0 1 0 1 0 0 0 0 0 0 Muitoa 2 1 1 2 1 1 0 0 0 0 0 0 0 0 0 0 0 0 0 0 0 Mo'unga'one 3 2 1 1 1 0 2 1 1 0 0 0 0 0 0 0 0 0 0 0 0
Uiha 22 9 13 8 4 4 12 4 8 2 1 1 0 0 0 0 0 0 0 0 0 Uiha 8 2 6 1 1 0 6 1 5 1 0 1 0 0 0 0 0 0 0 0 0 Felemea 4 2 2 2 1 1 2 1 1 0 0 0 0 0 0 0 0 0 0 0 0 Lofanga 10 5 5 5 2 3 4 2 2 1 1 0 0 0 0 0 0 0 0 0 0
'Eua 64 25 39 11 2 9 19 6 13 24 10 14 7 4 3 1 1 0 2 2 0 'Eua Motu'a 43 15 28 5 1 4 17 5 12 15 4 11 4 3 1 0 0 0 2 2 0
Ohonua 14 4 10 1 1 0 4 0 4 6 1 5 3 2 1 0 0 0 0 0 0 Tufuvai 14 4 10 1 0 1 10 3 7 2 0 2 0 0 0 0 0 0 1 1 0 Pangai 4 2 2 0 0 0 1 0 1 2 1 1 0 0 0 0 0 0 1 1 0 Houma 5 2 3 2 0 2 0 0 0 3 2 1 0 0 0 0 0 0 0 0 0 Ha'atu'a /
Kolomaile 5 2 3 1 0 1 2 2 0 2 0 2 0 0 0 0 0 0 0 0 0 Ta'anga 1 1 0 0 0 0 0 0 0 0 0 0 1 1 0 0 0 0 0 0 0
'Eua Fo'ou 21 10 11 6 1 5 2 1 1 9 6 3 3 1 2 1 1 0 0 0 0 Angaha 5 3 2 0 0 0 0 0 0 2 2 0 3 1 2 0 0 0 0 0 0 Futu 2 0 2 0 0 0 0 0 0 2 0 2 0 0 0 0 0 0 0 0 0 Esia 6 3 3 4 1 3 0 0 0 1 1 0 0 0 0 1 1 0 0 0 0 Sapa'ata 1 1 0 0 0 0 0 0 0 1 1 0 0 0 0 0 0 0 0 0 0 Fata'ulua 0 0 0 0 0 0 0 0 0 0 0 0 0 0 0 0 0 0 0 0 0 Mu'a 0 0 0 0 0 0 0 0 0 0 0 0 0 0 0 0 0 0 0 0 0 Tongamama'o 3 1 2 2 0 2 1 1 0 0 0 0 0 0 0 0 0 0 0 0 0 Petani 3 2 1 0 0 0 1 0 1 2 2 0 0 0 0 0 0 0 0 0 0 Mata'aho 1 0 1 0 0 0 0 0 0 1 0 1 0 0 0 0 0 0 0 0 0
Ongo Niua 54 35 19 6 2 4 38 25 13 8 7 1 2 1 1 0 0 0 0 0 0

Tonga 2016 Census of Population and Housing
Tonga Statistics Department
96
Total Certificate Diploma Bachelor's degree Master's degree Other professional
qualifications Doctorate degree
Total M F Total M F Total M F Total M F Total M F Total M F Total M F
Niuatoputapu 30 19 11 3 1 2 23 15 8 3 3 0 1 0 1 0 0 0 0 0 0 Hihifo 14 9 5 2 1 1 10 7 3 1 1 0 1 0 1 0 0 0 0 0 0 Vaipoa 2 1 1 0 0 0 1 0 1 1 1 0 0 0 0 0 0 0 0 0 0 Falehau 14 9 5 1 0 1 12 8 4 1 1 0 0 0 0 0 0 0 0 0 0 Tafahi 0 0 0 0 0 0 0 0 0 0 0 0 0 0 0 0 0 0 0 0 0
Niuafo'ou 24 16 8 3 1 2 15 10 5 5 4 1 1 1 0 0 0 0 0 0 0 Esia 2 2 0 0 0 0 1 1 0 1 1 0 0 0 0 0 0 0 0 0 0 Kolofo'ou 3 2 1 1 1 0 0 0 0 2 1 1 0 0 0 0 0 0 0 0 0 Sapaata 17 11 6 2 0 2 12 8 4 2 2 0 1 1 0 0 0 0 0 0 0 Fata'ulua 0 0 0 0 0 0 0 0 0 0 0 0 0 0 0 0 0 0 0 0 0 Mata'aho 0 0 0 0 0 0 0 0 0 0 0 0 0 0 0 0 0 0 0 0 0 Mu'a 0 0 0 0 0 0 0 0 0 0 0 0 0 0 0 0 0 0 0 0 0 Tongamama'o 0 0 0 0 0 0 0 0 0 0 0 0 0 0 0 0 0 0 0 0 0 Petani 2 1 1 0 0 0 2 1 1 0 0 0 0 0 0 0 0 0 0 0 0
Urban 2,459 1,116 1,343 496 232 264 1,004 389 615 601 294 307 253 141 112 61 35 26 44 25 19 Rural 4,207 1,825 2,382 1,058 442 616 1,958 791 1,167 823 392 431 281 144 137 45 25 20 42 31 11 Greater Nukualofa 3,717 1,664 2,053 801 360 441 1,558 598 960 850 423 427 372 205 167 78 41 37 58 37 21

Tonga 2016 Census of Population and Housing
Tonga Statistics Department
97
Table G 49: Tertiary qualification achieved (population 15 years +) by age and sex
AGE Total Certificate Diploma Bachelor's degree Master's degree Other professional qualification Doctorate degree
Total M F Total M F Total M F Total M F Total M F Total M F Total M F
Total 6,666 2,941 3,725 1,554 674 880 2,962 1,180 1,782 1,424 686 738 534 285 249 106 60 46 86 56 30 15 0 0 0 0 0 0 0 0 0 0 0 0 0 0 0 0 0 0 0 0 0 16 0 0 0 0 0 0 0 0 0 0 0 0 0 0 0 0 0 0 0 0 0 17 11 5 6 9 4 5 2 1 1 0 0 0 0 0 0 0 0 0 0 0 0 18 41 13 28 24 8 16 17 5 12 0 0 0 0 0 0 0 0 0 0 0 0 19 86 23 63 54 11 43 27 9 18 5 3 2 0 0 0 0 0 0 0 0 0 20 146 53 93 77 26 51 58 24 34 10 2 8 0 0 0 1 1 0 0 0 0 21 160 45 115 71 24 47 70 18 52 15 3 12 0 0 0 4 0 4 0 0 0 22 208 82 126 75 32 43 102 39 63 27 10 17 1 0 1 3 1 2 0 0 0 23 214 82 132 62 28 34 103 38 65 46 15 31 3 1 2 0 0 0 0 0 0 24 212 71 141 57 20 37 112 38 74 39 10 29 3 2 1 1 1 0 0 0 0 25 193 72 121 46 16 30 98 37 61 41 18 23 5 1 4 1 0 1 2 0 2 26 220 93 127 49 25 24 100 38 62 57 24 33 7 2 5 4 2 2 3 2 1 27 195 70 125 44 19 25 101 35 66 40 14 26 6 1 5 3 1 2 1 0 1 28 209 75 134 53 21 32 88 22 66 55 24 31 6 2 4 2 2 0 5 4 1 29 200 74 126 43 22 21 108 34 74 42 15 27 5 2 3 2 1 1 0 0 0 30 211 72 139 46 11 35 110 37 73 40 19 21 13 4 9 0 0 0 2 1 1 31 211 75 136 33 19 14 113 38 75 49 12 37 13 5 8 2 0 2 1 1 0 32 215 75 140 38 15 23 115 38 77 48 17 31 8 2 6 3 2 1 3 1 2 33 176 64 112 27 11 16 99 32 67 36 18 18 11 2 9 1 0 1 2 1 1 34 187 76 111 37 18 19 91 29 62 49 26 23 9 3 6 0 0 0 1 0 1 35 166 68 98 32 11 21 88 33 55 34 18 16 10 4 6 1 1 0 1 1 0 36 177 79 98 25 6 19 94 45 49 44 23 21 12 4 8 1 0 1 1 1 0 37 136 58 78 21 9 12 67 24 43 36 21 15 12 4 8 0 0 0 0 0 0 38 148 68 80 33 18 15 61 28 33 29 16 13 20 5 15 4 1 3 1 0 1 39 126 47 79 22 4 18 56 24 32 33 13 20 13 6 7 2 0 2 0 0 0 40 123 48 75 18 6 12 54 20 34 24 10 14 21 9 12 4 2 2 2 1 1 41 120 57 63 25 11 14 44 20 24 33 17 16 16 8 8 2 1 1 0 0 0 42 135 65 70 12 8 4 64 26 38 34 18 16 19 11 8 0 0 0 6 2 4 43 115 46 69 21 12 9 47 19 28 31 8 23 16 7 9 0 0 0 0 0 0 44 116 59 57 24 14 10 50 23 27 27 13 14 13 8 5 1 0 1 1 1 0 45 126 64 62 19 7 12 49 26 23 38 23 15 11 6 5 6 1 5 3 1 2 46 128 65 63 32 15 17 51 28 23 25 11 14 18 10 8 2 1 1 0 0 0 47 119 70 49 29 16 13 43 24 19 27 17 10 14 8 6 3 2 1 3 3 0 48 129 79 50 24 14 10 55 32 23 29 21 8 14 7 7 4 3 1 3 2 1 49 112 59 53 20 8 12 44 20 24 28 15 13 19 16 3 0 0 0 1 0 1 50 125 69 56 28 17 11 46 25 21 26 15 11 20 9 11 2 2 0 3 1 2 51 102 47 55 15 9 6 36 16 20 26 8 18 21 12 9 3 1 2 1 1 0 52 75 44 31 15 9 6 35 18 17 13 8 5 6 6 0 3 1 2 3 2 1 53 87 51 36 16 11 5 25 7 18 30 21 9 12 10 2 1 0 1 3 2 1 54 102 54 48 20 13 7 43 17 26 22 15 7 9 4 5 5 4 1 3 1 2 55 81 48 33 26 13 13 21 13 8 17 12 5 15 8 7 2 2 0 0 0 0 56 92 53 39 16 11 5 38 16 22 22 14 8 9 7 2 3 2 1 4 3 1 57 85 48 37 17 9 8 32 16 16 22 14 8 11 7 4 2 1 1 1 1 0

Tonga 2016 Census of Population and Housing
Tonga Statistics Department
98
AGE Total Certificate Diploma Bachelor's degree Master's degree Other professional qualification Doctorate degree
Total M F Total M F Total M F Total M F Total M F Total M F Total M F
58 84 45 39 20 9 11 28 12 16 18 11 7 6 3 3 7 6 1 5 4 1 59 63 36 27 8 5 3 24 10 14 15 9 6 15 11 4 1 1 0 0 0 0 60 66 32 34 19 11 8 29 12 17 8 2 6 8 5 3 2 2 0 0 0 0 61 51 29 22 8 4 4 19 8 11 10 8 2 12 8 4 0 0 0 2 1 1 62 61 39 22 15 11 4 24 14 10 11 8 3 10 5 5 1 1 0 0 0 0 63 55 31 24 14 6 8 16 8 8 18 12 6 4 2 2 3 3 0 0 0 0 64 42 24 18 7 3 4 11 5 6 14 9 5 7 4 3 0 0 0 3 3 0 65 43 29 14 8 4 4 16 10 6 9 5 4 5 5 0 2 2 0 3 3 0 66 31 21 10 4 2 2 12 5 7 7 7 0 5 4 1 1 1 0 2 2 0 67 33 17 16 7 3 4 9 2 7 8 4 4 7 7 0 2 1 1 0 0 0 68 37 21 16 9 4 5 10 5 5 11 5 6 4 4 0 0 0 0 3 3 0 69 31 19 12 7 2 5 10 6 4 7 5 2 4 4 0 2 1 1 1 1 0 70 36 18 18 5 1 4 17 9 8 7 3 4 3 2 1 2 2 0 2 1 1 71 24 11 13 8 4 4 10 5 5 3 0 3 1 0 1 1 1 0 1 1 0 72 16 9 7 3 1 2 6 2 4 1 1 0 5 4 1 1 1 0 0 0 0 73 15 10 5 4 2 2 4 3 1 4 2 2 3 3 0 0 0 0 0 0 0 74 20 9 11 10 3 7 6 2 4 1 1 0 3 3 0 0 0 0 0 0 0
75+ 138 75 63 43 18 25 54 30 24 23 13 10 11 8 3 3 2 1 4 4 0
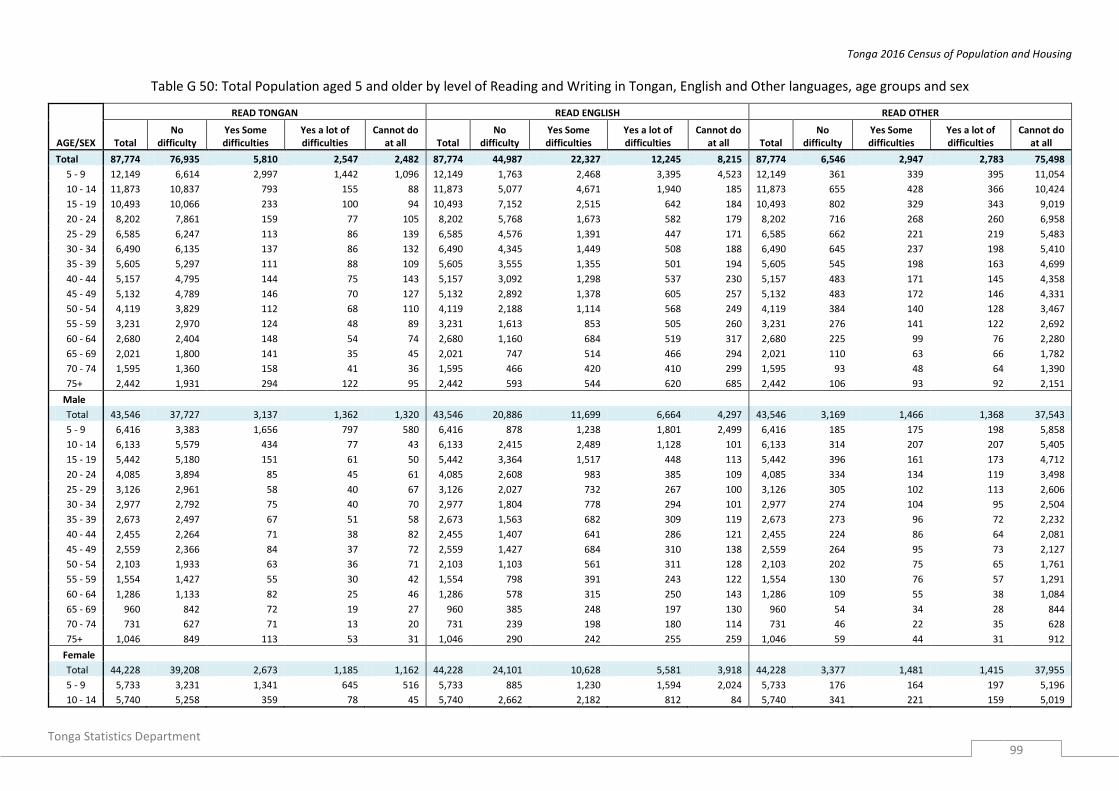
Tonga 2016 Census of Population and Housing
Tonga Statistics Department
99
Table G 50: Total Population aged 5 and older by level of Reading and Writing in Tongan, English and Other languages, age groups and sex
AGE/SEX
READ TONGAN READ ENGLISH READ OTHER
Total No
difficulty Yes Some difficulties
Yes a lot of difficulties
Cannot do at all Total
No difficulty
Yes Some difficulties
Yes a lot of difficulties
Cannot do at all Total
No difficulty
Yes Some difficulties
Yes a lot of difficulties
Cannot do at all
Total 87,774 76,935 5,810 2,547 2,482 87,774 44,987 22,327 12,245 8,215 87,774 6,546 2,947 2,783 75,498
5 - 9 12,149 6,614 2,997 1,442 1,096 12,149 1,763 2,468 3,395 4,523 12,149 361 339 395 11,054
10 - 14 11,873 10,837 793 155 88 11,873 5,077 4,671 1,940 185 11,873 655 428 366 10,424
15 - 19 10,493 10,066 233 100 94 10,493 7,152 2,515 642 184 10,493 802 329 343 9,019
20 - 24 8,202 7,861 159 77 105 8,202 5,768 1,673 582 179 8,202 716 268 260 6,958
25 - 29 6,585 6,247 113 86 139 6,585 4,576 1,391 447 171 6,585 662 221 219 5,483
30 - 34 6,490 6,135 137 86 132 6,490 4,345 1,449 508 188 6,490 645 237 198 5,410
35 - 39 5,605 5,297 111 88 109 5,605 3,555 1,355 501 194 5,605 545 198 163 4,699
40 - 44 5,157 4,795 144 75 143 5,157 3,092 1,298 537 230 5,157 483 171 145 4,358
45 - 49 5,132 4,789 146 70 127 5,132 2,892 1,378 605 257 5,132 483 172 146 4,331
50 - 54 4,119 3,829 112 68 110 4,119 2,188 1,114 568 249 4,119 384 140 128 3,467
55 - 59 3,231 2,970 124 48 89 3,231 1,613 853 505 260 3,231 276 141 122 2,692
60 - 64 2,680 2,404 148 54 74 2,680 1,160 684 519 317 2,680 225 99 76 2,280
65 - 69 2,021 1,800 141 35 45 2,021 747 514 466 294 2,021 110 63 66 1,782
70 - 74 1,595 1,360 158 41 36 1,595 466 420 410 299 1,595 93 48 64 1,390
75+ 2,442 1,931 294 122 95 2,442 593 544 620 685 2,442 106 93 92 2,151
Male
Total 43,546 37,727 3,137 1,362 1,320 43,546 20,886 11,699 6,664 4,297 43,546 3,169 1,466 1,368 37,543
5 - 9 6,416 3,383 1,656 797 580 6,416 878 1,238 1,801 2,499 6,416 185 175 198 5,858
10 - 14 6,133 5,579 434 77 43 6,133 2,415 2,489 1,128 101 6,133 314 207 207 5,405
15 - 19 5,442 5,180 151 61 50 5,442 3,364 1,517 448 113 5,442 396 161 173 4,712
20 - 24 4,085 3,894 85 45 61 4,085 2,608 983 385 109 4,085 334 134 119 3,498
25 - 29 3,126 2,961 58 40 67 3,126 2,027 732 267 100 3,126 305 102 113 2,606
30 - 34 2,977 2,792 75 40 70 2,977 1,804 778 294 101 2,977 274 104 95 2,504
35 - 39 2,673 2,497 67 51 58 2,673 1,563 682 309 119 2,673 273 96 72 2,232
40 - 44 2,455 2,264 71 38 82 2,455 1,407 641 286 121 2,455 224 86 64 2,081
45 - 49 2,559 2,366 84 37 72 2,559 1,427 684 310 138 2,559 264 95 73 2,127
50 - 54 2,103 1,933 63 36 71 2,103 1,103 561 311 128 2,103 202 75 65 1,761
55 - 59 1,554 1,427 55 30 42 1,554 798 391 243 122 1,554 130 76 57 1,291
60 - 64 1,286 1,133 82 25 46 1,286 578 315 250 143 1,286 109 55 38 1,084
65 - 69 960 842 72 19 27 960 385 248 197 130 960 54 34 28 844
70 - 74 731 627 71 13 20 731 239 198 180 114 731 46 22 35 628
75+ 1,046 849 113 53 31 1,046 290 242 255 259 1,046 59 44 31 912
Female
Total 44,228 39,208 2,673 1,185 1,162 44,228 24,101 10,628 5,581 3,918 44,228 3,377 1,481 1,415 37,955
5 - 9 5,733 3,231 1,341 645 516 5,733 885 1,230 1,594 2,024 5,733 176 164 197 5,196
10 - 14 5,740 5,258 359 78 45 5,740 2,662 2,182 812 84 5,740 341 221 159 5,019

Tonga 2016 Census of Population and Housing
Tonga Statistics Department
100
AGE/SEX
READ TONGAN READ ENGLISH READ OTHER
Total No
difficulty Yes Some difficulties
Yes a lot of difficulties
Cannot do at all Total
No difficulty
Yes Some difficulties
Yes a lot of difficulties
Cannot do at all Total
No difficulty
Yes Some difficulties
Yes a lot of difficulties
Cannot do at all
15 - 19 5,051 4,886 82 39 44 5,051 3,788 998 194 71 5,051 406 168 170 4,307
20 - 24 4,117 3,967 74 32 44 4,117 3,160 690 197 70 4,117 382 134 141 3,460
25 - 29 3,459 3,286 55 46 72 3,459 2,549 659 180 71 3,459 357 119 106 2,877
30 - 34 3,513 3,343 62 46 62 3,513 2,541 671 214 87 3,513 371 133 103 2,906
35 - 39 2,932 2,800 44 37 51 2,932 1,992 673 192 75 2,932 272 102 91 2,467
40 - 44 2,702 2,531 73 37 61 2,702 1,685 657 251 109 2,702 259 85 81 2,277
45 - 49 2,573 2,423 62 33 55 2,573 1,465 694 295 119 2,573 219 77 73 2,204
50 - 54 2,016 1,896 49 32 39 2,016 1,085 553 257 121 2,016 182 65 63 1,706
55 - 59 1,677 1,543 69 18 47 1,677 815 462 262 138 1,677 146 65 65 1,401
60 - 64 1,394 1,271 66 29 28 1,394 582 369 269 174 1,394 116 44 38 1,196
65 - 69 1,061 958 69 16 18 1,061 362 266 269 164 1,061 56 29 38 938
70 - 74 864 733 87 28 16 864 227 222 230 185 864 47 26 29 762
75+ 1,396 1,082 181 69 64 1,396 303 302 365 426 1,396 47 49 61 1,239
AGE/SEX
WRITE TONGAN WRITE ENGLISH WRITE OTHER
Total No
difficulty Yes Some difficulties
Yes a lot of difficulties
Cannot do at all Total
No difficulty
Yes Some difficulties
Yes a lot of difficulties
Cannot do at all Total
No difficulty
Yes Some difficulties
Yes a lot of difficulties
Cannot do at all
Total 87,774 74,829 7,088 2,783 3,074 87,774 41,758 22,530 14,118 9,368 87,774 5,646 2,761 2,627 76,740
5 - 9 12,149 6,272 3,203 1,474 1,200 12,149 1,628 2,352 3,367 4,802 12,149 316 296 355 11,182
10 - 14 11,873 10,501 1,030 208 134 11,873 4,639 4,532 2,400 302 11,873 535 393 325 10,620
15 - 19 10,493 9,874 361 106 152 10,493 6,623 2,743 879 248 10,493 659 324 324 9,186
20 - 24 8,202 7,712 258 93 139 8,202 5,432 1,779 764 227 8,202 595 257 248 7,102
25 - 29 6,585 6,131 184 91 179 6,585 4,260 1,518 600 207 6,585 582 214 210 5,579
30 - 34 6,490 5,995 215 98 182 6,490 4,017 1,574 681 218 6,490 558 232 212 5,488
35 - 39 5,605 5,196 184 74 151 5,605 3,286 1,417 636 266 5,605 494 174 176 4,761
40 - 44 5,157 4,725 171 87 174 5,157 2,850 1,340 681 286 5,157 436 146 154 4,421
45 - 49 5,132 4,693 207 77 155 5,132 2,685 1,386 733 328 5,132 435 174 133 4,390
50 - 54 4,119 3,751 153 73 142 4,119 2,032 1,085 695 307 4,119 333 133 113 3,540
55 - 59 3,231 2,893 169 67 102 3,231 1,523 819 566 323 3,231 235 132 108 2,756
60 - 64 2,680 2,311 195 65 109 2,680 1,077 639 580 384 2,680 193 100 73 2,314
65 - 69 2,021 1,736 163 53 69 2,021 712 484 479 346 2,021 101 60 60 1,800
70 - 74 1,595 1,299 196 48 52 1,595 448 376 417 354 1,595 74 56 54 1,411
75+ 2,442 1,740 399 169 134 2,442 546 486 640 770 2,442 100 70 82 2,190
Male
Total 43,546 36,632 3,780 1,481 1,653 43,546 19,387 11,551 7,672 4,936 43,546 2,775 1,364 1,282 38,125
5 - 9 6,416 3,189 1,757 812 658 6,416 803 1,180 1,787 2,646 6,416 167 142 180 5,927
10 - 14 6,133 5,410 543 111 69 6,133 2,238 2,340 1,384 171 6,133 267 189 182 5,495
15 - 19 5,442 5,068 229 58 87 5,442 3,108 1,588 591 155 5,442 320 161 153 4,808
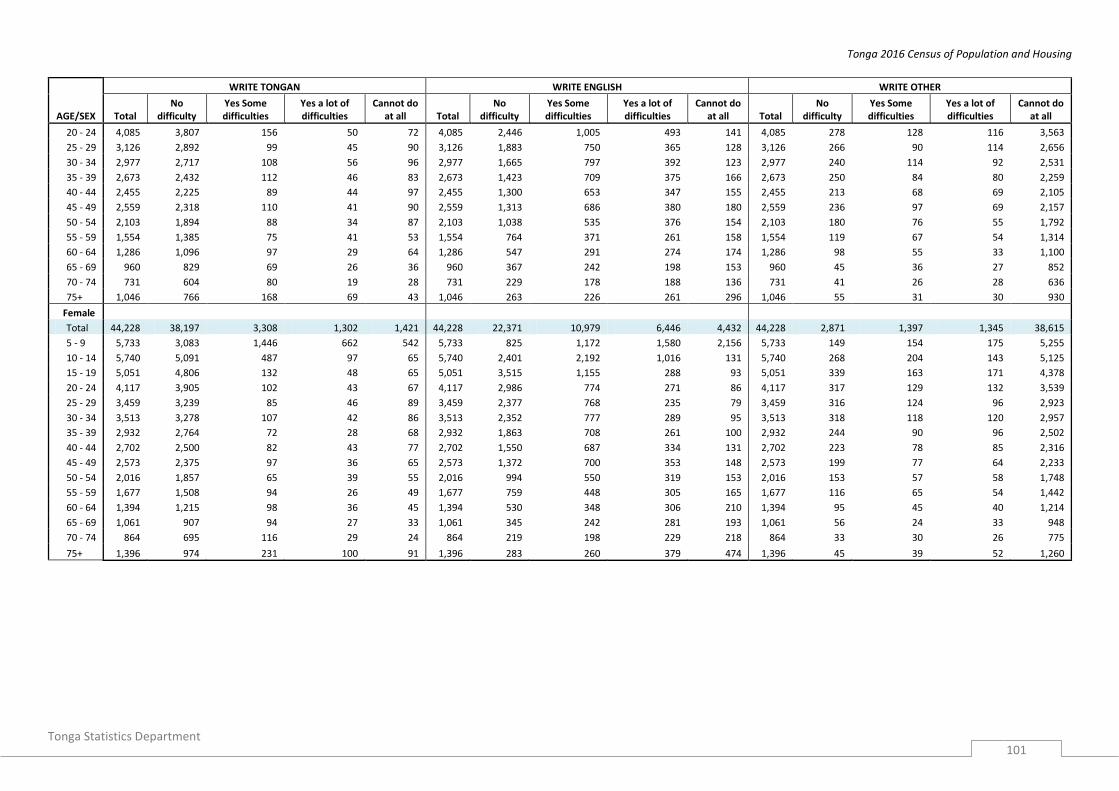
Tonga 2016 Census of Population and Housing
Tonga Statistics Department
101
AGE/SEX
WRITE TONGAN WRITE ENGLISH WRITE OTHER
Total No
difficulty Yes Some difficulties
Yes a lot of difficulties
Cannot do at all Total
No difficulty
Yes Some difficulties
Yes a lot of difficulties
Cannot do at all Total
No difficulty
Yes Some difficulties
Yes a lot of difficulties
Cannot do at all
20 - 24 4,085 3,807 156 50 72 4,085 2,446 1,005 493 141 4,085 278 128 116 3,563
25 - 29 3,126 2,892 99 45 90 3,126 1,883 750 365 128 3,126 266 90 114 2,656
30 - 34 2,977 2,717 108 56 96 2,977 1,665 797 392 123 2,977 240 114 92 2,531
35 - 39 2,673 2,432 112 46 83 2,673 1,423 709 375 166 2,673 250 84 80 2,259
40 - 44 2,455 2,225 89 44 97 2,455 1,300 653 347 155 2,455 213 68 69 2,105
45 - 49 2,559 2,318 110 41 90 2,559 1,313 686 380 180 2,559 236 97 69 2,157
50 - 54 2,103 1,894 88 34 87 2,103 1,038 535 376 154 2,103 180 76 55 1,792
55 - 59 1,554 1,385 75 41 53 1,554 764 371 261 158 1,554 119 67 54 1,314
60 - 64 1,286 1,096 97 29 64 1,286 547 291 274 174 1,286 98 55 33 1,100
65 - 69 960 829 69 26 36 960 367 242 198 153 960 45 36 27 852
70 - 74 731 604 80 19 28 731 229 178 188 136 731 41 26 28 636
75+ 1,046 766 168 69 43 1,046 263 226 261 296 1,046 55 31 30 930
Female
Total 44,228 38,197 3,308 1,302 1,421 44,228 22,371 10,979 6,446 4,432 44,228 2,871 1,397 1,345 38,615
5 - 9 5,733 3,083 1,446 662 542 5,733 825 1,172 1,580 2,156 5,733 149 154 175 5,255
10 - 14 5,740 5,091 487 97 65 5,740 2,401 2,192 1,016 131 5,740 268 204 143 5,125
15 - 19 5,051 4,806 132 48 65 5,051 3,515 1,155 288 93 5,051 339 163 171 4,378
20 - 24 4,117 3,905 102 43 67 4,117 2,986 774 271 86 4,117 317 129 132 3,539
25 - 29 3,459 3,239 85 46 89 3,459 2,377 768 235 79 3,459 316 124 96 2,923
30 - 34 3,513 3,278 107 42 86 3,513 2,352 777 289 95 3,513 318 118 120 2,957
35 - 39 2,932 2,764 72 28 68 2,932 1,863 708 261 100 2,932 244 90 96 2,502
40 - 44 2,702 2,500 82 43 77 2,702 1,550 687 334 131 2,702 223 78 85 2,316
45 - 49 2,573 2,375 97 36 65 2,573 1,372 700 353 148 2,573 199 77 64 2,233
50 - 54 2,016 1,857 65 39 55 2,016 994 550 319 153 2,016 153 57 58 1,748
55 - 59 1,677 1,508 94 26 49 1,677 759 448 305 165 1,677 116 65 54 1,442
60 - 64 1,394 1,215 98 36 45 1,394 530 348 306 210 1,394 95 45 40 1,214
65 - 69 1,061 907 94 27 33 1,061 345 242 281 193 1,061 56 24 33 948
70 - 74 864 695 116 29 24 864 219 198 229 218 864 33 30 26 775
75+ 1,396 974 231 100 91 1,396 283 260 379 474 1,396 45 39 52 1,260
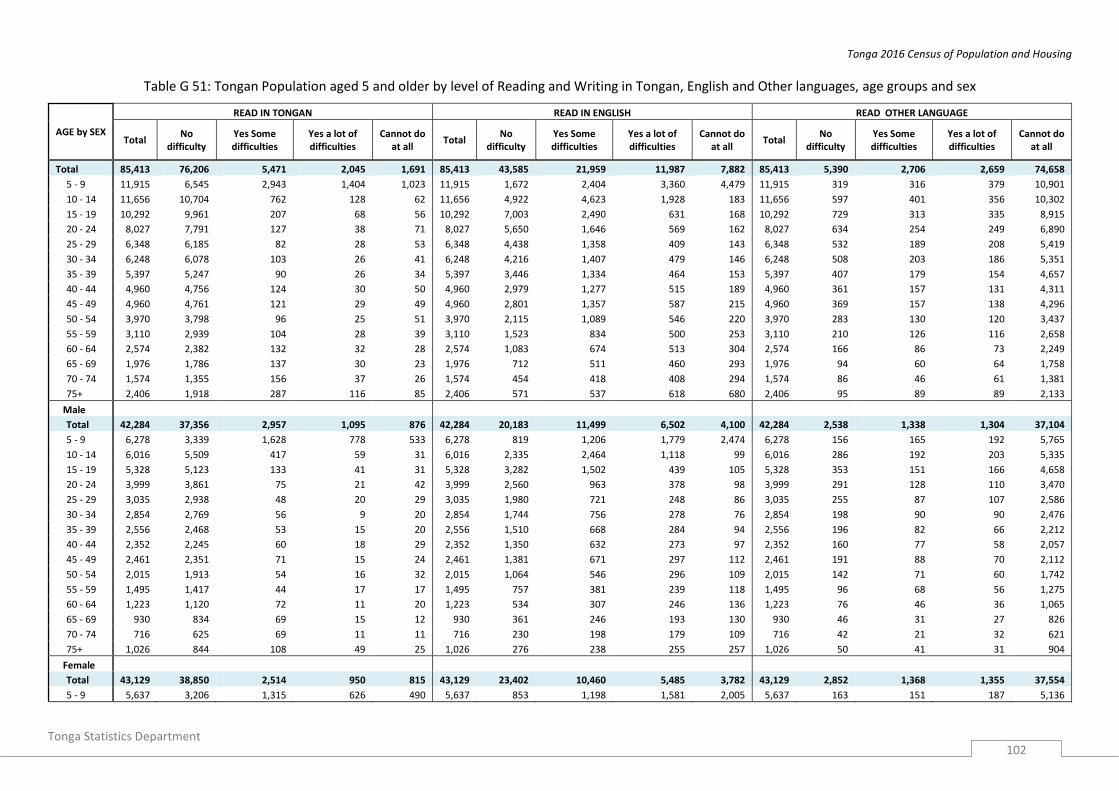
Tonga 2016 Census of Population and Housing
Tonga Statistics Department
102
Table G 51: Tongan Population aged 5 and older by level of Reading and Writing in Tongan, English and Other languages, age groups and sex
AGE by SEX
READ IN TONGAN READ IN ENGLISH READ OTHER LANGUAGE
Total No
difficulty Yes Some difficulties
Yes a lot of difficulties
Cannot do at all
Total No
difficulty Yes Some difficulties
Yes a lot of difficulties
Cannot do at all
Total No
difficulty Yes Some difficulties
Yes a lot of difficulties
Cannot do at all
Total 85,413 76,206 5,471 2,045 1,691 85,413 43,585 21,959 11,987 7,882 85,413 5,390 2,706 2,659 74,658
5 - 9 11,915 6,545 2,943 1,404 1,023 11,915 1,672 2,404 3,360 4,479 11,915 319 316 379 10,901
10 - 14 11,656 10,704 762 128 62 11,656 4,922 4,623 1,928 183 11,656 597 401 356 10,302
15 - 19 10,292 9,961 207 68 56 10,292 7,003 2,490 631 168 10,292 729 313 335 8,915
20 - 24 8,027 7,791 127 38 71 8,027 5,650 1,646 569 162 8,027 634 254 249 6,890
25 - 29 6,348 6,185 82 28 53 6,348 4,438 1,358 409 143 6,348 532 189 208 5,419
30 - 34 6,248 6,078 103 26 41 6,248 4,216 1,407 479 146 6,248 508 203 186 5,351
35 - 39 5,397 5,247 90 26 34 5,397 3,446 1,334 464 153 5,397 407 179 154 4,657
40 - 44 4,960 4,756 124 30 50 4,960 2,979 1,277 515 189 4,960 361 157 131 4,311
45 - 49 4,960 4,761 121 29 49 4,960 2,801 1,357 587 215 4,960 369 157 138 4,296
50 - 54 3,970 3,798 96 25 51 3,970 2,115 1,089 546 220 3,970 283 130 120 3,437
55 - 59 3,110 2,939 104 28 39 3,110 1,523 834 500 253 3,110 210 126 116 2,658
60 - 64 2,574 2,382 132 32 28 2,574 1,083 674 513 304 2,574 166 86 73 2,249
65 - 69 1,976 1,786 137 30 23 1,976 712 511 460 293 1,976 94 60 64 1,758
70 - 74 1,574 1,355 156 37 26 1,574 454 418 408 294 1,574 86 46 61 1,381
75+ 2,406 1,918 287 116 85 2,406 571 537 618 680 2,406 95 89 89 2,133
Male
Total 42,284 37,356 2,957 1,095 876 42,284 20,183 11,499 6,502 4,100 42,284 2,538 1,338 1,304 37,104
5 - 9 6,278 3,339 1,628 778 533 6,278 819 1,206 1,779 2,474 6,278 156 165 192 5,765
10 - 14 6,016 5,509 417 59 31 6,016 2,335 2,464 1,118 99 6,016 286 192 203 5,335
15 - 19 5,328 5,123 133 41 31 5,328 3,282 1,502 439 105 5,328 353 151 166 4,658
20 - 24 3,999 3,861 75 21 42 3,999 2,560 963 378 98 3,999 291 128 110 3,470
25 - 29 3,035 2,938 48 20 29 3,035 1,980 721 248 86 3,035 255 87 107 2,586
30 - 34 2,854 2,769 56 9 20 2,854 1,744 756 278 76 2,854 198 90 90 2,476
35 - 39 2,556 2,468 53 15 20 2,556 1,510 668 284 94 2,556 196 82 66 2,212
40 - 44 2,352 2,245 60 18 29 2,352 1,350 632 273 97 2,352 160 77 58 2,057
45 - 49 2,461 2,351 71 15 24 2,461 1,381 671 297 112 2,461 191 88 70 2,112
50 - 54 2,015 1,913 54 16 32 2,015 1,064 546 296 109 2,015 142 71 60 1,742
55 - 59 1,495 1,417 44 17 17 1,495 757 381 239 118 1,495 96 68 56 1,275
60 - 64 1,223 1,120 72 11 20 1,223 534 307 246 136 1,223 76 46 36 1,065
65 - 69 930 834 69 15 12 930 361 246 193 130 930 46 31 27 826
70 - 74 716 625 69 11 11 716 230 198 179 109 716 42 21 32 621
75+ 1,026 844 108 49 25 1,026 276 238 255 257 1,026 50 41 31 904
Female
Total 43,129 38,850 2,514 950 815 43,129 23,402 10,460 5,485 3,782 43,129 2,852 1,368 1,355 37,554
5 - 9 5,637 3,206 1,315 626 490 5,637 853 1,198 1,581 2,005 5,637 163 151 187 5,136
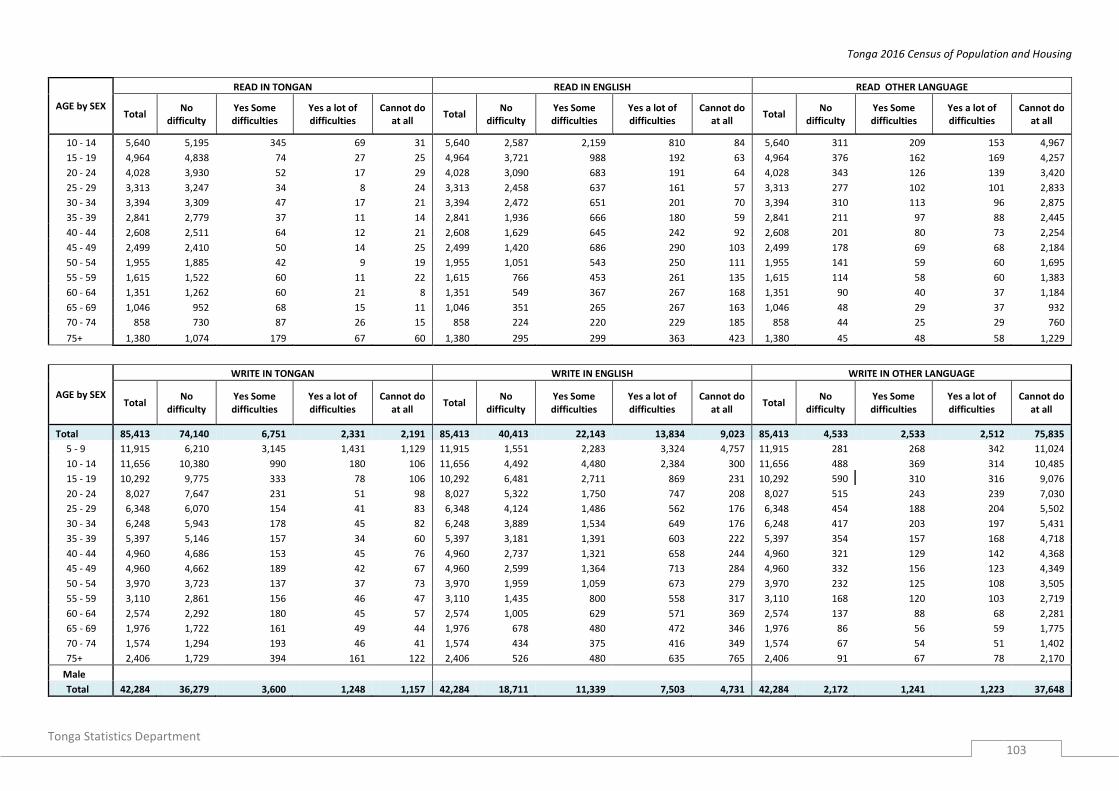
Tonga 2016 Census of Population and Housing
Tonga Statistics Department
103
AGE by SEX
READ IN TONGAN READ IN ENGLISH READ OTHER LANGUAGE
Total No
difficulty Yes Some difficulties
Yes a lot of difficulties
Cannot do at all
Total No
difficulty Yes Some difficulties
Yes a lot of difficulties
Cannot do at all
Total No
difficulty Yes Some difficulties
Yes a lot of difficulties
Cannot do at all
10 - 14 5,640 5,195 345 69 31 5,640 2,587 2,159 810 84 5,640 311 209 153 4,967
15 - 19 4,964 4,838 74 27 25 4,964 3,721 988 192 63 4,964 376 162 169 4,257
20 - 24 4,028 3,930 52 17 29 4,028 3,090 683 191 64 4,028 343 126 139 3,420
25 - 29 3,313 3,247 34 8 24 3,313 2,458 637 161 57 3,313 277 102 101 2,833
30 - 34 3,394 3,309 47 17 21 3,394 2,472 651 201 70 3,394 310 113 96 2,875
35 - 39 2,841 2,779 37 11 14 2,841 1,936 666 180 59 2,841 211 97 88 2,445
40 - 44 2,608 2,511 64 12 21 2,608 1,629 645 242 92 2,608 201 80 73 2,254
45 - 49 2,499 2,410 50 14 25 2,499 1,420 686 290 103 2,499 178 69 68 2,184
50 - 54 1,955 1,885 42 9 19 1,955 1,051 543 250 111 1,955 141 59 60 1,695
55 - 59 1,615 1,522 60 11 22 1,615 766 453 261 135 1,615 114 58 60 1,383
60 - 64 1,351 1,262 60 21 8 1,351 549 367 267 168 1,351 90 40 37 1,184
65 - 69 1,046 952 68 15 11 1,046 351 265 267 163 1,046 48 29 37 932
70 - 74 858 730 87 26 15 858 224 220 229 185 858 44 25 29 760
75+ 1,380 1,074 179 67 60 1,380 295 299 363 423 1,380 45 48 58 1,229
AGE by SEX
WRITE IN TONGAN WRITE IN ENGLISH WRITE IN OTHER LANGUAGE
Total No
difficulty Yes Some difficulties
Yes a lot of difficulties
Cannot do at all
Total No
difficulty Yes Some difficulties
Yes a lot of difficulties
Cannot do at all
Total No
difficulty Yes Some difficulties
Yes a lot of difficulties
Cannot do at all
Total 85,413 74,140 6,751 2,331 2,191 85,413 40,413 22,143 13,834 9,023 85,413 4,533 2,533 2,512 75,835
5 - 9 11,915 6,210 3,145 1,431 1,129 11,915 1,551 2,283 3,324 4,757 11,915 281 268 342 11,024
10 - 14 11,656 10,380 990 180 106 11,656 4,492 4,480 2,384 300 11,656 488 369 314 10,485
15 - 19 10,292 9,775 333 78 106 10,292 6,481 2,711 869 231 10,292 590 310 316 9,076
20 - 24 8,027 7,647 231 51 98 8,027 5,322 1,750 747 208 8,027 515 243 239 7,030
25 - 29 6,348 6,070 154 41 83 6,348 4,124 1,486 562 176 6,348 454 188 204 5,502
30 - 34 6,248 5,943 178 45 82 6,248 3,889 1,534 649 176 6,248 417 203 197 5,431
35 - 39 5,397 5,146 157 34 60 5,397 3,181 1,391 603 222 5,397 354 157 168 4,718
40 - 44 4,960 4,686 153 45 76 4,960 2,737 1,321 658 244 4,960 321 129 142 4,368
45 - 49 4,960 4,662 189 42 67 4,960 2,599 1,364 713 284 4,960 332 156 123 4,349
50 - 54 3,970 3,723 137 37 73 3,970 1,959 1,059 673 279 3,970 232 125 108 3,505
55 - 59 3,110 2,861 156 46 47 3,110 1,435 800 558 317 3,110 168 120 103 2,719
60 - 64 2,574 2,292 180 45 57 2,574 1,005 629 571 369 2,574 137 88 68 2,281
65 - 69 1,976 1,722 161 49 44 1,976 678 480 472 346 1,976 86 56 59 1,775
70 - 74 1,574 1,294 193 46 41 1,574 434 375 416 349 1,574 67 54 51 1,402
75+ 2,406 1,729 394 161 122 2,406 526 480 635 765 2,406 91 67 78 2,170
Male
Total 42,284 36,279 3,600 1,248 1,157 42,284 18,711 11,339 7,503 4,731 42,284 2,172 1,241 1,223 37,648

Tonga 2016 Census of Population and Housing
Tonga Statistics Department
104
AGE by SEX
WRITE IN TONGAN WRITE IN ENGLISH WRITE IN OTHER LANGUAGE
Total No
difficulty Yes Some difficulties
Yes a lot of difficulties
Cannot do at all
Total No
difficulty Yes Some difficulties
Yes a lot of difficulties
Cannot do at all
Total No
difficulty Yes Some difficulties
Yes a lot of difficulties
Cannot do at all
5 - 9 6,278 3,149 1,728 788 613 6,278 753 1,143 1,760 2,622 6,278 143 127 176 5,832
10 - 14 6,016 5,342 524 94 56 6,016 2,161 2,312 1,374 169 6,016 245 175 177 5,419
15 - 19 5,328 5,014 208 42 64 5,328 3,029 1,570 583 146 5,328 281 151 147 4,749
20 - 24 3,999 3,777 145 26 51 3,999 2,403 984 483 129 3,999 235 122 108 3,534
25 - 29 3,035 2,871 91 30 43 3,035 1,837 739 347 112 3,035 215 80 110 2,630
30 - 34 2,854 2,698 88 26 42 2,854 1,605 777 373 99 2,854 164 99 88 2,503
35 - 39 2,556 2,401 94 24 37 2,556 1,372 691 355 138 2,556 169 74 75 2,238
40 - 44 2,352 2,206 78 26 42 2,352 1,244 644 334 130 2,352 154 58 63 2,077
45 - 49 2,461 2,302 99 22 38 2,461 1,269 673 367 152 2,461 169 89 64 2,139
50 - 54 2,015 1,876 77 19 43 2,015 999 520 360 136 2,015 124 72 52 1,767
55 - 59 1,495 1,373 69 29 24 1,495 722 362 257 154 1,495 84 61 52 1,298
60 - 64 1,223 1,085 90 16 32 1,223 504 284 269 166 1,223 67 46 31 1,079
65 - 69 930 821 67 24 18 930 344 240 193 153 930 37 33 26 834
70 - 74 716 602 78 17 19 716 219 178 188 131 716 37 25 25 629
75+ 1,026 762 164 65 35 1,026 250 222 260 294 1,026 48 29 29 920
Female
Total 43,129 37,861 3,151 1,083 1,034 43,129 21,702 10,804 6,331 4,292 43,129 2,361 1,292 1,289 38,187
5 - 9 5,637 3,061 1,417 643 516 5,637 798 1,140 1,564 2,135 5,637 138 141 166 5,192
10 - 14 5,640 5,038 466 86 50 5,640 2,331 2,168 1,010 131 5,640 243 194 137 5,066
15 - 19 4,964 4,761 125 36 42 4,964 3,452 1,141 286 85 4,964 309 159 169 4,327
20 - 24 4,028 3,870 86 25 47 4,028 2,919 766 264 79 4,028 280 121 131 3,496
25 - 29 3,313 3,199 63 11 40 3,313 2,287 747 215 64 3,313 239 108 94 2,872
30 - 34 3,394 3,245 90 19 40 3,394 2,284 757 276 77 3,394 253 104 109 2,928
35 - 39 2,841 2,745 63 10 23 2,841 1,809 700 248 84 2,841 185 83 93 2,480
40 - 44 2,608 2,480 75 19 34 2,608 1,493 677 324 114 2,608 167 71 79 2,291
45 - 49 2,499 2,360 90 20 29 2,499 1,330 691 346 132 2,499 163 67 59 2,210
50 - 54 1,955 1,847 60 18 30 1,955 960 539 313 143 1,955 108 53 56 1,738
55 - 59 1,615 1,488 87 17 23 1,615 713 438 301 163 1,615 84 59 51 1,421
60 - 64 1,351 1,207 90 29 25 1,351 501 345 302 203 1,351 70 42 37 1,202
65 - 69 1,046 901 94 25 26 1,046 334 240 279 193 1,046 49 23 33 941
70 - 74 858 692 115 29 22 858 215 197 228 218 858 30 29 26 773
75+ 1,380 967 230 96 87 1,380 276 258 375 471 1,380 43 38 49 1,250
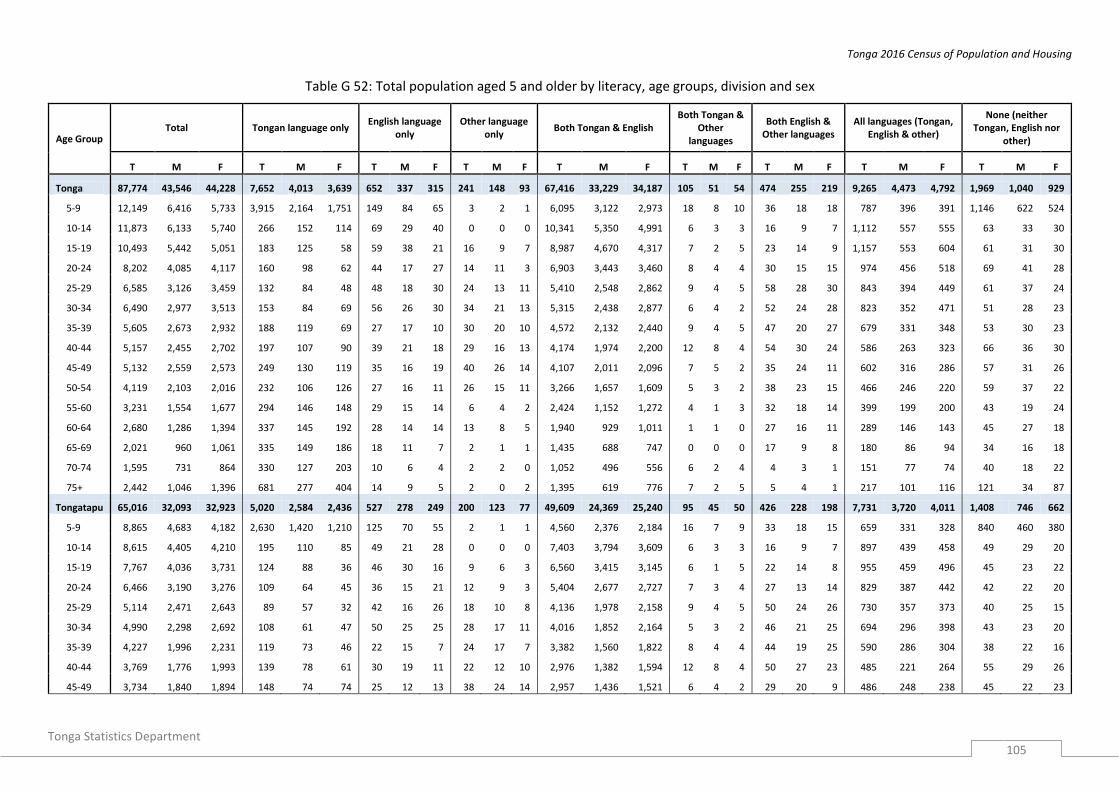
Tonga 2016 Census of Population and Housing
Tonga Statistics Department
105
Table G 52: Total population aged 5 and older by literacy, age groups, division and sex
Age Group Total Tongan language only
English language only
Other language only
Both Tongan & English Both Tongan &
Other languages
Both English & Other languages
All languages (Tongan, English & other)
None (neither Tongan, English nor
other)
T M F T M F T M F T M F T M F T M F T M F T M F T M F
Tonga 87,774 43,546 44,228 7,652 4,013 3,639 652 337 315 241 148 93 67,416 33,229 34,187 105 51 54 474 255 219 9,265 4,473 4,792 1,969 1,040 929
5-9 12,149 6,416 5,733 3,915 2,164 1,751 149 84 65 3 2 1 6,095 3,122 2,973 18 8 10 36 18 18 787 396 391 1,146 622 524
10-14 11,873 6,133 5,740 266 152 114 69 29 40 0 0 0 10,341 5,350 4,991 6 3 3 16 9 7 1,112 557 555 63 33 30
15-19 10,493 5,442 5,051 183 125 58 59 38 21 16 9 7 8,987 4,670 4,317 7 2 5 23 14 9 1,157 553 604 61 31 30
20-24 8,202 4,085 4,117 160 98 62 44 17 27 14 11 3 6,903 3,443 3,460 8 4 4 30 15 15 974 456 518 69 41 28
25-29 6,585 3,126 3,459 132 84 48 48 18 30 24 13 11 5,410 2,548 2,862 9 4 5 58 28 30 843 394 449 61 37 24
30-34 6,490 2,977 3,513 153 84 69 56 26 30 34 21 13 5,315 2,438 2,877 6 4 2 52 24 28 823 352 471 51 28 23
35-39 5,605 2,673 2,932 188 119 69 27 17 10 30 20 10 4,572 2,132 2,440 9 4 5 47 20 27 679 331 348 53 30 23
40-44 5,157 2,455 2,702 197 107 90 39 21 18 29 16 13 4,174 1,974 2,200 12 8 4 54 30 24 586 263 323 66 36 30
45-49 5,132 2,559 2,573 249 130 119 35 16 19 40 26 14 4,107 2,011 2,096 7 5 2 35 24 11 602 316 286 57 31 26
50-54 4,119 2,103 2,016 232 106 126 27 16 11 26 15 11 3,266 1,657 1,609 5 3 2 38 23 15 466 246 220 59 37 22
55-60 3,231 1,554 1,677 294 146 148 29 15 14 6 4 2 2,424 1,152 1,272 4 1 3 32 18 14 399 199 200 43 19 24
60-64 2,680 1,286 1,394 337 145 192 28 14 14 13 8 5 1,940 929 1,011 1 1 0 27 16 11 289 146 143 45 27 18
65-69 2,021 960 1,061 335 149 186 18 11 7 2 1 1 1,435 688 747 0 0 0 17 9 8 180 86 94 34 16 18
70-74 1,595 731 864 330 127 203 10 6 4 2 2 0 1,052 496 556 6 2 4 4 3 1 151 77 74 40 18 22
75+ 2,442 1,046 1,396 681 277 404 14 9 5 2 0 2 1,395 619 776 7 2 5 5 4 1 217 101 116 121 34 87
Tongatapu 65,016 32,093 32,923 5,020 2,584 2,436 527 278 249 200 123 77 49,609 24,369 25,240 95 45 50 426 228 198 7,731 3,720 4,011 1,408 746 662
5-9 8,865 4,683 4,182 2,630 1,420 1,210 125 70 55 2 1 1 4,560 2,376 2,184 16 7 9 33 18 15 659 331 328 840 460 380
10-14 8,615 4,405 4,210 195 110 85 49 21 28 0 0 0 7,403 3,794 3,609 6 3 3 16 9 7 897 439 458 49 29 20
15-19 7,767 4,036 3,731 124 88 36 46 30 16 9 6 3 6,560 3,415 3,145 6 1 5 22 14 8 955 459 496 45 23 22
20-24 6,466 3,190 3,276 109 64 45 36 15 21 12 9 3 5,404 2,677 2,727 7 3 4 27 13 14 829 387 442 42 22 20
25-29 5,114 2,471 2,643 89 57 32 42 16 26 18 10 8 4,136 1,978 2,158 9 4 5 50 24 26 730 357 373 40 25 15
30-34 4,990 2,298 2,692 108 61 47 50 25 25 28 17 11 4,016 1,852 2,164 5 3 2 46 21 25 694 296 398 43 23 20
35-39 4,227 1,996 2,231 119 73 46 22 15 7 24 17 7 3,382 1,560 1,822 8 4 4 44 19 25 590 286 304 38 22 16
40-44 3,769 1,776 1,993 139 78 61 30 19 11 22 12 10 2,976 1,382 1,594 12 8 4 50 27 23 485 221 264 55 29 26
45-49 3,734 1,840 1,894 148 74 74 25 12 13 38 24 14 2,957 1,436 1,521 6 4 2 29 20 9 486 248 238 45 22 23

Tonga 2016 Census of Population and Housing
Tonga Statistics Department
106
Age Group Total Tongan language only
English language only
Other language only
Both Tongan & English Both Tongan &
Other languages
Both English & Other languages
All languages (Tongan, English & other)
None (neither Tongan, English nor
other)
T M F T M F T M F T M F T M F T M F T M F T M F T M F
50-54 2,991 1,517 1,474 134 64 70 20 12 8 26 15 11 2,338 1,172 1,166 5 3 2 38 23 15 393 205 188 37 23 14
55-60 2,327 1,103 1,224 178 82 96 23 11 12 5 3 2 1,729 815 914 4 1 3 28 15 13 327 162 165 33 14 19
60-64 1,924 917 1,007 205 87 118 25 11 14 12 7 5 1,397 668 729 1 1 0 24 15 9 236 115 121 24 13 11
65-69 1,398 643 755 206 89 117 13 8 5 1 0 1 997 462 535 0 0 0 14 6 8 147 69 78 20 9 11
70-74 1,129 505 624 206 70 136 9 5 4 2 2 0 756 352 404 4 1 3 2 1 1 126 64 62 24 10 14
75+ 1,700 713 987 430 167 263 12 8 4 1 0 1 998 430 568 6 2 4 3 3 0 177 81 96 73 22 51
Vava'u 12,036 5,988 6,048 1,290 701 589 90 45 45 14 9 5 9,153 4,494 4,659 5 3 2 33 20 13 1,140 554 586 311 162 149
5-9 1,759 925 834 640 367 273 22 13 9 0 0 0 845 403 442 0 0 0 1 0 1 88 47 41 163 95 68
10-14 1,752 945 807 37 20 17 10 3 7 0 0 0 1,534 827 707 0 0 0 0 0 0 162 93 69 9 2 7
15-19 1,464 742 722 26 16 10 9 5 4 1 0 1 1,264 651 613 1 1 0 1 0 1 153 66 87 9 3 6
20-24 923 435 488 21 15 6 3 1 2 1 1 0 769 355 414 1 1 0 2 2 0 115 52 63 11 8 3
25-29 728 315 413 18 12 6 4 1 3 1 0 1 617 268 349 0 0 0 5 3 2 76 26 50 7 5 2
30-34 763 340 423 23 15 8 4 1 3 3 3 0 629 276 353 0 0 0 4 1 3 95 41 54 5 3 2
35-39 685 337 348 35 23 12 3 1 2 1 0 1 573 277 296 0 0 0 1 0 1 61 30 31 11 6 5
40-44 741 356 385 17 11 6 6 1 5 4 3 1 630 306 324 0 0 0 3 2 1 77 30 47 4 3 1
45-49 750 383 367 44 27 17 7 4 3 1 1 0 609 300 309 1 1 0 3 3 0 80 44 36 5 3 2
50-54 606 318 288 48 19 29 6 4 2 0 0 0 477 249 228 0 0 0 0 0 0 62 36 26 13 10 3
55-60 460 227 233 50 29 21 6 4 2 0 0 0 340 161 179 0 0 0 4 3 1 54 28 26 6 2 4
60-64 391 181 210 70 32 38 2 2 0 0 0 0 265 117 148 0 0 0 2 0 2 41 24 17 11 6 5
65-69 351 177 174 69 30 39 5 3 2 1 1 0 237 123 114 0 0 0 3 3 0 27 13 14 9 4 5
70-74 245 123 122 56 26 30 1 1 0 0 0 0 157 81 76 1 0 1 2 2 0 17 10 7 11 3 8
75+ 418 184 234 136 59 77 2 1 1 1 0 1 207 100 107 1 0 1 2 1 1 32 14 18 37 9 28
Ha'apai 5,349 2,744 2,605 776 424 352 22 8 14 18 11 7 4,174 2,116 2,058 4 3 1 9 3 6 212 96 116 134 83 51
5-9 786 433 353 327 198 129 2 1 1 1 1 0 359 184 175 1 1 0 2 0 2 25 8 17 69 40 29
10-14 696 372 324 28 19 9 5 2 3 0 0 0 637 338 299 0 0 0 0 0 0 24 12 12 2 1 1
15-19 616 328 288 29 19 10 2 1 1 6 3 3 550 289 261 0 0 0 0 0 0 26 13 13 3 3 0
20-24 416 234 182 22 13 9 4 1 3 1 1 0 360 199 161 0 0 0 0 0 0 17 11 6 12 9 3
25-29 384 181 203 22 14 8 2 1 1 3 2 1 324 154 170 0 0 0 3 1 2 23 5 18 7 4 3

Tonga 2016 Census of Population and Housing
Tonga Statistics Department
107
Age Group Total Tongan language only
English language only
Other language only
Both Tongan & English Both Tongan &
Other languages
Both English & Other languages
All languages (Tongan, English & other)
None (neither Tongan, English nor
other)
T M F T M F T M F T M F T M F T M F T M F T M F T M F
30-34 375 164 211 15 6 9 1 0 1 1 1 0 333 147 186 1 1 0 0 0 0 21 7 14 3 2 1
35-39 370 189 181 21 14 7 2 1 1 2 1 1 322 161 161 1 0 1 2 1 1 18 10 8 2 1 1
40-44 337 165 172 26 10 16 3 1 2 2 0 2 288 145 143 0 0 0 0 0 0 12 5 7 6 4 2
45-49 312 161 151 36 18 18 1 0 1 1 1 0 254 129 125 0 0 0 2 1 1 13 8 5 5 4 1
50-54 243 128 115 30 16 14 0 0 0 0 0 0 205 108 97 0 0 0 0 0 0 3 2 1 5 2 3
55-60 215 108 107 43 21 22 0 0 0 1 1 0 157 80 77 0 0 0 0 0 0 11 4 7 3 2 1
60-64 180 93 87 36 16 20 0 0 0 0 0 0 129 66 63 0 0 0 0 0 0 7 5 2 8 6 2
65-69 145 70 75 38 19 19 0 0 0 0 0 0 102 48 54 0 0 0 0 0 0 3 2 1 2 1 1
70-74 117 50 67 38 16 22 0 0 0 0 0 0 68 27 41 1 1 0 0 0 0 6 2 4 4 4 0
75+ 157 68 89 65 25 40 0 0 0 0 0 0 86 41 45 0 0 0 0 0 0 3 2 1 3 0 3
'Eua 4,281 2,140 2,141 400 222 178 9 3 6 8 4 4 3,714 1,844 1,870 0 0 0 4 2 2 58 32 26 88 33 55
5-9 610 309 301 266 155 111 4 2 2 0 0 0 277 132 145 0 0 0 0 0 0 3 1 2 64 21 43
10-14 651 321 330 2 1 1 1 1 0 0 0 0 639 317 322 0 0 0 0 0 0 3 0 3 3 1 2
15-19 521 264 257 3 1 2 1 0 1 0 0 0 511 259 252 0 0 0 0 0 0 4 2 2 2 1 1
20-24 323 181 142 5 4 1 0 0 0 0 0 0 307 173 134 0 0 0 1 0 1 7 3 4 2 1 1
25-29 286 127 159 1 1 0 1 0 1 2 1 1 274 121 153 0 0 0 0 0 0 6 2 4 3 2 1
30-34 303 146 157 5 1 4 0 0 0 2 0 2 287 139 148 0 0 0 1 1 0 7 5 2 0 0 0
35-39 254 116 138 13 9 4 1 0 1 2 1 1 235 104 131 0 0 0 0 0 0 3 2 1 1 0 1
40-44 245 132 113 10 6 4 1 0 1 1 1 0 230 121 109 0 0 0 0 0 0 4 4 0 0 0 0
45-49 272 140 132 13 8 5 0 0 0 0 0 0 246 125 121 0 0 0 1 0 1 10 6 4 1 1 0
50-54 211 103 108 7 1 6 0 0 0 0 0 0 197 99 98 0 0 0 0 0 0 3 2 1 3 1 2
55-60 165 76 89 10 4 6 0 0 0 0 0 0 152 71 81 0 0 0 0 0 0 3 1 2 0 0 0
60-64 141 77 64 12 5 7 0 0 0 1 1 0 126 69 57 0 0 0 1 1 0 0 0 0 1 1 0
65-69 98 49 49 12 4 8 0 0 0 0 0 0 84 43 41 0 0 0 0 0 0 1 1 0 1 1 0
70-74 74 37 37 11 6 5 0 0 0 0 0 0 62 30 32 0 0 0 0 0 0 1 1 0 0 0 0
75+ 127 62 65 30 16 14 0 0 0 0 0 0 87 41 46 0 0 0 0 0 0 3 2 1 7 3 4
Ongo Niua 1,092 581 511 166 82 84 4 3 1 1 1 0 766 406 360 1 0 1 2 2 0 124 71 53 28 16 12
5-9 129 66 63 52 24 28 1 1 0 0 0 0 54 27 27 1 0 1 0 0 0 12 9 3 10 6 4
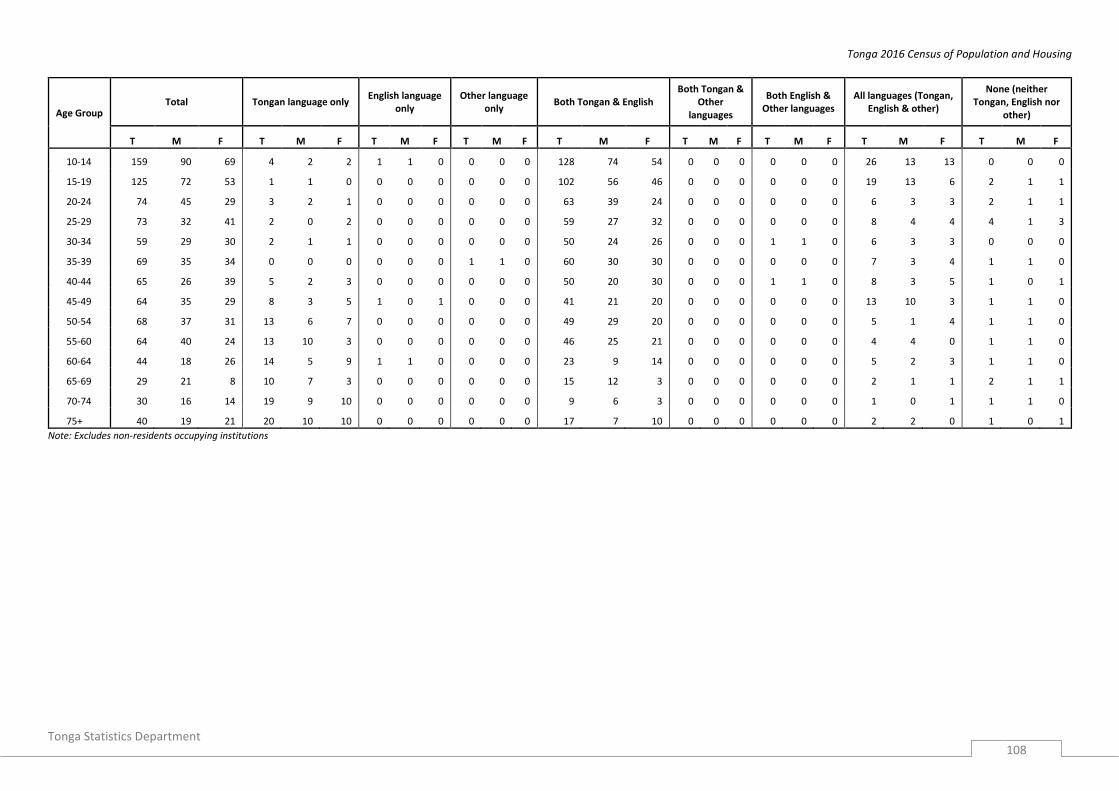
Tonga 2016 Census of Population and Housing
Tonga Statistics Department
108
Age Group Total Tongan language only
English language only
Other language only
Both Tongan & English Both Tongan &
Other languages
Both English & Other languages
All languages (Tongan, English & other)
None (neither Tongan, English nor
other)
T M F T M F T M F T M F T M F T M F T M F T M F T M F
10-14 159 90 69 4 2 2 1 1 0 0 0 0 128 74 54 0 0 0 0 0 0 26 13 13 0 0 0
15-19 125 72 53 1 1 0 0 0 0 0 0 0 102 56 46 0 0 0 0 0 0 19 13 6 2 1 1
20-24 74 45 29 3 2 1 0 0 0 0 0 0 63 39 24 0 0 0 0 0 0 6 3 3 2 1 1
25-29 73 32 41 2 0 2 0 0 0 0 0 0 59 27 32 0 0 0 0 0 0 8 4 4 4 1 3
30-34 59 29 30 2 1 1 0 0 0 0 0 0 50 24 26 0 0 0 1 1 0 6 3 3 0 0 0
35-39 69 35 34 0 0 0 0 0 0 1 1 0 60 30 30 0 0 0 0 0 0 7 3 4 1 1 0
40-44 65 26 39 5 2 3 0 0 0 0 0 0 50 20 30 0 0 0 1 1 0 8 3 5 1 0 1
45-49 64 35 29 8 3 5 1 0 1 0 0 0 41 21 20 0 0 0 0 0 0 13 10 3 1 1 0
50-54 68 37 31 13 6 7 0 0 0 0 0 0 49 29 20 0 0 0 0 0 0 5 1 4 1 1 0
55-60 64 40 24 13 10 3 0 0 0 0 0 0 46 25 21 0 0 0 0 0 0 4 4 0 1 1 0
60-64 44 18 26 14 5 9 1 1 0 0 0 0 23 9 14 0 0 0 0 0 0 5 2 3 1 1 0
65-69 29 21 8 10 7 3 0 0 0 0 0 0 15 12 3 0 0 0 0 0 0 2 1 1 2 1 1
70-74 30 16 14 19 9 10 0 0 0 0 0 0 9 6 3 0 0 0 0 0 0 1 0 1 1 1 0
75+ 40 19 21 20 10 10 0 0 0 0 0 0 17 7 10 0 0 0 0 0 0 2 2 0 1 0 1
Note: Excludes non-residents occupying institutions

Tonga 2016 Census of Population and Housing
Tonga Statistics Department
109
Table G 53: Labour market activity (population 15 years+) by division and region
Total Tongatapu Vava'u Ha'apai 'Eua Ongo Niua Urban Rural
Greater Nuku'alofa
Main activity last week 63,752 47,536 8,525 3,867 3,020 804 15,224 48,528 22,845 Employer1 710 590 84 19 15 2 300 410 383 Self-employed2 6,262 4,313 752 617 381 199 904 5,358 1,385 Public Sector3 9,296 7,818 715 385 241 137 3,251 6,045 4,698 Private sector4 7,055 5,398 964 389 296 8 2,118 4,937 3,173 Own Consumption5 7,470 3,878 1,850 918 717 107 418 7,052 910 Unpaid Family business6 1,561 940 244 128 194 55 137 1,424 258 Household Duties7 1,111 772 241 63 18 17 222 889 365 Volunteer work 508 395 58 35 15 5 137 371 198
Student - full time 8,990 6,886 1,145 418 442 99 2,287 6,703 3,487 Student - part time 479 365 57 38 17 2 109 370 174 Home duties 16,287 13,104 1,827 657 566 133 4,244 12,043 6,210 Retired / Too old 2,271 1,737 327 108 73 26 670 1,601 947 None 1,084 829 189 46 17 3 288 796 415 Physically/Mentally Disabled 668 511 72 46 28 11 139 529 242
Was [name] willing and available to work or take on another job last week? 63,752 47,536 8,525 3,867 3,020 804 15,224 48,528 22,845 Yes 25,434 18,777 3,493 1,542 1,409 213 6,079 19,355 8,968 No 38,318 28,759 5,032 2,325 1,611 591 9,145 29,173 13,877 Did [name] actively look for work or for a job last week? 63,752 47,536 8,525 3,867 3,020 804 15,224 48,528 22,845 Yes 1,034 833 124 58 15 4 300 734 422 No 62,718 46,703 8,401 3,809 3,005 800 14,924 47,794 22,423 Method of Looking for a Job 1034 833 124 58 15 4 300 734 422 Looked at job advertisement 435 361 49 21 4 0 131 304 185 Wrote, phone or applied in person to an employer 187 167 10 8 1 1 58 129 84 My parents, family and relatives help in finding jobs 294 246 28 17 1 2 76 218 123 Contacted Ministry of Youth and Employment 50 42 2 4 2 0 23 27 28 Contacted NGO employment agency, for eg 26 17 5 0 4 0 6 20 9 Other 161 108 36 12 4 1 34 127 50 Reason for not looking for a job last week? 62,718 46,703 8,401 3,809 3,005 800 14,924 47,794 22,423 Student 8,481 6,433 1,110 409 433 96 2,110 6,371 3,297 Already have a full-time job 16,144 12,691 1,634 853 651 315 5,184 10,960 7,604 Don't want to work more 18,430 13,323 2,638 1,450 854 165 3,163 15,267 5,014 Physically/psychologically disabled 1,041 754 140 78 50 19 193 848 330 Believe no paid work available 1,139 712 223 119 63 22 151 988 242 Discouraged (stopped looking, cannot fin 327 230 65 17 15 0 53 274 103 Waiting for family/friends to find work 260 183 30 35 0 12 65 195 104 Weather/no transport 54 28 14 10 2 0 10 44 11 Home duties (babysitting, chores, etc.) 10,347 7,493 1,537 597 583 137 2,580 7,767 3,647 Reliant on family and relatives overseas 1,516 1,251 206 30 28 1 346 1,170 467 Reliant on family and relatives here in 1,898 1,613 226 22 36 1 457 1,441 732 Other 3,081 1,992 578 189 290 32 612 2,469 872
Note: Excludes non-residents occupying institutions 1 -Employer, Producing goods or services for sale, running a business with paid employees 2 - Self-employed, Producing goods or services for sale, running a business without paid employees 3 - Employee, working for wages / salary in public sector (incl. NGO, UN agencies) 4 - Employee, working for wages / salary in private sector 5 - Producing goods for own and/ or family consumption 6 - Unpaid family worker (family business/plantation) 7 - Unpaid family worker, help with basic HH duties inside (washing, cooking, cleaning, etc.) and outside (gardening, maintaining lawn, etc.) Volunteer work (community, church, etc.)

Tonga 2016 Census of Population and Housing
Tonga Statistics Department
110
Table G 54: Labour market activity (population 15 +) by 5 yeat age group
Labour Market Activity Total 15-19 20-24 25-29 30-34 35-39 40-44 45-49 50-54 55-60 60-64 65-69 70-74 75+
Main activity last week 63,752 10,493 8,202 6,585 6,490 5,605 5,157 5,132 4,119 3,231 2,680 2,021 1,595 2,442 Employer1 710 11 32 50 61 114 84 99 92 64 45 27 15 16 Self-employed2 6,262 166 463 539 701 719 782 808 696 460 393 264 158 113 Public Sector3 9,296 208 1,174 1,501 1,516 1,202 1,035 1,000 783 506 217 94 36 24 Private sector4 7,055 352 1,093 1,067 1,056 865 767 696 497 318 182 106 37 19 Own Consumption5 7,470 344 652 697 751 729 817 870 659 570 510 399 256 216 Unpaid Family business6 1,561 146 269 169 139 136 153 149 115 85 85 53 30 32 Household Duties7 1,111 101 206 132 131 91 92 92 82 53 48 37 23 23 Volunteer work 508 35 92 47 30 26 44 48 53 49 37 25 13 9
Student - full time 8,990 7,327 1,300 184 63 39 27 20 13 3 4 3 2 5 Student - part time 479 161 234 41 22 11 1 3 2 0 0 1 3 0 Home duties 16,287 1,415 2,437 1,990 1,872 1,577 1,255 1,212 997 948 844 633 520 587 Retired / Too old 2,271 5 3 5 2 2 1 9 30 62 212 265 423 1,252 None 1,084 176 203 121 103 49 51 55 52 48 45 65 37 79 Physically/Mentally Disabled 668 46 44 42 43 45 48 71 48 65 58 49 42 67
Was [name] willing and available to work or take on another job last week? 63,752 10,493 8,202 6,585 6,490 5,605 5,157 5,132 4,119 3,231 2,680 2,021 1,595 2,442
Yes 25,434 3,389 3,376 2,946 2,880 2,422 2,295 2,259 1,822 1,334 1,088 700 451 472 No 38,318 7,104 4,826 3,639 3,610 3,183 2,862 2,873 2,297 1,897 1,592 1,321 1,144 1,970
Did [name] actively look for work or for a job last week? 63,752 10,493 8,202 6,585 6,490 5,605 5,157 5,132 4,119 3,231 2,680 2,021 1,595 2,442
Yes 1,034 184 286 175 140 83 67 43 23 11 12 4 5 1 No 62,718 10,309 7,916 6,410 6,350 5,522 5,090 5,089 4,096 3,220 2,668 2,017 1,590 2,441
Method of Looking for a Job 1034 184 286 175 140 83 67 43 23 11 12 4 5 1 Looked at job advertisement 435 69 128 93 54 34 30 11 7 4 2 0 2 1 Wrote, phone or applied in person to an employer 187 28 60 30 18 13 14 15 3 4 0 1 0 1 My parents, family and relatives help in finding jobs 294 67 79 34 49 25 22 10 2 2 2 1 1 0 Contacted Ministry of Youth and Employment 50 6 17 8 8 4 4 1 2 0 0 0 0 0 Contacted NGO employment agency, for eg. Church 26 2 6 2 5 3 2 1 2 1 2 0 0 0 Other 161 28 28 28 19 17 10 10 8 2 6 2 3 0 Reason for not looking for a job last week? 62,718 10,309 7,916 6,410 6,350 5,522 5,090 5,089 4,096 3,220 2,668 2,017 1,590 2,441
Student 8,481 6,786 1,296 199 67 48 26 20 21 4 4 2 2 6 Already have a full-time job 16,144 596 2,090 2,363 2,346 2,012 1,800 1,761 1,354 886 498 246 122 70 Don't want to work more 18,430 1,376 2,104 1,713 1,765 1,619 1,668 1,787 1,450 1,245 1,171 922 697 913 Physically/psychologically disabled 1,041 48 49 58 49 56 51 73 62 73 90 88 95 249 Believe no paid work available 1,139 173 213 153 135 123 89 88 59 44 33 15 7 7 Discouraged (stopped looking, cannot find any) 327 54 84 42 41 27 35 15 7 6 7 6 0 3 Waiting for family/friends to find work 260 49 76 46 18 20 16 12 13 6 2 1 1 0 Weather/no transport 54 9 7 2 2 5 8 5 5 5 2 1 1 2 Home duties (babysitting, chores, etc.) 10,347 676 1,259 1,301 1,417 1,182 962 926 748 580 482 351 228 235 Reliant on family and relatives overseas 1,516 80 114 129 129 120 121 95 88 95 102 128 121 194 Reliant on family and relatives here in Tonga 1,898 251 293 166 127 87 80 96 88 84 98 93 132 303 Other 3,081 211 331 238 254 223 234 211 201 192 179 164 184 459
Note: Excludes non-residents occupying institutions Refer to notes in Table G 51 for meaning of Employer1, Emplyed2, Public sector3, Private sector4,Own consumption5, unpaid family business6, Houshold duties7
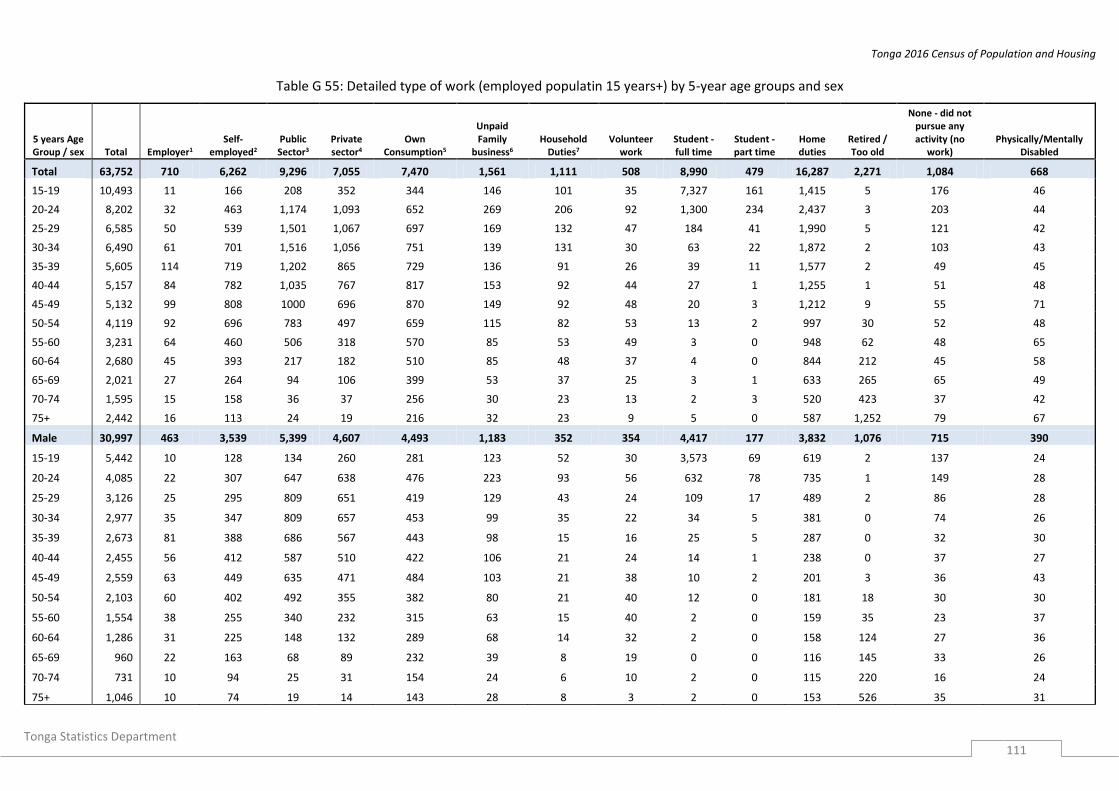
Tonga 2016 Census of Population and Housing
Tonga Statistics Department
111
Table G 55: Detailed type of work (employed populatin 15 years+) by 5-year age groups and sex
5 years Age Group / sex Total Employer1
Self-employed2
Public Sector3
Private sector4
Own Consumption5
Unpaid Family
business6 Household
Duties7 Volunteer
work Student - full time
Student - part time
Home duties
Retired / Too old
None - did not pursue any activity (no
work) Physically/Mentally
Disabled
Total 63,752 710 6,262 9,296 7,055 7,470 1,561 1,111 508 8,990 479 16,287 2,271 1,084 668
15-19 10,493 11 166 208 352 344 146 101 35 7,327 161 1,415 5 176 46
20-24 8,202 32 463 1,174 1,093 652 269 206 92 1,300 234 2,437 3 203 44
25-29 6,585 50 539 1,501 1,067 697 169 132 47 184 41 1,990 5 121 42
30-34 6,490 61 701 1,516 1,056 751 139 131 30 63 22 1,872 2 103 43
35-39 5,605 114 719 1,202 865 729 136 91 26 39 11 1,577 2 49 45
40-44 5,157 84 782 1,035 767 817 153 92 44 27 1 1,255 1 51 48
45-49 5,132 99 808 1000 696 870 149 92 48 20 3 1,212 9 55 71
50-54 4,119 92 696 783 497 659 115 82 53 13 2 997 30 52 48
55-60 3,231 64 460 506 318 570 85 53 49 3 0 948 62 48 65
60-64 2,680 45 393 217 182 510 85 48 37 4 0 844 212 45 58
65-69 2,021 27 264 94 106 399 53 37 25 3 1 633 265 65 49
70-74 1,595 15 158 36 37 256 30 23 13 2 3 520 423 37 42
75+ 2,442 16 113 24 19 216 32 23 9 5 0 587 1,252 79 67
Male 30,997 463 3,539 5,399 4,607 4,493 1,183 352 354 4,417 177 3,832 1,076 715 390
15-19 5,442 10 128 134 260 281 123 52 30 3,573 69 619 2 137 24
20-24 4,085 22 307 647 638 476 223 93 56 632 78 735 1 149 28
25-29 3,126 25 295 809 651 419 129 43 24 109 17 489 2 86 28
30-34 2,977 35 347 809 657 453 99 35 22 34 5 381 0 74 26
35-39 2,673 81 388 686 567 443 98 15 16 25 5 287 0 32 30
40-44 2,455 56 412 587 510 422 106 21 24 14 1 238 0 37 27
45-49 2,559 63 449 635 471 484 103 21 38 10 2 201 3 36 43
50-54 2,103 60 402 492 355 382 80 21 40 12 0 181 18 30 30
55-60 1,554 38 255 340 232 315 63 15 40 2 0 159 35 23 37
60-64 1,286 31 225 148 132 289 68 14 32 2 0 158 124 27 36
65-69 960 22 163 68 89 232 39 8 19 0 0 116 145 33 26
70-74 731 10 94 25 31 154 24 6 10 2 0 115 220 16 24
75+ 1,046 10 74 19 14 143 28 8 3 2 0 153 526 35 31
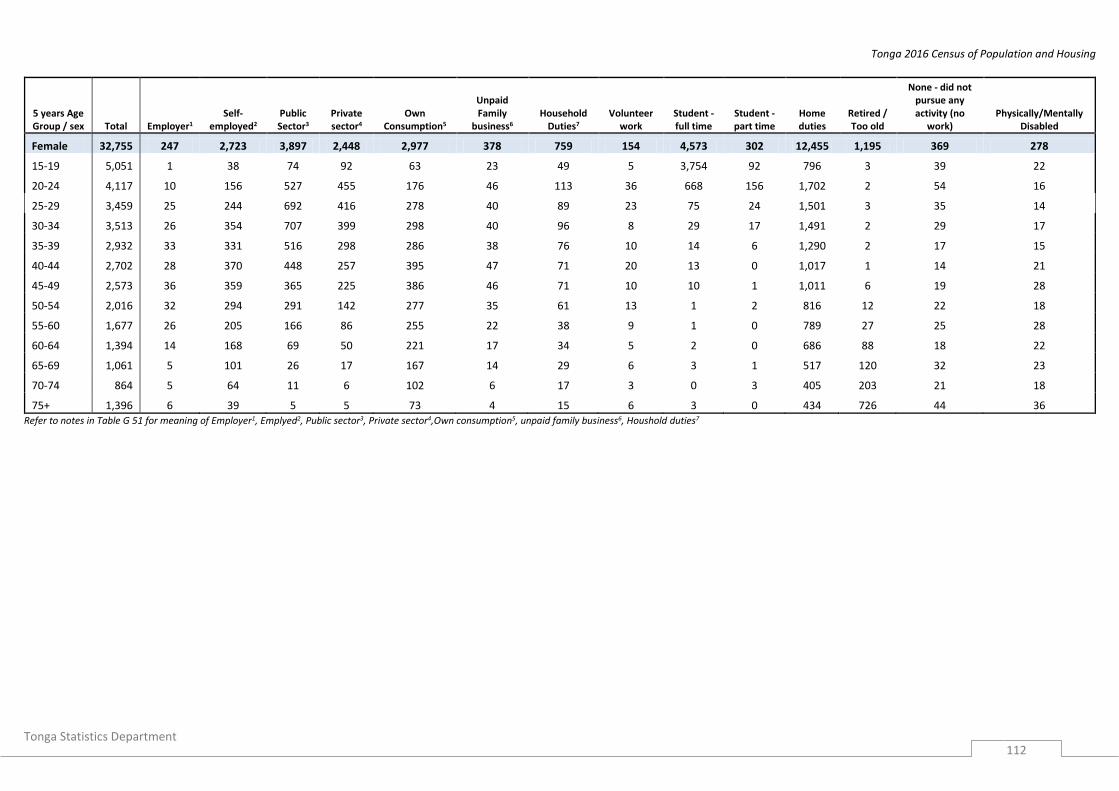
Tonga 2016 Census of Population and Housing
Tonga Statistics Department
112
5 years Age Group / sex Total Employer1
Self-employed2
Public Sector3
Private sector4
Own Consumption5
Unpaid Family
business6 Household
Duties7 Volunteer
work Student - full time
Student - part time
Home duties
Retired / Too old
None - did not pursue any activity (no
work) Physically/Mentally
Disabled
Female 32,755 247 2,723 3,897 2,448 2,977 378 759 154 4,573 302 12,455 1,195 369 278
15-19 5,051 1 38 74 92 63 23 49 5 3,754 92 796 3 39 22
20-24 4,117 10 156 527 455 176 46 113 36 668 156 1,702 2 54 16
25-29 3,459 25 244 692 416 278 40 89 23 75 24 1,501 3 35 14
30-34 3,513 26 354 707 399 298 40 96 8 29 17 1,491 2 29 17
35-39 2,932 33 331 516 298 286 38 76 10 14 6 1,290 2 17 15
40-44 2,702 28 370 448 257 395 47 71 20 13 0 1,017 1 14 21
45-49 2,573 36 359 365 225 386 46 71 10 10 1 1,011 6 19 28
50-54 2,016 32 294 291 142 277 35 61 13 1 2 816 12 22 18
55-60 1,677 26 205 166 86 255 22 38 9 1 0 789 27 25 28
60-64 1,394 14 168 69 50 221 17 34 5 2 0 686 88 18 22
65-69 1,061 5 101 26 17 167 14 29 6 3 1 517 120 32 23
70-74 864 5 64 11 6 102 6 17 3 0 3 405 203 21 18
75+ 1,396 6 39 5 5 73 4 15 6 3 0 434 726 44 36 Refer to notes in Table G 51 for meaning of Employer1, Emplyed2, Public sector3, Private sector4,Own consumption5, unpaid family business6, Houshold duties7

Tonga 2016 Census of Population and Housing
Tonga Statistics Department
113
Table G 56: Principal occupation (population 15 years+) by region and divison
Principal Occupation (1 and 2 digit)* Total Tongatapu Vava’u Ha’apai ‘Eua Ongo Niua Urban Rural Great
Nuku’alofa
Total Employed 33,973 24,104 4,908 2,554 1,877 530 7,468 26,505 11,362
Armed Forces Occupations 412 372 17 20 2 1 167 245 238
Managers 2,128 1,700 282 85 32 29 861 1,267 1,158
Professionals 4,736 3,699 534 289 169 45 1,461 3,275 2,186
Technicians and Associates Professional 2,216 1,823 194 102 68 29 785 1,431 1,139
Clerical Support Workers 1,420 1,215 111 39 42 13 525 895 761
Services and Sales Workers 4,476 3,702 479 169 103 23 1,390 3,086 2,041
Skilled Agricultural, Forestry and Fishing 8,080 4,819 1,479 868 742 172 607 7,473 1,087
Craft and Related Trades Workers 7,537 4,755 1,309 774 570 129 1,099 6,438 1,846
Plant and Machine Operators and Assemblers 1,257 880 151 126 27 73 285 972 460
Elementary Occupations 1,711 1,139 352 82 122 16 288 1,423 446 *Base on the (ISCO) International Standard Classification of Occupations code.
Table G 57: Principal occupation (population 15 years +) by 5 year age groups
Principal Occupation (1 and 2 digit) Total 15-19 20-24 25-29 30-34 35-39 40-44 45-49 50-54 55-60 60-64 65-69 70-74 75+
Total Employed 33,973 1,363 3,981 4,202 4,385 3,882 3,774 3,762 2,977 2,105 1,517 1,005 568 452
Armed Forces Occupations 412 8 58 102 92 63 31 31 19 5 2 1 . .
Managers 2,128 15 125 187 262 272 262 291 309 199 108 57 24 17
Professionals 4,736 49 537 696 790 610 491 508 398 324 166 98 48 21
Technicians and Associates Professional 2,216 77 305 316 307 267 253 240 203 117 66 44 9 12
Clerical Support Workers 1,420 28 254 308 234 164 137 141 91 36 16 6 2 3
Services and Sales Workers 4,476 250 719 702 640 511 494 424 292 179 128 69 30 38
Skilled Agricultural, Forestry and Fishing 8,080 484 877 736 784 783 791 901 754 565 520 403 257 225
Craft and Related Trades Workers 7,537 280 692 808 898 864 940 881 682 520 411 276 171 114
Plant and Machine Operators and Assemblers 1,257 24 92 112 166 178 202 174 115 89 53 28 11 13
Elementary Occupations 1,711 148 322 235 212 170 173 171 114 71 47 23 16 9

Tonga 2016 Census of Population and Housing
Tonga Statistics Department
114
Table G 58: Principal occupation (employed population 15 years +) by 5 year age groups and sex
5 years Age group / Sex
Main Occupation
Total
Armed Forces
Occupations Managers Professionals
Technicians and
Associates Professional
Clerical Support Workers
Services and Sales Workers
Skilled Agricultural,
Forestry and Fishing
Craft and Related Trades
Workers
Plant and Machine
Operators and
Assemblers Elementary Occupations
Total 33,973 412 2,128 4,736 2,216 1,420 4,476 8,080 7,537 1,257 1,711
15-19 1,363 8 15 49 77 28 250 484 280 24 148
20-24 3,981 58 125 537 305 254 719 877 692 92 322
25-29 4,202 102 187 696 316 308 702 736 808 112 235
30-34 4,385 92 262 790 307 234 640 784 898 166 212
35-39 3,882 63 272 610 267 164 511 783 864 178 170
40-44 3,774 31 262 491 253 137 494 791 940 202 173
45-49 3,762 31 291 508 240 141 424 901 881 174 171
50-54 2,977 19 309 398 203 91 292 754 682 115 114
55-60 2,105 5 199 324 117 36 179 565 520 89 71
60-64 1,517 2 108 166 66 16 128 520 411 53 47
65-69 1,005 1 57 98 44 6 69 403 276 28 23
70-74 568 0 24 48 9 2 30 257 171 11 16
75+ 452 0 17 21 12 3 38 225 114 13 9
Male 20,390 384 1,261 2,450 1,448 322 2,098 7,904 2,514 823 1,186
15-19 1,018 4 12 39 55 5 119 475 181 15 113
20-24 2,462 47 61 260 167 57 338 858 385 66 223
25-29 2,395 95 100 289 198 69 334 718 342 78 172
30-34 2,457 87 135 318 188 40 306 773 332 117 161
35-39 2,294 63 149 291 171 35 249 775 314 126 121
40-44 2,138 31 135 262 173 23 220 767 278 135 114
45-49 2,264 30 176 301 167 37 204 871 261 108 109
50-54 1,832 19 200 241 143 30 122 733 196 81 67
55-60 1,298 5 137 203 86 11 92 558 107 53 46
60-64 939 2 79 117 49 8 56 511 64 24 29
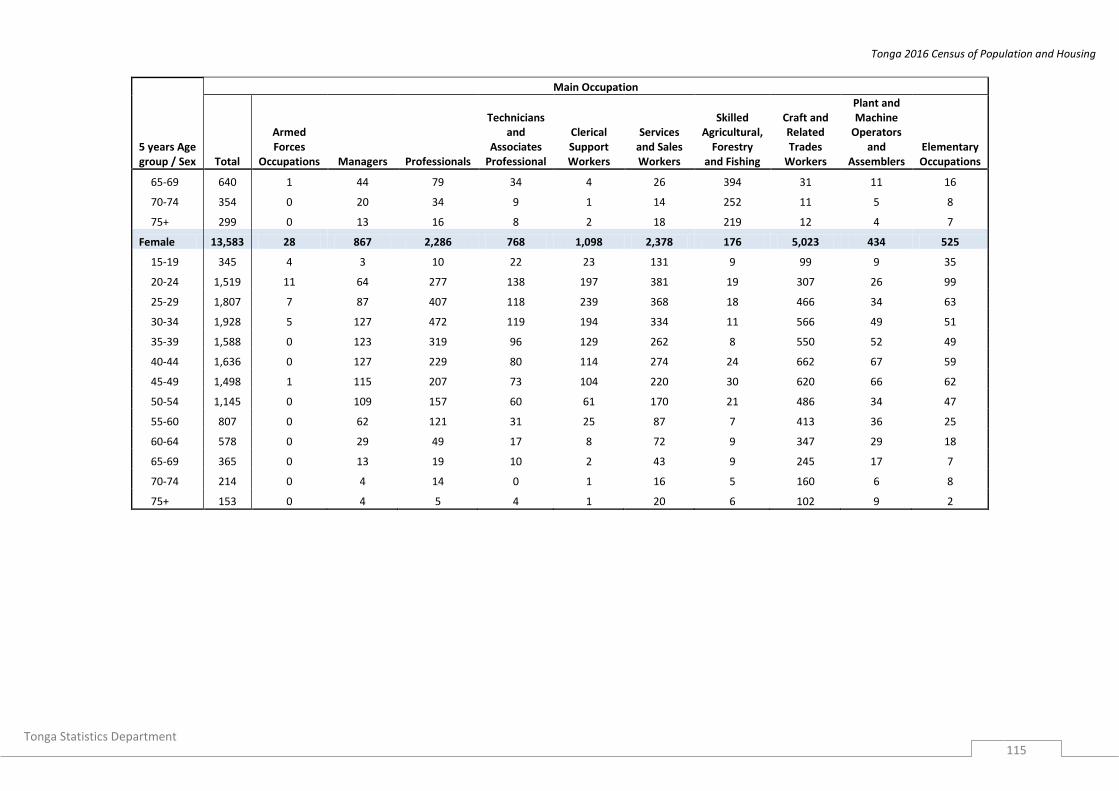
Tonga 2016 Census of Population and Housing
Tonga Statistics Department
115
5 years Age group / Sex
Main Occupation
Total
Armed Forces
Occupations Managers Professionals
Technicians and
Associates Professional
Clerical Support Workers
Services and Sales Workers
Skilled Agricultural,
Forestry and Fishing
Craft and Related Trades
Workers
Plant and Machine
Operators and
Assemblers Elementary Occupations
65-69 640 1 44 79 34 4 26 394 31 11 16
70-74 354 0 20 34 9 1 14 252 11 5 8
75+ 299 0 13 16 8 2 18 219 12 4 7
Female 13,583 28 867 2,286 768 1,098 2,378 176 5,023 434 525
15-19 345 4 3 10 22 23 131 9 99 9 35
20-24 1,519 11 64 277 138 197 381 19 307 26 99
25-29 1,807 7 87 407 118 239 368 18 466 34 63
30-34 1,928 5 127 472 119 194 334 11 566 49 51
35-39 1,588 0 123 319 96 129 262 8 550 52 49
40-44 1,636 0 127 229 80 114 274 24 662 67 59
45-49 1,498 1 115 207 73 104 220 30 620 66 62
50-54 1,145 0 109 157 60 61 170 21 486 34 47
55-60 807 0 62 121 31 25 87 7 413 36 25
60-64 578 0 29 49 17 8 72 9 347 29 18
65-69 365 0 13 19 10 2 43 9 245 17 7
70-74 214 0 4 14 0 1 16 5 160 6 8
75+ 153 0 4 5 4 1 20 6 102 9 2
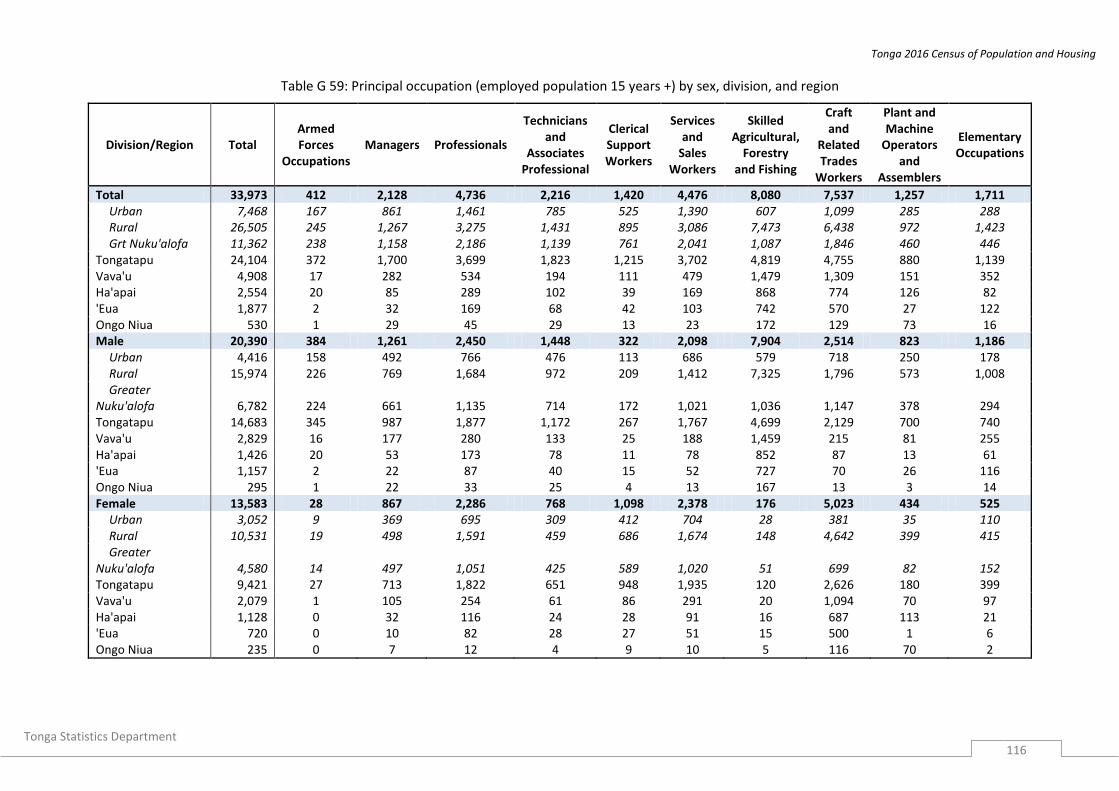
Tonga 2016 Census of Population and Housing
Tonga Statistics Department
116
Table G 59: Principal occupation (employed population 15 years +) by sex, division, and region
Division/Region Total Armed Forces
Occupations Managers Professionals
Technicians and
Associates Professional
Clerical Support Workers
Services and
Sales Workers
Skilled Agricultural,
Forestry and Fishing
Craft and
Related Trades
Workers
Plant and Machine
Operators and
Assemblers
Elementary Occupations
Total 33,973 412 2,128 4,736 2,216 1,420 4,476 8,080 7,537 1,257 1,711 Urban 7,468 167 861 1,461 785 525 1,390 607 1,099 285 288 Rural 26,505 245 1,267 3,275 1,431 895 3,086 7,473 6,438 972 1,423 Grt Nuku'alofa 11,362 238 1,158 2,186 1,139 761 2,041 1,087 1,846 460 446
Tongatapu 24,104 372 1,700 3,699 1,823 1,215 3,702 4,819 4,755 880 1,139 Vava'u 4,908 17 282 534 194 111 479 1,479 1,309 151 352 Ha'apai 2,554 20 85 289 102 39 169 868 774 126 82 'Eua 1,877 2 32 169 68 42 103 742 570 27 122 Ongo Niua 530 1 29 45 29 13 23 172 129 73 16 Male 20,390 384 1,261 2,450 1,448 322 2,098 7,904 2,514 823 1,186
Urban 4,416 158 492 766 476 113 686 579 718 250 178 Rural 15,974 226 769 1,684 972 209 1,412 7,325 1,796 573 1,008 Greater
Nuku'alofa 6,782 224 661 1,135 714 172 1,021 1,036 1,147 378 294 Tongatapu 14,683 345 987 1,877 1,172 267 1,767 4,699 2,129 700 740 Vava'u 2,829 16 177 280 133 25 188 1,459 215 81 255 Ha'apai 1,426 20 53 173 78 11 78 852 87 13 61 'Eua 1,157 2 22 87 40 15 52 727 70 26 116 Ongo Niua 295 1 22 33 25 4 13 167 13 3 14 Female 13,583 28 867 2,286 768 1,098 2,378 176 5,023 434 525
Urban 3,052 9 369 695 309 412 704 28 381 35 110 Rural 10,531 19 498 1,591 459 686 1,674 148 4,642 399 415 Greater
Nuku'alofa 4,580 14 497 1,051 425 589 1,020 51 699 82 152 Tongatapu 9,421 27 713 1,822 651 948 1,935 120 2,626 180 399 Vava'u 2,079 1 105 254 61 86 291 20 1,094 70 97 Ha'apai 1,128 0 32 116 24 28 91 16 687 113 21 'Eua 720 0 10 82 28 27 51 15 500 1 6 Ongo Niua 235 0 7 12 4 9 10 5 116 70 2
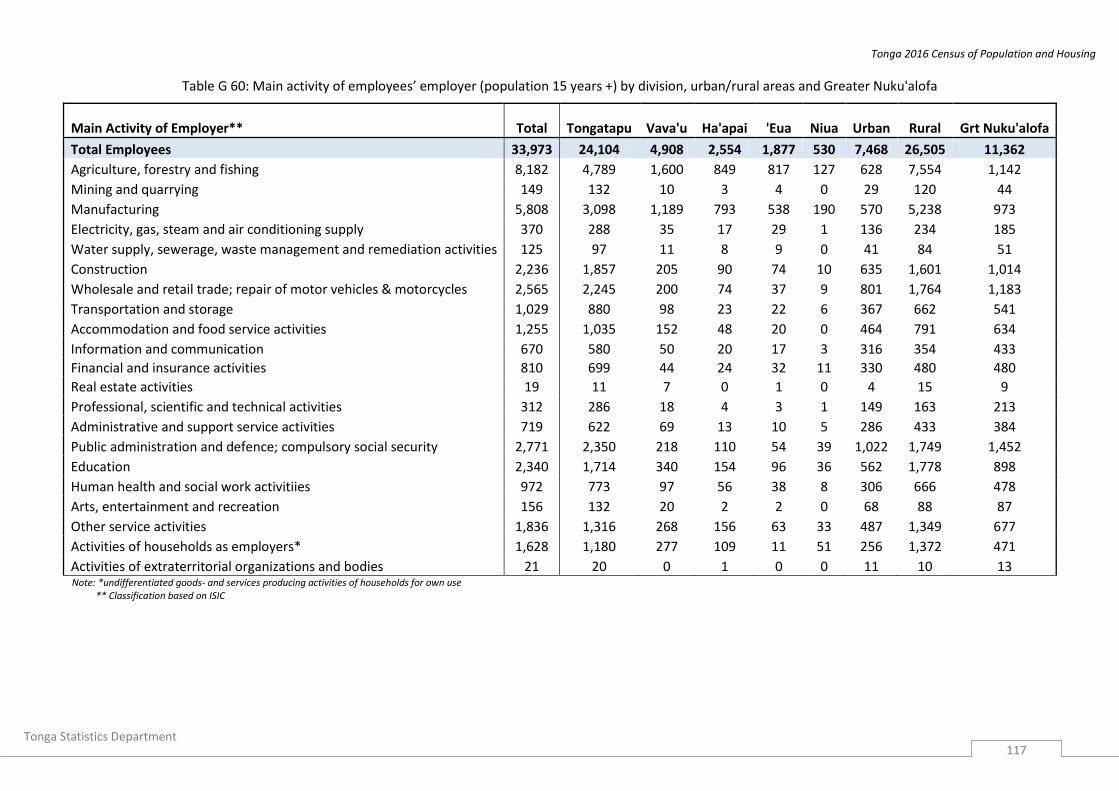
Tonga 2016 Census of Population and Housing
Tonga Statistics Department
117
Table G 60: Main activity of employees’ employer (population 15 years +) by division, urban/rural areas and Greater Nuku'alofa
Main Activity of Employer** Total Tongatapu Vava'u Ha'apai 'Eua Niua Urban Rural Grt Nuku'alofa
Total Employees 33,973 24,104 4,908 2,554 1,877 530 7,468 26,505 11,362
Agriculture, forestry and fishing 8,182 4,789 1,600 849 817 127 628 7,554 1,142
Mining and quarrying 149 132 10 3 4 0 29 120 44
Manufacturing 5,808 3,098 1,189 793 538 190 570 5,238 973
Electricity, gas, steam and air conditioning supply 370 288 35 17 29 1 136 234 185
Water supply, sewerage, waste management and remediation activities 125 97 11 8 9 0 41 84 51
Construction 2,236 1,857 205 90 74 10 635 1,601 1,014
Wholesale and retail trade; repair of motor vehicles & motorcycles 2,565 2,245 200 74 37 9 801 1,764 1,183
Transportation and storage 1,029 880 98 23 22 6 367 662 541
Accommodation and food service activities 1,255 1,035 152 48 20 0 464 791 634
Information and communication 670 580 50 20 17 3 316 354 433
Financial and insurance activities 810 699 44 24 32 11 330 480 480
Real estate activities 19 11 7 0 1 0 4 15 9
Professional, scientific and technical activities 312 286 18 4 3 1 149 163 213
Administrative and support service activities 719 622 69 13 10 5 286 433 384
Public administration and defence; compulsory social security 2,771 2,350 218 110 54 39 1,022 1,749 1,452
Education 2,340 1,714 340 154 96 36 562 1,778 898
Human health and social work activitiies 972 773 97 56 38 8 306 666 478
Arts, entertainment and recreation 156 132 20 2 2 0 68 88 87
Other service activities 1,836 1,316 268 156 63 33 487 1,349 677
Activities of households as employers* 1,628 1,180 277 109 11 51 256 1,372 471
Activities of extraterritorial organizations and bodies 21 20 0 1 0 0 11 10 13 Note: *undifferentiated goods- and services producing activities of households for own use ** Classification based on ISIC

Tonga 2016 Census of Population and Housing
Tonga Statistics Department
118
Table G 61: Main activity of employees’ employer (for employed population 15 years +) by 5 year age groups
Main Actgivity of Employer Total 15-19 20-24 25-29 30-34 35-39 40-44 45-49 50-54 55-60 60-64 65-69 70-74 75+
Total Employees 33,973 1,363 3,981 4,202 4,385 3,882 3,774 3,762 2,977 2,105 1,517 1,005 568 452 Agriculture, forestry and fishing 8,182 498 910 785 823 811 799 910 763 552 499 385 236 211 Mining and quarrying 149 3 17 30 20 23 21 15 8 8 1 3 0 0 Manufacturing 5,808 146 431 561 662 620 747 701 551 469 391 249 167 113 Electricity, gas, steam and air conditioning supply 370 13 54 74 70 39 34 35 24 10 12 5 0 0 Water supply, sewerage, waste management and remediation activities 125 4 19 17 14 14 12 17 12 5 8 3 0 0 Construction 2,236 149 335 289 309 282 266 237 178 96 54 25 8 8 Wholesale and retail trade; repair of motor vehicles & motorcycles 2,565 147 378 393 371 319 301 235 174 102 73 31 22 19 Transportation and storage 1,029 20 104 136 149 150 152 133 85 51 27 12 7 3 Accommodation and food service activities 1,255 99 286 227 153 129 130 96 64 30 23 12 1 5 Information and communication 670 6 125 100 115 83 69 82 50 20 11 7 0 2 Financial and insurance activities 810 9 120 167 140 97 74 81 52 32 21 9 3 5 Real estate activities 19 0 3 1 1 0 7 2 1 0 1 1 1 1 Professional, scientific and technical activities 312 4 37 50 43 38 29 42 28 24 7 6 2 2 Administrative and support service activities 719 22 87 92 96 96 86 83 59 43 31 14 7 3 Public administration and defence; compulsory social security 2,771 38 307 438 470 340 311 316 268 167 62 36 13 5 Education 2,340 6 199 322 426 410 269 260 184 165 67 22 7 3 Human health and social work activitiies 972 17 144 187 159 89 88 105 104 47 18 7 5 2 Arts, entertainment and recreation 156 3 17 23 22 22 23 15 12 8 4 4 1 2 Other service activities 1,836 71 188 153 157 152 194 238 219 178 122 94 42 28 Activities of households as employers* 1,628 108 220 153 183 166 159 155 137 96 85 80 46 40 Activities of extraterritorial organizations and bodies 21 0 0 4 2 2 3 4 4 2 0 0 0 0 Note: *undifferentiated goods- and services producing activities of households for own use
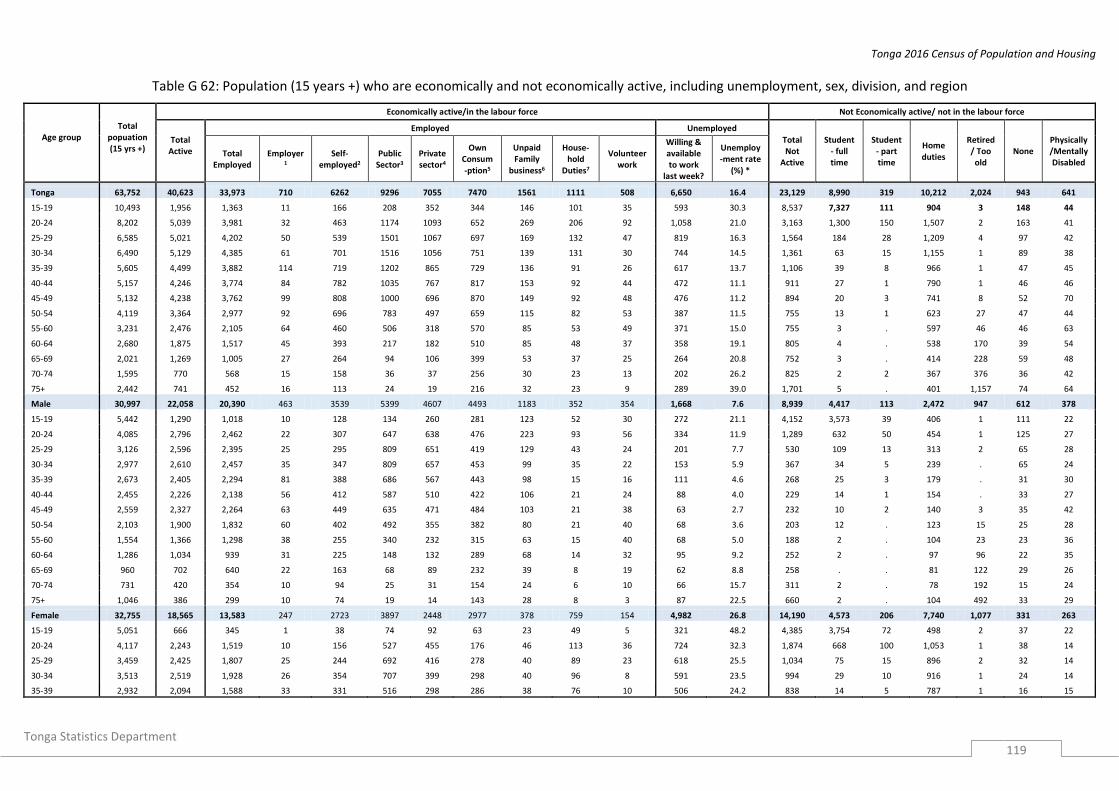
Tonga 2016 Census of Population and Housing
Tonga Statistics Department
119
Table G 62: Population (15 years +) who are economically and not economically active, including unemployment, sex, division, and region
Age group
Total popuation (15 yrs +)
Economically active/in the labour force Not Economically active/ not in the labour force
Total Active
Employed Unemployed
Total Not
Active
Student - full time
Student - part time
Home duties
Retired / Too old
None Physically/Mentally Disabled
Total Employed
Employer1
Self-employed2
Public Sector3
Private sector4
Own Consum-ption5
Unpaid Family
business6
House-hold
Duties7
Volunteer work
Willing & available to work
last week?
Unemploy-ment rate
(%) *
Tonga 63,752 40,623 33,973 710 6262 9296 7055 7470 1561 1111 508 6,650 16.4 23,129 8,990 319 10,212 2,024 943 641
15-19 10,493 1,956 1,363 11 166 208 352 344 146 101 35 593 30.3 8,537 7,327 111 904 3 148 44
20-24 8,202 5,039 3,981 32 463 1174 1093 652 269 206 92 1,058 21.0 3,163 1,300 150 1,507 2 163 41
25-29 6,585 5,021 4,202 50 539 1501 1067 697 169 132 47 819 16.3 1,564 184 28 1,209 4 97 42
30-34 6,490 5,129 4,385 61 701 1516 1056 751 139 131 30 744 14.5 1,361 63 15 1,155 1 89 38
35-39 5,605 4,499 3,882 114 719 1202 865 729 136 91 26 617 13.7 1,106 39 8 966 1 47 45
40-44 5,157 4,246 3,774 84 782 1035 767 817 153 92 44 472 11.1 911 27 1 790 1 46 46
45-49 5,132 4,238 3,762 99 808 1000 696 870 149 92 48 476 11.2 894 20 3 741 8 52 70
50-54 4,119 3,364 2,977 92 696 783 497 659 115 82 53 387 11.5 755 13 1 623 27 47 44
55-60 3,231 2,476 2,105 64 460 506 318 570 85 53 49 371 15.0 755 3 . 597 46 46 63
60-64 2,680 1,875 1,517 45 393 217 182 510 85 48 37 358 19.1 805 4 . 538 170 39 54
65-69 2,021 1,269 1,005 27 264 94 106 399 53 37 25 264 20.8 752 3 . 414 228 59 48
70-74 1,595 770 568 15 158 36 37 256 30 23 13 202 26.2 825 2 2 367 376 36 42
75+ 2,442 741 452 16 113 24 19 216 32 23 9 289 39.0 1,701 5 . 401 1,157 74 64
Male 30,997 22,058 20,390 463 3539 5399 4607 4493 1183 352 354 1,668 7.6 8,939 4,417 113 2,472 947 612 378
15-19 5,442 1,290 1,018 10 128 134 260 281 123 52 30 272 21.1 4,152 3,573 39 406 1 111 22
20-24 4,085 2,796 2,462 22 307 647 638 476 223 93 56 334 11.9 1,289 632 50 454 1 125 27
25-29 3,126 2,596 2,395 25 295 809 651 419 129 43 24 201 7.7 530 109 13 313 2 65 28
30-34 2,977 2,610 2,457 35 347 809 657 453 99 35 22 153 5.9 367 34 5 239 . 65 24
35-39 2,673 2,405 2,294 81 388 686 567 443 98 15 16 111 4.6 268 25 3 179 . 31 30
40-44 2,455 2,226 2,138 56 412 587 510 422 106 21 24 88 4.0 229 14 1 154 . 33 27
45-49 2,559 2,327 2,264 63 449 635 471 484 103 21 38 63 2.7 232 10 2 140 3 35 42
50-54 2,103 1,900 1,832 60 402 492 355 382 80 21 40 68 3.6 203 12 . 123 15 25 28
55-60 1,554 1,366 1,298 38 255 340 232 315 63 15 40 68 5.0 188 2 . 104 23 23 36
60-64 1,286 1,034 939 31 225 148 132 289 68 14 32 95 9.2 252 2 . 97 96 22 35
65-69 960 702 640 22 163 68 89 232 39 8 19 62 8.8 258 . . 81 122 29 26
70-74 731 420 354 10 94 25 31 154 24 6 10 66 15.7 311 2 . 78 192 15 24
75+ 1,046 386 299 10 74 19 14 143 28 8 3 87 22.5 660 2 . 104 492 33 29
Female 32,755 18,565 13,583 247 2723 3897 2448 2977 378 759 154 4,982 26.8 14,190 4,573 206 7,740 1,077 331 263
15-19 5,051 666 345 1 38 74 92 63 23 49 5 321 48.2 4,385 3,754 72 498 2 37 22
20-24 4,117 2,243 1,519 10 156 527 455 176 46 113 36 724 32.3 1,874 668 100 1,053 1 38 14
25-29 3,459 2,425 1,807 25 244 692 416 278 40 89 23 618 25.5 1,034 75 15 896 2 32 14
30-34 3,513 2,519 1,928 26 354 707 399 298 40 96 8 591 23.5 994 29 10 916 1 24 14
35-39 2,932 2,094 1,588 33 331 516 298 286 38 76 10 506 24.2 838 14 5 787 1 16 15

Tonga 2016 Census of Population and Housing
Tonga Statistics Department
120
Age group
Total popuation (15 yrs +)
Economically active/in the labour force Not Economically active/ not in the labour force
Total Active
Employed Unemployed
Total Not
Active
Student - full time
Student - part time
Home duties
Retired / Too old
None Physically/Mentally Disabled
Total Employed
Employer1
Self-employed2
Public Sector3
Private sector4
Own Consum-ption5
Unpaid Family
business6
House-hold
Duties7
Volunteer work
Willing & available to work
last week?
Unemploy-ment rate
(%) *
40-44 2,702 2,020 1,636 28 370 448 257 395 47 71 20 384 19.0 682 13 . 636 1 13 19
45-49 2,573 1,911 1,498 36 359 365 225 386 46 71 10 413 21.6 662 10 1 601 5 17 28
50-54 2,016 1,464 1,145 32 294 291 142 277 35 61 13 319 21.8 552 1 1 500 12 22 16
55-60 1,677 1,110 807 26 205 166 86 255 22 38 9 303 27.3 567 1 . 493 23 23 27
60-64 1,394 841 578 14 168 69 50 221 17 34 5 263 31.3 553 2 . 441 74 17 19
65-69 1,061 567 365 5 101 26 17 167 14 29 6 202 35.6 494 3 . 333 106 30 22
70-74 864 350 214 5 64 11 6 102 6 17 3 136 38.9 514 . 2 289 184 21 18
75+ 1,396 355 153 6 39 5 5 73 4 15 6 202 56.9 1,041 3 . 297 665 41 35
Tongatapu 47,536 29,379 24,104 590 4313 7818 5398 3878 940 772 395 5,275 18.0 18,157 6,886 258 8,260 1,544 718 491
15-19 7,767 1,405 972 9 111 193 293 194 80 67 25 433 30.8 6,362 5,435 83 705 3 103 33
20-24 6,466 3,855 3,035 28 329 1038 910 369 158 134 69 820 21.3 2,611 1,120 123 1,201 2 134 31
25-29 5,114 3,813 3,138 38 373 1292 840 371 93 95 36 675 17.7 1,301 168 25 991 3 81 33
30-34 4,990 3,866 3,260 49 488 1278 854 390 89 92 20 606 15.7 1,124 59 13 938 1 77 36
35-39 4,227 3,293 2,790 97 466 1027 658 376 86 58 22 503 15.3 934 37 8 818 . 37 34
40-44 3,769 3,027 2,643 75 555 860 548 401 99 70 35 384 12.7 742 23 1 640 . 40 38
45-49 3,734 3,007 2,627 84 584 818 486 450 97 71 37 380 12.6 727 18 3 609 8 37 52
50-54 2,991 2,366 2,060 77 507 622 338 341 76 55 44 306 12.9 625 13 . 514 23 39 36
55-60 2,327 1,697 1,398 50 315 389 235 289 47 32 41 299 17.6 630 2 . 506 35 36 51
60-64 1,924 1,282 991 41 253 176 131 277 46 36 31 291 22.7 642 4 . 439 136 24 39
65-69 1,398 808 594 22 164 75 68 188 31 27 19 214 26.5 590 2 . 318 192 40 38
70-74 1,129 490 334 9 96 30 28 124 20 18 9 156 31.8 639 1 2 295 295 24 22
75+ 1,700 470 262 11 72 20 9 108 18 17 7 208 44.3 1,230 4 . 286 846 46 48
Male 23,005 15,990 14,683 377 2587 4508 3472 2505 709 253 272 1,307 8.2 7,015 3,430 99 1,965 740 490 291
15-19 4,036 914 716 8 84 126 214 162 67 34 21 198 21.7 3,122 2,682 33 308 1 80 18
20-24 3,190 2,116 1,852 20 224 571 532 276 124 62 43 264 12.5 1,074 549 45 354 1 104 21
25-29 2,471 2,016 1,847 20 220 714 526 239 74 35 19 169 8.4 455 103 11 259 1 60 21
30-34 2,298 1,977 1,842 26 255 678 530 249 66 23 15 135 6.8 321 32 4 206 . 56 23
35-39 1,996 1,769 1,682 66 274 590 429 241 60 9 13 87 4.9 227 23 3 155 . 25 21
40-44 1,776 1,588 1,518 50 311 478 353 220 69 17 20 70 4.4 188 14 1 121 . 30 22
45-49 1,840 1,657 1,607 54 343 515 318 268 66 16 27 50 3.0 183 9 2 113 3 26 30
50-54 1,517 1,348 1,301 49 316 385 228 221 55 14 33 47 3.5 169 12 . 100 14 21 22
55-60 1,103 952 898 28 188 253 166 183 38 10 32 54 5.7 151 1 . 85 18 20 27
60-64 917 713 639 28 158 112 91 174 37 13 26 74 10.4 204 2 . 81 79 14 28
65-69 643 439 389 17 102 50 56 120 22 8 14 50 11.4 204 . . 56 106 21 21
70-74 505 267 218 4 61 21 22 82 16 5 7 49 18.4 238 1 . 62 153 9 13
75+ 713 234 174 7 51 15 7 70 15 7 2 60 25.6 479 2 . 65 364 24 24
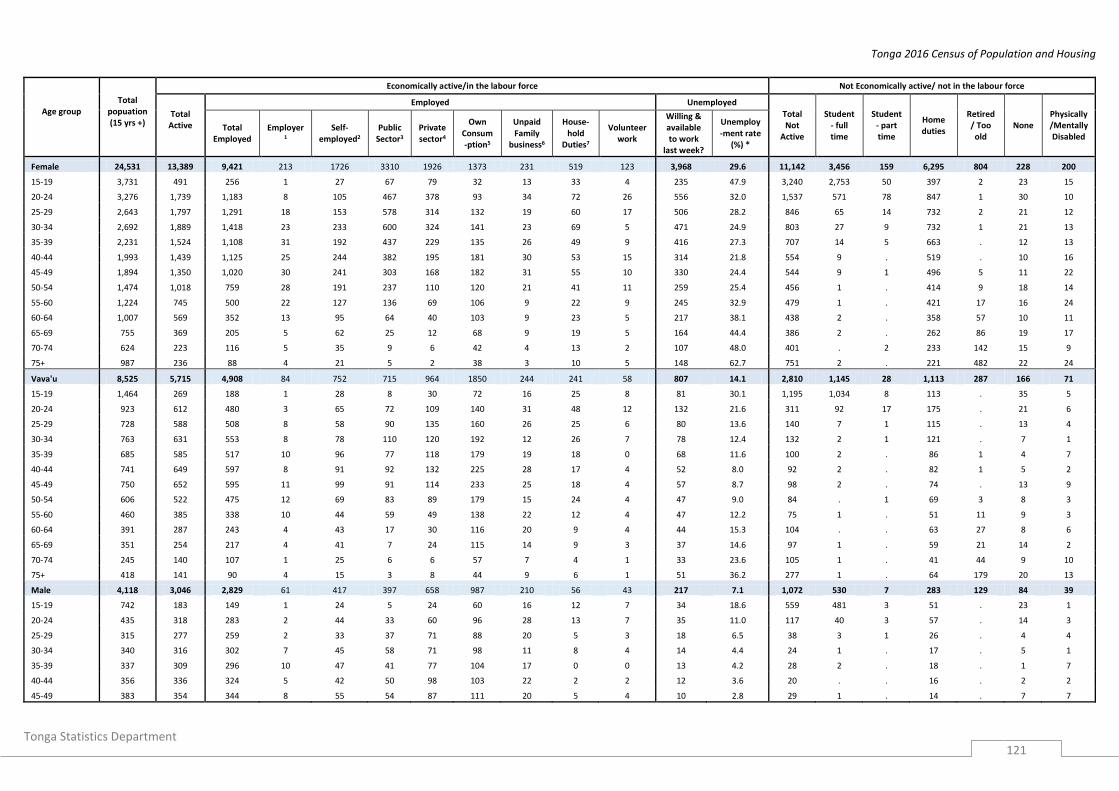
Tonga 2016 Census of Population and Housing
Tonga Statistics Department
121
Age group
Total popuation (15 yrs +)
Economically active/in the labour force Not Economically active/ not in the labour force
Total Active
Employed Unemployed
Total Not
Active
Student - full time
Student - part time
Home duties
Retired / Too old
None Physically/Mentally Disabled
Total Employed
Employer1
Self-employed2
Public Sector3
Private sector4
Own Consum-ption5
Unpaid Family
business6
House-hold
Duties7
Volunteer work
Willing & available to work
last week?
Unemploy-ment rate
(%) *
Female 24,531 13,389 9,421 213 1726 3310 1926 1373 231 519 123 3,968 29.6 11,142 3,456 159 6,295 804 228 200
15-19 3,731 491 256 1 27 67 79 32 13 33 4 235 47.9 3,240 2,753 50 397 2 23 15
20-24 3,276 1,739 1,183 8 105 467 378 93 34 72 26 556 32.0 1,537 571 78 847 1 30 10
25-29 2,643 1,797 1,291 18 153 578 314 132 19 60 17 506 28.2 846 65 14 732 2 21 12
30-34 2,692 1,889 1,418 23 233 600 324 141 23 69 5 471 24.9 803 27 9 732 1 21 13
35-39 2,231 1,524 1,108 31 192 437 229 135 26 49 9 416 27.3 707 14 5 663 . 12 13
40-44 1,993 1,439 1,125 25 244 382 195 181 30 53 15 314 21.8 554 9 . 519 . 10 16
45-49 1,894 1,350 1,020 30 241 303 168 182 31 55 10 330 24.4 544 9 1 496 5 11 22
50-54 1,474 1,018 759 28 191 237 110 120 21 41 11 259 25.4 456 1 . 414 9 18 14
55-60 1,224 745 500 22 127 136 69 106 9 22 9 245 32.9 479 1 . 421 17 16 24
60-64 1,007 569 352 13 95 64 40 103 9 23 5 217 38.1 438 2 . 358 57 10 11
65-69 755 369 205 5 62 25 12 68 9 19 5 164 44.4 386 2 . 262 86 19 17
70-74 624 223 116 5 35 9 6 42 4 13 2 107 48.0 401 . 2 233 142 15 9
75+ 987 236 88 4 21 5 2 38 3 10 5 148 62.7 751 2 . 221 482 22 24
Vava'u 8,525 5,715 4,908 84 752 715 964 1850 244 241 58 807 14.1 2,810 1,145 28 1,113 287 166 71
15-19 1,464 269 188 1 28 8 30 72 16 25 8 81 30.1 1,195 1,034 8 113 . 35 5
20-24 923 612 480 3 65 72 109 140 31 48 12 132 21.6 311 92 17 175 . 21 6
25-29 728 588 508 8 58 90 135 160 26 25 6 80 13.6 140 7 1 115 . 13 4
30-34 763 631 553 8 78 110 120 192 12 26 7 78 12.4 132 2 1 121 . 7 1
35-39 685 585 517 10 96 77 118 179 19 18 0 68 11.6 100 2 . 86 1 4 7
40-44 741 649 597 8 91 92 132 225 28 17 4 52 8.0 92 2 . 82 1 5 2
45-49 750 652 595 11 99 91 114 233 25 18 4 57 8.7 98 2 . 74 . 13 9
50-54 606 522 475 12 69 83 89 179 15 24 4 47 9.0 84 . 1 69 3 8 3
55-60 460 385 338 10 44 59 49 138 22 12 4 47 12.2 75 1 . 51 11 9 3
60-64 391 287 243 4 43 17 30 116 20 9 4 44 15.3 104 . . 63 27 8 6
65-69 351 254 217 4 41 7 24 115 14 9 3 37 14.6 97 1 . 59 21 14 2
70-74 245 140 107 1 25 6 6 57 7 4 1 33 23.6 105 1 . 41 44 9 10
75+ 418 141 90 4 15 3 8 44 9 6 1 51 36.2 277 1 . 64 179 20 13
Male 4,118 3,046 2,829 61 417 397 658 987 210 56 43 217 7.1 1,072 530 7 283 129 84 39
15-19 742 183 149 1 24 5 24 60 16 12 7 34 18.6 559 481 3 51 . 23 1
20-24 435 318 283 2 44 33 60 96 28 13 7 35 11.0 117 40 3 57 . 14 3
25-29 315 277 259 2 33 37 71 88 20 5 3 18 6.5 38 3 1 26 . 4 4
30-34 340 316 302 7 45 58 71 98 11 8 4 14 4.4 24 1 . 17 . 5 1
35-39 337 309 296 10 47 41 77 104 17 0 0 13 4.2 28 2 . 18 . 1 7
40-44 356 336 324 5 42 50 98 103 22 2 2 12 3.6 20 . . 16 . 2 2
45-49 383 354 344 8 55 54 87 111 20 5 4 10 2.8 29 1 . 14 . 7 7
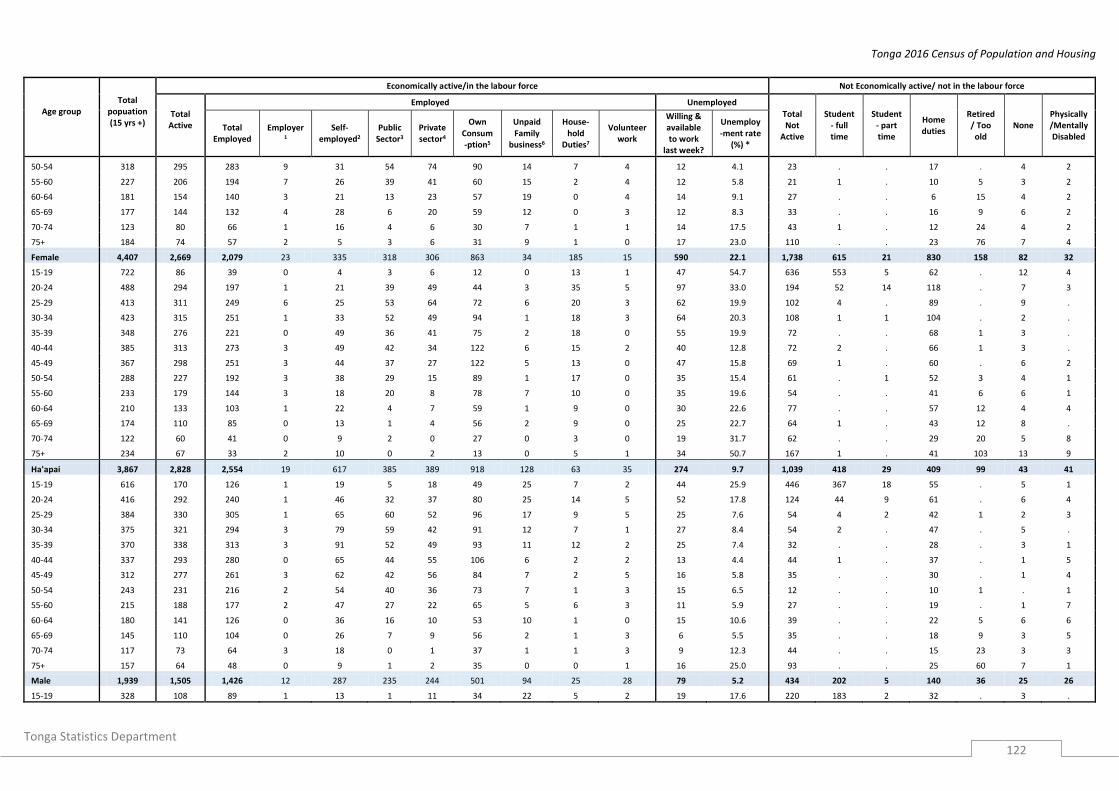
Tonga 2016 Census of Population and Housing
Tonga Statistics Department
122
Age group
Total popuation (15 yrs +)
Economically active/in the labour force Not Economically active/ not in the labour force
Total Active
Employed Unemployed
Total Not
Active
Student - full time
Student - part time
Home duties
Retired / Too old
None Physically/Mentally Disabled
Total Employed
Employer1
Self-employed2
Public Sector3
Private sector4
Own Consum-ption5
Unpaid Family
business6
House-hold
Duties7
Volunteer work
Willing & available to work
last week?
Unemploy-ment rate
(%) *
50-54 318 295 283 9 31 54 74 90 14 7 4 12 4.1 23 . . 17 . 4 2
55-60 227 206 194 7 26 39 41 60 15 2 4 12 5.8 21 1 . 10 5 3 2
60-64 181 154 140 3 21 13 23 57 19 0 4 14 9.1 27 . . 6 15 4 2
65-69 177 144 132 4 28 6 20 59 12 0 3 12 8.3 33 . . 16 9 6 2
70-74 123 80 66 1 16 4 6 30 7 1 1 14 17.5 43 1 . 12 24 4 2
75+ 184 74 57 2 5 3 6 31 9 1 0 17 23.0 110 . . 23 76 7 4
Female 4,407 2,669 2,079 23 335 318 306 863 34 185 15 590 22.1 1,738 615 21 830 158 82 32
15-19 722 86 39 0 4 3 6 12 0 13 1 47 54.7 636 553 5 62 . 12 4
20-24 488 294 197 1 21 39 49 44 3 35 5 97 33.0 194 52 14 118 . 7 3
25-29 413 311 249 6 25 53 64 72 6 20 3 62 19.9 102 4 . 89 . 9 .
30-34 423 315 251 1 33 52 49 94 1 18 3 64 20.3 108 1 1 104 . 2 .
35-39 348 276 221 0 49 36 41 75 2 18 0 55 19.9 72 . . 68 1 3 .
40-44 385 313 273 3 49 42 34 122 6 15 2 40 12.8 72 2 . 66 1 3 .
45-49 367 298 251 3 44 37 27 122 5 13 0 47 15.8 69 1 . 60 . 6 2
50-54 288 227 192 3 38 29 15 89 1 17 0 35 15.4 61 . 1 52 3 4 1
55-60 233 179 144 3 18 20 8 78 7 10 0 35 19.6 54 . . 41 6 6 1
60-64 210 133 103 1 22 4 7 59 1 9 0 30 22.6 77 . . 57 12 4 4
65-69 174 110 85 0 13 1 4 56 2 9 0 25 22.7 64 1 . 43 12 8 .
70-74 122 60 41 0 9 2 0 27 0 3 0 19 31.7 62 . . 29 20 5 8
75+ 234 67 33 2 10 0 2 13 0 5 1 34 50.7 167 1 . 41 103 13 9
Ha'apai 3,867 2,828 2,554 19 617 385 389 918 128 63 35 274 9.7 1,039 418 29 409 99 43 41
15-19 616 170 126 1 19 5 18 49 25 7 2 44 25.9 446 367 18 55 . 5 1
20-24 416 292 240 1 46 32 37 80 25 14 5 52 17.8 124 44 9 61 . 6 4
25-29 384 330 305 1 65 60 52 96 17 9 5 25 7.6 54 4 2 42 1 2 3
30-34 375 321 294 3 79 59 42 91 12 7 1 27 8.4 54 2 . 47 . 5 .
35-39 370 338 313 3 91 52 49 93 11 12 2 25 7.4 32 . . 28 . 3 1
40-44 337 293 280 0 65 44 55 106 6 2 2 13 4.4 44 1 . 37 . 1 5
45-49 312 277 261 3 62 42 56 84 7 2 5 16 5.8 35 . . 30 . 1 4
50-54 243 231 216 2 54 40 36 73 7 1 3 15 6.5 12 . . 10 1 . 1
55-60 215 188 177 2 47 27 22 65 5 6 3 11 5.9 27 . . 19 . 1 7
60-64 180 141 126 0 36 16 10 53 10 1 0 15 10.6 39 . . 22 5 6 6
65-69 145 110 104 0 26 7 9 56 2 1 3 6 5.5 35 . . 18 9 3 5
70-74 117 73 64 3 18 0 1 37 1 1 3 9 12.3 44 . . 15 23 3 3
75+ 157 64 48 0 9 1 2 35 0 0 1 16 25.0 93 . . 25 60 7 1
Male 1,939 1,505 1,426 12 287 235 244 501 94 25 28 79 5.2 434 202 5 140 36 25 26
15-19 328 108 89 1 13 1 11 34 22 5 2 19 17.6 220 183 2 32 . 3 .

Tonga 2016 Census of Population and Housing
Tonga Statistics Department
123
Age group
Total popuation (15 yrs +)
Economically active/in the labour force Not Economically active/ not in the labour force
Total Active
Employed Unemployed
Total Not
Active
Student - full time
Student - part time
Home duties
Retired / Too old
None Physically/Mentally Disabled
Total Employed
Employer1
Self-employed2
Public Sector3
Private sector4
Own Consum-ption5
Unpaid Family
business6
House-hold
Duties7
Volunteer work
Willing & available to work
last week?
Unemploy-ment rate
(%) *
20-24 234 177 158 0 32 22 23 47 21 8 5 19 10.7 57 18 2 29 . 5 3
25-29 181 159 153 1 28 26 29 54 11 2 2 6 3.8 22 . 1 17 1 1 2
30-34 164 149 149 1 32 27 24 53 9 2 1 0 0.0 15 1 . 10 . 4 .
35-39 189 182 176 3 45 30 29 54 9 4 2 6 3.3 7 . . 4 . 2 1
40-44 165 149 147 0 25 29 31 56 4 1 1 2 1.3 16 . . 13 . 1 2
45-49 161 151 148 1 27 28 35 48 4 0 5 3 2.0 10 . . 6 . 1 3
50-54 128 124 118 1 25 25 27 35 3 0 2 6 4.8 4 . . 2 1 . 1
55-60 108 98 96 1 18 23 17 29 3 2 3 2 2.0 10 . . 5 . . 5
60-64 93 76 70 0 16 16 8 23 6 1 0 6 7.9 17 . . 8 2 3 4
65-69 70 60 60 0 14 7 8 27 2 0 2 0 0.0 10 . . 4 3 1 2
70-74 50 36 33 3 7 0 1 20 0 0 2 3 8.3 14 . . 2 7 2 3
75+ 68 36 29 0 5 1 1 21 0 0 1 7 19.4 32 . . 8 22 2 .
Female 1,928 1,323 1,128 7 330 150 145 417 34 38 7 195 14.7 605 216 24 269 63 18 15
15-19 288 62 37 0 6 4 7 15 3 2 0 25 40.3 226 184 16 23 . 2 1
20-24 182 115 82 1 14 10 14 33 4 6 0 33 28.7 67 26 7 32 . 1 1
25-29 203 171 152 0 37 34 23 42 6 7 3 19 11.1 32 4 1 25 . 1 1
30-34 211 172 145 2 47 32 18 38 3 5 0 27 15.7 39 1 . 37 . 1 .
35-39 181 156 137 0 46 22 20 39 2 8 0 19 12.2 25 . . 24 . 1 .
40-44 172 144 133 0 40 15 24 50 2 1 1 11 7.6 28 1 . 24 . . 3
45-49 151 126 113 2 35 14 21 36 3 2 0 13 10.3 25 . . 24 . . 1
50-54 115 107 98 1 29 15 9 38 4 1 1 9 8.4 8 . . 8 . . .
55-60 107 90 81 1 29 4 5 36 2 4 0 9 10.0 17 . . 14 . 1 2
60-64 87 65 56 0 20 0 2 30 4 0 0 9 13.8 22 . . 14 3 3 2
65-69 75 50 44 0 12 0 1 29 0 1 1 6 12.0 25 . . 14 6 2 3
70-74 67 37 31 0 11 0 0 17 1 1 1 6 16.2 30 . . 13 16 1 .
75+ 89 28 19 0 4 0 1 14 0 0 0 9 32.1 61 . . 17 38 5 1
Eua 3,020 2,143 1,877 15 381 241 296 717 194 18 15 266 12.4 877 442 4 323 68 13 27
15-19 521 90 62 0 6 1 11 27 16 1 0 28 31.1 431 401 2 21 . 4 3
20-24 323 228 181 0 16 23 37 59 36 4 6 47 20.6 95 37 1 55 . 2 .
25-29 286 233 200 3 30 41 39 61 26 0 0 33 14.2 53 4 . 48 . . 1
30-34 303 257 227 1 42 46 39 70 22 5 2 30 11.7 46 . 1 44 . . 1
35-39 254 221 202 2 45 30 38 69 15 2 1 19 8.6 33 . . 28 . 3 2
40-44 245 223 201 1 50 22 30 77 17 2 2 22 9.9 22 . . 21 . . 1
45-49 272 251 228 1 42 35 39 88 20 1 2 23 9.2 21 . . 18 . . 3
50-54 211 189 170 1 40 20 33 60 15 1 0 19 10.1 22 . . 19 . . 3
55-60 165 147 133 2 32 12 12 64 10 1 0 14 9.5 18 . . 17 . . 1

Tonga 2016 Census of Population and Housing
Tonga Statistics Department
124
Age group
Total popuation (15 yrs +)
Economically active/in the labour force Not Economically active/ not in the labour force
Total Active
Employed Unemployed
Total Not
Active
Student - full time
Student - part time
Home duties
Retired / Too old
None Physically/Mentally Disabled
Total Employed
Employer1
Self-employed2
Public Sector3
Private sector4
Own Consum-ption5
Unpaid Family
business6
House-hold
Duties7
Volunteer work
Willing & available to work
last week?
Unemploy-ment rate
(%) *
60-64 141 126 118 0 35 7 11 55 7 1 2 8 6.3 15 . . 9 2 1 3
65-69 98 75 68 1 25 4 5 30 3 0 0 7 9.3 23 . . 17 2 2 2
70-74 74 50 46 2 9 0 2 31 2 0 0 4 8.0 24 . . 9 10 . 5
75+ 127 53 41 1 9 0 0 26 5 0 0 12 22.6 74 . . 17 54 1 2
Male 1,510 1,210 1,157 12 196 151 225 419 138 8 8 53 4.4 300 204 2 41 27 11 15
15-19 264 71 56 0 6 1 11 23 14 1 0 15 21.1 193 178 1 8 . 4 2
20-24 181 148 136 0 7 13 23 54 34 4 1 12 8.1 33 24 . 7 . 2 .
25-29 127 117 111 2 11 23 24 31 20 0 0 6 5.1 10 2 . 7 . . 1
30-34 146 141 137 1 14 30 31 46 12 1 2 4 2.8 5 . 1 4 . . .
35-39 116 112 107 1 18 14 30 34 9 1 0 5 4.5 4 . . 1 . 3 .
40-44 132 130 126 1 31 17 26 38 11 1 1 4 3.1 2 . . 1 . . 1
45-49 140 137 137 0 17 26 30 49 13 0 2 0 0.0 3 . . 2 . . 1
50-54 103 101 98 1 21 11 25 32 8 0 0 3 3.0 2 . . . . . 2
55-60 76 73 73 2 18 6 8 32 7 0 0 0 0.0 3 . . 2 . . 1
60-64 77 74 73 0 22 6 10 29 4 0 2 1 1.4 3 . . 1 . 1 1
65-69 49 42 42 1 15 4 5 16 1 0 0 0 0.0 7 . . 3 2 1 1
70-74 37 28 28 2 7 0 2 16 1 0 0 0 0.0 9 . . . 5 . 4
75+ 62 36 33 1 9 0 0 19 4 0 0 3 8.3 26 . . 5 20 . 1
Female 1,510 933 720 3 185 90 71 298 56 10 7 213 22.8 577 238 2 282 41 2 12
15-19 257 19 6 0 0 0 0 4 2 0 0 13 68.4 238 223 1 13 . . 1
20-24 142 80 45 0 9 10 14 5 2 0 5 35 43.8 62 13 1 48 . . .
25-29 159 116 89 1 19 18 15 30 6 0 0 27 23.3 43 2 . 41 . . .
30-34 157 116 90 0 28 16 8 24 10 4 0 26 22.4 41 . . 40 . . 1
35-39 138 109 95 1 27 16 8 35 6 1 1 14 12.8 29 . . 27 . . 2
40-44 113 93 75 0 19 5 4 39 6 1 1 18 19.4 20 . . 20 . . .
45-49 132 114 91 1 25 9 9 39 7 1 0 23 20.2 18 . . 16 . . 2
50-54 108 88 72 0 19 9 8 28 7 1 0 16 18.2 20 . . 19 . . 1
55-60 89 74 60 0 14 6 4 32 3 1 0 14 18.9 15 . . 15 . . .
60-64 64 52 45 0 13 1 1 26 3 1 0 7 13.5 12 . . 8 2 . 2
65-69 49 33 26 0 10 0 0 14 2 0 0 7 21.2 16 . . 14 . 1 1
70-74 37 22 18 0 2 0 0 15 1 0 0 4 18.2 15 . . 9 5 . 1
75+ 65 17 8 0 0 0 0 7 1 0 0 9 52.9 48 . . 12 34 1 1
Ongo Niua 804 558 530 2 199 137 8 107 55 17 5 28 5.0 246 99 . 107 26 3 11
15-19 125 22 15 0 2 1 0 2 9 1 0 7 31.8 103 90 . 10 . 1 2
20-24 74 52 45 0 7 9 0 4 19 6 0 7 13.5 22 7 . 15 . . .
25-29 73 57 51 0 13 18 1 9 7 3 0 6 10.5 16 1 . 13 . 1 1

Tonga 2016 Census of Population and Housing
Tonga Statistics Department
125
Age group
Total popuation (15 yrs +)
Economically active/in the labour force Not Economically active/ not in the labour force
Total Active
Employed Unemployed
Total Not
Active
Student - full time
Student - part time
Home duties
Retired / Too old
None Physically/Mentally Disabled
Total Employed
Employer1
Self-employed2
Public Sector3
Private sector4
Own Consum-ption5
Unpaid Family
business6
House-hold
Duties7
Volunteer work
Willing & available to work
last week?
Unemploy-ment rate
(%) *
30-34 59 54 51 0 14 23 1 8 4 1 0 3 5.6 5 . . 5 . . .
35-39 69 62 60 2 21 16 2 12 5 1 1 2 3.2 7 . . 6 . . 1
40-44 65 54 53 0 21 17 2 8 3 1 1 1 1.9 11 1 . 10 . . .
45-49 64 51 51 0 21 14 1 15 0 0 0 0 0.0 13 . . 10 . 1 2
50-54 68 56 56 0 26 18 1 6 2 1 2 0 0.0 12 . . 11 . . 1
55-60 64 59 59 0 22 19 0 14 1 2 1 0 0.0 5 . . 4 . . 1
60-64 44 39 39 0 26 1 0 9 2 1 0 0 0.0 5 . . 5 . . .
65-69 29 22 22 0 8 1 0 10 3 0 0 0 0.0 7 . . 2 4 . 1
70-74 30 17 17 0 10 0 0 7 0 0 0 0 0.0 13 . . 7 4 . 2
75+ 40 13 11 0 8 0 0 3 0 0 0 2 15.4 27 . . 9 18 . .
Male 425 307 295 1 52 108 8 81 32 10 3 12 3.9 118 51 . 43 15 2 7
15-19 72 14 8 0 1 1 0 2 4 0 0 6 42.9 58 49 . 7 . 1 1
20-24 45 37 33 0 0 8 0 3 16 6 0 4 10.8 8 1 . 7 . . .
25-29 32 27 25 0 3 9 1 7 4 1 0 2 7.4 5 1 . 4 . . .
30-34 29 27 27 0 1 16 1 7 1 1 0 0 0.0 2 . . 2 . . .
35-39 35 33 33 1 4 11 2 10 3 1 1 0 0.0 2 . . 1 . . 1
40-44 26 23 23 0 3 13 2 5 0 0 0 0 0.0 3 . . 3 . . .
45-49 35 28 28 0 7 12 1 8 0 0 0 0 0.0 7 . . 5 . 1 1
50-54 37 32 32 0 9 17 1 4 0 0 1 0 0.0 5 . . 4 . . 1
55-60 40 37 37 0 5 19 0 11 0 1 1 0 0.0 3 . . 2 . . 1
60-64 18 17 17 0 8 1 0 6 2 0 0 0 0.0 1 . . 1 . . .
65-69 21 17 17 0 4 1 0 10 2 0 0 0 0.0 4 . . 2 2 . .
70-74 16 9 9 0 3 0 0 6 0 0 0 0 0.0 7 . . 2 3 . 2
75+ 19 6 6 0 4 0 0 2 0 0 0 0 0.0 13 . . 3 10 . .
Female 379 251 235 1 147 29 0 26 23 7 2 16 6.4 128 48 . 64 11 1 4
15-19 53 8 7 0 1 0 0 0 5 1 0 1 12.5 45 41 . 3 . . 1
20-24 29 15 12 0 7 1 0 1 3 0 0 3 20.0 14 6 . 8 . . .
25-29 41 30 26 0 10 9 0 2 3 2 0 4 13.3 11 . . 9 . 1 1
30-34 30 27 24 0 13 7 0 1 3 0 0 3 11.1 3 . . 3 . . .
35-39 34 29 27 1 17 5 0 2 2 0 0 2 6.9 5 . . 5 . . .
40-44 39 31 30 0 18 4 0 3 3 1 1 1 3.2 8 1 . 7 . . .
45-49 29 23 23 0 14 2 0 7 0 0 0 0 0.0 6 . . 5 . . 1
50-54 31 24 24 0 17 1 0 2 2 1 1 0 0.0 7 . . 7 . . .
55-60 24 22 22 0 17 0 0 3 1 1 0 0 0.0 2 . . 2 . . .
60-64 26 22 22 0 18 0 0 3 0 1 0 0 0.0 4 . . 4 . . .
65-69 8 5 5 0 4 0 0 0 1 0 0 0 0.0 3 . . . 2 . 1
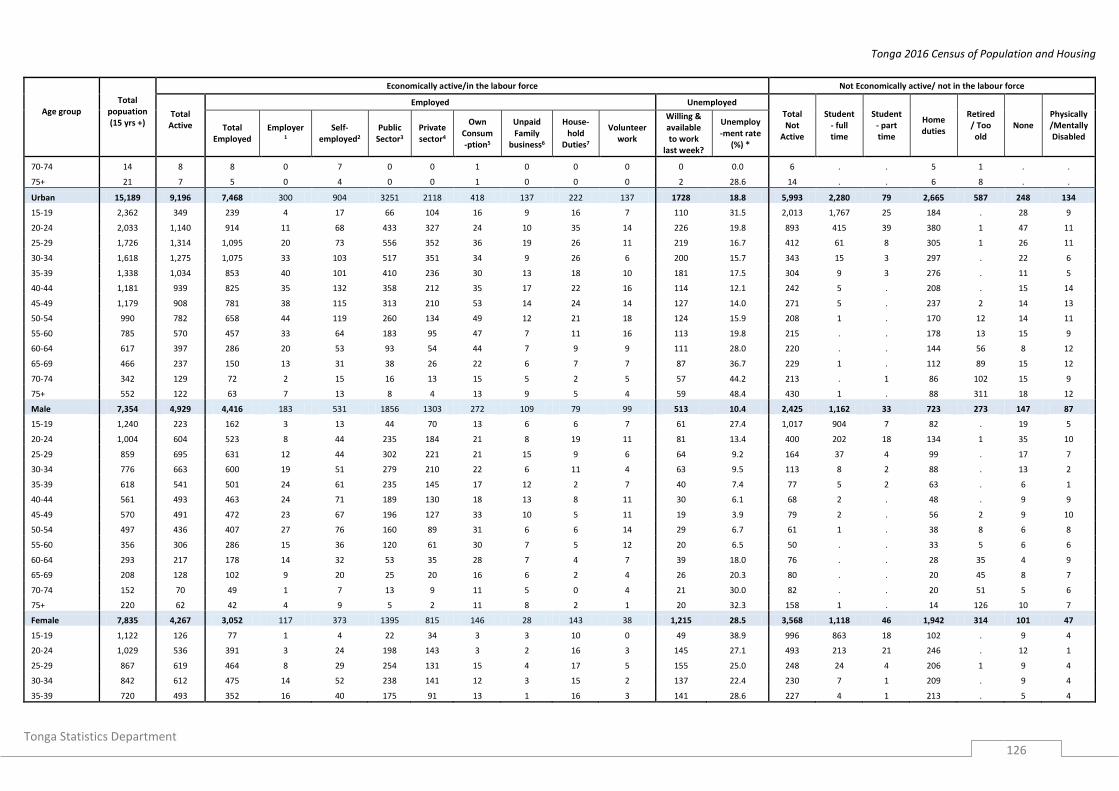
Tonga 2016 Census of Population and Housing
Tonga Statistics Department
126
Age group
Total popuation (15 yrs +)
Economically active/in the labour force Not Economically active/ not in the labour force
Total Active
Employed Unemployed
Total Not
Active
Student - full time
Student - part time
Home duties
Retired / Too old
None Physically/Mentally Disabled
Total Employed
Employer1
Self-employed2
Public Sector3
Private sector4
Own Consum-ption5
Unpaid Family
business6
House-hold
Duties7
Volunteer work
Willing & available to work
last week?
Unemploy-ment rate
(%) *
70-74 14 8 8 0 7 0 0 1 0 0 0 0 0.0 6 . . 5 1 . .
75+ 21 7 5 0 4 0 0 1 0 0 0 2 28.6 14 . . 6 8 . .
Urban 15,189 9,196 7,468 300 904 3251 2118 418 137 222 137 1728 18.8 5,993 2,280 79 2,665 587 248 134
15-19 2,362 349 239 4 17 66 104 16 9 16 7 110 31.5 2,013 1,767 25 184 . 28 9
20-24 2,033 1,140 914 11 68 433 327 24 10 35 14 226 19.8 893 415 39 380 1 47 11
25-29 1,726 1,314 1,095 20 73 556 352 36 19 26 11 219 16.7 412 61 8 305 1 26 11
30-34 1,618 1,275 1,075 33 103 517 351 34 9 26 6 200 15.7 343 15 3 297 . 22 6
35-39 1,338 1,034 853 40 101 410 236 30 13 18 10 181 17.5 304 9 3 276 . 11 5
40-44 1,181 939 825 35 132 358 212 35 17 22 16 114 12.1 242 5 . 208 . 15 14
45-49 1,179 908 781 38 115 313 210 53 14 24 14 127 14.0 271 5 . 237 2 14 13
50-54 990 782 658 44 119 260 134 49 12 21 18 124 15.9 208 1 . 170 12 14 11
55-60 785 570 457 33 64 183 95 47 7 11 16 113 19.8 215 . . 178 13 15 9
60-64 617 397 286 20 53 93 54 44 7 9 9 111 28.0 220 . . 144 56 8 12
65-69 466 237 150 13 31 38 26 22 6 7 7 87 36.7 229 1 . 112 89 15 12
70-74 342 129 72 2 15 16 13 15 5 2 5 57 44.2 213 . 1 86 102 15 9
75+ 552 122 63 7 13 8 4 13 9 5 4 59 48.4 430 1 . 88 311 18 12
Male 7,354 4,929 4,416 183 531 1856 1303 272 109 79 99 513 10.4 2,425 1,162 33 723 273 147 87
15-19 1,240 223 162 3 13 44 70 13 6 6 7 61 27.4 1,017 904 7 82 . 19 5
20-24 1,004 604 523 8 44 235 184 21 8 19 11 81 13.4 400 202 18 134 1 35 10
25-29 859 695 631 12 44 302 221 21 15 9 6 64 9.2 164 37 4 99 . 17 7
30-34 776 663 600 19 51 279 210 22 6 11 4 63 9.5 113 8 2 88 . 13 2
35-39 618 541 501 24 61 235 145 17 12 2 7 40 7.4 77 5 2 63 . 6 1
40-44 561 493 463 24 71 189 130 18 13 8 11 30 6.1 68 2 . 48 . 9 9
45-49 570 491 472 23 67 196 127 33 10 5 11 19 3.9 79 2 . 56 2 9 10
50-54 497 436 407 27 76 160 89 31 6 6 14 29 6.7 61 1 . 38 8 6 8
55-60 356 306 286 15 36 120 61 30 7 5 12 20 6.5 50 . . 33 5 6 6
60-64 293 217 178 14 32 53 35 28 7 4 7 39 18.0 76 . . 28 35 4 9
65-69 208 128 102 9 20 25 20 16 6 2 4 26 20.3 80 . . 20 45 8 7
70-74 152 70 49 1 7 13 9 11 5 0 4 21 30.0 82 . . 20 51 5 6
75+ 220 62 42 4 9 5 2 11 8 2 1 20 32.3 158 1 . 14 126 10 7
Female 7,835 4,267 3,052 117 373 1395 815 146 28 143 38 1,215 28.5 3,568 1,118 46 1,942 314 101 47
15-19 1,122 126 77 1 4 22 34 3 3 10 0 49 38.9 996 863 18 102 . 9 4
20-24 1,029 536 391 3 24 198 143 3 2 16 3 145 27.1 493 213 21 246 . 12 1
25-29 867 619 464 8 29 254 131 15 4 17 5 155 25.0 248 24 4 206 1 9 4
30-34 842 612 475 14 52 238 141 12 3 15 2 137 22.4 230 7 1 209 . 9 4
35-39 720 493 352 16 40 175 91 13 1 16 3 141 28.6 227 4 1 213 . 5 4

Tonga 2016 Census of Population and Housing
Tonga Statistics Department
127
Age group
Total popuation (15 yrs +)
Economically active/in the labour force Not Economically active/ not in the labour force
Total Active
Employed Unemployed
Total Not
Active
Student - full time
Student - part time
Home duties
Retired / Too old
None Physically/Mentally Disabled
Total Employed
Employer1
Self-employed2
Public Sector3
Private sector4
Own Consum-ption5
Unpaid Family
business6
House-hold
Duties7
Volunteer work
Willing & available to work
last week?
Unemploy-ment rate
(%) *
40-44 620 446 362 11 61 169 82 17 4 14 5 84 18.8 174 3 . 160 . 6 5
45-49 609 417 309 15 48 117 83 20 4 19 3 108 25.9 192 3 . 181 . 5 3
50-54 493 346 251 17 43 100 45 18 6 15 4 95 27.5 147 . . 132 4 8 3
55-60 429 264 171 18 28 63 34 17 0 6 4 93 35.2 165 . . 145 8 9 3
60-64 324 180 108 6 21 40 19 16 0 5 2 72 40.0 144 . . 116 21 4 3
65-69 258 109 48 4 11 13 6 6 0 5 3 61 56.0 149 1 . 92 44 7 5
70-74 190 59 23 1 8 3 4 4 0 2 1 36 61.0 131 . 1 66 51 10 3
75+ 332 60 21 3 4 3 2 2 1 3 3 39 65.0 272 . . 74 185 8 5
Rural 48,563 31,427 26,505 410 5358 6045 4937 7052 1424 889 371 4,922 15.7 17,136 6,710 240 7,547 1,437 695 507
15-19 8,131 1,607 1,124 7 149 142 248 328 137 85 28 483 30.1 6,524 5,560 86 720 3 120 35
20-24 6,169 3,899 3,067 21 395 741 766 628 259 171 78 832 21.3 2,270 885 111 1,127 1 116 30
25-29 4,859 3,707 3,107 30 466 945 715 661 150 106 36 600 16.2 1,152 123 20 904 3 71 31
30-34 4,872 3,854 3,310 28 598 999 705 717 130 105 24 544 14.1 1,018 48 12 858 1 67 32
35-39 4,267 3,465 3,029 74 618 792 629 699 123 73 16 436 12.6 802 30 5 690 1 36 40
40-44 3,976 3,307 2,949 49 650 677 555 782 136 70 28 358 10.8 669 22 1 582 1 31 32
45-49 3,953 3,330 2,981 61 693 687 486 817 135 68 34 349 10.5 623 15 3 504 6 38 57
50-54 3,129 2,582 2,319 48 577 523 363 610 103 61 35 263 10.2 547 12 1 453 15 33 33
55-60 2,446 1,906 1,648 31 396 323 223 523 78 42 33 258 13.5 540 3 . 419 33 31 54
60-64 2,063 1,478 1,231 25 340 124 128 466 78 39 28 247 16.7 585 4 . 394 114 31 42
65-69 1,555 1,032 855 14 233 56 80 377 47 30 18 177 17.2 523 2 . 302 139 44 36
70-74 1,253 641 496 13 143 20 24 241 25 21 8 145 22.6 612 2 1 281 274 21 33
75+ 1,890 619 389 9 100 16 15 203 23 18 5 230 37.2 1,271 4 . 313 846 56 52
Male 23,643 17,129 15,974 280 3008 3543 3304 4221 1074 273 255 1,155 6.7 6,514 3,255 80 1,749 674 465 291
15-19 4,202 1,067 856 7 115 90 190 268 117 46 23 211 19.8 3,135 2,669 32 324 1 92 17
20-24 3,081 2,192 1,939 14 263 412 454 455 215 74 45 253 11.5 889 430 32 320 . 90 17
25-29 2,267 1,901 1,764 13 251 507 430 398 114 34 18 137 7.2 366 72 9 214 2 48 21
30-34 2,201 1,947 1,857 16 296 530 447 431 93 24 18 90 4.6 254 26 3 151 . 52 22
35-39 2,055 1,864 1,793 57 327 451 422 426 86 13 9 71 3.8 191 20 1 116 . 25 29
40-44 1,894 1,733 1,675 32 341 398 380 404 93 13 13 58 3.3 161 12 1 106 . 24 18
45-49 1,989 1,836 1,792 40 382 439 344 451 93 16 27 44 2.4 153 8 2 84 1 26 32
50-54 1,606 1,464 1,425 33 326 332 266 351 74 15 26 39 2.7 142 11 . 85 7 19 20
55-60 1,198 1,060 1,012 23 219 220 171 285 56 10 28 48 4.5 138 2 . 71 18 17 30
60-64 993 817 761 17 193 95 97 261 61 10 25 56 6.9 176 2 . 69 61 18 26
65-69 752 574 538 13 143 43 69 216 33 6 15 36 6.3 178 . . 61 77 21 19
70-74 579 350 305 9 87 12 22 143 19 6 6 45 12.9 229 2 . 58 141 10 18
75+ 826 324 257 6 65 14 12 132 20 6 2 67 20.7 502 1 . 90 366 23 22

Tonga 2016 Census of Population and Housing
Tonga Statistics Department
128
Age group
Total popuation (15 yrs +)
Economically active/in the labour force Not Economically active/ not in the labour force
Total Active
Employed Unemployed
Total Not
Active
Student - full time
Student - part time
Home duties
Retired / Too old
None Physically/Mentally Disabled
Total Employed
Employer1
Self-employed2
Public Sector3
Private sector4
Own Consum-ption5
Unpaid Family
business6
House-hold
Duties7
Volunteer work
Willing & available to work
last week?
Unemploy-ment rate
(%) *
Female 24,920 14,298 10,531 130 2350 2502 1633 2831 350 616 116 3,767 26.3 10,622 3,455 160 5,798 763 230 216
15-19 3,929 540 268 0 34 52 58 60 20 39 5 272 50.4 3,389 2,891 54 396 2 28 18
20-24 3,088 1,707 1,128 7 132 329 312 173 44 97 33 579 33.9 1,381 455 79 807 1 26 13
25-29 2,592 1,806 1,343 17 215 438 285 263 36 72 18 463 25.6 786 51 11 690 1 23 10
30-34 2,671 1,907 1,453 12 302 469 258 286 37 81 6 454 23.8 764 22 9 707 1 15 10
35-39 2,212 1,601 1,236 17 291 341 207 273 37 60 7 365 22.8 611 10 4 574 1 11 11
40-44 2,082 1,574 1,274 17 309 279 175 378 43 57 15 300 19.1 508 10 . 476 1 7 14
45-49 1,964 1,494 1,189 21 311 248 142 366 42 52 7 305 20.4 470 7 1 420 5 12 25
50-54 1,523 1,118 894 15 251 191 97 259 29 46 9 224 20.0 405 1 1 368 8 14 13
55-60 1,248 846 636 8 177 103 52 238 22 32 5 210 24.8 402 1 . 348 15 14 24
60-64 1,070 661 470 8 147 29 31 205 17 29 3 191 28.9 409 2 . 325 53 13 16
65-69 803 458 317 1 90 13 11 161 14 24 3 141 30.8 345 2 . 241 62 23 17
70-74 674 291 191 4 56 8 2 98 6 15 2 100 34.4 383 . 1 223 133 11 15
75+ 1,064 295 132 3 35 2 3 71 3 12 3 163 55.3 769 3 . 223 480 33 30
Greater Nuku'alofa 22,830 13,877 11,362 383 1385 4698 3173 910 258 365 198 2,515 18.1 8,953 3,485 127 3,917 834 356 234
15-19 3,596 561 382 5 31 94 171 36 12 23 10 179 31.9 3,035 2,649 40 281 2 49 14
20-24 3,116 1,781 1,432 17 112 623 500 72 31 58 19 349 19.6 1,335 632 57 562 1 66 17
25-29 2,570 1,942 1,613 28 114 800 494 88 30 38 19 329 16.9 628 99 13 462 1 36 17
30-34 2,457 1,936 1,633 39 154 764 532 78 17 41 9 303 15.7 521 29 7 437 . 28 20
35-39 2,054 1,580 1,325 58 151 600 377 83 22 25 13 255 16.1 474 27 7 409 . 16 15
40-44 1,787 1,425 1,263 45 199 523 320 93 27 35 24 162 11.4 362 17 1 302 . 19 23
45-49 1,742 1,367 1,180 49 178 473 304 101 24 35 16 187 13.7 375 16 1 311 2 19 26
50-54 1,442 1,127 965 55 179 372 198 81 23 32 25 162 14.4 315 11 . 250 17 22 15
55-60 1,152 821 669 37 102 240 141 92 15 22 21 152 18.5 331 2 . 268 20 18 23
60-64 918 590 439 22 77 125 73 80 21 22 19 151 25.6 328 . . 220 77 15 16
65-69 679 360 241 14 43 54 40 48 13 16 13 119 33.1 319 2 . 160 116 22 19
70-74 517 203 126 4 26 22 15 34 12 8 5 77 37.9 314 . 1 132 150 19 12
75+ 800 184 94 10 19 8 8 24 11 10 5 90 48.9 616 1 . 123 448 27 17
Male 11,045 7,506 6,782 242 816 2698 2019 570 187 124 132 724 9.6 3,539 1,765 51 972 391 210 150
15-19 1,864 359 266 4 23 62 121 31 8 9 8 93 25.9 1,505 1,327 15 120 1 33 9
20-24 1,557 980 856 12 76 352 293 56 23 31 13 124 12.7 577 312 24 176 1 50 14
25-29 1,257 1,026 931 18 70 431 309 56 22 15 9 95 9.3 231 61 6 132 . 21 11
30-34 1,175 1,021 930 22 72 418 336 52 12 13 6 91 8.9 154 15 2 111 . 14 12
35-39 967 847 799 39 96 336 251 52 17 2 8 48 5.7 120 19 3 81 . 10 7
40-44 860 749 708 30 104 283 200 49 21 9 14 41 5.5 111 12 1 70 . 12 16
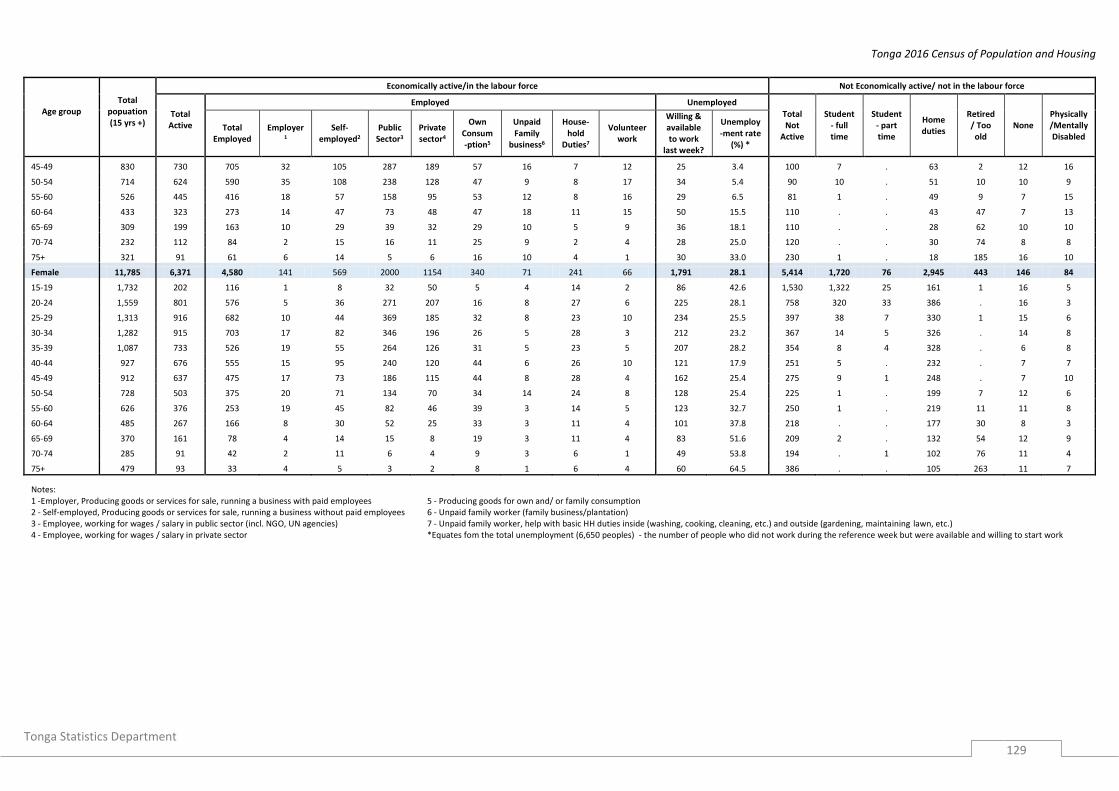
Tonga 2016 Census of Population and Housing
Tonga Statistics Department
129
Age group
Total popuation (15 yrs +)
Economically active/in the labour force Not Economically active/ not in the labour force
Total Active
Employed Unemployed
Total Not
Active
Student - full time
Student - part time
Home duties
Retired / Too old
None Physically/Mentally Disabled
Total Employed
Employer1
Self-employed2
Public Sector3
Private sector4
Own Consum-ption5
Unpaid Family
business6
House-hold
Duties7
Volunteer work
Willing & available to work
last week?
Unemploy-ment rate
(%) *
45-49 830 730 705 32 105 287 189 57 16 7 12 25 3.4 100 7 . 63 2 12 16
50-54 714 624 590 35 108 238 128 47 9 8 17 34 5.4 90 10 . 51 10 10 9
55-60 526 445 416 18 57 158 95 53 12 8 16 29 6.5 81 1 . 49 9 7 15
60-64 433 323 273 14 47 73 48 47 18 11 15 50 15.5 110 . . 43 47 7 13
65-69 309 199 163 10 29 39 32 29 10 5 9 36 18.1 110 . . 28 62 10 10
70-74 232 112 84 2 15 16 11 25 9 2 4 28 25.0 120 . . 30 74 8 8
75+ 321 91 61 6 14 5 6 16 10 4 1 30 33.0 230 1 . 18 185 16 10
Female 11,785 6,371 4,580 141 569 2000 1154 340 71 241 66 1,791 28.1 5,414 1,720 76 2,945 443 146 84
15-19 1,732 202 116 1 8 32 50 5 4 14 2 86 42.6 1,530 1,322 25 161 1 16 5
20-24 1,559 801 576 5 36 271 207 16 8 27 6 225 28.1 758 320 33 386 . 16 3
25-29 1,313 916 682 10 44 369 185 32 8 23 10 234 25.5 397 38 7 330 1 15 6
30-34 1,282 915 703 17 82 346 196 26 5 28 3 212 23.2 367 14 5 326 . 14 8
35-39 1,087 733 526 19 55 264 126 31 5 23 5 207 28.2 354 8 4 328 . 6 8
40-44 927 676 555 15 95 240 120 44 6 26 10 121 17.9 251 5 . 232 . 7 7
45-49 912 637 475 17 73 186 115 44 8 28 4 162 25.4 275 9 1 248 . 7 10
50-54 728 503 375 20 71 134 70 34 14 24 8 128 25.4 225 1 . 199 7 12 6
55-60 626 376 253 19 45 82 46 39 3 14 5 123 32.7 250 1 . 219 11 11 8
60-64 485 267 166 8 30 52 25 33 3 11 4 101 37.8 218 . . 177 30 8 3
65-69 370 161 78 4 14 15 8 19 3 11 4 83 51.6 209 2 . 132 54 12 9
70-74 285 91 42 2 11 6 4 9 3 6 1 49 53.8 194 . 1 102 76 11 4
75+ 479 93 33 4 5 3 2 8 1 6 4 60 64.5 386 . . 105 263 11 7
Notes: 1 -Employer, Producing goods or services for sale, running a business with paid employees 5 - Producing goods for own and/ or family consumption 2 - Self-employed, Producing goods or services for sale, running a business without paid employees 6 - Unpaid family worker (family business/plantation) 3 - Employee, working for wages / salary in public sector (incl. NGO, UN agencies) 7 - Unpaid family worker, help with basic HH duties inside (washing, cooking, cleaning, etc.) and outside (gardening, maintaining lawn, etc.) 4 - Employee, working for wages / salary in private sector *Equates fom the total unemployment (6,650 peoples) - the number of people who did not work during the reference week but were available and willing to start work

Tonga 2016 Census of Population and Housing
Tonga Statistics Department
130
Table G 63: Population (15 years +) who are economically and not economically active, including unemployment, sex, division, and region
Age Group / sex
Total popuation (15 yrs +)
Economically active/in the labour force Not Economically active/ not in the labour force
Total Active
Employed Unemployed
Total Not
Active
Student - full time
Student - part time
Home duties
Retired / Too old
None Physically/Mentally Disabled
Total Employed
Employer1 Self-
employed2 Public Sector3
Private sector4
Own Consum-
ption5
Unpaid Family
business6
Household Duties7
Volunteer work
Willing & avail-able to work last
week?
Unemp-loyment rate (%)
**
Tonga 63,752 34,321 33,973 710 6262 9296 7055 7470 1561 1111 508 348 1.0 29,431 8,990 460 15,977 2,269 1,067 668
10,493 1,422 1,363 11 166 208 352 344 146 101 35 59 4.1 9,071 7,327 152 1,370 5 171 46
20-24 8,202 4,091 3,981 32 463 1174 1093 652 269 206 92 110 2.7 4,111 1,300 227 2,341 3 196 44
25-29 6,585 4,269 4,202 50 539 1501 1067 697 169 132 47 67 1.6 2,316 184 38 1,929 5 118 42
30-34 6,490 4,426 4,385 61 701 1516 1056 751 139 131 30 41 0.9 2,064 63 22 1,832 2 102 43
35-39 5,605 3,904 3,882 114 719 1202 865 729 136 91 26 22 0.6 1,701 39 11 1,555 2 49 45
40-44 5,157 3,794 3,774 84 782 1035 767 817 153 92 44 20 0.5 1,363 27 1 1,236 1 50 48
45-49 5,132 3,775 3,762 99 808 1000 696 870 149 92 48 13 0.3 1,357 20 3 1,199 9 55 71
50-54 4,119 2,982 2,977 92 696 783 497 659 115 82 53 5 0.2 1,137 13 2 993 29 52 48
55-60 3,231 2,108 2,105 64 460 506 318 570 85 53 49 3 0.1 1,123 3 . 945 62 48 65
60-64 2,680 1,521 1,517 45 393 217 182 510 85 48 37 4 0.3 1,159 4 . 840 212 45 58
65-69 2,021 1,008 1,005 27 264 94 106 399 53 37 25 3 0.3 1,016 3 1 633 265 65 49
70-74 1,595 569 568 15 158 36 37 256 30 23 13 1 0.2 1,024 2 3 518 422 37 42
75+ 2,442 452 452 16 113 24 19 216 32 23 9 0 0.0 1,989 5 . 586 1,252 79 67
Male 30,997 20,544 20,390 463 3539 5399 4607 4493 1183 352 354 154 0.7 10,453 4,417 166 3,703 1,075 702 390
15-19 5,442 1,048 1,018 10 128 134 260 281 123 52 30 30 2.9 4,394 3,573 63 599 2 133 24
20-24 4,085 2,509 2,462 22 307 647 638 476 223 93 56 47 1.9 1,576 632 74 698 1 143 28
25-29 3,126 2,424 2,395 25 295 809 651 419 129 43 24 29 1.2 702 109 16 463 2 84 28
30-34 2,977 2,473 2,457 35 347 809 657 453 99 35 22 16 0.6 504 34 5 365 . 74 26
35-39 2,673 2,300 2,294 81 388 686 567 443 98 15 16 6 0.3 373 25 5 281 . 32 30
40-44 2,455 2,151 2,138 56 412 587 510 422 106 21 24 13 0.6 304 14 1 226 . 36 27
45-49 2,559 2,267 2,264 63 449 635 471 484 103 21 38 3 0.1 292 10 2 198 3 36 43
50-54 2,103 1,836 1,832 60 402 492 355 382 80 21 40 4 0.2 267 12 . 178 17 30 30
55-60 1,554 1,300 1,298 38 255 340 232 315 63 15 40 2 0.2 254 2 . 157 35 23 37
60-64 1,286 941 939 31 225 148 132 289 68 14 32 2 0.2 345 2 . 156 124 27 36
65-69 960 641 640 22 163 68 89 232 39 8 19 1 0.2 320 . . 116 145 33 26
70-74 731 355 354 10 94 25 31 154 24 6 10 1 0.3 376 2 . 114 220 16 24
75+ 1,046 299 299 10 74 19 14 143 28 8 3 0 0.0 746 2 . 152 526 35 31
Female 32,755 13,777 13,583 247 2723 3897 2448 2977 378 759 154 194 1.4 18,978 4,573 294 12,274 1,194 365 278
15-19 5,051 374 345 1 38 74 92 63 23 49 5 29 7.8 4,677 3,754 89 771 3 38 22
20-24 4,117 1,582 1,519 10 156 527 455 176 46 113 36 63 4.0 2,535 668 153 1,643 2 53 16
25-29 3,459 1,845 1,807 25 244 692 416 278 40 89 23 38 2.1 1,614 75 22 1,466 3 34 14
30-34 3,513 1,953 1,928 26 354 707 399 298 40 96 8 25 1.3 1,560 29 17 1,467 2 28 17
35-39 2,932 1,604 1,588 33 331 516 298 286 38 76 10 16 1.0 1,328 14 6 1,274 2 17 15
40-44 2,702 1,643 1,636 28 370 448 257 395 47 71 20 7 0.4 1,059 13 . 1,010 1 14 21
45-49 2,573 1,508 1,498 36 359 365 225 386 46 71 10 10 0.7 1,065 10 1 1,001 6 19 28
50-54 2,016 1,146 1,145 32 294 291 142 277 35 61 13 1 0.1 870 1 2 815 12 22 18
55-60 1,677 808 807 26 205 166 86 255 22 38 9 1 0.1 869 1 . 788 27 25 28

Tonga 2016 Census of Population and Housing
Tonga Statistics Department
131
Age Group / sex
Total popuation (15 yrs +)
Economically active/in the labour force Not Economically active/ not in the labour force
Total Active
Employed Unemployed
Total Not
Active
Student - full time
Student - part time
Home duties
Retired / Too old
None Physically/Mentally Disabled
Total Employed
Employer1 Self-
employed2 Public Sector3
Private sector4
Own Consum-
ption5
Unpaid Family
business6
Household Duties7
Volunteer work
Willing & avail-able to work last
week?
Unemp-loyment rate (%)
**
60-64 1,394 580 578 14 168 69 50 221 17 34 5 2 0.3 814 2 . 684 88 18 22
65-69 1,061 365 365 5 101 26 17 167 14 29 6 0 0.0 696 3 1 517 120 32 23
70-74 864 216 214 5 64 11 6 102 6 17 3 2 0.9 648 . 3 404 202 21 18
75+ 1,396 153 153 6 39 5 5 73 4 15 6 0 0.0 1,243 3 . 434 726 44 36
Tongatapu 47,536 24,407 24,104 590 4313 7818 5398 3878 940 772 395 303 1.2 23,129 6,886 352 12,830 1,735 815 511
15-19 7,767 1,018 972 9 111 193 293 194 80 67 25 46 4.5 6,749 5,435 106 1,045 5 123 35
20-24 6,466 3,129 3,035 28 329 1038 910 369 158 134 69 94 3.0 3,337 1,120 177 1,848 3 158 31
25-29 5,114 3,203 3,138 38 373 1292 840 371 93 95 36 65 2.0 1,911 168 33 1,577 4 96 33
30-34 4,990 3,296 3,260 49 488 1278 854 390 89 92 20 36 1.1 1,694 59 19 1,484 2 89 41
35-39 4,227 2,808 2,790 97 466 1027 658 376 86 58 22 18 0.6 1,419 37 11 1,299 1 37 34
40-44 3,769 2,663 2,643 75 555 860 548 401 99 70 35 20 0.8 1,106 23 1 999 . 44 39
45-49 3,734 2,637 2,627 84 584 818 486 450 97 71 37 10 0.4 1,097 18 3 974 9 40 53
50-54 2,991 2,065 2,060 77 507 622 338 341 76 55 44 5 0.2 926 13 . 807 24 43 39
55-60 2,327 1,400 1,398 50 315 389 235 289 47 32 41 2 0.1 927 2 . 787 47 38 53
60-64 1,924 994 991 41 253 176 131 277 46 36 31 3 0.3 930 4 . 683 172 28 43
65-69 1,398 594 594 22 164 75 68 188 31 27 19 0 0.0 804 2 . 496 224 43 39
70-74 1,129 337 334 9 96 30 28 124 20 18 9 3 0.9 792 1 2 410 332 25 22
75+ 1,700 263 262 11 72 20 9 108 18 17 7 1 0.4 1,437 4 . 421 912 51 49
Male 23,005 14,816 14,683 377 2587 4508 3472 2505 709 253 272 133 0.9 8,189 3,430 134 2,923 840 562 300
15-19 4,036 740 716 8 84 126 214 162 67 34 21 24 3.2 3,296 2,682 46 447 2 99 20
20-24 3,190 1,893 1,852 20 224 571 532 276 124 62 43 41 2.2 1,297 549 62 545 1 119 21
25-29 2,471 1,874 1,847 20 220 714 526 239 74 35 19 27 1.4 597 103 14 385 1 73 21
30-34 2,298 1,856 1,842 26 255 678 530 249 66 23 15 14 0.8 442 32 4 316 . 65 25
35-39 1,996 1,686 1,682 66 274 590 429 241 60 9 13 4 0.2 310 23 5 236 . 25 21
40-44 1,776 1,531 1,518 50 311 478 353 220 69 17 20 13 0.8 245 14 1 175 . 33 22
45-49 1,840 1,609 1,607 54 343 515 318 268 66 16 27 2 0.1 231 9 2 159 3 27 31
50-54 1,517 1,305 1,301 49 316 385 228 221 55 14 33 4 0.3 212 12 . 136 15 25 24
55-60 1,103 899 898 28 188 253 166 183 38 10 32 1 0.1 204 1 . 129 26 20 28
60-64 917 640 639 28 158 112 91 174 37 13 26 1 0.2 277 2 . 127 102 17 29
65-69 643 389 389 17 102 50 56 120 22 8 14 0 0.0 254 . . 82 128 23 21
70-74 505 219 218 4 61 21 22 82 16 5 7 1 0.5 286 1 . 86 176 10 13
75+ 713 175 174 7 51 15 7 70 15 7 2 1 0.6 538 2 . 100 386 26 24
Female 24,531 9,591 9,421 213 1726 3310 1926 1373 231 519 123 170 1.8 14,940 3,456 218 9,907 895 253 211
15-19 3,731 278 256 1 27 67 79 32 13 33 4 22 7.9 3,453 2,753 60 598 3 24 15
20-24 3,276 1,236 1,183 8 105 467 378 93 34 72 26 53 4.3 2,040 571 115 1,303 2 39 10
25-29 2,643 1,329 1,291 18 153 578 314 132 19 60 17 38 2.9 1,314 65 19 1,192 3 23 12
30-34 2,692 1,440 1,418 23 233 600 324 141 23 69 5 22 1.5 1,252 27 15 1,168 2 24 16
35-39 2,231 1,122 1,108 31 192 437 229 135 26 49 9 14 1.2 1,109 14 6 1,063 1 12 13
40-44 1,993 1,132 1,125 25 244 382 195 181 30 53 15 7 0.6 861 9 . 824 . 11 17
45-49 1,894 1,028 1,020 30 241 303 168 182 31 55 10 8 0.8 866 9 1 815 6 13 22
50-54 1,474 760 759 28 191 237 110 120 21 41 11 1 0.1 714 1 . 671 9 18 15

Tonga 2016 Census of Population and Housing
Tonga Statistics Department
132
Age Group / sex
Total popuation (15 yrs +)
Economically active/in the labour force Not Economically active/ not in the labour force
Total Active
Employed Unemployed
Total Not
Active
Student - full time
Student - part time
Home duties
Retired / Too old
None Physically/Mentally Disabled
Total Employed
Employer1 Self-
employed2 Public Sector3
Private sector4
Own Consum-
ption5
Unpaid Family
business6
Household Duties7
Volunteer work
Willing & avail-able to work last
week?
Unemp-loyment rate (%)
**
55-60 1,224 501 500 22 127 136 69 106 9 22 9 1 0.2 723 1 . 658 21 18 25
60-64 1,007 354 352 13 95 64 40 103 9 23 5 2 0.6 653 2 . 556 70 11 14
65-69 755 205 205 5 62 25 12 68 9 19 5 0 0.0 550 2 . 414 96 20 18
70-74 624 118 116 5 35 9 6 42 4 13 2 2 1.7 506 . 2 324 156 15 9
75+ 987 88 88 4 21 5 2 38 3 10 5 0 0.0 899 2 . 321 526 25 25
Vava'u 8,525 4,939 4,908 84 752 715 964 1850 244 241 58 31 0.6 3,586 1,145 54 1,801 327 187 72
15-19 1,464 195 188 1 28 8 30 72 16 25 8 7 3.6 1,269 1,034 12 180 . 38 5
20-24 923 492 480 3 65 72 109 140 31 48 12 12 2.4 431 92 33 272 . 28 6
25-29 728 508 508 8 58 90 135 160 26 25 6 0 0.0 220 7 3 188 . 18 4
30-34 763 557 553 8 78 110 120 192 12 26 7 4 0.7 206 2 2 193 . 8 1
35-39 685 520 517 10 96 77 118 179 19 18 0 3 0.6 165 2 . 150 1 5 7
40-44 741 597 597 8 91 92 132 225 28 17 4 0 0.0 144 2 . 134 1 5 2
45-49 750 598 595 11 99 91 114 233 25 18 4 3 0.5 152 2 . 128 . 13 9
50-54 606 475 475 12 69 83 89 179 15 24 4 0 0.0 131 . 2 114 4 8 3
55-60 460 339 338 10 44 59 49 138 22 12 4 1 0.3 121 1 . 93 15 9 3
60-64 391 244 243 4 43 17 30 116 20 9 4 1 0.4 147 . . 101 31 9 6
65-69 351 217 217 4 41 7 24 115 14 9 3 0 0.0 134 1 1 87 26 17 2
70-74 245 107 107 1 25 6 6 57 7 4 1 0 0.0 138 1 1 65 52 9 10
75+ 418 90 90 4 15 3 8 44 9 6 1 0 0.0 328 1 . 96 197 20 14
Male 4,118 2,842 2,829 61 417 397 658 987 210 56 43 13 0.5 1,276 530 12 446 150 98 40
15-19 742 152 149 1 24 5 24 60 16 12 7 3 2.0 590 481 4 78 . 26 1
20-24 435 288 283 2 44 33 60 96 28 13 7 5 1.7 147 40 7 80 . 17 3
25-29 315 259 259 2 33 37 71 88 20 5 3 0 0.0 56 3 1 39 . 9 4
30-34 340 303 302 7 45 58 71 98 11 8 4 1 0.3 37 1 . 30 . 5 1
35-39 337 297 296 10 47 41 77 104 17 0 0 1 0.3 40 2 . 30 . 1 7
40-44 356 324 324 5 42 50 98 103 22 2 2 0 0.0 32 . . 28 . 2 2
45-49 383 345 344 8 55 54 87 111 20 5 4 1 0.3 38 1 . 23 . 7 7
50-54 318 283 283 9 31 54 74 90 14 7 4 0 0.0 35 . . 28 1 4 2
55-60 227 195 194 7 26 39 41 60 15 2 4 1 0.5 32 1 . 17 9 3 2
60-64 181 141 140 3 21 13 23 57 19 0 4 1 0.7 40 . . 15 18 5 2
65-69 177 132 132 4 28 6 20 59 12 0 3 0 0.0 45 . . 25 10 8 2
70-74 123 66 66 1 16 4 6 30 7 1 1 0 0.0 57 1 . 21 29 4 2
75+ 184 57 57 2 5 3 6 31 9 1 0 0 0.0 127 . . 32 83 7 5
Female 4,407 2,097 2,079 23 335 318 306 863 34 185 15 18 0.9 2,310 615 42 1,355 177 89 32
15-19 722 43 39 0 4 3 6 12 0 13 1 4 9.3 679 553 8 102 . 12 4
20-24 488 204 197 1 21 39 49 44 3 35 5 7 3.4 284 52 26 192 . 11 3
25-29 413 249 249 6 25 53 64 72 6 20 3 0 0.0 164 4 2 149 . 9 .
30-34 423 254 251 1 33 52 49 94 1 18 3 3 1.2 169 1 2 163 . 3 .
35-39 348 223 221 0 49 36 41 75 2 18 0 2 0.9 125 . . 120 1 4 .
40-44 385 273 273 3 49 42 34 122 6 15 2 0 0.0 112 2 . 106 1 3 .
45-49 367 253 251 3 44 37 27 122 5 13 0 2 0.8 114 1 . 105 . 6 2
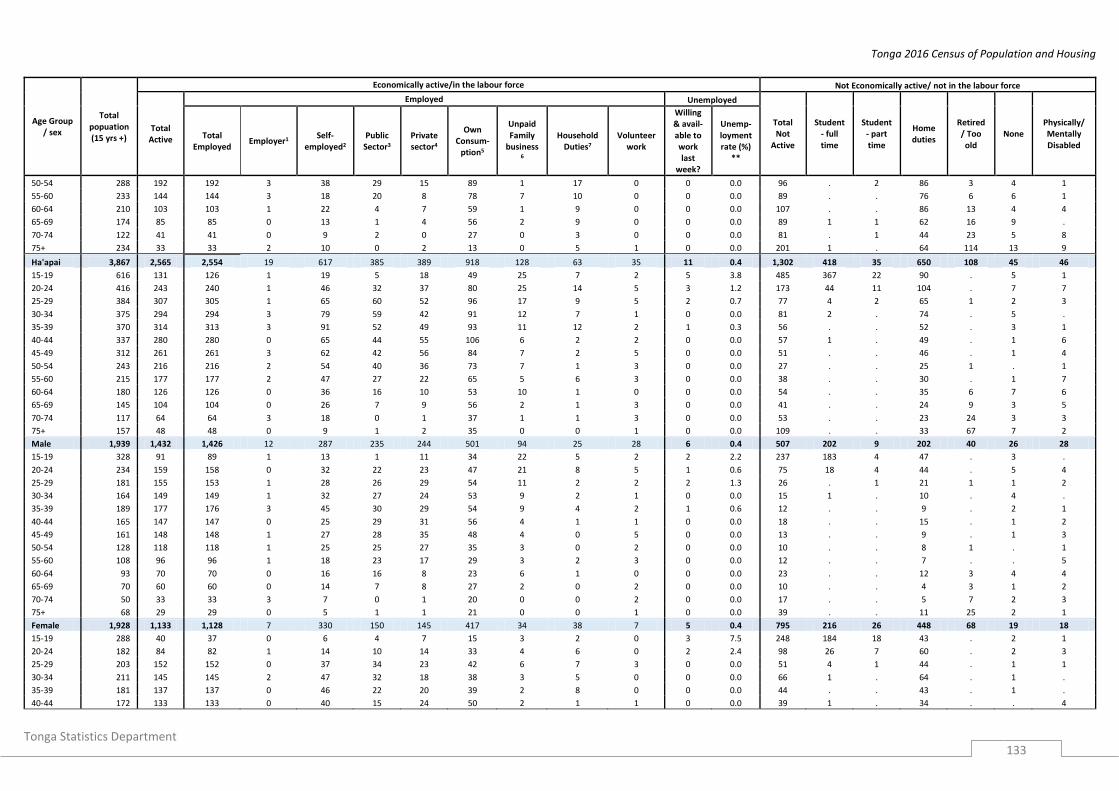
Tonga 2016 Census of Population and Housing
Tonga Statistics Department
133
Age Group / sex
Total popuation (15 yrs +)
Economically active/in the labour force Not Economically active/ not in the labour force
Total Active
Employed Unemployed
Total Not
Active
Student - full time
Student - part time
Home duties
Retired / Too old
None Physically/Mentally Disabled
Total Employed
Employer1 Self-
employed2 Public Sector3
Private sector4
Own Consum-
ption5
Unpaid Family
business6
Household Duties7
Volunteer work
Willing & avail-able to work last
week?
Unemp-loyment rate (%)
**
50-54 288 192 192 3 38 29 15 89 1 17 0 0 0.0 96 . 2 86 3 4 1
55-60 233 144 144 3 18 20 8 78 7 10 0 0 0.0 89 . . 76 6 6 1
60-64 210 103 103 1 22 4 7 59 1 9 0 0 0.0 107 . . 86 13 4 4
65-69 174 85 85 0 13 1 4 56 2 9 0 0 0.0 89 1 1 62 16 9 .
70-74 122 41 41 0 9 2 0 27 0 3 0 0 0.0 81 . 1 44 23 5 8
75+ 234 33 33 2 10 0 2 13 0 5 1 0 0.0 201 1 . 64 114 13 9
Ha'apai 3,867 2,565 2,554 19 617 385 389 918 128 63 35 11 0.4 1,302 418 35 650 108 45 46
15-19 616 131 126 1 19 5 18 49 25 7 2 5 3.8 485 367 22 90 . 5 1
20-24 416 243 240 1 46 32 37 80 25 14 5 3 1.2 173 44 11 104 . 7 7
25-29 384 307 305 1 65 60 52 96 17 9 5 2 0.7 77 4 2 65 1 2 3
30-34 375 294 294 3 79 59 42 91 12 7 1 0 0.0 81 2 . 74 . 5 .
35-39 370 314 313 3 91 52 49 93 11 12 2 1 0.3 56 . . 52 . 3 1
40-44 337 280 280 0 65 44 55 106 6 2 2 0 0.0 57 1 . 49 . 1 6
45-49 312 261 261 3 62 42 56 84 7 2 5 0 0.0 51 . . 46 . 1 4
50-54 243 216 216 2 54 40 36 73 7 1 3 0 0.0 27 . . 25 1 . 1
55-60 215 177 177 2 47 27 22 65 5 6 3 0 0.0 38 . . 30 . 1 7
60-64 180 126 126 0 36 16 10 53 10 1 0 0 0.0 54 . . 35 6 7 6
65-69 145 104 104 0 26 7 9 56 2 1 3 0 0.0 41 . . 24 9 3 5
70-74 117 64 64 3 18 0 1 37 1 1 3 0 0.0 53 . . 23 24 3 3
75+ 157 48 48 0 9 1 2 35 0 0 1 0 0.0 109 . . 33 67 7 2
Male 1,939 1,432 1,426 12 287 235 244 501 94 25 28 6 0.4 507 202 9 202 40 26 28
15-19 328 91 89 1 13 1 11 34 22 5 2 2 2.2 237 183 4 47 . 3 .
20-24 234 159 158 0 32 22 23 47 21 8 5 1 0.6 75 18 4 44 . 5 4
25-29 181 155 153 1 28 26 29 54 11 2 2 2 1.3 26 . 1 21 1 1 2
30-34 164 149 149 1 32 27 24 53 9 2 1 0 0.0 15 1 . 10 . 4 .
35-39 189 177 176 3 45 30 29 54 9 4 2 1 0.6 12 . . 9 . 2 1
40-44 165 147 147 0 25 29 31 56 4 1 1 0 0.0 18 . . 15 . 1 2
45-49 161 148 148 1 27 28 35 48 4 0 5 0 0.0 13 . . 9 . 1 3
50-54 128 118 118 1 25 25 27 35 3 0 2 0 0.0 10 . . 8 1 . 1
55-60 108 96 96 1 18 23 17 29 3 2 3 0 0.0 12 . . 7 . . 5
60-64 93 70 70 0 16 16 8 23 6 1 0 0 0.0 23 . . 12 3 4 4
65-69 70 60 60 0 14 7 8 27 2 0 2 0 0.0 10 . . 4 3 1 2
70-74 50 33 33 3 7 0 1 20 0 0 2 0 0.0 17 . . 5 7 2 3
75+ 68 29 29 0 5 1 1 21 0 0 1 0 0.0 39 . . 11 25 2 1
Female 1,928 1,133 1,128 7 330 150 145 417 34 38 7 5 0.4 795 216 26 448 68 19 18
15-19 288 40 37 0 6 4 7 15 3 2 0 3 7.5 248 184 18 43 . 2 1
20-24 182 84 82 1 14 10 14 33 4 6 0 2 2.4 98 26 7 60 . 2 3
25-29 203 152 152 0 37 34 23 42 6 7 3 0 0.0 51 4 1 44 . 1 1
30-34 211 145 145 2 47 32 18 38 3 5 0 0 0.0 66 1 . 64 . 1 .
35-39 181 137 137 0 46 22 20 39 2 8 0 0 0.0 44 . . 43 . 1 .
40-44 172 133 133 0 40 15 24 50 2 1 1 0 0.0 39 1 . 34 . . 4

Tonga 2016 Census of Population and Housing
Tonga Statistics Department
134
Age Group / sex
Total popuation (15 yrs +)
Economically active/in the labour force Not Economically active/ not in the labour force
Total Active
Employed Unemployed
Total Not
Active
Student - full time
Student - part time
Home duties
Retired / Too old
None Physically/Mentally Disabled
Total Employed
Employer1 Self-
employed2 Public Sector3
Private sector4
Own Consum-
ption5
Unpaid Family
business6
Household Duties7
Volunteer work
Willing & avail-able to work last
week?
Unemp-loyment rate (%)
**
45-49 151 113 113 2 35 14 21 36 3 2 0 0 0.0 38 . . 37 . . 1
50-54 115 98 98 1 29 15 9 38 4 1 1 0 0.0 17 . . 17 . . .
55-60 107 81 81 1 29 4 5 36 2 4 0 0 0.0 26 . . 23 . 1 2
60-64 87 56 56 0 20 0 2 30 4 0 0 0 0.0 31 . . 23 3 3 2
65-69 75 44 44 0 12 0 1 29 0 1 1 0 0.0 31 . . 20 6 2 3
70-74 67 31 31 0 11 0 0 17 1 1 1 0 0.0 36 . . 18 17 1 .
75+ 89 19 19 0 4 0 1 14 0 0 0 0 0.0 70 . . 22 42 5 1
Eua 3,020 1,879 1,877 15 381 241 296 717 194 18 15 2 0.1 1,141 442 17 564 73 17 28
15-19 521 62 62 0 6 1 11 27 16 1 0 0 0.0 459 401 11 40 . 4 3
20-24 323 182 181 0 16 23 37 59 36 4 6 1 0.5 141 37 5 96 . 3 .
25-29 286 200 200 3 30 41 39 61 26 0 0 0 0.0 86 4 . 80 . 1 1
30-34 303 228 227 1 42 46 39 70 22 5 2 1 0.4 75 . 1 73 . . 1
35-39 254 202 202 2 45 30 38 69 15 2 1 0 0.0 52 . . 46 . 4 2
40-44 245 201 201 1 50 22 30 77 17 2 2 0 0.0 44 . . 43 . . 1
45-49 272 228 228 1 42 35 39 88 20 1 2 0 0.0 44 . . 41 . . 3
50-54 211 170 170 1 40 20 33 60 15 1 0 0 0.0 41 . . 36 . 1 4
55-60 165 133 133 2 32 12 12 64 10 1 0 0 0.0 32 . . 31 . . 1
60-64 141 118 118 0 35 7 11 55 7 1 2 0 0.0 23 . . 16 3 1 3
65-69 98 68 68 1 25 4 5 30 3 0 0 0 0.0 30 . . 24 2 2 2
70-74 74 46 46 2 9 0 2 31 2 0 0 0 0.0 28 . . 13 10 . 5
75+ 127 41 41 1 9 0 0 26 5 0 0 0 0.0 86 . . 25 58 1 2
Male 1,510 1,158 1,157 12 196 151 225 419 138 8 8 1 0.1 352 204 9 80 30 14 15
15-19 264 56 56 0 6 1 11 23 14 1 0 0 0.0 208 178 8 16 . 4 2
20-24 181 136 136 0 7 13 23 54 34 4 1 0 0.0 45 24 . 19 . 2 .
25-29 127 111 111 2 11 23 24 31 20 0 0 0 0.0 16 2 . 12 . 1 1
30-34 146 138 137 1 14 30 31 46 12 1 2 1 0.7 8 . 1 7 . . .
35-39 116 107 107 1 18 14 30 34 9 1 0 0 0.0 9 . . 5 . 4 .
40-44 132 126 126 1 31 17 26 38 11 1 1 0 0.0 6 . . 5 . . 1
45-49 140 137 137 0 17 26 30 49 13 0 2 0 0.0 3 . . 2 . . 1
50-54 103 98 98 1 21 11 25 32 8 0 0 0 0.0 5 . . 2 . 1 2
55-60 76 73 73 2 18 6 8 32 7 0 0 0 0.0 3 . . 2 . . 1
60-64 77 73 73 0 22 6 10 29 4 0 2 0 0.0 4 . . 1 1 1 1
65-69 49 42 42 1 15 4 5 16 1 0 0 0 0.0 7 . . 3 2 1 1
70-74 37 28 28 2 7 0 2 16 1 0 0 0 0.0 9 . . . 5 . 4
75+ 62 33 33 1 9 0 0 19 4 0 0 0 0.0 29 . . 6 22 . 1
Female 1,510 721 720 3 185 90 71 298 56 10 7 1 0.1 789 238 8 484 43 3 13
15-19 257 6 6 0 0 0 0 4 2 0 0 0 0.0 251 223 3 24 . . 1
20-24 142 46 45 0 9 10 14 5 2 0 5 1 2.2 96 13 5 77 . 1 .
25-29 159 89 89 1 19 18 15 30 6 0 0 0 0.0 70 2 . 68 . . .
30-34 157 90 90 0 28 16 8 24 10 4 0 0 0.0 67 . . 66 . . 1
35-39 138 95 95 1 27 16 8 35 6 1 1 0 0.0 43 . . 41 . . 2

Tonga 2016 Census of Population and Housing
Tonga Statistics Department
135
Age Group / sex
Total popuation (15 yrs +)
Economically active/in the labour force Not Economically active/ not in the labour force
Total Active
Employed Unemployed
Total Not
Active
Student - full time
Student - part time
Home duties
Retired / Too old
None Physically/Mentally Disabled
Total Employed
Employer1 Self-
employed2 Public Sector3
Private sector4
Own Consum-
ption5
Unpaid Family
business6
Household Duties7
Volunteer work
Willing & avail-able to work last
week?
Unemp-loyment rate (%)
**
40-44 113 75 75 0 19 5 4 39 6 1 1 0 0.0 38 . . 38 . . .
45-49 132 91 91 1 25 9 9 39 7 1 0 0 0.0 41 . . 39 . . 2
50-54 108 72 72 0 19 9 8 28 7 1 0 0 0.0 36 . . 34 . . 2
55-60 89 60 60 0 14 6 4 32 3 1 0 0 0.0 29 . . 29 . . .
60-64 64 45 45 0 13 1 1 26 3 1 0 0 0.0 19 . . 15 2 . 2
65-69 49 26 26 0 10 0 0 14 2 0 0 0 0.0 23 . . 21 . 1 1
70-74 37 18 18 0 2 0 0 15 1 0 0 0 0.0 19 . . 13 5 . 1
75+ 65 8 8 0 0 0 0 7 1 0 0 0 0.0 57 . . 19 36 1 1
Ongo Niua 804 531 530 2 199 137 8 107 55 17 5 1 0.2 273 99 2 132 26 3 11
15-19 125 16 15 0 2 1 0 2 9 1 0 1 6.3 109 90 1 15 . 1 2
20-24 74 45 45 0 7 9 0 4 19 6 0 0 0.0 29 7 1 21 . . .
25-29 73 51 51 0 13 18 1 9 7 3 0 0 0.0 22 1 . 19 . 1 1
30-34 59 51 51 0 14 23 1 8 4 1 0 0 0.0 8 . . 8 . . .
35-39 69 60 60 2 21 16 2 12 5 1 1 0 0.0 9 . . 8 . . 1
40-44 65 53 53 0 21 17 2 8 3 1 1 0 0.0 12 1 . 11 . . .
45-49 64 51 51 0 21 14 1 15 0 0 0 0 0.0 13 . . 10 . 1 2
50-54 68 56 56 0 26 18 1 6 2 1 2 0 0.0 12 . . 11 . . 1
55-60 64 59 59 0 22 19 0 14 1 2 1 0 0.0 5 . . 4 . . 1
60-64 44 39 39 0 26 1 0 9 2 1 0 0 0.0 5 . . 5 . . .
65-69 29 22 22 0 8 1 0 10 3 0 0 0 0.0 7 . . 2 4 . 1
70-74 30 17 17 0 10 0 0 7 0 0 0 0 0.0 13 . . 7 4 . 2
75+ 40 11 11 0 8 0 0 3 0 0 0 0 0.0 29 . . 11 18 . .
Male 425 296 295 1 52 108 8 81 32 10 3 1 0.3 129 51 2 52 15 2 7
15-19 72 9 8 0 1 1 0 2 4 0 0 1 11.1 63 49 1 11 . 1 1
20-24 45 33 33 0 0 8 0 3 16 6 0 0 0.0 12 1 1 10 . . .
25-29 32 25 25 0 3 9 1 7 4 1 0 0 0.0 7 1 . 6 . . .
30-34 29 27 27 0 1 16 1 7 1 1 0 0 0.0 2 . . 2 . . .
35-39 35 33 33 1 4 11 2 10 3 1 1 0 0.0 2 . . 1 . . 1
40-44 26 23 23 0 3 13 2 5 0 0 0 0 0.0 3 . . 3 . . .
45-49 35 28 28 0 7 12 1 8 0 0 0 0 0.0 7 . . 5 . 1 1
50-54 37 32 32 0 9 17 1 4 0 0 1 0 0.0 5 . . 4 . . 1
55-60 40 37 37 0 5 19 0 11 0 1 1 0 0.0 3 . . 2 . . 1
60-64 18 17 17 0 8 1 0 6 2 0 0 0 0.0 1 . . 1 . . .
65-69 21 17 17 0 4 1 0 10 2 0 0 0 0.0 4 . . 2 2 . .
70-74 16 9 9 0 3 0 0 6 0 0 0 0 0.0 7 . . 2 3 . 2
75+ 19 6 6 0 4 0 0 2 0 0 0 0 0.0 13 . . 3 10 . .
Female 379 235 235 1 147 29 0 26 23 7 2 0 0.0 144 48 . 80 11 1 4
15-19 53 7 7 0 1 0 0 0 5 1 0 0 0.0 46 41 . 4 . . 1
20-24 29 12 12 0 7 1 0 1 3 0 0 0 0.0 17 6 . 11 . . .
25-29 41 26 26 0 10 9 0 2 3 2 0 0 0.0 15 . . 13 . 1 1

Tonga 2016 Census of Population and Housing
Tonga Statistics Department
136
Age Group / sex
Total popuation (15 yrs +)
Economically active/in the labour force Not Economically active/ not in the labour force
Total Active
Employed Unemployed
Total Not
Active
Student - full time
Student - part time
Home duties
Retired / Too old
None Physically/Mentally Disabled
Total Employed
Employer1 Self-
employed2 Public Sector3
Private sector4
Own Consum-
ption5
Unpaid Family
business6
Household Duties7
Volunteer work
Willing & avail-able to work last
week?
Unemp-loyment rate (%)
**
30-34 30 24 24 0 13 7 0 1 3 0 0 0 0.0 6 . . 6 . . .
35-39 34 27 27 1 17 5 0 2 2 0 0 0 0.0 7 . . 7 . . .
40-44 39 30 30 0 18 4 0 3 3 1 1 0 0.0 9 1 . 8 . . .
45-49 29 23 23 0 14 2 0 7 0 0 0 0 0.0 6 . . 5 . . 1
50-54 31 24 24 0 17 1 0 2 2 1 1 0 0.0 7 . . 7 . . .
55-60 24 22 22 0 17 0 0 3 1 1 0 0 0.0 2 . . 2 . . .
60-64 26 22 22 0 18 0 0 3 0 1 0 0 0.0 4 . . 4 . . .
65-69 8 5 5 0 4 0 0 0 1 0 0 0 0.0 3 . . . 2 . 1
70-74 14 8 8 0 7 0 0 1 0 0 0 0 0.0 6 . . 5 1 . .
75+ 21 5 5 0 4 0 0 1 0 0 0 0 0.0 16 . . 8 8 . .
Urban 15,189 7,576 7,468 300 904 3251 2118 418 137 222 137 108 1.4 7,613 2,280 108 4,132 671 283 139
15-19 2,362 255 239 4 17 66 104 16 9 16 7 16 6.3 2,107 1,767 32 260 . 39 9
20-24 2,033 954 914 11 68 433 327 24 10 35 14 40 4.2 1,079 415 59 543 1 50 11
25-29 1,726 1,115 1,095 20 73 556 352 36 19 26 11 20 1.8 611 61 9 497 1 32 11
30-34 1,618 1,082 1,075 33 103 517 351 34 9 26 6 7 0.6 536 15 3 480 . 30 8
35-39 1,338 861 853 40 101 410 236 30 13 18 10 8 0.9 477 9 4 447 1 11 5
40-44 1,181 831 825 35 132 358 212 35 17 22 16 6 0.7 350 5 . 315 . 16 14
45-49 1,179 784 781 38 115 313 210 53 14 24 14 3 0.4 395 5 . 359 3 15 13
50-54 990 661 658 44 119 260 134 49 12 21 18 3 0.5 329 1 . 287 13 15 13
55-60 785 458 457 33 64 183 95 47 7 11 16 1 0.2 327 . . 285 16 17 9
60-64 617 287 286 20 53 93 54 44 7 9 9 1 0.3 330 . . 229 80 8 13
65-69 466 150 150 13 31 38 26 22 6 7 7 0 0.0 316 1 . 180 107 16 12
70-74 342 74 72 2 15 16 13 15 5 2 5 2 2.7 268 . 1 126 116 16 9
75+ 552 64 63 7 13 8 4 13 9 5 4 1 1.6 488 1 . 124 333 18 12
Male 7,354 4,477 4,416 183 531 1856 1303 272 109 79 99 61 1.4 2,877 1,162 43 1,089 318 175 90
15-19 1,240 172 162 3 13 44 70 13 6 6 7 10 5.8 1,068 904 10 120 . 29 5
20-24 1,004 544 523 8 44 235 184 21 8 19 11 21 3.9 460 202 25 185 1 37 10
25-29 859 645 631 12 44 302 221 21 15 9 6 14 2.2 214 37 4 143 . 23 7
30-34 776 603 600 19 51 279 210 22 6 11 4 3 0.5 173 8 2 142 . 19 2
35-39 618 503 501 24 61 235 145 17 12 2 7 2 0.4 115 5 2 101 . 6 1
40-44 561 467 463 24 71 189 130 18 13 8 11 4 0.9 94 2 . 73 . 10 9
45-49 570 473 472 23 67 196 127 33 10 5 11 1 0.2 97 2 . 74 2 9 10
50-54 497 410 407 27 76 160 89 31 6 6 14 3 0.7 87 1 . 60 9 7 10
55-60 356 287 286 15 36 120 61 30 7 5 12 1 0.3 69 . . 49 8 6 6
60-64 293 178 178 14 32 53 35 28 7 4 7 0 0.0 115 . . 49 52 4 10
65-69 208 102 102 9 20 25 20 16 6 2 4 0 0.0 106 . . 35 55 9 7
70-74 152 50 49 1 7 13 9 11 5 0 4 1 2.0 102 . . 32 58 6 6
75+ 220 43 42 4 9 5 2 11 8 2 1 1 2.3 177 1 . 26 133 10 7
Female 7,835 3,099 3,052 117 373 1395 815 146 28 143 38 47 1.5 4,736 1,118 65 3,043 353 108 49
15-19 1,122 83 77 1 4 22 34 3 3 10 0 6 7.2 1,039 863 22 140 . 10 4
20-24 1,029 410 391 3 24 198 143 3 2 16 3 19 4.6 619 213 34 358 . 13 1

Tonga 2016 Census of Population and Housing
Tonga Statistics Department
137
Age Group / sex
Total popuation (15 yrs +)
Economically active/in the labour force Not Economically active/ not in the labour force
Total Active
Employed Unemployed
Total Not
Active
Student - full time
Student - part time
Home duties
Retired / Too old
None Physically/Mentally Disabled
Total Employed
Employer1 Self-
employed2 Public Sector3
Private sector4
Own Consum-
ption5
Unpaid Family
business6
Household Duties7
Volunteer work
Willing & avail-able to work last
week?
Unemp-loyment rate (%)
**
25-29 867 470 464 8 29 254 131 15 4 17 5 6 1.3 397 24 5 354 1 9 4
30-34 842 479 475 14 52 238 141 12 3 15 2 4 0.8 363 7 1 338 . 11 6
35-39 720 358 352 16 40 175 91 13 1 16 3 6 1.7 362 4 2 346 1 5 4
40-44 620 364 362 11 61 169 82 17 4 14 5 2 0.5 256 3 . 242 . 6 5
45-49 609 311 309 15 48 117 83 20 4 19 3 2 0.6 298 3 . 285 1 6 3
50-54 493 251 251 17 43 100 45 18 6 15 4 0 0.0 242 . . 227 4 8 3
55-60 429 171 171 18 28 63 34 17 0 6 4 0 0.0 258 . . 236 8 11 3
60-64 324 109 108 6 21 40 19 16 0 5 2 1 0.9 215 . . 180 28 4 3
65-69 258 48 48 4 11 13 6 6 0 5 3 0 0.0 210 1 . 145 52 7 5
70-74 190 24 23 1 8 3 4 4 0 2 1 1 4.2 166 . 1 94 58 10 3
75+ 332 21 21 3 4 3 2 2 1 3 3 0 0.0 311 . . 98 200 8 5
Rural 48,563 26,745 26,505 410 5358 6045 4937 7052 1424 889 371 240 0.9 21,818 6,710 352 11,845 1,598 784 529
15-19 8,131 1,167 1,124 7 149 142 248 328 137 85 28 43 3.7 6,964 5,560 120 1,110 5 132 37
20-24 6,169 3,137 3,067 21 395 741 766 628 259 171 78 70 2.2 3,032 885 168 1,798 2 146 33
25-29 4,859 3,154 3,107 30 466 945 715 661 150 106 36 47 1.5 1,705 123 29 1,432 4 86 31
30-34 4,872 3,344 3,310 28 598 999 705 717 130 105 24 34 1.0 1,528 48 19 1,352 2 72 35
35-39 4,267 3,043 3,029 74 618 792 629 699 123 73 16 14 0.5 1,224 30 7 1,108 1 38 40
40-44 3,976 2,963 2,949 49 650 677 555 782 136 70 28 14 0.5 1,013 22 1 921 1 34 34
45-49 3,953 2,991 2,981 61 693 687 486 817 135 68 34 10 0.3 962 15 3 840 6 40 58
50-54 3,129 2,321 2,319 48 577 523 363 610 103 61 35 2 0.1 808 12 2 706 16 37 35
55-60 2,446 1,650 1,648 31 396 323 223 523 78 42 33 2 0.1 796 3 . 660 46 31 56
60-64 2,063 1,234 1,231 25 340 124 128 466 78 39 28 3 0.2 829 4 . 611 132 37 45
65-69 1,555 855 855 14 233 56 80 377 47 30 18 0 0.0 700 2 1 453 158 49 37
70-74 1,253 497 496 13 143 20 24 241 25 21 8 1 0.2 756 2 2 392 306 21 33
75+ 1,890 389 389 9 100 16 15 203 23 18 5 0 0.0 1,501 4 . 462 919 61 55
Male 23,643 16,067 15,974 280 3008 3543 3304 4221 1074 273 255 93 0.6 7,576 3,255 123 2,614 757 527 300
15-19 4,202 876 856 7 115 90 190 268 117 46 23 20 2.3 3,326 2,669 53 479 2 104 19
20-24 3,081 1,965 1,939 14 263 412 454 455 215 74 45 26 1.3 1,116 430 49 513 . 106 18
25-29 2,267 1,779 1,764 13 251 507 430 398 114 34 18 15 0.8 488 72 12 320 2 61 21
30-34 2,201 1,870 1,857 16 296 530 447 431 93 24 18 13 0.7 331 26 3 223 . 55 24
35-39 2,055 1,797 1,793 57 327 451 422 426 86 13 9 4 0.2 258 20 3 180 . 26 29
40-44 1,894 1,684 1,675 32 341 398 380 404 93 13 13 9 0.5 210 12 1 153 . 26 18
45-49 1,989 1,794 1,792 40 382 439 344 451 93 16 27 2 0.1 195 8 2 124 1 27 33
50-54 1,606 1,426 1,425 33 326 332 266 351 74 15 26 1 0.1 180 11 . 118 8 23 20
55-60 1,198 1,013 1,012 23 219 220 171 285 56 10 28 1 0.1 185 2 . 108 27 17 31
60-64 993 763 761 17 193 95 97 261 61 10 25 2 0.3 230 2 . 107 72 23 26
65-69 752 538 538 13 143 43 69 216 33 6 15 0 0.0 214 . . 81 90 24 19
70-74 579 305 305 9 87 12 22 143 19 6 6 0 0.0 274 2 . 82 162 10 18
75+ 826 257 257 6 65 14 12 132 20 6 2 0 0.0 569 1 . 126 393 25 24
Female 24,920 10,678 10,531 130 2350 2502 1633 2831 350 616 116 147 1.4 14,242 3,455 229 9,231 841 257 229
15-19 3,929 291 268 0 34 52 58 60 20 39 5 23 7.9 3,638 2,891 67 631 3 28 18

Tonga 2016 Census of Population and Housing
Tonga Statistics Department
138
Age Group / sex
Total popuation (15 yrs +)
Economically active/in the labour force Not Economically active/ not in the labour force
Total Active
Employed Unemployed
Total Not
Active
Student - full time
Student - part time
Home duties
Retired / Too old
None Physically/Mentally Disabled
Total Employed
Employer1 Self-
employed2 Public Sector3
Private sector4
Own Consum-
ption5
Unpaid Family
business6
Household Duties7
Volunteer work
Willing & avail-able to work last
week?
Unemp-loyment rate (%)
**
20-24 3,088 1,172 1,128 7 132 329 312 173 44 97 33 44 3.8 1,916 455 119 1,285 2 40 15
25-29 2,592 1,375 1,343 17 215 438 285 263 36 72 18 32 2.3 1,217 51 17 1,112 2 25 10
30-34 2,671 1,474 1,453 12 302 469 258 286 37 81 6 21 1.4 1,197 22 16 1,129 2 17 11
35-39 2,212 1,246 1,236 17 291 341 207 273 37 60 7 10 0.8 966 10 4 928 1 12 11
40-44 2,082 1,279 1,274 17 309 279 175 378 43 57 15 5 0.4 803 10 . 768 1 8 16
45-49 1,964 1,197 1,189 21 311 248 142 366 42 52 7 8 0.7 767 7 1 716 5 13 25
50-54 1,523 895 894 15 251 191 97 259 29 46 9 1 0.1 628 1 2 588 8 14 15
55-60 1,248 637 636 8 177 103 52 238 22 32 5 1 0.2 611 1 . 552 19 14 25
60-64 1,070 471 470 8 147 29 31 205 17 29 3 1 0.2 599 2 . 504 60 14 19
65-69 803 317 317 1 90 13 11 161 14 24 3 0 0.0 486 2 1 372 68 25 18
70-74 674 192 191 4 56 8 2 98 6 15 2 1 0.5 482 . 2 310 144 11 15
75+ 1,064 132 132 3 35 2 3 71 3 12 3 0 0.0 932 3 . 336 526 36 31
Greater Nuku'alofa 22,830 11,520 11,362 383 1385 4698 3173 910 258 365 198 158 1.4 11,310 3,485 167 6,060 946 410 242
15-19 3,596 400 382 5 31 94 171 36 12 23 10 18 4.5 3,196 2,649 50 418 2 63 14
20-24 3,116 1,484 1,432 17 112 623 500 72 31 58 19 52 3.5 1,632 632 83 824 1 75 17
25-29 2,570 1,643 1,613 28 114 800 494 88 30 38 19 30 1.8 927 99 15 749 1 46 17
30-34 2,457 1,650 1,633 39 154 764 532 78 17 41 9 17 1.0 807 29 8 708 . 38 24
35-39 2,054 1,337 1,325 58 151 600 377 83 22 25 13 12 0.9 717 27 8 650 1 16 15
40-44 1,787 1,277 1,263 45 199 523 320 93 27 35 24 14 1.1 510 17 1 449 . 20 23
45-49 1,742 1,184 1,180 49 178 473 304 101 24 35 16 4 0.3 558 16 1 492 3 20 26
50-54 1,442 968 965 55 179 372 198 81 23 32 25 3 0.3 474 11 . 404 18 24 17
55-60 1,152 671 669 37 102 240 141 92 15 22 21 2 0.3 481 2 . 409 26 20 24
60-64 918 442 439 22 77 125 73 80 21 22 19 3 0.7 476 . . 337 106 16 17
65-69 679 243 241 14 43 54 40 48 13 16 13 2 0.8 438 2 . 252 141 24 19
70-74 517 126 126 4 26 22 15 34 12 8 5 0 0.0 389 . 1 187 169 20 12
75+ 800 95 94 10 19 8 8 24 11 10 5 1 1.1 705 1 . 181 478 28 17
Male 11,045 6,867 6,782 242 816 2698 2019 570 187 124 132 85 1.2 4,178 1,765 65 1,489 453 251 155
15-19 1,864 276 266 4 23 62 121 31 8 9 8 10 3.6 1,588 1,327 20 185 1 46 9
20-24 1,557 884 856 12 76 352 293 56 23 31 13 28 3.2 673 312 33 257 1 56 14
25-29 1,257 948 931 18 70 431 309 56 22 15 9 17 1.8 309 61 6 200 . 31 11
30-34 1,175 939 930 22 72 418 336 52 12 13 6 9 1.0 236 15 2 184 . 21 14
35-39 967 802 799 39 96 336 251 52 17 2 8 3 0.4 165 19 3 126 . 10 7
40-44 860 718 708 30 104 283 200 49 21 9 14 10 1.4 142 12 1 100 . 13 16
45-49 830 706 705 32 105 287 189 57 16 7 12 1 0.1 124 7 . 87 2 12 16
50-54 714 593 590 35 108 238 128 47 9 8 17 3 0.5 121 10 . 77 11 12 11
55-60 526 417 416 18 57 158 95 53 12 8 16 1 0.2 109 1 . 71 15 7 15
60-64 433 274 273 14 47 73 48 47 18 11 15 1 0.4 159 . . 71 67 7 14
65-69 309 163 163 10 29 39 32 29 10 5 9 0 0.0 146 . . 47 78 11 10
70-74 232 85 84 2 15 16 11 25 9 2 4 1 1.2 147 . . 47 83 9 8
75+ 321 62 61 6 14 5 6 16 10 4 1 1 1.6 259 1 . 37 195 16 10
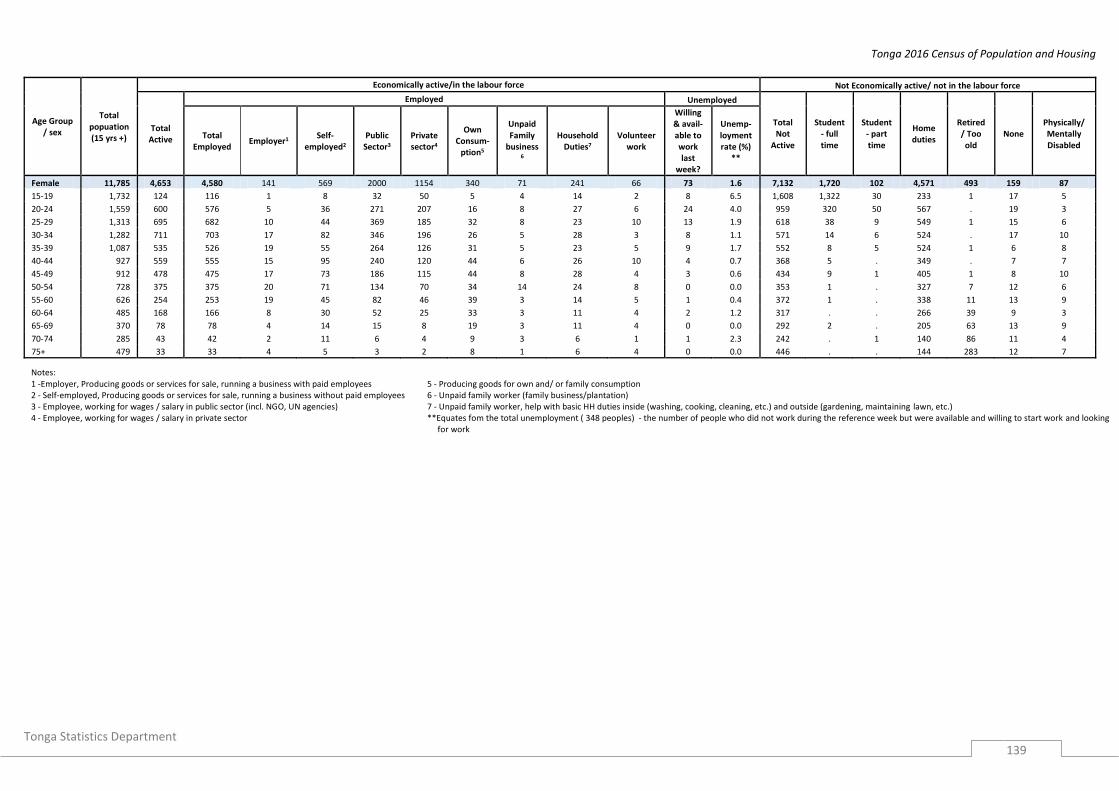
Tonga 2016 Census of Population and Housing
Tonga Statistics Department
139
Age Group / sex
Total popuation (15 yrs +)
Economically active/in the labour force Not Economically active/ not in the labour force
Total Active
Employed Unemployed
Total Not
Active
Student - full time
Student - part time
Home duties
Retired / Too old
None Physically/Mentally Disabled
Total Employed
Employer1 Self-
employed2 Public Sector3
Private sector4
Own Consum-
ption5
Unpaid Family
business6
Household Duties7
Volunteer work
Willing & avail-able to work last
week?
Unemp-loyment rate (%)
**
Female 11,785 4,653 4,580 141 569 2000 1154 340 71 241 66 73 1.6 7,132 1,720 102 4,571 493 159 87
15-19 1,732 124 116 1 8 32 50 5 4 14 2 8 6.5 1,608 1,322 30 233 1 17 5
20-24 1,559 600 576 5 36 271 207 16 8 27 6 24 4.0 959 320 50 567 . 19 3
25-29 1,313 695 682 10 44 369 185 32 8 23 10 13 1.9 618 38 9 549 1 15 6
30-34 1,282 711 703 17 82 346 196 26 5 28 3 8 1.1 571 14 6 524 . 17 10
35-39 1,087 535 526 19 55 264 126 31 5 23 5 9 1.7 552 8 5 524 1 6 8
40-44 927 559 555 15 95 240 120 44 6 26 10 4 0.7 368 5 . 349 . 7 7
45-49 912 478 475 17 73 186 115 44 8 28 4 3 0.6 434 9 1 405 1 8 10
50-54 728 375 375 20 71 134 70 34 14 24 8 0 0.0 353 1 . 327 7 12 6
55-60 626 254 253 19 45 82 46 39 3 14 5 1 0.4 372 1 . 338 11 13 9
60-64 485 168 166 8 30 52 25 33 3 11 4 2 1.2 317 . . 266 39 9 3
65-69 370 78 78 4 14 15 8 19 3 11 4 0 0.0 292 2 . 205 63 13 9
70-74 285 43 42 2 11 6 4 9 3 6 1 1 2.3 242 . 1 140 86 11 4
75+ 479 33 33 4 5 3 2 8 1 6 4 0 0.0 446 . . 144 283 12 7
Notes: 1 -Employer, Producing goods or services for sale, running a business with paid employees 5 - Producing goods for own and/ or family consumption 2 - Self-employed, Producing goods or services for sale, running a business without paid employees 6 - Unpaid family worker (family business/plantation) 3 - Employee, working for wages / salary in public sector (incl. NGO, UN agencies) 7 - Unpaid family worker, help with basic HH duties inside (washing, cooking, cleaning, etc.) and outside (gardening, maintaining lawn, etc.) 4 - Employee, working for wages / salary in private sector **Equates fom the total unemployment ( 348 peoples) - the number of people who did not work during the reference week but were available and willing to start work and looking
for work

Tonga 2016 Census of Population and Housing
Tonga Statistics Department
140
Table G 64: Voting status (21years+) by division and region
Total Tongatapu Vava'u Ha'apai 'Eua Ongo Niua Urban Rural Grt Nuku'alofa
Registered to vote 51,525 38,396 6,870 3,171 2,425 663 12,397 39,128 18,554
Yes 44,016 32,313 6,174 2,788 2,141 600 10,179 33,837 15,339
No 7,509 6,083 696 383 284 63 2,218 5,291 3,215
Reason for not registering to vote 7,509 6,083 696 383 284 63 2,218 5,291 3,215
Was away overseas 2,080 1,728 182 82 75 13 645 1,435 916
Sick 661 486 81 30 57 7 184 477 273
Not Interested 2,124 1,757 190 108 56 13 582 1,542 935
Don't know where to register 876 670 78 77 36 15 188 688 257
Other reasons 1,768 1,442 165 86 60 15 619 1,149 834 Note: Excludes Non- residents occupying institutions
Table G 65: Voting status (21 years +) by 5 year age groups
Total 21-24 25-29 30-34 35-39 40-44 45-49 50-54 55-59 60-64 65-69 70-74 75+
Registered to vote 51,525 6,468 6,585 6,490 5,605 5,157 5,132 4,119 3,231 2,680 2,021 1,595 2,442
Yes 44,016 3,375 5,417 5,784 5,126 4,719 4,763 3,814 2,979 2,469 1,880 1,487 2,203
No 7,509 3,093 1,168 706 479 438 369 305 252 211 141 108 239
Reason for not registering to vote 7,509 3,093 1,168 706 479 438 369 305 252 211 141 108 239
Was away overseas 2,080 619 315 231 152 146 134 106 105 77 70 49 76
Sick 661 242 88 52 45 35 39 27 24 18 14 18 59
Not Interested 2,124 1,104 403 182 113 102 56 51 31 32 18 14 18
where to register 876 549 160 63 29 18 19 3 8 8 3 4 12
Other reasons 1,768 579 202 178 140 137 121 118 84 76 36 23 74

Tonga 2016 Census of Population and Housing
Tonga Statistics Department
141
Table G 66: Population (10 years +) Accessing and Location of Internet by Island, District and Region
Division by District
INTERNET ACCESS LOCATION OF ACCESSING INTERNET
Total Yes No Total Home Internet cafe
Free wireless hotspots Workplace
At place of education Other
Tonga 75,625 23,247 52,378 23,247 15,959 668 985 3,390 878 1,367
Tongatapu 56,151 18,782 37,369 18,782 13,190 552 561 2,946 717 816
Kolofo'ou 13,661 5,557 8,104 5,557 4,021 139 192 991 135 79
Kolomotu'a 13,060 5,915 7,145 5,915 4,313 122 104 848 183 345
Vaini 9,740 3,305 6,435 3,305 2,382 123 75 499 188 38
Tatakamotonga 5,195 1,296 3,899 1,296 784 65 96 214 80 57
Lapaha 5,313 1,057 4,256 1,057 716 51 4 176 65 45
Nukunuku 5,970 1,137 4,833 1,137 595 40 77 171 50 204
Kolovai 3,212 515 2,697 515 379 12 13 47 16 48
Vava'u 10,277 3,142 7,135 3,142 1,858 105 338 283 79 479
Neiafu 4,009 1,385 2,624 1,385 771 40 189 190 35 160
Pangaimotu 921 264 657 264 79 7 4 12 2 160
Hahake 1,502 309 1,193 309 115 37 20 25 15 97
Leimatu'a 1,751 583 1,168 583 515 10 6 24 5 23
Hihifo 1,531 493 1,038 493 319 8 83 29 21 33
Motu 563 108 455 108 59 3 36 3 1 6
Ha'apai 4,563 938 3,625 938 704 6 13 105 62 48
Pangai Hp 1,752 539 1,213 539 373 2 10 90 51 13
Foa 996 104 892 104 76 3 0 13 2 10
Lulunga 632 85 547 85 70 0 2 0 0 13
Mu'omu'a 308 77 231 77 77 0 0 0 0 0
Ha'ano 357 88 269 88 68 1 1 1 6 11
Uiha 518 45 473 45 40 0 0 1 3 1
'Eua 3,671 382 3,289 382 207 5 73 54 20 23
'Eua Motu'a 2,052 149 1,903 149 52 3 53 33 6 2
'Eua Fo'ou 1,619 233 1,386 233 155 2 20 21 14 21
Ongo Niua 963 3 960 3 0 0 0 2 0 1
Niuatoputapu 571 1 570 1 0 0 0 0 0 1
Niuafo'ou 392 2 390 2 0 0 0 2 0 0
Urban 17,737 7,783 9,954 7,783 5,679 186 229 1,342 186 161
Rural 57,888 15,464 42,424 15,464 10,280 482 756 2,048 692 1,206
Greater Nukualofa 26,721 11,472 15,249 11,472 8,334 261 296 1,839 318 424

Tonga 2016 Census of Population and Housing
Tonga Statistics Department
142
Table G 67: Population (10 years +) Have a Mobile Phone and Use Mobile Data with Internet Provider and Purpose of using Mobile data by Island, District and Region
Division by District
MOBILE PHONE MOBILE DATA PURPOSE OF USING MOBILE DATA FOR INTERNET
Total Yes No Total No
Yes TCC Yes Yes both
Total Education Social media Entertainment
Work / Business Communication
Information gathering
Shopping / product information Other Digicel
(TCC / Digicel)
Tonga 75,625 45,836 29,789 45,836 11,829 18,841 12,158 3,008 34,007 1,201 20,678 537 1,496 9,469 366 14 246
Tongatapu 56,151 34,859 21,292 34,859 7,752 16,821 7,888 2,398 27,107 949 16,407 473 1,321 7,475 283 13 186
Kolofo'ou 13,661 8,914 4,747 8,914 1,720 4,603 1,866 725 7,194 286 4,174 201 528 1,876 83 5 41
Kolomotu'a 13,060 8,469 4,591 8,469 1,619 4,366 1,909 575 6,850 250 4,126 87 441 1,817 72 4 53
Vaini 9,740 5,894 3,846 5,894 1,370 2,770 1,350 404 4,524 162 2,831 99 207 1,123 97 0 5
Tatakamotonga 5,195 3,063 2,132 3,063 899 1,317 649 198 2,164 83 1,170 49 53 790 13 1 5
Lapaha 5,313 3,013 2,300 3,013 763 1,375 744 131 2,250 47 1,378 17 30 740 4 1 33
Nukunuku 5,970 3,604 2,366 3,604 900 1,543 938 223 2,704 72 1,742 12 43 811 6 1 17
Kolovai 3,212 1,902 1,310 1,902 481 847 432 142 1,421 49 986 8 19 318 8 1 32
Vava'u 10,277 5,867 4,410 5,867 2,078 618 2,919 252 3,789 157 2,129 46 123 1,214 74 0 46
Neiafu 4,009 2,366 1,643 2,366 651 429 1,101 185 1,715 81 764 13 79 702 71 0 5
Pangaimotu 921 478 443 478 228 20 220 10 250 6 145 0 3 92 1 0 3
Hahake 1,502 780 722 780 277 24 459 20 503 18 269 26 10 179 0 0 1
Leimatu'a 1,751 981 770 981 361 60 540 20 620 38 444 5 23 95 1 0 14
Hihifo 1,531 933 598 933 424 41 456 12 509 12 365 1 5 116 1 0 9
Motu 563 329 234 329 137 44 143 5 192 2 142 1 3 30 0 0 14
Ha'apai 4,563 2,701 1,862 2,701 1,004 727 842 128 1,697 67 1,077 14 42 478 7 0 12
Pangai Hp 1,752 1,025 727 1,025 303 225 403 94 722 48 349 12 37 258 6 0 12
Foa 996 634 362 634 217 119 275 23 417 8 274 0 1 133 1 0 0
Lulunga 632 375 257 375 161 212 1 1 214 6 149 2 1 56 0 0 0
Mu'omu'a 308 176 132 176 93 83 0 0 83 3 72 0 3 5 0 0 0
Ha'ano 357 198 159 198 72 23 100 3 126 2 102 0 0 22 0 0 0
Uiha 518 293 225 293 158 65 63 7 135 0 131 0 0 4 0 0 0
'Eua 3,671 1,973 1,698 1,973 576 658 509 230 1,397 28 1,057 3 9 295 2 1 2
'Eua Motu'a 2,052 1,104 948 1,104 351 369 296 88 753 22 620 3 6 97 2 1 2
'Eua Fo'ou 1,619 869 750 869 225 289 213 142 644 6 437 0 3 198 0 0 0
Ongo Niua 963 436 527 436 419 17 0 0 17 0 8 1 1 7 0 0 0
Niuatoputapu 571 293 278 293 288 5 0 0 5 0 0 0 1 4 0 0 0
Niuafo'ou 392 143 249 143 131 12 0 0 12 0 8 1 0 3 0 0 0
Urban 17,737 11,653 6,084 11,653 2,253 6,216 2,301 883 9,400 376 5,407 241 740 2,489 93 8 46
Rural 57,888 34,183 23,705 34,183 9,576 12,625 9,857 2,125 24,607 825 15,271 296 756 6,980 273 6 200
Greater Nukualofa 26,721 17,383 9,338 17,383 3,339 8,969 3,775 1,300 14,044 536 8,300 288 969 3,693 155 9 94

Tonga 2016 Census of Population and Housing
Tonga Statistics Department
143
Table G 68: Number of female ever given birth (15 years +) by 5-years age group and division
Division/ age group
Number of women given birth Division/ age group
Number of women given birth
Total Given birth Not given birth Total Given birth Not given birth
TONGA 32,755 19,362 13,393 Ha'apai 1,928 1,072 856
15-19 5,051 162 4,889 15-19 288 14 274
20-24 4,117 1,200 2,917 20-24 182 44 138
25-29 3,459 1,891 1,568 25-29 203 104 99
30-34 3,513 2,521 992 30-34 211 140 71
35-39 2,932 2,300 632 35-39 181 125 56
40-44 2,702 2,119 583 40-44 172 123 49
45-49 2,573 2,110 463 45-49 151 108 43
50-54 2,016 1,654 362 50-54 115 89 26
55-60 1,677 1,382 295 55-60 107 78 29
60-64 1,394 1,173 221 60-64 87 67 20
65-69 1,061 914 147 65-69 75 60 15
70-74 864 742 122 70-74 67 51 16
75+ 1,396 1,194 202 75+ 89 69 20
Tongatapu 24,531 14,385 10,146 'Eua 1,510 993 517
15-19 3,731 123 3,608 15-19 257 7 250
20-24 3,276 933 2,343 20-24 142 59 83
25-29 2,643 1,409 1,234 25-29 159 103 56
30-34 2,692 1,915 777 30-34 157 124 33
35-39 2,231 1,751 480 35-39 138 123 15
40-44 1,993 1,565 428 40-44 113 95 18
45-49 1,894 1,564 330 45-49 132 112 20
50-54 1,474 1,217 257 50-54 108 90 18
55-60 1,224 1,011 213 55-60 89 78 11
60-64 1,007 848 159 60-64 64 58 6
65-69 755 661 94 65-69 49 47 2
70-74 624 538 86 70-74 37 36 1
75+ 987 850 137 75+ 65 61 4
Vava'u 4,407 2,677 1,730 Ongo Niua 379 235 144
15-19 722 18 704 15-19 53 . 53
20-24 488 155 333 20-24 29 9 20
25-29 413 255 158 25-29 41 20 21
30-34 423 320 103 30-34 30 22 8
35-39 348 275 73 35-39 34 26 8
40-44 385 307 78 40-44 39 29 10
45-49 367 301 66 45-49 29 25 4
50-54 288 233 55 50-54 31 25 6
55-60 233 195 38 55-60 24 20 4
60-64 210 176 34 60-64 26 24 2
65-69 174 140 34 65-69 8 6 2
70-74 122 104 18 70-74 14 13 1
75+ 234 198 36 75+ 21 16 5

Tonga 2016 Census of Population and Housing
Tonga Statistics Department
144
Table G 69: Number of Children ever born were in household, elsewhere in Tonga or overseas, and number of children died to female population (15 years+) by division
Division/ age group
Number of Women
Number of Children Born Number of Children in Household Number of Children elsewhere in Tonga Number of Children Overseas Number of Children born Alive who
had died
TOTAL MALE FEMALE TOTAL MALE FEMALE TOTAL MALE FEMALE TOTAL MALE FEMALE TOTAL MALE FEMALE
TONGA 19,362 79,238 41,406 37,832 47,564 24,276 23,288 15,444 7,733 7,711 14,073 8,058 6,015 2,157 1,339 818 15-19 162 198 115 83 178 107 71 14 5 9 2 0 2 4 3 1 20-24 1,200 1,923 1,010 913 1,786 938 848 108 62 46 11 2 9 18 8 10 25-29 1,891 4,304 2,254 2,050 3,954 2,067 1,887 258 134 124 56 31 25 36 22 14 30-34 2,521 7,872 4,152 3,720 7,150 3,783 3,367 498 254 244 147 67 80 77 48 29 35-39 2,300 8,729 4,533 4,196 7,710 3,978 3,732 710 378 332 204 108 96 105 69 36 40-44 2,119 8,941 4,626 4,315 7,460 3,790 3,670 959 512 447 424 261 163 98 63 35 45-49 2,110 9,627 4,956 4,671 6,798 3,444 3,354 1,575 748 827 1,107 666 441 147 98 49 50-54 1,654 7,965 4,234 3,731 4,467 2,325 2,142 1,745 854 891 1,601 953 648 152 102 50 55-60 1,382 7,138 3,748 3,390 2,897 1,464 1,433 2,078 989 1,089 1,967 1,171 796 196 124 72 60-64 1,173 6,162 3,211 2,951 1,865 894 971 2,062 1,013 1,049 2,037 1,177 860 198 127 71 65-69 914 4,957 2,636 2,321 1,193 581 612 1,777 890 887 1,767 1,029 738 220 136 84 70-74 742 4,118 2,163 1,955 822 378 444 1,398 712 686 1,651 924 727 247 149 98 75+ 1,194 7,304 3,768 3,536 1,284 527 757 2,262 1,182 1,080 3,099 1,669 1,430 659 390 269 Tongatapu 14,385 57,710 30,076 27,634 35,906 18,281 17,625 9,418 4,716 4,702 10,901 6,155 4,746 1,498 937 561 15-19 123 149 86 63 136 81 55 10 4 6 2 0 2 1 1 0 20-24 933 1,513 803 710 1,408 748 660 83 49 34 8 2 6 14 4 10 25-29 1,409 3,162 1,652 1,510 2,925 1,523 1,402 173 89 84 40 23 17 24 17 7 30-34 1,915 5,931 3,133 2,798 5,399 2,850 2,549 357 187 170 124 63 61 51 33 18 35-39 1,751 6,634 3,473 3,161 5,914 3,073 2,841 478 264 214 167 87 80 75 49 26 40-44 1,565 6,448 3,273 3,175 5,517 2,769 2,748 557 275 282 311 189 122 63 40 23 45-49 1,564 7,068 3,641 3,427 5,136 2,592 2,544 954 463 491 873 516 357 105 70 35 50-54 1,217 5,747 3,061 2,686 3,379 1,764 1,615 1,014 486 528 1,252 738 514 102 73 29 55-60 1,011 5,202 2,691 2,511 2,204 1,108 1,096 1,266 575 691 1,578 911 667 154 97 57 60-64 848 4,351 2,257 2,094 1,438 689 749 1,205 592 613 1,566 884 682 142 92 50 65-69 661 3,507 1,855 1,652 917 432 485 1,071 543 528 1,366 784 582 153 96 57 70-74 538 2,895 1,518 1,377 615 284 331 853 444 409 1,279 707 572 161 96 65 75+ 850 5,103 2,633 2,470 918 368 550 1,397 745 652 2,335 1,251 1,084 453 269 184 Vava'u 2,677 11,431 6,005 5,426 6,237 3,185 3,052 3,090 1,558 1,532 1,789 1,060 729 315 202 113 15-19 18 24 16 8 22 15 7 2 1 1 0 0 0 0 0 0 20-24 155 235 118 117 216 106 110 14 9 5 2 0 2 3 3 0 25-29 255 596 333 263 542 307 235 41 21 20 8 4 4 5 1 4 30-34 320 1,002 535 467 915 497 418 58 25 33 14 3 11 15 10 5 35-39 275 1,079 547 532 945 468 477 100 56 44 17 12 5 17 11 6 40-44 307 1,362 722 640 1,068 543 525 206 120 86 72 48 24 16 11 5 45-49 301 1,378 699 679 932 459 473 295 149 146 134 78 56 17 13 4 50-54 233 1,121 603 518 551 289 262 367 181 186 177 116 61 26 17 9 55-60 195 1,014 543 471 370 185 185 409 207 202 216 140 76 19 11 8 60-64 176 926 479 447 232 107 125 424 199 225 246 157 89 24 16 8 65-69 140 800 441 359 137 74 63 380 194 186 241 147 94 42 26 16 70-74 104 625 329 296 104 53 51 301 149 152 183 104 79 37 23 14 75+ 198 1,269 640 629 203 82 121 493 247 246 479 251 228 94 60 34 Ha'apai 1,072 4,589 2,428 2,161 2,476 1,297 1,179 1,324 641 683 614 388 226 175 102 73 15-19 14 18 9 9 15 8 7 2 0 2 0 0 0 1 1 0

Tonga 2016 Census of Population and Housing
Tonga Statistics Department
145
Division/ age group
Number of Women
Number of Children Born Number of Children in Household Number of Children elsewhere in Tonga Number of Children Overseas Number of Children born Alive who
had died
TOTAL MALE FEMALE TOTAL MALE FEMALE TOTAL MALE FEMALE TOTAL MALE FEMALE TOTAL MALE FEMALE
20-24 44 65 29 36 57 26 31 7 3 4 1 0 1 0 0 0 25-29 104 252 137 115 226 122 104 19 10 9 2 2 0 5 3 2 30-34 140 445 228 217 397 206 191 41 20 21 4 0 4 3 2 1 35-39 125 464 242 222 378 205 173 68 26 42 8 4 4 10 7 3 40-44 123 545 304 241 405 219 186 110 67 43 15 8 7 15 10 5 45-49 108 507 266 241 321 174 147 135 57 78 43 30 13 8 5 3 50-54 89 456 239 217 232 111 121 149 80 69 65 44 21 10 4 6 55-60 78 427 247 180 145 80 65 186 97 89 85 62 23 11 8 3 60-64 67 401 212 189 101 54 47 188 82 106 91 64 27 21 12 9 65-69 60 312 154 158 74 36 38 157 68 89 65 40 25 16 10 6 70-74 51 287 151 136 51 21 30 107 53 54 100 59 41 29 18 11 75+ 69 410 210 200 74 35 39 155 78 77 135 75 60 46 22 24 'Eua 993 4,433 2,295 2,138 2,434 1,242 1,192 1,192 575 617 665 395 270 142 83 59 15-19 7 7 4 3 5 3 2 0 0 0 0 0 0 2 1 1 20-24 59 96 52 44 93 51 42 3 1 2 0 0 0 0 0 0 25-29 103 245 112 133 216 97 119 21 12 9 6 2 4 2 1 1 30-34 124 429 223 206 376 197 179 40 22 18 5 1 4 8 3 5 35-39 123 474 230 244 420 203 217 45 24 21 6 1 5 3 2 1 40-44 95 457 254 203 377 206 171 60 35 25 16 11 5 4 2 2 45-49 112 560 284 276 340 182 158 154 57 97 51 36 15 15 9 6 50-54 90 494 250 244 231 121 110 154 74 80 96 48 48 13 7 6 55-60 78 382 202 180 146 71 75 148 73 75 77 51 26 11 7 4 60-64 58 343 181 162 66 32 34 159 82 77 109 61 48 9 6 3 65-69 47 300 159 141 56 35 21 147 67 80 88 53 35 9 4 5 70-74 36 222 117 105 37 12 25 95 50 45 76 46 30 14 9 5 75+ 61 424 227 197 71 32 39 166 78 88 135 85 50 52 32 20 Ongo Niua 235 1,062 589 473 511 271 240 420 243 177 104 60 44 27 15 12 20-24 9 14 8 6 12 7 5 1 0 1 0 0 0 1 1 0 25-29 20 49 20 29 45 18 27 4 2 2 0 0 0 0 0 0 30-34 22 65 33 32 63 33 30 2 0 2 0 0 0 0 0 0 35-39 26 78 41 37 53 29 24 19 8 11 6 4 2 0 0 0 40-44 29 129 73 56 93 53 40 26 15 11 10 5 5 0 0 0 45-49 25 114 66 48 69 37 32 37 22 15 6 6 0 2 1 1 50-54 25 147 81 66 74 40 34 61 33 28 11 7 4 1 1 0 55-60 20 113 65 48 32 20 12 69 37 32 11 7 4 1 1 0 60-64 24 141 82 59 28 12 16 86 58 28 25 11 14 2 1 1 65-69 6 38 27 11 9 4 5 22 18 4 7 5 2 0 0 0 70-74 13 76 35 41 15 8 7 42 16 26 13 8 5 6 3 3 75+ 16 98 58 40 18 10 8 51 34 17 15 7 8 14 7 7

Tonga 2016 Census of Population and Housing
Tonga Statistics Department
146
Table H 1: Number of households by type, sex of head by division, district, village and region
Island Divison/ District/ Region
Total Households
Private household Institution
Number of Private
Households
Headed by Number of Institutions
Number of persons in Institution
Male Female Male Female
TONGA 18,198 18,005 13,911 4,094 193 730 321
Tongatapu 13,096 12,953 9,853 3,100 143 588 273
Kolofo'ou 3,188 3,108 2,305 803 80 289 120
Kolofo'ou 1,524 1,475 1,051 424 49 173 80
Ma'ufanga 1,266 1,237 940 297 29 105 36
Nukunukumotu 8 8 5 3 0 0 0
Popua 313 312 250 62 1 1 0
Tukutonga 75 75 58 17 0 0 0
Pangaimotu 1 1 1 0 0 0 0
Fafaa 1 0 0 0 1 10 4
Kolomotu'a 3,057 3,031 2,289 742 26 117 80
Kolomotu'a 1,394 1,377 1,007 370 17 68 55
Havelu 617 617 457 160 0 0 0
Tofoa 598 590 448 142 8 46 22
Hofoa 194 193 159 34 1 3 3
Puke 156 156 131 25 0 0 0
Sia'atoutai 98 98 87 11 0 0 0
Vaini 2,216 2,201 1,707 494 15 142 28
Vaini 585 576 453 123 9 110 2
Malapo 107 106 75 31 1 2 0
Longoteme 103 101 75 26 2 5 3
Folaha 162 162 126 36 0 0 0
Nukuhetulu 63 63 45 18 0 0 0
Veitongo 179 179 140 39 0 0 0
Ha'ateiho 451 449 351 98 2 7 5
Pea 346 345 273 72 1 18 18
Tokomololo 220 220 169 51 0 0 0
Tatakamotonga 1,252 1,248 974 274 4 15 8
Tatakamotonga 324 324 250 74 0 0 0
Holonga 89 89 70 19 0 0 0
Pelehake 150 149 108 41 1 3 1
Fua'amotu 312 309 246 63 3 12 7
Nakolo 65 65 50 15 0 0 0
Ha'asini 158 158 122 36 0 0 0
Lavengatonga 65 65 57 8 0 0 0
Haveluliku 26 26 23 3 0 0 0
Fatumu 63 63 48 15 0 0 0
Lapaha 1,238 1,234 931 303 4 4 9
Lapaha 334 331 247 84 3 2 6
Talasiu 58 58 48 10 0 0 0
Hoi 75 75 57 18 0 0 0
Nukuleka 45 45 36 9 0 0 0
Makaunga 58 58 47 11 0 0 0
Talafo'ou 74 74 55 19 0 0 0
Manuka 46 46 35 11 0 0 0
Navutoka 118 117 90 27 1 2 3
Kolonga 216 216 148 68 0 0 0
Afa 71 71 60 11 0 0 0
Niutoua 130 130 97 33 0 0 0
Eueiki 12 12 10 2 0 0 0
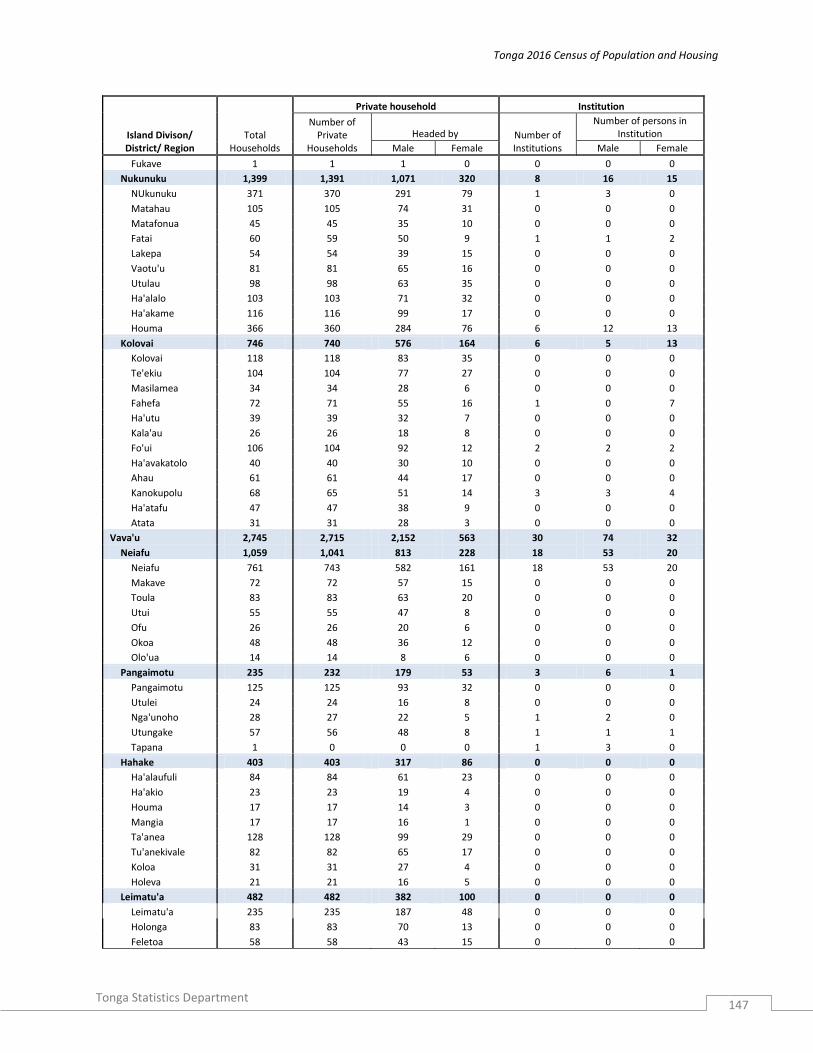
Tonga 2016 Census of Population and Housing
Tonga Statistics Department
147
Island Divison/ District/ Region
Total Households
Private household Institution
Number of Private
Households
Headed by Number of Institutions
Number of persons in Institution
Male Female Male Female
Fukave 1 1 1 0 0 0 0
Nukunuku 1,399 1,391 1,071 320 8 16 15
NUkunuku 371 370 291 79 1 3 0
Matahau 105 105 74 31 0 0 0
Matafonua 45 45 35 10 0 0 0
Fatai 60 59 50 9 1 1 2
Lakepa 54 54 39 15 0 0 0
Vaotu'u 81 81 65 16 0 0 0
Utulau 98 98 63 35 0 0 0
Ha'alalo 103 103 71 32 0 0 0
Ha'akame 116 116 99 17 0 0 0
Houma 366 360 284 76 6 12 13
Kolovai 746 740 576 164 6 5 13
Kolovai 118 118 83 35 0 0 0
Te'ekiu 104 104 77 27 0 0 0
Masilamea 34 34 28 6 0 0 0
Fahefa 72 71 55 16 1 0 7
Ha'utu 39 39 32 7 0 0 0
Kala'au 26 26 18 8 0 0 0
Fo'ui 106 104 92 12 2 2 2
Ha'avakatolo 40 40 30 10 0 0 0
Ahau 61 61 44 17 0 0 0
Kanokupolu 68 65 51 14 3 3 4
Ha'atafu 47 47 38 9 0 0 0
Atata 31 31 28 3 0 0 0
Vava'u 2,745 2,715 2,152 563 30 74 32
Neiafu 1,059 1,041 813 228 18 53 20
Neiafu 761 743 582 161 18 53 20
Makave 72 72 57 15 0 0 0
Toula 83 83 63 20 0 0 0
Utui 55 55 47 8 0 0 0
Ofu 26 26 20 6 0 0 0
Okoa 48 48 36 12 0 0 0
Olo'ua 14 14 8 6 0 0 0
Pangaimotu 235 232 179 53 3 6 1
Pangaimotu 125 125 93 32 0 0 0
Utulei 24 24 16 8 0 0 0
Nga'unoho 28 27 22 5 1 2 0
Utungake 57 56 48 8 1 1 1
Tapana 1 0 0 0 1 3 0
Hahake 403 403 317 86 0 0 0
Ha'alaufuli 84 84 61 23 0 0 0
Ha'akio 23 23 19 4 0 0 0
Houma 17 17 14 3 0 0 0
Mangia 17 17 16 1 0 0 0
Ta'anea 128 128 99 29 0 0 0
Tu'anekivale 82 82 65 17 0 0 0
Koloa 31 31 27 4 0 0 0
Holeva 21 21 16 5 0 0 0
Leimatu'a 482 482 382 100 0 0 0
Leimatu'a 235 235 187 48 0 0 0
Holonga 83 83 70 13 0 0 0
Feletoa 58 58 43 15 0 0 0
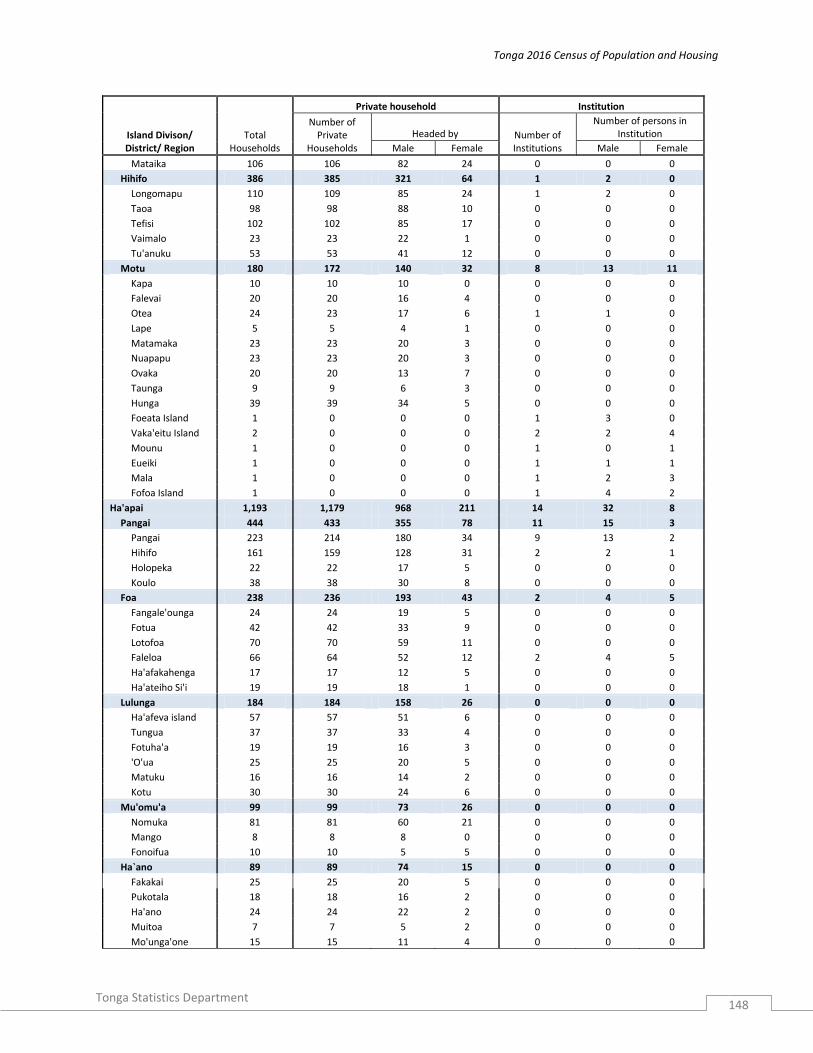
Tonga 2016 Census of Population and Housing
Tonga Statistics Department
148
Island Divison/ District/ Region
Total Households
Private household Institution
Number of Private
Households
Headed by Number of Institutions
Number of persons in Institution
Male Female Male Female
Mataika 106 106 82 24 0 0 0
Hihifo 386 385 321 64 1 2 0
Longomapu 110 109 85 24 1 2 0
Taoa 98 98 88 10 0 0 0
Tefisi 102 102 85 17 0 0 0
Vaimalo 23 23 22 1 0 0 0
Tu'anuku 53 53 41 12 0 0 0
Motu 180 172 140 32 8 13 11
Kapa 10 10 10 0 0 0 0
Falevai 20 20 16 4 0 0 0
Otea 24 23 17 6 1 1 0
Lape 5 5 4 1 0 0 0
Matamaka 23 23 20 3 0 0 0
Nuapapu 23 23 20 3 0 0 0
Ovaka 20 20 13 7 0 0 0
Taunga 9 9 6 3 0 0 0
Hunga 39 39 34 5 0 0 0
Foeata Island 1 0 0 0 1 3 0
Vaka'eitu Island 2 0 0 0 2 2 4
Mounu 1 0 0 0 1 0 1
Eueiki 1 0 0 0 1 1 1
Mala 1 0 0 0 1 2 3
Fofoa Island 1 0 0 0 1 4 2
Ha'apai 1,193 1,179 968 211 14 32 8
Pangai 444 433 355 78 11 15 3
Pangai 223 214 180 34 9 13 2
Hihifo 161 159 128 31 2 2 1
Holopeka 22 22 17 5 0 0 0
Koulo 38 38 30 8 0 0 0
Foa 238 236 193 43 2 4 5
Fangale'ounga 24 24 19 5 0 0 0
Fotua 42 42 33 9 0 0 0
Lotofoa 70 70 59 11 0 0 0
Faleloa 66 64 52 12 2 4 5
Ha'afakahenga 17 17 12 5 0 0 0
Ha'ateiho Si'i 19 19 18 1 0 0 0
Lulunga 184 184 158 26 0 0 0
Ha'afeva island 57 57 51 6 0 0 0
Tungua 37 37 33 4 0 0 0
Fotuha'a 19 19 16 3 0 0 0
'O'ua 25 25 20 5 0 0 0
Matuku 16 16 14 2 0 0 0
Kotu 30 30 24 6 0 0 0
Mu'omu'a 99 99 73 26 0 0 0
Nomuka 81 81 60 21 0 0 0
Mango 8 8 8 0 0 0 0
Fonoifua 10 10 5 5 0 0 0
Ha`ano 89 89 74 15 0 0 0
Fakakai 25 25 20 5 0 0 0
Pukotala 18 18 16 2 0 0 0
Ha'ano 24 24 22 2 0 0 0
Muitoa 7 7 5 2 0 0 0
Mo'unga'one 15 15 11 4 0 0 0
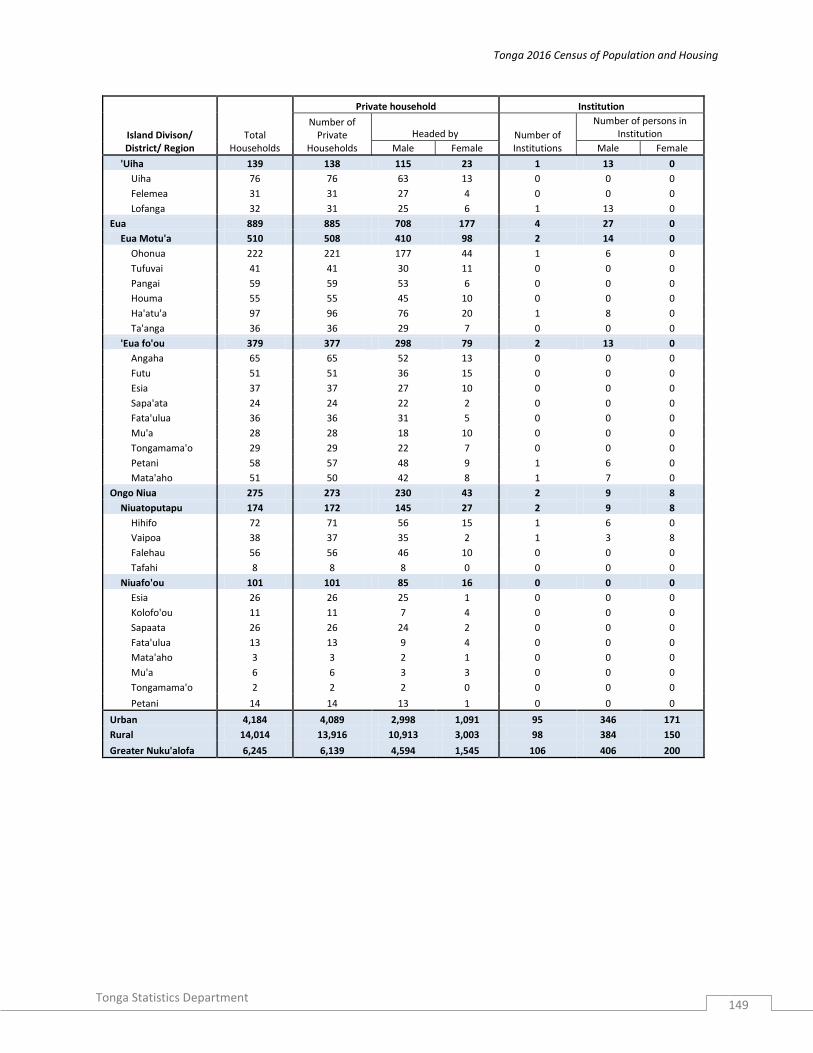
Tonga 2016 Census of Population and Housing
Tonga Statistics Department
149
Island Divison/ District/ Region
Total Households
Private household Institution
Number of Private
Households
Headed by Number of Institutions
Number of persons in Institution
Male Female Male Female
'Uiha 139 138 115 23 1 13 0
Uiha 76 76 63 13 0 0 0
Felemea 31 31 27 4 0 0 0
Lofanga 32 31 25 6 1 13 0
Eua 889 885 708 177 4 27 0
Eua Motu'a 510 508 410 98 2 14 0
Ohonua 222 221 177 44 1 6 0
Tufuvai 41 41 30 11 0 0 0
Pangai 59 59 53 6 0 0 0
Houma 55 55 45 10 0 0 0
Ha'atu'a 97 96 76 20 1 8 0
Ta'anga 36 36 29 7 0 0 0
'Eua fo'ou 379 377 298 79 2 13 0
Angaha 65 65 52 13 0 0 0
Futu 51 51 36 15 0 0 0
Esia 37 37 27 10 0 0 0
Sapa'ata 24 24 22 2 0 0 0
Fata'ulua 36 36 31 5 0 0 0
Mu'a 28 28 18 10 0 0 0
Tongamama'o 29 29 22 7 0 0 0
Petani 58 57 48 9 1 6 0
Mata'aho 51 50 42 8 1 7 0
Ongo Niua 275 273 230 43 2 9 8
Niuatoputapu 174 172 145 27 2 9 8
Hihifo 72 71 56 15 1 6 0
Vaipoa 38 37 35 2 1 3 8
Falehau 56 56 46 10 0 0 0
Tafahi 8 8 8 0 0 0 0
Niuafo'ou 101 101 85 16 0 0 0
Esia 26 26 25 1 0 0 0
Kolofo'ou 11 11 7 4 0 0 0
Sapaata 26 26 24 2 0 0 0
Fata'ulua 13 13 9 4 0 0 0
Mata'aho 3 3 2 1 0 0 0
Mu'a 6 6 3 3 0 0 0
Tongamama'o 2 2 2 0 0 0 0
Petani 14 14 13 1 0 0 0
Urban 4,184 4,089 2,998 1,091 95 346 171
Rural 14,014 13,916 10,913 3,003 98 384 150
Greater Nuku'alofa 6,245 6,139 4,594 1,545 106 406 200
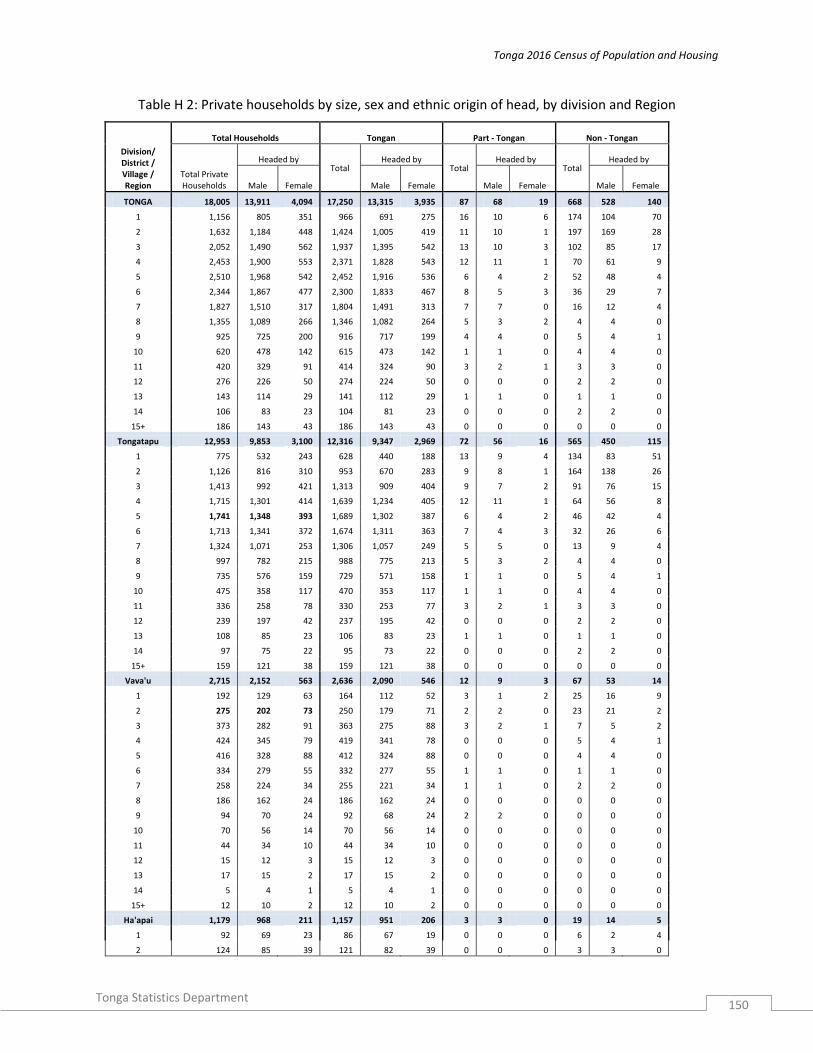
Tonga 2016 Census of Population and Housing
Tonga Statistics Department
150
Table H 2: Private households by size, sex and ethnic origin of head, by division and Region
Division/ District / Village / Region
Total Households Tongan Part - Tongan Non - Tongan
Total Private Households
Headed by Total
Headed by Total
Headed by Total
Headed by
Male Female Male Female Male Female Male Female
TONGA 18,005 13,911 4,094 17,250 13,315 3,935 87 68 19 668 528 140
1 1,156 805 351 966 691 275 16 10 6 174 104 70
2 1,632 1,184 448 1,424 1,005 419 11 10 1 197 169 28
3 2,052 1,490 562 1,937 1,395 542 13 10 3 102 85 17
4 2,453 1,900 553 2,371 1,828 543 12 11 1 70 61 9
5 2,510 1,968 542 2,452 1,916 536 6 4 2 52 48 4
6 2,344 1,867 477 2,300 1,833 467 8 5 3 36 29 7
7 1,827 1,510 317 1,804 1,491 313 7 7 0 16 12 4
8 1,355 1,089 266 1,346 1,082 264 5 3 2 4 4 0
9 925 725 200 916 717 199 4 4 0 5 4 1
10 620 478 142 615 473 142 1 1 0 4 4 0
11 420 329 91 414 324 90 3 2 1 3 3 0
12 276 226 50 274 224 50 0 0 0 2 2 0
13 143 114 29 141 112 29 1 1 0 1 1 0
14 106 83 23 104 81 23 0 0 0 2 2 0
15+ 186 143 43 186 143 43 0 0 0 0 0 0
Tongatapu 12,953 9,853 3,100 12,316 9,347 2,969 72 56 16 565 450 115
1 775 532 243 628 440 188 13 9 4 134 83 51
2 1,126 816 310 953 670 283 9 8 1 164 138 26
3 1,413 992 421 1,313 909 404 9 7 2 91 76 15
4 1,715 1,301 414 1,639 1,234 405 12 11 1 64 56 8
5 1,741 1,348 393 1,689 1,302 387 6 4 2 46 42 4
6 1,713 1,341 372 1,674 1,311 363 7 4 3 32 26 6
7 1,324 1,071 253 1,306 1,057 249 5 5 0 13 9 4
8 997 782 215 988 775 213 5 3 2 4 4 0
9 735 576 159 729 571 158 1 1 0 5 4 1
10 475 358 117 470 353 117 1 1 0 4 4 0
11 336 258 78 330 253 77 3 2 1 3 3 0
12 239 197 42 237 195 42 0 0 0 2 2 0
13 108 85 23 106 83 23 1 1 0 1 1 0
14 97 75 22 95 73 22 0 0 0 2 2 0
15+ 159 121 38 159 121 38 0 0 0 0 0 0
Vava'u 2,715 2,152 563 2,636 2,090 546 12 9 3 67 53 14
1 192 129 63 164 112 52 3 1 2 25 16 9
2 275 202 73 250 179 71 2 2 0 23 21 2
3 373 282 91 363 275 88 3 2 1 7 5 2
4 424 345 79 419 341 78 0 0 0 5 4 1
5 416 328 88 412 324 88 0 0 0 4 4 0
6 334 279 55 332 277 55 1 1 0 1 1 0
7 258 224 34 255 221 34 1 1 0 2 2 0
8 186 162 24 186 162 24 0 0 0 0 0 0
9 94 70 24 92 68 24 2 2 0 0 0 0
10 70 56 14 70 56 14 0 0 0 0 0 0
11 44 34 10 44 34 10 0 0 0 0 0 0
12 15 12 3 15 12 3 0 0 0 0 0 0
13 17 15 2 17 15 2 0 0 0 0 0 0
14 5 4 1 5 4 1 0 0 0 0 0 0
15+ 12 10 2 12 10 2 0 0 0 0 0 0
Ha'apai 1,179 968 211 1,157 951 206 3 3 0 19 14 5
1 92 69 23 86 67 19 0 0 0 6 2 4
2 124 85 39 121 82 39 0 0 0 3 3 0

Tonga 2016 Census of Population and Housing
Tonga Statistics Department
151
Division/ District / Village / Region
Total Households Tongan Part - Tongan Non - Tongan
Total Private Households
Headed by Total
Headed by Total
Headed by Total
Headed by
Male Female Male Female Male Female Male Female
3 138 109 29 133 104 29 1 1 0 4 4 0
4 155 134 21 155 134 21 0 0 0 0 0 0
5 186 155 31 184 153 31 0 0 0 2 2 0
6 151 131 20 148 129 19 0 0 0 3 2 1
7 121 104 17 119 102 17 1 1 0 1 1 0
8 90 77 13 90 77 13 0 0 0 0 0 0
9 43 35 8 42 34 8 1 1 0 0 0 0
10 34 30 4 34 30 4 0 0 0 0 0 0
11 17 16 1 17 16 1 0 0 0 0 0 0
12 12 8 4 12 8 4 0 0 0 0 0 0
13 9 8 1 9 8 1 0 0 0 0 0 0
14 0 0 0 0 0 0 0 0 0 0 0 0
15+ 7 7 0 7 7 0 0 0 0 0 0 0
'Eua 885 708 177 869 698 171 0 0 0 16 10 6
1 64 44 20 55 41 14 0 0 0 9 3 6
2 68 52 16 62 46 16 0 0 0 6 6 0
3 94 79 15 94 79 15 0 0 0 0 0 0
4 113 84 29 112 83 29 0 0 0 1 1 0
5 129 106 23 129 106 23 0 0 0 0 0 0
6 123 96 27 123 96 27 0 0 0 0 0 0
7 94 83 11 94 83 11 0 0 0 0 0 0
8 73 61 12 73 61 12 0 0 0 0 0 0
9 43 35 8 43 35 8 0 0 0 0 0 0
10 34 27 7 34 27 7 0 0 0 0 0 0
11 22 20 2 22 20 2 0 0 0 0 0 0
12 8 7 1 8 7 1 0 0 0 0 0 0
13 8 5 3 8 5 3 0 0 0 0 0 0
14 4 4 0 4 4 0 0 0 0 0 0 0
15+ 8 5 3 8 5 3 0 0 0 0 0 0
Ongo Niua 273 230 43 272 229 43 0 0 0 1 1 0
1 33 31 2 33 31 2 0 0 0 0 0 0
2 39 29 10 38 28 10 0 0 0 1 1 0
3 34 28 6 34 28 6 0 0 0 0 0 0
4 46 36 10 46 36 10 0 0 0 0 0 0
5 38 31 7 38 31 7 0 0 0 0 0 0
6 23 20 3 23 20 3 0 0 0 0 0 0
7 30 28 2 30 28 2 0 0 0 0 0 0
8 9 7 2 9 7 2 0 0 0 0 0 0
9 10 9 1 10 9 1 0 0 0 0 0 0
10 7 7 0 7 7 0 0 0 0 0 0 0
11 1 1 0 1 1 0 0 0 0 0 0 0
12 2 2 0 2 2 0 0 0 0 0 0 0
13 1 1 0 1 1 0 0 0 0 0 0 0
14 0 0 0 0 0 0 0 0 0 0 0 0
154+ 0 0 0 0 0 0 0 0 0 0 0 0
Urban 4,080 2,990 1,090 3,768 2,747 1,021 20 15 5 292 228 64
1 281 179 102 215 139 76 5 4 1 61 36 25
2 406 295 111 322 227 95 4 4 . 80 64 16
3 453 300 153 401 257 144 2 1 1 50 42 8
4 557 405 152 512 367 145 3 2 1 42 36 6
5 531 392 139 507 370 137 2 1 1 22 21 1
6 496 387 109 478 374 104 1 1 0 17 12 5
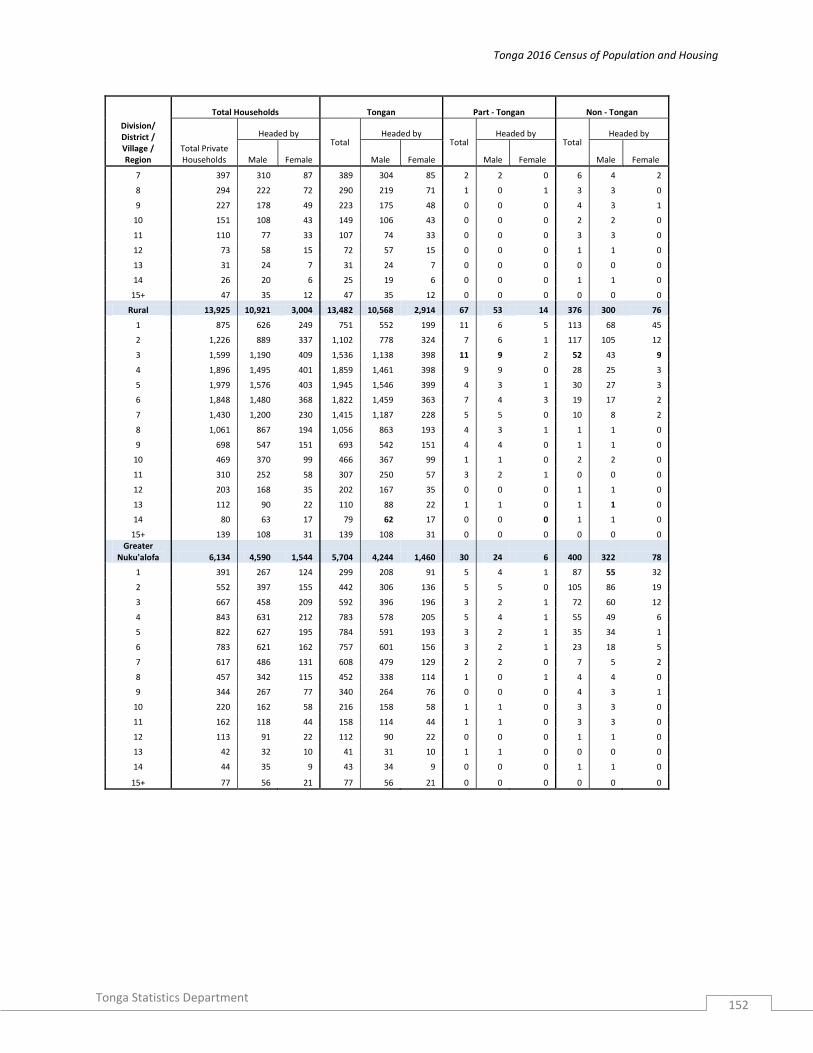
Tonga 2016 Census of Population and Housing
Tonga Statistics Department
152
Division/ District / Village / Region
Total Households Tongan Part - Tongan Non - Tongan
Total Private Households
Headed by Total
Headed by Total
Headed by Total
Headed by
Male Female Male Female Male Female Male Female
7 397 310 87 389 304 85 2 2 0 6 4 2
8 294 222 72 290 219 71 1 0 1 3 3 0
9 227 178 49 223 175 48 0 0 0 4 3 1
10 151 108 43 149 106 43 0 0 0 2 2 0
11 110 77 33 107 74 33 0 0 0 3 3 0
12 73 58 15 72 57 15 0 0 0 1 1 0
13 31 24 7 31 24 7 0 0 0 0 0 0
14 26 20 6 25 19 6 0 0 0 1 1 0
15+ 47 35 12 47 35 12 0 0 0 0 0 0
Rural 13,925 10,921 3,004 13,482 10,568 2,914 67 53 14 376 300 76
1 875 626 249 751 552 199 11 6 5 113 68 45
2 1,226 889 337 1,102 778 324 7 6 1 117 105 12
3 1,599 1,190 409 1,536 1,138 398 11 9 2 52 43 9
4 1,896 1,495 401 1,859 1,461 398 9 9 0 28 25 3
5 1,979 1,576 403 1,945 1,546 399 4 3 1 30 27 3
6 1,848 1,480 368 1,822 1,459 363 7 4 3 19 17 2
7 1,430 1,200 230 1,415 1,187 228 5 5 0 10 8 2
8 1,061 867 194 1,056 863 193 4 3 1 1 1 0
9 698 547 151 693 542 151 4 4 0 1 1 0
10 469 370 99 466 367 99 1 1 0 2 2 0
11 310 252 58 307 250 57 3 2 1 0 0 0
12 203 168 35 202 167 35 0 0 0 1 1 0
13 112 90 22 110 88 22 1 1 0 1 1 0
14 80 63 17 79 62 17 0 0 0 1 1 0
15+ 139 108 31 139 108 31 0 0 0 0 0 0 Greater
Nuku'alofa 6,134 4,590 1,544 5,704 4,244 1,460 30 24 6 400 322 78
1 391 267 124 299 208 91 5 4 1 87 55 32
2 552 397 155 442 306 136 5 5 0 105 86 19
3 667 458 209 592 396 196 3 2 1 72 60 12
4 843 631 212 783 578 205 5 4 1 55 49 6
5 822 627 195 784 591 193 3 2 1 35 34 1
6 783 621 162 757 601 156 3 2 1 23 18 5
7 617 486 131 608 479 129 2 2 0 7 5 2
8 457 342 115 452 338 114 1 0 1 4 4 0
9 344 267 77 340 264 76 0 0 0 4 3 1
10 220 162 58 216 158 58 1 1 0 3 3 0
11 162 118 44 158 114 44 1 1 0 3 3 0
12 113 91 22 112 90 22 0 0 0 1 1 0
13 42 32 10 41 31 10 1 1 0 0 0 0
14 44 35 9 43 34 9 0 0 0 1 1 0
15+ 77 56 21 77 56 21 0 0 0 0 0 0
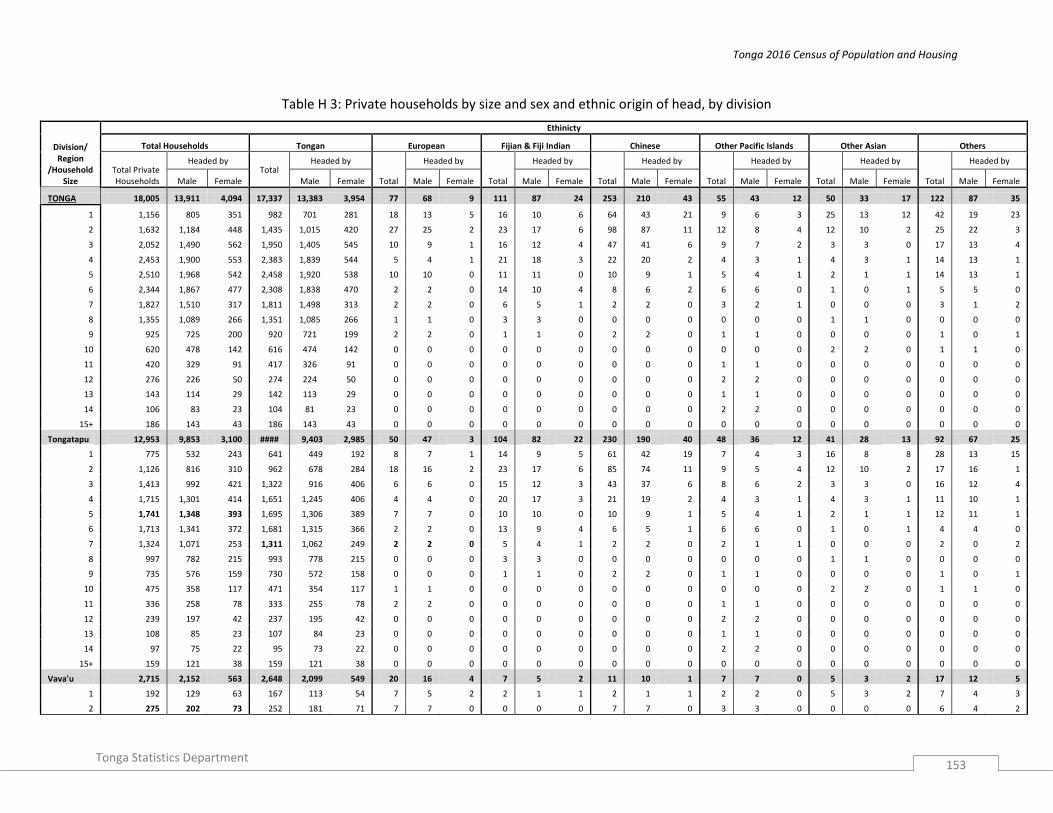
Tonga 2016 Census of Population and Housing
Tonga Statistics Department
153
Table H 3: Private households by size and sex and ethnic origin of head, by division
Division/ Region
/Household Size
Ethinicty
Total Households Tongan European Fijian & Fiji Indian Chinese Other Pacific Islands Other Asian Others
Total Private Households
Headed by Total
Headed by
Total
Headed by
Total
Headed by
Total
Headed by
Total
Headed by
Total
Headed by
Total
Headed by
Male Female Male Female Male Female Male Female Male Female Male Female Male Female Male Female
TONGA 18,005 13,911 4,094 17,337 13,383 3,954 77 68 9 111 87 24 253 210 43 55 43 12 50 33 17 122 87 35
1 1,156 805 351 982 701 281 18 13 5 16 10 6 64 43 21 9 6 3 25 13 12 42 19 23
2 1,632 1,184 448 1,435 1,015 420 27 25 2 23 17 6 98 87 11 12 8 4 12 10 2 25 22 3
3 2,052 1,490 562 1,950 1,405 545 10 9 1 16 12 4 47 41 6 9 7 2 3 3 0 17 13 4
4 2,453 1,900 553 2,383 1,839 544 5 4 1 21 18 3 22 20 2 4 3 1 4 3 1 14 13 1
5 2,510 1,968 542 2,458 1,920 538 10 10 0 11 11 0 10 9 1 5 4 1 2 1 1 14 13 1
6 2,344 1,867 477 2,308 1,838 470 2 2 0 14 10 4 8 6 2 6 6 0 1 0 1 5 5 0
7 1,827 1,510 317 1,811 1,498 313 2 2 0 6 5 1 2 2 0 3 2 1 0 0 0 3 1 2
8 1,355 1,089 266 1,351 1,085 266 1 1 0 3 3 0 0 0 0 0 0 0 1 1 0 0 0 0
9 925 725 200 920 721 199 2 2 0 1 1 0 2 2 0 1 1 0 0 0 0 1 0 1
10 620 478 142 616 474 142 0 0 0 0 0 0 0 0 0 0 0 0 2 2 0 1 1 0
11 420 329 91 417 326 91 0 0 0 0 0 0 0 0 0 1 1 0 0 0 0 0 0 0
12 276 226 50 274 224 50 0 0 0 0 0 0 0 0 0 2 2 0 0 0 0 0 0 0
13 143 114 29 142 113 29 0 0 0 0 0 0 0 0 0 1 1 0 0 0 0 0 0 0
14 106 83 23 104 81 23 0 0 0 0 0 0 0 0 0 2 2 0 0 0 0 0 0 0
15+ 186 143 43 186 143 43 0 0 0 0 0 0 0 0 0 0 0 0 0 0 0 0 0 0
Tongatapu 12,953 9,853 3,100 #### 9,403 2,985 50 47 3 104 82 22 230 190 40 48 36 12 41 28 13 92 67 25
1 775 532 243 641 449 192 8 7 1 14 9 5 61 42 19 7 4 3 16 8 8 28 13 15
2 1,126 816 310 962 678 284 18 16 2 23 17 6 85 74 11 9 5 4 12 10 2 17 16 1
3 1,413 992 421 1,322 916 406 6 6 0 15 12 3 43 37 6 8 6 2 3 3 0 16 12 4
4 1,715 1,301 414 1,651 1,245 406 4 4 0 20 17 3 21 19 2 4 3 1 4 3 1 11 10 1
5 1,741 1,348 393 1,695 1,306 389 7 7 0 10 10 0 10 9 1 5 4 1 2 1 1 12 11 1
6 1,713 1,341 372 1,681 1,315 366 2 2 0 13 9 4 6 5 1 6 6 0 1 0 1 4 4 0
7 1,324 1,071 253 1,311 1,062 249 2 2 0 5 4 1 2 2 0 2 1 1 0 0 0 2 0 2
8 997 782 215 993 778 215 0 0 0 3 3 0 0 0 0 0 0 0 1 1 0 0 0 0
9 735 576 159 730 572 158 0 0 0 1 1 0 2 2 0 1 1 0 0 0 0 1 0 1
10 475 358 117 471 354 117 1 1 0 0 0 0 0 0 0 0 0 0 2 2 0 1 1 0
11 336 258 78 333 255 78 2 2 0 0 0 0 0 0 0 1 1 0 0 0 0 0 0 0
12 239 197 42 237 195 42 0 0 0 0 0 0 0 0 0 2 2 0 0 0 0 0 0 0
13 108 85 23 107 84 23 0 0 0 0 0 0 0 0 0 1 1 0 0 0 0 0 0 0
14 97 75 22 95 73 22 0 0 0 0 0 0 0 0 0 2 2 0 0 0 0 0 0 0
15+ 159 121 38 159 121 38 0 0 0 0 0 0 0 0 0 0 0 0 0 0 0 0 0 0
Vava'u 2,715 2,152 563 2,648 2,099 549 20 16 4 7 5 2 11 10 1 7 7 0 5 3 2 17 12 5
1 192 129 63 167 113 54 7 5 2 2 1 1 2 1 1 2 2 0 5 3 2 7 4 3
2 275 202 73 252 181 71 7 7 0 0 0 0 7 7 0 3 3 0 0 0 0 6 4 2

Tonga 2016 Census of Population and Housing
Tonga Statistics Department
154
Division/ Region
/Household Size
Ethinicty
Total Households Tongan European Fijian & Fiji Indian Chinese Other Pacific Islands Other Asian Others
Total Private Households
Headed by Total
Headed by
Total
Headed by
Total
Headed by
Total
Headed by
Total
Headed by
Total
Headed by
Total
Headed by
Male Female Male Female Male Female Male Female Male Female Male Female Male Female Male Female
3 373 282 91 366 277 89 4 3 1 1 0 1 1 1 0 1 1 0 0 0 0 0 0 0
4 424 345 79 419 341 78 1 0 1 1 1 0 1 1 0 0 0 0 0 0 0 2 2 0
5 416 328 88 412 324 88 1 1 0 1 1 0 0 0 0 0 0 0 0 0 0 2 2 0
6 334 279 55 333 278 55 0 0 0 1 1 0 0 0 0 0 0 0 0 0 0 0 0 0
7 258 224 34 256 222 34 0 0 0 1 1 0 0 0 0 1 1 0 0 0 0 0 0 0
8 186 162 24 186 162 24 0 0 0 0 0 0 0 0 0 0 0 0 0 0 0 0 0 0
9 94 70 24 94 70 24 0 0 0 0 0 0 0 0 0 0 0 0 0 0 0 0 0 0
10 70 56 14 70 56 14 0 0 0 0 0 0 0 0 0 0 0 0 0 0 0 0 0 0
11 44 34 10 44 34 10 0 0 0 0 0 0 0 0 0 0 0 0 0 0 0 0 0 0
12 15 12 3 15 12 3 0 0 0 0 0 0 0 0 0 0 0 0 0 0 0 0 0 0
13 17 15 2 17 15 2 0 0 0 0 0 0 0 0 0 0 0 0 0 0 0 0 0 0
14 5 4 1 5 4 1 0 0 0 0 0 0 0 0 0 0 0 0 0 0 0 0 0 0
15+ 12 10 2 12 10 2 0 0 0 0 0 0 0 0 0 0 0 0 0 0 0 0 0 0
Ha'apai 1,179 968 211 1,160 954 206 4 4 0 0 0 0 6 5 1 0 0 0 0 0 0 9 5 4
1 92 69 23 86 67 19 1 1 0 0 0 0 0 0 0 0 0 0 0 0 0 5 1 4
2 124 85 39 121 82 39 1 1 0 0 0 0 1 1 0 0 0 0 0 0 0 1 1 0
3 138 109 29 134 105 29 0 0 0 0 0 0 3 3 0 0 0 0 0 0 0 1 1 0
4 155 134 21 155 134 21 0 0 0 0 0 0 0 0 0 0 0 0 0 0 0 0 0 0
5 186 155 31 184 153 31 2 2 0 0 0 0 0 0 0 0 0 0 0 0 0 0 0 0
6 151 131 20 148 129 19 0 0 0 0 0 0 2 1 1 0 0 0 0 0 0 1 1 0
7 121 104 17 120 103 17 0 0 0 0 0 0 0 0 0 0 0 0 0 0 0 1 1 0
8 90 77 13 90 77 13 0 0 0 0 0 0 0 0 0 0 0 0 0 0 0 0 0 0
9 43 35 8 43 35 8 0 0 0 0 0 0 0 0 0 0 0 0 0 0 0 0 0 0
10 34 30 4 34 30 4 0 0 0 0 0 0 0 0 0 0 0 0 0 0 0 0 0 0
11 17 16 1 17 16 1 0 0 0 0 0 0 0 0 0 0 0 0 0 0 0 0 0 0
12 12 8 4 12 8 4 0 0 0 0 0 0 0 0 0 0 0 0 0 0 0 0 0 0
13 9 8 1 9 8 1 0 0 0 0 0 0 0 0 0 0 0 0 0 0 0 0 0 0
14 0 0 0 0 0 0 0 0 0 0 0 0 0 0 0 0 0 0 0 0 0 0 0 0
15+ 7 7 0 7 7 0 0 0 0 0 0 0 0 0 0 0 0 0 0 0 0 0 0 0
'Eua 885 708 177 869 698 171 3 1 2 0 0 0 5 4 1 0 0 0 4 2 2 4 3 1
1 64 44 20 55 41 14 2 0 2 0 0 0 1 0 1 0 0 0 4 2 2 2 1 1
2 68 52 16 62 46 16 1 1 0 0 0 0 4 4 0 0 0 0 0 0 0 1 1 0
3 94 79 15 94 79 15 0 0 0 0 0 0 0 0 0 0 0 0 0 0 0 0 0 0
4 113 84 29 112 83 29 0 0 0 0 0 0 0 0 0 0 0 0 0 0 0 1 1 0
5 129 106 23 129 106 23 0 0 0 0 0 0 0 0 0 0 0 0 0 0 0 0 0 0
6 123 96 27 123 96 27 0 0 0 0 0 0 0 0 0 0 0 0 0 0 0 0 0 0
7 94 83 11 94 83 11 0 0 0 0 0 0 0 0 0 0 0 0 0 0 0 0 0 0
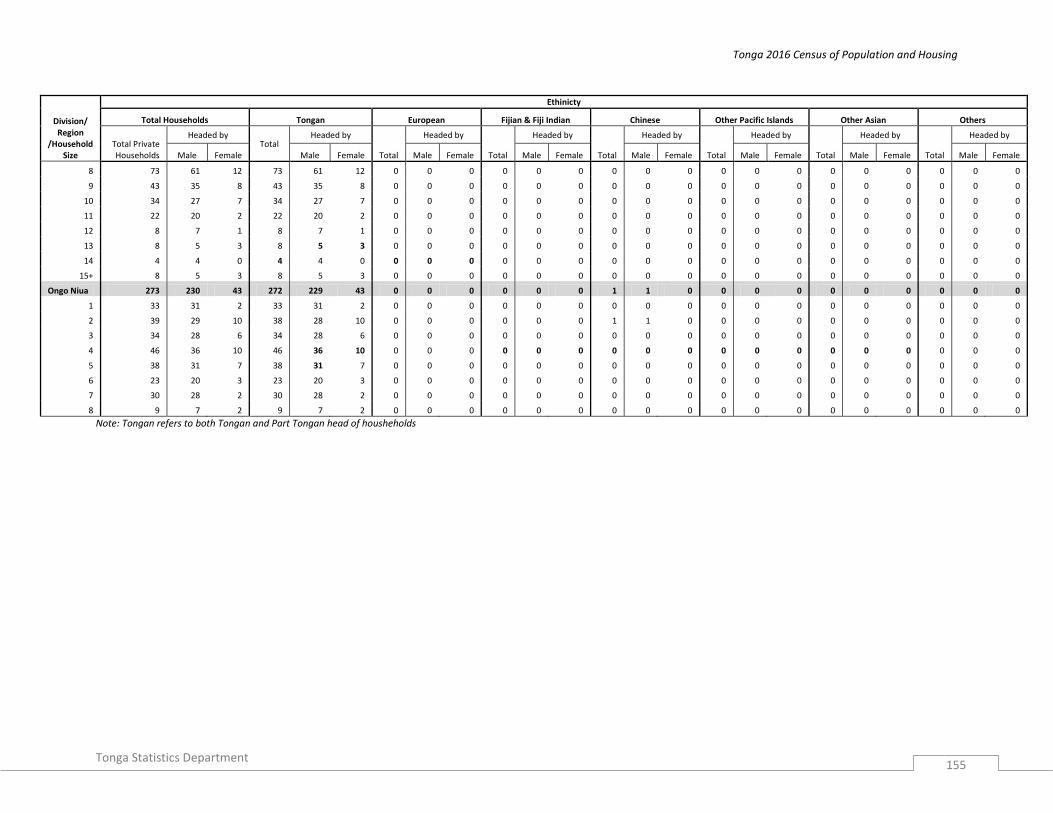
Tonga 2016 Census of Population and Housing
Tonga Statistics Department
155
Division/ Region
/Household Size
Ethinicty
Total Households Tongan European Fijian & Fiji Indian Chinese Other Pacific Islands Other Asian Others
Total Private Households
Headed by Total
Headed by
Total
Headed by
Total
Headed by
Total
Headed by
Total
Headed by
Total
Headed by
Total
Headed by
Male Female Male Female Male Female Male Female Male Female Male Female Male Female Male Female
8 73 61 12 73 61 12 0 0 0 0 0 0 0 0 0 0 0 0 0 0 0 0 0 0
9 43 35 8 43 35 8 0 0 0 0 0 0 0 0 0 0 0 0 0 0 0 0 0 0
10 34 27 7 34 27 7 0 0 0 0 0 0 0 0 0 0 0 0 0 0 0 0 0 0
11 22 20 2 22 20 2 0 0 0 0 0 0 0 0 0 0 0 0 0 0 0 0 0 0
12 8 7 1 8 7 1 0 0 0 0 0 0 0 0 0 0 0 0 0 0 0 0 0 0
13 8 5 3 8 5 3 0 0 0 0 0 0 0 0 0 0 0 0 0 0 0 0 0 0
14 4 4 0 4 4 0 0 0 0 0 0 0 0 0 0 0 0 0 0 0 0 0 0 0
15+ 8 5 3 8 5 3 0 0 0 0 0 0 0 0 0 0 0 0 0 0 0 0 0 0
Ongo Niua 273 230 43 272 229 43 0 0 0 0 0 0 1 1 0 0 0 0 0 0 0 0 0 0
1 33 31 2 33 31 2 0 0 0 0 0 0 0 0 0 0 0 0 0 0 0 0 0 0
2 39 29 10 38 28 10 0 0 0 0 0 0 1 1 0 0 0 0 0 0 0 0 0 0
3 34 28 6 34 28 6 0 0 0 0 0 0 0 0 0 0 0 0 0 0 0 0 0 0
4 46 36 10 46 36 10 0 0 0 0 0 0 0 0 0 0 0 0 0 0 0 0 0 0
5 38 31 7 38 31 7 0 0 0 0 0 0 0 0 0 0 0 0 0 0 0 0 0 0
6 23 20 3 23 20 3 0 0 0 0 0 0 0 0 0 0 0 0 0 0 0 0 0 0
7 30 28 2 30 28 2 0 0 0 0 0 0 0 0 0 0 0 0 0 0 0 0 0 0
8 9 7 2 9 7 2 0 0 0 0 0 0 0 0 0 0 0 0 0 0 0 0 0 0
Note: Tongan refers to both Tongan and Part Tongan head of housheholds

Tonga 2016 Census of Population and Housing
Tonga Statistics Department
156
Table H 4: Private households’ populations by household composition (relationship to Head of Household)
Island/District/Region Total Head Spouse
Biological son/
daughter
Adopted son/
daughter Brother/
Sister Grandchild Parent
of Head
Parent of
Spouse Child of Spouse
Othe Relatives
No Relationship
TONGA 99,600 18,005 11,588 39,184 3,153 1,867 13,044 541 779 704 9,209 1,526
Tongatapu 73,750 12,953 8,239 28,919 2,186 1,463 9,703 389 586 537 7,595 1,180
Kolofo'ou 17,655 3,108 1,894 6,663 525 452 2,350 98 145 111 2,034 275
Kolofo'ou 8,012 1,475 831 2,947 211 200 1,062 41 74 68 934 169
Ma'ufanga 7,220 1,237 789 2,759 207 187 969 47 50 24 858 93
Nukumotu 50 8 5 31 2 1 1 2 0 0 0 0
Popua 1,879 312 214 702 93 55 247 7 15 19 203 12
Tukutonga 488 75 54 222 12 9 71 1 4 0 39 1
Pangaimotu 6 1 1 2 0 0 0 0 2 0 0 0
Kolomotu'a 16,923 3,031 1,887 6,507 459 337 2,075 86 164 104 1,971 302
Kolomotu'a 7,472 1,377 829 2,909 166 169 852 45 69 30 932 94
Havelu 3,476 617 371 1,284 100 74 485 17 36 20 387 85
Tofoa 3,421 590 372 1,306 98 61 440 15 39 22 403 75
Hofoa 1,167 193 130 466 35 15 170 2 7 13 108 28
Puke 927 156 111 349 38 10 120 6 9 18 102 8
Sia'atoutai 460 98 74 193 22 8 8 1 4 1 39 12
Vaini 12,829 2,201 1,455 5,191 371 266 1,723 85 106 74 1,081 276
Vaini 3,249 576 389 1,317 114 58 451 21 35 19 213 56
Malapo 574 106 59 185 22 14 103 3 7 3 70 2
Longoteme 595 101 56 261 11 11 86 2 10 7 46 4
Folaha 952 162 109 392 22 20 135 9 5 10 79 9
Nukuhetulu 340 63 42 143 20 2 39 3 2 1 10 15
Veitongo 1,199 179 123 459 38 29 216 10 9 3 84 49
Ha'ateiho 2,652 449 297 1,072 58 57 338 22 19 16 270 54
Pea 1,992 345 231 837 45 51 213 11 9 12 186 52
Tokomololo 1,276 220 149 525 41 24 142 4 10 3 123 35
Tatakamotonga 7,020 1,248 814 2,850 216 87 968 26 32 71 597 111
Tatakamotonga 1,903 324 210 775 41 20 295 4 7 30 154 43
Holonga 488 89 55 211 9 3 63 5 3 5 27 18
Pelehake 792 149 83 327 25 13 98 2 3 14 56 22
Fua'amotu 1,618 309 211 674 76 18 176 7 12 4 115 16
Nakolo 406 65 38 148 6 3 83 2 2 3 55 1
Ha'asini 883 158 101 353 40 12 122 4 2 7 78 6
Lavengatonga 619 109 82 239 12 13 77 1 2 8 71 5
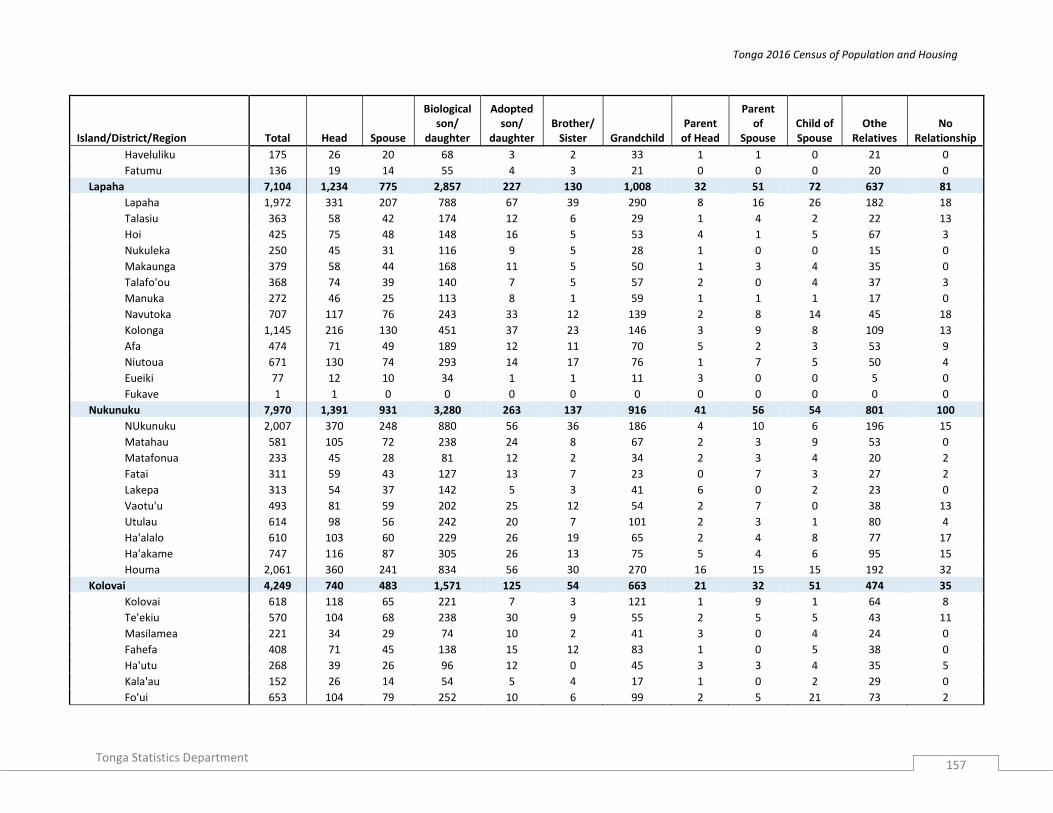
Tonga 2016 Census of Population and Housing
Tonga Statistics Department
157
Island/District/Region Total Head Spouse
Biological son/
daughter
Adopted son/
daughter Brother/
Sister Grandchild Parent
of Head
Parent of
Spouse Child of Spouse
Othe Relatives
No Relationship
Haveluliku 175 26 20 68 3 2 33 1 1 0 21 0
Fatumu 136 19 14 55 4 3 21 0 0 0 20 0
Lapaha 7,104 1,234 775 2,857 227 130 1,008 32 51 72 637 81
Lapaha 1,972 331 207 788 67 39 290 8 16 26 182 18
Talasiu 363 58 42 174 12 6 29 1 4 2 22 13
Hoi 425 75 48 148 16 5 53 4 1 5 67 3
Nukuleka 250 45 31 116 9 5 28 1 0 0 15 0
Makaunga 379 58 44 168 11 5 50 1 3 4 35 0
Talafo'ou 368 74 39 140 7 5 57 2 0 4 37 3
Manuka 272 46 25 113 8 1 59 1 1 1 17 0
Navutoka 707 117 76 243 33 12 139 2 8 14 45 18
Kolonga 1,145 216 130 451 37 23 146 3 9 8 109 13
Afa 474 71 49 189 12 11 70 5 2 3 53 9
Niutoua 671 130 74 293 14 17 76 1 7 5 50 4
Eueiki 77 12 10 34 1 1 11 3 0 0 5 0
Fukave 1 1 0 0 0 0 0 0 0 0 0 0
Nukunuku 7,970 1,391 931 3,280 263 137 916 41 56 54 801 100
NUkunuku 2,007 370 248 880 56 36 186 4 10 6 196 15
Matahau 581 105 72 238 24 8 67 2 3 9 53 0
Matafonua 233 45 28 81 12 2 34 2 3 4 20 2
Fatai 311 59 43 127 13 7 23 0 7 3 27 2
Lakepa 313 54 37 142 5 3 41 6 0 2 23 0
Vaotu'u 493 81 59 202 25 12 54 2 7 0 38 13
Utulau 614 98 56 242 20 7 101 2 3 1 80 4
Ha'alalo 610 103 60 229 26 19 65 2 4 8 77 17
Ha'akame 747 116 87 305 26 13 75 5 4 6 95 15
Houma 2,061 360 241 834 56 30 270 16 15 15 192 32
Kolovai 4,249 740 483 1,571 125 54 663 21 32 51 474 35
Kolovai 618 118 65 221 7 3 121 1 9 1 64 8
Te'ekiu 570 104 68 238 30 9 55 2 5 5 43 11
Masilamea 221 34 29 74 10 2 41 3 0 4 24 0
Fahefa 408 71 45 138 15 12 83 1 0 5 38 0
Ha'utu 268 39 26 96 12 0 45 3 3 4 35 5
Kala'au 152 26 14 54 5 4 17 1 0 2 29 0
Fo'ui 653 104 79 252 10 6 99 2 5 21 73 2
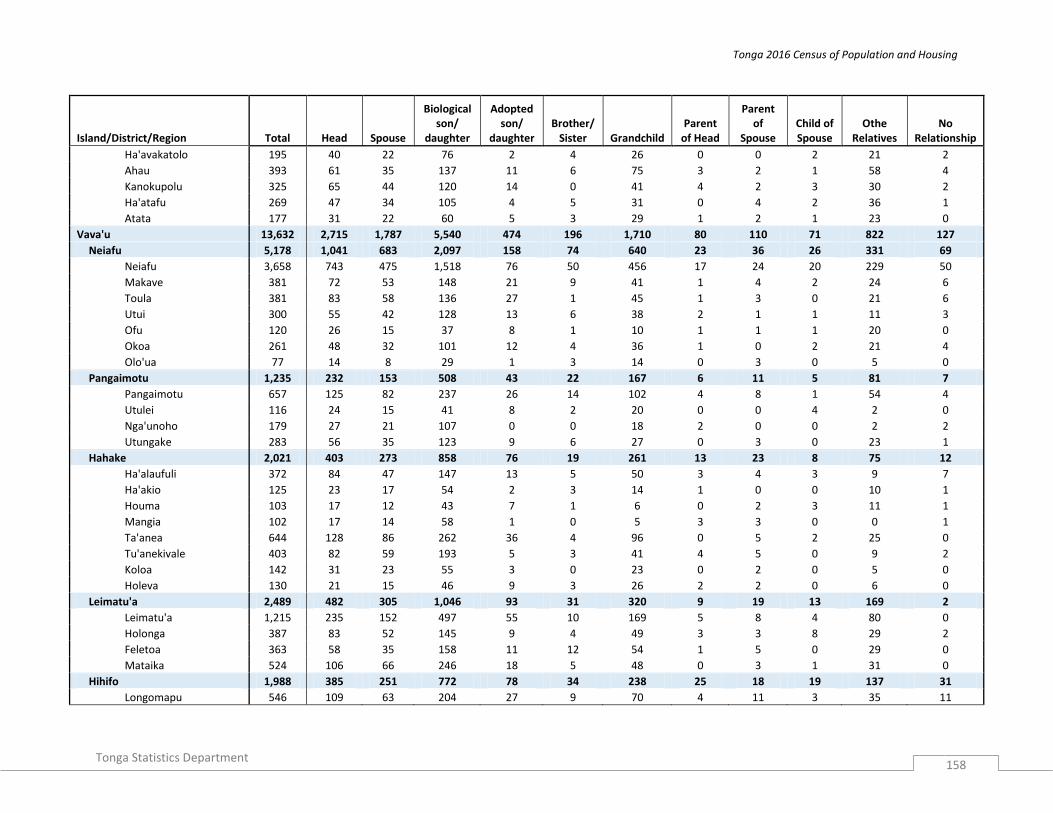
Tonga 2016 Census of Population and Housing
Tonga Statistics Department
158
Island/District/Region Total Head Spouse
Biological son/
daughter
Adopted son/
daughter Brother/
Sister Grandchild Parent
of Head
Parent of
Spouse Child of Spouse
Othe Relatives
No Relationship
Ha'avakatolo 195 40 22 76 2 4 26 0 0 2 21 2
Ahau 393 61 35 137 11 6 75 3 2 1 58 4
Kanokupolu 325 65 44 120 14 0 41 4 2 3 30 2
Ha'atafu 269 47 34 105 4 5 31 0 4 2 36 1
Atata 177 31 22 60 5 3 29 1 2 1 23 0
Vava'u 13,632 2,715 1,787 5,540 474 196 1,710 80 110 71 822 127
Neiafu 5,178 1,041 683 2,097 158 74 640 23 36 26 331 69
Neiafu 3,658 743 475 1,518 76 50 456 17 24 20 229 50
Makave 381 72 53 148 21 9 41 1 4 2 24 6
Toula 381 83 58 136 27 1 45 1 3 0 21 6
Utui 300 55 42 128 13 6 38 2 1 1 11 3
Ofu 120 26 15 37 8 1 10 1 1 1 20 0
Okoa 261 48 32 101 12 4 36 1 0 2 21 4
Olo'ua 77 14 8 29 1 3 14 0 3 0 5 0
Pangaimotu 1,235 232 153 508 43 22 167 6 11 5 81 7
Pangaimotu 657 125 82 237 26 14 102 4 8 1 54 4
Utulei 116 24 15 41 8 2 20 0 0 4 2 0
Nga'unoho 179 27 21 107 0 0 18 2 0 0 2 2
Utungake 283 56 35 123 9 6 27 0 3 0 23 1
Hahake 2,021 403 273 858 76 19 261 13 23 8 75 12
Ha'alaufuli 372 84 47 147 13 5 50 3 4 3 9 7
Ha'akio 125 23 17 54 2 3 14 1 0 0 10 1
Houma 103 17 12 43 7 1 6 0 2 3 11 1
Mangia 102 17 14 58 1 0 5 3 3 0 0 1
Ta'anea 644 128 86 262 36 4 96 0 5 2 25 0
Tu'anekivale 403 82 59 193 5 3 41 4 5 0 9 2
Koloa 142 31 23 55 3 0 23 0 2 0 5 0
Holeva 130 21 15 46 9 3 26 2 2 0 6 0
Leimatu'a 2,489 482 305 1,046 93 31 320 9 19 13 169 2
Leimatu'a 1,215 235 152 497 55 10 169 5 8 4 80 0
Holonga 387 83 52 145 9 4 49 3 3 8 29 2
Feletoa 363 58 35 158 11 12 54 1 5 0 29 0
Mataika 524 106 66 246 18 5 48 0 3 1 31 0
Hihifo 1,988 385 251 772 78 34 238 25 18 19 137 31
Longomapu 546 109 63 204 27 9 70 4 11 3 35 11

Tonga 2016 Census of Population and Housing
Tonga Statistics Department
159
Island/District/Region Total Head Spouse
Biological son/
daughter
Adopted son/
daughter Brother/
Sister Grandchild Parent
of Head
Parent of
Spouse Child of Spouse
Othe Relatives
No Relationship
Taoa 537 98 69 222 30 11 63 6 3 3 32 0
Tefisi 532 102 70 209 14 9 54 10 2 4 38 20
Vaimalo 112 23 19 52 0 0 13 1 0 1 3 0
Tu'anuku 261 53 30 85 7 5 38 4 2 8 29 0
Motu 721 172 122 259 26 16 84 4 3 0 29 6
Kapa 42 10 9 15 0 3 4 1 0 0 0 0
Falevai 79 20 14 30 2 0 7 0 0 0 6 0
Otea 96 23 15 35 2 0 14 0 0 0 7 0
Lape 24 5 4 14 1 0 0 0 0 0 0 0
Matamaka 79 23 15 32 1 2 3 1 1 0 0 1
Nuapapu 98 23 20 35 2 0 15 0 0 0 1 2
Ovaka 97 20 11 26 10 2 21 2 1 0 4 0
Taunga 28 9 3 9 1 1 2 0 0 0 3 0
Hunga 178 39 31 63 7 8 18 0 1 0 8 3
Foeata Island 0 0 0 0 0 0 0 0 0 0 0 0
Ha'apai 6,085 1,179 802 2,364 267 111 717 44 43 64 367 127
Pangai 2,187 433 288 838 114 52 205 20 12 16 158 51
Pangai 1,071 214 139 430 53 26 101 7 7 5 62 27
Hihifo 784 159 108 284 49 18 73 6 3 9 56 19
Holopeka 126 22 16 46 5 1 19 3 0 0 14 0
Koulo 206 38 25 78 7 7 12 4 2 2 26 5
Foa 1,383 236 175 573 58 8 207 6 13 20 67 20
Fangale'ounga 140 24 17 63 5 1 23 0 0 0 7 0
Fotua 259 42 28 125 4 1 31 3 6 10 3 6
Lotofoa 413 70 53 161 12 2 72 1 3 2 35 2
faleloa 371 64 47 156 8 4 59 0 2 6 14 11
Ha'afakahenga 90 17 12 33 14 0 12 0 2 0 0 0
Ha'ateiho Si'i 110 19 18 35 15 0 10 2 0 2 8 1
Lulunga 923 184 132 361 32 16 121 4 1 15 36 21
Ha'afeva island 297 57 43 110 12 4 49 0 1 6 9 6
Tungua 187 37 31 75 8 4 21 1 0 7 1 2
Fotuha'a 105 19 13 37 6 0 16 1 0 0 0 13
'O'ua 116 25 13 46 4 2 20 0 0 0 6 0
Matuku 89 16 13 48 0 1 7 0 0 0 4 0
Kotu 129 30 19 45 2 5 8 2 0 2 16 0
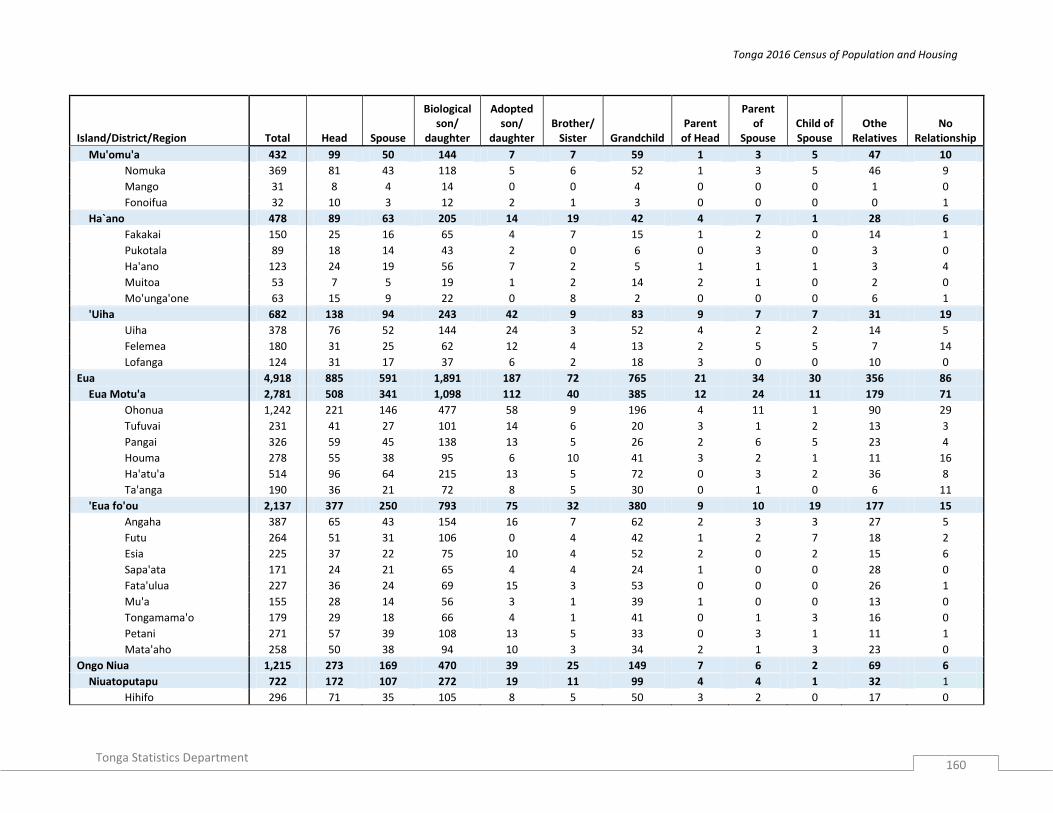
Tonga 2016 Census of Population and Housing
Tonga Statistics Department
160
Island/District/Region Total Head Spouse
Biological son/
daughter
Adopted son/
daughter Brother/
Sister Grandchild Parent
of Head
Parent of
Spouse Child of Spouse
Othe Relatives
No Relationship
Mu'omu'a 432 99 50 144 7 7 59 1 3 5 47 10
Nomuka 369 81 43 118 5 6 52 1 3 5 46 9
Mango 31 8 4 14 0 0 4 0 0 0 1 0
Fonoifua 32 10 3 12 2 1 3 0 0 0 0 1
Ha`ano 478 89 63 205 14 19 42 4 7 1 28 6
Fakakai 150 25 16 65 4 7 15 1 2 0 14 1
Pukotala 89 18 14 43 2 0 6 0 3 0 3 0
Ha'ano 123 24 19 56 7 2 5 1 1 1 3 4
Muitoa 53 7 5 19 1 2 14 2 1 0 2 0
Mo'unga'one 63 15 9 22 0 8 2 0 0 0 6 1
'Uiha 682 138 94 243 42 9 83 9 7 7 31 19
Uiha 378 76 52 144 24 3 52 4 2 2 14 5
Felemea 180 31 25 62 12 4 13 2 5 5 7 14
Lofanga 124 31 17 37 6 2 18 3 0 0 10 0
Eua 4,918 885 591 1,891 187 72 765 21 34 30 356 86
Eua Motu'a 2,781 508 341 1,098 112 40 385 12 24 11 179 71
Ohonua 1,242 221 146 477 58 9 196 4 11 1 90 29
Tufuvai 231 41 27 101 14 6 20 3 1 2 13 3
Pangai 326 59 45 138 13 5 26 2 6 5 23 4
Houma 278 55 38 95 6 10 41 3 2 1 11 16
Ha'atu'a 514 96 64 215 13 5 72 0 3 2 36 8
Ta'anga 190 36 21 72 8 5 30 0 1 0 6 11
'Eua fo'ou 2,137 377 250 793 75 32 380 9 10 19 177 15
Angaha 387 65 43 154 16 7 62 2 3 3 27 5
Futu 264 51 31 106 0 4 42 1 2 7 18 2
Esia 225 37 22 75 10 4 52 2 0 2 15 6
Sapa'ata 171 24 21 65 4 4 24 1 0 0 28 0
Fata'ulua 227 36 24 69 15 3 53 0 0 0 26 1
Mu'a 155 28 14 56 3 1 39 1 0 0 13 0
Tongamama'o 179 29 18 66 4 1 41 0 1 3 16 0
Petani 271 57 39 108 13 5 33 0 3 1 11 1
Mata'aho 258 50 38 94 10 3 34 2 1 3 23 0
Ongo Niua 1,215 273 169 470 39 25 149 7 6 2 69 6
Niuatoputapu 722 172 107 272 19 11 99 4 4 1 32 1
Hihifo 296 71 35 105 8 5 50 3 2 0 17 0
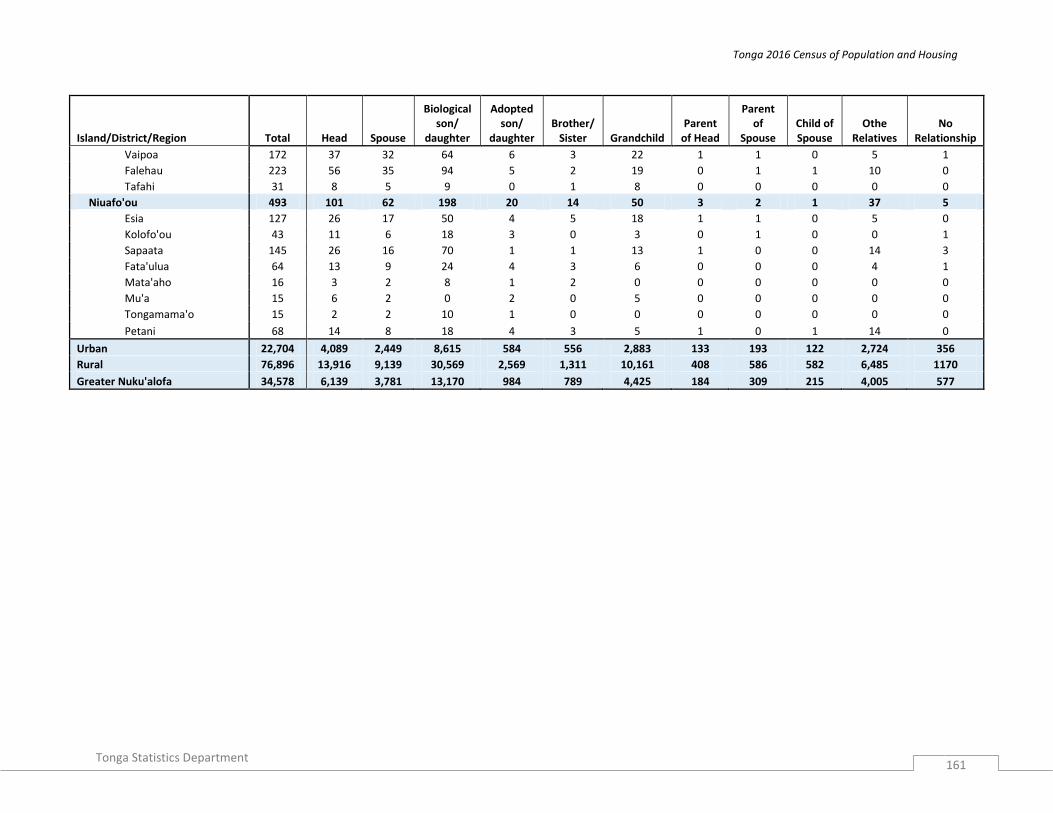
Tonga 2016 Census of Population and Housing
Tonga Statistics Department
161
Island/District/Region Total Head Spouse
Biological son/
daughter
Adopted son/
daughter Brother/
Sister Grandchild Parent
of Head
Parent of
Spouse Child of Spouse
Othe Relatives
No Relationship
Vaipoa 172 37 32 64 6 3 22 1 1 0 5 1
Falehau 223 56 35 94 5 2 19 0 1 1 10 0
Tafahi 31 8 5 9 0 1 8 0 0 0 0 0
Niuafo'ou 493 101 62 198 20 14 50 3 2 1 37 5
Esia 127 26 17 50 4 5 18 1 1 0 5 0
Kolofo'ou 43 11 6 18 3 0 3 0 1 0 0 1
Sapaata 145 26 16 70 1 1 13 1 0 0 14 3
Fata'ulua 64 13 9 24 4 3 6 0 0 0 4 1
Mata'aho 16 3 2 8 1 2 0 0 0 0 0 0
Mu'a 15 6 2 0 2 0 5 0 0 0 0 0
Tongamama'o 15 2 2 10 1 0 0 0 0 0 0 0
Petani 68 14 8 18 4 3 5 1 0 1 14 0
Urban 22,704 4,089 2,449 8,615 584 556 2,883 133 193 122 2,724 356
Rural 76,896 13,916 9,139 30,569 2,569 1,311 10,161 408 586 582 6,485 1170
Greater Nuku'alofa 34,578 6,139 3,781 13,170 984 789 4,425 184 309 215 4,005 577
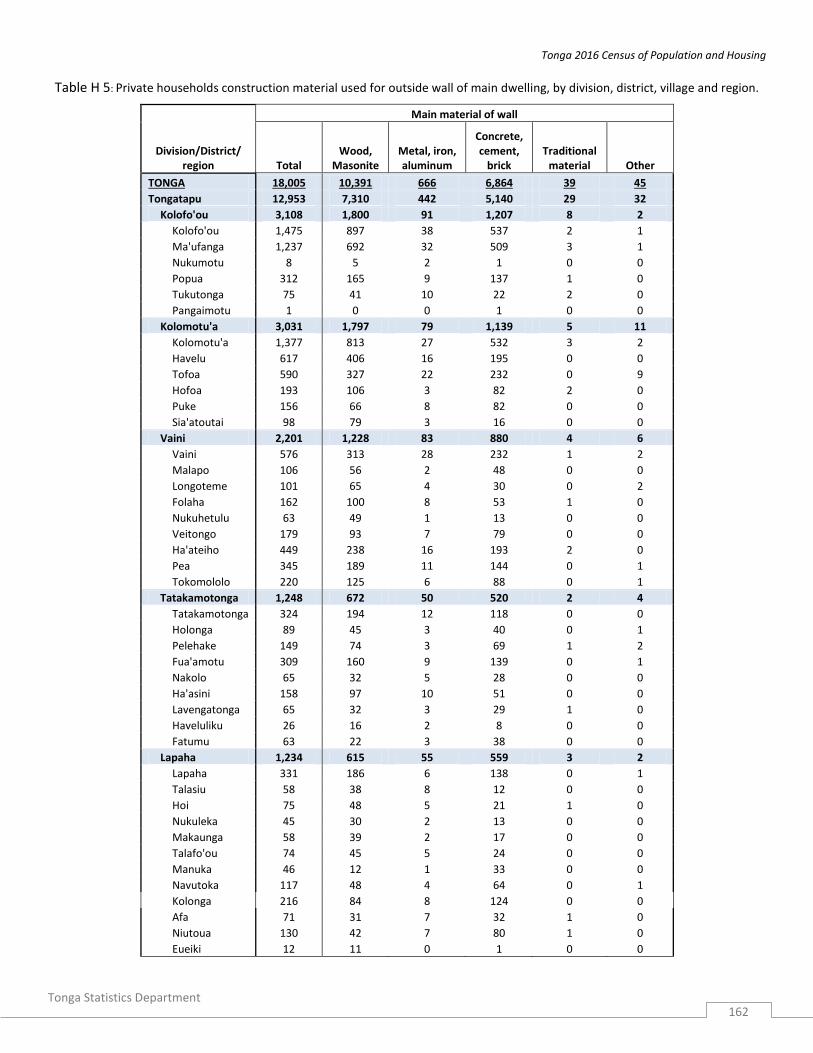
Tonga 2016 Census of Population and Housing
Tonga Statistics Department
162
Table H 5: Private households construction material used for outside wall of main dwelling, by division, district, village and region.
Division/District/ region
Main material of wall
Total Wood,
Masonite Metal, iron, aluminum
Concrete, cement,
brick Traditional
material Other
TONGA 18,005 10,391 666 6,864 39 45
Tongatapu 12,953 7,310 442 5,140 29 32
Kolofo'ou 3,108 1,800 91 1,207 8 2
Kolofo'ou 1,475 897 38 537 2 1
Ma'ufanga 1,237 692 32 509 3 1
Nukumotu 8 5 2 1 0 0
Popua 312 165 9 137 1 0
Tukutonga 75 41 10 22 2 0
Pangaimotu 1 0 0 1 0 0
Kolomotu'a 3,031 1,797 79 1,139 5 11
Kolomotu'a 1,377 813 27 532 3 2
Havelu 617 406 16 195 0 0
Tofoa 590 327 22 232 0 9
Hofoa 193 106 3 82 2 0
Puke 156 66 8 82 0 0
Sia'atoutai 98 79 3 16 0 0
Vaini 2,201 1,228 83 880 4 6
Vaini 576 313 28 232 1 2
Malapo 106 56 2 48 0 0
Longoteme 101 65 4 30 0 2
Folaha 162 100 8 53 1 0
Nukuhetulu 63 49 1 13 0 0
Veitongo 179 93 7 79 0 0
Ha'ateiho 449 238 16 193 2 0
Pea 345 189 11 144 0 1
Tokomololo 220 125 6 88 0 1
Tatakamotonga 1,248 672 50 520 2 4
Tatakamotonga 324 194 12 118 0 0
Holonga 89 45 3 40 0 1
Pelehake 149 74 3 69 1 2
Fua'amotu 309 160 9 139 0 1
Nakolo 65 32 5 28 0 0
Ha'asini 158 97 10 51 0 0
Lavengatonga 65 32 3 29 1 0
Haveluliku 26 16 2 8 0 0
Fatumu 63 22 3 38 0 0
Lapaha 1,234 615 55 559 3 2
Lapaha 331 186 6 138 0 1
Talasiu 58 38 8 12 0 0
Hoi 75 48 5 21 1 0
Nukuleka 45 30 2 13 0 0
Makaunga 58 39 2 17 0 0
Talafo'ou 74 45 5 24 0 0
Manuka 46 12 1 33 0 0
Navutoka 117 48 4 64 0 1
Kolonga 216 84 8 124 0 0
Afa 71 31 7 32 1 0
Niutoua 130 42 7 80 1 0
Eueiki 12 11 0 1 0 0

Tonga 2016 Census of Population and Housing
Tonga Statistics Department
163
Division/District/ region
Main material of wall
Total Wood,
Masonite Metal, iron, aluminum
Concrete, cement,
brick Traditional
material Other
Fukave 1 1 0 0 0 0
Nukunuku 1,391 749 59 571 7 5
NUkunuku 370 226 14 124 4 2
Matahau 105 66 3 36 0 0
Matafonua 45 21 1 22 0 1
Fatai 59 44 0 15 0 0
Lakepa 54 45 4 5 0 0
Vaotu'u 81 47 3 31 0 0
Utulau 98 36 4 58 0 0
Ha'alalo 103 45 4 53 1 0
Ha'akame 116 42 9 63 1 1
Houma 360 177 17 164 1 1
Kolovai 740 449 25 264 0 2
Kolovai 118 76 5 36 0 1
Te'ekiu 104 58 6 40 0 0
Masilamea 34 22 1 11 0 0
Fahefa 71 43 0 28 0 0
Ha'utu 39 17 3 19 0 0
Kala'au 26 15 1 10 0 0
Fo'ui 104 59 4 41 0 0
Ha'avakatolo 40 32 1 7 0 0
Ahau 61 38 2 21 0 0
Kanokupolu 65 36 1 28 0 0
Ha'atafu 47 28 0 18 0 1
Atata 31 25 1 5 0 0
Vava'u 2,715 1,516 122 1,063 7 7
Neiafu 1,041 566 25 445 1 4
Neiafu 743 373 18 349 0 3
Makave 72 49 1 22 0 0
Toula 83 46 3 33 1 0
Utui 55 40 3 12 0 0
Ofu 26 18 0 8 0 0
Okoa 48 30 0 18 0 0
Olo'ua 14 10 0 3 0 1
Pangaimotu 232 122 10 97 2 1
Pangaimotu 125 59 7 57 2 0
Utulei 24 12 1 11 0 0
Nga'unoho 27 14 0 13 0 0
Utungake 56 37 2 16 0 1
Hahake 403 220 19 161 3 0
Ha'alaufuli 84 44 0 40 0 0
Ha'akio 23 9 0 14 0 0
Houma 17 12 0 5 0 0
Mangia 17 14 0 3 0 0
Ta'anea 128 52 15 60 1 0
Tu'anekivale 82 62 3 16 1 0
Koloa 31 21 1 8 1 0
Holeva 21 6 0 15 0 0
Leimatu'a 482 260 29 193 0 0
Leimatu'a 235 131 16 88 0 0
Holonga 83 38 4 41 0 0

Tonga 2016 Census of Population and Housing
Tonga Statistics Department
164
Division/District/ region
Main material of wall
Total Wood,
Masonite Metal, iron, aluminum
Concrete, cement,
brick Traditional
material Other
Feletoa 58 33 1 24 0 0
Mataika 106 58 8 40 0 0
Hihifo 385 218 31 135 0 1
Longomapu 109 58 12 39 0 0
Taoa 98 59 7 32 0 0
Tefisi 102 62 6 34 0 0
Vaimalo 23 11 5 7 0 0
Tu'anuku 53 28 1 23 0 1
Motu 172 130 8 32 1 1
Kapa 10 9 0 1 0 0
Falevai 20 16 0 4 0 0
Otea 23 10 2 11 0 0
Lape 5 4 1 0 0 0
Matamaka 23 15 1 7 0 0
Nuapapu 23 22 0 1 0 0
Ovaka 20 17 0 1 1 1
Taunga 9 6 0 3 0 0
Hunga 39 31 4 4 0 0
Foeata Island 0 0 0 0 0 0
Ha'apai 1,179 938 51 186 3 1
Pangai 433 343 16 73 1 0
Pangai 214 175 8 31 0 0
Hihifo 159 128 4 26 1 0
Holopeka 22 14 0 8 0 0
Koulo 38 26 4 8 0 0
Foa 236 164 15 57 0 0
Fangale'ounga 24 15 3 6 0 0
Fotua 42 36 1 5 0 0
Lotofoa 70 47 4 19 0 0
faleloa 64 35 5 24 0 0
Ha'afakahenga 17 15 1 1 0 0
Ha'ateiho Si'i 19 16 1 2 0 0
Lulunga 184 162 6 14 1 1
Ha'afeva island 57 50 1 5 1 0
Tungua 37 32 0 4 0 1
Fotuha'a 19 17 2 0 0 0
'O'ua 25 21 1 3 0 0
Matuku 16 13 2 1 0 0
Kotu 30 29 0 1 0 0
Mu'omu'a 99 80 4 15 0 0
Nomuka 81 65 4 12 0 0
Mango 8 8 0 0 0 0
Fonoifua 10 7 0 3 0 0
Ha`ano 89 71 5 13 0 0
Fakakai 25 21 0 4 0 0
Pukotala 18 13 3 2 0 0
Ha'ano 24 20 2 2 0 0
Muitoa 7 5 0 2 0 0
Mo'unga'one 15 12 0 3 0 0
'Uiha 138 118 5 14 1 0
Uiha 76 62 4 10 0 0
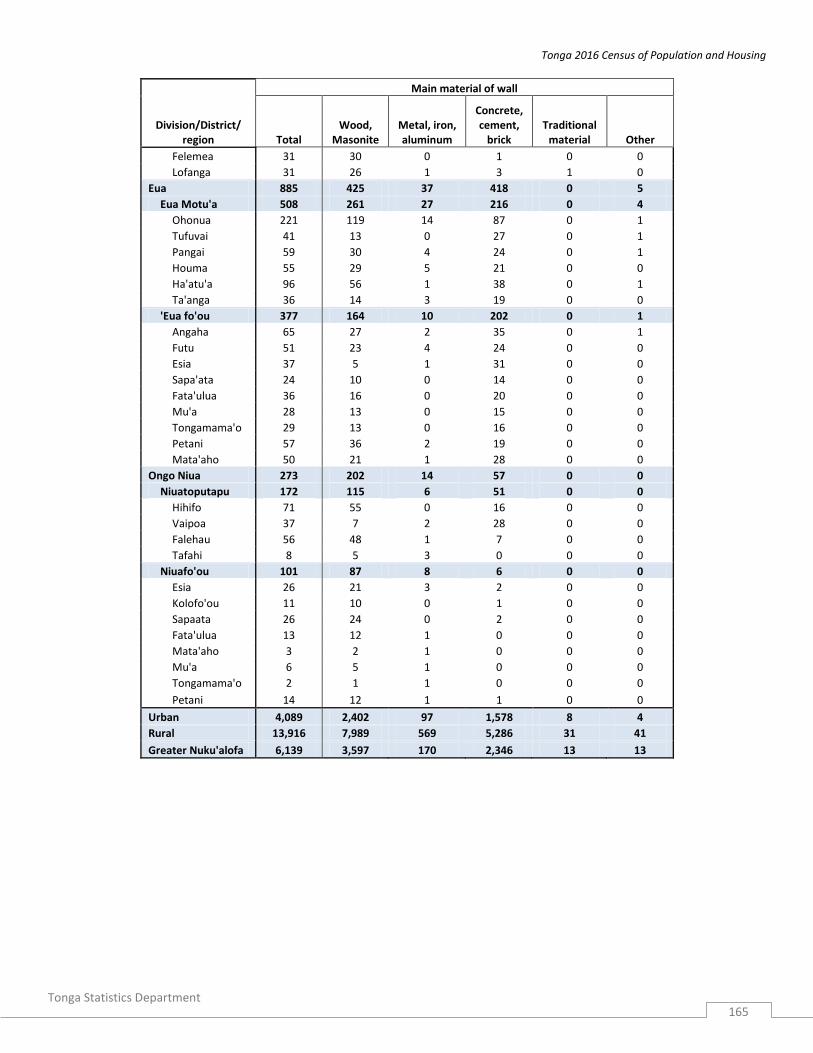
Tonga 2016 Census of Population and Housing
Tonga Statistics Department
165
Division/District/ region
Main material of wall
Total Wood,
Masonite Metal, iron, aluminum
Concrete, cement,
brick Traditional
material Other
Felemea 31 30 0 1 0 0
Lofanga 31 26 1 3 1 0
Eua 885 425 37 418 0 5
Eua Motu'a 508 261 27 216 0 4
Ohonua 221 119 14 87 0 1
Tufuvai 41 13 0 27 0 1
Pangai 59 30 4 24 0 1
Houma 55 29 5 21 0 0
Ha'atu'a 96 56 1 38 0 1
Ta'anga 36 14 3 19 0 0
'Eua fo'ou 377 164 10 202 0 1
Angaha 65 27 2 35 0 1
Futu 51 23 4 24 0 0
Esia 37 5 1 31 0 0
Sapa'ata 24 10 0 14 0 0
Fata'ulua 36 16 0 20 0 0
Mu'a 28 13 0 15 0 0
Tongamama'o 29 13 0 16 0 0
Petani 57 36 2 19 0 0
Mata'aho 50 21 1 28 0 0
Ongo Niua 273 202 14 57 0 0
Niuatoputapu 172 115 6 51 0 0
Hihifo 71 55 0 16 0 0
Vaipoa 37 7 2 28 0 0
Falehau 56 48 1 7 0 0
Tafahi 8 5 3 0 0 0
Niuafo'ou 101 87 8 6 0 0
Esia 26 21 3 2 0 0
Kolofo'ou 11 10 0 1 0 0
Sapaata 26 24 0 2 0 0
Fata'ulua 13 12 1 0 0 0
Mata'aho 3 2 1 0 0 0
Mu'a 6 5 1 0 0 0
Tongamama'o 2 1 1 0 0 0
Petani 14 12 1 1 0 0
Urban 4,089 2,402 97 1,578 8 4
Rural 13,916 7,989 569 5,286 31 41
Greater Nuku'alofa 6,139 3,597 170 2,346 13 13

Tonga 2016 Census of Population and Housing
Tonga Statistics Department
166
Table H 6: Private households’ construction material used for the roof and floor of main dwelling by division, district, village and region
Division/District/ region
Main material of roof Main material of Floor
Total Wood,
Masonite Metal, iron, aluminium
Concrete, cement,
bric Traditional
material Other Total Wood/
Masonite
Metal/ iron/
aluminium
Concrete/ cement/
bric Traditional
material Other
TONGA 18,005 453 17,365 128 42 17 18,005 2,997 123 14,628 210 47
Tongatapu 12,953 329 12,492 95 28 9 12,953 1,766 83 10,929 142 33
Kolofo'ou 3,108 119 2,943 34 10 2 3,108 475 20 2,595 14 4
Kolofo'ou 1,475 77 1,377 19 1 1 1,475 293 5 1,173 1 3
Ma'ufanga 1,237 27 1,193 12 4 1 1,237 133 5 1,093 5 1
Nukumotu 8 0 6 0 2 0 8 5 0 2 1 0
Popua 312 10 299 2 1 0 312 29 4 278 1 0
Tukutonga 75 5 67 1 2 0 75 15 6 48 6 0
Pangaimotu 1 0 1 0 0 0 1 0 0 1 0 0
Kolomotu'a 3,031 65 2,939 21 5 1 3,031 474 19 2,510 19 9
Kolomotu'a 1,377 44 1,319 11 2 1 1,377 238 12 1,120 6 1
Havelu 617 11 601 5 0 0 617 109 2 498 1 7
Tofoa 590 4 584 1 1 0 590 71 3 513 3 0
Hofoa 193 3 189 1 0 0 193 28 0 158 7 0
Puke 156 0 152 2 2 0 156 25 0 128 2 1
Sia'atoutai 98 3 94 1 0 0 98 3 2 93 0 0
Vaini 2,201 30 2,152 14 4 1 2,201 266 16 1,888 29 2
Vaini 576 12 560 2 2 0 576 91 6 469 10 0
Malapo 106 0 106 0 0 0 106 16 2 88 0 0
Longoteme 101 1 100 0 0 0 101 13 0 87 1 0
Folaha 162 1 158 2 1 0 162 11 1 145 5 0
Nukuhetulu 63 2 61 0 0 0 63 7 0 56 0 0
Veitongo 179 2 174 3 0 0 179 9 3 166 1 0
Ha'ateiho 449 11 435 3 0 0 449 64 3 381 1 0
Pea 345 1 341 3 0 0 345 42 1 297 5 0
Tokomololo 220 0 217 1 1 1 220 13 0 199 6 2
Tatakamotonga 1,248 24 1,214 7 2 1 1,248 164 13 1,042 24 5
Tatakamotong 324 6 315 3 0 0 324 42 4 274 2 2
Holonga 89 1 88 0 0 0 89 10 1 77 1 0
Pelehake 149 2 147 0 0 0 149 14 1 131 1 2
Fua'amotu 309 7 299 3 0 0 309 52 2 254 0 1
Nakolo 65 0 65 0 0 0 65 3 1 61 0 0

Tonga 2016 Census of Population and Housing
Tonga Statistics Department
167
Division/District/ region
Main material of roof Main material of Floor
Total Wood,
Masonite Metal, iron, aluminium
Concrete, cement,
bric Traditional
material Other Total Wood/
Masonite
Metal/ iron/
aluminium
Concrete/ cement/
bric Traditional
material Other
Ha'asini 158 2 155 0 0 1 158 28 1 111 18 0
Lavengatonga 65 3 61 0 1 0 65 11 3 50 1 0
Haveluliku 26 3 22 0 1 0 26 0 0 25 1 0
Fatumu 63 0 62 1 0 0 63 4 0 59 0 0
Lapaha 1,234 11 1,215 5 3 0 1,234 128 6 1,073 24 3
Lapaha 331 5 325 1 0 0 331 50 2 278 1 0
Talasiu 58 0 58 0 0 0 58 5 0 45 7 1
Hoi 75 1 71 1 2 0 75 7 0 65 3 0
Nukuleka 45 1 44 0 0 0 45 2 0 43 0 0
Makaunga 58 0 58 0 0 0 58 10 0 45 3 0
Talafo'ou 74 0 74 0 0 0 74 7 0 67 0 0
Manuka 46 0 46 0 0 0 46 1 1 44 0 0
Navutoka 117 1 115 1 0 0 117 11 3 103 0 0
Kolonga 216 0 216 0 0 0 216 24 0 188 4 0
Afa 71 0 69 1 1 0 71 4 0 63 3 1
Niutoua 130 2 127 1 0 0 130 6 0 120 3 1
Eueiki 12 1 11 0 0 0 12 1 0 11 0 0
Fukave 1 0 1 0 0 0 1 0 0 1 0 0
Nukunuku 1,391 67 1,305 12 4 3 1,391 142 5 1,210 26 8
NUkunuku 370 4 364 0 0 2 370 64 1 299 6 0
Matahau 105 0 105 0 0 0 105 9 1 95 0 0
Matafonua 45 1 43 1 0 0 45 4 0 40 0 1
Fatai 59 2 57 0 0 0 59 9 0 50 0 0
Lakepa 54 2 52 0 0 0 54 5 0 49 0 0
Vaotu'u 81 0 79 0 1 1 81 12 0 62 7 0
Utulau 98 1 96 1 0 0 98 4 0 94 0 0
Ha'alalo 103 1 99 2 1 0 103 2 1 98 2 0
Ha'akame 116 0 115 0 1 0 116 3 0 106 5 2
Houma 360 56 295 8 1 0 360 30 2 317 6 5
Kolovai 740 13 724 2 0 1 740 117 4 611 6 2
Kolovai 118 3 113 1 0 1 118 33 0 84 0 1
Te'ekiu 104 0 104 0 0 0 104 9 0 90 4 1
Masilamea 34 0 34 0 0 0 34 2 0 32 0 0

Tonga 2016 Census of Population and Housing
Tonga Statistics Department
168
Division/District/ region
Main material of roof Main material of Floor
Total Wood,
Masonite Metal, iron, aluminium
Concrete, cement,
bric Traditional
material Other Total Wood/
Masonite
Metal/ iron/
aluminium
Concrete/ cement/
bric Traditional
material Other
Fahefa 71 2 69 0 0 0 71 10 0 61 0 0
Ha'utu 39 1 37 1 0 0 39 5 0 33 1 0
Kala'au 26 1 25 0 0 0 26 4 0 22 0 0
Fo'ui 104 1 103 0 0 0 104 16 0 87 1 0
Ha'avakatolo 40 5 35 0 0 0 40 7 2 31 0 0
Ahau 61 0 61 0 0 0 61 14 1 46 0 0
Kanokupolu 65 0 65 0 0 0 65 7 0 58 0 0
Ha'atafu 47 0 47 0 0 0 47 3 1 43 0 0
Atata 31 0 31 0 0 0 31 7 0 24 0 0
Vava'u 2,715 79 2,595 25 12 4 2,715 600 25 2,053 35 2
Neiafu 1,041 32 995 13 0 1 1,041 197 9 829 5 1
Neiafu 743 26 705 11 0 1 743 123 7 608 5 0
Makave 72 0 71 1 0 0 72 12 0 60 0 0
Toula 83 1 82 0 0 0 83 15 2 65 0 1
Utui 55 4 51 0 0 0 55 13 0 42 0 0
Ofu 26 0 26 0 0 0 26 8 0 18 0 0
Okoa 48 1 46 1 0 0 48 22 0 26 0 0
Olo'ua 14 0 14 0 0 0 14 4 0 10 0 0
Pangaimotu 232 8 221 0 3 0 232 34 4 188 5 1
Pangaimotu 125 1 121 0 3 0 125 19 1 100 5 0
Utulei 24 1 23 0 0 0 24 1 0 23 0 0
Nga'unoho 27 0 27 0 0 0 27 6 0 21 0 0
Utungake 56 6 50 0 0 0 56 8 3 44 0 1
Hahake 403 8 385 4 4 2 403 79 2 313 9 0
Ha'alaufuli 84 5 79 0 0 0 84 12 0 72 0 0
Ha'akio 23 0 22 1 0 0 23 3 0 20 0 0
Houma 17 1 15 1 0 0 17 4 0 13 0 0
Mangia 17 1 14 2 0 0 17 7 1 9 0 0
Ta'anea 128 1 122 0 4 1 128 25 0 95 8 0
Tu'anekivale 82 0 82 0 0 0 82 21 1 60 0 0
Koloa 31 0 30 0 0 1 31 6 0 24 1 0
Holeva 21 0 21 0 0 0 21 1 0 20 0 0
Leimatu'a 482 25 451 4 2 0 482 109 4 364 5 0
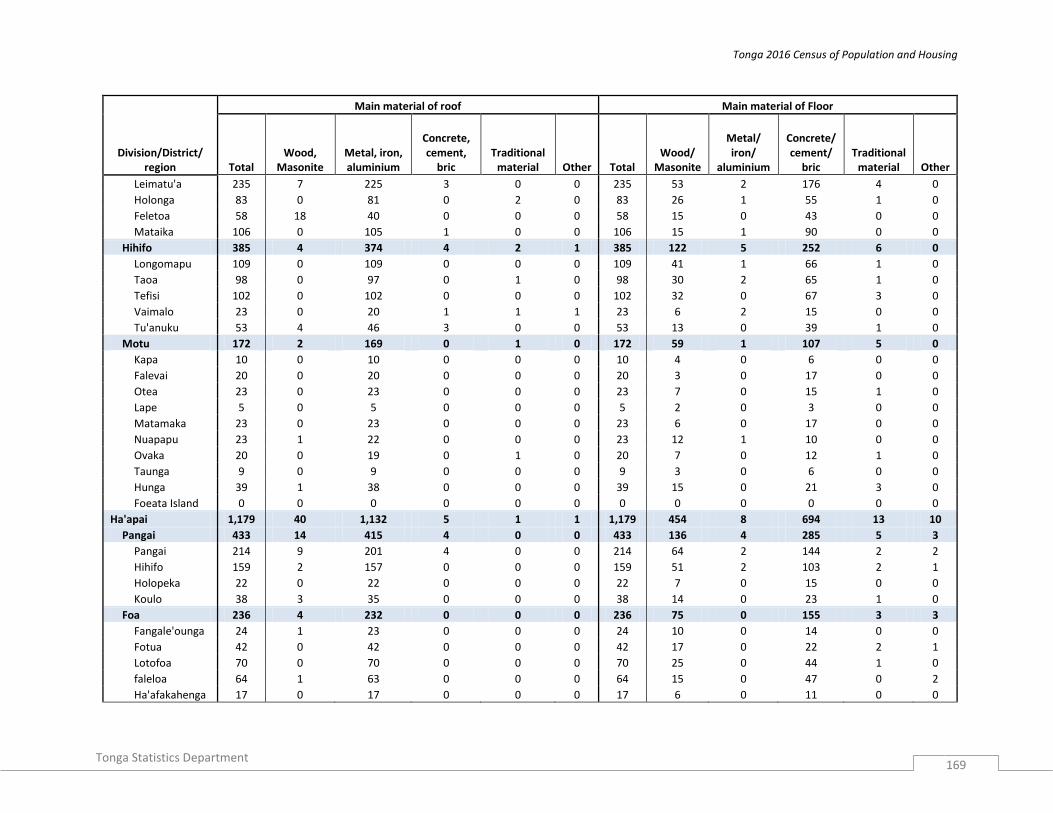
Tonga 2016 Census of Population and Housing
Tonga Statistics Department
169
Division/District/ region
Main material of roof Main material of Floor
Total Wood,
Masonite Metal, iron, aluminium
Concrete, cement,
bric Traditional
material Other Total Wood/
Masonite
Metal/ iron/
aluminium
Concrete/ cement/
bric Traditional
material Other
Leimatu'a 235 7 225 3 0 0 235 53 2 176 4 0
Holonga 83 0 81 0 2 0 83 26 1 55 1 0
Feletoa 58 18 40 0 0 0 58 15 0 43 0 0
Mataika 106 0 105 1 0 0 106 15 1 90 0 0
Hihifo 385 4 374 4 2 1 385 122 5 252 6 0
Longomapu 109 0 109 0 0 0 109 41 1 66 1 0
Taoa 98 0 97 0 1 0 98 30 2 65 1 0
Tefisi 102 0 102 0 0 0 102 32 0 67 3 0
Vaimalo 23 0 20 1 1 1 23 6 2 15 0 0
Tu'anuku 53 4 46 3 0 0 53 13 0 39 1 0
Motu 172 2 169 0 1 0 172 59 1 107 5 0
Kapa 10 0 10 0 0 0 10 4 0 6 0 0
Falevai 20 0 20 0 0 0 20 3 0 17 0 0
Otea 23 0 23 0 0 0 23 7 0 15 1 0
Lape 5 0 5 0 0 0 5 2 0 3 0 0
Matamaka 23 0 23 0 0 0 23 6 0 17 0 0
Nuapapu 23 1 22 0 0 0 23 12 1 10 0 0
Ovaka 20 0 19 0 1 0 20 7 0 12 1 0
Taunga 9 0 9 0 0 0 9 3 0 6 0 0
Hunga 39 1 38 0 0 0 39 15 0 21 3 0
Foeata Island 0 0 0 0 0 0 0 0 0 0 0 0
Ha'apai 1,179 40 1,132 5 1 1 1,179 454 8 694 13 10
Pangai 433 14 415 4 0 0 433 136 4 285 5 3
Pangai 214 9 201 4 0 0 214 64 2 144 2 2
Hihifo 159 2 157 0 0 0 159 51 2 103 2 1
Holopeka 22 0 22 0 0 0 22 7 0 15 0 0
Koulo 38 3 35 0 0 0 38 14 0 23 1 0
Foa 236 4 232 0 0 0 236 75 0 155 3 3
Fangale'ounga 24 1 23 0 0 0 24 10 0 14 0 0
Fotua 42 0 42 0 0 0 42 17 0 22 2 1
Lotofoa 70 0 70 0 0 0 70 25 0 44 1 0
faleloa 64 1 63 0 0 0 64 15 0 47 0 2
Ha'afakahenga 17 0 17 0 0 0 17 6 0 11 0 0

Tonga 2016 Census of Population and Housing
Tonga Statistics Department
170
Division/District/ region
Main material of roof Main material of Floor
Total Wood,
Masonite Metal, iron, aluminium
Concrete, cement,
bric Traditional
material Other Total Wood/
Masonite
Metal/ iron/
aluminium
Concrete/ cement/
bric Traditional
material Other
Ha'ateiho Si'i 19 2 17 0 0 0 19 2 0 17 0 0
Lulunga 184 18 164 1 1 0 184 79 1 99 2 3
Ha'afeva island 57 1 55 0 1 0 57 23 0 33 1 0
Tungua 37 15 22 0 0 0 37 4 0 30 0 3
Fotuha'a 19 0 19 0 0 0 19 10 0 8 1 0
'O'ua 25 0 25 0 0 0 25 14 0 11 0 0
Matuku 16 1 14 1 0 0 16 13 1 2 0 0
Kotu 30 1 29 0 0 0 30 15 0 15 0 0
Mu'omu'a 99 0 98 0 0 1 99 55 0 44 0 0
Nomuka 81 0 80 0 0 1 81 47 0 34 0 0
Mango 8 0 8 0 0 0 8 5 0 3 0 0
Fonoifua 10 0 10 0 0 0 10 3 0 7 0 0
Ha`ano 89 2 87 0 0 0 89 41 2 44 1 1
Fakakai 25 0 25 0 0 0 25 13 0 11 1 0
Pukotala 18 1 17 0 0 0 18 7 0 10 0 1
Ha'ano 24 1 23 0 0 0 24 10 0 14 0 0
Muitoa 7 0 7 0 0 0 7 3 0 4 0 0
Mo'unga'one 15 0 15 0 0 0 15 8 2 5 0 0
'Uiha 138 2 136 0 0 0 138 68 1 67 2 0
Uiha 76 2 74 0 0 0 76 30 1 44 1 0
Felemea 31 0 31 0 0 0 31 17 0 14 0 0
Lofanga 31 0 31 0 0 0 31 21 0 9 1 0
Eua 885 0 879 3 0 3 885 87 1 776 19 2
Eua Motu'a 508 0 505 2 0 1 508 57 0 441 8 2
Ohonua 221 0 220 1 0 0 221 28 0 186 5 2
Tufuvai 41 0 41 0 0 0 41 4 0 37 0 0
Pangai 59 0 59 0 0 0 59 4 0 55 0 0
Houma 55 0 55 0 0 0 55 8 0 46 1 0
Ha'atu'a 96 0 95 0 0 1 96 9 0 85 2 0
Ta'anga 36 0 35 1 0 0 36 4 0 32 0 0
'Eua fo'ou 377 0 374 1 0 2 377 30 1 335 11 0
Angaha 65 0 65 0 0 0 65 7 0 58 0 0
Futu 51 0 49 0 0 2 51 6 1 41 3 0
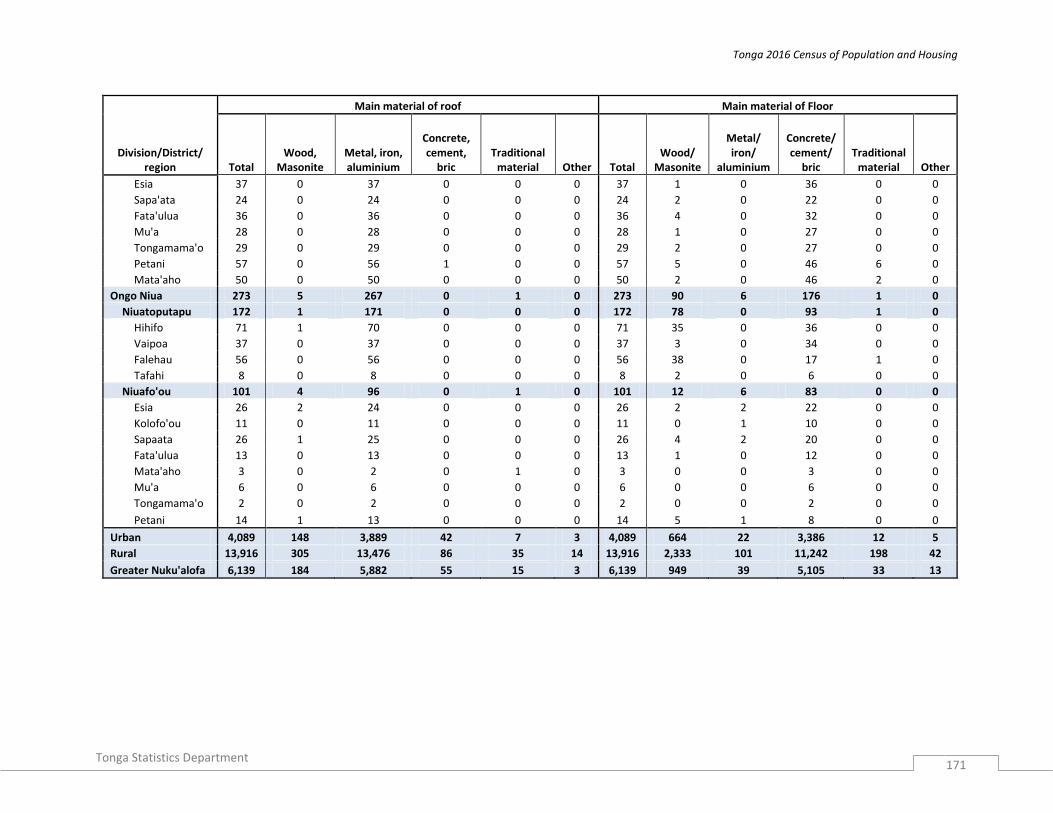
Tonga 2016 Census of Population and Housing
Tonga Statistics Department
171
Division/District/ region
Main material of roof Main material of Floor
Total Wood,
Masonite Metal, iron, aluminium
Concrete, cement,
bric Traditional
material Other Total Wood/
Masonite
Metal/ iron/
aluminium
Concrete/ cement/
bric Traditional
material Other
Esia 37 0 37 0 0 0 37 1 0 36 0 0
Sapa'ata 24 0 24 0 0 0 24 2 0 22 0 0
Fata'ulua 36 0 36 0 0 0 36 4 0 32 0 0
Mu'a 28 0 28 0 0 0 28 1 0 27 0 0
Tongamama'o 29 0 29 0 0 0 29 2 0 27 0 0
Petani 57 0 56 1 0 0 57 5 0 46 6 0
Mata'aho 50 0 50 0 0 0 50 2 0 46 2 0
Ongo Niua 273 5 267 0 1 0 273 90 6 176 1 0
Niuatoputapu 172 1 171 0 0 0 172 78 0 93 1 0
Hihifo 71 1 70 0 0 0 71 35 0 36 0 0
Vaipoa 37 0 37 0 0 0 37 3 0 34 0 0
Falehau 56 0 56 0 0 0 56 38 0 17 1 0
Tafahi 8 0 8 0 0 0 8 2 0 6 0 0
Niuafo'ou 101 4 96 0 1 0 101 12 6 83 0 0
Esia 26 2 24 0 0 0 26 2 2 22 0 0
Kolofo'ou 11 0 11 0 0 0 11 0 1 10 0 0
Sapaata 26 1 25 0 0 0 26 4 2 20 0 0
Fata'ulua 13 0 13 0 0 0 13 1 0 12 0 0
Mata'aho 3 0 2 0 1 0 3 0 0 3 0 0
Mu'a 6 0 6 0 0 0 6 0 0 6 0 0
Tongamama'o 2 0 2 0 0 0 2 0 0 2 0 0
Petani 14 1 13 0 0 0 14 5 1 8 0 0
Urban 4,089 148 3,889 42 7 3 4,089 664 22 3,386 12 5
Rural 13,916 305 13,476 86 35 14 13,916 2,333 101 11,242 198 42
Greater Nuku'alofa 6,139 184 5,882 55 15 3 6,139 949 39 5,105 33 13

Tonga 2016 Census of Population and Housing
Tonga Statistics Department
172
Table H 7: Private households source of drinking water and water apart from drinking water by division, district, village and region
Division/District/ region
Main source of drinking water Main source of water for cooking
Total
Piped water supply
Own cement or other
Neighbor / community
Bottled water
Boiled water Other Total
Piped water supply
Cement or other
tank Own well Other
TONGA 18,005 1,799 10,890 3,537 1,713 34 32 18,005 15,892 1,961 100 52
Tongatapu 12,953 1,458 7,096 2,683 1,661 30 25 12,953 12,080 776 62 35
Kolofo'ou 3,108 358 1,713 464 555 10 8 3,108 2,880 208 15 5
Kolofo'ou 1,475 158 769 171 366 7 4 1,475 1,380 94 0 1
Ma'ufanga 1,237 160 698 210 162 3 4 1,237 1,135 86 14 2
Nukumotu 8 0 7 1 0 0 0 8 0 8 0 0
Popua 312 20 201 64 27 0 0 312 297 12 1 2
Tukutonga 75 20 37 18 0 0 0 75 68 7 0 0
Pangaimotu 1 0 1 0 0 0 0 1 0 1 0 0
Kolomotu'a 3,031 363 1,587 509 557 8 7 3,031 2,768 229 23 11
Kolomotu'a 1,377 181 720 203 263 6 4 1,377 1,260 110 3 4
Havelu 617 53 305 102 155 1 1 617 555 60 0 2
Tofoa 590 102 323 70 94 1 0 590 552 36 0 2
Hofoa 193 10 113 48 22 0 0 193 187 6 0 0
Puke 156 6 90 46 12 0 2 156 119 15 19 3
Sia'atoutai 98 11 36 40 11 0 0 98 95 2 1 0
Vaini 2,201 235 1,179 541 238 5 3 2,201 2,058 118 14 11
Vaini 576 42 320 130 79 3 2 576 503 63 6 4
Malapo 106 5 72 18 11 0 0 106 101 5 0 0
Longoteme 101 1 43 54 3 0 0 101 99 1 0 1
Folaha 162 3 102 48 9 0 0 162 152 7 2 1
Nukuhetulu 63 10 31 20 2 0 0 63 63 0 0 0
Veitongo 179 98 48 18 15 0 0 179 177 1 1 0
Ha'ateiho 449 16 289 98 46 0 0 449 426 22 0 1
Pea 345 47 164 91 41 2 0 345 331 11 2 1
Tokomololo 220 13 110 64 32 0 1 220 206 8 3 3
Tatakamotonga 1,248 171 677 313 81 2 4 1,248 1,182 60 3 3
Tatakamotonga 324 20 195 89 18 1 1 324 308 13 0 3
Holonga 89 13 52 12 9 0 3 89 82 7 0 0
Pelehake 149 4 96 42 7 0 0 149 143 6 0 0
Fua'amotu 309 73 152 64 19 1 0 309 285 21 3 0
Nakolo 65 6 19 22 18 0 0 65 65 0 0 0

Tonga 2016 Census of Population and Housing
Tonga Statistics Department
173
Division/District/ region
Main source of drinking water Main source of water for cooking
Total
Piped water supply
Own cement or other
Neighbor / community
Bottled water
Boiled water Other Total
Piped water supply
Cement or other
tank Own well Other
Ha'asini 158 32 72 47 7 0 0 158 155 3 0 0
Lavengatonga 65 15 34 15 1 0 0 65 59 6 0 0
Haveluliku 26 0 18 8 0 0 0 26 26 0 0 0
Fatumu 63 8 39 14 2 0 0 63 59 4 0 0
Lapaha 1,234 96 791 303 40 2 2 1,234 1,175 56 3 0
Lapaha 331 21 240 53 17 0 0 331 320 10 1 0
Talasiu 58 8 24 25 1 0 0 58 57 1 0 0
Hoi 75 4 25 40 6 0 0 75 74 0 1 0
Nukuleka 45 2 33 10 0 0 0 45 45 0 0 0
Makaunga 58 19 32 7 0 0 0 58 57 1 0 0
Talafo'ou 74 1 59 10 2 0 2 74 74 0 0 0
Manuka 46 0 35 10 1 0 0 46 46 0 0 0
Navutoka 117 0 94 20 2 1 0 117 113 4 0 0
Kolonga 216 5 131 71 8 1 0 216 208 7 1 0
Afa 71 2 28 41 0 0 0 71 70 1 0 0
Niutoua 130 34 77 16 3 0 0 130 106 24 0 0
Eueiki 12 0 12 0 0 0 0 12 5 7 0 0
Fukave 1 0 1 0 0 0 0 1 0 1 0 0
Nukunuku 1,391 175 671 387 155 2 1 1,391 1,346 40 4 1
NUkunuku 370 46 217 82 23 1 1 370 357 13 0 0
Matahau 105 7 29 59 10 0 0 105 104 1 0 0
Matafonua 45 6 22 15 2 0 0 45 42 3 0 0
Fatai 59 3 34 22 0 0 0 59 54 5 0 0
Lakepa 54 7 37 9 1 0 0 54 51 3 0 0
Vaotu'u 81 2 49 15 15 0 0 81 75 5 1 0
Utulau 98 22 48 21 7 0 0 98 95 3 0 0
Ha'alalo 103 34 22 41 6 0 0 103 102 1 0 0
Ha'akame 116 30 60 15 11 0 0 116 114 2 0 0
Houma 360 18 153 108 80 1 0 360 352 4 3 1
Kolovai 740 60 478 166 35 1 0 740 671 65 0 4
Kolovai 118 29 71 7 10 1 0 118 108 9 0 1
Te'ekiu 104 4 52 45 3 0 0 104 103 1 0 0
Masilamea 34 8 22 4 0 0 0 34 34 0 0 0
Fahefa 71 0 52 16 3 0 0 71 68 3 0 0

Tonga 2016 Census of Population and Housing
Tonga Statistics Department
174
Division/District/ region
Main source of drinking water Main source of water for cooking
Total
Piped water supply
Own cement or other
Neighbor / community
Bottled water
Boiled water Other Total
Piped water supply
Cement or other
tank Own well Other
Ha'utu 39 1 8 29 1 0 0 39 39 0 0 0
Kala'au 26 1 12 13 0 0 0 26 25 0 0 1
Fo'ui 104 9 64 22 9 0 0 104 97 7 0 0
Ha'avakatolo 40 4 31 3 2 0 0 40 38 2 0 0
Ahau 61 1 51 6 3 0 0 61 55 6 0 0
Kanokupolu 65 2 46 15 2 0 0 65 59 6 0 0
Ha'atafu 47 1 40 5 1 0 0 47 44 3 0 0
Atata 31 0 29 1 1 0 0 31 1 28 0 2
Vava'u 2,715 281 1,879 511 37 2 5 2,715 2,192 514 1 8
Neiafu 1,041 140 753 119 29 0 0 1,041 855 181 1 4
Neiafu 743 122 513 82 26 0 0 743 664 76 0 3
Makave 72 5 60 5 2 0 0 72 52 20 0 0
Toula 83 7 69 6 1 0 0 83 35 47 1 0
Utui 55 0 32 23 0 0 0 55 55 0 0 0
Ofu 26 0 24 2 0 0 0 26 25 0 0 1
Okoa 48 6 41 1 0 0 0 48 24 24 0 0
Olo'ua 14 0 14 0 0 0 0 14 0 14 0 0
Pangaimotu 232 11 198 21 2 0 0 232 171 58 0 3
Pangaimotu 125 8 95 20 2 0 0 125 101 24 0 0
Utulei 24 0 24 0 0 0 0 24 3 21 0 0
Nga'unoho 27 0 27 0 0 0 0 27 26 1 0 0
Utungake 56 3 52 1 0 0 0 56 41 12 0 3
Hahake 403 19 245 134 4 1 0 403 334 69 0 0
Ha'alaufuli 84 9 33 40 2 0 0 84 81 3 0 0
Ha'akio 23 3 13 6 1 0 0 23 21 2 0 0
Houma 17 3 7 6 0 1 0 17 16 1 0 0
Mangia 17 1 13 3 0 0 0 17 15 2 0 0
Ta'anea 128 2 76 49 1 0 0 128 128 0 0 0
Tu'anekivale 82 1 59 22 0 0 0 82 73 9 0 0
Koloa 31 0 23 8 0 0 0 31 0 31 0 0
Holeva 21 0 21 0 0 0 0 21 0 21 0 0
Leimatu'a 482 73 272 131 1 0 5 482 471 11 0 0
Leimatu'a 235 62 106 61 1 0 5 235 228 7 0 0
Holonga 83 0 51 32 0 0 0 83 82 1 0 0
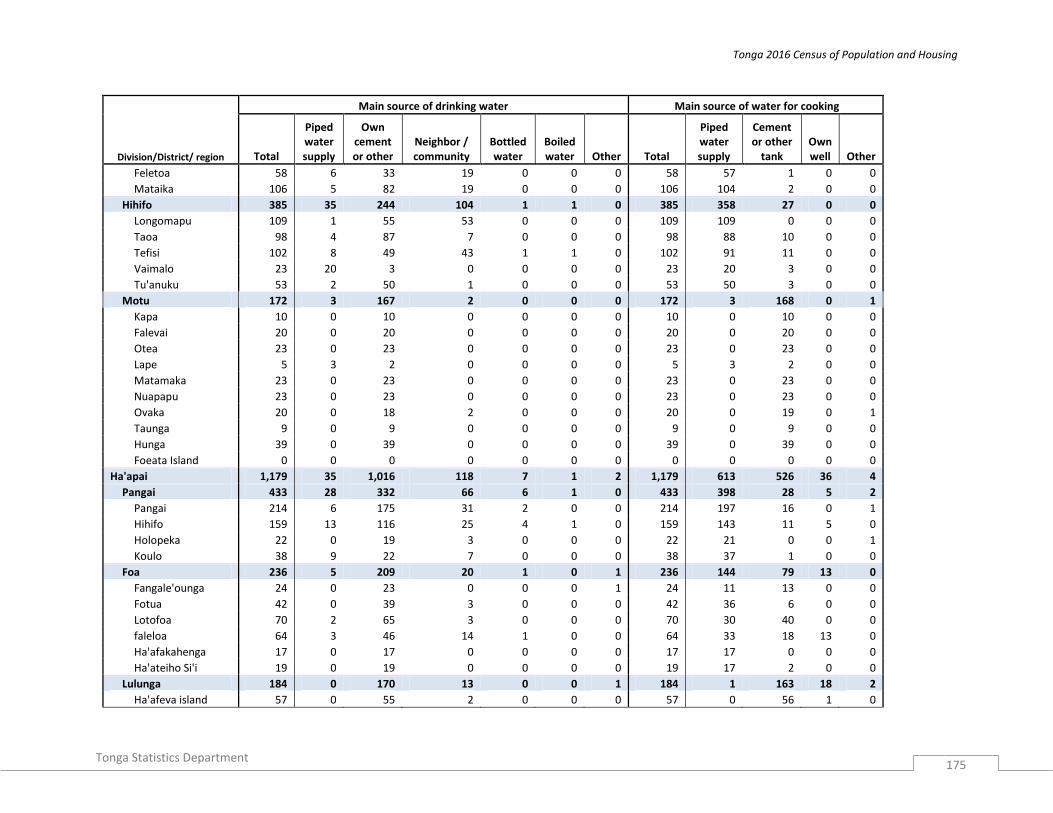
Tonga 2016 Census of Population and Housing
Tonga Statistics Department
175
Division/District/ region
Main source of drinking water Main source of water for cooking
Total
Piped water supply
Own cement or other
Neighbor / community
Bottled water
Boiled water Other Total
Piped water supply
Cement or other
tank Own well Other
Feletoa 58 6 33 19 0 0 0 58 57 1 0 0
Mataika 106 5 82 19 0 0 0 106 104 2 0 0
Hihifo 385 35 244 104 1 1 0 385 358 27 0 0
Longomapu 109 1 55 53 0 0 0 109 109 0 0 0
Taoa 98 4 87 7 0 0 0 98 88 10 0 0
Tefisi 102 8 49 43 1 1 0 102 91 11 0 0
Vaimalo 23 20 3 0 0 0 0 23 20 3 0 0
Tu'anuku 53 2 50 1 0 0 0 53 50 3 0 0
Motu 172 3 167 2 0 0 0 172 3 168 0 1
Kapa 10 0 10 0 0 0 0 10 0 10 0 0
Falevai 20 0 20 0 0 0 0 20 0 20 0 0
Otea 23 0 23 0 0 0 0 23 0 23 0 0
Lape 5 3 2 0 0 0 0 5 3 2 0 0
Matamaka 23 0 23 0 0 0 0 23 0 23 0 0
Nuapapu 23 0 23 0 0 0 0 23 0 23 0 0
Ovaka 20 0 18 2 0 0 0 20 0 19 0 1
Taunga 9 0 9 0 0 0 0 9 0 9 0 0
Hunga 39 0 39 0 0 0 0 39 0 39 0 0
Foeata Island 0 0 0 0 0 0 0 0 0 0 0 0
Ha'apai 1,179 35 1,016 118 7 1 2 1,179 613 526 36 4
Pangai 433 28 332 66 6 1 0 433 398 28 5 2
Pangai 214 6 175 31 2 0 0 214 197 16 0 1
Hihifo 159 13 116 25 4 1 0 159 143 11 5 0
Holopeka 22 0 19 3 0 0 0 22 21 0 0 1
Koulo 38 9 22 7 0 0 0 38 37 1 0 0
Foa 236 5 209 20 1 0 1 236 144 79 13 0
Fangale'ounga 24 0 23 0 0 0 1 24 11 13 0 0
Fotua 42 0 39 3 0 0 0 42 36 6 0 0
Lotofoa 70 2 65 3 0 0 0 70 30 40 0 0
faleloa 64 3 46 14 1 0 0 64 33 18 13 0
Ha'afakahenga 17 0 17 0 0 0 0 17 17 0 0 0
Ha'ateiho Si'i 19 0 19 0 0 0 0 19 17 2 0 0
Lulunga 184 0 170 13 0 0 1 184 1 163 18 2
Ha'afeva island 57 0 55 2 0 0 0 57 0 56 1 0
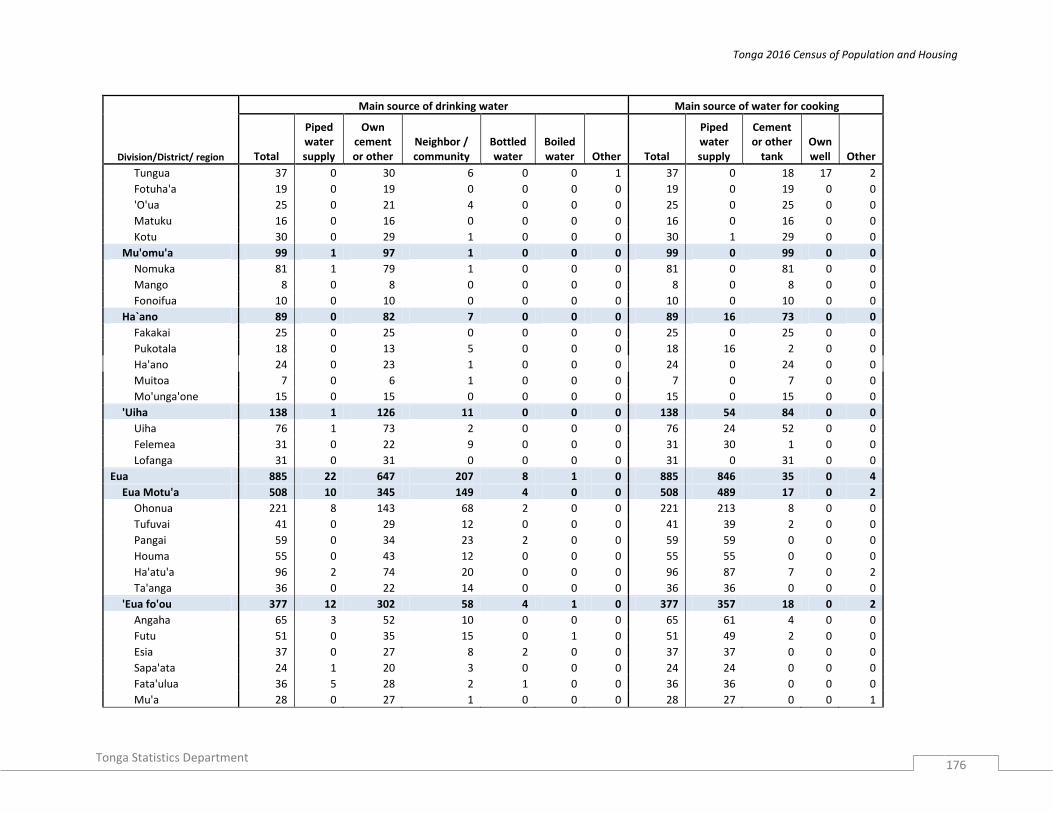
Tonga 2016 Census of Population and Housing
Tonga Statistics Department
176
Division/District/ region
Main source of drinking water Main source of water for cooking
Total
Piped water supply
Own cement or other
Neighbor / community
Bottled water
Boiled water Other Total
Piped water supply
Cement or other
tank Own well Other
Tungua 37 0 30 6 0 0 1 37 0 18 17 2
Fotuha'a 19 0 19 0 0 0 0 19 0 19 0 0
'O'ua 25 0 21 4 0 0 0 25 0 25 0 0
Matuku 16 0 16 0 0 0 0 16 0 16 0 0
Kotu 30 0 29 1 0 0 0 30 1 29 0 0
Mu'omu'a 99 1 97 1 0 0 0 99 0 99 0 0
Nomuka 81 1 79 1 0 0 0 81 0 81 0 0
Mango 8 0 8 0 0 0 0 8 0 8 0 0
Fonoifua 10 0 10 0 0 0 0 10 0 10 0 0
Ha`ano 89 0 82 7 0 0 0 89 16 73 0 0
Fakakai 25 0 25 0 0 0 0 25 0 25 0 0
Pukotala 18 0 13 5 0 0 0 18 16 2 0 0
Ha'ano 24 0 23 1 0 0 0 24 0 24 0 0
Muitoa 7 0 6 1 0 0 0 7 0 7 0 0
Mo'unga'one 15 0 15 0 0 0 0 15 0 15 0 0
'Uiha 138 1 126 11 0 0 0 138 54 84 0 0
Uiha 76 1 73 2 0 0 0 76 24 52 0 0
Felemea 31 0 22 9 0 0 0 31 30 1 0 0
Lofanga 31 0 31 0 0 0 0 31 0 31 0 0
Eua 885 22 647 207 8 1 0 885 846 35 0 4
Eua Motu'a 508 10 345 149 4 0 0 508 489 17 0 2
Ohonua 221 8 143 68 2 0 0 221 213 8 0 0
Tufuvai 41 0 29 12 0 0 0 41 39 2 0 0
Pangai 59 0 34 23 2 0 0 59 59 0 0 0
Houma 55 0 43 12 0 0 0 55 55 0 0 0
Ha'atu'a 96 2 74 20 0 0 0 96 87 7 0 2
Ta'anga 36 0 22 14 0 0 0 36 36 0 0 0
'Eua fo'ou 377 12 302 58 4 1 0 377 357 18 0 2
Angaha 65 3 52 10 0 0 0 65 61 4 0 0
Futu 51 0 35 15 0 1 0 51 49 2 0 0
Esia 37 0 27 8 2 0 0 37 37 0 0 0
Sapa'ata 24 1 20 3 0 0 0 24 24 0 0 0
Fata'ulua 36 5 28 2 1 0 0 36 36 0 0 0
Mu'a 28 0 27 1 0 0 0 28 27 0 0 1

Tonga 2016 Census of Population and Housing
Tonga Statistics Department
177
Division/District/ region
Main source of drinking water Main source of water for cooking
Total
Piped water supply
Own cement or other
Neighbor / community
Bottled water
Boiled water Other Total
Piped water supply
Cement or other
tank Own well Other
Tongamama'o 29 2 27 0 0 0 0 29 19 10 0 0
Petani 57 1 43 12 1 0 0 57 55 1 0 1
Mata'aho 50 0 43 7 0 0 0 50 49 1 0 0
Ongo Niua 273 3 252 18 0 0 0 273 161 110 1 1
Niuatoputapu 172 3 152 17 0 0 0 172 159 11 1 1
Hihifo 71 3 65 3 0 0 0 71 69 1 1 0
Vaipoa 37 0 32 5 0 0 0 37 35 2 0 0
Falehau 56 0 47 9 0 0 0 56 55 0 0 1
Tafahi 8 0 8 0 0 0 0 8 0 8 0 0
Niuafo'ou 101 0 100 1 0 0 0 101 2 99 0 0
Esia 26 0 26 0 0 0 0 26 1 25 0 0
Kolofo'ou 11 0 11 0 0 0 0 11 1 10 0 0
Sapaata 26 0 25 1 0 0 0 26 0 26 0 0
Fata'ulua 13 0 13 0 0 0 0 13 0 13 0 0
Mata'aho 3 0 3 0 0 0 0 3 0 3 0 0
Mu'a 6 0 6 0 0 0 0 6 0 6 0 0
Tongamama'o 2 0 2 0 0 0 0 2 0 2 0 0
Petani 14 0 14 0 0 0 0 14 0 14 0 0
Urban 4,089 499 2,187 584 791 16 12 4,089 3,775 290 17 7
Rural 13,916 1,300 8,703 2,953 922 18 20 13,916 12,117 1,671 83 45
Greater Nuku'alofa 6,139 721 3,300 973 1,112 18 15 6,139 5,648 437 38 16
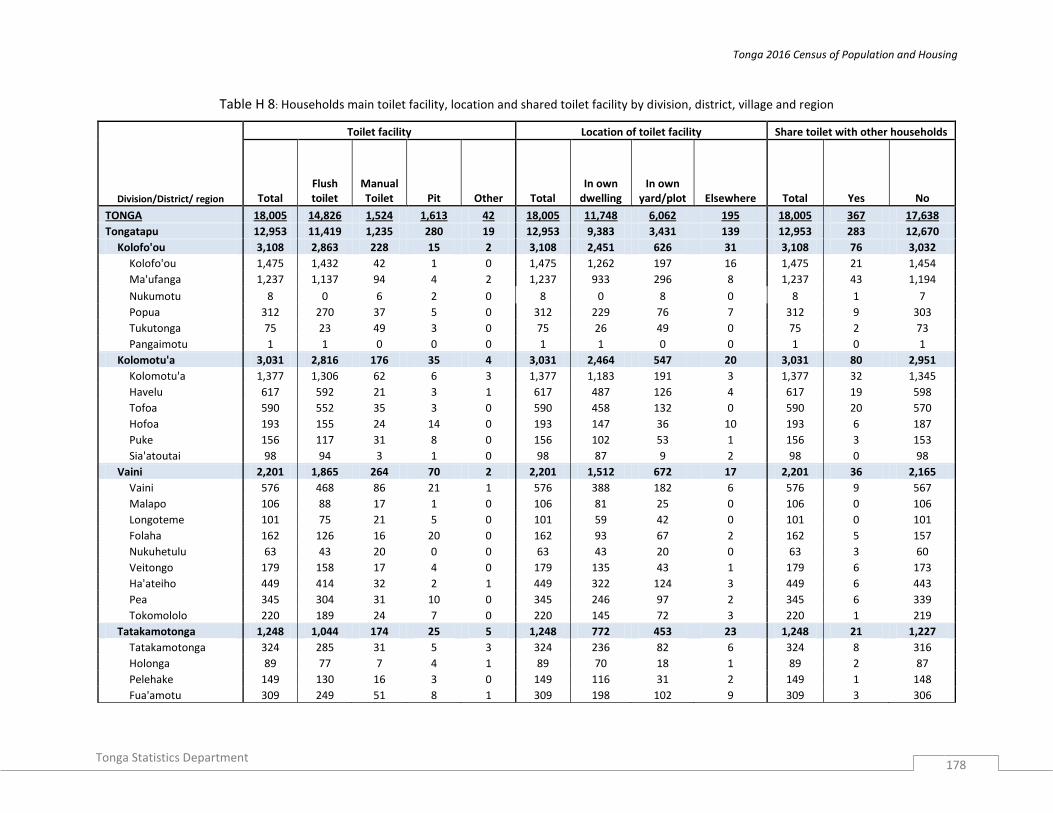
Tonga 2016 Census of Population and Housing
Tonga Statistics Department
178
Table H 8: Households main toilet facility, location and shared toilet facility by division, district, village and region
Division/District/ region
Toilet facility Location of toilet facility Share toilet with other households
Total Flush toilet
Manual Toilet Pit Other Total
In own dwelling
In own yard/plot Elsewhere Total Yes No
TONGA 18,005 14,826 1,524 1,613 42 18,005 11,748 6,062 195 18,005 367 17,638
Tongatapu 12,953 11,419 1,235 280 19 12,953 9,383 3,431 139 12,953 283 12,670
Kolofo'ou 3,108 2,863 228 15 2 3,108 2,451 626 31 3,108 76 3,032
Kolofo'ou 1,475 1,432 42 1 0 1,475 1,262 197 16 1,475 21 1,454
Ma'ufanga 1,237 1,137 94 4 2 1,237 933 296 8 1,237 43 1,194
Nukumotu 8 0 6 2 0 8 0 8 0 8 1 7
Popua 312 270 37 5 0 312 229 76 7 312 9 303
Tukutonga 75 23 49 3 0 75 26 49 0 75 2 73
Pangaimotu 1 1 0 0 0 1 1 0 0 1 0 1
Kolomotu'a 3,031 2,816 176 35 4 3,031 2,464 547 20 3,031 80 2,951
Kolomotu'a 1,377 1,306 62 6 3 1,377 1,183 191 3 1,377 32 1,345
Havelu 617 592 21 3 1 617 487 126 4 617 19 598
Tofoa 590 552 35 3 0 590 458 132 0 590 20 570
Hofoa 193 155 24 14 0 193 147 36 10 193 6 187
Puke 156 117 31 8 0 156 102 53 1 156 3 153
Sia'atoutai 98 94 3 1 0 98 87 9 2 98 0 98
Vaini 2,201 1,865 264 70 2 2,201 1,512 672 17 2,201 36 2,165
Vaini 576 468 86 21 1 576 388 182 6 576 9 567
Malapo 106 88 17 1 0 106 81 25 0 106 0 106
Longoteme 101 75 21 5 0 101 59 42 0 101 0 101
Folaha 162 126 16 20 0 162 93 67 2 162 5 157
Nukuhetulu 63 43 20 0 0 63 43 20 0 63 3 60
Veitongo 179 158 17 4 0 179 135 43 1 179 6 173
Ha'ateiho 449 414 32 2 1 449 322 124 3 449 6 443
Pea 345 304 31 10 0 345 246 97 2 345 6 339
Tokomololo 220 189 24 7 0 220 145 72 3 220 1 219
Tatakamotonga 1,248 1,044 174 25 5 1,248 772 453 23 1,248 21 1,227
Tatakamotonga 324 285 31 5 3 324 236 82 6 324 8 316
Holonga 89 77 7 4 1 89 70 18 1 89 2 87
Pelehake 149 130 16 3 0 149 116 31 2 149 1 148
Fua'amotu 309 249 51 8 1 309 198 102 9 309 3 306
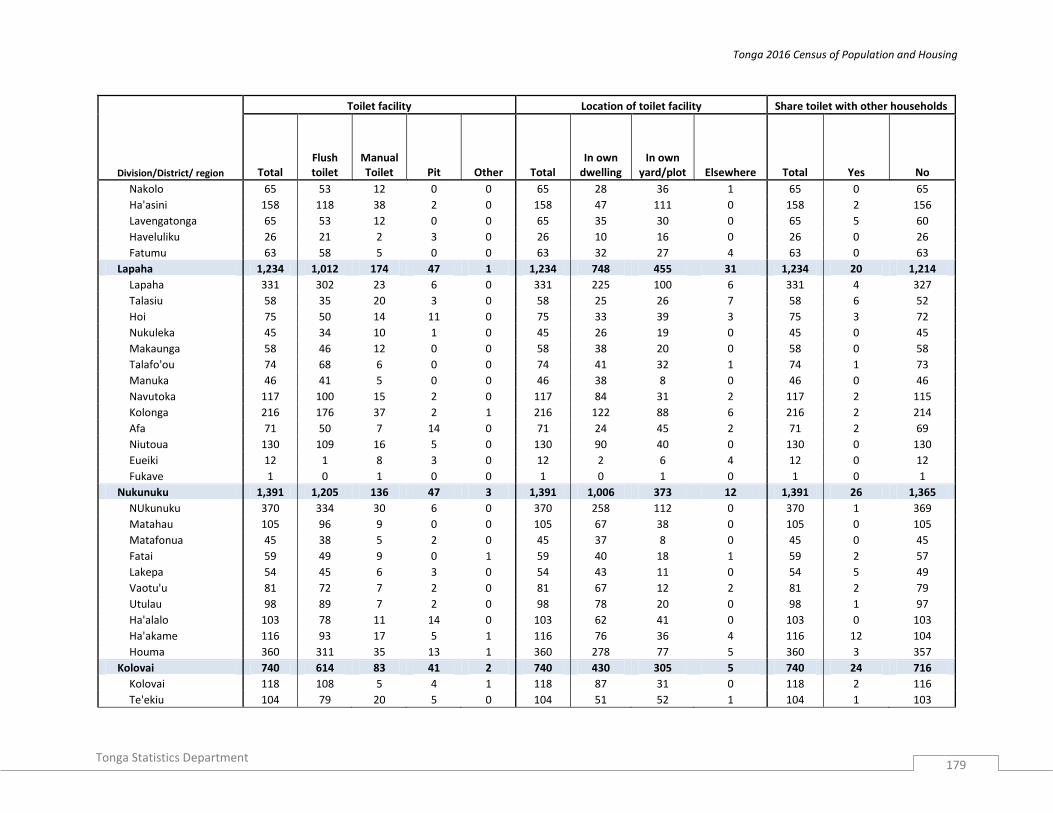
Tonga 2016 Census of Population and Housing
Tonga Statistics Department
179
Division/District/ region
Toilet facility Location of toilet facility Share toilet with other households
Total Flush toilet
Manual Toilet Pit Other Total
In own dwelling
In own yard/plot Elsewhere Total Yes No
Nakolo 65 53 12 0 0 65 28 36 1 65 0 65
Ha'asini 158 118 38 2 0 158 47 111 0 158 2 156
Lavengatonga 65 53 12 0 0 65 35 30 0 65 5 60
Haveluliku 26 21 2 3 0 26 10 16 0 26 0 26
Fatumu 63 58 5 0 0 63 32 27 4 63 0 63
Lapaha 1,234 1,012 174 47 1 1,234 748 455 31 1,234 20 1,214
Lapaha 331 302 23 6 0 331 225 100 6 331 4 327
Talasiu 58 35 20 3 0 58 25 26 7 58 6 52
Hoi 75 50 14 11 0 75 33 39 3 75 3 72
Nukuleka 45 34 10 1 0 45 26 19 0 45 0 45
Makaunga 58 46 12 0 0 58 38 20 0 58 0 58
Talafo'ou 74 68 6 0 0 74 41 32 1 74 1 73
Manuka 46 41 5 0 0 46 38 8 0 46 0 46
Navutoka 117 100 15 2 0 117 84 31 2 117 2 115
Kolonga 216 176 37 2 1 216 122 88 6 216 2 214
Afa 71 50 7 14 0 71 24 45 2 71 2 69
Niutoua 130 109 16 5 0 130 90 40 0 130 0 130
Eueiki 12 1 8 3 0 12 2 6 4 12 0 12
Fukave 1 0 1 0 0 1 0 1 0 1 0 1
Nukunuku 1,391 1,205 136 47 3 1,391 1,006 373 12 1,391 26 1,365
NUkunuku 370 334 30 6 0 370 258 112 0 370 1 369
Matahau 105 96 9 0 0 105 67 38 0 105 0 105
Matafonua 45 38 5 2 0 45 37 8 0 45 0 45
Fatai 59 49 9 0 1 59 40 18 1 59 2 57
Lakepa 54 45 6 3 0 54 43 11 0 54 5 49
Vaotu'u 81 72 7 2 0 81 67 12 2 81 2 79
Utulau 98 89 7 2 0 98 78 20 0 98 1 97
Ha'alalo 103 78 11 14 0 103 62 41 0 103 0 103
Ha'akame 116 93 17 5 1 116 76 36 4 116 12 104
Houma 360 311 35 13 1 360 278 77 5 360 3 357
Kolovai 740 614 83 41 2 740 430 305 5 740 24 716
Kolovai 118 108 5 4 1 118 87 31 0 118 2 116
Te'ekiu 104 79 20 5 0 104 51 52 1 104 1 103

Tonga 2016 Census of Population and Housing
Tonga Statistics Department
180
Division/District/ region
Toilet facility Location of toilet facility Share toilet with other households
Total Flush toilet
Manual Toilet Pit Other Total
In own dwelling
In own yard/plot Elsewhere Total Yes No
Masilamea 34 29 5 0 0 34 21 13 0 34 0 34
Fahefa 71 61 6 4 0 71 45 25 1 71 2 69
Ha'utu 39 38 1 0 0 39 21 17 1 39 8 31
Kala'au 26 25 0 1 0 26 17 8 1 26 0 26
Fo'ui 104 78 26 0 0 104 61 43 0 104 3 101
Ha'avakatolo 40 39 1 0 0 40 28 12 0 40 2 38
Ahau 61 59 2 0 0 61 23 38 0 61 5 56
Kanokupolu 65 57 6 1 1 65 31 34 0 65 1 64
Ha'atafu 47 38 6 3 0 47 41 5 1 47 0 47
Atata 31 3 5 23 0 31 4 27 0 31 0 31
Vava'u 2,715 1,932 116 658 9 2,715 1,393 1,278 44 2,715 50 2,665
Neiafu 1,041 915 35 89 2 1,041 749 282 10 1,041 13 1,028
Neiafu 743 675 19 48 1 743 595 145 3 743 10 733
Makave 72 71 0 1 0 72 54 18 0 72 0 72
Toula 83 71 2 10 0 83 48 35 0 83 1 82
Utui 55 41 0 13 1 55 24 30 1 55 1 54
Ofu 26 11 14 1 0 26 9 17 0 26 0 26
Okoa 48 42 0 6 0 48 17 31 0 48 1 47
Olo'ua 14 4 0 10 0 14 2 6 6 14 0 14
Pangaimotu 232 165 6 61 0 232 122 109 1 232 2 230
Pangaimotu 125 82 2 41 0 125 72 53 0 125 0 125
Utulei 24 18 4 2 0 24 7 17 0 24 0 24
Nga'unoho 27 23 0 4 0 27 17 10 0 27 0 27
Utungake 56 42 0 14 0 56 26 29 1 56 2 54
Hahake 403 274 34 94 1 403 172 223 8 403 10 393
Ha'alaufuli 84 66 8 10 0 84 45 33 6 84 1 83
Ha'akio 23 17 5 1 0 23 7 16 0 23 0 23
Houma 17 16 1 0 0 17 11 6 0 17 0 17
Mangia 17 14 0 3 0 17 13 4 0 17 0 17
Ta'anea 128 82 7 39 0 128 43 85 0 128 1 127
Tu'anekivale 82 62 10 10 0 82 42 40 0 82 0 82
Koloa 31 8 3 19 1 31 6 23 2 31 3 28
Holeva 21 9 0 12 0 21 5 16 0 21 5 16
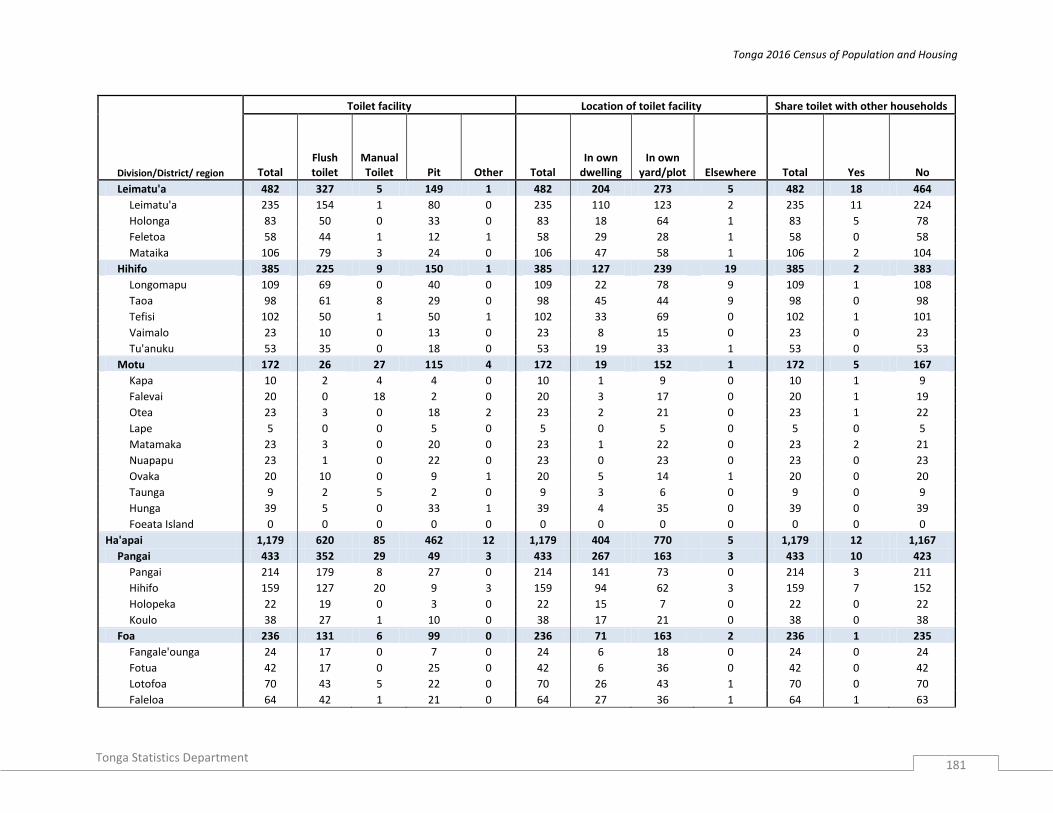
Tonga 2016 Census of Population and Housing
Tonga Statistics Department
181
Division/District/ region
Toilet facility Location of toilet facility Share toilet with other households
Total Flush toilet
Manual Toilet Pit Other Total
In own dwelling
In own yard/plot Elsewhere Total Yes No
Leimatu'a 482 327 5 149 1 482 204 273 5 482 18 464
Leimatu'a 235 154 1 80 0 235 110 123 2 235 11 224
Holonga 83 50 0 33 0 83 18 64 1 83 5 78
Feletoa 58 44 1 12 1 58 29 28 1 58 0 58
Mataika 106 79 3 24 0 106 47 58 1 106 2 104
Hihifo 385 225 9 150 1 385 127 239 19 385 2 383
Longomapu 109 69 0 40 0 109 22 78 9 109 1 108
Taoa 98 61 8 29 0 98 45 44 9 98 0 98
Tefisi 102 50 1 50 1 102 33 69 0 102 1 101
Vaimalo 23 10 0 13 0 23 8 15 0 23 0 23
Tu'anuku 53 35 0 18 0 53 19 33 1 53 0 53
Motu 172 26 27 115 4 172 19 152 1 172 5 167
Kapa 10 2 4 4 0 10 1 9 0 10 1 9
Falevai 20 0 18 2 0 20 3 17 0 20 1 19
Otea 23 3 0 18 2 23 2 21 0 23 1 22
Lape 5 0 0 5 0 5 0 5 0 5 0 5
Matamaka 23 3 0 20 0 23 1 22 0 23 2 21
Nuapapu 23 1 0 22 0 23 0 23 0 23 0 23
Ovaka 20 10 0 9 1 20 5 14 1 20 0 20
Taunga 9 2 5 2 0 9 3 6 0 9 0 9
Hunga 39 5 0 33 1 39 4 35 0 39 0 39
Foeata Island 0 0 0 0 0 0 0 0 0 0 0 0
Ha'apai 1,179 620 85 462 12 1,179 404 770 5 1,179 12 1,167
Pangai 433 352 29 49 3 433 267 163 3 433 10 423
Pangai 214 179 8 27 0 214 141 73 0 214 3 211
Hihifo 159 127 20 9 3 159 94 62 3 159 7 152
Holopeka 22 19 0 3 0 22 15 7 0 22 0 22
Koulo 38 27 1 10 0 38 17 21 0 38 0 38
Foa 236 131 6 99 0 236 71 163 2 236 1 235
Fangale'ounga 24 17 0 7 0 24 6 18 0 24 0 24
Fotua 42 17 0 25 0 42 6 36 0 42 0 42
Lotofoa 70 43 5 22 0 70 26 43 1 70 0 70
Faleloa 64 42 1 21 0 64 27 36 1 64 1 63

Tonga 2016 Census of Population and Housing
Tonga Statistics Department
182
Division/District/ region
Toilet facility Location of toilet facility Share toilet with other households
Total Flush toilet
Manual Toilet Pit Other Total
In own dwelling
In own yard/plot Elsewhere Total Yes No
Ha'afakahenga 17 7 0 10 0 17 3 14 0 17 0 17
Ha'ateiho Si'i 19 5 0 14 0 19 3 16 0 19 0 19
Lulunga 184 11 36 137 0 184 10 174 0 184 1 183
Ha'afeva island 57 6 0 51 0 57 6 51 0 57 0 57
Tungua 37 2 9 26 0 37 1 36 0 37 1 36
Fotuha'a 19 0 19 0 0 19 0 19 0 19 0 19
'O'ua 25 1 0 24 0 25 1 24 0 25 0 25
Matuku 16 1 7 8 0 16 2 14 0 16 0 16
Kotu 30 1 1 28 0 30 0 30 0 30 0 30
Mu'omu'a 99 9 13 77 0 99 11 88 0 99 0 99
Nomuka 81 7 11 63 0 81 9 72 0 81 0 81
Mango 8 2 1 5 0 8 2 6 0 8 0 8
Fonoifua 10 0 1 9 0 10 0 10 0 10 0 10
Ha`ano 89 38 0 42 9 89 15 74 0 89 0 89
Fakakai 25 7 0 18 0 25 5 20 0 25 0 25
Pukotala 18 11 0 7 0 18 3 15 0 18 0 18
Ha'ano 24 15 0 9 0 24 5 19 0 24 0 24
Muitoa 7 4 0 3 0 7 1 6 0 7 0 7
Mo'unga'one 15 1 0 5 9 15 1 14 0 15 0 15
'Uiha 138 79 1 58 0 138 30 108 0 138 0 138
Uiha 76 66 1 9 0 76 25 51 0 76 0 76
Felemea 31 10 0 21 0 31 5 26 0 31 0 31
Lofanga 31 3 0 28 0 31 0 31 0 31 0 31
Eua 885 685 65 133 2 885 468 410 7 885 21 864
Eua Motu'a 508 387 45 76 0 508 237 268 3 508 12 496
Ohonua 221 183 15 23 0 221 103 116 2 221 5 216
Tufuvai 41 34 3 4 0 41 23 18 0 41 0 41
Pangai 59 39 20 0 0 59 30 29 0 59 1 58
Houma 55 30 0 25 0 55 8 46 1 55 6 49
Ha'atu'a 96 69 6 21 0 96 47 49 0 96 0 96
Ta'anga 36 32 1 3 0 36 26 10 0 36 0 36
'Eua fo'ou 377 298 20 57 2 377 231 142 4 377 9 368
Angaha 65 50 9 6 0 65 50 15 0 65 0 65
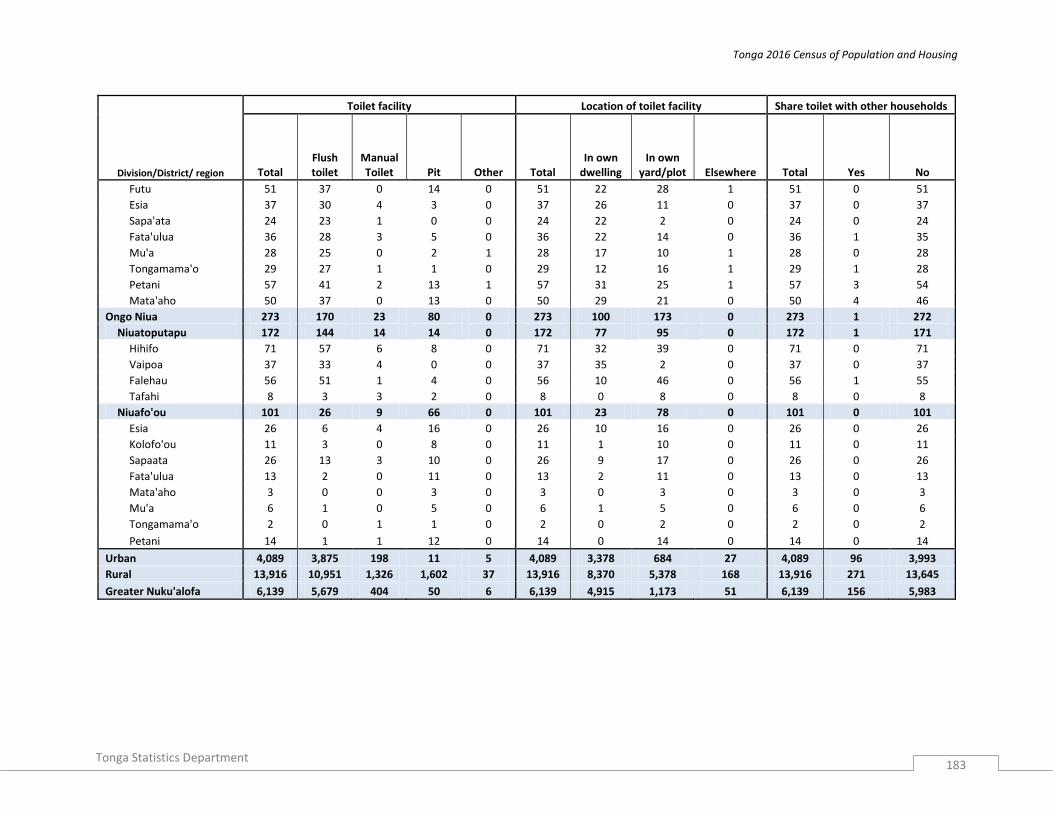
Tonga 2016 Census of Population and Housing
Tonga Statistics Department
183
Division/District/ region
Toilet facility Location of toilet facility Share toilet with other households
Total Flush toilet
Manual Toilet Pit Other Total
In own dwelling
In own yard/plot Elsewhere Total Yes No
Futu 51 37 0 14 0 51 22 28 1 51 0 51
Esia 37 30 4 3 0 37 26 11 0 37 0 37
Sapa'ata 24 23 1 0 0 24 22 2 0 24 0 24
Fata'ulua 36 28 3 5 0 36 22 14 0 36 1 35
Mu'a 28 25 0 2 1 28 17 10 1 28 0 28
Tongamama'o 29 27 1 1 0 29 12 16 1 29 1 28
Petani 57 41 2 13 1 57 31 25 1 57 3 54
Mata'aho 50 37 0 13 0 50 29 21 0 50 4 46
Ongo Niua 273 170 23 80 0 273 100 173 0 273 1 272
Niuatoputapu 172 144 14 14 0 172 77 95 0 172 1 171
Hihifo 71 57 6 8 0 71 32 39 0 71 0 71
Vaipoa 37 33 4 0 0 37 35 2 0 37 0 37
Falehau 56 51 1 4 0 56 10 46 0 56 1 55
Tafahi 8 3 3 2 0 8 0 8 0 8 0 8
Niuafo'ou 101 26 9 66 0 101 23 78 0 101 0 101
Esia 26 6 4 16 0 26 10 16 0 26 0 26
Kolofo'ou 11 3 0 8 0 11 1 10 0 11 0 11
Sapaata 26 13 3 10 0 26 9 17 0 26 0 26
Fata'ulua 13 2 0 11 0 13 2 11 0 13 0 13
Mata'aho 3 0 0 3 0 3 0 3 0 3 0 3
Mu'a 6 1 0 5 0 6 1 5 0 6 0 6
Tongamama'o 2 0 1 1 0 2 0 2 0 2 0 2
Petani 14 1 1 12 0 14 0 14 0 14 0 14
Urban 4,089 3,875 198 11 5 4,089 3,378 684 27 4,089 96 3,993
Rural 13,916 10,951 1,326 1,602 37 13,916 8,370 5,378 168 13,916 271 13,645
Greater Nuku'alofa 6,139 5,679 404 50 6 6,139 4,915 1,173 51 6,139 156 5,983
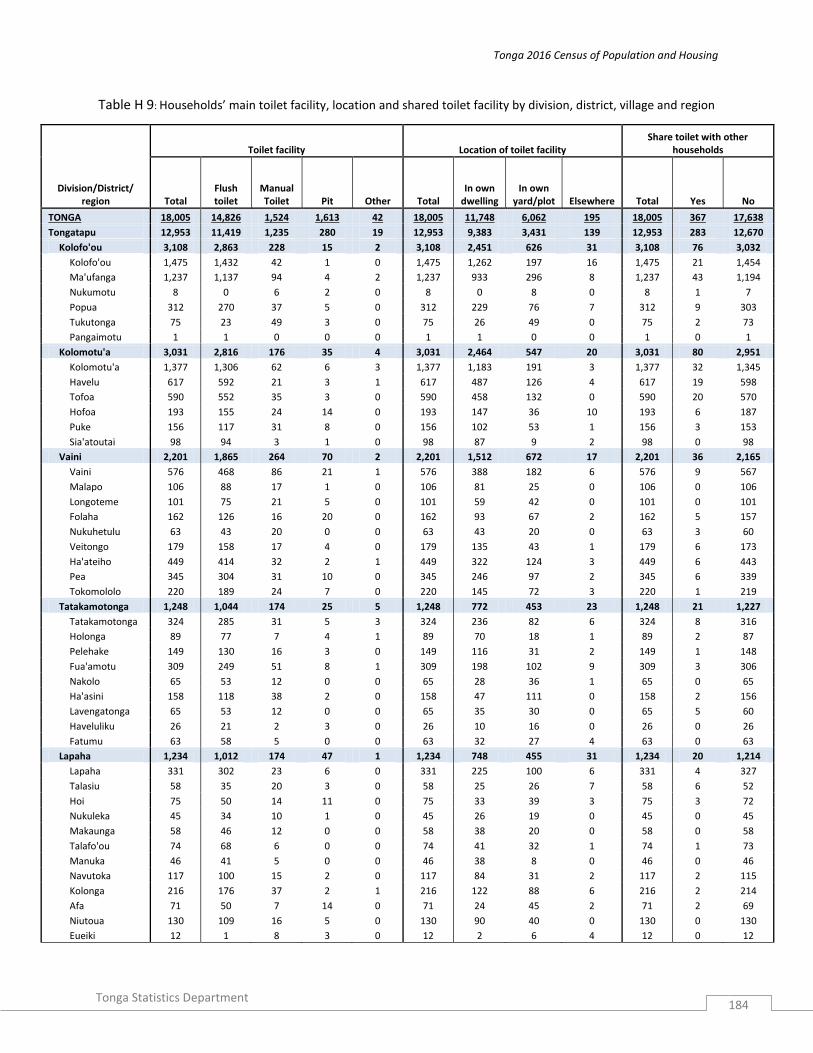
Tonga 2016 Census of Population and Housing
Tonga Statistics Department
184
Table H 9: Households’ main toilet facility, location and shared toilet facility by division, district, village and region
Division/District/ region
Toilet facility Location of toilet facility Share toilet with other
households
Total Flush toilet
Manual Toilet Pit Other Total
In own dwelling
In own yard/plot Elsewhere Total Yes No
TONGA 18,005 14,826 1,524 1,613 42 18,005 11,748 6,062 195 18,005 367 17,638
Tongatapu 12,953 11,419 1,235 280 19 12,953 9,383 3,431 139 12,953 283 12,670
Kolofo'ou 3,108 2,863 228 15 2 3,108 2,451 626 31 3,108 76 3,032
Kolofo'ou 1,475 1,432 42 1 0 1,475 1,262 197 16 1,475 21 1,454
Ma'ufanga 1,237 1,137 94 4 2 1,237 933 296 8 1,237 43 1,194
Nukumotu 8 0 6 2 0 8 0 8 0 8 1 7
Popua 312 270 37 5 0 312 229 76 7 312 9 303
Tukutonga 75 23 49 3 0 75 26 49 0 75 2 73
Pangaimotu 1 1 0 0 0 1 1 0 0 1 0 1
Kolomotu'a 3,031 2,816 176 35 4 3,031 2,464 547 20 3,031 80 2,951
Kolomotu'a 1,377 1,306 62 6 3 1,377 1,183 191 3 1,377 32 1,345
Havelu 617 592 21 3 1 617 487 126 4 617 19 598
Tofoa 590 552 35 3 0 590 458 132 0 590 20 570
Hofoa 193 155 24 14 0 193 147 36 10 193 6 187
Puke 156 117 31 8 0 156 102 53 1 156 3 153
Sia'atoutai 98 94 3 1 0 98 87 9 2 98 0 98
Vaini 2,201 1,865 264 70 2 2,201 1,512 672 17 2,201 36 2,165
Vaini 576 468 86 21 1 576 388 182 6 576 9 567
Malapo 106 88 17 1 0 106 81 25 0 106 0 106
Longoteme 101 75 21 5 0 101 59 42 0 101 0 101
Folaha 162 126 16 20 0 162 93 67 2 162 5 157
Nukuhetulu 63 43 20 0 0 63 43 20 0 63 3 60
Veitongo 179 158 17 4 0 179 135 43 1 179 6 173
Ha'ateiho 449 414 32 2 1 449 322 124 3 449 6 443
Pea 345 304 31 10 0 345 246 97 2 345 6 339
Tokomololo 220 189 24 7 0 220 145 72 3 220 1 219
Tatakamotonga 1,248 1,044 174 25 5 1,248 772 453 23 1,248 21 1,227
Tatakamotonga 324 285 31 5 3 324 236 82 6 324 8 316
Holonga 89 77 7 4 1 89 70 18 1 89 2 87
Pelehake 149 130 16 3 0 149 116 31 2 149 1 148
Fua'amotu 309 249 51 8 1 309 198 102 9 309 3 306
Nakolo 65 53 12 0 0 65 28 36 1 65 0 65
Ha'asini 158 118 38 2 0 158 47 111 0 158 2 156
Lavengatonga 65 53 12 0 0 65 35 30 0 65 5 60
Haveluliku 26 21 2 3 0 26 10 16 0 26 0 26
Fatumu 63 58 5 0 0 63 32 27 4 63 0 63
Lapaha 1,234 1,012 174 47 1 1,234 748 455 31 1,234 20 1,214
Lapaha 331 302 23 6 0 331 225 100 6 331 4 327
Talasiu 58 35 20 3 0 58 25 26 7 58 6 52
Hoi 75 50 14 11 0 75 33 39 3 75 3 72
Nukuleka 45 34 10 1 0 45 26 19 0 45 0 45
Makaunga 58 46 12 0 0 58 38 20 0 58 0 58
Talafo'ou 74 68 6 0 0 74 41 32 1 74 1 73
Manuka 46 41 5 0 0 46 38 8 0 46 0 46
Navutoka 117 100 15 2 0 117 84 31 2 117 2 115
Kolonga 216 176 37 2 1 216 122 88 6 216 2 214
Afa 71 50 7 14 0 71 24 45 2 71 2 69
Niutoua 130 109 16 5 0 130 90 40 0 130 0 130
Eueiki 12 1 8 3 0 12 2 6 4 12 0 12
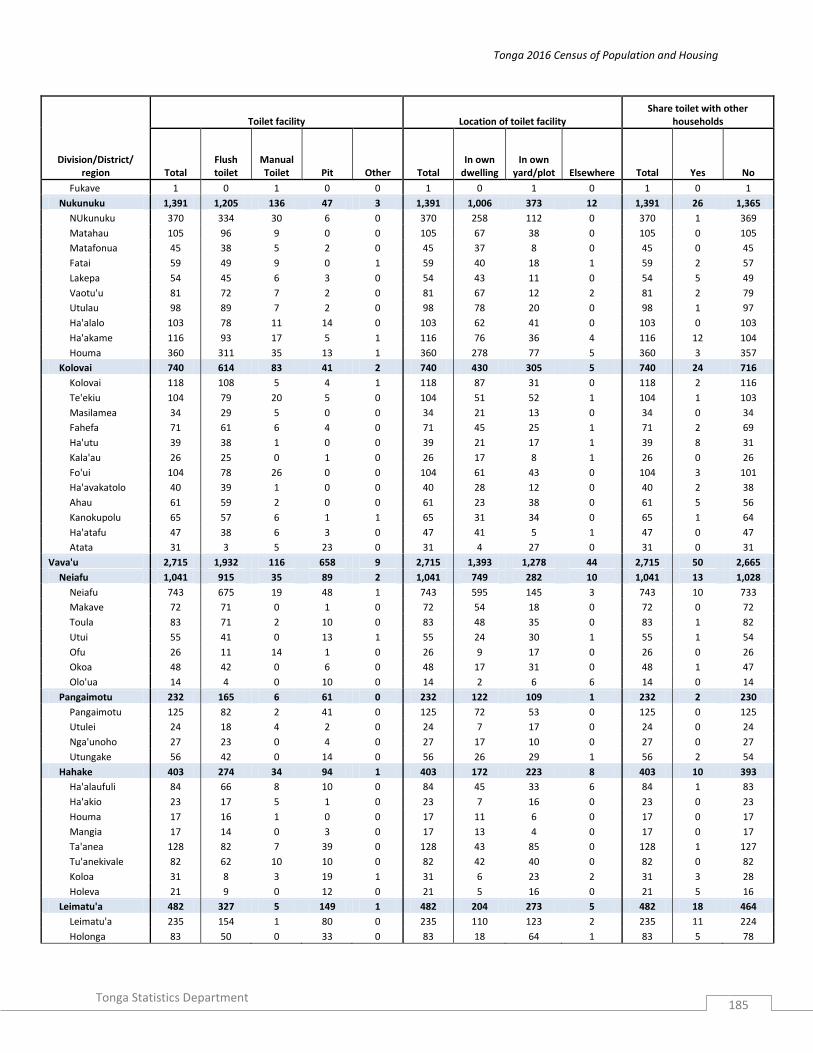
Tonga 2016 Census of Population and Housing
Tonga Statistics Department
185
Division/District/ region
Toilet facility Location of toilet facility Share toilet with other
households
Total Flush toilet
Manual Toilet Pit Other Total
In own dwelling
In own yard/plot Elsewhere Total Yes No
Fukave 1 0 1 0 0 1 0 1 0 1 0 1
Nukunuku 1,391 1,205 136 47 3 1,391 1,006 373 12 1,391 26 1,365
NUkunuku 370 334 30 6 0 370 258 112 0 370 1 369
Matahau 105 96 9 0 0 105 67 38 0 105 0 105
Matafonua 45 38 5 2 0 45 37 8 0 45 0 45
Fatai 59 49 9 0 1 59 40 18 1 59 2 57
Lakepa 54 45 6 3 0 54 43 11 0 54 5 49
Vaotu'u 81 72 7 2 0 81 67 12 2 81 2 79
Utulau 98 89 7 2 0 98 78 20 0 98 1 97
Ha'alalo 103 78 11 14 0 103 62 41 0 103 0 103
Ha'akame 116 93 17 5 1 116 76 36 4 116 12 104
Houma 360 311 35 13 1 360 278 77 5 360 3 357
Kolovai 740 614 83 41 2 740 430 305 5 740 24 716
Kolovai 118 108 5 4 1 118 87 31 0 118 2 116
Te'ekiu 104 79 20 5 0 104 51 52 1 104 1 103
Masilamea 34 29 5 0 0 34 21 13 0 34 0 34
Fahefa 71 61 6 4 0 71 45 25 1 71 2 69
Ha'utu 39 38 1 0 0 39 21 17 1 39 8 31
Kala'au 26 25 0 1 0 26 17 8 1 26 0 26
Fo'ui 104 78 26 0 0 104 61 43 0 104 3 101
Ha'avakatolo 40 39 1 0 0 40 28 12 0 40 2 38
Ahau 61 59 2 0 0 61 23 38 0 61 5 56
Kanokupolu 65 57 6 1 1 65 31 34 0 65 1 64
Ha'atafu 47 38 6 3 0 47 41 5 1 47 0 47
Atata 31 3 5 23 0 31 4 27 0 31 0 31
Vava'u 2,715 1,932 116 658 9 2,715 1,393 1,278 44 2,715 50 2,665
Neiafu 1,041 915 35 89 2 1,041 749 282 10 1,041 13 1,028
Neiafu 743 675 19 48 1 743 595 145 3 743 10 733
Makave 72 71 0 1 0 72 54 18 0 72 0 72
Toula 83 71 2 10 0 83 48 35 0 83 1 82
Utui 55 41 0 13 1 55 24 30 1 55 1 54
Ofu 26 11 14 1 0 26 9 17 0 26 0 26
Okoa 48 42 0 6 0 48 17 31 0 48 1 47
Olo'ua 14 4 0 10 0 14 2 6 6 14 0 14
Pangaimotu 232 165 6 61 0 232 122 109 1 232 2 230
Pangaimotu 125 82 2 41 0 125 72 53 0 125 0 125
Utulei 24 18 4 2 0 24 7 17 0 24 0 24
Nga'unoho 27 23 0 4 0 27 17 10 0 27 0 27
Utungake 56 42 0 14 0 56 26 29 1 56 2 54
Hahake 403 274 34 94 1 403 172 223 8 403 10 393
Ha'alaufuli 84 66 8 10 0 84 45 33 6 84 1 83
Ha'akio 23 17 5 1 0 23 7 16 0 23 0 23
Houma 17 16 1 0 0 17 11 6 0 17 0 17
Mangia 17 14 0 3 0 17 13 4 0 17 0 17
Ta'anea 128 82 7 39 0 128 43 85 0 128 1 127
Tu'anekivale 82 62 10 10 0 82 42 40 0 82 0 82
Koloa 31 8 3 19 1 31 6 23 2 31 3 28
Holeva 21 9 0 12 0 21 5 16 0 21 5 16
Leimatu'a 482 327 5 149 1 482 204 273 5 482 18 464
Leimatu'a 235 154 1 80 0 235 110 123 2 235 11 224
Holonga 83 50 0 33 0 83 18 64 1 83 5 78

Tonga 2016 Census of Population and Housing
Tonga Statistics Department
186
Division/District/ region
Toilet facility Location of toilet facility Share toilet with other
households
Total Flush toilet
Manual Toilet Pit Other Total
In own dwelling
In own yard/plot Elsewhere Total Yes No
Feletoa 58 44 1 12 1 58 29 28 1 58 0 58
Mataika 106 79 3 24 0 106 47 58 1 106 2 104
Hihifo 385 225 9 150 1 385 127 239 19 385 2 383
Longomapu 109 69 0 40 0 109 22 78 9 109 1 108
Taoa 98 61 8 29 0 98 45 44 9 98 0 98
Tefisi 102 50 1 50 1 102 33 69 0 102 1 101
Vaimalo 23 10 0 13 0 23 8 15 0 23 0 23
Tu'anuku 53 35 0 18 0 53 19 33 1 53 0 53
Motu 172 26 27 115 4 172 19 152 1 172 5 167
Kapa 10 2 4 4 0 10 1 9 0 10 1 9
Falevai 20 0 18 2 0 20 3 17 0 20 1 19
Otea 23 3 0 18 2 23 2 21 0 23 1 22
Lape 5 0 0 5 0 5 0 5 0 5 0 5
Matamaka 23 3 0 20 0 23 1 22 0 23 2 21
Nuapapu 23 1 0 22 0 23 0 23 0 23 0 23
Ovaka 20 10 0 9 1 20 5 14 1 20 0 20
Taunga 9 2 5 2 0 9 3 6 0 9 0 9
Hunga 39 5 0 33 1 39 4 35 0 39 0 39
Foeata Island 0 0 0 0 0 0 0 0 0 0 0 0
Ha'apai 1,179 620 85 462 12 1,179 404 770 5 1,179 12 1,167
Pangai 433 352 29 49 3 433 267 163 3 433 10 423
Pangai 214 179 8 27 0 214 141 73 0 214 3 211
Hihifo 159 127 20 9 3 159 94 62 3 159 7 152
Holopeka 22 19 0 3 0 22 15 7 0 22 0 22
Koulo 38 27 1 10 0 38 17 21 0 38 0 38
Foa 236 131 6 99 0 236 71 163 2 236 1 235
Fangale'ounga 24 17 0 7 0 24 6 18 0 24 0 24
Fotua 42 17 0 25 0 42 6 36 0 42 0 42
Lotofoa 70 43 5 22 0 70 26 43 1 70 0 70
faleloa 64 42 1 21 0 64 27 36 1 64 1 63
Ha'afakahenga 17 7 0 10 0 17 3 14 0 17 0 17
Ha'ateiho Si'i 19 5 0 14 0 19 3 16 0 19 0 19
Lulunga 184 11 36 137 0 184 10 174 0 184 1 183
Ha'afeva island 57 6 0 51 0 57 6 51 0 57 0 57
Tungua 37 2 9 26 0 37 1 36 0 37 1 36
Fotuha'a 19 0 19 0 0 19 0 19 0 19 0 19
'O'ua 25 1 0 24 0 25 1 24 0 25 0 25
Matuku 16 1 7 8 0 16 2 14 0 16 0 16
Kotu 30 1 1 28 0 30 0 30 0 30 0 30
Mu'omu'a 99 9 13 77 0 99 11 88 0 99 0 99
Nomuka 81 7 11 63 0 81 9 72 0 81 0 81
Mango 8 2 1 5 0 8 2 6 0 8 0 8
Fonoifua 10 0 1 9 0 10 0 10 0 10 0 10
Ha`ano 89 38 0 42 9 89 15 74 0 89 0 89
Fakakai 25 7 0 18 0 25 5 20 0 25 0 25
Pukotala 18 11 0 7 0 18 3 15 0 18 0 18
Ha'ano 24 15 0 9 0 24 5 19 0 24 0 24
Muitoa 7 4 0 3 0 7 1 6 0 7 0 7
Mo'unga'one 15 1 0 5 9 15 1 14 0 15 0 15
'Uiha 138 79 1 58 0 138 30 108 0 138 0 138
Uiha 76 66 1 9 0 76 25 51 0 76 0 76

Tonga 2016 Census of Population and Housing
Tonga Statistics Department
187
Division/District/ region
Toilet facility Location of toilet facility Share toilet with other
households
Total Flush toilet
Manual Toilet Pit Other Total
In own dwelling
In own yard/plot Elsewhere Total Yes No
Felemea 31 10 0 21 0 31 5 26 0 31 0 31
Lofanga 31 3 0 28 0 31 0 31 0 31 0 31
Eua 885 685 65 133 2 885 468 410 7 885 21 864
Eua Motu'a 508 387 45 76 0 508 237 268 3 508 12 496
Ohonua 221 183 15 23 0 221 103 116 2 221 5 216
Tufuvai 41 34 3 4 0 41 23 18 0 41 0 41
Pangai 59 39 20 0 0 59 30 29 0 59 1 58
Houma 55 30 0 25 0 55 8 46 1 55 6 49
Ha'atu'a 96 69 6 21 0 96 47 49 0 96 0 96
Ta'anga 36 32 1 3 0 36 26 10 0 36 0 36
'Eua fo'ou 377 298 20 57 2 377 231 142 4 377 9 368
Angaha 65 50 9 6 0 65 50 15 0 65 0 65
Futu 51 37 0 14 0 51 22 28 1 51 0 51
Esia 37 30 4 3 0 37 26 11 0 37 0 37
Sapa'ata 24 23 1 0 0 24 22 2 0 24 0 24
Fata'ulua 36 28 3 5 0 36 22 14 0 36 1 35
Mu'a 28 25 0 2 1 28 17 10 1 28 0 28
Tongamama'o 29 27 1 1 0 29 12 16 1 29 1 28
Petani 57 41 2 13 1 57 31 25 1 57 3 54
Mata'aho 50 37 0 13 0 50 29 21 0 50 4 46
Ongo Niua 273 170 23 80 0 273 100 173 0 273 1 272
Niuatoputapu 172 144 14 14 0 172 77 95 0 172 1 171
Hihifo 71 57 6 8 0 71 32 39 0 71 0 71
Vaipoa 37 33 4 0 0 37 35 2 0 37 0 37
Falehau 56 51 1 4 0 56 10 46 0 56 1 55
Tafahi 8 3 3 2 0 8 0 8 0 8 0 8
Niuafo'ou 101 26 9 66 0 101 23 78 0 101 0 101
Esia 26 6 4 16 0 26 10 16 0 26 0 26
Kolofo'ou 11 3 0 8 0 11 1 10 0 11 0 11
Sapaata 26 13 3 10 0 26 9 17 0 26 0 26
Fata'ulua 13 2 0 11 0 13 2 11 0 13 0 13
Mata'aho 3 0 0 3 0 3 0 3 0 3 0 3
Mu'a 6 1 0 5 0 6 1 5 0 6 0 6
Tongamama'o 2 0 1 1 0 2 0 2 0 2 0 2
Petani 14 1 1 12 0 14 0 14 0 14 0 14
Urban 4,089 3,875 198 11 5 4,089 3,378 684 27 4,089 96 3,993
Rural 13,916 10,951 1,326 1,602 37 13,916 8,370 5,378 168 13,916 271 13,645
Greater Nuku'alofa 6,139 5,679 404 50 6 6,139 4,915 1,173 51 6,139 156 5,983

Tonga 2016 Census of Population and Housing
Tonga Statistics Department
188
Table H 10: Private Households’ main source of energy for cooking by division, district, village and region
Division/District/ region
Main cooking fuel used Main place of cooking
Total Electricity Propane gas (LPG) Kerosene
Solar power
Wood and
coconut husk Others Total
Inside the
dwelling -
separate kitchen
area
Inside the
dwelling - no
devoted kitchen
Outside - open
cooking area
Outside - closed
cooking area Others
TONGA 18,005 1,960 11,530 58 55 4,374 28 18,005 11,507 1,705 2,133 2,636 24
Tongatapu 12,953 1,421 9,346 47 17 2,102 20 12,953 9,144 1,292 1,357 1,147 13
Kolofo'ou 3,108 412 2,480 10 4 198 4 3,108 2,368 386 244 110 0
Kolofo'ou 1,475 203 1,215 4 1 49 3 1,475 1,181 187 83 24 0
Ma'ufanga 1,237 184 969 2 0 81 1 1,237 963 133 96 45 0
Nukumotu 8 0 5 0 0 3 0 8 0 0 0 8 0
Popua 312 25 264 0 1 22 0 312 209 56 30 17 0
Tukutonga 75 0 26 4 2 43 0 75 14 10 35 16 0
Pangaimotu 1 0 1 0 0 0 0 1 1 0 0 0 0
Kolomotu'a 3,031 397 2,387 11 3 228 5 3,031 2,380 290 211 146 4
Kolomotu'a 1,377 201 1,106 4 2 62 2 1,377 1,144 125 74 31 3
Havelu 617 62 515 2 0 38 0 617 459 82 37 39 0
Tofoa 590 78 482 1 0 28 1 590 460 51 45 34 0
Hofoa 193 30 129 2 1 30 1 193 137 8 30 17 1
Puke 156 7 86 1 0 61 1 156 98 10 23 25 0
Sia'atoutai 98 19 69 1 0 9 0 98 82 14 2 0 0
Vaini 2,201 128 1,658 11 3 397 4 2,201 1,555 178 290 175 3
Vaini 576 29 436 1 3 106 1 576 409 57 65 45 0
Malapo 106 1 98 3 0 3 1 106 86 3 3 13 1
Longoteme 101 3 60 0 0 38 0 101 58 8 11 24 0
Folaha 162 5 119 0 0 38 0 162 105 12 17 28 0
Nukuhetulu 63 11 33 2 0 17 0 63 49 8 5 1 0
Veitongo 179 45 99 2 0 33 0 179 121 18 37 3 0
Ha'ateiho 449 20 348 3 0 76 2 449 311 53 50 34 1
Pea 345 11 281 0 0 53 0 345 251 16 56 21 1
Tokomololo 220 3 184 0 0 33 0 220 165 3 46 6 0
Tatakamotonga 1,248 98 795 7 0 346 2 1,248 788 87 192 179 2
Tatakamotong 324 38 228 1 0 56 1 324 224 23 49 27 1
Holonga 89 4 65 0 0 19 1 89 66 1 7 14 1
Pelehake 149 4 104 0 0 41 0 149 114 16 12 7 0
Fua'amotu 309 40 221 6 0 42 0 309 217 25 32 35 0
Nakolo 65 0 33 0 0 32 0 65 33 1 15 16 0

Tonga 2016 Census of Population and Housing
Tonga Statistics Department
189
Division/District/ region
Main cooking fuel used Main place of cooking
Total Electricity Propane gas (LPG) Kerosene
Solar power
Wood and
coconut husk Others Total
Inside the
dwelling -
separate kitchen
area
Inside the
dwelling - no
devoted kitchen
Outside - open
cooking area
Outside - closed
cooking area Others
Ha'asini 158 6 64 0 0 88 0 158 65 10 36 47 0
Lavengatonga 65 5 32 0 0 28 0 65 24 8 15 18 0
Haveluliku 26 0 22 0 0 4 0 26 7 2 14 3 0
Fatumu 63 1 26 0 0 36 0 63 38 1 12 12 0
Lapaha 1,234 189 659 3 6 376 1 1,234 765 68 186 214 1
Lapaha 331 43 232 1 0 54 1 331 241 21 36 32 1
Talasiu 58 9 19 0 0 30 0 58 18 2 21 17 0
Hoi 75 8 51 0 0 16 0 75 44 4 10 17 0
Nukuleka 45 2 26 0 0 17 0 45 26 0 18 1 0
Makaunga 58 0 41 0 0 17 0 58 38 1 2 17 0
Talafo'ou 74 4 44 0 0 26 0 74 46 3 4 21 0
Manuka 46 15 22 0 0 9 0 46 37 1 6 2 0
Navutoka 117 31 72 1 0 13 0 117 83 12 11 11 0
Kolonga 216 63 78 1 0 74 0 216 118 18 25 55 0
Afa 71 6 11 0 0 54 0 71 26 0 22 23 0
Niutoua 130 8 63 0 0 59 0 130 80 6 28 16 0
Eueiki 12 0 0 0 6 6 0 12 8 0 2 2 0
Fukave 1 0 0 0 0 1 0 1 0 0 1 0 0
Nukunuku 1,391 124 955 3 0 308 1 1,391 931 161 131 168 0
NUkunuku 370 9 290 1 0 69 1 370 277 14 33 46 0
Matahau 105 6 77 0 0 22 0 105 75 6 5 19 0
Matafonua 45 0 28 0 0 17 0 45 6 33 4 2 0
Fatai 59 4 52 0 0 3 0 59 40 8 6 5 0
Lakepa 54 3 38 1 0 12 0 54 33 1 17 3 0
Vaotu'u 81 2 54 0 0 25 0 81 33 36 6 6 0
Utulau 98 56 37 0 0 5 0 98 70 15 8 5 0
Ha'alalo 103 23 57 0 0 23 0 103 56 17 13 17 0
Ha'akame 116 10 60 0 0 46 0 116 82 14 7 13 0
Houma 360 11 262 1 0 86 0 360 259 17 32 52 0
Kolovai 740 73 412 2 1 249 3 740 357 122 103 155 3
Kolovai 118 1 95 0 0 19 3 118 54 46 8 8 2
Te'ekiu 104 5 47 2 0 50 0 104 41 7 18 38 0
Masilamea 34 2 16 0 0 16 0 34 18 3 3 10 0
Fahefa 71 10 56 0 0 5 0 71 50 2 8 11 0

Tonga 2016 Census of Population and Housing
Tonga Statistics Department
190
Division/District/ region
Main cooking fuel used Main place of cooking
Total Electricity Propane gas (LPG) Kerosene
Solar power
Wood and
coconut husk Others Total
Inside the
dwelling -
separate kitchen
area
Inside the
dwelling - no
devoted kitchen
Outside - open
cooking area
Outside - closed
cooking area Others
Ha'utu 39 1 21 0 0 17 0 39 21 4 9 5 0
Kala'au 26 0 23 0 0 3 0 26 17 0 5 4 0
Fo'ui 104 45 28 0 0 31 0 104 56 13 15 20 0
Ha'avakatolo 40 1 26 0 0 13 0 40 22 3 8 7 0
Ahau 61 1 34 0 0 26 0 61 23 17 8 13 0
Kanokupolu 65 5 30 0 0 30 0 65 41 6 11 7 0
Ha'atafu 47 2 26 0 0 19 0 47 5 19 5 18 0
Atata 31 0 10 0 1 20 0 31 9 2 5 14 1
Vava'u 2,715 401 1,509 9 24 766 6 2,715 1,486 267 284 671 7
Neiafu 1,041 182 688 1 0 166 4 1,041 730 107 59 141 4
Neiafu 743 155 520 1 0 64 3 743 568 80 40 51 4
Makave 72 3 54 0 0 15 0 72 39 10 2 21 0
Toula 83 20 43 0 0 19 1 83 49 0 2 32 0
Utui 55 1 30 0 0 24 0 55 29 13 10 3 0
Ofu 26 0 13 0 0 13 0 26 10 1 1 14 0
Okoa 48 3 22 0 0 23 0 48 29 3 4 12 0
Olo'ua 14 0 6 0 0 8 0 14 6 0 0 8 0
Pangaimotu 232 27 120 0 0 85 0 232 131 17 33 51 0
Pangaimotu 125 15 47 0 0 63 0 125 68 8 16 33 0
Utulei 24 0 22 0 0 2 0 24 16 3 1 4 0
Nga'unoho 27 10 9 0 0 8 0 27 16 0 9 2 0
Utungake 56 2 42 0 0 12 0 56 31 6 7 12 0
Hahake 403 81 201 4 0 117 0 403 197 30 24 152 0
Ha'alaufuli 84 8 61 0 0 15 0 84 58 9 9 8 0
Ha'akio 23 0 23 0 0 0 0 23 11 1 2 9 0
Houma 17 5 3 0 0 9 0 17 14 1 1 1 0
Mangia 17 2 12 0 0 3 0 17 7 9 0 1 0
Ta'anea 128 37 50 4 0 37 0 128 44 6 6 72 0
Tu'anekivale 82 11 36 0 0 35 0 82 42 1 5 34 0
Koloa 31 0 15 0 0 16 0 31 11 3 1 16 0
Holeva 21 18 1 0 0 2 0 21 10 0 0 11 0
Leimatu'a 482 73 268 3 0 136 2 482 240 63 62 116 1
Leimatu'a 235 31 130 1 0 72 1 235 122 33 34 46 0
Holonga 83 3 38 0 0 41 1 83 34 8 8 32 1

Tonga 2016 Census of Population and Housing
Tonga Statistics Department
191
Division/District/ region
Main cooking fuel used Main place of cooking
Total Electricity Propane gas (LPG) Kerosene
Solar power
Wood and
coconut husk Others Total
Inside the
dwelling -
separate kitchen
area
Inside the
dwelling - no
devoted kitchen
Outside - open
cooking area
Outside - closed
cooking area Others
Feletoa 58 3 36 1 0 18 0 58 33 5 9 11 0
Mataika 106 36 64 1 0 5 0 106 51 17 11 27 0
Hihifo 385 38 195 1 0 151 0 385 153 39 82 110 1
Longomapu 109 1 52 0 0 56 0 109 46 13 21 29 0
Taoa 98 4 79 1 0 14 0 98 47 10 31 10 0
Tefisi 102 19 22 0 0 61 0 102 27 5 23 47 0
Vaimalo 23 13 0 0 0 10 0 23 6 3 6 7 1
Tu'anuku 53 1 42 0 0 10 0 53 27 8 1 17 0
Motu 172 0 37 0 24 111 0 172 35 11 24 101 1
Kapa 10 0 6 0 0 4 0 10 4 5 0 1 0
Falevai 20 0 9 0 0 11 0 20 8 1 1 10 0
Otea 23 0 2 0 0 21 0 23 4 0 5 14 0
Lape 5 0 0 0 0 5 0 5 0 2 0 3 0
Matamaka 23 0 0 0 21 2 0 23 4 1 5 13 0
Nuapapu 23 0 1 0 0 22 0 23 0 0 1 22 0
Ovaka 20 0 10 0 1 9 0 20 5 0 4 10 1
Taunga 9 0 4 0 0 5 0 9 3 0 1 5 0
Hunga 39 0 5 0 2 32 0 39 7 2 7 23 0
Foeata Island 0 0 0 0 0 0 0 0 0 0 0 0 0
Ha'apai 1,179 112 303 0 9 753 2 1,179 383 80 277 438 1
Pangai 433 33 172 0 1 226 1 433 194 34 66 138 1
Pangai 214 27 88 0 0 99 0 214 112 8 43 51 0
Hihifo 159 3 60 0 1 94 1 159 49 9 21 79 1
Holopeka 22 2 6 0 0 14 0 22 9 8 0 5 0
Koulo 38 1 18 0 0 19 0 38 24 9 2 3 0
Foa 236 72 31 0 0 132 1 236 101 15 59 61 0
Fangale'ounga 24 2 4 0 0 18 0 24 9 0 12 3 0
Fotua 42 2 7 0 0 33 0 42 6 0 13 23 0
Lotofoa 70 34 13 0 0 22 1 70 39 9 20 2 0
faleloa 64 30 7 0 0 27 0 64 28 5 3 28 0
Ha'afakaheng 17 0 0 0 0 17 0 17 9 0 5 3 0
Ha'ateiho Si'i 19 4 0 0 0 15 0 19 10 1 6 2 0
Lulunga 184 0 26 0 8 150 0 184 41 4 57 82 0
Ha'afeva 57 0 14 0 0 43 0 57 7 0 2 48 0

Tonga 2016 Census of Population and Housing
Tonga Statistics Department
192
Division/District/ region
Main cooking fuel used Main place of cooking
Total Electricity Propane gas (LPG) Kerosene
Solar power
Wood and
coconut husk Others Total
Inside the
dwelling -
separate kitchen
area
Inside the
dwelling - no
devoted kitchen
Outside - open
cooking area
Outside - closed
cooking area Others
Tungua 37 0 1 0 1 35 0 37 21 1 12 3 0
Fotuha'a 19 0 2 0 0 17 0 19 0 2 0 17 0
'O'ua 25 0 8 0 1 16 0 25 8 1 2 14 0
Matuku 16 0 0 0 6 10 0 16 4 0 12 0 0
Kotu 30 0 1 0 0 29 0 30 1 0 29 0 0
Mu'omu'a 99 0 41 0 0 58 0 99 15 3 24 57 0
Nomuka 81 0 26 0 0 55 0 81 15 3 6 57 0
Mango 8 0 6 0 0 2 0 8 0 0 8 0 0
Fonoifua 10 0 9 0 0 1 0 10 0 0 10 0 0
Ha`ano 89 3 8 0 0 78 0 89 22 9 17 41 0
Fakakai 25 1 4 0 0 20 0 25 18 6 0 1 0
Pukotala 18 0 1 0 0 17 0 18 1 0 6 11 0
Ha'ano 24 2 2 0 0 20 0 24 1 3 7 13 0
Muitoa 7 0 0 0 0 7 0 7 1 0 4 2 0
Mo'unga'one 15 0 1 0 0 14 0 15 1 0 0 14 0
'Uiha 138 4 25 0 0 109 0 138 10 15 54 59 0
Uiha 76 4 23 0 0 49 0 76 10 14 38 14 0
Felemea 31 0 1 0 0 30 0 31 0 1 4 26 0
Lofanga 31 0 1 0 0 30 0 31 0 0 12 19 0
Eua 885 26 339 1 1 518 0 885 394 43 175 270 3
Eua Motu'a 508 18 204 1 0 285 0 508 211 36 133 127 1
Ohonua 221 4 108 0 0 109 0 221 88 30 66 37 0
Tufuvai 41 3 19 0 0 19 0 41 23 0 3 15 0
Pangai 59 0 24 0 0 35 0 59 26 1 22 10 0
Houma 55 1 18 0 0 36 0 55 13 3 5 33 1
Ha'atu'a 96 10 18 1 0 67 0 96 46 2 31 17 0
Ta'anga 36 0 17 0 0 19 0 36 15 0 6 15 0
'Eua fo'ou 377 8 135 0 1 233 0 377 183 7 42 143 2
Angaha 65 1 48 0 0 16 0 65 45 0 10 10 0
Futu 51 0 16 0 0 35 0 51 14 2 12 23 0
Esia 37 2 7 0 0 28 0 37 8 1 3 25 0
Sapa'ata 24 0 14 0 0 10 0 24 13 0 2 9 0
Fata'ulua 36 1 9 0 0 26 0 36 20 1 5 10 0
Mu'a 28 0 10 0 0 18 0 28 13 1 0 14 0

Tonga 2016 Census of Population and Housing
Tonga Statistics Department
193
Division/District/ region
Main cooking fuel used Main place of cooking
Total Electricity Propane gas (LPG) Kerosene
Solar power
Wood and
coconut husk Others Total
Inside the
dwelling -
separate kitchen
area
Inside the
dwelling - no
devoted kitchen
Outside - open
cooking area
Outside - closed
cooking area Others
Tongamama'o 29 0 14 0 0 15 0 29 24 0 3 2 0
Petani 57 3 12 0 0 42 0 57 21 2 3 29 2
Mata'aho 50 1 5 0 1 43 0 50 25 0 4 21 0
Ongo Niua 273 0 33 1 4 235 0 273 100 23 40 110 0
Niuatoputapu 172 0 21 0 1 150 0 172 74 8 24 66 0
Hihifo 71 0 14 0 0 57 0 71 34 7 2 28 0
Vaipoa 37 0 1 0 1 35 0 37 33 0 0 4 0
Falehau 56 0 6 0 0 50 0 56 7 1 16 32 0
Tafahi 8 0 0 0 0 8 0 8 0 0 6 2 0
Niuafo'ou 101 0 12 1 3 85 0 101 26 15 16 44 0
Esia 26 0 3 0 3 20 0 26 16 5 4 1 0
Kolofo'ou 11 0 3 0 0 8 0 11 2 2 3 4 0
Sapaata 26 0 5 1 0 20 0 26 4 1 0 21 0
Fata'ulua 13 0 0 0 0 13 0 13 3 7 3 0 0
Mata'aho 3 0 0 0 0 3 0 3 0 0 2 1 0
Mu'a 6 0 0 0 0 6 0 6 0 0 3 3 0
Tongamama'o 2 0 0 0 0 2 0 2 0 0 0 2 0
Petani 14 0 1 0 0 13 0 14 1 0 1 12 0
Urban 4,089 588 3,290 10 3 192 6 4,089 3,288 445 253 100 3
Rural 13,916 1,372 8,240 48 52 4,182 22 13,916 8,219 1,260 1,880 2,536 21 Greater Nuku'alofa 6,139 809 4,867 21 7 426 9 6,139 4,748 676 455 256 4

Tonga 2016 Census of Population and Housing
Tonga Statistics Department
194
Table H 11: Private Households main source of lighting by division, district, village and region
Division/ District/ region
Main source of lighting Main Waste Disposal
Total
Public power supply Solar
Own generator Kerosene Other Total
Personal bin
(public collection)
Personal bin (take to dump yourself) Burn it Compost
Bury in yard/bush Other
TONGA 18,005 16,662 767 44 260 272 18,005 12,358 749 4,556 148 182 12
Tongatapu 12,953 12,438 133 36 172 174 12,953 11,722 240 786 75 123 7
Kolofo'ou 3,108 2,961 59 18 41 29 3,108 2,982 29 61 17 18 1
Kolofo'ou 1,475 1,458 2 0 7 8 1,475 1,448 9 12 3 2 1
Ma'ufanga 1,237 1,204 8 5 6 14 1,237 1,208 7 17 2 3 0
Nukumotu 8 0 7 0 1 0 8 6 0 2 0 0 0
Popua 312 297 3 2 4 6 312 292 2 8 5 5 0
Tukutonga 75 2 39 10 23 1 75 28 11 21 7 8 0
Pangaimotu 1 0 0 1 0 0 1 0 0 1 0 0 0
Kolomotu'a 3,031 2,964 12 3 28 24 3,031 2,880 29 96 7 19 0
Kolomotu'a 1,377 1,358 2 0 11 6 1,377 1,312 17 34 4 10 0
Havelu 617 604 1 0 4 8 617 605 4 7 1 0 0
Tofoa 590 580 3 2 2 3 590 567 5 16 0 2 0
Hofoa 193 176 4 0 9 4 193 156 1 28 1 7 0
Puke 156 150 2 1 0 3 156 148 2 6 0 0 0
Sia'atoutai 98 96 0 0 2 0 98 92 0 5 1 0 0
Vaini 2,201 2,122 14 7 21 37 2,201 1,976 78 90 13 43 1
Vaini 576 548 10 4 6 8 576 486 19 26 11 33 1
Malapo 106 104 0 0 0 2 106 100 1 5 0 0 0
Longoteme 101 92 1 0 1 7 101 97 0 3 0 1 0
Folaha 162 151 1 1 3 6 162 152 2 7 0 1 0
Nukuhetulu 63 63 0 0 0 0 63 61 0 2 0 0 0
Veitongo 179 175 1 0 3 0 179 128 40 9 1 1 0
Ha'ateiho 449 443 0 0 3 3 449 415 14 18 1 1 0
Pea 345 334 1 2 1 7 345 330 0 13 0 2 0
Tokomololo 220 212 0 0 4 4 220 207 2 7 0 4 0
Tatakamotonga 1,248 1,189 3 4 27 25 1,248 1,019 17 188 17 6 1
Tatakamotonga 324 311 1 1 5 6 324 304 6 14 0 0 0
Holonga 89 87 0 0 1 1 89 85 1 0 0 3 0
Pelehake 149 144 1 1 0 3 149 136 1 9 2 1 0
Fua'amotu 309 295 1 1 8 4 309 208 3 83 14 0 1
Nakolo 65 62 0 0 0 3 65 45 0 18 0 2 0
Ha'asini 158 139 0 1 11 7 158 108 1 49 0 0 0

Tonga 2016 Census of Population and Housing
Tonga Statistics Department
195
Division/ District/ region
Main source of lighting Main Waste Disposal
Total
Public power supply Solar
Own generator Kerosene Other Total
Personal bin
(public collection)
Personal bin (take to dump yourself) Burn it Compost
Bury in yard/bush Other
Lavengatonga 65 64 0 0 0 1 65 59 0 6 0 0 0
Haveluliku 26 24 0 0 2 0 26 21 0 5 0 0 0
Fatumu 63 63 0 0 0 0 63 53 5 4 1 0 0
Lapaha 1,234 1,160 17 2 29 26 1,234 1,039 60 113 8 14 0
Lapaha 331 323 2 0 3 3 331 303 9 17 2 0 0
Talasiu 58 45 1 0 2 10 58 53 1 4 0 0 0
Hoi 75 65 1 1 4 4 75 62 5 6 1 1 0
Nukuleka 45 42 0 0 3 0 45 34 0 11 0 0 0
Makaunga 58 55 0 0 3 0 58 48 0 6 4 0 0
Talafo'ou 74 71 0 0 2 1 74 69 1 2 0 2 0
Manuka 46 46 0 0 0 0 46 34 11 0 0 1 0
Navutoka 117 115 0 0 1 1 117 98 7 12 0 0 0
Kolonga 216 205 2 0 6 3 216 169 25 20 0 2 0
Afa 71 67 0 0 3 1 71 43 1 26 0 1 0
Niutoua 130 125 0 0 2 3 130 126 0 3 1 0 0
Eueiki 12 1 11 0 0 0 12 0 0 5 0 7 0
Fukave 1 0 0 1 0 0 1 0 0 1 0 0 0
Nukunuku 1,391 1,351 4 0 18 18 1,391 1,261 14 94 6 13 3
Nukunuku 370 362 1 0 6 1 370 322 6 32 5 4 1
Matahau 105 104 0 0 1 0 105 102 0 3 0 0 0
Matafonua 45 45 0 0 0 0 45 29 0 13 0 3 0
Fatai 59 56 0 0 0 3 59 52 3 4 0 0 0
Lakepa 54 53 0 0 1 0 54 54 0 0 0 0 0
Vaotu'u 81 77 0 0 2 2 81 70 0 9 1 1 0
Utulau 98 96 0 0 0 2 98 97 1 0 0 0 0
Ha'alalo 103 98 0 0 3 2 103 100 0 2 0 1 0
Ha'akame 116 111 1 0 1 3 116 111 1 3 0 0 1
Houma 360 349 2 0 4 5 360 324 3 28 0 4 1
Kolovai 740 691 24 2 8 15 740 565 13 144 7 10 1
Kolovai 118 116 0 0 0 2 118 110 0 7 0 0 1
Te'ekiu 104 97 0 1 3 3 104 82 2 19 0 1 0
Masilamea 34 34 0 0 0 0 34 32 0 2 0 0 0
Fahefa 71 69 0 0 1 1 71 39 0 31 1 0 0
Ha'utu 39 38 0 0 0 1 39 31 0 7 1 0 0
Kala'au 26 25 0 0 1 0 26 17 0 9 0 0 0

Tonga 2016 Census of Population and Housing
Tonga Statistics Department
196
Division/ District/ region
Main source of lighting Main Waste Disposal
Total
Public power supply Solar
Own generator Kerosene Other Total
Personal bin
(public collection)
Personal bin (take to dump yourself) Burn it Compost
Bury in yard/bush Other
Fo'ui 104 102 0 0 1 1 104 74 1 22 0 7 0
Ha'avakatolo 40 39 0 0 0 1 40 37 1 2 0 0 0
Ahau 61 61 0 0 0 0 61 53 0 4 4 0 0
Kanokupolu 65 62 0 0 2 1 65 56 5 4 0 0 0
Ha'atafu 47 47 0 0 0 0 47 33 3 11 0 0 0
Atata 31 1 24 1 0 5 31 1 1 26 1 2 0
Vava'u 2,715 2,426 211 2 32 44 2,715 596 354 1,695 36 31 3
Neiafu 1,041 979 41 0 7 14 1,041 280 229 513 6 12 1
Neiafu 743 728 1 0 3 11 743 167 179 382 5 9 1
Makave 72 72 0 0 0 0 72 50 3 19 0 0 0
Toula 83 81 2 0 0 0 83 59 3 20 1 0 0
Utui 55 52 0 0 2 1 55 0 1 53 0 1 0
Ofu 26 0 24 0 1 1 26 0 1 25 0 0 0
Okoa 48 46 0 0 1 1 48 4 42 0 0 2 0
Olo'ua 14 0 14 0 0 0 14 0 0 14 0 0 0
Pangaimotu 232 221 0 0 3 8 232 60 37 133 0 2 0
Pangaimotu 125 116 0 0 3 6 125 18 6 100 0 1 0
Utulei 24 24 0 0 0 0 24 0 19 5 0 0 0
Nga'unoho 27 27 0 0 0 0 27 1 4 21 0 1 0
Utungake 56 54 0 0 0 2 56 41 8 7 0 0 0
Hahake 403 393 0 0 7 3 403 40 6 343 10 4 0
Ha'alaufuli 84 83 0 0 1 0 84 25 0 59 0 0 0
Ha'akio 23 23 0 0 0 0 23 0 0 23 0 0 0
Houma 17 17 0 0 0 0 17 0 0 11 2 4 0
Mangia 17 17 0 0 0 0 17 3 0 14 0 0 0
Ta'anea 128 124 0 0 4 0 128 6 5 116 1 0 0
Tu'anekivale 82 81 0 0 0 1 82 6 1 73 2 0 0
Koloa 31 27 0 0 2 2 31 0 0 27 4 0 0
Holeva 21 21 0 0 0 0 21 0 0 20 1 0 0
Leimatu'a 482 462 0 1 9 10 482 123 43 299 15 1 1
Leimatu'a 235 221 0 1 6 7 235 90 29 116 0 0 0
Holonga 83 82 0 0 1 0 83 16 2 65 0 0 0
Feletoa 58 55 0 0 1 2 58 17 0 39 1 0 1
Mataika 106 104 0 0 1 1 106 0 12 79 14 1 0
Hihifo 385 371 1 1 4 8 385 93 36 244 1 11 0

Tonga 2016 Census of Population and Housing
Tonga Statistics Department
197
Division/ District/ region
Main source of lighting Main Waste Disposal
Total
Public power supply Solar
Own generator Kerosene Other Total
Personal bin
(public collection)
Personal bin (take to dump yourself) Burn it Compost
Bury in yard/bush Other
Longomapu 109 103 1 0 1 4 109 58 2 49 0 0 0
Taoa 98 97 0 1 0 0 98 32 2 61 0 3 0
Tefisi 102 98 0 0 2 2 102 0 12 90 0 0 0
Vaimalo 23 23 0 0 0 0 23 2 1 20 0 0 0
Tu'anuku 53 50 0 0 1 2 53 1 19 24 1 8 0
Motu 172 0 169 0 2 1 172 0 3 163 4 1 1
Kapa 10 0 10 0 0 0 10 0 1 9 0 0 0
Falevai 20 0 20 0 0 0 20 0 0 20 0 0 0
Otea 23 0 22 0 0 1 23 0 0 22 0 0 1
Lape 5 0 4 0 1 0 5 0 0 5 0 0 0
Matamaka 23 0 23 0 0 0 23 0 1 22 0 0 0
Nuapapu 23 0 22 0 1 0 23 0 0 23 0 0 0
Ovaka 20 0 20 0 0 0 20 0 1 16 2 1 0
Taunga 9 0 9 0 0 0 9 0 0 7 2 0 0
Hunga 39 0 39 0 0 0 39 0 0 39 0 0 0
Foeata Island 0 0 0 0 0 0 0 0 0 0 0 0 0
Ha'apai 1,179 955 187 3 17 17 1,179 19 52 1,056 25 26 1
Pangai 433 420 4 2 3 4 433 15 36 353 14 14 1
Pangai 214 208 1 2 2 1 214 7 27 158 14 8 0
Hihifo 159 154 2 0 1 2 159 8 7 137 0 6 1
Holopeka 22 21 1 0 0 0 22 0 0 22 0 0 0
Koulo 38 37 0 0 0 1 38 0 2 36 0 0 0
Foa 236 223 1 0 6 6 236 3 13 213 5 2 0
Fangale'ounga 24 24 0 0 0 0 24 0 0 22 0 2 0
Fotua 42 34 1 0 6 1 42 0 0 41 1 0 0
Lotofoa 70 69 0 0 0 1 70 0 0 69 1 0 0
faleloa 64 60 0 0 0 4 64 3 13 46 2 0 0
Ha'afakahenga 17 17 0 0 0 0 17 0 0 16 1 0 0
Ha'ateiho Si'i 19 19 0 0 0 0 19 0 0 19 0 0 0
Lulunga 184 56 117 0 7 4 184 0 0 177 2 5 0
Ha'afeva island 57 56 0 0 1 0 57 0 0 57 0 0 0
Tungua 37 0 33 0 1 3 37 0 0 37 0 0 0
Fotuha'a 19 0 18 0 0 1 19 0 0 19 0 0 0
'O'ua 25 0 21 0 4 0 25 0 0 25 0 0 0
Matuku 16 0 16 0 0 0 16 0 0 9 2 5 0

Tonga 2016 Census of Population and Housing
Tonga Statistics Department
198
Division/ District/ region
Main source of lighting Main Waste Disposal
Total
Public power supply Solar
Own generator Kerosene Other Total
Personal bin
(public collection)
Personal bin (take to dump yourself) Burn it Compost
Bury in yard/bush Other
Kotu 30 0 29 0 1 0 30 0 0 30 0 0 0
Mu'omu'a 99 80 19 0 0 0 99 1 2 96 0 0 0
Nomuka 81 80 1 0 0 0 81 1 2 78 0 0 0
Mango 8 0 8 0 0 0 8 0 0 8 0 0 0
Fonoifua 10 0 10 0 0 0 10 0 0 10 0 0 0
Ha`ano 89 72 16 0 1 0 89 0 1 86 0 2 0
Fakakai 25 25 0 0 0 0 25 0 1 23 0 1 0
Pukotala 18 17 1 0 0 0 18 0 0 18 0 0 0
Ha'ano 24 24 0 0 0 0 24 0 0 24 0 0 0
Muitoa 7 6 0 0 1 0 7 0 0 7 0 0 0
Mo'unga'one 15 0 15 0 0 0 15 0 0 14 0 1 0
'Uiha 138 104 30 1 0 3 138 0 0 131 4 3 0
Uiha 76 75 1 0 0 0 76 0 0 70 4 2 0
Felemea 31 29 2 0 0 0 31 0 0 30 0 1 0
Lofanga 31 0 27 1 0 3 31 0 0 31 0 0 0
Eua 885 842 9 1 19 14 885 20 95 759 8 2 1
Eua Motu'a 508 483 6 1 10 8 508 11 43 447 5 2 0
Ohonua 221 214 2 1 1 3 221 9 7 201 4 0 0
Tufuvai 41 39 0 0 1 1 41 0 19 21 1 0 0
Pangai 59 57 0 0 2 0 59 1 14 44 0 0 0
Houma 55 54 0 0 1 0 55 0 0 55 0 0 0
Ha'atu'a 96 86 4 0 2 4 96 1 2 91 0 2 0
Ta'anga 36 33 0 0 3 0 36 0 1 35 0 0 0
'Eua fo'ou 377 359 3 0 9 6 377 9 52 312 3 0 1
Angaha 65 63 0 0 2 0 65 2 22 40 0 0 1
Futu 51 45 0 0 4 2 51 0 4 47 0 0 0
Esia 37 36 1 0 0 0 37 2 7 28 0 0 0
Sapa'ata 24 24 0 0 0 0 24 0 6 18 0 0 0
Fata'ulua 36 36 0 0 0 0 36 1 1 33 1 0 0
Mu'a 28 27 1 0 0 0 28 0 1 26 1 0 0
Tongamama'o 29 29 0 0 0 0 29 4 6 19 0 0 0
Petani 57 54 1 0 0 2 57 0 4 52 1 0 0
Mata'aho 50 45 0 0 3 2 50 0 1 49 0 0 0
Ongo Niua 273 1 227 2 20 23 273 1 8 260 4 0 0
Niuatoputapu 172 0 128 2 19 23 172 1 0 167 4 0 0
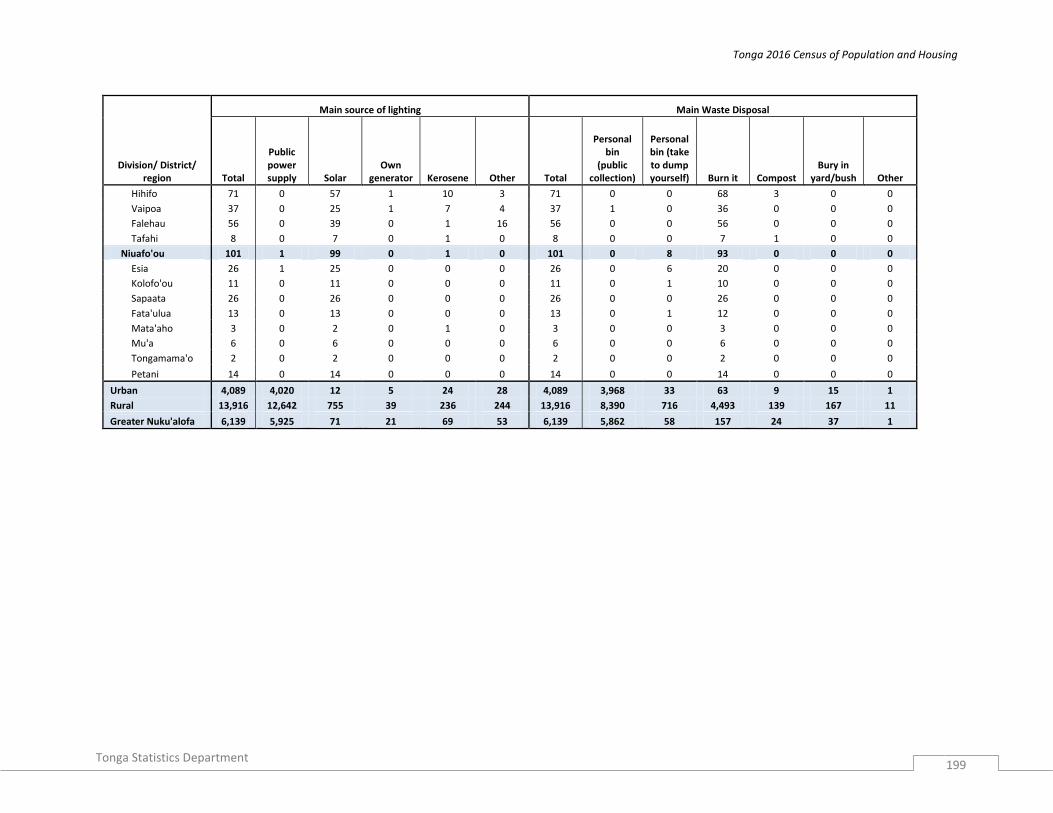
Tonga 2016 Census of Population and Housing
Tonga Statistics Department
199
Division/ District/ region
Main source of lighting Main Waste Disposal
Total
Public power supply Solar
Own generator Kerosene Other Total
Personal bin
(public collection)
Personal bin (take to dump yourself) Burn it Compost
Bury in yard/bush Other
Hihifo 71 0 57 1 10 3 71 0 0 68 3 0 0
Vaipoa 37 0 25 1 7 4 37 1 0 36 0 0 0
Falehau 56 0 39 0 1 16 56 0 0 56 0 0 0
Tafahi 8 0 7 0 1 0 8 0 0 7 1 0 0
Niuafo'ou 101 1 99 0 1 0 101 0 8 93 0 0 0
Esia 26 1 25 0 0 0 26 0 6 20 0 0 0
Kolofo'ou 11 0 11 0 0 0 11 0 1 10 0 0 0
Sapaata 26 0 26 0 0 0 26 0 0 26 0 0 0
Fata'ulua 13 0 13 0 0 0 13 0 1 12 0 0 0
Mata'aho 3 0 2 0 1 0 3 0 0 3 0 0 0
Mu'a 6 0 6 0 0 0 6 0 0 6 0 0 0
Tongamama'o 2 0 2 0 0 0 2 0 0 2 0 0 0
Petani 14 0 14 0 0 0 14 0 0 14 0 0 0
Urban 4,089 4,020 12 5 24 28 4,089 3,968 33 63 9 15 1
Rural 13,916 12,642 755 39 236 244 13,916 8,390 716 4,493 139 167 11
Greater Nuku'alofa 6,139 5,925 71 21 69 53 6,139 5,862 58 157 24 37 1

Tonga 2016 Census of Population and Housing
Tonga Statistics Department
200
Table H 12: Households’ goods in the household by division and region
Private Houseolds Goods
TONGA Tongatapu Vava'u Ha'apai Eua
Number of Household
Number of Goods
Number of Household
Number of Goods
Number of Household
Number of Goods
Number of Household
Number of Goods
Number of Household
Number of Goods
Car 6,647 7,618 5,675 6,580 669 714 166 182 120 123
Trucks 920 1,022 693 776 146 159 34 35 32 37
Van 6,103 6,995 4,628 5,361 832 912 234 255 345 397
Motor Bike 237 275 158 190 41 45 19 21 16 16
Buses 80 119 69 108 7 7 1 1 2 2
Bicycles 4,695 7,009 3,527 5,418 372 539 442 588 236 326
Canoes 96 123 40 52 34 42 21 28 1 1
Boat 635 723 294 335 205 224 111 137 12 13
Fridges 8,959 9,502 7,241 7,714 981 1,015 313 335 386 397
Freezer 7,144 7,620 5,469 5,858 933 962 423 460 281 302
Stove 15,419 16,480 11,491 12,348 2,247 2,332 889 961 613 652
Washing Machine 13,947 14,374 10,401 10,774 1,989 2,022 743 754 681 689
Sewing Machine 3,110 3,337 2,349 2,551 463 479 176 181 96 99
Generator 946 1,002 535 574 159 169 123 125 13 14
Solar Panel 755 896 225 252 214 278 121 165 3 3
Air Condition 329 481 299 417 23 52 3 7 3 4
TV 13,147 14,858 10,387 11,927 1,640 1,733 417 446 668 717
CD/ DVD Player 10,414 11,400 7,727 8,539 1,636 1,722 466 506 543 589
Cell Phones 15,929 41,082 11,505 31,410 2,347 5,037 1,074 2,509 789 1,784
Land Line Phones 4,720 4,720 3,895 3,895 365 365 202 202 242 242
Desktop Comuter 1,576 1,822 1,380 1,610 118 128 49 53 27 29
Labtops 6,791 8,887 5,542 7,465 636 712 296 355 249 282
Tablets 3,204 4,314 2,670 3,680 332 393 104 134 88 97
None 118 0 45 0 37 0 20 0 10 0
Private Houseolds Goods
Ongo Niua Urban Rural Greater Nukualofa
Number of Household
Number of Goods
Number of Household
Number of Goods
Number of Household
Number of Goods
Number of Household
Number of Goods
Car 17 19 2,063 2,469 4,584 5,149 3,014 3,599 Trucks 15 15 187 214 733 808 262 300 Van 64 70 1,495 1,743 4,608 5,252 2,223 2,607 Motor Bike 3 3 47 51 190 224 66 82 Buses 1 1 7 8 73 111 19 24 Bicycles 118 138 892 1,414 3,803 5,595 1,366 2,200 Canoes 0 0 10 10 86 113 15 18 Boat 13 14 112 132 523 591 179 204 Fridges 38 41 2,651 2,869 6,308 6,633 3,832 4,142 Freezer 38 38 1,809 1,974 5,335 5,646 2,580 2,803 Stove 179 187 3,742 4,049 11,677 12,431 5,611 6,087 Washing Machine 133 135 3,458 3,596 10,489 10,778 5,063 5,259 Sewing Machine 26 27 774 853 2,336 2,484 1,197 1,313 Generator 116 120 146 158 800 844 254 275 solar Panel 192 198 110 116 645 780 172 188 Air Condition 1 1 165 230 164 251 232 331 TV 35 35 3,419 4,010 9,728 10,848 5,046 5,890 CD/ DVD Player 42 44 2,466 2,742 7,948 8,658 3,645 4,054 Cell Phones 214 342 3,612 10,421 12,317 30,661 5,478 15,658 Land Line Phones 16 16 1,590 1,590 3,130 3,130 2,238 2,238 Desktop Comuter 2 2 627 753 949 1,069 878 1,035 Labtops 68 73 2,170 3,078 4,621 5,809 3,206 4,485 Tablets 10 10 1,083 1,540 2,121 2,774 1,523 2,137 None 6 0 12 0 106 0 18 0

Tonga 2016 Census of Population and Housing
Tonga Statistics Department
201
Table H 13: Household access to internet and have battery Radio by division, district and region
Division/ District/ region
Access Internet
Access to baterry radio
Total Households
Access internet at
home TCC Only Digicel Only Both
TONGA 18,005 2,385 1,648 597 140 7,788
Tongatapu 12,953 1,966 1,406 437 123 5,060
Kolofo'ou 3,108 642 490 121 31 1,115
Kolomotu'a 3,031 610 456 126 28 1,129
Vaini 2,201 314 200 89 25 808
Tatakamotonga 1,248 110 60 32 18 599
Lapaha 1,234 91 65 24 2 607
Nukunuku 1,391 107 78 25 4 518
Kolovai 740 92 57 20 15 284
Vava'u 2,715 236 108 117 11 1,325
Neiafu 1,041 169 90 70 9 582
Pangaimotu 232 25 8 15 2 86
Hahake 403 17 5 12 0 200
Leimatu'a 482 15 2 13 0 187
Hihifo 385 7 1 6 0 140
Motu 172 3 2 1 0 130
Ha'apai 1179 137 93 39 5 829
Pangai 433 81 51 26 4 219
Foa 236 12 8 3 1 172
Lulunga 184 26 26 0 0 155
Mu'omu'a 99 1 1 0 0 88
Ha`ano 89 11 3 8 0 69
'Uiha 138 6 4 2 0 126
Eua 885 46 41 4 1 395
Eua Motu'a 508 28 23 4 1 261
'Eua fo'ou 377 18 18 0 0 134
Ongo Niua 273 0 0 0 0 179
Niuatoputapu 172 0 0 0 0 126
Niuafo'ou 101 0 0 0 0 53
Urban 4,089 905 680 182 50 1,483
Rural 13,916 1480 968 415 90 6,305
Greater Nuku'alofa 6,139 1251 946 247 59 2,244

Tonga 2016 Census of Population and Housing
Tonga Statistics Department
202
Table H 14: Main means of waste disposal by division, district, village and region.
Division/ District/ Region
Means of Waste Disposal
Total
Personal bin (public
collection)
Personal bin (take to dump
yourself) Burn it Compost Bury in
yard/bush
Ocean, river, or other body of water Other
TONGA 18,005 12,358 749 4,556 148 182 8 4
Tongatapu 12,953 11,722 240 786 75 123 6 1
Kolofo'ou 3,108 2,982 29 61 17 18 1 0
Kolomotu'a 3,031 2,880 29 96 7 19 0 0
Vaini 2,201 1,976 78 90 13 43 1 0
Tatakamotonga 1,248 1,019 17 188 17 6 1 0
Lapaha 1,234 1,039 60 113 8 14 0 0
Nukunuku 1,391 1,261 14 94 6 13 3 0
Kolovai 740 565 13 144 7 10 0 1
Vava'u 2,715 596 354 1,695 36 31 0 3
Neiafu 1,041 280 229 513 6 12 0 1
Pangaimotu 232 60 37 133 0 2 0 0
Hahake 403 40 6 343 10 4 0 0
Leimatu'a 482 123 43 299 15 1 0 1
Hihifo 385 93 36 244 1 11 0 0
Motu 172 0 3 163 4 1 0 1
Ha'apai 1,179 19 52 1,056 25 26 1 0
Pangai 433 15 36 353 14 14 1 0
Foa 236 3 13 213 5 2 0 0
Lulunga 184 0 0 177 2 5 0 0
Mu'omu'a 99 1 2 96 0 0 0 0
Ha`ano 89 0 1 86 0 2 0 0
'Uiha 138 0 0 131 4 3 0 0
Eua 885 20 95 759 8 2 1 0
Eua Motu'a 508 11 43 447 5 2 0 0
Eua Fo'ou 377 9 52 312 3 0 1 0
Ongo Niua 273 1 8 260 4 0 0 0
Niuatoputapu 172 1 0 167 4 0 0 0
Niuafo'ou 101 0 8 93 0 0 0 0
Urban 4,089 3,968 33 63 9 15 1 0
Rural 13,916 8,390 716 4,493 139 167 7 4
Greater Nuku'alofa 6,139 5,862 58 157 24 37 1 0

Tonga 2016 Census of Population and Housing
Tonga Statistics Department
203
Table H 15: Household tenure by district and region
Island/ District/ region
TENURE
Total
Owned by you or someone in this
Household with a mortgage or loan
Owned by you or someone in this Household free and clear? (no
loan) Rented? (with any
payments) Occupied without
payment?
TONGA 18,005 1,251 11,449 909 4,396
Tongatapu 12,953 937 8,160 822 3,034
Kolofo'ou 3,108 233 1,906 369 600
Kolomotu'a 3,031 278 1,711 314 728
Vaini 2,201 143 1,444 62 552
Tatakamotonga 1,248 51 868 30 299
Lapaha 1,234 103 755 13 363
Nukunuku 1,391 59 1,015 21 296
Kolovai 740 70 461 13 196
Vava'u 2,715 191 1,803 57 664
Neiafu 1,041 104 661 53 223
Pangaimotu 232 10 152 3 67
Hahake 403 53 230 1 119
Leimatu'a 482 8 324 0 150
Hihifo 385 11 305 0 69
Motu 172 5 131 0 36
Ha'apai 1,179 24 765 15 375
Pangai 433 18 241 10 164
Foa 236 1 165 3 67
Lulunga 184 1 137 1 45
Mu'omu'a 99 1 81 1 16
Ha`ano 89 1 58 0 30
'Uiha 138 2 83 0 53
Eua 885 96 561 12 216
Eua Motu'a 508 55 328 7 118
Eua Fo'ou 377 41 233 5 98
Ongo Niua 273 3 160 3 107
Niuatoputapu 172 3 142 2 25
Niuafo'ou 101 0 18 1 82
Urban 4,089 285 2,406 505 893
Rural 13,916 966 9,043 404 3,503
Greater Nuku'alofa 6,139 511 3,617 683 1,328

Tonga 2016 Census of Population and Housing
Tonga Statistics Department
204
Table H 16: Main source of household income by division, district and region
Island/ District/ Region
Main source of income
Total Regular salary
Income from own
business Sale of
products
Rental income
from Land Lease
Rental income
from house rented Remittances
Pension or retirement None Other
TONGA 18,005 8,312 1,468 3,683 42 82 3,455 355 561 47
Tongatapu 12,953 6,575 1,182 2,050 31 70 2,382 247 386 30
Kolofo'ou 3,108 1,891 350 278 15 26 431 64 49 4
Kolomotu'a 3,031 1,933 263 230 6 27 416 73 74 9
Vaini 2,201 1,070 213 387 4 9 371 43 99 5
Tatakamotonga 1,248 491 75 289 2 3 324 18 40 6
Lapaha 1,234 392 76 332 2 3 380 18 30 1
Nukunuku 1,391 527 159 340 1 2 266 19 74 3
Kolovai 740 271 46 194 1 0 194 12 20 2
Vava'u 2,715 900 174 823 9 8 599 67 128 7
Neiafu 1,041 511 108 122 6 6 196 29 58 5
Pangaimotu 232 96 15 75 1 1 33 6 5 0
Hahake 403 96 9 129 0 0 135 8 26 0
Leimatu'a 482 91 23 207 2 0 145 8 6 0
Hihifo 385 62 14 230 0 1 62 6 8 2
Motu 172 44 5 60 0 0 28 10 25 0
Ha'apai 1,179 431 49 399 1 4 248 19 23 5
Pangai 433 247 19 73 1 4 67 5 14 3
Foa 236 69 7 83 0 0 74 0 2 1
Lulunga 184 43 7 106 0 0 26 0 2 0
Mu'omu'a 99 20 4 43 0 0 26 1 5 0
Ha`ano 89 28 2 32 0 0 21 6 0 0
'Uiha 138 24 10 62 0 0 34 7 0 1
Eua 885 302 56 300 1 0 183 15 23 5
Eua Motu'a 508 200 33 177 0 0 77 4 13 4
'Eua fo'ou 377 102 23 123 1 0 106 11 10 1
Ongo Niua 273 104 7 111 0 0 43 7 1 0
Niuatoputapu 172 59 5 96 0 0 11 1 0 0
Niuafo'ou 101 45 2 15 0 0 32 6 1 0
Urban 4,089 2,595 443 255 19 37 562 103 69 6
Rural 13,916 5,717 1,025 3,428 23 45 2,893 252 492 41
Greater Nuku'alofa 6,139 3,824 613 508 21 53 847 137 123 13

Tonga 2016 Census of Population and Housing
Tonga Statistics Department
205
Table H 17: Main source of household income by division, district and village
Island/ District / Region
Main source of income
Total Regular salary
Income from own
business Sale of
products
Rental income
from Land Lease
Rental income
from house rented Remittances
Pension or retirement None Other
TONGA 18,005 8,312 1,468 3,683 42 82 3,455 355 561 47
Tongatapu 12,953 6,575 1,182 2,050 31 70 2,382 247 386 30
Kolofo'ou 3,108 1,891 350 278 15 26 431 64 49 4
Kolofo'ou 1,475 907 174 75 12 21 210 52 22 2
Ma'ufanga 1,237 789 135 87 3 4 185 9 23 2
Nukumotu 8 2 0 2 0 0 4 0 0 0
Popua 312 188 36 53 0 1 29 3 2 0
Tukutonga 75 5 4 61 0 0 3 0 2 0
Pangaimotu 1 0 1 0 0 0 0 0 0 0
Kolomotu'a 3,031 1,933 263 230 6 27 416 73 74 9
Kolomotu'a 1,377 899 134 93 4 12 167 42 24 2
Havelu 617 405 59 24 0 9 96 17 4 3
Tofoa 590 371 49 47 2 6 79 9 24 3
Hofoa 193 116 11 25 0 0 21 4 15 1
Puke 156 77 7 36 0 0 32 1 3 0
Sia'atoutai 98 65 3 5 0 0 21 0 4 0
Vaini 2,201 1,070 213 387 4 9 371 43 99 5
Vaini 576 286 70 98 4 3 81 14 19 1
Malapo 106 59 6 21 0 0 15 4 1 0
Longoteme 101 31 4 26 0 1 35 3 1 0
Folaha 162 75 14 37 0 1 31 2 2 0
Nukuhetulu 63 34 1 11 0 0 16 0 1 0
Veitongo 179 69 17 29 0 0 28 2 34 0
Ha'ateiho 449 225 30 77 0 4 74 14 23 2
Pea 345 190 45 37 0 0 55 2 14 2
Tokomololo 220 101 26 51 0 0 36 2 4 0
Tatakamotonga 1,248 491 75 289 2 3 324 18 40 6
Tatakamotonga 324 111 28 70 1 1 87 9 16 1
Holonga 89 34 4 20 1 0 24 2 3 1
Pelehake 149 58 9 44 0 1 32 2 1 2
Fua'amotu 309 150 12 58 0 1 76 4 7 1
Nakolo 65 23 5 22 0 0 15 0 0 0
Ha'asini 158 50 4 44 0 0 49 0 10 1
Lavengatonga 65 30 8 14 0 0 12 1 0 0
Haveluliku 26 10 3 6 0 0 7 0 0 0
Fatumu 63 25 2 11 0 0 22 0 3 0
Lapaha 1,234 392 76 332 2 3 380 18 30 1
Lapaha 331 146 15 57 0 2 98 8 5 0
Talasiu 58 15 3 31 0 0 8 1 0 0
Hoi 75 28 8 17 1 0 20 0 1 0
Nukuleka 45 9 4 21 0 0 9 0 2 0
Makaunga 58 20 4 14 0 0 7 1 12 0
Talafo'ou 74 21 0 4 0 0 48 0 0 1
Manuka 46 13 4 4 0 0 21 0 4 0
Navutoka 117 30 6 27 0 1 52 0 1 0
Kolonga 216 45 19 81 0 0 66 4 1 0
Afa 71 18 5 35 1 0 11 1 0 0
Niutoua 130 45 7 36 0 0 35 3 4 0
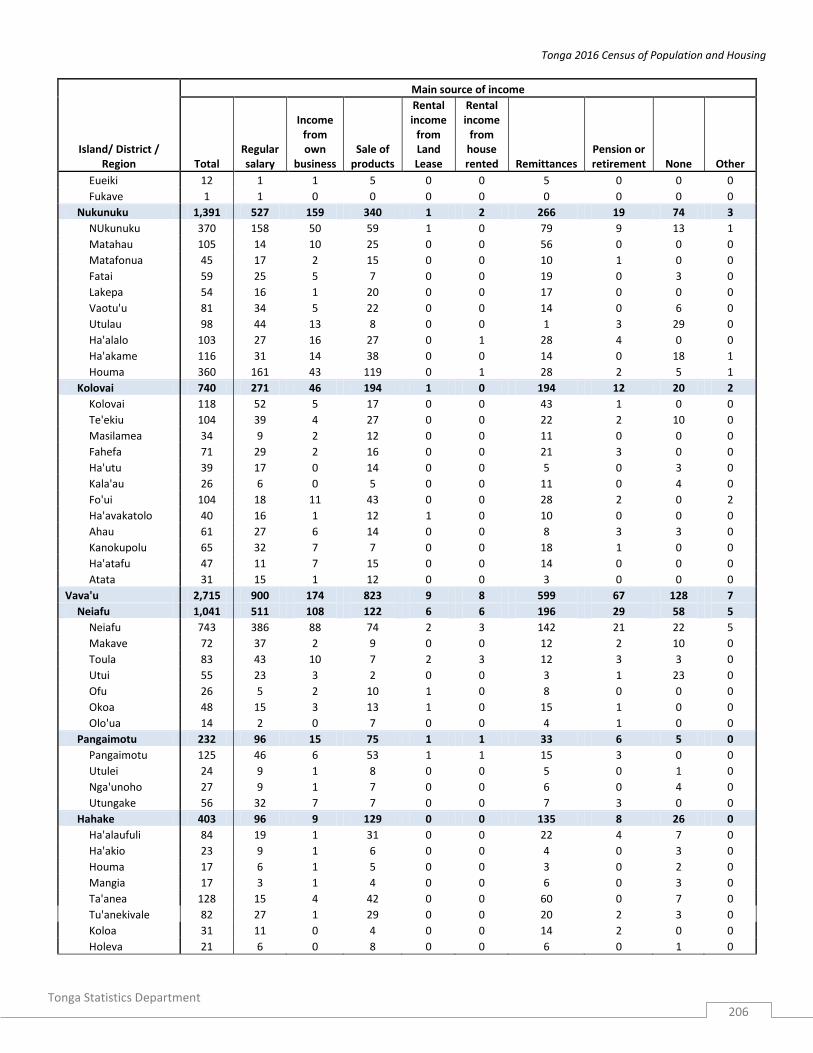
Tonga 2016 Census of Population and Housing
Tonga Statistics Department
206
Island/ District / Region
Main source of income
Total Regular salary
Income from own
business Sale of
products
Rental income
from Land Lease
Rental income
from house rented Remittances
Pension or retirement None Other
Eueiki 12 1 1 5 0 0 5 0 0 0
Fukave 1 1 0 0 0 0 0 0 0 0
Nukunuku 1,391 527 159 340 1 2 266 19 74 3
NUkunuku 370 158 50 59 1 0 79 9 13 1
Matahau 105 14 10 25 0 0 56 0 0 0
Matafonua 45 17 2 15 0 0 10 1 0 0
Fatai 59 25 5 7 0 0 19 0 3 0
Lakepa 54 16 1 20 0 0 17 0 0 0
Vaotu'u 81 34 5 22 0 0 14 0 6 0
Utulau 98 44 13 8 0 0 1 3 29 0
Ha'alalo 103 27 16 27 0 1 28 4 0 0
Ha'akame 116 31 14 38 0 0 14 0 18 1
Houma 360 161 43 119 0 1 28 2 5 1
Kolovai 740 271 46 194 1 0 194 12 20 2
Kolovai 118 52 5 17 0 0 43 1 0 0
Te'ekiu 104 39 4 27 0 0 22 2 10 0
Masilamea 34 9 2 12 0 0 11 0 0 0
Fahefa 71 29 2 16 0 0 21 3 0 0
Ha'utu 39 17 0 14 0 0 5 0 3 0
Kala'au 26 6 0 5 0 0 11 0 4 0
Fo'ui 104 18 11 43 0 0 28 2 0 2
Ha'avakatolo 40 16 1 12 1 0 10 0 0 0
Ahau 61 27 6 14 0 0 8 3 3 0
Kanokupolu 65 32 7 7 0 0 18 1 0 0
Ha'atafu 47 11 7 15 0 0 14 0 0 0
Atata 31 15 1 12 0 0 3 0 0 0
Vava'u 2,715 900 174 823 9 8 599 67 128 7
Neiafu 1,041 511 108 122 6 6 196 29 58 5
Neiafu 743 386 88 74 2 3 142 21 22 5
Makave 72 37 2 9 0 0 12 2 10 0
Toula 83 43 10 7 2 3 12 3 3 0
Utui 55 23 3 2 0 0 3 1 23 0
Ofu 26 5 2 10 1 0 8 0 0 0
Okoa 48 15 3 13 1 0 15 1 0 0
Olo'ua 14 2 0 7 0 0 4 1 0 0
Pangaimotu 232 96 15 75 1 1 33 6 5 0
Pangaimotu 125 46 6 53 1 1 15 3 0 0
Utulei 24 9 1 8 0 0 5 0 1 0
Nga'unoho 27 9 1 7 0 0 6 0 4 0
Utungake 56 32 7 7 0 0 7 3 0 0
Hahake 403 96 9 129 0 0 135 8 26 0
Ha'alaufuli 84 19 1 31 0 0 22 4 7 0
Ha'akio 23 9 1 6 0 0 4 0 3 0
Houma 17 6 1 5 0 0 3 0 2 0
Mangia 17 3 1 4 0 0 6 0 3 0
Ta'anea 128 15 4 42 0 0 60 0 7 0
Tu'anekivale 82 27 1 29 0 0 20 2 3 0
Koloa 31 11 0 4 0 0 14 2 0 0
Holeva 21 6 0 8 0 0 6 0 1 0

Tonga 2016 Census of Population and Housing
Tonga Statistics Department
207
Island/ District / Region
Main source of income
Total Regular salary
Income from own
business Sale of
products
Rental income
from Land Lease
Rental income
from house rented Remittances
Pension or retirement None Other
Leimatu'a 482 91 23 207 2 0 145 8 6 0
Leimatu'a 235 25 7 128 2 0 69 1 3 0
Holonga 83 17 4 13 0 0 47 1 1 0
Feletoa 58 17 2 30 0 0 8 1 0 0
Mataika 106 32 10 36 0 0 21 5 2 0
Hihifo 385 62 14 230 0 1 62 6 8 2
Longomapu 109 11 4 62 0 1 29 0 1 1
Taoa 98 21 5 56 0 0 11 0 5 0
Tefisi 102 11 3 76 0 0 8 1 2 1
Vaimalo 23 7 0 12 0 0 2 2 0 0
Tu'anuku 53 12 2 24 0 0 12 3 0 0
Motu 172 44 5 60 0 0 28 10 25 0
Kapa 10 5 0 2 0 0 3 0 0 0
Falevai 20 11 1 3 0 0 3 2 0 0
Otea 23 8 2 6 0 0 7 0 0 0
Lape 5 1 0 4 0 0 0 0 0 0
Matamaka 23 2 0 17 0 0 0 0 4 0
Nuapapu 23 3 0 4 0 0 1 4 11 0
Ovaka 20 6 1 7 0 0 2 3 1 0
Taunga 9 3 0 5 0 0 1 0 0 0
Hunga 39 5 1 12 0 0 11 1 9 0
Foeata Island 0 0 0 0 0 0 0 0 0 0
Ha'apai 1,179 431 49 399 1 4 248 19 23 5
Pangai 433 247 19 73 1 4 67 5 14 3
Pangai 214 116 5 33 0 4 40 4 11 1
Hihifo 159 95 12 35 1 0 12 0 2 2
Holopeka 22 10 2 1 0 0 8 1 0 0
Koulo 38 26 0 4 0 0 7 0 1 0
Foa 236 69 7 83 0 0 74 0 2 1
Fangale'ounga 24 10 1 9 0 0 3 0 0 1
Fotua 42 11 2 20 0 0 8 0 1 0
Lotofoa 70 17 3 25 0 0 24 0 1 0
faleloa 64 28 1 22 0 0 13 0 0 0
Ha'afakahenga 17 0 0 1 0 0 16 0 0 0
Ha'ateiho Si'i 19 3 0 6 0 0 10 0 0 0
Lulunga 184 43 7 106 0 0 26 0 2 0
Ha'afeva island 57 21 2 20 0 0 13 0 1 0
Tungua 37 3 4 30 0 0 0 0 0 0
Fotuha'a 19 4 0 13 0 0 2 0 0 0
'O'ua 25 6 0 9 0 0 10 0 0 0
Matuku 16 4 0 12 0 0 0 0 0 0
Kotu 30 5 1 22 0 0 1 0 1 0
Mu'omu'a 99 20 4 43 0 0 26 1 5 0
Nomuka 81 16 4 31 0 0 24 1 5 0
Mango 8 3 0 4 0 0 1 0 0 0
Fonoifua 10 1 0 8 0 0 1 0 0 0
Ha`ano 89 28 2 32 0 0 21 6 0 0
Fakakai 25 7 0 10 0 0 7 1 0 0
Pukotala 18 4 1 7 0 0 6 0 0 0
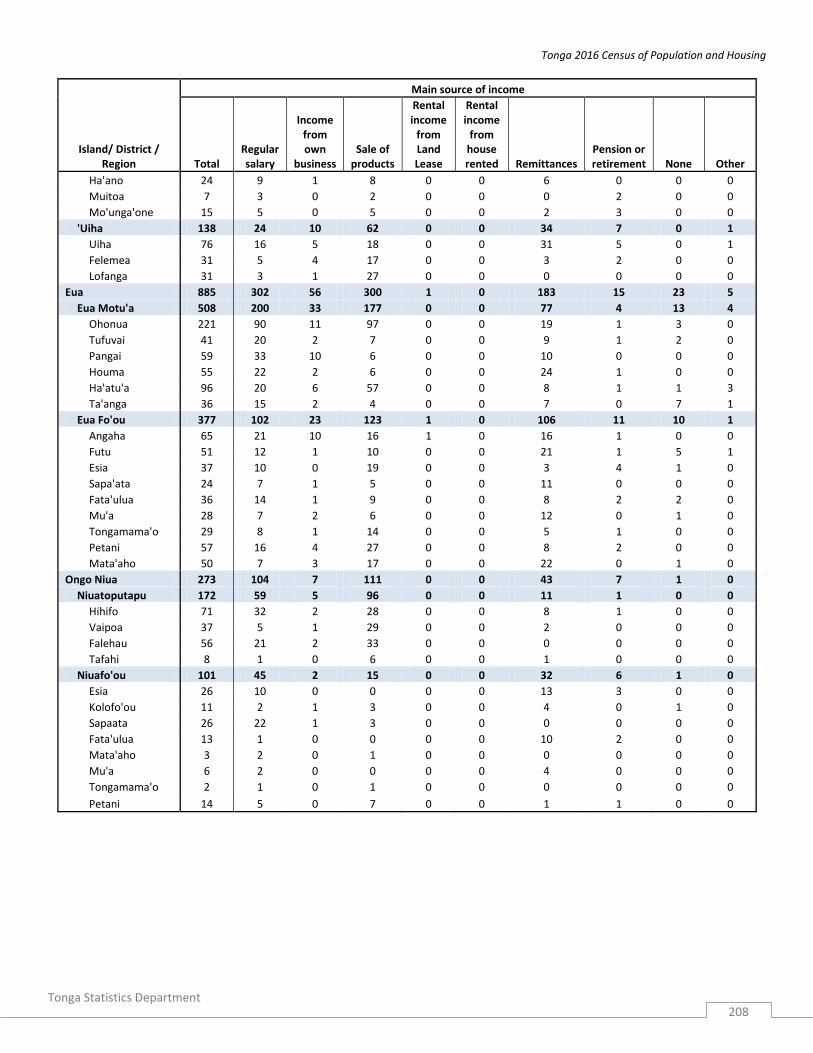
Tonga 2016 Census of Population and Housing
Tonga Statistics Department
208
Island/ District / Region
Main source of income
Total Regular salary
Income from own
business Sale of
products
Rental income
from Land Lease
Rental income
from house rented Remittances
Pension or retirement None Other
Ha'ano 24 9 1 8 0 0 6 0 0 0
Muitoa 7 3 0 2 0 0 0 2 0 0
Mo'unga'one 15 5 0 5 0 0 2 3 0 0
'Uiha 138 24 10 62 0 0 34 7 0 1
Uiha 76 16 5 18 0 0 31 5 0 1
Felemea 31 5 4 17 0 0 3 2 0 0
Lofanga 31 3 1 27 0 0 0 0 0 0
Eua 885 302 56 300 1 0 183 15 23 5
Eua Motu'a 508 200 33 177 0 0 77 4 13 4
Ohonua 221 90 11 97 0 0 19 1 3 0
Tufuvai 41 20 2 7 0 0 9 1 2 0
Pangai 59 33 10 6 0 0 10 0 0 0
Houma 55 22 2 6 0 0 24 1 0 0
Ha'atu'a 96 20 6 57 0 0 8 1 1 3
Ta'anga 36 15 2 4 0 0 7 0 7 1
Eua Fo'ou 377 102 23 123 1 0 106 11 10 1
Angaha 65 21 10 16 1 0 16 1 0 0
Futu 51 12 1 10 0 0 21 1 5 1
Esia 37 10 0 19 0 0 3 4 1 0
Sapa'ata 24 7 1 5 0 0 11 0 0 0
Fata'ulua 36 14 1 9 0 0 8 2 2 0
Mu'a 28 7 2 6 0 0 12 0 1 0
Tongamama'o 29 8 1 14 0 0 5 1 0 0
Petani 57 16 4 27 0 0 8 2 0 0
Mata'aho 50 7 3 17 0 0 22 0 1 0
Ongo Niua 273 104 7 111 0 0 43 7 1 0
Niuatoputapu 172 59 5 96 0 0 11 1 0 0
Hihifo 71 32 2 28 0 0 8 1 0 0
Vaipoa 37 5 1 29 0 0 2 0 0 0
Falehau 56 21 2 33 0 0 0 0 0 0
Tafahi 8 1 0 6 0 0 1 0 0 0
Niuafo'ou 101 45 2 15 0 0 32 6 1 0
Esia 26 10 0 0 0 0 13 3 0 0
Kolofo'ou 11 2 1 3 0 0 4 0 1 0
Sapaata 26 22 1 3 0 0 0 0 0 0
Fata'ulua 13 1 0 0 0 0 10 2 0 0
Mata'aho 3 2 0 1 0 0 0 0 0 0
Mu'a 6 2 0 0 0 0 4 0 0 0
Tongamama'o 2 1 0 1 0 0 0 0 0 0
Petani 14 5 0 7 0 0 1 1 0 0

Tonga 2016 Census of Population and Housing
Tonga Statistics Department
209
Table H 18: Main source of income by sex and ethnic origin of head of household, by division and region
Source of Income by Islands and division
Households Tongan Part - Tongan Non - Tongan
Total
Headed by Total
Headed by Total
Headed by Total
Headed by
Male Female Male Female Male Female Male Female
TONGA 18,005 13,911 4,094 17,250 13,315 3,935 87 68 19 668 528 140
Regular salary and Wages 8,312 6,676 1,636 7,952 6,406 1,546 37 31 6 323 239 84
Income from own business 1,468 1,221 247 1,205 1,001 204 16 12 4 247 208 39
Sale of products (crops, fish, handicrafts) 3,683 3,047 636 3,661 3,027 634 10 8 2 12 12 0
Rental income from land lease 42 29 13 41 28 13 0 0 0 1 1 0
Rental income from house rented out 82 58 24 81 57 24 1 1 0 0 0 0
Remittances from anyone not on HH roster 3,455 2,183 1,272 3,402 2,142 1,260 18 13 5 35 28 7
Pension or retirement fund 355 250 105 325 226 99 3 1 2 27 23 4
None 561 412 149 546 399 147 1 1 0 14 12 2
Other 47 35 12 37 29 8 1 1 0 9 5 4
Tongatapu 12,953 9,853 3,100 12,316 9,347 2,969 72 56 16 565 450 115
Regular salary and Wages 6,575 5,171 1,404 6,265 4,931 1,334 29 25 4 281 215 66
Income from own business 1,182 983 199 956 797 159 15 11 4 211 175 36
Sale of products (crops, fish, handicrafts) 2,050 1,693 357 2,031 1,676 355 8 6 2 11 11 0
Rental income from land lease 31 18 13 30 17 13 0 0 0 1 1 0
Rental income from house rented out 70 50 20 69 49 20 1 1 0 0 0 0
Remittances from anyone not on HH roster 2,382 1,461 921 2,338 1,428 910 14 10 4 30 23 7
Pension or retirement fund 247 174 73 227 160 67 3 1 2 17 13 4
None 386 282 104 377 273 104 1 1 0 8 8 0
Other 30 21 9 23 16 7 1 1 0 6 4 2
Vava'u 2,715 2,152 563 2,636 2,090 546 12 9 3 67 53 14
Regular salary and Wages 900 772 128 872 754 118 6 4 2 22 14 8
Income from own business 174 147 27 148 124 24 1 1 0 25 22 3
Sale of products (crops, fish, handicrafts) 823 681 142 821 679 142 1 1 0 1 1 0
Rental income from land lease 9 9 0 9 9 0 0 0 0 0 0 0
Rental income from house rented out 8 5 3 8 5 3 0 0 0 0 0 0
Remittances from anyone not on HH roster 599 393 206 591 386 205 4 3 1 4 4 0
Pension or retirement fund 67 45 22 59 37 22 0 0 0 8 8 0
None 128 94 34 123 91 32 0 0 0 5 3 2
Other 7 6 1 5 5 0 0 0 0 2 1 1
Ha'apai 1,179 968 211 1,157 951 206 3 3 0 19 14 5
Regular salary and Wages 431 385 46 420 378 42 2 2 0 9 5 4
Income from own business 49 40 9 43 34 9 0 0 0 6 6 0
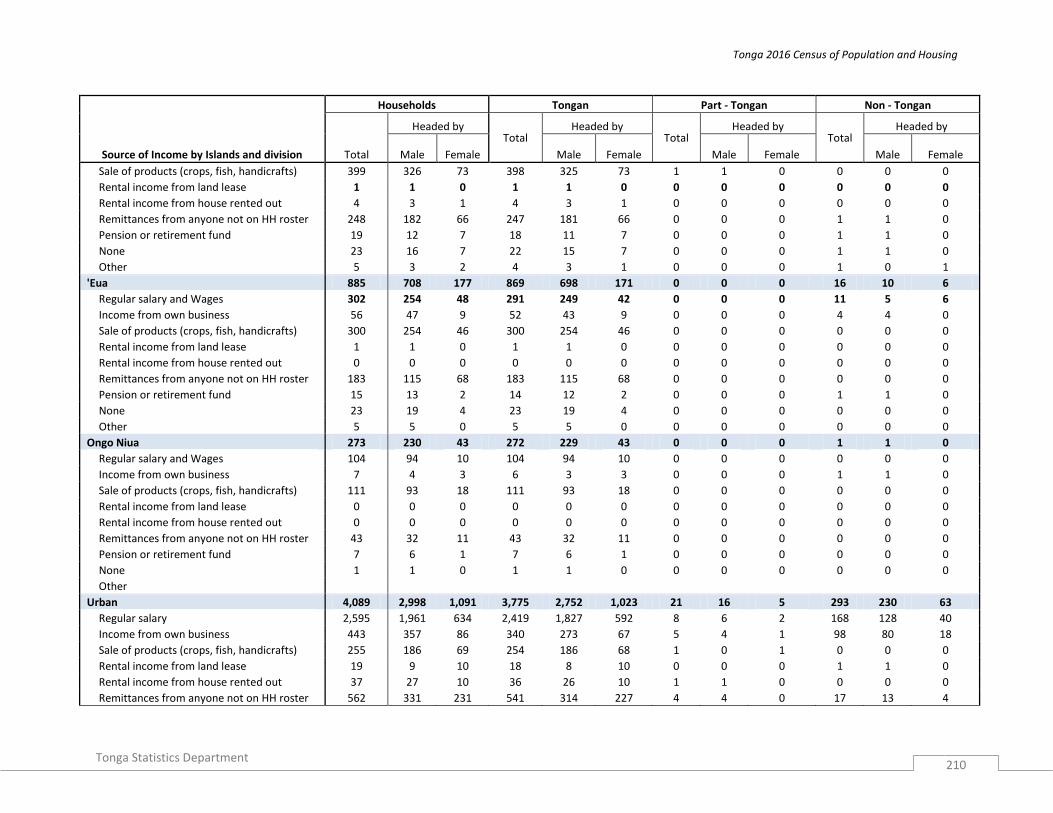
Tonga 2016 Census of Population and Housing
Tonga Statistics Department
210
Source of Income by Islands and division
Households Tongan Part - Tongan Non - Tongan
Total
Headed by Total
Headed by Total
Headed by Total
Headed by
Male Female Male Female Male Female Male Female
Sale of products (crops, fish, handicrafts) 399 326 73 398 325 73 1 1 0 0 0 0
Rental income from land lease 1 1 0 1 1 0 0 0 0 0 0 0
Rental income from house rented out 4 3 1 4 3 1 0 0 0 0 0 0
Remittances from anyone not on HH roster 248 182 66 247 181 66 0 0 0 1 1 0
Pension or retirement fund 19 12 7 18 11 7 0 0 0 1 1 0
None 23 16 7 22 15 7 0 0 0 1 1 0
Other 5 3 2 4 3 1 0 0 0 1 0 1
'Eua 885 708 177 869 698 171 0 0 0 16 10 6
Regular salary and Wages 302 254 48 291 249 42 0 0 0 11 5 6
Income from own business 56 47 9 52 43 9 0 0 0 4 4 0
Sale of products (crops, fish, handicrafts) 300 254 46 300 254 46 0 0 0 0 0 0
Rental income from land lease 1 1 0 1 1 0 0 0 0 0 0 0
Rental income from house rented out 0 0 0 0 0 0 0 0 0 0 0 0
Remittances from anyone not on HH roster 183 115 68 183 115 68 0 0 0 0 0 0
Pension or retirement fund 15 13 2 14 12 2 0 0 0 1 1 0
None 23 19 4 23 19 4 0 0 0 0 0 0
Other 5 5 0 5 5 0 0 0 0 0 0 0
Ongo Niua 273 230 43 272 229 43 0 0 0 1 1 0
Regular salary and Wages 104 94 10 104 94 10 0 0 0 0 0 0
Income from own business 7 4 3 6 3 3 0 0 0 1 1 0
Sale of products (crops, fish, handicrafts) 111 93 18 111 93 18 0 0 0 0 0 0
Rental income from land lease 0 0 0 0 0 0 0 0 0 0 0 0
Rental income from house rented out 0 0 0 0 0 0 0 0 0 0 0 0
Remittances from anyone not on HH roster 43 32 11 43 32 11 0 0 0 0 0 0
Pension or retirement fund 7 6 1 7 6 1 0 0 0 0 0 0
None 1 1 0 1 1 0 0 0 0 0 0 0
Other
Urban 4,089 2,998 1,091 3,775 2,752 1,023 21 16 5 293 230 63
Regular salary 2,595 1,961 634 2,419 1,827 592 8 6 2 168 128 40
Income from own business 443 357 86 340 273 67 5 4 1 98 80 18
Sale of products (crops, fish, handicrafts) 255 186 69 254 186 68 1 0 1 0 0 0
Rental income from land lease 19 9 10 18 8 10 0 0 0 1 1 0
Rental income from house rented out 37 27 10 36 26 10 1 1 0 0 0 0
Remittances from anyone not on HH roster 562 331 231 541 314 227 4 4 0 17 13 4
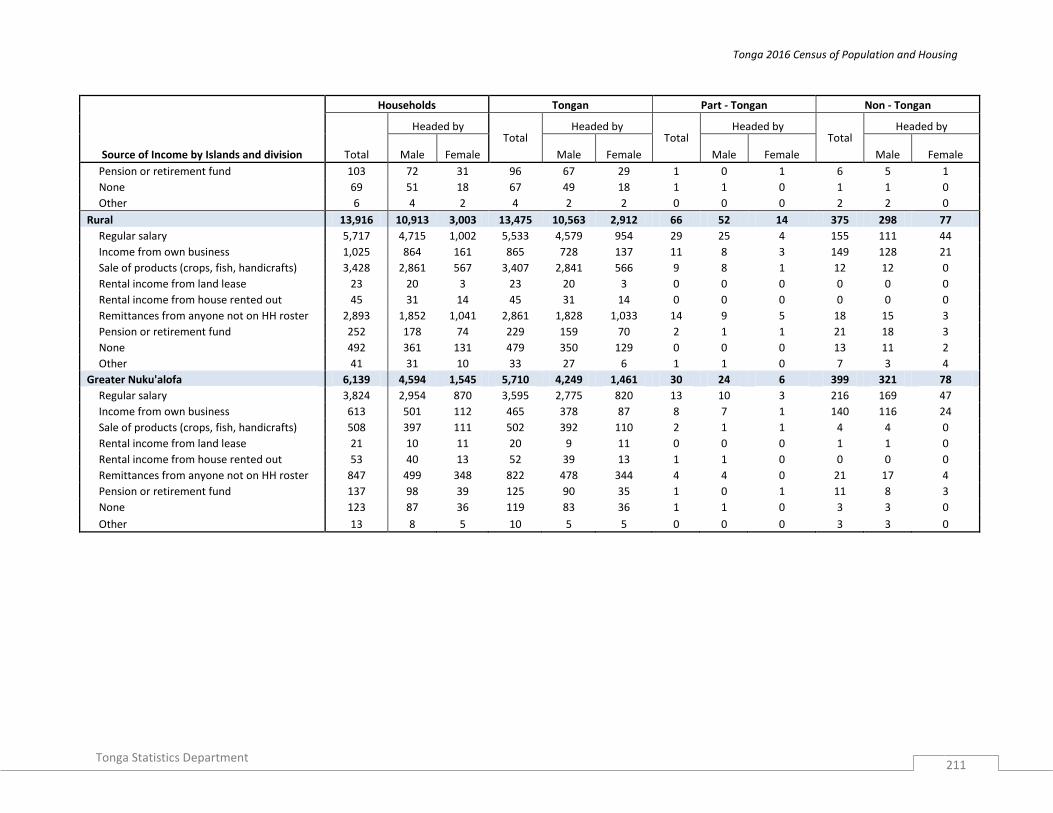
Tonga 2016 Census of Population and Housing
Tonga Statistics Department
211
Source of Income by Islands and division
Households Tongan Part - Tongan Non - Tongan
Total
Headed by Total
Headed by Total
Headed by Total
Headed by
Male Female Male Female Male Female Male Female
Pension or retirement fund 103 72 31 96 67 29 1 0 1 6 5 1
None 69 51 18 67 49 18 1 1 0 1 1 0
Other 6 4 2 4 2 2 0 0 0 2 2 0
Rural 13,916 10,913 3,003 13,475 10,563 2,912 66 52 14 375 298 77
Regular salary 5,717 4,715 1,002 5,533 4,579 954 29 25 4 155 111 44
Income from own business 1,025 864 161 865 728 137 11 8 3 149 128 21
Sale of products (crops, fish, handicrafts) 3,428 2,861 567 3,407 2,841 566 9 8 1 12 12 0
Rental income from land lease 23 20 3 23 20 3 0 0 0 0 0 0
Rental income from house rented out 45 31 14 45 31 14 0 0 0 0 0 0
Remittances from anyone not on HH roster 2,893 1,852 1,041 2,861 1,828 1,033 14 9 5 18 15 3
Pension or retirement fund 252 178 74 229 159 70 2 1 1 21 18 3
None 492 361 131 479 350 129 0 0 0 13 11 2
Other 41 31 10 33 27 6 1 1 0 7 3 4
Greater Nuku'alofa 6,139 4,594 1,545 5,710 4,249 1,461 30 24 6 399 321 78
Regular salary 3,824 2,954 870 3,595 2,775 820 13 10 3 216 169 47
Income from own business 613 501 112 465 378 87 8 7 1 140 116 24
Sale of products (crops, fish, handicrafts) 508 397 111 502 392 110 2 1 1 4 4 0
Rental income from land lease 21 10 11 20 9 11 0 0 0 1 1 0
Rental income from house rented out 53 40 13 52 39 13 1 1 0 0 0 0
Remittances from anyone not on HH roster 847 499 348 822 478 344 4 4 0 21 17 4
Pension or retirement fund 137 98 39 125 90 35 1 0 1 11 8 3
None 123 87 36 119 83 36 1 1 0 3 3 0
Other 13 8 5 10 5 5 0 0 0 3 3 0

Tonga 2016 Census of Population and Housing
Tonga Statistics Department
212
Table H 19: Households receiving remittances by Island, district and region.
Island division/ District/Region
Remittances
Total No
Yes, from
outside the
country only
Yes, from
within the
country only
Yes, both within and outside the
country
TONGA 18,005 2,917 11,029 686 3,373
Tongatapu 12,953 2,068 8,650 355 1,880
Kolofo'ou 3,108 700 2,049 95 264
Kolofo'ou 1,475 311 965 48 151
Ma'ufanga 1,237 255 864 37 81
Nukumotu 8 1 6 1 0
Popua 312 90 195 7 20
Tukutonga 75 42 19 2 12
Pangaimotu 1 1 0 0 0
Kolomotu'a 3,031 615 1,994 91 331
Kolomotu'a 1,377 303 903 31 140
Havelu 617 124 403 13 77
Tofoa 590 122 380 19 69
Hofoa 193 30 126 11 26
Puke 156 22 119 6 9
Sia'atoutai 98 14 63 11 10
Vaini 2,201 324 1,504 60 313
Vaini 576 84 428 6 58
Malapo 106 6 90 1 9
Longoteme 101 4 46 1 50
Folaha 162 28 62 20 52
Nukuhetulu 63 6 54 3 0
Veitongo 179 31 126 5 17
Ha'ateiho 449 93 259 12 85
Pea 345 53 259 11 22
Tokomololo 220 19 180 1 20
Tatakamotonga 1,248 81 801 40 326
Tatakamotonga 324 19 189 12 104
Holonga 89 6 78 3 2
Pelehake 149 3 86 3 57
Fua'amotu 309 26 195 11 77
Nakolo 65 3 29 0 33
Ha'asini 158 14 96 8 40
Lavengatonga 65 7 51 3 4
Haveluliku 26 1 22 0 3
Fatumu 63 2 55 0 6
Lapaha 1,234 94 787 21 332
Lapaha 331 19 191 8 113
Talasiu 58 16 9 0 33
Hoi 75 3 15 3 54
Nukuleka 45 1 25 2 17
Makaunga 58 7 48 0 3
Talafo'ou 74 1 30 0 43
Manuka 46 1 17 0 28
Navutoka 117 5 96 0 16
Kolonga 216 19 176 2 19
Afa 71 8 60 3 0
Niutoua 130 13 108 3 6
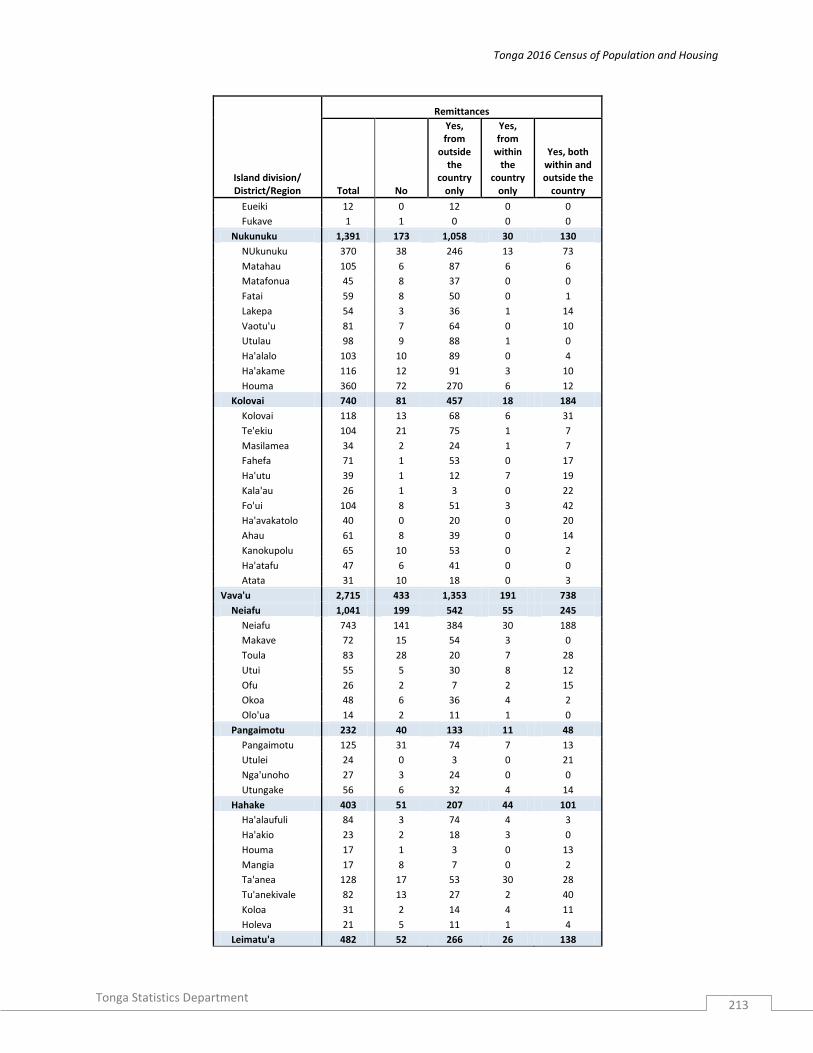
Tonga 2016 Census of Population and Housing
Tonga Statistics Department
213
Island division/ District/Region
Remittances
Total No
Yes, from
outside the
country only
Yes, from
within the
country only
Yes, both within and outside the
country
Eueiki 12 0 12 0 0
Fukave 1 1 0 0 0
Nukunuku 1,391 173 1,058 30 130
NUkunuku 370 38 246 13 73
Matahau 105 6 87 6 6
Matafonua 45 8 37 0 0
Fatai 59 8 50 0 1
Lakepa 54 3 36 1 14
Vaotu'u 81 7 64 0 10
Utulau 98 9 88 1 0
Ha'alalo 103 10 89 0 4
Ha'akame 116 12 91 3 10
Houma 360 72 270 6 12
Kolovai 740 81 457 18 184
Kolovai 118 13 68 6 31
Te'ekiu 104 21 75 1 7
Masilamea 34 2 24 1 7
Fahefa 71 1 53 0 17
Ha'utu 39 1 12 7 19
Kala'au 26 1 3 0 22
Fo'ui 104 8 51 3 42
Ha'avakatolo 40 0 20 0 20
Ahau 61 8 39 0 14
Kanokupolu 65 10 53 0 2
Ha'atafu 47 6 41 0 0
Atata 31 10 18 0 3
Vava'u 2,715 433 1,353 191 738
Neiafu 1,041 199 542 55 245
Neiafu 743 141 384 30 188
Makave 72 15 54 3 0
Toula 83 28 20 7 28
Utui 55 5 30 8 12
Ofu 26 2 7 2 15
Okoa 48 6 36 4 2
Olo'ua 14 2 11 1 0
Pangaimotu 232 40 133 11 48
Pangaimotu 125 31 74 7 13
Utulei 24 0 3 0 21
Nga'unoho 27 3 24 0 0
Utungake 56 6 32 4 14
Hahake 403 51 207 44 101
Ha'alaufuli 84 3 74 4 3
Ha'akio 23 2 18 3 0
Houma 17 1 3 0 13
Mangia 17 8 7 0 2
Ta'anea 128 17 53 30 28
Tu'anekivale 82 13 27 2 40
Koloa 31 2 14 4 11
Holeva 21 5 11 1 4
Leimatu'a 482 52 266 26 138

Tonga 2016 Census of Population and Housing
Tonga Statistics Department
214
Island division/ District/Region
Remittances
Total No
Yes, from
outside the
country only
Yes, from
within the
country only
Yes, both within and outside the
country
Leimatu'a 235 30 106 10 89
Holonga 83 4 50 4 25
Feletoa 58 4 45 4 5
Mataika 106 14 65 8 19
Hihifo 385 65 143 46 131
Longomapu 109 14 60 7 28
Taoa 98 18 13 9 58
Tefisi 102 27 25 23 27
Vaimalo 23 2 17 0 4
Tu'anuku 53 4 28 7 14
Motu 172 26 62 9 75
Kapa 10 3 5 1 1
Falevai 20 1 5 1 13
Otea 23 2 1 1 19
Lape 5 0 4 0 1
Matamaka 23 3 20 0 0
Nuapapu 23 2 1 1 19
Ovaka 20 2 9 1 8
Taunga 9 5 4 0 0
Hunga 39 8 13 4 14
Foeata Island 0 0 0 0 0
Ha'apai 1,179 198 456 65 460
Pangai 433 69 168 18 178
Pangai 214 34 90 4 86
Hihifo 159 34 74 13 38
Holopeka 22 0 3 1 18
Koulo 38 1 1 0 36
Foa 236 38 80 14 104
Fangale'ounga 24 1 5 2 16
Fotua 42 7 29 4 2
Lotofoa 70 16 29 2 23
faleloa 64 9 17 5 33
Ha'afakahenga 17 0 0 0 17
Ha'ateiho Si'i 19 5 0 1 13
Lulunga 184 49 71 14 50
Ha'afeva island 57 12 12 2 31
Tungua 37 14 9 6 8
Fotuha'a 19 2 3 3 11
'O'ua 25 4 20 1 0
Matuku 16 3 13 0 0
Kotu 30 14 14 2 0
Mu'omu'a 99 5 47 5 42
Nomuka 81 4 30 5 42
Mango 8 1 7 0 0
Fonoifua 10 0 10 0 0
Ha`ano 89 9 61 1 18
Fakakai 25 1 20 0 4
Pukotala 18 1 15 0 2
Ha'ano 24 1 22 0 1
Muitoa 7 2 2 0 3

Tonga 2016 Census of Population and Housing
Tonga Statistics Department
215
Island division/ District/Region
Remittances
Total No
Yes, from
outside the
country only
Yes, from
within the
country only
Yes, both within and outside the
country
Mo'unga'one 15 4 2 1 8
'Uiha 138 28 29 13 68
Uiha 76 12 11 8 45
Felemea 31 10 15 1 5
Lofanga 31 6 3 4 18
Eua 885 161 463 45 216
Eua Motu'a 508 117 287 16 88
Ohonua 221 61 133 9 18
Tufuvai 41 11 24 3 3
Pangai 59 1 29 1 28
Houma 55 2 43 1 9
Ha'atu'a 96 22 44 2 28
Ta'anga 36 20 14 0 2
'Eua fo'ou 377 44 176 29 128
Angaha 65 5 35 7 18
Futu 51 9 23 8 11
Esia 37 8 25 0 4
Sapa'ata 24 2 9 4 9
Fata'ulua 36 2 18 2 14
Mu'a 28 2 13 1 12
Tongamama'o 29 4 18 1 6
Petani 57 9 30 2 16
Mata'aho 50 3 5 4 38
Ongo Niua 273 57 107 30 79
Niuatoputapu 172 44 64 13 51
Hihifo 71 11 32 7 21
Vaipoa 37 13 24 0 0
Falehau 56 19 7 5 25
Tafahi 8 1 1 1 5
Niuafo'ou 101 13 43 17 28
Esia 26 1 24 1 0
Kolofo'ou 11 0 2 6 3
Sapaata 26 11 2 5 8
Fata'ulua 13 0 13 0 0
Mata'aho 3 0 0 1 2
Mu'a 6 1 1 0 4
Tongamama'o 2 0 0 0 2
Petani 14 0 1 4 9

Tonga 2016 Census of Population and Housing
Tonga Statistics Department
216
Table H 20: Frequency of remittances received by sex and ethnic origin of head of household by division and region
Island division / Frequency Received
TOTAL Male Female
Tongan Part
Tongan Non-
Tongan Total Tongan Part
Tongan Non-
Tongan Total Tongan Part
Tongan Non-
Tongan Total
TONGA 14,758 111 219 15,088 7,400 63 115 7,578 7,358 48 104 7,510
Every 2 weeks 2,925 23 49 2,997 1,383 13 25 1,421 1,542 10 24 1,576
Every month 4,567 44 75 4,686 2,281 29 45 2,355 2,286 15 30 2,331
Every 2 - 3 months 3,474 19 40 3,533 1,775 10 15 1,800 1,699 9 25 1,733
Twice a Year 915 7 11 933 480 2 5 487 435 5 6 446
Once a year 245 0 6 251 129 0 4 133 116 0 2 118
Occasionally 2,632 18 38 2,688 1,352 9 21 1,382 1,280 9 17 1,306
Tongatapu 10,622 90 173 10,885 5,333 54 86 5,473 5,289 36 87 5,412
Every 2 weeks 2,372 20 42 2,434 1,133 12 20 1,165 1,239 8 22 1,269
Every month 3,280 33 54 3,367 1,631 22 32 1,685 1,649 11 22 1,682
Every 2 - 3 months 2,241 15 31 2,287 1,162 9 11 1,182 1,079 6 20 1,105
Twice a Year 545 6 6 557 284 2 2 288 261 4 4 269
Once a year 148 0 6 154 76 0 4 80 72 0 2 74
Occasionally 2,036 16 34 2,086 1,047 9 17 1,073 989 7 17 1,013
Vava'u 2,238 14 30 2,282 1,084 7 20 1,111 1,154 7 10 1,171
Every 2 weeks 332 2 4 338 151 1 4 156 181 1 0 182
Every month 686 8 13 707 338 5 9 352 348 3 4 355
Every 2 - 3 months 659 3 7 669 316 1 3 320 343 2 4 349
Twice a Year 224 0 4 228 114 0 2 116 110 0 2 112
Once a year 59 0 0 59 35 0 0 35 24 0 0 24
Occasionally 278 1 2 281 130 0 2 132 148 1 0 149
Ha'apai 969 4 8 981 499 1 5 505 470 3 3 476
Every 2 weeks 79 0 1 80 31 0 0 31 48 0 1 49
Every month 258 1 5 264 141 1 4 146 117 0 1 118
Every 2 - 3 months 314 1 1 316 153 0 0 153 161 1 1 163
Twice a Year 111 1 0 112 61 0 0 61 50 1 0 51
Once a year 35 0 0 35 16 0 0 16 19 0 0 19
Occasionally 172 1 1 174 97 0 1 98 75 1 0 76
'Eua 714 3 7 724 374 1 3 378 340 2 4 346
Every 2 weeks 135 1 2 138 66 0 1 67 69 1 1 71
Every month 278 2 3 283 145 1 0 146 133 1 3 137
Every 2 - 3 months 161 0 0 161 83 0 0 83 78 0 0 78
Twice a Year 19 0 1 20 14 0 1 15 5 0 0 5
Once a year 2 0 0 2 1 0 0 1 1 0 0 1
Occasionally 119 0 1 120 65 0 1 66 54 0 0 54
Ongo Niua 215 0 1 216 110 0 1 111 105 0 0 105

Tonga 2016 Census of Population and Housing
Tonga Statistics Department
217
Island division / Frequency Received
TOTAL Male Female
Tongan Part
Tongan Non-
Tongan Total Tongan Part
Tongan Non-
Tongan Total Tongan Part
Tongan Non-
Tongan Total
Every 2 weeks 7 0 0 7 2 0 0 2 5 0 0 5
Every month 65 0 0 65 26 0 0 26 39 0 0 39
Every 2 - 3 months 99 0 1 100 61 0 1 62 38 0 0 38
Twice a Year 16 0 0 16 7 0 0 7 9 0 0 9
Once a year 1 0 0 1 1 0 0 1 0 0 0 0
Occasionally 27 0 0 27 13 0 0 13 14 0 0 14

Tonga 2016 Census of Population and Housing
Tonga Statistics Department
218
Table H 21: Purpose of growing crops by division, district, village and region
Division/ District/ Region
Purpose of Growing Crops
Total No
Yes, for home consumption
and social obligation Yes, for sale
Yes, mainly for home
consumption, but some sale
Yes, mainly for sale, but some
home consumption
TONGA 18,005 9,392 6,045 129 1,774 665
Tongatapu 12,953 7,680 3,599 97 1,059 518
Kolofo'ou 3,108 2,597 382 14 84 31
Kolofo'ou 1,475 1,217 211 5 30 12
Ma'ufanga 1,237 1,037 133 9 43 15
Nukumotu 8 5 3 0 0 0
Popua 312 272 30 0 7 3
Tukutonga 75 65 5 0 4 1
Pangaimotu 1 1 0 0 0 0
Kolomotu'a 3,031 2,082 800 13 97 39
Kolomotu'a 1,377 1,026 300 6 36 9
Havelu 617 430 165 2 15 5
Tofoa 590 413 137 2 25 13
Hofoa 193 99 81 1 6 6
Puke 156 66 68 2 14 6
Sia'atoutai 98 48 49 0 1 0
Vaini 2,201 1,104 746 18 234 99
Vaini 576 310 187 4 51 24
Malapo 106 50 38 2 6 10
Longoteme 101 45 37 1 12 6
Folaha 162 72 50 1 27 12
Nukuhetulu 63 23 31 2 7 0
Veitongo 179 82 79 2 14 2
Ha'ateiho 449 250 137 1 40 21
Pea 345 189 95 2 50 9
Tokomololo 220 83 92 3 27 15
Tatakamotonga 1,248 483 489 19 161 96
Tatakamotonga 324 151 94 5 50 24
Holonga 89 25 41 1 17 5
Pelehake 149 68 32 2 32 15
Fua'amotu 309 102 164 8 21 14
Nakolo 65 20 22 1 10 12
Ha'asini 158 56 70 0 15 17
Lavengatonga 65 27 20 2 6 10
Haveluliku 26 8 9 0 9 0
Fatumu 63 20 38 0 3 2
Lapaha 1,234 552 456 18 125 83
Lapaha 331 151 100 4 55 21
Talasiu 58 25 26 2 4 1
Hoi 75 36 23 0 16 0
Nukuleka 45 19 10 0 9 7
Makaunga 58 21 26 7 4 0
Talafo'ou 74 32 38 0 2 2
Manuka 46 27 19 0 0 0
Navutoka 117 64 46 0 4 3
Kolonga 216 62 82 5 19 48
Afa 71 35 29 0 6 1

Tonga 2016 Census of Population and Housing
Tonga Statistics Department
219
Division/ District/ Region
Purpose of Growing Crops
Total No
Yes, for home consumption
and social obligation Yes, for sale
Yes, mainly for home
consumption, but some sale
Yes, mainly for sale, but some
home consumption
Niutoua 130 72 52 0 6 0
Eueiki 12 7 5 0 0 0
Fukave 1 1 0 0 0 0
Nukunuku 1,391 625 391 10 230 135
NUkunuku 370 197 110 7 36 20
Matahau 105 60 19 0 15 11
Matafonua 45 18 22 0 4 1
Fatai 59 31 19 0 8 1
Lakepa 54 30 13 0 6 5
Vaotu'u 81 21 28 0 17 15
Utulau 98 40 40 1 10 7
Ha'alalo 103 45 25 1 17 15
Ha'akame 116 58 19 1 29 9
Houma 360 125 96 0 88 51
Kolovai 740 237 335 5 128 35
Kolovai 118 64 47 1 4 2
Te'ekiu 104 33 57 1 11 2
Masilamea 34 10 15 2 4 3
Fahefa 71 27 19 0 19 6
Ha'utu 39 10 15 0 14 0
Kala'au 26 10 16 0 0 0
Fo'ui 104 19 35 0 49 1
Ha'avakatolo 40 12 17 0 4 7
Ahau 61 7 35 1 11 7
Kanokupolu 65 31 30 0 4 0
Ha'atafu 47 7 25 0 8 7
Atata 31 7 24 0 0 0
Vava'u 2,715 1,044 1,191 21 406 53
Neiafu 1,041 588 410 6 28 9
Neiafu 743 433 272 6 24 8
Makave 72 39 33 0 0 0
Toula 83 53 28 0 2 0
Utui 55 46 9 0 0 0
Ofu 26 7 19 0 0 0
Okoa 48 8 38 0 1 1
Olo'ua 14 2 11 0 1 0
Pangaimotu 232 80 119 3 27 3
Pangaimotu 125 39 62 0 22 2
Utulei 24 11 13 0 0 0
Nga'unoho 27 5 21 0 1 0
Utungake 56 25 23 3 4 1
Hahake 403 179 181 1 40 2
Ha'alaufuli 84 47 22 1 14 0
Ha'akio 23 21 2 0 0 0
Houma 17 8 7 0 2 0
Mangia 17 5 12 0 0 0
Ta'anea 128 63 55 0 10 0
Tu'anekivale 82 25 54 0 2 1
Koloa 31 4 20 0 7 0
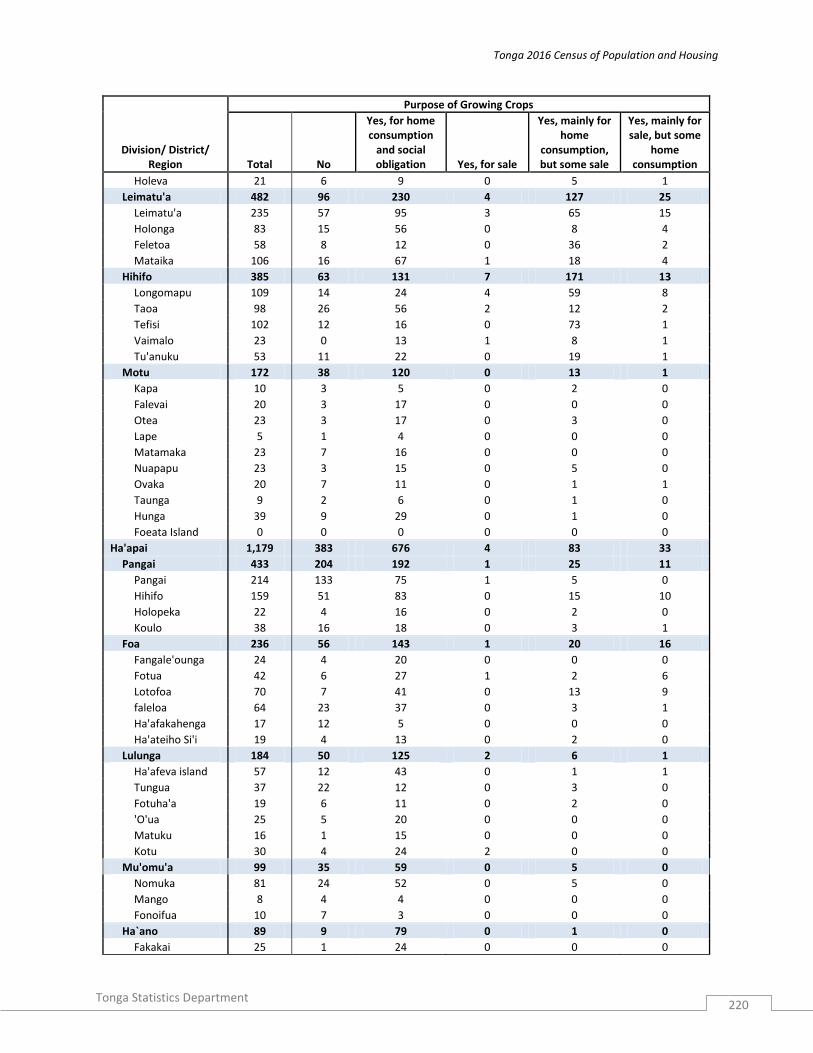
Tonga 2016 Census of Population and Housing
Tonga Statistics Department
220
Division/ District/ Region
Purpose of Growing Crops
Total No
Yes, for home consumption
and social obligation Yes, for sale
Yes, mainly for home
consumption, but some sale
Yes, mainly for sale, but some
home consumption
Holeva 21 6 9 0 5 1
Leimatu'a 482 96 230 4 127 25
Leimatu'a 235 57 95 3 65 15
Holonga 83 15 56 0 8 4
Feletoa 58 8 12 0 36 2
Mataika 106 16 67 1 18 4
Hihifo 385 63 131 7 171 13
Longomapu 109 14 24 4 59 8
Taoa 98 26 56 2 12 2
Tefisi 102 12 16 0 73 1
Vaimalo 23 0 13 1 8 1
Tu'anuku 53 11 22 0 19 1
Motu 172 38 120 0 13 1
Kapa 10 3 5 0 2 0
Falevai 20 3 17 0 0 0
Otea 23 3 17 0 3 0
Lape 5 1 4 0 0 0
Matamaka 23 7 16 0 0 0
Nuapapu 23 3 15 0 5 0
Ovaka 20 7 11 0 1 1
Taunga 9 2 6 0 1 0
Hunga 39 9 29 0 1 0
Foeata Island 0 0 0 0 0 0
Ha'apai 1,179 383 676 4 83 33
Pangai 433 204 192 1 25 11
Pangai 214 133 75 1 5 0
Hihifo 159 51 83 0 15 10
Holopeka 22 4 16 0 2 0
Koulo 38 16 18 0 3 1
Foa 236 56 143 1 20 16
Fangale'ounga 24 4 20 0 0 0
Fotua 42 6 27 1 2 6
Lotofoa 70 7 41 0 13 9
faleloa 64 23 37 0 3 1
Ha'afakahenga 17 12 5 0 0 0
Ha'ateiho Si'i 19 4 13 0 2 0
Lulunga 184 50 125 2 6 1
Ha'afeva island 57 12 43 0 1 1
Tungua 37 22 12 0 3 0
Fotuha'a 19 6 11 0 2 0
'O'ua 25 5 20 0 0 0
Matuku 16 1 15 0 0 0
Kotu 30 4 24 2 0 0
Mu'omu'a 99 35 59 0 5 0
Nomuka 81 24 52 0 5 0
Mango 8 4 4 0 0 0
Fonoifua 10 7 3 0 0 0
Ha`ano 89 9 79 0 1 0
Fakakai 25 1 24 0 0 0

Tonga 2016 Census of Population and Housing
Tonga Statistics Department
221
Division/ District/ Region
Purpose of Growing Crops
Total No
Yes, for home consumption
and social obligation Yes, for sale
Yes, mainly for home
consumption, but some sale
Yes, mainly for sale, but some
home consumption
Pukotala 18 3 15 0 0 0
Ha'ano 24 1 23 0 0 0
Muitoa 7 2 5 0 0 0
Mo'unga'one 15 2 12 0 1 0
'Uiha 138 29 78 0 26 5
Uiha 76 22 46 0 5 3
Felemea 31 4 25 0 2 0
Lofanga 31 3 7 0 19 2
Eua 885 227 410 7 184 57
Eua Motu'a 508 132 233 6 104 33
Ohonua 221 66 84 3 62 6
Tufuvai 41 22 11 1 4 3
Pangai 59 14 32 0 10 3
Houma 55 3 45 0 4 3
Ha'atu'a 96 16 40 2 24 14
Ta'anga 36 11 21 0 0 4
'Eua fo'ou 377 95 177 1 80 24
Angaha 65 17 32 0 12 4
Futu 51 18 27 0 3 3
Esia 37 11 16 0 10 0
Sapa'ata 24 15 8 0 1 0
Fata'ulua 36 5 16 0 10 5
Mu'a 28 6 15 0 4 3
Tongamama'o 29 3 17 1 5 3
Petani 57 14 15 0 25 3
Mata'aho 50 6 31 0 10 3
Ongo Niua 273 58 169 0 42 4
Niuatoputapu 172 38 117 0 16 1
Hihifo 71 15 49 0 6 1
Vaipoa 37 12 24 0 1 0
Falehau 56 11 44 0 1 0
Tafahi 8 0 0 0 8 0
Niuafo'ou 101 20 52 0 26 3
Esia 26 9 14 0 2 1
Kolofo'ou 11 4 7 0 0 0
Sapaata 26 5 10 0 11 0
Fata'ulua 13 0 13 0 0 0
Mata'aho 3 0 3 0 0 0
Mu'a 6 2 4 0 0 0
Tongamama'o 2 0 0 0 1 1
Petani 14 0 1 0 12 1
Urban 4,089 3,280 644 20 109 36
Rural 13,916 6,112 5,401 109 1,665 629
Greater Nuku'alofa 6,139 4,679 1,182 27 181 70

Tonga 2016 Census of Population and Housing
Tonga Statistics Department
222
Table H 22: Type of crops grown by division, district, village and region
Island, District and Village
CROPS
Total Cassava Early Yam Yam Yautia
Swamp taro
Giant taro
Sweet potato Banana Plantain
Water-melon Kava Vanilla Mullberry Peanuts Pineapple Squash Vegetables
Other Crops
TONGA 8,593 7,197 2,157 4,669 3,046 2,331 1,840 2,578 2,510 1,683 392 1,004 342 395 246 478 22 408 339
Tongatapu 5,254 4,416 1,225 2,864 1,626 1,211 539 1,463 1,284 722 240 72 29 256 203 143 18 276 161
Kolofo'ou 510 396 112 254 163 164 52 139 151 59 20 9 3 7 7 8 2 42 19
Kolofo'ou 257 206 69 143 88 82 32 74 72 34 3 2 2 6 0 7 0 22 12
Ma'ufanga 200 153 38 84 63 60 20 55 63 24 17 6 1 1 5 0 2 16 5
Nukumotu 3 2 0 3 1 1 0 1 0 0 0 0 0 0 0 0 0 0 0
Popua 40 27 5 20 10 18 0 7 14 1 0 1 0 0 1 1 0 3 2
Tukutonga 10 8 0 4 1 3 0 2 2 0 0 0 0 0 1 0 0 1 0
Kolomotu'a 945 736 222 528 276 262 121 219 243 118 21 13 5 6 9 22 1 68 41
Kolomotu'a 349 274 63 192 93 106 21 80 96 37 8 4 3 2 4 9 1 30 20
Havelu 187 142 74 83 66 38 37 50 36 20 3 2 0 1 3 4 0 14 3
Tofoa 176 137 39 97 55 50 29 48 51 30 6 4 0 2 0 4 0 13 6
Hofoa 94 83 20 51 30 22 5 20 23 16 2 1 1 0 0 1 0 4 5
Puke 90 76 7 72 20 27 17 16 21 14 2 2 1 1 2 4 0 4 7
Sia'atoutai 49 24 19 33 12 19 12 5 16 1 0 0 0 0 0 0 0 3 0
Vaini 1,093 971 315 575 315 315 105 319 258 158 64 12 4 37 27 33 4 84 23
Vaini 266 227 94 126 88 81 28 95 55 35 21 3 1 6 15 7 2 19 7
Malapo 56 48 9 25 7 9 2 20 11 6 4 1 1 1 0 2 0 1 1
Longoteme 56 51 22 29 12 29 9 11 28 7 4 1 0 15 1 0 0 8 0
Folaha 90 83 16 51 14 21 1 39 20 15 8 0 0 2 0 1 0 7 1
Nukuhetulu 40 34 28 4 12 2 3 11 6 11 0 2 0 2 1 0 0 0 0
Veitongo 97 93 33 55 15 21 9 26 16 6 2 1 0 2 1 2 1 7 2
Ha'ateiho 197 170 45 117 66 42 19 47 29 7 8 0 1 3 3 4 1 12 8
Pea 156 142 46 95 55 72 30 44 63 55 8 3 1 5 3 10 0 22 1
Tokomololo 135 123 22 73 46 38 4 26 30 16 9 1 0 1 3 7 0 8 3
Tatakamoton 760 599 156 390 230 99 74 255 129 78 30 8 2 81 116 21 4 33 15
Tatakamoto 172 116 28 120 35 14 12 87 24 11 16 1 0 10 86 2 1 13 1
Holonga 64 54 6 36 25 7 12 31 29 11 1 3 0 17 2 7 0 5 0
Pelehake 80 70 30 31 22 28 7 30 20 17 5 1 1 11 15 4 3 9 6
Fua'amotu 205 165 68 93 57 41 24 27 19 11 2 1 0 6 3 3 0 2 6
Nakolo 44 29 2 23 16 2 2 13 8 4 3 2 0 5 1 0 0 1 1
Ha'asini 102 89 15 30 46 4 8 36 11 10 2 0 0 13 4 2 0 1 1
Lavengaton 37 26 2 24 7 1 4 17 6 10 1 0 1 15 2 3 0 2 0
Haveluliku 14 11 3 8 8 0 0 4 3 1 0 0 0 0 2 0 0 0 0
Fatumu 42 39 2 25 14 2 5 10 9 3 0 0 0 4 1 0 0 0 0
Lapaha 681 546 140 407 218 93 72 211 141 63 34 6 6 92 26 22 5 17 18
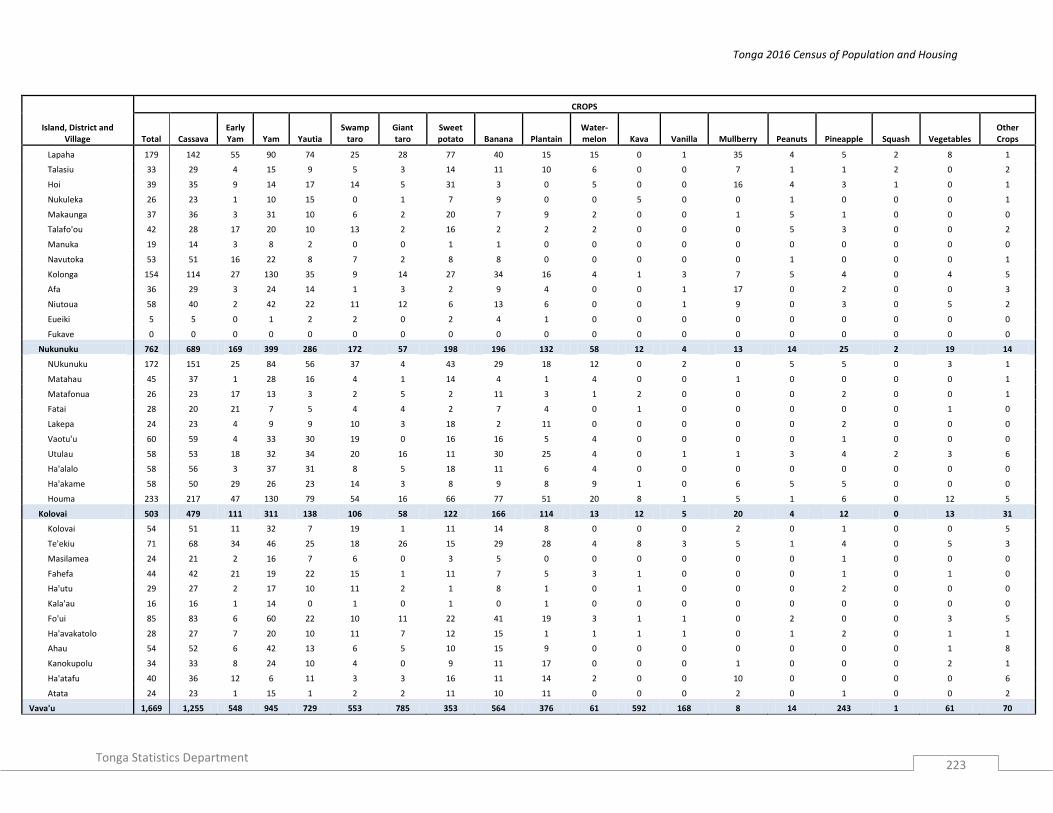
Tonga 2016 Census of Population and Housing
Tonga Statistics Department
223
Island, District and Village
CROPS
Total Cassava Early Yam Yam Yautia
Swamp taro
Giant taro
Sweet potato Banana Plantain
Water-melon Kava Vanilla Mullberry Peanuts Pineapple Squash Vegetables
Other Crops
Lapaha 179 142 55 90 74 25 28 77 40 15 15 0 1 35 4 5 2 8 1
Talasiu 33 29 4 15 9 5 3 14 11 10 6 0 0 7 1 1 2 0 2
Hoi 39 35 9 14 17 14 5 31 3 0 5 0 0 16 4 3 1 0 1
Nukuleka 26 23 1 10 15 0 1 7 9 0 0 5 0 0 1 0 0 0 1
Makaunga 37 36 3 31 10 6 2 20 7 9 2 0 0 1 5 1 0 0 0
Talafo'ou 42 28 17 20 10 13 2 16 2 2 2 0 0 0 5 3 0 0 2
Manuka 19 14 3 8 2 0 0 1 1 0 0 0 0 0 0 0 0 0 0
Navutoka 53 51 16 22 8 7 2 8 8 0 0 0 0 0 1 0 0 0 1
Kolonga 154 114 27 130 35 9 14 27 34 16 4 1 3 7 5 4 0 4 5
Afa 36 29 3 24 14 1 3 2 9 4 0 0 1 17 0 2 0 0 3
Niutoua 58 40 2 42 22 11 12 6 13 6 0 0 1 9 0 3 0 5 2
Eueiki 5 5 0 1 2 2 0 2 4 1 0 0 0 0 0 0 0 0 0
Fukave 0 0 0 0 0 0 0 0 0 0 0 0 0 0 0 0 0 0 0
Nukunuku 762 689 169 399 286 172 57 198 196 132 58 12 4 13 14 25 2 19 14
NUkunuku 172 151 25 84 56 37 4 43 29 18 12 0 2 0 5 5 0 3 1
Matahau 45 37 1 28 16 4 1 14 4 1 4 0 0 1 0 0 0 0 1
Matafonua 26 23 17 13 3 2 5 2 11 3 1 2 0 0 0 2 0 0 1
Fatai 28 20 21 7 5 4 4 2 7 4 0 1 0 0 0 0 0 1 0
Lakepa 24 23 4 9 9 10 3 18 2 11 0 0 0 0 0 2 0 0 0
Vaotu'u 60 59 4 33 30 19 0 16 16 5 4 0 0 0 0 1 0 0 0
Utulau 58 53 18 32 34 20 16 11 30 25 4 0 1 1 3 4 2 3 6
Ha'alalo 58 56 3 37 31 8 5 18 11 6 4 0 0 0 0 0 0 0 0
Ha'akame 58 50 29 26 23 14 3 8 9 8 9 1 0 6 5 5 0 0 0
Houma 233 217 47 130 79 54 16 66 77 51 20 8 1 5 1 6 0 12 5
Kolovai 503 479 111 311 138 106 58 122 166 114 13 12 5 20 4 12 0 13 31
Kolovai 54 51 11 32 7 19 1 11 14 8 0 0 0 2 0 1 0 0 5
Te'ekiu 71 68 34 46 25 18 26 15 29 28 4 8 3 5 1 4 0 5 3
Masilamea 24 21 2 16 7 6 0 3 5 0 0 0 0 0 0 1 0 0 0
Fahefa 44 42 21 19 22 15 1 11 7 5 3 1 0 0 0 1 0 1 0
Ha'utu 29 27 2 17 10 11 2 1 8 1 0 1 0 0 0 2 0 0 0
Kala'au 16 16 1 14 0 1 0 1 0 1 0 0 0 0 0 0 0 0 0
Fo'ui 85 83 6 60 22 10 11 22 41 19 3 1 1 0 2 0 0 3 5
Ha'avakatolo 28 27 7 20 10 11 7 12 15 1 1 1 1 0 1 2 0 1 1
Ahau 54 52 6 42 13 6 5 10 15 9 0 0 0 0 0 0 0 1 8
Kanokupolu 34 33 8 24 10 4 0 9 11 17 0 0 0 1 0 0 0 2 1
Ha'atafu 40 36 12 6 11 3 3 16 11 14 2 0 0 10 0 0 0 0 6
Atata 24 23 1 15 1 2 2 11 10 11 0 0 0 2 0 1 0 0 2
Vava'u 1,669 1,255 548 945 729 553 785 353 564 376 61 592 168 8 14 243 1 61 70
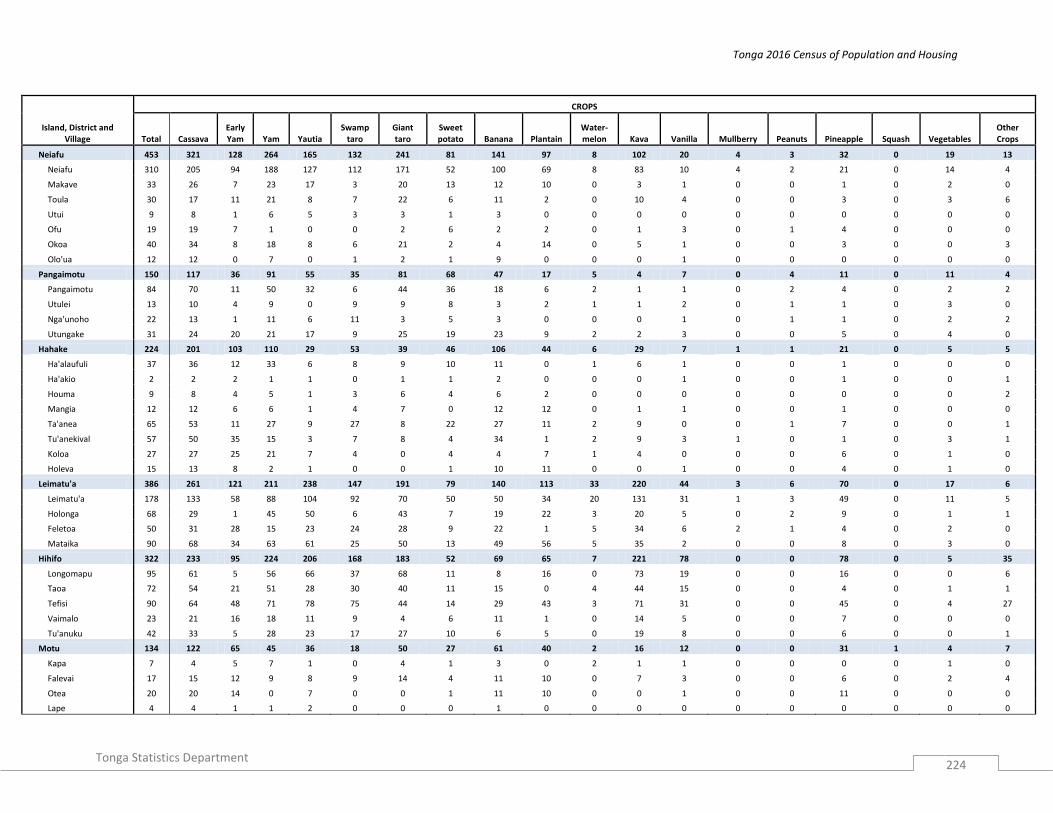
Tonga 2016 Census of Population and Housing
Tonga Statistics Department
224
Island, District and Village
CROPS
Total Cassava Early Yam Yam Yautia
Swamp taro
Giant taro
Sweet potato Banana Plantain
Water-melon Kava Vanilla Mullberry Peanuts Pineapple Squash Vegetables
Other Crops
Neiafu 453 321 128 264 165 132 241 81 141 97 8 102 20 4 3 32 0 19 13
Neiafu 310 205 94 188 127 112 171 52 100 69 8 83 10 4 2 21 0 14 4
Makave 33 26 7 23 17 3 20 13 12 10 0 3 1 0 0 1 0 2 0
Toula 30 17 11 21 8 7 22 6 11 2 0 10 4 0 0 3 0 3 6
Utui 9 8 1 6 5 3 3 1 3 0 0 0 0 0 0 0 0 0 0
Ofu 19 19 7 1 0 0 2 6 2 2 0 1 3 0 1 4 0 0 0
Okoa 40 34 8 18 8 6 21 2 4 14 0 5 1 0 0 3 0 0 3
Olo'ua 12 12 0 7 0 1 2 1 9 0 0 0 1 0 0 0 0 0 0
Pangaimotu 150 117 36 91 55 35 81 68 47 17 5 4 7 0 4 11 0 11 4
Pangaimotu 84 70 11 50 32 6 44 36 18 6 2 1 1 0 2 4 0 2 2
Utulei 13 10 4 9 0 9 9 8 3 2 1 1 2 0 1 1 0 3 0
Nga'unoho 22 13 1 11 6 11 3 5 3 0 0 0 1 0 1 1 0 2 2
Utungake 31 24 20 21 17 9 25 19 23 9 2 2 3 0 0 5 0 4 0
Hahake 224 201 103 110 29 53 39 46 106 44 6 29 7 1 1 21 0 5 5
Ha'alaufuli 37 36 12 33 6 8 9 10 11 0 1 6 1 0 0 1 0 0 0
Ha'akio 2 2 2 1 1 0 1 1 2 0 0 0 1 0 0 1 0 0 1
Houma 9 8 4 5 1 3 6 4 6 2 0 0 0 0 0 0 0 0 2
Mangia 12 12 6 6 1 4 7 0 12 12 0 1 1 0 0 1 0 0 0
Ta'anea 65 53 11 27 9 27 8 22 27 11 2 9 0 0 1 7 0 0 1
Tu'anekival 57 50 35 15 3 7 8 4 34 1 2 9 3 1 0 1 0 3 1
Koloa 27 27 25 21 7 4 0 4 4 7 1 4 0 0 0 6 0 1 0
Holeva 15 13 8 2 1 0 0 1 10 11 0 0 1 0 0 4 0 1 0
Leimatu'a 386 261 121 211 238 147 191 79 140 113 33 220 44 3 6 70 0 17 6
Leimatu'a 178 133 58 88 104 92 70 50 50 34 20 131 31 1 3 49 0 11 5
Holonga 68 29 1 45 50 6 43 7 19 22 3 20 5 0 2 9 0 1 1
Feletoa 50 31 28 15 23 24 28 9 22 1 5 34 6 2 1 4 0 2 0
Mataika 90 68 34 63 61 25 50 13 49 56 5 35 2 0 0 8 0 3 0
Hihifo 322 233 95 224 206 168 183 52 69 65 7 221 78 0 0 78 0 5 35
Longomapu 95 61 5 56 66 37 68 11 8 16 0 73 19 0 0 16 0 0 6
Taoa 72 54 21 51 28 30 40 11 15 0 4 44 15 0 0 4 0 1 1
Tefisi 90 64 48 71 78 75 44 14 29 43 3 71 31 0 0 45 0 4 27
Vaimalo 23 21 16 18 11 9 4 6 11 1 0 14 5 0 0 7 0 0 0
Tu'anuku 42 33 5 28 23 17 27 10 6 5 0 19 8 0 0 6 0 0 1
Motu 134 122 65 45 36 18 50 27 61 40 2 16 12 0 0 31 1 4 7
Kapa 7 4 5 7 1 0 4 1 3 0 2 1 1 0 0 0 0 1 0
Falevai 17 15 12 9 8 9 14 4 11 10 0 7 3 0 0 6 0 2 4
Otea 20 20 14 0 7 0 0 1 11 10 0 0 1 0 0 11 0 0 0
Lape 4 4 1 1 2 0 0 0 1 0 0 0 0 0 0 0 0 0 0

Tonga 2016 Census of Population and Housing
Tonga Statistics Department
225
Island, District and Village
CROPS
Total Cassava Early Yam Yam Yautia
Swamp taro
Giant taro
Sweet potato Banana Plantain
Water-melon Kava Vanilla Mullberry Peanuts Pineapple Squash Vegetables
Other Crops
Matamaka 16 15 4 3 6 3 0 0 9 0 0 4 2 0 0 5 0 0 0
Nuapapu 20 19 18 1 1 0 19 4 6 20 0 1 2 0 0 2 0 0 0
Ovaka 13 10 4 3 2 3 4 4 9 0 0 2 1 0 0 6 1 0 2
Taunga 7 7 0 0 0 0 0 0 0 0 0 0 0 0 0 0 0 0 0
Hunga 30 28 7 21 9 3 9 13 11 0 0 1 2 0 0 1 0 1 1
Foeata 0 0 0 0 0 0 0 0 0 0 0 0 0 0 0 0 0 0 0
Ha'apai 797 764 194 399 252 110 186 374 390 310 62 9 4 55 14 42 1 37 20
Pangai 230 216 83 114 85 37 89 124 126 111 14 1 0 1 8 4 0 20 2
Pangai 82 74 18 38 16 5 12 44 36 12 4 0 0 1 3 0 0 6 1
Hihifo 108 103 41 56 62 21 69 46 65 83 10 1 0 0 4 4 0 7 1
Holopeka 18 18 10 10 0 0 6 18 14 14 0 0 0 0 0 0 0 6 0
Koulo 22 21 14 10 7 11 2 16 11 2 0 0 0 0 1 0 0 1 0
Foa 180 168 24 73 43 6 25 75 81 74 10 1 0 54 1 4 0 4 11
Fangale'ou 20 20 6 10 6 0 0 14 16 0 0 1 0 6 1 0 0 0 2
Fotua 36 33 1 6 6 2 0 4 7 1 0 0 0 1 0 1 0 0 8
Lotofoa 63 56 6 33 13 4 7 42 25 32 5 0 0 31 0 0 0 3 1
faleloa 41 40 5 15 14 0 15 14 29 37 5 0 0 16 0 3 0 1 0
Ha'afakahenga 5 5 2 2 1 0 1 0 1 3 0 0 0 0 0 0 0 0 0
Ha'ateiho Si’i 15 14 4 7 3 0 2 1 3 1 0 0 0 0 0 0 0 0 0
Lulunga 134 131 8 77 34 31 29 47 29 28 1 6 0 0 1 3 0 1 1
Ha'afeva 45 44 3 25 26 15 9 22 16 12 0 0 0 0 0 1 0 0 0
Tungua 15 15 5 10 0 0 0 5 10 0 0 0 0 0 0 0 0 1 0
Fotuha'a 13 13 0 0 0 13 13 1 1 0 0 3 0 0 0 1 0 0 0
'O'ua 20 20 0 17 8 3 1 19 2 16 0 0 0 0 1 0 0 0 0
Matuku 15 15 0 14 0 0 5 0 0 0 0 0 0 0 0 0 0 0 0
Kotu 26 24 0 11 0 0 1 0 0 0 1 3 0 0 0 1 0 0 1
Mu'omu'a 64 62 2 11 1 2 1 29 13 7 7 0 1 0 1 2 1 3 5
Nomuka 57 55 2 8 1 2 1 29 13 7 7 0 0 0 1 2 1 3 5
Mango 4 4 0 3 0 0 0 0 0 0 0 0 1 0 0 0 0 0 0
Fonoifua 3 3 0 0 0 0 0 0 0 0 0 0 0 0 0 0 0 0 0
Ha`ano 80 80 18 38 24 9 0 56 61 21 6 0 0 0 2 3 0 2 0
Fakakai 24 24 0 7 6 3 0 19 22 0 1 0 0 0 0 0 0 0 0
Pukotala 15 15 2 2 0 0 0 7 8 3 0 0 0 0 0 0 0 0 0
Ha'ano 23 23 4 16 4 2 0 23 15 2 2 0 0 0 0 0 0 0 0
Muitoa 5 5 3 2 3 3 0 5 4 4 0 0 0 0 1 0 0 1 0
Moungaon 13 13 9 11 11 1 0 2 12 12 3 0 0 0 1 3 0 1 0
'Uiha 109 107 59 86 65 25 42 43 80 69 24 1 3 0 1 26 0 7 1
Uiha 54 54 22 44 25 9 3 13 31 16 3 0 0 0 0 3 0 0 0
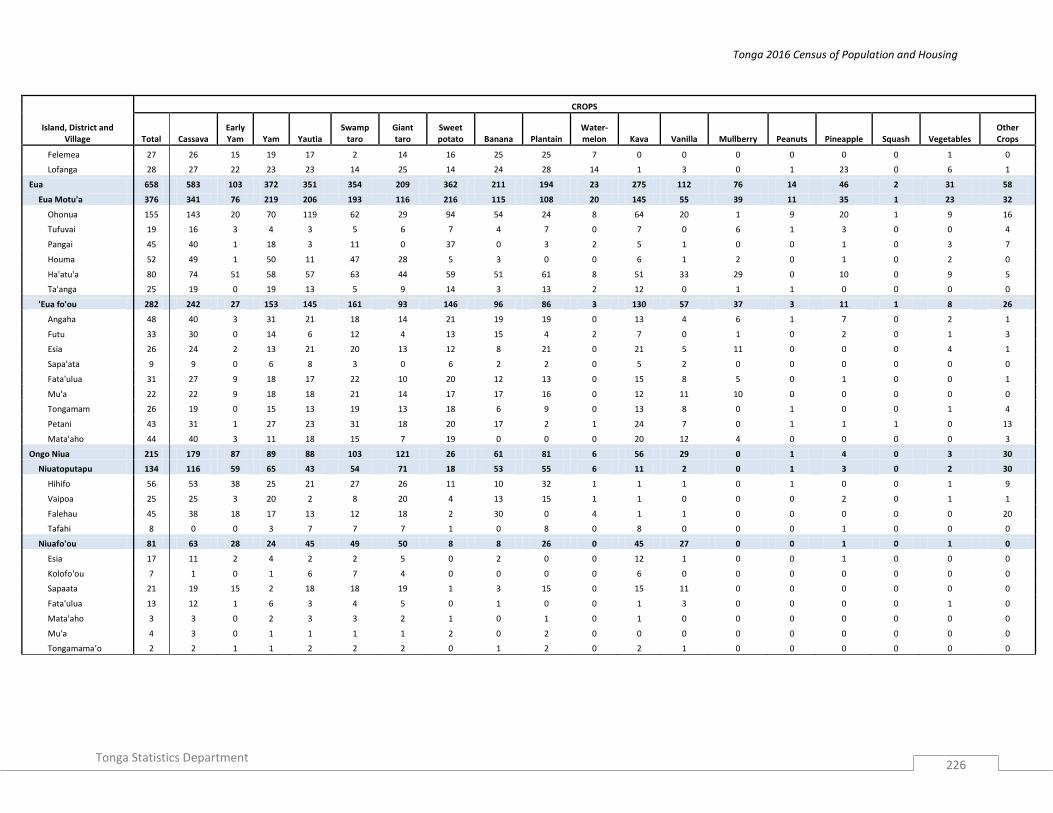
Tonga 2016 Census of Population and Housing
Tonga Statistics Department
226
Island, District and Village
CROPS
Total Cassava Early Yam Yam Yautia
Swamp taro
Giant taro
Sweet potato Banana Plantain
Water-melon Kava Vanilla Mullberry Peanuts Pineapple Squash Vegetables
Other Crops
Felemea 27 26 15 19 17 2 14 16 25 25 7 0 0 0 0 0 0 1 0
Lofanga 28 27 22 23 23 14 25 14 24 28 14 1 3 0 1 23 0 6 1
Eua 658 583 103 372 351 354 209 362 211 194 23 275 112 76 14 46 2 31 58
Eua Motu'a 376 341 76 219 206 193 116 216 115 108 20 145 55 39 11 35 1 23 32
Ohonua 155 143 20 70 119 62 29 94 54 24 8 64 20 1 9 20 1 9 16
Tufuvai 19 16 3 4 3 5 6 7 4 7 0 7 0 6 1 3 0 0 4
Pangai 45 40 1 18 3 11 0 37 0 3 2 5 1 0 0 1 0 3 7
Houma 52 49 1 50 11 47 28 5 3 0 0 6 1 2 0 1 0 2 0
Ha'atu'a 80 74 51 58 57 63 44 59 51 61 8 51 33 29 0 10 0 9 5
Ta'anga 25 19 0 19 13 5 9 14 3 13 2 12 0 1 1 0 0 0 0
'Eua fo'ou 282 242 27 153 145 161 93 146 96 86 3 130 57 37 3 11 1 8 26
Angaha 48 40 3 31 21 18 14 21 19 19 0 13 4 6 1 7 0 2 1
Futu 33 30 0 14 6 12 4 13 15 4 2 7 0 1 0 2 0 1 3
Esia 26 24 2 13 21 20 13 12 8 21 0 21 5 11 0 0 0 4 1
Sapa'ata 9 9 0 6 8 3 0 6 2 2 0 5 2 0 0 0 0 0 0
Fata'ulua 31 27 9 18 17 22 10 20 12 13 0 15 8 5 0 1 0 0 1
Mu'a 22 22 9 18 18 21 14 17 17 16 0 12 11 10 0 0 0 0 0
Tongamam 26 19 0 15 13 19 13 18 6 9 0 13 8 0 1 0 0 1 4
Petani 43 31 1 27 23 31 18 20 17 2 1 24 7 0 1 1 1 0 13
Mata'aho 44 40 3 11 18 15 7 19 0 0 0 20 12 4 0 0 0 0 3
Ongo Niua 215 179 87 89 88 103 121 26 61 81 6 56 29 0 1 4 0 3 30
Niuatoputapu 134 116 59 65 43 54 71 18 53 55 6 11 2 0 1 3 0 2 30
Hihifo 56 53 38 25 21 27 26 11 10 32 1 1 1 0 1 0 0 1 9
Vaipoa 25 25 3 20 2 8 20 4 13 15 1 1 0 0 0 2 0 1 1
Falehau 45 38 18 17 13 12 18 2 30 0 4 1 1 0 0 0 0 0 20
Tafahi 8 0 0 3 7 7 7 1 0 8 0 8 0 0 0 1 0 0 0
Niuafo'ou 81 63 28 24 45 49 50 8 8 26 0 45 27 0 0 1 0 1 0
Esia 17 11 2 4 2 2 5 0 2 0 0 12 1 0 0 1 0 0 0
Kolofo'ou 7 1 0 1 6 7 4 0 0 0 0 6 0 0 0 0 0 0 0
Sapaata 21 19 15 2 18 18 19 1 3 15 0 15 11 0 0 0 0 0 0
Fata'ulua 13 12 1 6 3 4 5 0 1 0 0 1 3 0 0 0 0 1 0
Mata'aho 3 3 0 2 3 3 2 1 0 1 0 1 0 0 0 0 0 0 0
Mu'a 4 3 0 1 1 1 1 2 0 2 0 0 0 0 0 0 0 0 0
Tongamama’o 2 2 1 1 2 2 2 0 1 2 0 2 1 0 0 0 0 0 0
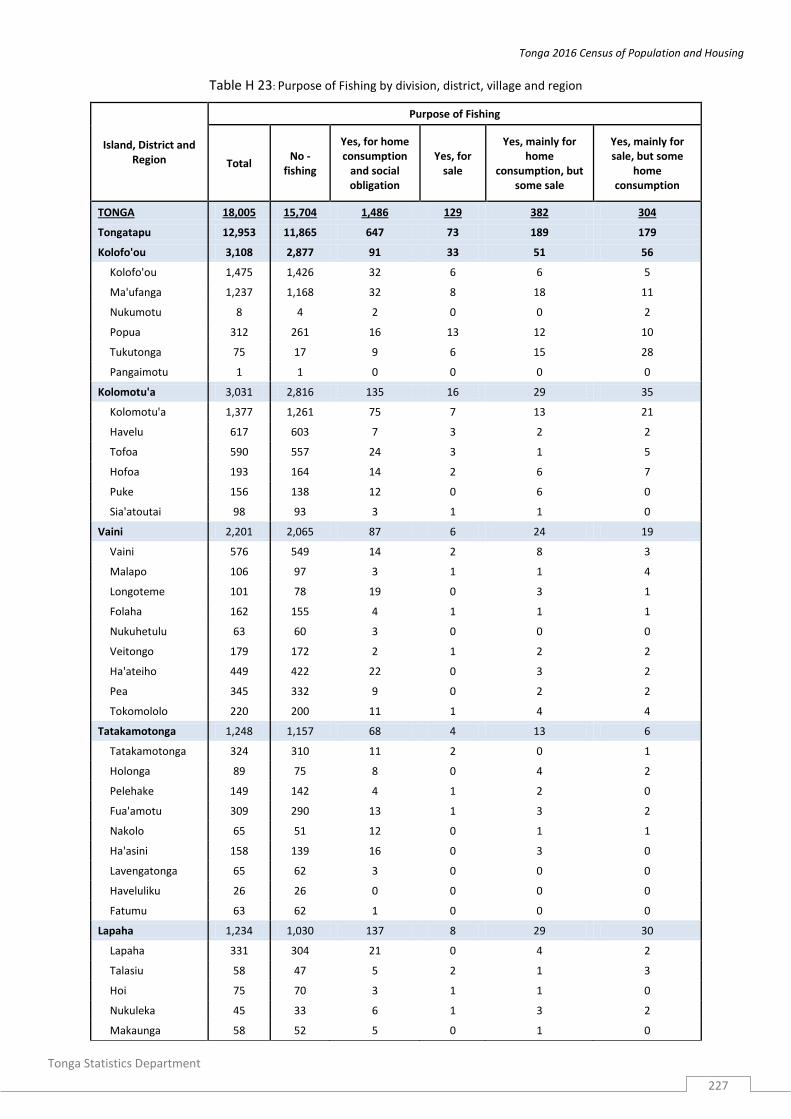
Tonga 2016 Census of Population and Housing
Tonga Statistics Department
227
Table H 23: Purpose of Fishing by division, district, village and region
Island, District and Region
Purpose of Fishing
Total No -
fishing
Yes, for home consumption
and social obligation
Yes, for sale
Yes, mainly for home
consumption, but some sale
Yes, mainly for sale, but some
home consumption
TONGA 18,005 15,704 1,486 129 382 304
Tongatapu 12,953 11,865 647 73 189 179
Kolofo'ou 3,108 2,877 91 33 51 56
Kolofo'ou 1,475 1,426 32 6 6 5
Ma'ufanga 1,237 1,168 32 8 18 11
Nukumotu 8 4 2 0 0 2
Popua 312 261 16 13 12 10
Tukutonga 75 17 9 6 15 28
Pangaimotu 1 1 0 0 0 0
Kolomotu'a 3,031 2,816 135 16 29 35
Kolomotu'a 1,377 1,261 75 7 13 21
Havelu 617 603 7 3 2 2
Tofoa 590 557 24 3 1 5
Hofoa 193 164 14 2 6 7
Puke 156 138 12 0 6 0
Sia'atoutai 98 93 3 1 1 0
Vaini 2,201 2,065 87 6 24 19
Vaini 576 549 14 2 8 3
Malapo 106 97 3 1 1 4
Longoteme 101 78 19 0 3 1
Folaha 162 155 4 1 1 1
Nukuhetulu 63 60 3 0 0 0
Veitongo 179 172 2 1 2 2
Ha'ateiho 449 422 22 0 3 2
Pea 345 332 9 0 2 2
Tokomololo 220 200 11 1 4 4
Tatakamotonga 1,248 1,157 68 4 13 6
Tatakamotonga 324 310 11 2 0 1
Holonga 89 75 8 0 4 2
Pelehake 149 142 4 1 2 0
Fua'amotu 309 290 13 1 3 2
Nakolo 65 51 12 0 1 1
Ha'asini 158 139 16 0 3 0
Lavengatonga 65 62 3 0 0 0
Haveluliku 26 26 0 0 0 0
Fatumu 63 62 1 0 0 0
Lapaha 1,234 1,030 137 8 29 30
Lapaha 331 304 21 0 4 2
Talasiu 58 47 5 2 1 3
Hoi 75 70 3 1 1 0
Nukuleka 45 33 6 1 3 2
Makaunga 58 52 5 0 1 0

Tonga 2016 Census of Population and Housing
Tonga Statistics Department
228
Island, District and Region
Purpose of Fishing
Total No -
fishing
Yes, for home consumption
and social obligation
Yes, for sale
Yes, mainly for home
consumption, but some sale
Yes, mainly for sale, but some
home consumption
Talafo'ou 74 55 14 0 2 3
Manuka 46 32 7 1 6 0
Navutoka 117 95 18 0 4 0
Kolonga 216 179 22 0 5 10
Afa 71 44 14 3 0 10
Niutoua 130 111 17 0 2 0
Eueiki 12 8 4 0 0 0
Fukave 1 0 1 0 0 0
Nukunuku 1,391 1,323 33 6 18 11
NUkunuku 370 354 9 3 3 1
Matahau 105 91 10 0 1 3
Matafonua 45 39 0 0 4 2
Fatai 59 55 0 1 1 2
Lakepa 54 52 1 0 0 1
Vaotu'u 81 79 1 0 0 1
Utulau 98 98 0 0 0 0
Ha'alalo 103 100 2 0 1 0
Ha'akame 116 105 2 2 6 1
Houma 360 350 8 0 2 0
Kolovai 740 597 96 0 25 22
Kolovai 118 107 9 0 2 0
Te'ekiu 104 89 11 0 4 0
Masilamea 34 33 0 0 0 1
Fahefa 71 64 5 0 1 1
Ha'utu 39 36 1 0 2 0
Kala'au 26 25 1 0 0 0
Fo'ui 104 79 15 0 9 1
Ha'avakatolo 40 36 4 0 0 0
Ahau 61 33 23 0 4 1
Kanokupolu 65 42 19 0 3 1
Ha'atafu 47 40 2 0 0 5
Atata 31 13 6 0 0 12
Vava'u 2,715 2,177 388 16 93 41
Neiafu 1,041 859 147 9 12 14
Neiafu 743 660 70 5 4 4
Makave 72 62 10 0 0 0
Toula 83 70 12 0 0 1
Utui 55 46 8 0 1 0
Ofu 26 6 11 0 4 5
Okoa 48 11 35 1 1 0
Olo'ua 14 4 1 3 2 4
Pangaimotu 232 150 53 4 11 14
Pangaimotu 125 89 16 1 8 11

Tonga 2016 Census of Population and Housing
Tonga Statistics Department
229
Island, District and Region
Purpose of Fishing
Total No -
fishing
Yes, for home consumption
and social obligation
Yes, for sale
Yes, mainly for home
consumption, but some sale
Yes, mainly for sale, but some
home consumption
Utulei 24 14 10 0 0 0
Nga'unoho 27 20 2 3 1 1
Utungake 56 27 25 0 2 2
Hahake 403 340 44 0 15 4
Ha'alaufuli 84 76 5 0 3 0
Ha'akio 23 22 0 0 1 0
Houma 17 12 4 0 1 0
Mangia 17 17 0 0 0 0
Ta'anea 128 120 7 0 1 0
Tu'anekivale 82 63 18 0 1 0
Koloa 31 18 4 0 7 2
Holeva 21 12 6 0 1 2
Leimatu'a 482 445 28 0 8 1
Leimatu'a 235 222 11 0 2 0
Holonga 83 74 6 0 2 1
Feletoa 58 50 5 0 3 0
Mataika 106 99 6 0 1 0
Hihifo 385 311 50 2 18 4
Longomapu 109 92 7 0 7 3
Taoa 98 79 16 1 2 0
Tefisi 102 86 8 0 7 1
Vaimalo 23 11 9 1 2 0
Tu'anuku 53 43 10 0 0 0
Motu 172 72 66 1 29 4
Kapa 10 5 5 0 0 0
Falevai 20 12 7 0 1 0
Otea 23 7 9 0 7 0
Lape 5 2 3 0 0 0
Matamaka 23 9 11 1 2 0
Nuapapu 23 8 5 0 10 0
Ovaka 20 5 9 0 2 4
Taunga 9 1 3 0 5 0
Hunga 39 23 14 0 2 0
Foeata Island 0 0 0 0 0 0
Ha'apai 1,179 712 309 39 65 54
Pangai 433 331 76 6 11 9
Pangai 214 173 32 4 3 2
Hihifo 159 105 39 2 8 5
Holopeka 22 19 2 0 0 1
Koulo 38 34 3 0 0 1
Foa 236 173 57 0 2 4
Fangale'ounga 24 13 11 0 0 0
Fotua 42 40 2 0 0 0

Tonga 2016 Census of Population and Housing
Tonga Statistics Department
230
Island, District and Region
Purpose of Fishing
Total No -
fishing
Yes, for home consumption
and social obligation
Yes, for sale
Yes, mainly for home
consumption, but some sale
Yes, mainly for sale, but some
home consumption
Lotofoa 70 47 20 0 1 2
faleloa 64 42 20 0 0 2
Ha'afakahenga 17 17 0 0 0 0
Ha'ateiho Si'i 19 14 4 0 1 0
Lulunga 184 92 42 21 15 14
Ha'afeva island 57 34 10 3 5 5
Tungua 37 18 11 1 4 3
Fotuha'a 19 14 5 0 0 0
'O'ua 25 11 3 0 5 6
Matuku 16 4 5 7 0 0
Kotu 30 11 8 10 1 0
Mu'omu'a 99 45 35 6 9 4
Nomuka 81 38 32 0 8 3
Mango 8 1 2 3 1 1
Fonoifua 10 6 1 3 0 0
Ha`ano 89 28 41 2 7 11
Fakakai 25 9 3 1 3 9
Pukotala 18 7 8 0 2 1
Ha'ano 24 9 12 1 1 1
Muitoa 7 2 4 0 1 0
Mo'unga'one 15 1 14 0 0 0
'Uiha 138 43 58 4 21 12
Uiha 76 26 32 4 6 8
Felemea 31 9 10 0 8 4
Lofanga 31 8 16 0 7 0
Eua 885 776 60 1 22 26
Eua Motu'a 508 436 48 1 14 9
Ohonua 221 190 17 0 11 3
Tufuvai 41 39 0 0 1 1
Pangai 59 57 0 0 1 1
Houma 55 47 7 0 0 1
Ha'atu'a 96 67 24 1 1 3
Ta'anga 36 36 0 0 0 0
'Eua fo'ou 377 340 12 0 8 17
Angaha 65 51 2 0 2 10
Futu 51 48 1 0 1 1
Esia 37 33 2 0 2 0
Sapa'ata 24 24 0 0 0 0
Fata'ulua 36 36 0 0 0 0
Mu'a 28 25 0 0 1 2
Tongamama'o 29 21 3 0 1 4
Petani 57 53 4 0 0 0
Mata'aho 50 49 0 0 1 0

Tonga 2016 Census of Population and Housing
Tonga Statistics Department
231
Island, District and Region
Purpose of Fishing
Total No -
fishing
Yes, for home consumption
and social obligation
Yes, for sale
Yes, mainly for home
consumption, but some sale
Yes, mainly for sale, but some
home consumption
Ongo Niua 273 174 82 0 13 4
Niuatoputapu 172 110 48 0 12 2
Hihifo 71 44 22 0 3 2
Vaipoa 37 21 9 0 7 0
Falehau 56 42 12 0 2 0
Tafahi 8 3 5 0 0 0
Niuafo'ou 101 64 34 0 1 2
Esia 26 18 7 0 1 0
Kolofo'ou 11 9 2 0 0 0
Sapaata 26 14 10 0 0 2
Fata'ulua 13 10 3 0 0 0
Mata'aho 3 3 0 0 0 0
Mu'a 6 6 0 0 0 0
Tongamama'o 2 0 2 0 0 0
Petani 14 4 10 0 0 0
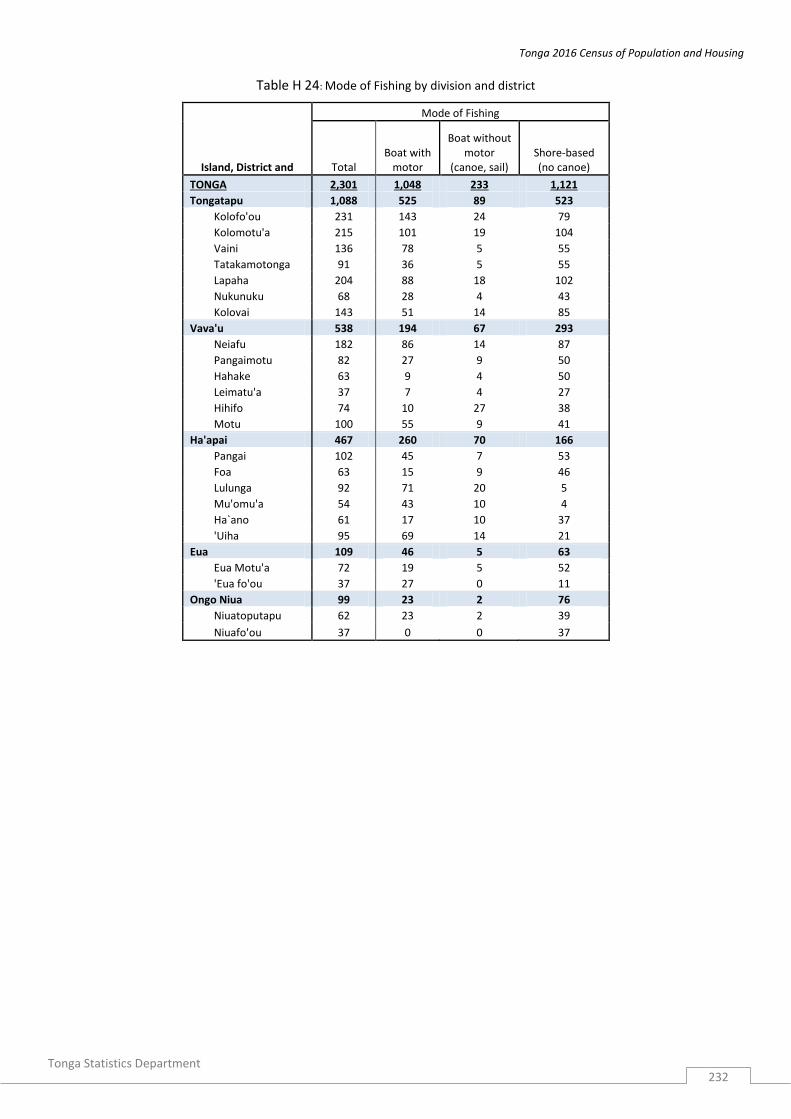
Tonga 2016 Census of Population and Housing
Tonga Statistics Department
232
Table H 24: Mode of Fishing by division and district
Island, District and
Mode of Fishing
Total Boat with
motor
Boat without motor
(canoe, sail) Shore-based (no canoe)
TONGA 2,301 1,048 233 1,121
Tongatapu 1,088 525 89 523
Kolofo'ou 231 143 24 79
Kolomotu'a 215 101 19 104
Vaini 136 78 5 55
Tatakamotonga 91 36 5 55
Lapaha 204 88 18 102
Nukunuku 68 28 4 43
Kolovai 143 51 14 85
Vava'u 538 194 67 293
Neiafu 182 86 14 87
Pangaimotu 82 27 9 50
Hahake 63 9 4 50
Leimatu'a 37 7 4 27
Hihifo 74 10 27 38
Motu 100 55 9 41
Ha'apai 467 260 70 166
Pangai 102 45 7 53
Foa 63 15 9 46
Lulunga 92 71 20 5
Mu'omu'a 54 43 10 4
Ha`ano 61 17 10 37
'Uiha 95 69 14 21
Eua 109 46 5 63
Eua Motu'a 72 19 5 52
'Eua fo'ou 37 27 0 11
Ongo Niua 99 23 2 76
Niuatoputapu 62 23 2 39
Niuafo'ou 37 0 0 37

Tonga 2016 Census of Population and Housing
Tonga Statistics Department
233
Table H 25: Purpose of Raising Livestock by division, district and village
Division/District
Purpose of Raising Livestock
Total No
Yes, for home consumption
and social obligation
Yes, for sale
Yes, mainly for home
consumption, but some sale
Yes, mainly for sale, but some
home consumption
TONGA 18,005 9,907 6,994 67 903 134
Tongatapu 12,953 8,038 4,291 47 478 99
Kolofo'ou 3,108 2,403 635 7 49 14
Kolofo'ou 1,475 1,138 310 1 21 5
Ma'ufanga 1,237 1,003 212 2 17 3
Nukumotu 8 2 5 0 0 1
Popua 312 193 102 4 8 5
Tukutonga 75 66 6 0 3 0
Pangaimotu 1 1 0 0 0 0
Kolomotu'a 3,031 2,060 885 6 65 15
Kolomotu'a 1,377 926 408 2 33 8
Havelu 617 479 132 0 5 1
Tofoa 590 393 182 2 8 5
Hofoa 193 123 62 1 7 0
Puke 156 78 68 0 10 0
Sia'atoutai 98 61 33 1 2 1
Vaini 2,201 1,315 770 9 88 19
Vaini 576 358 175 3 30 10
Malapo 106 43 57 0 2 4
Longoteme 101 50 47 0 4 0
Folaha 162 84 67 1 10 0
Nukuhetulu 63 16 42 0 5 0
Veitongo 179 122 50 1 5 1
Ha'ateiho 449 297 137 1 12 2
Pea 345 206 123 0 15 1
Tokomololo 220 139 72 3 5 1
Tatakamotonga 1,248 643 498 10 83 14
Tatakamotonga 324 180 127 0 15 2
Holonga 89 31 49 0 7 2
Pelehake 149 55 67 5 17 5
Fua'amotu 309 167 134 1 5 2
Nakolo 65 42 18 1 4 0
Ha'asini 158 87 53 0 18 0
Lavengatonga 65 29 21 2 10 3
Haveluliku 26 11 12 1 2 0
Fatumu 63 41 17 0 5 0
Lapaha 1,234 532 595 5 86 16
Lapaha 331 136 159 2 28 6
Talasiu 58 15 32 0 11 0
Hoi 75 51 18 0 6 0
Nukuleka 45 22 21 0 1 1
Makaunga 58 45 11 2 0 0

Tonga 2016 Census of Population and Housing
Tonga Statistics Department
234
Division/District
Purpose of Raising Livestock
Total No
Yes, for home consumption
and social obligation
Yes, for sale
Yes, mainly for home
consumption, but some sale
Yes, mainly for sale, but some
home consumption
Talafo'ou 74 30 41 0 2 1
Manuka 46 24 20 1 1 0
Navutoka 117 54 54 0 9 0
Kolonga 216 55 129 0 24 8
Afa 71 27 41 0 3 0
Niutoua 130 63 66 0 1 0
Eueiki 12 9 3 0 0 0
Fukave 1 1 0 0 0 0
Nukunuku 1,391 772 528 8 69 14
NUkunuku 370 249 103 4 12 2
Matahau 105 41 56 0 6 2
Matafonua 45 15 24 0 6 0
Fatai 59 39 14 1 5 0
Lakepa 54 26 25 0 2 1
Vaotu'u 81 27 51 1 2 0
Utulau 98 50 47 0 0 1
Ha'alalo 103 66 32 1 2 2
Ha'akame 116 86 20 0 8 2
Houma 360 173 156 1 26 4
Kolovai 740 313 380 2 38 7
Kolovai 118 65 48 0 5 0
Te'ekiu 104 39 55 0 9 1
Masilamea 34 15 16 0 3 0
Fahefa 71 51 16 0 4 0
Ha'utu 39 15 21 0 1 2
Kala'au 26 9 17 0 0 0
Fo'ui 104 24 72 0 8 0
Ha'avakatolo 40 16 20 0 2 2
Ahau 61 23 34 0 3 1
Kanokupolu 65 29 34 0 2 0
Ha'atafu 47 14 29 2 1 1
Atata 31 13 18 0 0 0
Vava'u 2,715 1,172 1,317 7 210 9
Neiafu 1,041 638 389 2 10 2
Neiafu 743 454 282 0 6 1
Makave 72 53 17 0 2 0
Toula 83 56 27 0 0 0
Utui 55 49 6 0 0 0
Ofu 26 5 21 0 0 0
Okoa 48 8 35 2 2 1
Olo'ua 14 13 1 0 0 0
Pangaimotu 232 56 166 2 8 0
Pangaimotu 125 31 89 1 4 0
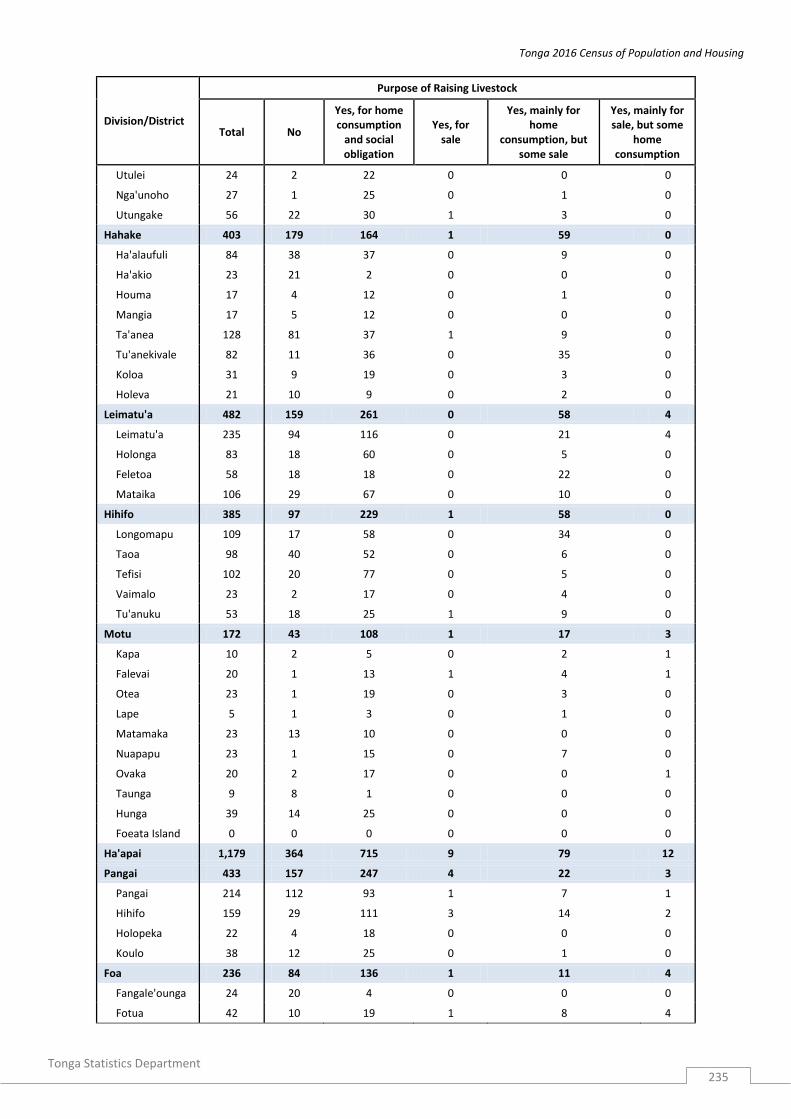
Tonga 2016 Census of Population and Housing
Tonga Statistics Department
235
Division/District
Purpose of Raising Livestock
Total No
Yes, for home consumption
and social obligation
Yes, for sale
Yes, mainly for home
consumption, but some sale
Yes, mainly for sale, but some
home consumption
Utulei 24 2 22 0 0 0
Nga'unoho 27 1 25 0 1 0
Utungake 56 22 30 1 3 0
Hahake 403 179 164 1 59 0
Ha'alaufuli 84 38 37 0 9 0
Ha'akio 23 21 2 0 0 0
Houma 17 4 12 0 1 0
Mangia 17 5 12 0 0 0
Ta'anea 128 81 37 1 9 0
Tu'anekivale 82 11 36 0 35 0
Koloa 31 9 19 0 3 0
Holeva 21 10 9 0 2 0
Leimatu'a 482 159 261 0 58 4
Leimatu'a 235 94 116 0 21 4
Holonga 83 18 60 0 5 0
Feletoa 58 18 18 0 22 0
Mataika 106 29 67 0 10 0
Hihifo 385 97 229 1 58 0
Longomapu 109 17 58 0 34 0
Taoa 98 40 52 0 6 0
Tefisi 102 20 77 0 5 0
Vaimalo 23 2 17 0 4 0
Tu'anuku 53 18 25 1 9 0
Motu 172 43 108 1 17 3
Kapa 10 2 5 0 2 1
Falevai 20 1 13 1 4 1
Otea 23 1 19 0 3 0
Lape 5 1 3 0 1 0
Matamaka 23 13 10 0 0 0
Nuapapu 23 1 15 0 7 0
Ovaka 20 2 17 0 0 1
Taunga 9 8 1 0 0 0
Hunga 39 14 25 0 0 0
Foeata Island 0 0 0 0 0 0
Ha'apai 1,179 364 715 9 79 12
Pangai 433 157 247 4 22 3
Pangai 214 112 93 1 7 1
Hihifo 159 29 111 3 14 2
Holopeka 22 4 18 0 0 0
Koulo 38 12 25 0 1 0
Foa 236 84 136 1 11 4
Fangale'ounga 24 20 4 0 0 0
Fotua 42 10 19 1 8 4

Tonga 2016 Census of Population and Housing
Tonga Statistics Department
236
Division/District
Purpose of Raising Livestock
Total No
Yes, for home consumption
and social obligation
Yes, for sale
Yes, mainly for home
consumption, but some sale
Yes, mainly for sale, but some
home consumption
Lotofoa 70 5 63 0 2 0
faleloa 64 16 47 0 1 0
Ha'afakahenga 17 17 0 0 0 0
Ha'ateiho Si'i 19 16 3 0 0 0
Lulunga 184 44 127 3 9 1
Ha'afeva island 57 12 41 0 4 0
Tungua 37 16 13 3 4 1
Fotuha'a 19 1 17 0 1 0
'O'ua 25 5 20 0 0 0
Matuku 16 4 12 0 0 0
Kotu 30 6 24 0 0 0
Mu'omu'a 99 30 62 0 7 0
Nomuka 81 13 61 0 7 0
Mango 8 7 1 0 0 0
Fonoifua 10 10 0 0 0 0
Ha`ano 89 10 76 0 3 0
Fakakai 25 5 20 0 0 0
Pukotala 18 3 15 0 0 0
Ha'ano 24 1 22 0 1 0
Muitoa 7 0 6 0 1 0
Mo'unga'one 15 1 13 0 1 0
'Uiha 138 39 67 1 27 4
Uiha 76 34 33 1 4 4
Felemea 31 2 14 0 15 0
Lofanga 31 3 20 0 8 0
Eua 885 271 495 4 103 12
Eua Motu'a 508 161 270 4 70 3
Ohonua 221 63 104 1 52 1
Tufuvai 41 18 22 0 1 0
Pangai 59 35 16 0 8 0
Houma 55 18 35 0 2 0
Ha'atu'a 96 25 60 3 7 1
Ta'anga 36 2 33 0 0 1
'Eua fo'ou 377 110 225 0 33 9
Angaha 65 18 30 0 10 7
Futu 51 27 22 0 2 0
Esia 37 13 24 0 0 0
Sapa'ata 24 11 12 0 1 0
Fata'ulua 36 10 22 0 3 1
Mu'a 28 7 20 0 1 0
Tongamama'o 29 3 25 0 1 0
Petani 57 10 35 0 11 1
Mata'aho 50 11 35 0 4 0

Tonga 2016 Census of Population and Housing
Tonga Statistics Department
237
Division/District
Purpose of Raising Livestock
Total No
Yes, for home consumption
and social obligation
Yes, for sale
Yes, mainly for home
consumption, but some sale
Yes, mainly for sale, but some
home consumption
Ongo Niua 273 62 176 0 33 2
Niuatoputapu 172 39 116 0 16 1
Hihifo 71 16 43 0 11 1
Vaipoa 37 2 30 0 5 0
Falehau 56 21 35 0 0 0
Tafahi 8 0 8 0 0 0
Niuafo'ou 101 23 60 0 17 1
Esia 26 11 14 0 0 1
Kolofo'ou 11 3 8 0 0 0
Sapaata 26 6 15 0 5 0
Fata'ulua 13 1 12 0 0 0
Mata'aho 3 0 3 0 0 0
Mu'a 6 2 4 0 0 0
Tongamama'o 2 0 1 0 1 0
Petani 14 0 3 0 11 0
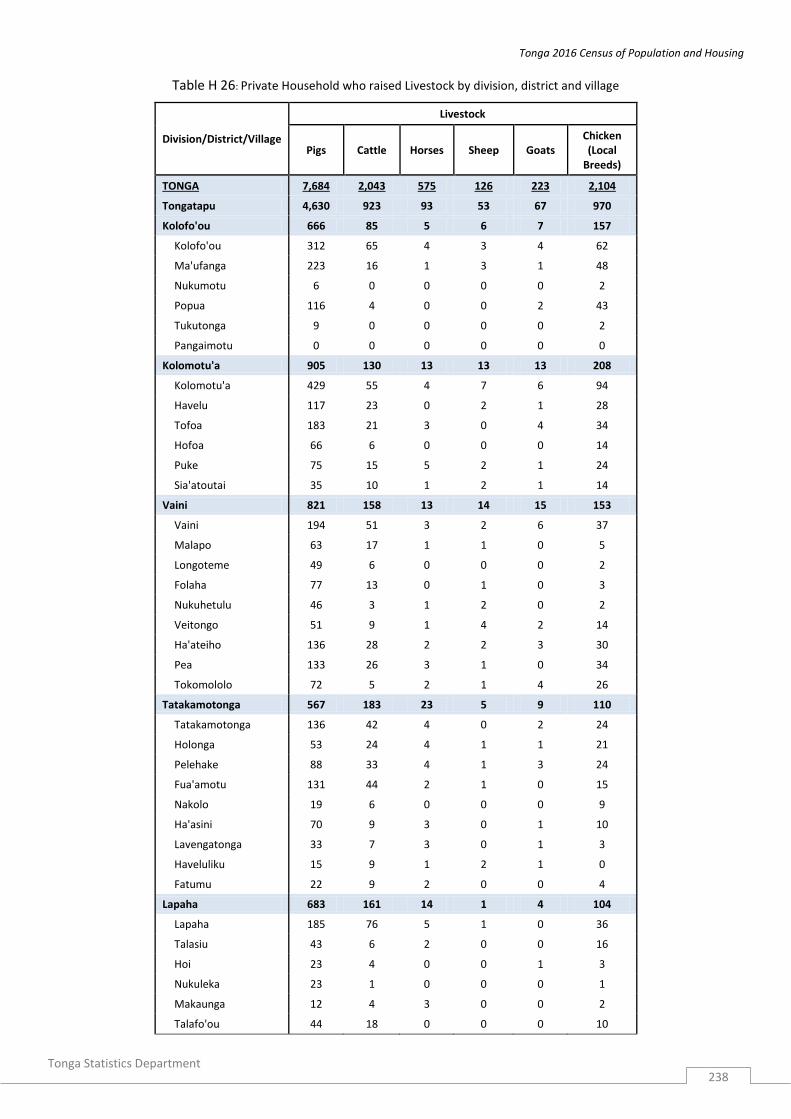
Tonga 2016 Census of Population and Housing
Tonga Statistics Department
238
Table H 26: Private Household who raised Livestock by division, district and village
Division/District/Village
Livestock
Pigs Cattle Horses Sheep Goats Chicken (Local
Breeds)
TONGA 7,684 2,043 575 126 223 2,104
Tongatapu 4,630 923 93 53 67 970
Kolofo'ou 666 85 5 6 7 157
Kolofo'ou 312 65 4 3 4 62
Ma'ufanga 223 16 1 3 1 48
Nukumotu 6 0 0 0 0 2
Popua 116 4 0 0 2 43
Tukutonga 9 0 0 0 0 2
Pangaimotu 0 0 0 0 0 0
Kolomotu'a 905 130 13 13 13 208
Kolomotu'a 429 55 4 7 6 94
Havelu 117 23 0 2 1 28
Tofoa 183 21 3 0 4 34
Hofoa 66 6 0 0 0 14
Puke 75 15 5 2 1 24
Sia'atoutai 35 10 1 2 1 14
Vaini 821 158 13 14 15 153
Vaini 194 51 3 2 6 37
Malapo 63 17 1 1 0 5
Longoteme 49 6 0 0 0 2
Folaha 77 13 0 1 0 3
Nukuhetulu 46 3 1 2 0 2
Veitongo 51 9 1 4 2 14
Ha'ateiho 136 28 2 2 3 30
Pea 133 26 3 1 0 34
Tokomololo 72 5 2 1 4 26
Tatakamotonga 567 183 23 5 9 110
Tatakamotonga 136 42 4 0 2 24
Holonga 53 24 4 1 1 21
Pelehake 88 33 4 1 3 24
Fua'amotu 131 44 2 1 0 15
Nakolo 19 6 0 0 0 9
Ha'asini 70 9 3 0 1 10
Lavengatonga 33 7 3 0 1 3
Haveluliku 15 9 1 2 1 0
Fatumu 22 9 2 0 0 4
Lapaha 683 161 14 1 4 104
Lapaha 185 76 5 1 0 36
Talasiu 43 6 2 0 0 16
Hoi 23 4 0 0 1 3
Nukuleka 23 1 0 0 0 1
Makaunga 12 4 3 0 0 2
Talafo'ou 44 18 0 0 0 10
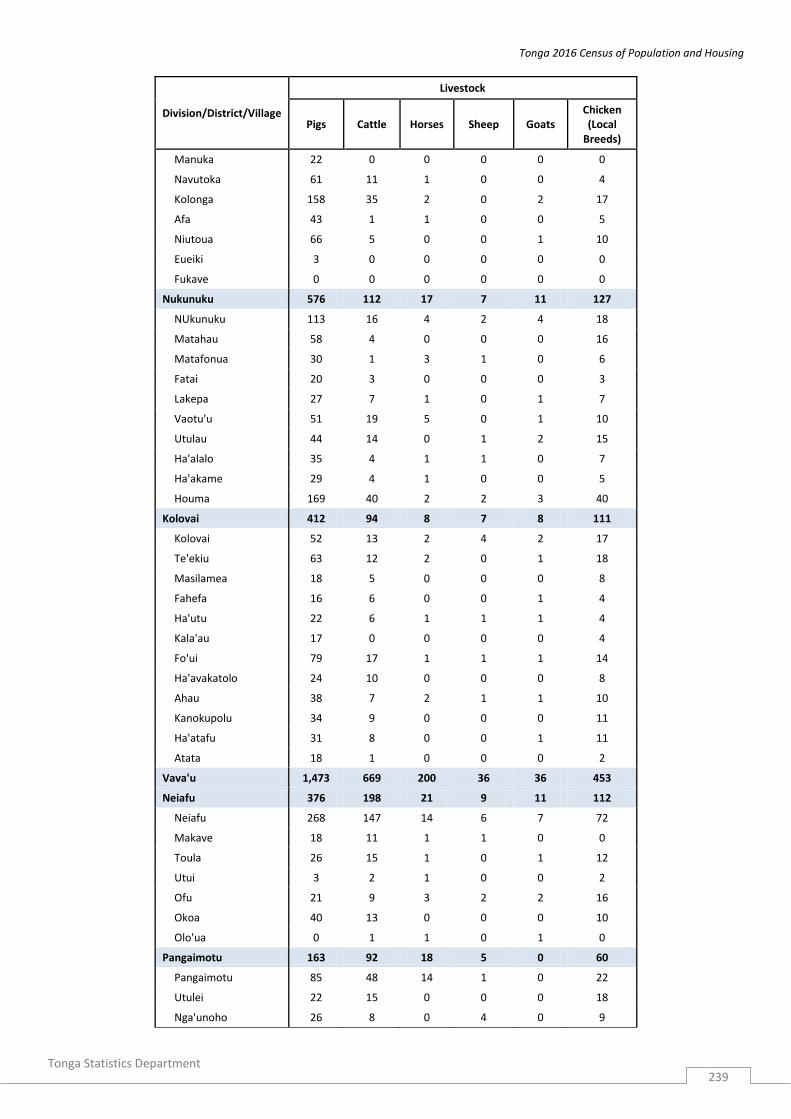
Tonga 2016 Census of Population and Housing
Tonga Statistics Department
239
Division/District/Village
Livestock
Pigs Cattle Horses Sheep Goats Chicken (Local
Breeds)
Manuka 22 0 0 0 0 0
Navutoka 61 11 1 0 0 4
Kolonga 158 35 2 0 2 17
Afa 43 1 1 0 0 5
Niutoua 66 5 0 0 1 10
Eueiki 3 0 0 0 0 0
Fukave 0 0 0 0 0 0
Nukunuku 576 112 17 7 11 127
NUkunuku 113 16 4 2 4 18
Matahau 58 4 0 0 0 16
Matafonua 30 1 3 1 0 6
Fatai 20 3 0 0 0 3
Lakepa 27 7 1 0 1 7
Vaotu'u 51 19 5 0 1 10
Utulau 44 14 0 1 2 15
Ha'alalo 35 4 1 1 0 7
Ha'akame 29 4 1 0 0 5
Houma 169 40 2 2 3 40
Kolovai 412 94 8 7 8 111
Kolovai 52 13 2 4 2 17
Te'ekiu 63 12 2 0 1 18
Masilamea 18 5 0 0 0 8
Fahefa 16 6 0 0 1 4
Ha'utu 22 6 1 1 1 4
Kala'au 17 0 0 0 0 4
Fo'ui 79 17 1 1 1 14
Ha'avakatolo 24 10 0 0 0 8
Ahau 38 7 2 1 1 10
Kanokupolu 34 9 0 0 0 11
Ha'atafu 31 8 0 0 1 11
Atata 18 1 0 0 0 2
Vava'u 1,473 669 200 36 36 453
Neiafu 376 198 21 9 11 112
Neiafu 268 147 14 6 7 72
Makave 18 11 1 1 0 0
Toula 26 15 1 0 1 12
Utui 3 2 1 0 0 2
Ofu 21 9 3 2 2 16
Okoa 40 13 0 0 0 10
Olo'ua 0 1 1 0 1 0
Pangaimotu 163 92 18 5 0 60
Pangaimotu 85 48 14 1 0 22
Utulei 22 15 0 0 0 18
Nga'unoho 26 8 0 4 0 9
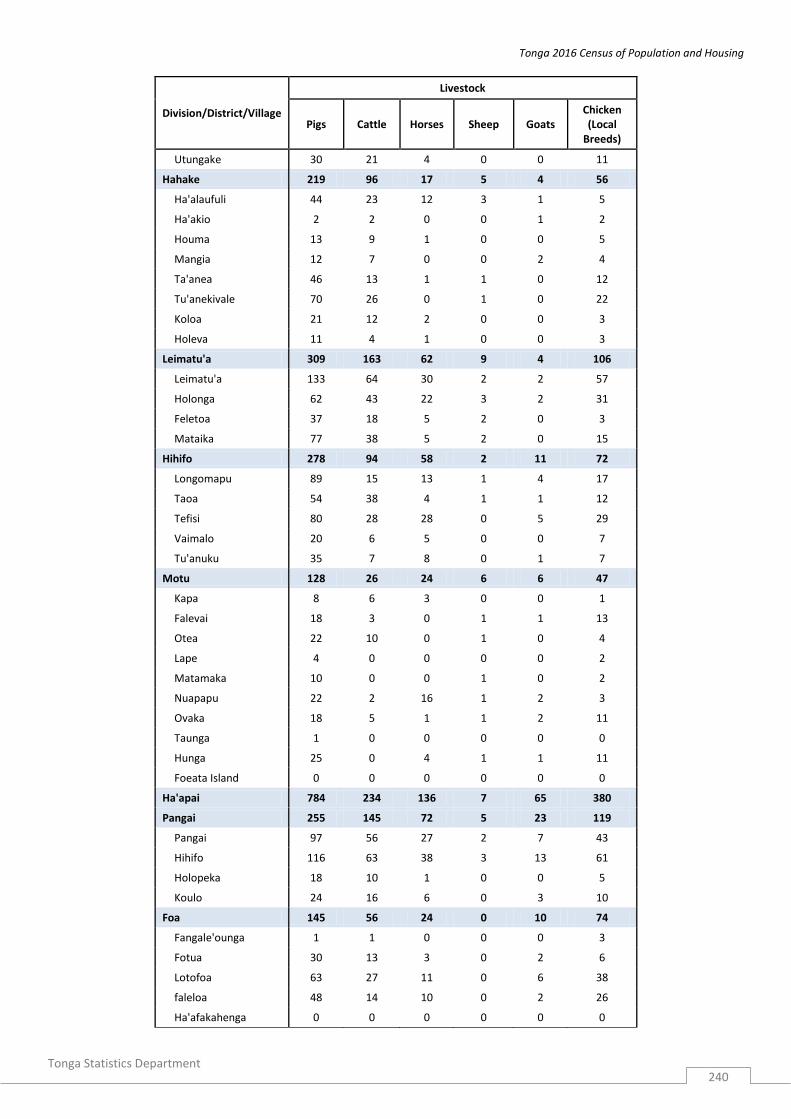
Tonga 2016 Census of Population and Housing
Tonga Statistics Department
240
Division/District/Village
Livestock
Pigs Cattle Horses Sheep Goats Chicken (Local
Breeds)
Utungake 30 21 4 0 0 11
Hahake 219 96 17 5 4 56
Ha'alaufuli 44 23 12 3 1 5
Ha'akio 2 2 0 0 1 2
Houma 13 9 1 0 0 5
Mangia 12 7 0 0 2 4
Ta'anea 46 13 1 1 0 12
Tu'anekivale 70 26 0 1 0 22
Koloa 21 12 2 0 0 3
Holeva 11 4 1 0 0 3
Leimatu'a 309 163 62 9 4 106
Leimatu'a 133 64 30 2 2 57
Holonga 62 43 22 3 2 31
Feletoa 37 18 5 2 0 3
Mataika 77 38 5 2 0 15
Hihifo 278 94 58 2 11 72
Longomapu 89 15 13 1 4 17
Taoa 54 38 4 1 1 12
Tefisi 80 28 28 0 5 29
Vaimalo 20 6 5 0 0 7
Tu'anuku 35 7 8 0 1 7
Motu 128 26 24 6 6 47
Kapa 8 6 3 0 0 1
Falevai 18 3 0 1 1 13
Otea 22 10 0 1 0 4
Lape 4 0 0 0 0 2
Matamaka 10 0 0 1 0 2
Nuapapu 22 2 16 1 2 3
Ovaka 18 5 1 1 2 11
Taunga 1 0 0 0 0 0
Hunga 25 0 4 1 1 11
Foeata Island 0 0 0 0 0 0
Ha'apai 784 234 136 7 65 380
Pangai 255 145 72 5 23 119
Pangai 97 56 27 2 7 43
Hihifo 116 63 38 3 13 61
Holopeka 18 10 1 0 0 5
Koulo 24 16 6 0 3 10
Foa 145 56 24 0 10 74
Fangale'ounga 1 1 0 0 0 3
Fotua 30 13 3 0 2 6
Lotofoa 63 27 11 0 6 38
faleloa 48 14 10 0 2 26
Ha'afakahenga 0 0 0 0 0 0
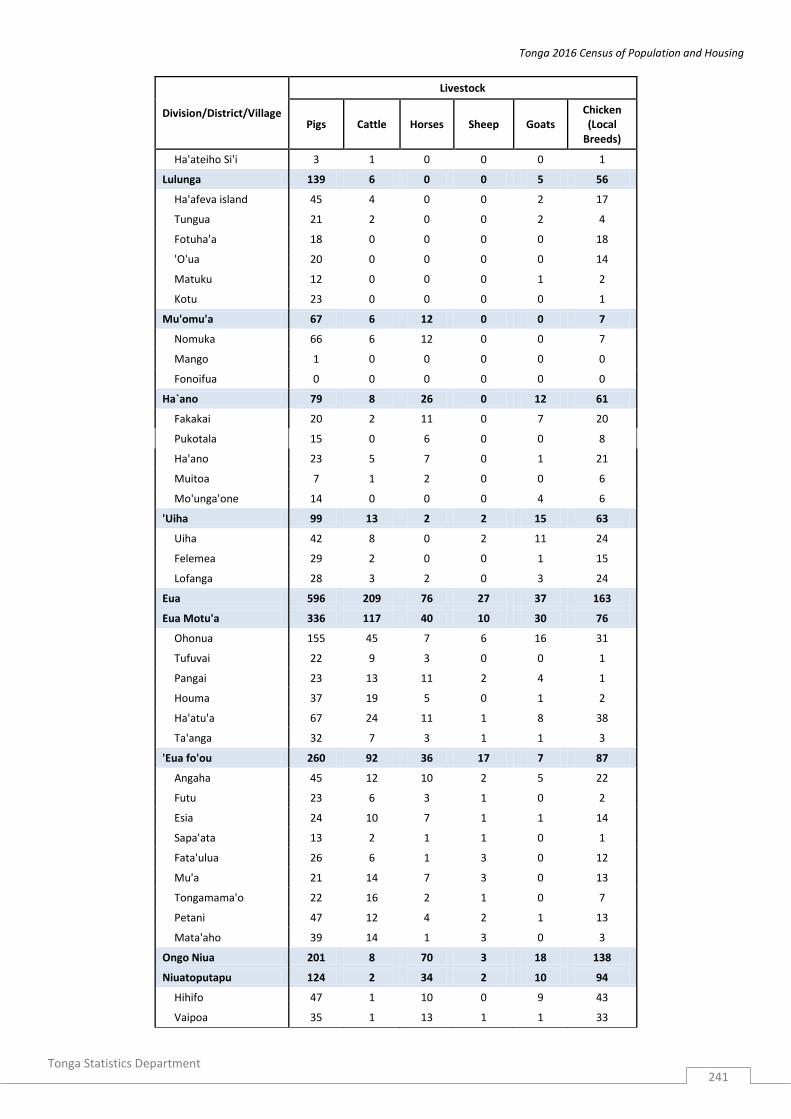
Tonga 2016 Census of Population and Housing
Tonga Statistics Department
241
Division/District/Village
Livestock
Pigs Cattle Horses Sheep Goats Chicken (Local
Breeds)
Ha'ateiho Si'i 3 1 0 0 0 1
Lulunga 139 6 0 0 5 56
Ha'afeva island 45 4 0 0 2 17
Tungua 21 2 0 0 2 4
Fotuha'a 18 0 0 0 0 18
'O'ua 20 0 0 0 0 14
Matuku 12 0 0 0 1 2
Kotu 23 0 0 0 0 1
Mu'omu'a 67 6 12 0 0 7
Nomuka 66 6 12 0 0 7
Mango 1 0 0 0 0 0
Fonoifua 0 0 0 0 0 0
Ha`ano 79 8 26 0 12 61
Fakakai 20 2 11 0 7 20
Pukotala 15 0 6 0 0 8
Ha'ano 23 5 7 0 1 21
Muitoa 7 1 2 0 0 6
Mo'unga'one 14 0 0 0 4 6
'Uiha 99 13 2 2 15 63
Uiha 42 8 0 2 11 24
Felemea 29 2 0 0 1 15
Lofanga 28 3 2 0 3 24
Eua 596 209 76 27 37 163
Eua Motu'a 336 117 40 10 30 76
Ohonua 155 45 7 6 16 31
Tufuvai 22 9 3 0 0 1
Pangai 23 13 11 2 4 1
Houma 37 19 5 0 1 2
Ha'atu'a 67 24 11 1 8 38
Ta'anga 32 7 3 1 1 3
'Eua fo'ou 260 92 36 17 7 87
Angaha 45 12 10 2 5 22
Futu 23 6 3 1 0 2
Esia 24 10 7 1 1 14
Sapa'ata 13 2 1 1 0 1
Fata'ulua 26 6 1 3 0 12
Mu'a 21 14 7 3 0 13
Tongamama'o 22 16 2 1 0 7
Petani 47 12 4 2 1 13
Mata'aho 39 14 1 3 0 3
Ongo Niua 201 8 70 3 18 138
Niuatoputapu 124 2 34 2 10 94
Hihifo 47 1 10 0 9 43
Vaipoa 35 1 13 1 1 33

Tonga 2016 Census of Population and Housing
Tonga Statistics Department
242
Division/District/Village
Livestock
Pigs Cattle Horses Sheep Goats Chicken (Local
Breeds)
Falehau 34 0 8 0 0 11
Tafahi 8 0 3 1 0 7
Niuafo'ou 77 6 36 1 8 44
Esia 15 0 3 0 0 6
Kolofo'ou 8 1 5 0 0 4
Sapaata 20 3 10 1 5 9
Fata'ulua 11 0 1 0 2 7
Mata'aho 3 1 3 0 1 2
Mu'a 4 0 2 0 0 3
Tongamama'o 2 1 2 0 0 2
Petani 14 0 10 0 0 11

Tonga 2016 Census of Population and Housing
Tonga Statistics Department
243
Table H 27: Private Households who produced handicrafts by division, district and village
Division/District/Village
Handicrafts
Total No
Yes, for home consumption
and social obligation
Yes, for sale
Yes, mainly for home
consumption, but some sale
Yes, mainly for sale, but some
home consumption
TONGA 18,005 13,490 2,107 937 943 528
Tongatapu 12,953 10,523 1,132 595 432 271
Kolofo'ou 3,108 2,757 143 119 51 38
Kolofo'ou 1,475 1,358 44 45 16 12
Ma'ufanga 1,237 1,083 65 52 24 13
Nukumotu 8 8 0 0 0 0
Popua 312 241 29 22 8 12
Tukutonga 75 66 5 0 3 1
Pangaimotu 1 1 0 0 0 0
Kolomotu'a 3,031 2,630 217 112 43 29
Kolomotu'a 1,377 1,238 75 38 18 8
Havelu 617 538 51 21 4 3
Tofoa 590 480 65 23 14 8
Hofoa 193 172 8 7 1 5
Puke 156 115 12 20 5 4
Sia'atoutai 98 87 6 3 1 1
Vaini 2,201 1,693 256 124 98 30
Vaini 576 507 34 22 8 5
Malapo 106 68 5 33 0 0
Longoteme 101 41 42 2 11 5
Folaha 162 92 45 9 15 1
Nukuhetulu 63 38 13 10 1 1
Veitongo 179 155 11 5 8 0
Ha'ateiho 449 354 40 23 22 10
Pea 345 275 40 9 16 5
Tokomololo 220 163 26 11 17 3
Tatakamotonga 1,248 925 140 74 49 60
Tatakamotonga 324 270 35 14 1 4
Holonga 89 68 8 1 2 10
Pelehake 149 95 12 5 22 15
Fua'amotu 309 242 43 16 6 2
Nakolo 65 45 3 15 1 1
Ha'asini 158 105 10 9 11 23
Lavengatonga 65 43 10 7 3 2
Haveluliku 26 23 2 0 0 1
Fatumu 63 34 17 7 3 2
Lapaha 1,234 906 164 50 69 45
Lapaha 331 247 56 5 16 7
Talasiu 58 21 9 6 19 3
Hoi 75 67 0 4 4 0
Nukuleka 45 42 1 1 1 0
Makaunga 58 51 2 4 1 0

Tonga 2016 Census of Population and Housing
Tonga Statistics Department
244
Division/District/Village
Handicrafts
Total No
Yes, for home consumption
and social obligation
Yes, for sale
Yes, mainly for home
consumption, but some sale
Yes, mainly for sale, but some
home consumption
Talafo'ou 74 55 9 0 6 4
Manuka 46 46 0 0 0 0
Navutoka 117 102 8 1 3 3
Kolonga 216 140 31 20 8 17
Afa 71 38 20 4 3 6
Niutoua 130 87 25 5 8 5
Eueiki 12 9 3 0 0 0
Fukave 1 1 0 0 0 0
Nukunuku 1,391 1,097 96 86 75 37
NUkunuku 370 280 29 42 12 7
Matahau 105 88 4 3 3 7
Matafonua 45 27 12 0 4 2
Fatai 59 53 1 3 2 0
Lakepa 54 48 1 3 0 2
Vaotu'u 81 71 2 4 4 0
Utulau 98 89 4 0 4 1
Ha'alalo 103 79 8 11 3 2
Ha'akame 116 96 0 6 14 0
Houma 360 266 35 14 29 16
Kolovai 740 515 116 30 47 32
Kolovai 118 100 9 0 7 2
Te'ekiu 104 67 21 6 5 5
Masilamea 34 20 6 4 4 0
Fahefa 71 60 1 8 1 1
Ha'utu 39 27 3 1 1 7
Kala'au 26 12 12 1 1 0
Fo'ui 104 64 21 1 16 2
Ha'avakatolo 40 29 4 1 3 3
Ahau 61 31 16 4 4 6
Kanokupolu 65 51 6 4 2 2
Ha'atafu 47 25 15 0 3 4
Atata 31 29 2 0 0 0
Vava'u 2,715 1,776 483 161 218 77
Neiafu 1,041 803 143 37 30 28
Neiafu 743 581 108 26 16 12
Makave 72 69 1 0 2 0
Toula 83 50 23 4 3 3
Utui 55 51 3 0 1 0
Ofu 26 10 1 0 5 10
Okoa 48 40 5 2 1 0
Olo'ua 14 2 2 5 2 3
Pangaimotu 232 126 57 20 22 7
Pangaimotu 125 70 21 16 14 4
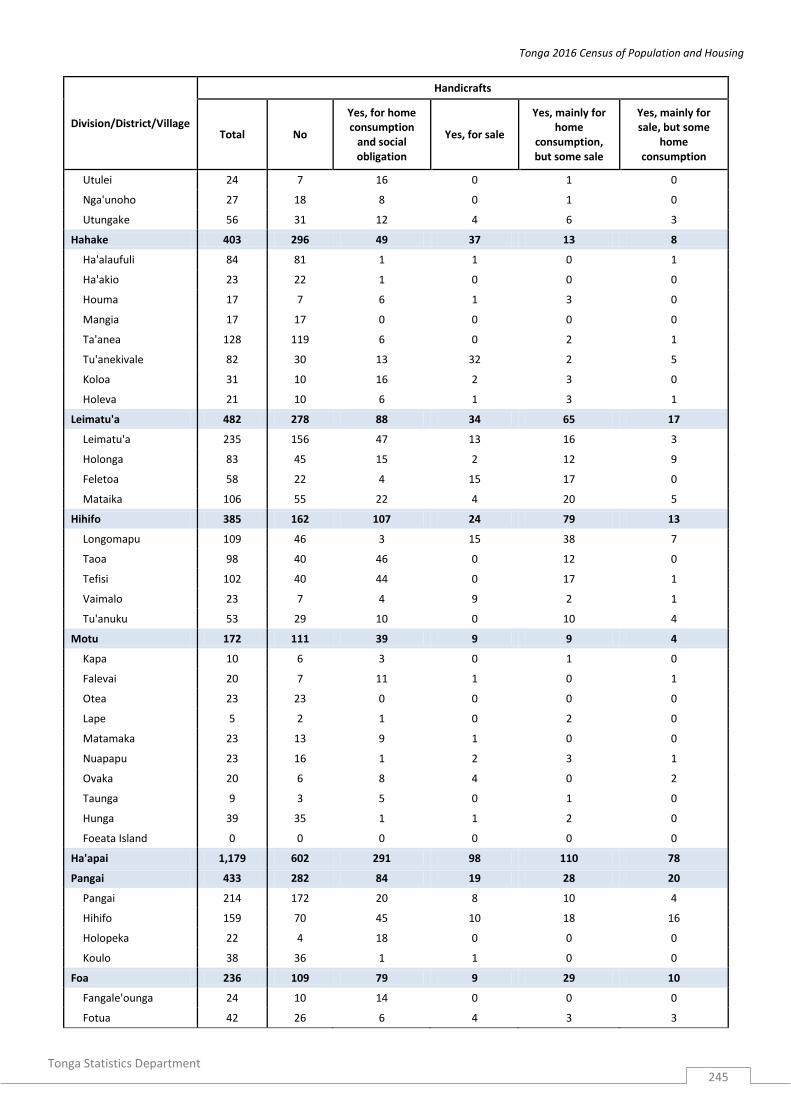
Tonga 2016 Census of Population and Housing
Tonga Statistics Department
245
Division/District/Village
Handicrafts
Total No
Yes, for home consumption
and social obligation
Yes, for sale
Yes, mainly for home
consumption, but some sale
Yes, mainly for sale, but some
home consumption
Utulei 24 7 16 0 1 0
Nga'unoho 27 18 8 0 1 0
Utungake 56 31 12 4 6 3
Hahake 403 296 49 37 13 8
Ha'alaufuli 84 81 1 1 0 1
Ha'akio 23 22 1 0 0 0
Houma 17 7 6 1 3 0
Mangia 17 17 0 0 0 0
Ta'anea 128 119 6 0 2 1
Tu'anekivale 82 30 13 32 2 5
Koloa 31 10 16 2 3 0
Holeva 21 10 6 1 3 1
Leimatu'a 482 278 88 34 65 17
Leimatu'a 235 156 47 13 16 3
Holonga 83 45 15 2 12 9
Feletoa 58 22 4 15 17 0
Mataika 106 55 22 4 20 5
Hihifo 385 162 107 24 79 13
Longomapu 109 46 3 15 38 7
Taoa 98 40 46 0 12 0
Tefisi 102 40 44 0 17 1
Vaimalo 23 7 4 9 2 1
Tu'anuku 53 29 10 0 10 4
Motu 172 111 39 9 9 4
Kapa 10 6 3 0 1 0
Falevai 20 7 11 1 0 1
Otea 23 23 0 0 0 0
Lape 5 2 1 0 2 0
Matamaka 23 13 9 1 0 0
Nuapapu 23 16 1 2 3 1
Ovaka 20 6 8 4 0 2
Taunga 9 3 5 0 1 0
Hunga 39 35 1 1 2 0
Foeata Island 0 0 0 0 0 0
Ha'apai 1,179 602 291 98 110 78
Pangai 433 282 84 19 28 20
Pangai 214 172 20 8 10 4
Hihifo 159 70 45 10 18 16
Holopeka 22 4 18 0 0 0
Koulo 38 36 1 1 0 0
Foa 236 109 79 9 29 10
Fangale'ounga 24 10 14 0 0 0
Fotua 42 26 6 4 3 3
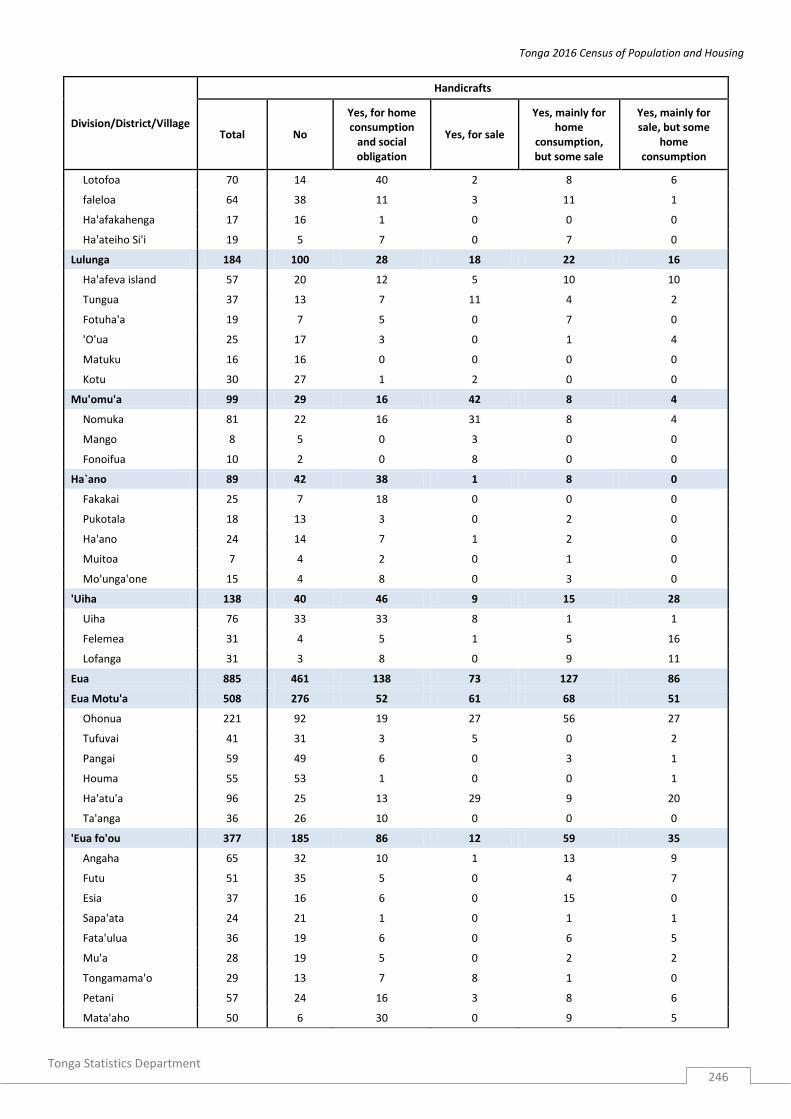
Tonga 2016 Census of Population and Housing
Tonga Statistics Department
246
Division/District/Village
Handicrafts
Total No
Yes, for home consumption
and social obligation
Yes, for sale
Yes, mainly for home
consumption, but some sale
Yes, mainly for sale, but some
home consumption
Lotofoa 70 14 40 2 8 6
faleloa 64 38 11 3 11 1
Ha'afakahenga 17 16 1 0 0 0
Ha'ateiho Si'i 19 5 7 0 7 0
Lulunga 184 100 28 18 22 16
Ha'afeva island 57 20 12 5 10 10
Tungua 37 13 7 11 4 2
Fotuha'a 19 7 5 0 7 0
'O'ua 25 17 3 0 1 4
Matuku 16 16 0 0 0 0
Kotu 30 27 1 2 0 0
Mu'omu'a 99 29 16 42 8 4
Nomuka 81 22 16 31 8 4
Mango 8 5 0 3 0 0
Fonoifua 10 2 0 8 0 0
Ha`ano 89 42 38 1 8 0
Fakakai 25 7 18 0 0 0
Pukotala 18 13 3 0 2 0
Ha'ano 24 14 7 1 2 0
Muitoa 7 4 2 0 1 0
Mo'unga'one 15 4 8 0 3 0
'Uiha 138 40 46 9 15 28
Uiha 76 33 33 8 1 1
Felemea 31 4 5 1 5 16
Lofanga 31 3 8 0 9 11
Eua 885 461 138 73 127 86
Eua Motu'a 508 276 52 61 68 51
Ohonua 221 92 19 27 56 27
Tufuvai 41 31 3 5 0 2
Pangai 59 49 6 0 3 1
Houma 55 53 1 0 0 1
Ha'atu'a 96 25 13 29 9 20
Ta'anga 36 26 10 0 0 0
'Eua fo'ou 377 185 86 12 59 35
Angaha 65 32 10 1 13 9
Futu 51 35 5 0 4 7
Esia 37 16 6 0 15 0
Sapa'ata 24 21 1 0 1 1
Fata'ulua 36 19 6 0 6 5
Mu'a 28 19 5 0 2 2
Tongamama'o 29 13 7 8 1 0
Petani 57 24 16 3 8 6
Mata'aho 50 6 30 0 9 5

Tonga 2016 Census of Population and Housing
Tonga Statistics Department
247
Division/District/Village
Handicrafts
Total No
Yes, for home consumption
and social obligation
Yes, for sale
Yes, mainly for home
consumption, but some sale
Yes, mainly for sale, but some
home consumption
Ongo Niua 273 128 63 10 56 16
Niuatoputapu 172 66 34 10 47 15
Hihifo 71 20 15 0 22 14
Vaipoa 37 2 14 10 11 0
Falehau 56 41 4 0 10 1
Tafahi 8 3 1 0 4 0
Niuafo'ou 101 62 29 0 9 1
Esia 26 13 13 0 0 0
Kolofo'ou 11 11 0 0 0 0
Sapaata 26 17 5 0 3 1
Fata'ulua 13 3 10 0 0 0
Mata'aho 3 3 0 0 0 0
Mu'a 6 6 0 0 0 0
Tongamama'o 2 1 0 0 1 0
Petani 14 8 1 0 5 0

Tonga 2016 Census of Population and Housing
Tonga Statistics Department
248
Part 2: Census 2016 Background
2.1 Introduction
The Census is the official count of population, dwellings and households in Tonga and it provides a ‘snapshot’ of the
country at one specific point in time: 30th of November 2016. Since 1956 until 2006, Census has been taken once in
every ten years.
The census provides a unique source of detailed demographic, social and economic data relating the entire
population and its most precious resource of its people. This information is used for policy making and planning,
monitoring and evaluation, research and other decision-making.
The census is often the primary source of information such as used for allocation of public funding, especially in
areas such as health, education and social policy. The main users of this information are the government, local
authorities, education facilities (such as schools and tertiary organizations), businesses, community organizations
and the public in general.
The population census 2016 was the second population census by 5 years interval or after 5 years from the previous census in 2011. This was requested by the Electoral Boundary Commission (EBC) according to its Act 2010. Of this Electoral Boundary Commission Act 2010, Section 21(1) & (2) states;
(1) To facilitate the second determination of boundaries under this Act, the Minister responsible for the
administration of the Statistics Act shall cause a general population census to be carried out before the next
General Election.
(2) The Government Statistician shall certify and provide to the Commission such Information, calculations and
projections that the Commission may enable it to perform its functions under this Act.
2.2 Census History
The 2016 Census was taken under the authority of revised Statictics Act No. 7 of 2015. A review of the Statistical Act (1978) Chapter 53, which empowers the Minister of Finance to make regulations necessary to conduct the population Census. This regulation was approved by the Cabinet and cited as Census Regulation 2011. The Census regulations also indicate that the Government Statistician is responsible for the administration and completion of the Census, in addition, the regulations enabled the Statistics Department to carry out the necessary activities required to plan, manage and implement all the necessary Census activities. Censuses of population were first taken in England and Scotland in March 1801, Ireland in 1811 and Australia in 1828. The first New Zealand was undertaken in 1851. A national population census has been taken in Tonga since 1921, although there were counts as early as 1891. After World War II, censuses in Tonga were taken regularly once in every ten years beginning in 1956 up to 2006. In 2011 Census of Population and Housing was the first time to conduct Census in a five-yearly interval, and 2016 is the second one. 1.1 Census planning and management From a planning and management perspective, the Census had two main objectives. Firstly, it was to ensure that the process of collecting, compiling, evaluating, analysing and disseminating of demographic, economic and social data was conducted in a timely and accurate manner. The development of procedures and processes for the 2016 Census of Population and Housing made use of the lessons learned in previous censuses, and built upon recommendations for improvements. Secondly, it was a valuable opportunity for building the capacities of employees of the Statistics Department (SD), thus resulting in enhancing the image, credibility and reputation of the Department and at the same time, strengthening its infrastructure. Emphasis was placed on having a senior staff with a wide perspective and leadership qualities.
Tonga 2016 Census of Population and Housing
Tonga Statistics Department
249
Through the use of vision, planning, coordination, delegation of responsibility and a strong team spirit, the census work was conducted in an effective and efficient manner. Incentives for other parties to participate, both within and outside the government, w e r e encouraged. As a result, the wider community including donors such as UNICEF, the Secretariat of the Pacific Community (SPC) in Noumea, that provided the technical assistance and the general public, were able to support the census project. The most distinct feature about the 2016 Population and Housing Census was using new technology –tablets using CAPI for data collection. Tonga had been the first country in the Pacific to use tablets for a Population Census. Statistics Department had planned taking into account the great advantages that associated this methodology. Tablets were able to contribute to cutting down budget cost, and avoid long period taken for data processing phase and not the least enable monitoring of fieldwork simultaneously. Later advantages includes institutionalizing across ministries these equipments. There were 600 tablets all together where 100 was donated by UNICEF and 500 purchased by Tonga Government. Out of those 600, 55 Huawei tablets were purchased first and used during the Census Listing and 545 Samsung tablets were later purchased prior fieldwork. Data consistency between censuses was an important consideration in the overall census planning. Demands for and the use of data, improvement in data accessibility and analytical tools were also considered. Extensive and detailed planning is needed to conduct a successful census. Areas that required planning include: enumeration procedures and fieldwork, public communication, data processing and output systems, mapping and the design of census block boundaries, dissemination procedures, content determination and questionnaire development and training. These aspects, and how they interacted with each other, played a crucial role in determining the quality of all of the census outputs. Each phase therefore required careful, methodical planning and testing. The details of such activities, and their implementation a n d responsibilities were assigned to 5 sub‐committees composed of staff members of the SD.
2.3 Computer-Assisted Personal Interview (CAPI) To improve data quality in data collection, The Tonga National Statistics Office (TNSO), in collaboration with the Statistics for Development Division (SDD) of the Pacific Community (SPC), embarked on a new venture to use CAPI technology in their data collection for the 2016 Population and Housing Census. One the biggest challenge in National Statistics Office is the collection of good quality data – data which is reliable and timely and the TNSO was one of the first countries in the Pacific region to use the technology in their Population Census. Through the recommendation and technical assistance of SDD, the World Bank Survey Solution application was used for the data collection which involves the use of 600 Android Tablets to be used by Interviewers for the data collections, and Supervisors and Headquarters in their monitoring and evaluation of the data collection. The Survey Solution software was identified as one of the best tool for data collection due to its capabilities of monitor data collection and data quality. Every completed questionnaire is sent to the respective supervisors to check and either rejects the questionnaire back to the interviewers if there are any errors/inconsistencies or approves the questionnaire if he/she is satisfied with the completed questionnaire. Rejected questionnaires are then verified and corrected by the interviewers with the respective household while they are still in the field, which ensures data quality is collected from the field by the interviewers. The use of the GPS in the tablets, together with the capturing the photo of each visited house ensures the interviewers are visiting their correct Enumeration Area (EA) as well as proof of visiting the house. With the GPS points, Supervisors

Tonga 2016 Census of Population and Housing
Tonga Statistics Department
250
and Headquarters staffs were able to plot these GPS points on the map and identify those interviewers who may have enumerated in a wrong EA or had overlapped to other EAs assigned to another interviewer. In summary, improved data quality is attained through correcting survey processes during the field operation. One of the biggest advantages of using Survey Solutions was the capability to allow for data collection to continue without internet access and this gives more flexibility for interviewers to undertake their work in areas without internet access and only synchronizes the completed questionnaires once they have access to the internet later. Digicel was the main service provider for the technology which includes tablets for the Pilot, 3G SIM Cards, DATA and other technical assistance in terms of APN (Access Point Network) and daily reports of data usage by the tablet users. There was only one island where the other service provider was used as Digicel coverage was not so efficient. The Questionnaire was designed using the Survey Solution Questionnaire Designer Tool, which has the facilities to include validations, consistency and logic checks as well as well-designed skip patterns to assist the interviewers in collecting good quality data. The use of CAPI involves massive planning, preparation, training and testing and this resulted in a number of trainings being undertaken by the staff of the TNSO with SDD in Questionnaire Design and the full process of using Survey Solution Tools. A listing was undertaken first, which was a good introduction to the technology as it was only for a few questions and the staff, together with about 50 project staff, were able to learn the different processes involved as well as get acquainted to the use of tablets for data collection. Following the listing, was the Pilot testing and then followed by the Training of Trainers (TOT) of about 100 persons who went through intensive training for two full weeks in the full processes of using tablets. Most of these training were mainly on practical work where they were trained to being an Interviewer, a Supervisor as well as being a Headquarter so they fully understand the different processes and responsibilities involved with these three components of Survey Solutions. After completion of the training, they were then dispatched to their respective areas to train their interviewers before the actual enumeration starts.
2.4 Administrative Framework
2.4.1 Government Approval The SD first sought the Minister of Finance’s approval to conduct this census. Once, this approval was received, the census proposal was prepared. The proposal was submitted to the Minister of Finance for endorsement to the Cabinet with the recommendation “That the Statistics Department conduct the Tonga Population Census and Housing on 30th November 2016(census date), and Ministry of Finance and National Planning assist with obtaining of necessary funding for the census be approved.”
2.4.2 National Census Steering Committee The National Census Steering Committee (NCSC) consisting of the Head of both Government and Non-Government Organization was started early 2016 to oversee the overall national census operation under the chairmanship of the Secretary for Finance with the Government Statistician (GS) as secretary. The census steering committee was a high level committee that approved and endorsed the plans and activities of the census. Policy issues that needed to be addressed were submitted to the steering committee for approval prior to the census team and sub‐committees designation of the activities necessary to address the tasks. In 2016 the Census Steering Committee members several times were called upon during the preparation period to discuss and approve of the plans of the Census 2016. These meetings were also opportunities for members to input their organization needs into census questionnaire.
Tonga 2016 Census of Population and Housing
Tonga Statistics Department
251
Members of the Steering Committee: Secretary of Finance (Chairperson) Director of Education (Vice-
chairperson),Government Statistician(secretary), Director of Health, Director of Agriculture, Secretary of Labour, Commerce and Industries, Director of Tonga Red Cross, Director of MEIDCC, Director of Family Health and Planning, Deputy Director Ministry of Internal Affairs – Disability and Social Protection, Director of Tonga Health,
United Nation Office, Ministry of Justice, Chamber of Commerce and Industries, Secretary for Lands, Survey & Natural Resources, Governor of the National Reserve Bank, Prime Minister Office Secretary General.
2.4.3 Organizational structure of the Census
In preparation for the 2016 Census a new form of organization structure of the Census was established and approved by the Government Statistician. A structure where all planning and tasks involved with preparation and conducting the Census was given to the Census Team that consisted of Statistics Staff from the SACA (Statistical Advise and Capacity Assistance Group).
A. National Census Steering Committee
The National Census Steering Committee is responsible for endorsing and approving the census plans and activities. (Refer to Section 1.4.2 National Census Steering Committee)
B. Government Statistician
In charge of approving the plans and activities of the census and bringing it forth to the Census Steering Committee and reporting to the Minister of Finance with regards to Census task.
C. Census Manager
The responsibilities of the Census Manager is most important for with it is the focal point of the Census activity as a whole. This task was assigned to Mr Winston Fainga’anuku. The job of the Census Manger was to plan and prepare for the Census operations and take lead doing so and monitoring the Census task beginning from preparation to dissemination phase. All methodologies and procedures are all his task. He also assigns the core activities to the rest of the census team not only is responsible to inform the Government Statistician and the Census Steering Committee.
D. Census Team
A taskforce lead by the Census Manager and 4 other staff members. Census operations were divided into five tasks based on the core activities and one task was assigned to each member of the team to be responsible for. This included Mapping, Publicity, Training, Fieldwork and Data Processing.
i) Mapping Personnel
The Census Manager was responsible for mapping task because he was with most knowledge and expertise about the enumeration boundaries. Updating and digitizing of new Enumeration Blocks was under the responsibility of the mapping personnel, and ensuring that all settlements are assigned to a specific block.
ii) Publicity Personnel
This task involved looking after all publicity programs and actions for awareness done with regards to Census. The officer in charge was responsible for scheduling TV programs and advertisements, designing roadside banners and putting them up, informative text messages through Ucall Company, printed t-shirts and umbrellas for the Census staff.

Tonga 2016 Census of Population and Housing
Tonga Statistics Department
252
iii) Training Personnel
Responsibilities of this officer was to arrangements of venues, list of participants, arranging catering, purchase and prepare materials for the training period and all other activities directly linked to before and during Census Training of Trainers and Training of Supervisors and Enumerators.
iv) Fieldwork Personnel
Responsible for monitoring of fieldwork, preparation distributing and collecting of materials and field equipment such as tablets, bags, questionnaire manual and umbrella, arranging transportation and other task with regards to the enumeration period.
v) Data Processing Personnel
Data processing procedures were quite different this round of census as CAPI and tablets were being used. However the census manager was in charge of the area monitoring the system to ensure the data is quality assured, also responsible for data cleaning with the assistance of SPC. vi) Financial Personnel
The officer responsible for all financial expenses, aligning according to census budget and keeping records of all expenses. Also coordinates with SD account division.
vii) IT Technical Personnel Responsible for registering of tablets and its setup and installation of the survey solutions designer and interviewer, testing of the tablet's status and internet coverage, preparing technical equipment need for the TOT and Training of enumerations, address the main technical support for IT technical needs arise during fieldwork, and maintance of the electronic equipments.
2.4.4 The Mapping
The task of the Mapping Personnel was to ensure that good quality maps were produced. The objective was to ensure that the maps provided complete coverage of the country, and designed to accommodate a reasonable workload of one census enumerator per census block. Updates were made after Census 2011 and before Census 2016. Census Block boundaries were re‐ designed by merging or splitting existing census blocks to achieve an average of 50 households per census block. Various updates within the census block maps were made. These included the drawing new block boundaries, roads and other landmarks to ensure that current and accurate information was provided to the enumerators. Reliable maps, both for enumerators and supervisors are necessary ingredients to assist in avoiding any under or over – counting during enumeration. Included in the package of maps was: PCmap1 which indicated where the census block was located; PCmap 2 indicating details about the boundaries of the census blocks, along with the numbers of the households within the block; and a list of the head of each household on the map.
2.4.5 Pre‐listing of Households
The purpose of the pre‐listing of households for this population census is to establish a firm framework in which the rest of the Enumeration can be undertaken. It is a most important part of the population census and it is essential that this part be done as carefully as the rest of the census enumeration. A pre‐listing carefully done before the census prevents later errors and confusion and makes the later stages of the enumeration easier. During the pre-listing the tablets system was being used to enumerate the whole population for the first time.

Tonga 2016 Census of Population and Housing
Tonga Statistics Department
253
The Household is the major grouping unit used in this census. It is composed of the other major units of enumeration, the Individual. What, then, is a Household? It is defined here as “Those persons who usually eat together and share the work of preparing the food and/or the cost or work of providing it.” Normally household members also live and sleep in the same building but experience has shown that this is not always so , which is why the definition is based on eating together rather than on living or sleeping in the same building. As an example, take a family consisting of a father, mother, and teenage unmarried son, an adult married son and his wife and two small daughters. If they share eating arrangements they should be enumerated as one household. This would remain true even if the father works as a night watchman and does not sleep at home six nights a week, or if the teenage son often spends the night away who knows where. It also remains true if, for instance, on census night the men in the household spend the night fishing and stay on a small island offshore in a temporary shelter and return home next morning. If the adult son, his wife and two small daughters live in another house and maintain their own eating arrangements they are a separate household ‐ even if the houses are adjacent and the two families are on the closest possible terms. If the adult married son and his family live in another house but normally eat with the parents and the rest of the family, they remain one household. A household may be found in a variety of forms. It may spread over more than one building. Members of a family may sleep in two or even more buildings but share one place to cook and eat. They should be enumerated as one Household. Two or more households can be found in one building. Two or more families who share the same building but who do not normally prepare food and eat together should be enumerated as two households, e.g. blocks of flats or servants who have their own quarters. Households may be found in buildings intended primarily for other purposes. A family may live in the back of their shop for instance. Boats tied up to a dock or even pulled up on shore may be permanently lived in and be counted as Households. Enumerators should look out for such dwellings and enumerate their occupants as a household if they meet the definition. In doubtful cases, instead of grouping people into one Household who should perhaps be separated, it is better to use two households.
Some households will be based in Institutions such as hotels, dormitories, prisons or military institutions. An Institution, for census purposes may be defined as an organisation providing specified services or performing some general function for a group of residents or inmates who will normally be unrelated to each other. In listing households for these Institutions the common eating arrangement still applies, so that it is possible, for instance, that more than one household will occur in the grounds of one Institution. Where a group of unrelated, institution‐based persons have common eating arrangements, they should be treated as one Household and the Head of Household identified as the one who has administrative responsibility, supervises or, by common consent, seems to have some leadership authority.
2.4.6 The Publicity
The publicity personnel responsibility was to ensure that the general public understood the benefits of the census, why each person was required to take part and to know how, when and what they needed to do to take part. The task of striving to obtain an understanding and the cooperation of every individual in the country through effective use of publicity was of great importance for the quality of responses required by the Census. To achieve t h i s , the public ity s u b ‐committee established a publicity framework. This included the use of TV, radio programs, newspaper, IDs, and Census banners. TV and radio programs were first presented by the GS, Chairperson of the NCSC and Census Manager on the 2nd week of August, 2016, and then ran every week before and during the census collection period. They were

Tonga 2016 Census of Population and Housing
Tonga Statistics Department
254
used to inform the general public about the progress and the need for cooperation on the census. During the last two weeks just prior to the enumeration, these programs were used to brief the people of Tonga about the nature of the questions that they would be asked. There were also radio talkback programs were the public had the opportunity to query and comment on the census.
Banners were used to display the Census slogan, ‘Remember to be counted’, and the dates of enumeration period and census night. Similarly, T‐shirts a n d u m b r e l l a s were printed with a similar content as the banners to promote awareness about the Census. Radio programs directed specifically towards the teachers were also used for publicity to assist in informing teachers who were involved in training and other programs.
2.4.7 The Training
The activities of the training began with the various preparations including combining and printing manuals – enumerators ‘and supervisors’ questionnaire manual, prior arrangements of venues and catering for the training and not the least preparation of training materials. The activities were led by the training personnel. The structure and implementation of the training program was managed mainly by the census manager and the training personnel. This was to ensure that the training program is addressing a particular area of work included adequate reference to other related areas since there was substantial interaction among the different areas of work. Two weeks training of census trainers was conducted during the first and second week of October 2016, and then
followed by two weeks training sessions of all census supervisors and enumerators throughout the Kingdom.
The training sessions were divided into 8-9 days sessions in each training centre. During the training, teachers
were given tablets taught step by step on operating the device and thorough explanation of the questionnaire by
modules to ensure they understand the definition and target of each question. To test their knowledge teachers were
given scenarios to use to complete the questionnaire, also they were asked to enumerate 2 or more households and
synchronize. This enabled them to see how the tablet system operates and to discuss in groups the errors and
queries that aroused especially with the questionnaire.
In Tongatapu there were 7 enumerators and supervisors training centres and 1 each in for Vava’u, Ha’pai, ‘Eua, and
Ongo Niua all located across the primary schools.
Training sessions for the outer islands were conducted close to the enumeration period, when training officers moved from the main islands with all necessary materials for training and enumerations. This was to minimize traveling expenses, since officers from SD spent about 6 – 8 weeks in the islands carrying out training and enumeration activities.
2.4.8 Fieldwork
The hierarchical structure of the tablet system was of clear defined levels and one which ensured that all was cooperating also enabled the SD office to monitor the work of the enumerators and supervisors during the period. Issues that aroused were dealt with according to the hierarchy. The highest level of the hierarchy was the Headquarter which were the officer who did the final approval of the questionnaire form. Second level of the hierarchy is the Supervisors which was the senior officers and teachers who were responsible for the first hand detail checking of the questionnaire forms send to them by the enumerators. The bottom rank was the enumerators who were responsible for enumerating and sending the forms to the supervisors for checking and from there to the headquarters.

Tonga 2016 Census of Population and Housing
Tonga Statistics Department
255
The enumerators were divided into groups in according to the location of the block they were to enumerate. Each group consist an average of 6 enumerators who were to report to 1 supervisor. Each supervisor was to report to headquarter and headquarters was responsible for an average of 2 supervisors and respective teams. Every enumerator was assigned 1 census block to enumerate in time using the tablets that was distributed to them during the training period. The selection of Enumerators and Supervisors was made from primary school teachers. Where possible, the teacher who resided or close to a particular census block was the enumerator of that block. This was an additional asset due to the local knowledge of the teacher about the census block boundaries and its residents. The enumeration procedures were publicly announced on the first day of the enumeration, the 28th of November, noting that the responsible enumerator should visit all households. This first visit was to update the household listings. The enumerator and the head of the household were to arrange a mutually convenient time for enumeration to take place during the enumeration period, from the 28th of November to the 16th of December 2016. This was to ensure that the enumerator m i n i m i z e d repeated visits to the households and that the households would be prepared and available to spend enough time to answer the questions. In addition, if a household was not visited, then one of the household members was asked to contact the SD so that it could ensure that the responsible enumerator followed up. On the other hand, if a household was visited more than once within this period, then, the household should contact the SD for clarification and to prevent over counting by having a household enumerated twice. A direct toll-free telephone line was established in the head office for teachers to call for clarification on any problem encountered during this process. A CUG (Closed User Group) was set for all tablets to enable the enumerators and supervisors to communicate freely with regards to fieldwork queries. The census team worked cooperatively to distribute the tablets and other materials such as questionnaire manual, bags, umbrella and t-shirts during the training period for practicing and to use when the enumeration period began. At the end of the enumeration period the supervisors were advised to collect all tablets and accessories of their respective groups and hand in to the SD office to census team who were checking and collecting them.
2.4.9 Data Processing
Data processing was composed of different phases which include; error checking and correction through CAPI system, data cleaning and editing, and tabulation. The most distinct advantage of using CAPI (Computer-Assisted Personal Interviewing) with tablets was shown in the data processing phases. The systematic structure of the operations of the tablet system enabled the data processing to be done simultaneously with the fieldwork during the enumeration period. Application software called Survey Solution (privileged by World Bank) was installed into the tablets to enable the enumerators to view, receive and send the questionnaire forms. Prior to that, the questionnaire was designed and uploaded to the system. Validation sequences and quality checks were implemented into the electronic questionnaire to ensure that quality and accurate data was achieved.

Tonga 2016 Census of Population and Housing
Tonga Statistics Department
256
The diagram below shows the hierarchical system of the tablets and CAPI functioned.
The hierarchical system of the tablets was structure into 3 levels – Headquarter, Supervisor and Enumerator each with clear defined roles in the data collection and data processing procedures. The enumerators were the first hand workers in the field who were responsible for collecting and inputting the questionnaire electronically. The Supervisors were doing the detailed error checking and then headquarters be the last to do quality examination of the questionnaire. If there were errors in completing the questions the form would be electronically send back from the Supervisor or Headquarter to the enumerator to correct while in the field. The system lessen the time and cost of the data processing phase. CAPI enabled the data to be digitalized and Survey solution enabled monitoring at the same time during the fieldwork. Electronic data was downloaded from the system immediately after the enumeration was done. The preliminary result was released at the beginning of the 2017. Data editing and cleaning was collaborate with the assistance of SPC.
2.4.10 Post – Enumeration Survey (PES)
For the post‐enumeration survey (PES) 7 census blocks were selected: 4 blocks from seven districts in Tongatapu, and 1 block from each Ha’apai and Vava’u respectively and 1 from ‘Eua. The PES count in some areas recorded slightly less and some more people than counted in the actual census enumeration. While the discrepancy in population numbers of the PES compared to the census enumeration could be explained by most likely explanation is the highly mobility (emigration) of the Tongan population during period of the census and PES count.
Headquarter
Supervisor
Enumerator
Tonga 2016 Census of Population and Housing
Tonga Statistics Department
257