Embed Size (px)
Citation preview
WHY TRANSIT-ORIENTED DEVELOPMENT AND WHY NOW?
Reconnecting America andthe Center for Transit-Oriented Development
ON THE COVER:Solana Beach, CA, station Rob Quigley Architects
Reconnecting AmericaAll rights reserved under International andPan-American Copyright Conventions.No part of this book may be reproduced in any form or by any means without permission in writing from Reconnecting America,436 14th St., Suite 1005, Oakland, CA 94612
1
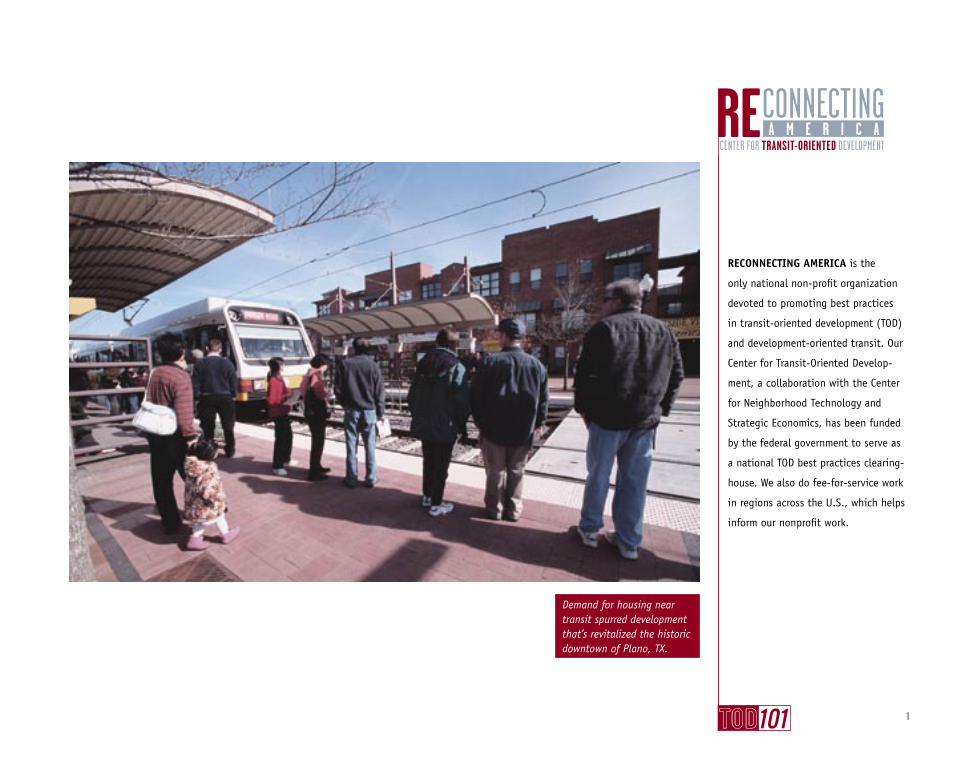
RECONNECTING AMERICA is the
only national non-profit organization
devoted to promoting best practices
in transit-oriented development (TOD)
and development-oriented transit. Our
Center for Transit-Oriented Develop-
ment, a collaboration with the Center
for Neighborhood Technology and
Strategic Economics, has been funded
by the federal government to serve as
a national TOD best practices clearing-
house. We also do fee-for-service work
in regions across the U.S., which helps
inform our nonprofit work.
1
Demand for housing near transit spurred development that’s revitalized the historic downtown of Plano, TX.
CENTER FOR TRANSIT-ORIENTED DEVELOPMENT
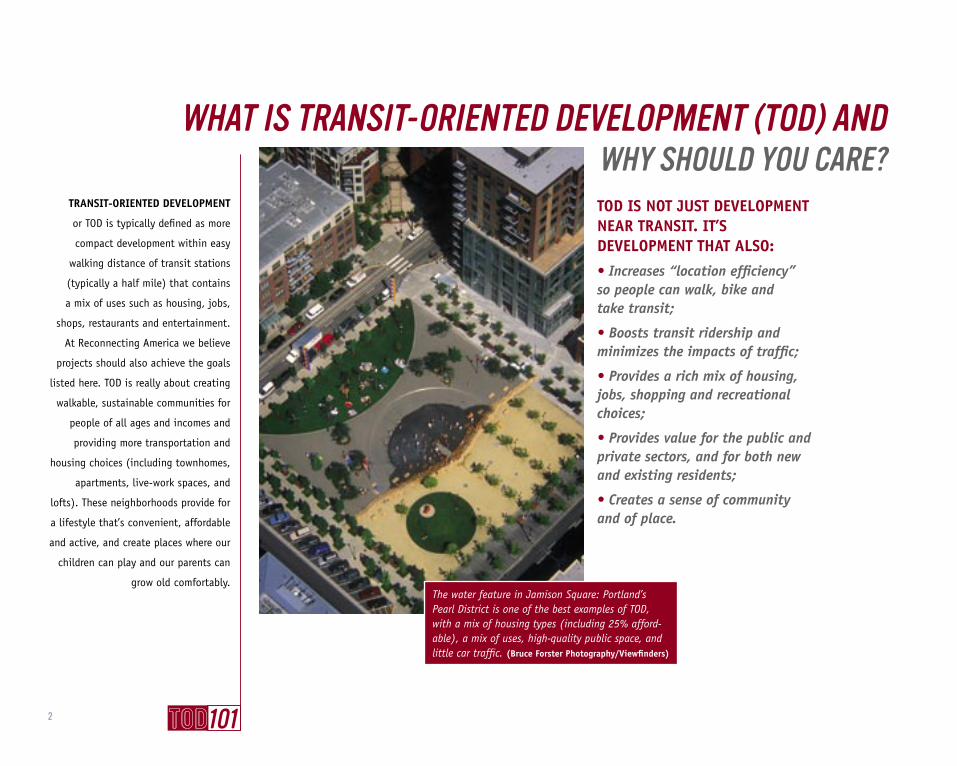
TRANSIT-ORIENTED DEVELOPMENT
or TOD is typically defined as more
compact development within easy
walking distance of transit stations
(typically a half mile) that contains
a mix of uses such as housing, jobs,
shops, restaurants and entertainment.
At Reconnecting America we believe
projects should also achieve the goals
listed here. TOD is really about creating
walkable, sustainable communities for
people of all ages and incomes and
providing more transportation and
housing choices (including townhomes,
apartments, live-work spaces, and
lofts). These neighborhoods provide for
a lifestyle that’s convenient, affordable
and active, and create places where our
children can play and our parents can
grow old comfortably.
TOD IS NOT JUST DEVELOPMENT NEAR TRANSIT. IT’S DEVELOPMENT THAT ALSO:
• Increases “location efficiency” so people can walk, bike and take transit;
• Boosts transit ridership and minimizes the impacts of traffic;
• Provides a rich mix of housing, jobs, shopping and recreational choices;
• Provides value for the public and private sectors, and for both new and existing residents;
• Creates a sense of community and of place.
WHAT IS TRANSIT-ORIENTED DEVELOPMENT (TOD) ANDWHY SHOULD YOU CARE?
The water feature in Jamison Square: Portland’s Pearl District is one of the best examples of TOD, with a mix of housing types (including 25% afford-able), a mix of uses, high-quality public space, and little car traffic. (Bruce Forster Photography/Viewfinders)
2

3
AFTER DECADES OF out-migration to
the suburbs many people are return-
ing to the city to live, in part because
traffic is so bad that commuting has
become less and less appealing. But
the changing housing market has much
to do with demographics: While the
vast majority of U.S. households used
to be families with both a mom and
dad and more than one child living in
the same household, this demographic
group now comprises just 25 percent
of households and it’s shrinking. More
and more households are childless or
headed by single parents, and single
adults comprise 41 percent of house-
holds. The demographic groups that are
increasing in size – smaller, older, and
more ethnically diverse – are the same
demographic groups that have histori-
cally shown a preference for higher-
density housing near transit.
BECAUSE CHANGING DEMOGRAPHICS ARE CAUSING FUNDAMENTAL SHIFTS IN THE HOUSING MARKET:
• Singles will soon be the new majority in the U.S.
• Older Americans will outnumber younger Americans by mid-century;
• By 2010 Echo Boomers (the children of Baby Boomers) will total 34% of the population;
• Almost half the U.S. population will be non-white by 2050;
• The demographic groups growing most quickly — older, non-family, non-white households – have historically used transitin higher numbers.
WHY BUILD TRANSIT AND TOD NOW?
Baby boomers. Echo boomers. American households are older, smaller and more diverse, and they want more housing and transportation choices.
4
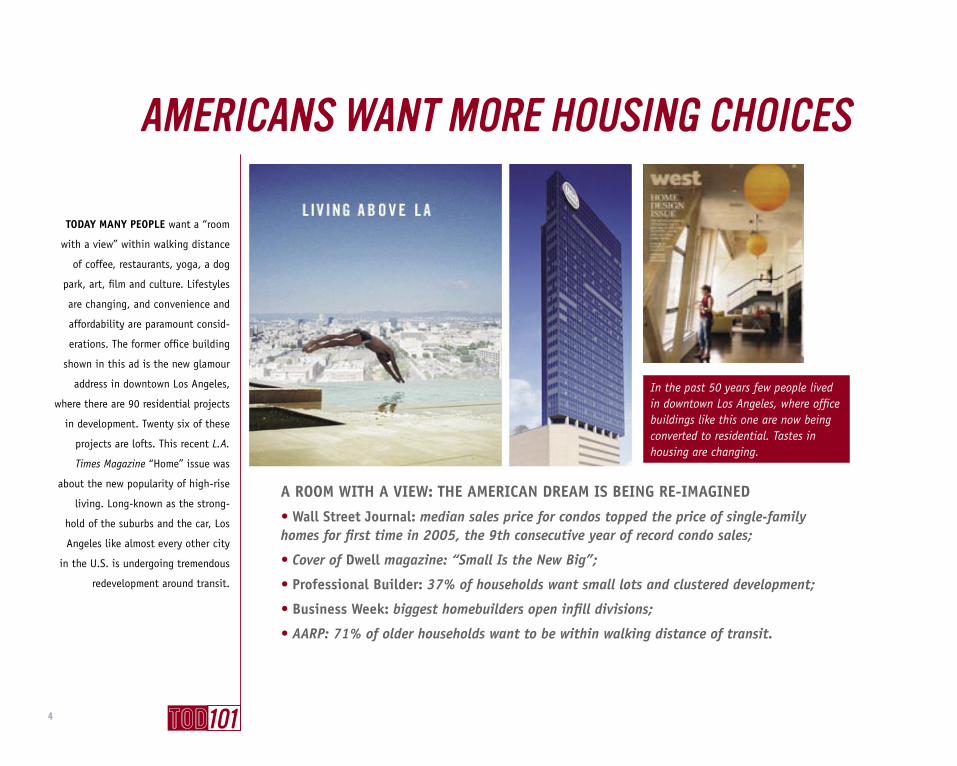
A ROOM WITH A VIEW: THE AMERICAN DREAM IS BEING RE-IMAGINED
• Wall Street Journal: median sales price for condos topped the price of single-family homes for first time in 2005, the 9th consecutive year of record condo sales;
• Cover of Dwell magazine: “Small Is the New Big”;
• Professional Builder: 37% of households want small lots and clustered development;
• Business Week: biggest homebuilders open infill divisions;
• AARP: 71% of older households want to be within walking distance of transit.
TODAY MANY PEOPLE want a “room
with a view” within walking distance
of coffee, restaurants, yoga, a dog
park, art, film and culture. Lifestyles
are changing, and convenience and
affordability are paramount consid-
erations. The former office building
shown in this ad is the new glamour
address in downtown Los Angeles,
where there are 90 residential projects
in development. Twenty six of these
projects are lofts. This recent L.A.
Times Magazine “Home” issue was
about the new popularity of high-rise
living. Long-known as the strong-
hold of the suburbs and the car, Los
Angeles like almost every other city
in the U.S. is undergoing tremendous
redevelopment around transit.
AMERICANS WANT MORE HOUSING CHOICES
In the past 50 years few people lived in downtown Los Angeles, where office buildings like this one are now being converted to residential. Tastes in housing are changing.
5
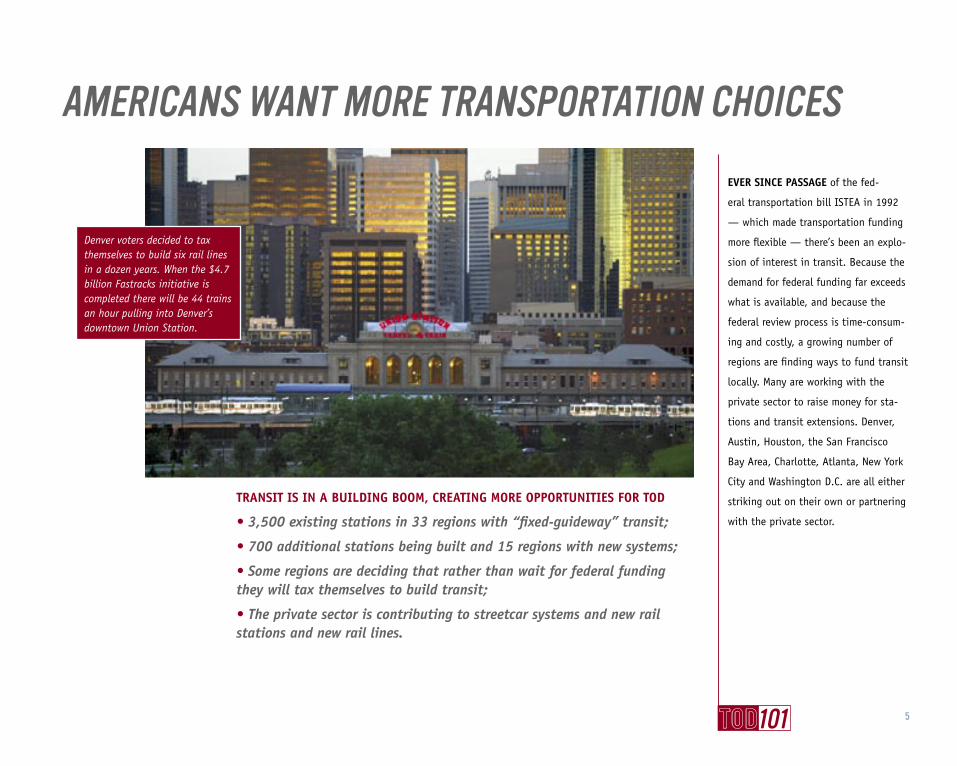
EVER SINCE PASSAGE of the fed-
eral transportation bill ISTEA in 1992
— which made transportation funding
more flexible — there’s been an explo-
sion of interest in transit. Because the
demand for federal funding far exceeds
what is available, and because the
federal review process is time-consum-
ing and costly, a growing number of
regions are finding ways to fund transit
locally. Many are working with the
private sector to raise money for sta-
tions and transit extensions. Denver,
Austin, Houston, the San Francisco
Bay Area, Charlotte, Atlanta, New York
City and Washington D.C. are all either
striking out on their own or partnering
with the private sector.
AMERICANS WANT MORE TRANSPORTATION CHOICES
Denver voters decided to tax themselves to build six rail lines in a dozen years. When the $4.7 billion Fastracks initiative is completed there will be 44 trains an hour pulling into Denver’s downtown Union Station.
TRANSIT IS IN A BUILDING BOOM, CREATING MORE OPPORTUNITIES FOR TOD
• 3,500 existing stations in 33 regions with “fixed-guideway” transit;
• 700 additional stations being built and 15 regions with new systems;
• Some regions are deciding that rather than wait for federal funding they will tax themselves to build transit;
• The private sector is contributing to streetcar systems and new rail stations and new rail lines.
6
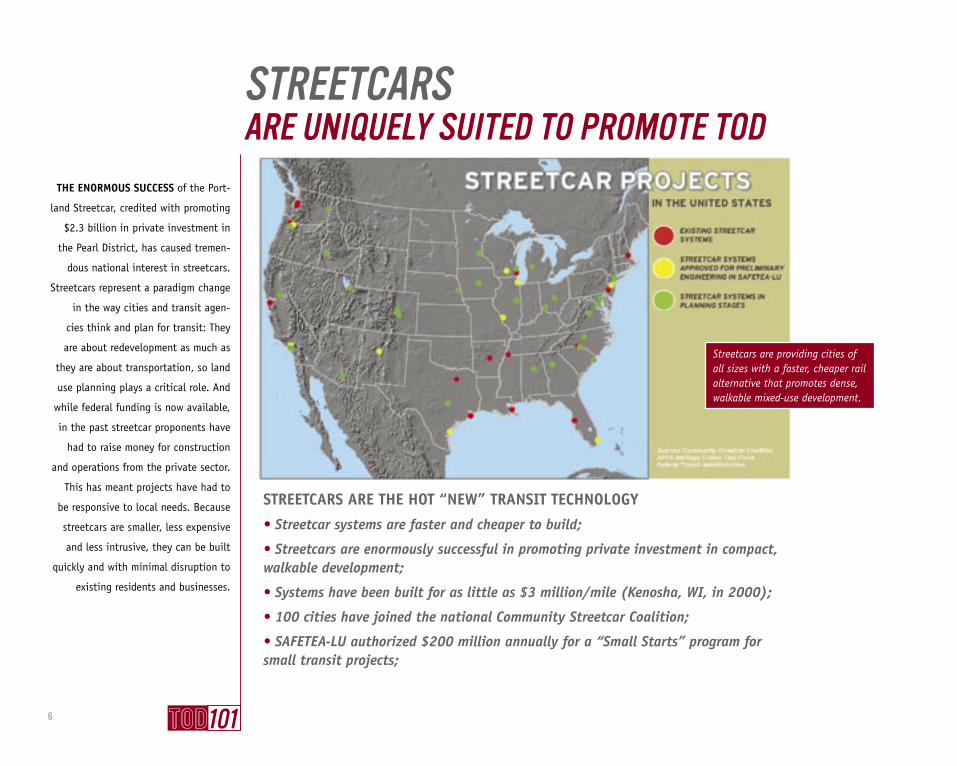
STREETCARS ARE THE HOT “NEW” TRANSIT TECHNOLOGY
• Streetcar systems are faster and cheaper to build;
• Streetcars are enormously successful in promoting private investment in compact, walkable development;
• Systems have been built for as little as $3 million/mile (Kenosha, WI, in 2000);
• 100 cities have joined the national Community Streetcar Coalition;
• SAFETEA-LU authorized $200 million annually for a “Small Starts” program for small transit projects;
THE ENORMOUS SUCCESS of the Port-
land Streetcar, credited with promoting
$2.3 billion in private investment in
the Pearl District, has caused tremen-
dous national interest in streetcars.
Streetcars represent a paradigm change
in the way cities and transit agen-
cies think and plan for transit: They
are about redevelopment as much as
they are about transportation, so land
use planning plays a critical role. And
while federal funding is now available,
in the past streetcar proponents have
had to raise money for construction
and operations from the private sector.
This has meant projects have had to
be responsive to local needs. Because
streetcars are smaller, less expensive
and less intrusive, they can be built
quickly and with minimal disruption to
existing residents and businesses.
STREETCARSARE UNIQUELY SUITED TO PROMOTE TOD
Streetcars are providing cities of all sizes with a faster, cheaper rail alternative that promotes dense, walkable mixed-use development.
7
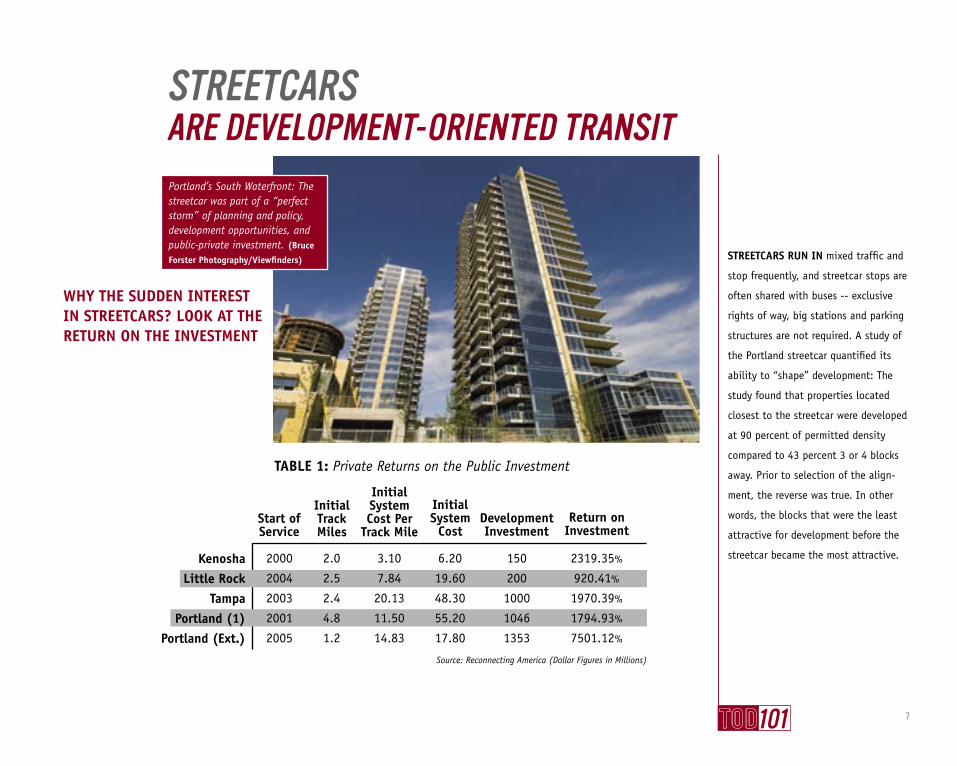
WHY THE SUDDEN INTEREST IN STREETCARS? LOOK AT THE RETURN ON THE INVESTMENT
STREETCARS RUN IN mixed traffic and
stop frequently, and streetcar stops are
often shared with buses -- exclusive
rights of way, big stations and parking
structures are not required. A study of
the Portland streetcar quantified its
ability to “shape” development: The
study found that properties located
closest to the streetcar were developed
at 90 percent of permitted density
compared to 43 percent 3 or 4 blocks
away. Prior to selection of the align-
ment, the reverse was true. In other
words, the blocks that were the least
attractive for development before the
streetcar became the most attractive.
Start ofService
KenoshaLittle Rock
TampaPortland (1)
Portland (Ext.)
2000
2004
2003
2001
2005
2.0
2.5
2.4
4.8
1.2
3.10
7.84
20.13
11.50
14.83
6.20
19.60
48.30
55.20
17.80
150
200
1000
1046
1353
Development Investment
2319.35%
920.41%
1970.39%
1794.93%
7501.12%
Return onInvestment
Initial TrackMiles
Initial System Cost Per
Track Mile
Initial System
Cost
TABLE 1: Private Returns on the Public Investment
Source: Reconnecting America (Dollar Figures in Millions)
STREETCARSARE DEVELOPMENT-ORIENTED TRANSITPortland’s South Waterfront: The streetcar was part of a “perfect storm” of planning and policy, development opportunities, and public-private investment. (Bruce
Forster Photography/Viewfinders)

8
OUR NATIONAL TOD market study
found that by 2030 almost a quarter
of all U.S. households looking to rent
or to buy are likely to want higher-
density housing near transit. To meet
this demand we’d have to build 2,000
units of housing at every one of the
4,000 existing and planned transit
stations in the U.S. Most of demand
will be in the five metro regions with
the biggest systems – when it come to
transit systems, size matters.
ALMOST A QUARTER OF ALL RENTERS AND BUYERS ARE LIKELY TO WANT TOD HOUSING IN 2030
Most demand for higher-density housing near transit will be in the regions with the biggest systems.
Source: Reconnecting America
ExistingStations
New YorkLos Angeles
ChicagoSan FranciscoPhiladelphia
BostonWashington, D.C.
PortlandMiamiDallas
955
113
401
286
370
288
127
108
60
48
6
38
8
49
34
7
11
29
6
17
2,876,160
261,316
787,204
409,497
506,058
396,261
234,202
72,410
62,595
46,429
5,371,866
1,708,447
1,503,638
832,418
809,058
750,726
688,582
279,891
271,326
270,676
87%
554%
91%
103%
60%
89%
194%
287%
333%
483%
PlannedStations
2000 TOD Households
TABLE 2: Top Ten Regions by Potential Demand for TOD Housing
2030 Demand
Percentage Change
Four Transit Systems Shown at the Same Geographic Scale
9
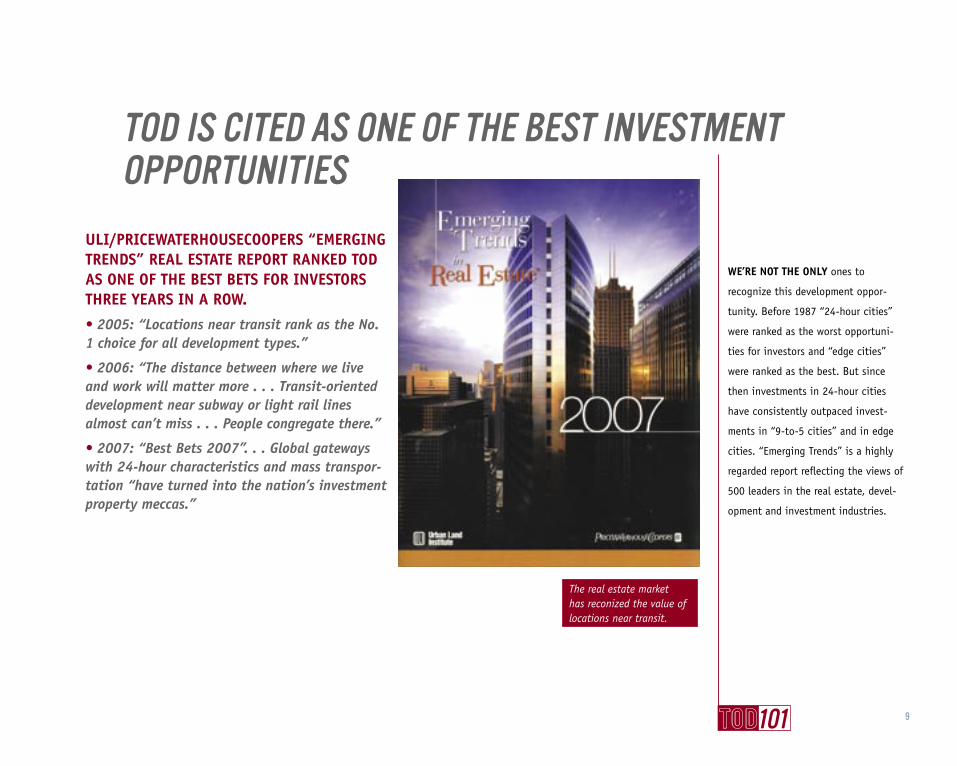
ULI/PRICEWATERHOUSECOOPERS “EMERGING TRENDS” REAL ESTATE REPORT RANKED TOD AS ONE OF THE BEST BETS FOR INVESTORS THREE YEARS IN A ROW.
• 2005: “Locations near transit rank as the No. 1 choice for all development types.”
• 2006: “The distance between where we live and work will matter more . . . Transit-oriented development near subway or light rail lines almost can’t miss . . . People congregate there.”
• 2007: “Best Bets 2007”. . . Global gateways with 24-hour characteristics and mass transpor-tation “have turned into the nation’s investment property meccas.”
WE’RE NOT THE ONLY ones to
recognize this development oppor-
tunity. Before 1987 “24-hour cities”
were ranked as the worst opportuni-
ties for investors and “edge cities”
were ranked as the best. But since
then investments in 24-hour cities
have consistently outpaced invest-
ments in “9-to-5 cities” and in edge
cities. “Emerging Trends” is a highly
regarded report reflecting the views of
500 leaders in the real estate, devel-
opment and investment industries.
The real estate market has reconized the value of locations near transit.
TOD IS CITED AS ONE OF THE BEST INVESTMENT OPPORTUNITIES

10
THERE ARE INDICATORS TO SUGGEST THE BALANCE WILL SHIFT TO REINVESTMENT AND REDEVELOPMENT:
• Higher gas and oil prices;
• Infill can be very lucrative and financing is getting easier;
• Capital for infrastructure is tight and getting tighter;
• Fees for greenfield development are high — $100,000 per house in Orange County, CA;
• Major homebuilders and big box retailers are developing infill models.
MOST DEVELOPMENT IS STILL
happening in the suburbs. But there
are reasons to believe the balance
could shift and that we will need to
redevelop our urban and suburban
centers to accommodate more
growth. Without transit, neighbor-
hoods will be overrun with traffic.
WE ARE SPRAWLING AND REINVESTING SIMULTANEOUSLY
The shift in the housing market is the most signifi-cant since the march to the suburbs began after WWII.
• TOD is more sustainable
• More efficient use of land, energy and resources
• Helps conserve open space
• Less oil and gas consumption
• Cleaner air
• Minimizes traffic increases
• Encourages walking
• Increases revenues, allowing cities to lower tax rates and compete with suburbs
• Increases transit ridership at a lower cost than if bus service or parking structures are needed to bring riders to stations
• Increases property values, lease revenues and rents
• Increases foot traffic for local businesses
• Creates opportunity to build mixed-income housing
• Height and density can pay for community benefits and affordability
• Reduces transportation expenditures
• Promotes healthier lifestyles
• Neighborhoods are safer because there are more people on the street and more “eyes on the street.”
11
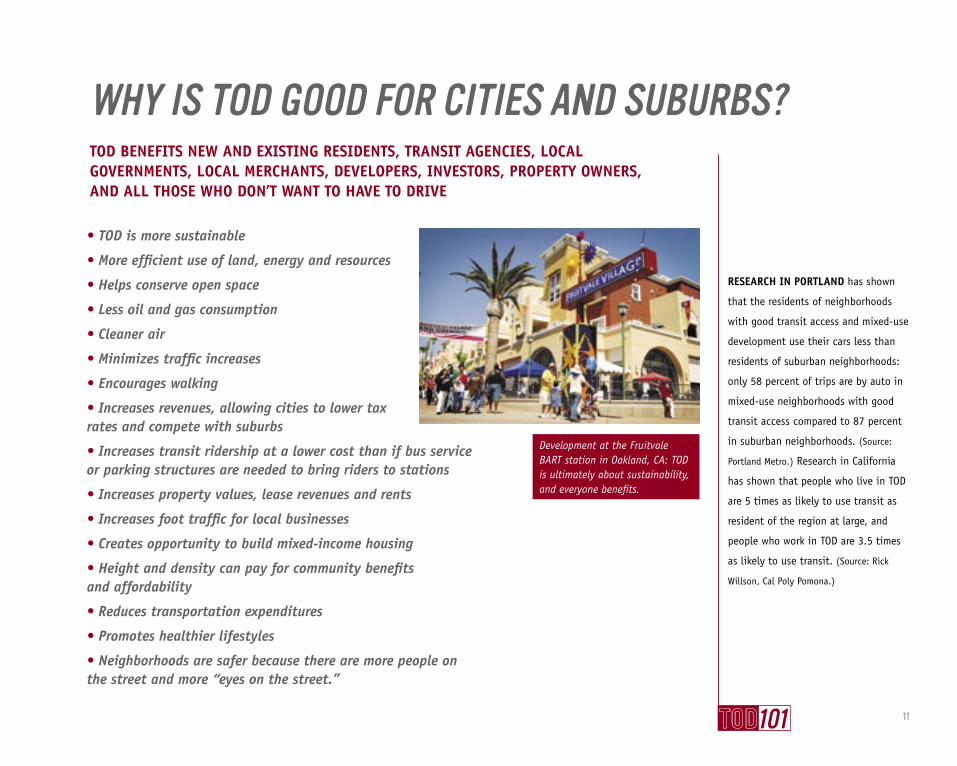
TOD BENEFITS NEW AND EXISTING RESIDENTS, TRANSIT AGENCIES, LOCAL GOVERNMENTS, LOCAL MERCHANTS, DEVELOPERS, INVESTORS, PROPERTY OWNERS, AND ALL THOSE WHO DON’T WANT TO HAVE TO DRIVE
Development at the Fruitvale BART station in Oakland, CA: TOD is ultimately about sustainability, and everyone benefits.
WHY IS TOD GOOD FOR CITIES AND SUBURBS?
RESEARCH IN PORTLAND has shown
that the residents of neighborhoods
with good transit access and mixed-use
development use their cars less than
residents of suburban neighborhoods:
only 58 percent of trips are by auto in
mixed-use neighborhoods with good
transit access compared to 87 percent
in suburban neighborhoods. (Source:
Portland Metro.) Research in California
has shown that people who live in TOD
are 5 times as likely to use transit as
resident of the region at large, and
people who work in TOD are 3.5 times
as likely to use transit. (Source: Rick
Willson, Cal Poly Pomona.)
12
TRIED AND TRUE VALUE CAPTURE STRATEGIES INCLUDE:
• Property and sales taxes
• Real estate lease and sales revenues
• Farebox revenues
• Fees on everything from parking to business licenses
• Joint development
• Tax increment financing
• Special assessment districts
• Public-private partnerships
TOD CONCENTRATES development
and activity and the tax base in a
way that allows for focused value
capture strategies. This captured
value can be reinvested in communi-
ties and in the region, and in creat-
ing and preserving affordability.
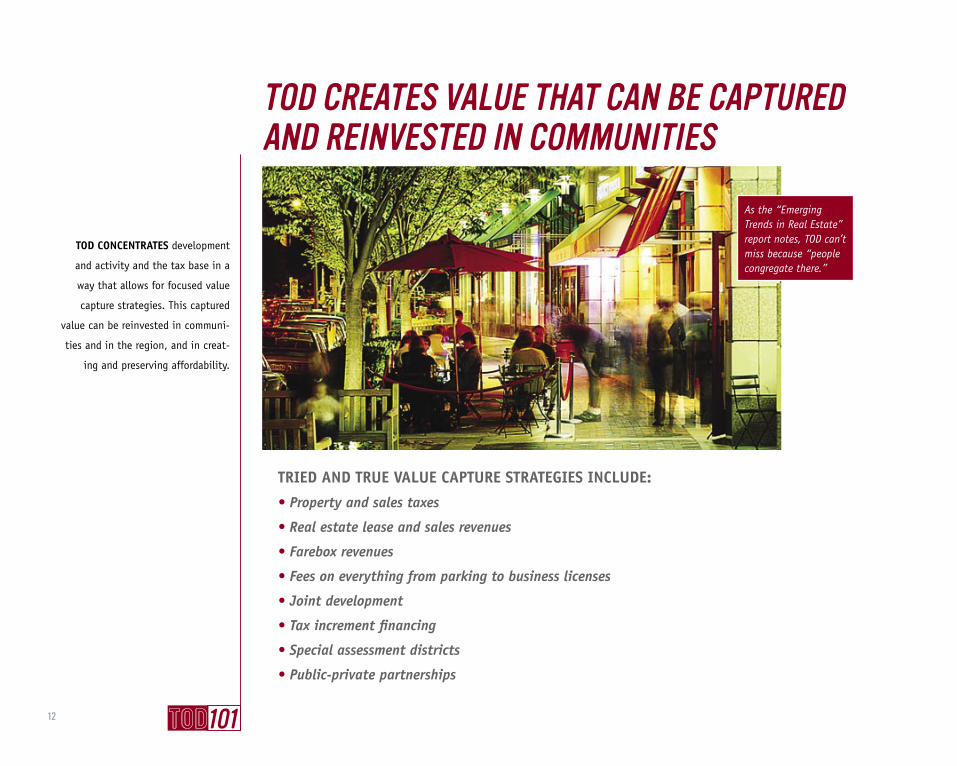
TOD CREATES VALUE THAT CAN BE CAPTURED AND REINVESTED IN COMMUNITIES
As the “Emerging Trends in Real Estate” report notes, TOD can’t miss because “people congregate there.”
13
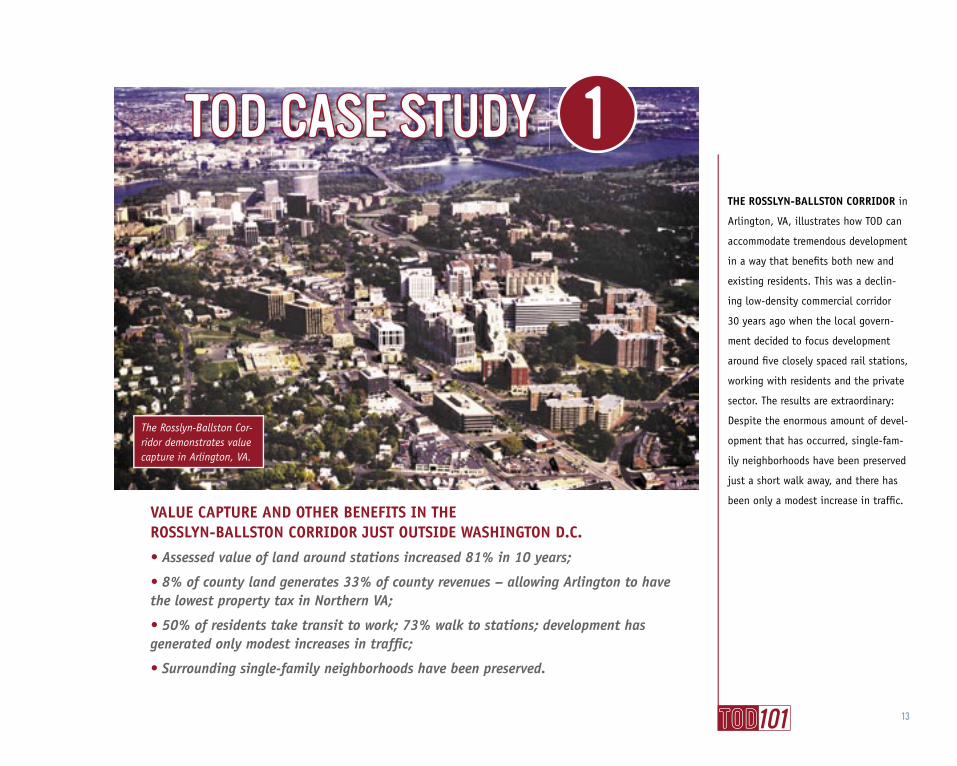
VALUE CAPTURE AND OTHER BENEFITS IN THEROSSLYN-BALLSTON CORRIDOR JUST OUTSIDE WASHINGTON D.C.
• Assessed value of land around stations increased 81% in 10 years;
• 8% of county land generates 33% of county revenues – allowing Arlington to have the lowest property tax in Northern VA;
• 50% of residents take transit to work; 73% walk to stations; development has generated only modest increases in traffi c;
• Surrounding single-family neighborhoods have been preserved.
THE ROSSLYN-BALLSTON CORRIDOR in
Arlington, VA, illustrates how TOD can
accommodate tremendous development
in a way that benefi ts both new and
existing residents. This was a declin-
ing low-density commercial corridor
30 years ago when the local govern-
ment decided to focus development
around fi ve closely spaced rail stations,
working with residents and the private
sector. The results are extraordinary:
Despite the enormous amount of devel-
opment that has occurred, single-fam-
ily neighborhoods have been preserved
just a short walk away, and there has
been only a modest increase in traffi c.
TOD CASE STUDY 1
The Rosslyn-Ballston Cor-ridor demonstrates value capture in Arlington, VA.
14
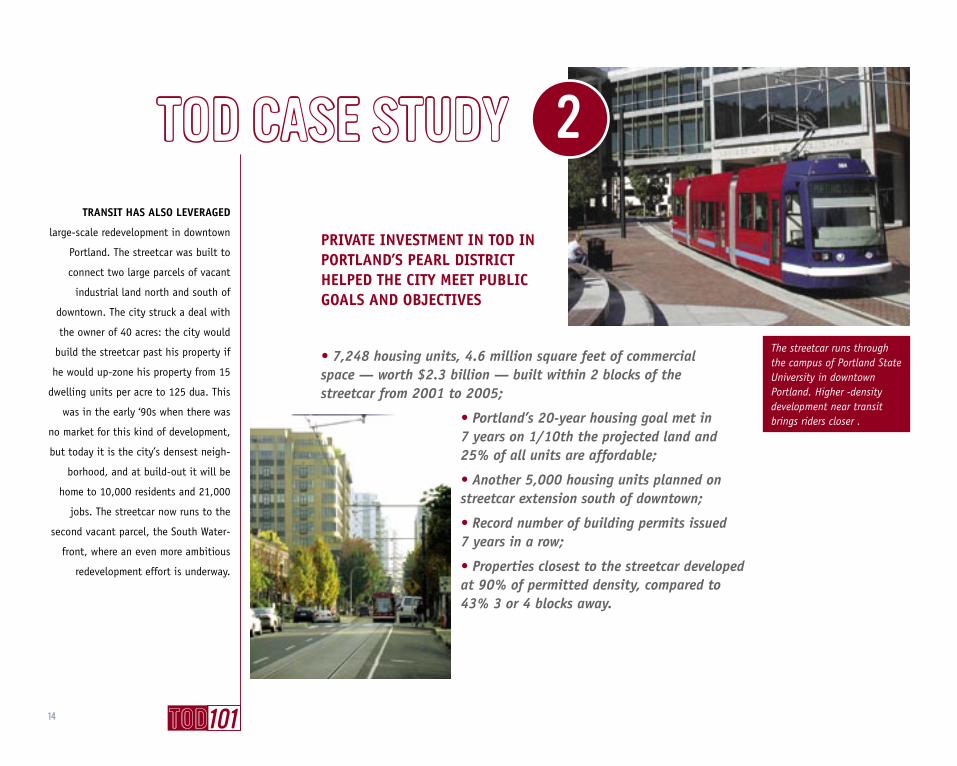
PRIVATE INVESTMENT IN TOD IN PORTLAND’S PEARL DISTRICT HELPED THE CITY MEET PUBLIC GOALS AND OBJECTIVES
TRANSIT HAS ALSO LEVERAGED
large-scale redevelopment in downtown
Portland. The streetcar was built to
connect two large parcels of vacant
industrial land north and south of
downtown. The city struck a deal with
the owner of 40 acres: the city would
build the streetcar past his property if
he would up-zone his property from 15
dwelling units per acre to 125 dua. This
was in the early ‘90s when there was
no market for this kind of development,
but today it is the city’s densest neigh-
borhood, and at build-out it will be
home to 10,000 residents and 21,000
jobs. The streetcar now runs to the
second vacant parcel, the South Water-
front, where an even more ambitious
redevelopment effort is underway.
The streetcar runs through the campus of Portland State University in downtown Portland. Higher -density development near transit brings riders closer .
TOD CASE STUDY 2
• 7,248 housing units, 4.6 million square feet of commercial space — worth $2.3 billion — built within 2 blocks of the streetcar from 2001 to 2005;
• Portland’s 20-year housing goal met in 7 years on 1/10th the projected land and 25% of all units are affordable;
• Another 5,000 housing units planned on streetcar extension south of downtown;
• Record number of building permits issued 7 years in a row;
• Properties closest to the streetcar developed at 90% of permitted density, compared to 43% 3 or 4 blocks away.
15
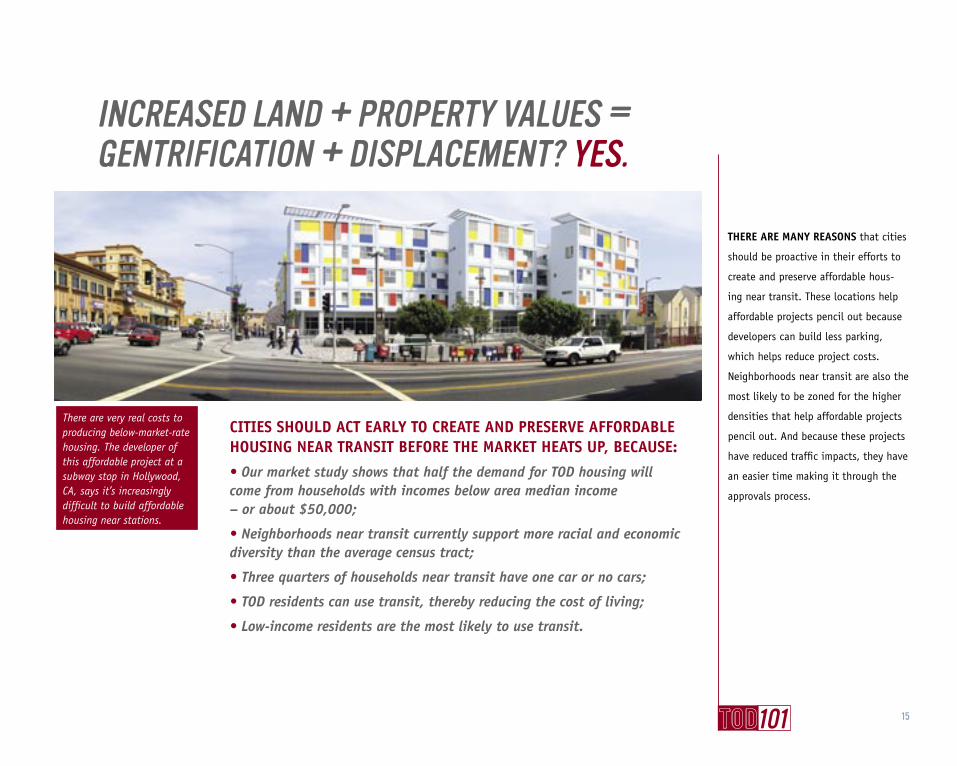
CITIES SHOULD ACT EARLY TO CREATE AND PRESERVE AFFORDABLE HOUSING NEAR TRANSIT BEFORE THE MARKET HEATS UP, BECAUSE:
• Our market study shows that half the demand for TOD housing will come from households with incomes below area median income – or about $50,000;
• Neighborhoods near transit currently support more racial and economic diversity than the average census tract;
• Three quarters of households near transit have one car or no cars;
• TOD residents can use transit, thereby reducing the cost of living;
• Low-income residents are the most likely to use transit.
THERE ARE MANY REASONS that cities
should be proactive in their efforts to
create and preserve affordable hous-
ing near transit. These locations help
affordable projects pencil out because
developers can build less parking,
which helps reduce project costs.
Neighborhoods near transit are also the
most likely to be zoned for the higher
densities that help affordable projects
pencil out. And because these projects
have reduced traffic impacts, they have
an easier time making it through the
approvals process.
INCREASED LAND + PROPERTY VALUES = GENTRIFICATION + DISPLACEMENT? YES.
There are very real costs to producing below-market-rate housing. The developer of this affordable project at a subway stop in Hollywood, CA, says it’s increasingly difficult to build affordable housing near stations.
16
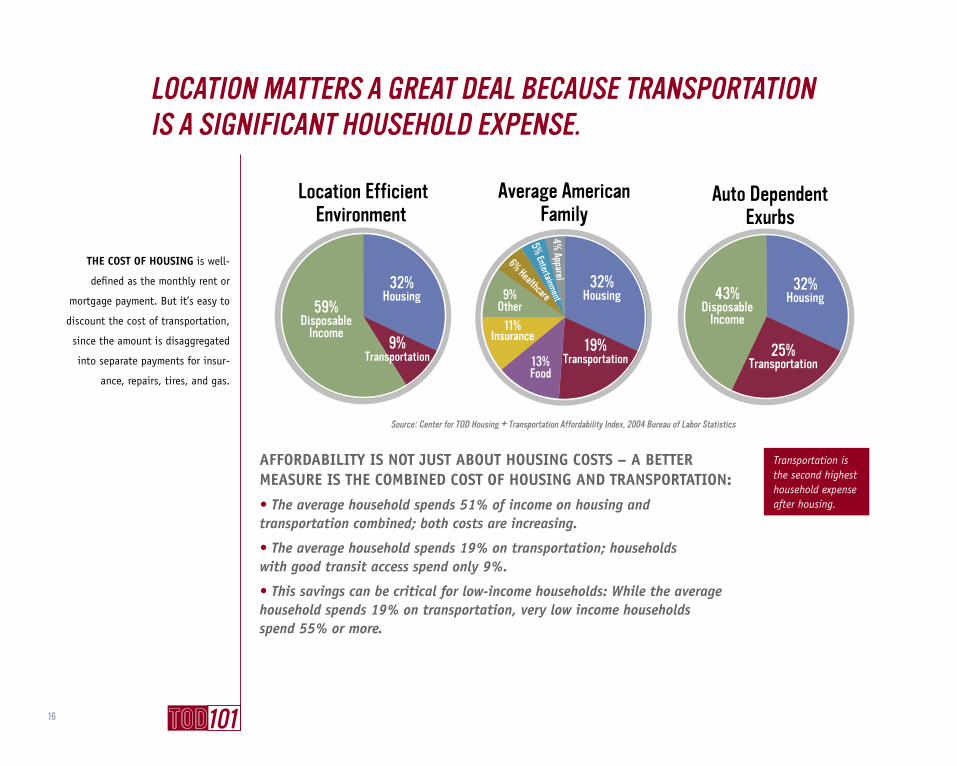
AFFORDABILITY IS NOT JUST ABOUT HOUSING COSTS – A BETTER MEASURE IS THE COMBINED COST OF HOUSING AND TRANSPORTATION:
• The average household spends 51% of income on housing and transportation combined; both costs are increasing.
• The average household spends 19% on transportation; households with good transit access spend only 9%.
• This savings can be critical for low-income households: While the average household spends 19% on transportation, very low income households spend 55% or more.
THE COST OF HOUSING is well-
defined as the monthly rent or
mortgage payment. But it’s easy to
discount the cost of transportation,
since the amount is disaggregated
into separate payments for insur-
ance, repairs, tires, and gas.
Transportation is the second highest household expense after housing.
LOCATION MATTERS A GREAT DEAL BECAUSE TRANSPORTATION IS A SIGNIFICANT HOUSEHOLD EXPENSE.
Location EfficientEnvironment
Average AmericanFamily
Source: Center for TOD Housing + Transportation Affordability Index, 2004 Bureau of Labor Statistics
Auto DependentExurbs
59%Disposable
Income
43%Disposable
Income
32%Housing
32%Housing
32%Housing
19%Transportation 25%
Transportation
9%Transportation 13%
Food
11%Insurance
9%Other
6% Healthcare
5% Entertainment
4% Apparel
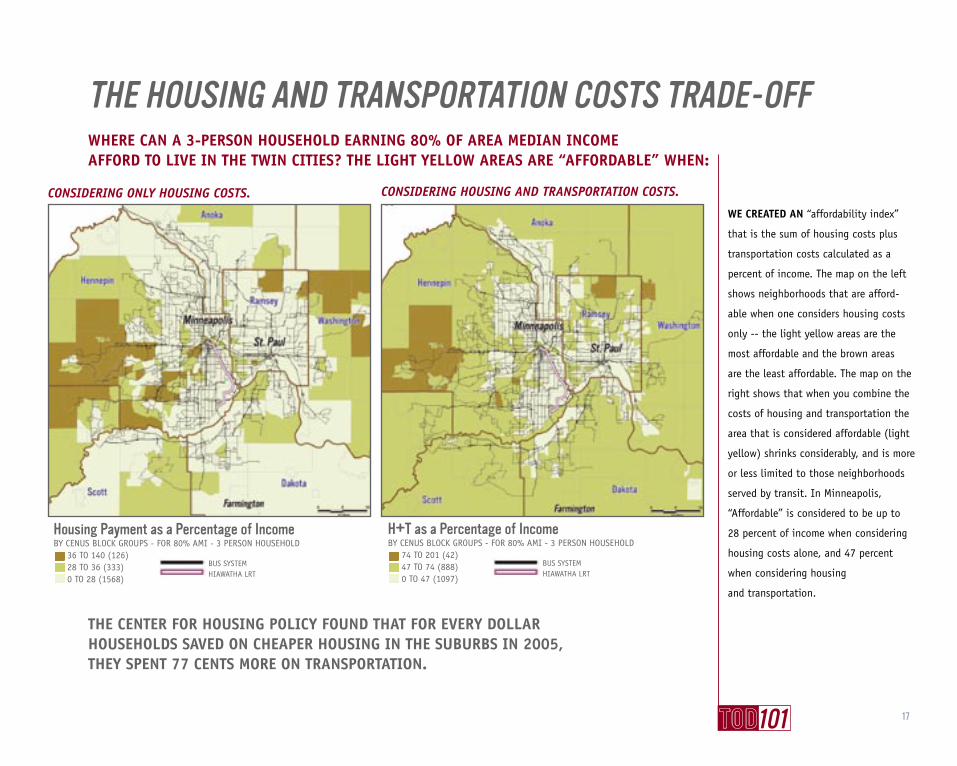
THE CENTER FOR HOUSING POLICY FOUND THAT FOR EVERY DOLLAR HOUSEHOLDS SAVED ON CHEAPER HOUSING IN THE SUBURBS IN 2005, THEY SPENT 77 CENTS MORE ON TRANSPORTATION.
CONSIDERING ONLY HOUSING COSTS.
WE CREATED AN “affordability index”
that is the sum of housing costs plus
transportation costs calculated as a
percent of income. The map on the left
shows neighborhoods that are afford-
able when one considers housing costs
only -- the light yellow areas are the
most affordable and the brown areas
are the least affordable. The map on the
right shows that when you combine the
costs of housing and transportation the
area that is considered affordable (light
yellow) shrinks considerably, and is more
or less limited to those neighborhoods
served by transit. In Minneapolis,
“Affordable” is considered to be up to
28 percent of income when considering
housing costs alone, and 47 percent
when considering housing
and transportation.
THE HOUSING AND TRANSPORTATION COSTS TRADE-OFFWHERE CAN A 3-PERSON HOUSEHOLD EARNING 80% OF AREA MEDIAN INCOMEAFFORD TO LIVE IN THE TWIN CITIES? THE LIGHT YELLOW AREAS ARE “AFFORDABLE” WHEN:
Housing Payment as a Percentage of IncomeBY CENUS BLOCK GROUPS - FOR 80% AMI - 3 PERSON HOUSEHOLD 36 TO 140 (126) 28 TO 36 (333) 0 TO 28 (1568)
BUS SYSTEMHIAWATHA LRT
CONSIDERING HOUSING AND TRANSPORTATION COSTS.
H+T as a Percentage of IncomeBY CENUS BLOCK GROUPS - FOR 80% AMI - 3 PERSON HOUSEHOLD 74 TO 201 (42) 47 TO 74 (888) 0 TO 47 (1097)
BUS SYSTEMHIAWATHA LRT
17
18
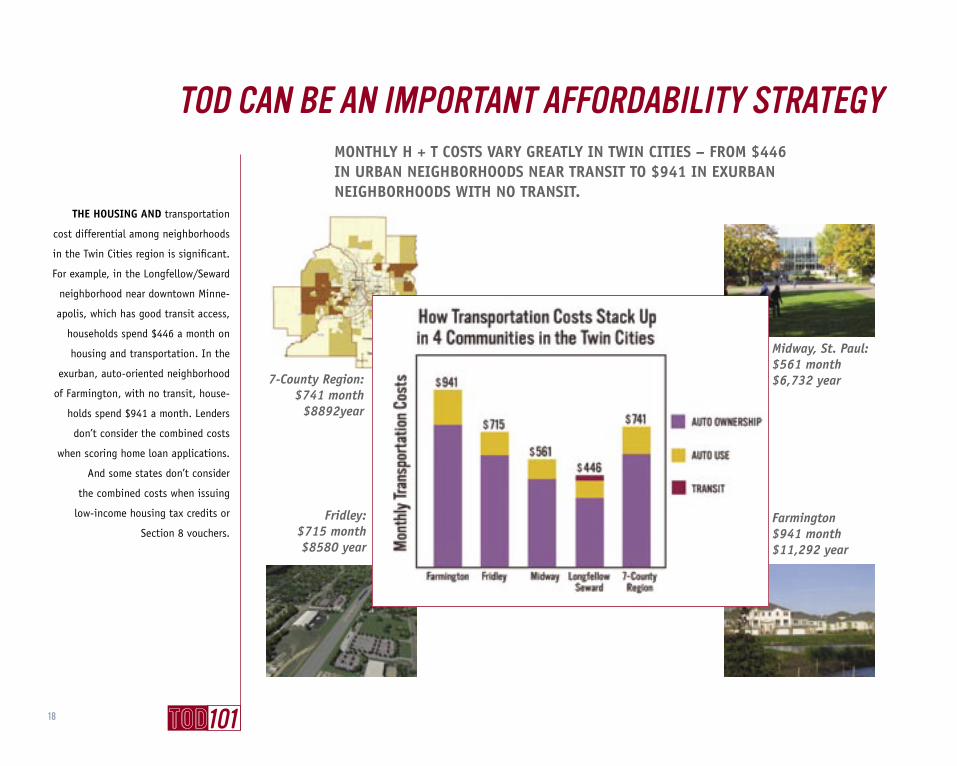
Midway, St. Paul:$561 month$6,732 year
THE HOUSING AND transportation
cost differential among neighborhoods
in the Twin Cities region is significant.
For example, in the Longfellow/Seward
neighborhood near downtown Minne-
apolis, which has good transit access,
households spend $446 a month on
housing and transportation. In the
exurban, auto-oriented neighborhood
of Farmington, with no transit, house-
holds spend $941 a month. Lenders
don’t consider the combined costs
when scoring home loan applications.
And some states don’t consider
the combined costs when issuing
low-income housing tax credits or
Section 8 vouchers.
TOD CAN BE AN IMPORTANT AFFORDABILITY STRATEGYMONTHLY H + T COSTS VARY GREATLY IN TWIN CITIES – FROM $446 IN URBAN NEIGHBORHOODS NEAR TRANSIT TO $941 IN EXURBAN NEIGHBORHOODS WITH NO TRANSIT.
7-County Region:$741 month
$8892year
Farmington$941 month$11,292 year
Fridley:$715 month$8580 year
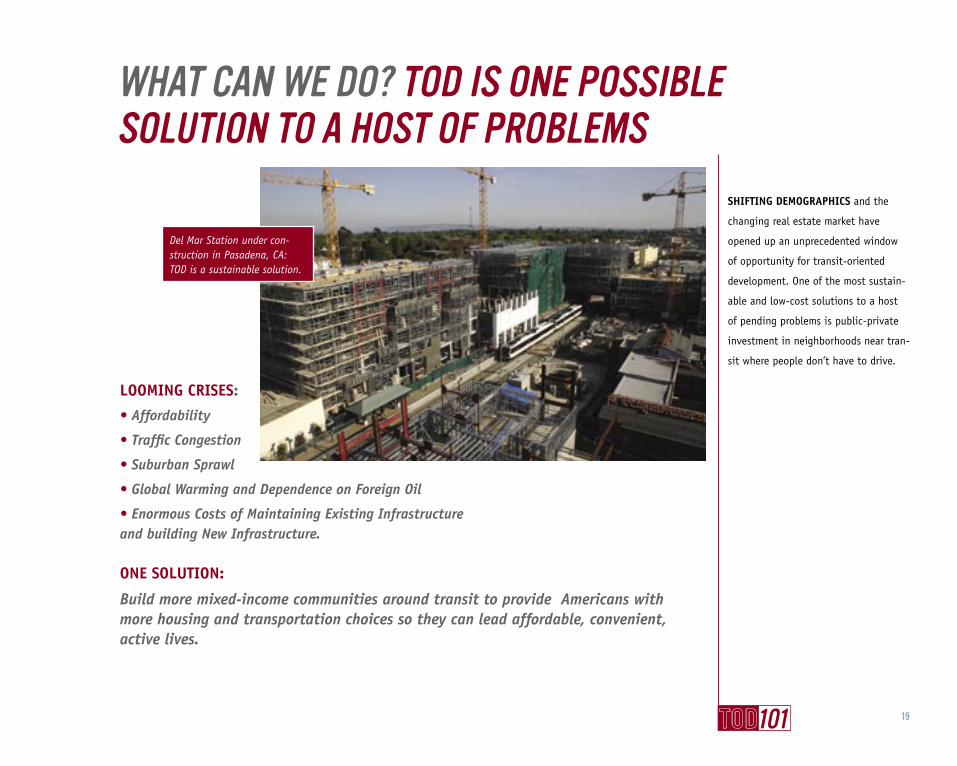
LOOMING CRISES:
• Affordability
• Traffic Congestion
• Suburban Sprawl
• Global Warming and Dependence on Foreign Oil
• Enormous Costs of Maintaining Existing Infrastructure and building New Infrastructure.
ONE SOLUTION:
Build more mixed-income communities around transit to provide Americans with more housing and transportation choices so they can lead affordable, convenient, active lives.
19
WHAT CAN WE DO? TOD IS ONE POSSIBLE SOLUTION TO A HOST OF PROBLEMS
Del Mar Station under con-struction in Pasadena, CA: TOD is a sustainable solution.
SHIFTING DEMOGRAPHICS and the
changing real estate market have
opened up an unprecedented window
of opportunity for transit-oriented
development. One of the most sustain-
able and low-cost solutions to a host
of pending problems is public-private
investment in neighborhoods near tran-
sit where people don’t have to drive.
BOARD OF DIRECTORS:
Janette Sadik-Khan, ChairSenior Vice President, Parsons Brinckerhoff
Jeffrey Boothe, Vice ChairPartner, Holland & Knight LLP
David King, TreasurerGeneral Manager, Triangle Transit Authority
Shelley Poticha, SecretaryPresident and CEO, Reconnecting America
Phyllis BleiweisExecutive Director, The Seaside Institute
William Kohn Fleissig:Partner, Urban Village Partners
Art LomenickManaging Director, High Street Residential/Trammell Crow Company
William MillarPresident, American Public Transportation Association
John Robert SmithMayor, Meridian, Mississippi
CENTER FOR TRANSIT-ORIENTED DEVELOPMENT

DESIGN BY SMARTPILLJOHN CURRY, 375 Canyon Vista Dr.,Los Angeles, CA 90065 323.993.3561
436 14TH ST., SUITE 1005 OAKLAND, CA 94612 (510-268-8602)1015 18TH ST., SUITE 601, WASHINGTON, D.C. 20036 (202-234-7591)
375 CANYON VISTA DR., LOS ANGELES, CA 90065 (323-222-5508)www.reconnectingamerica.org
CENTER FOR TRANSIT-ORIENTED DEVELOPMENT