Embed Size (px)
Citation preview
HEALTHY PEOPLE 2020 MIDCOURSE REVIEW
CHAPTER 41
Tobacco Use (TU)
Lead AgencyCenters for Disease Control and Prevention
ContentsGoal 41–2Status of Objectives 41–2Figure 41–1. Midcourse Status of the Tobacco Use Objectives 41–2Selected Findings 41–2More Information 41–6Footnotes 41–7Suggested Citation 41–7Table 41–1. Tobacco Use Objectives 41–8Table 41–2. Midcourse Progress for Measurable Tobacco Use Objectives 41–15Table 41–3. Midcourse Health Disparities for Population-based Tobacco Use Objectives 41–21Map 41–1. Adult (18+ years) Cigarette Smoking, by State: 2013 41–26Map 41–2. Adolescent (grades 9–12) Cigarette Smoking in Past 30 Days, by State: 2013 41–27Map 41–3. Comprehensive Smoke-free Indoor Air in Private Worksites,
Restaurants, and Bars, by State: 2014 41–28
41–2 HEALTHY PEOPLE 2020 MIDCOURSE REVIEW
Goal: Reduce illness, disability, and death related to tobacco use and secondhand smoke exposure.
This chapter includes objectives that monitor the prevalence of tobacco use, initiation of tobacco use, smoking cessation, health systems changes to reduce tobacco use, and social and environmental changes to reduce tobacco use and exposure to secondhand smoke. The Reader’s Guide provides a step-by-step explanation of the content of this chapter, including criteria for highlighting objectives in the Selected Findings.1
Status of ObjectivesFigure 41–1. Midcourse Status of the Tobacco Use Objectives
Baseline only 2.9% (n = 2)Getting worse 4.4% (n = 3) Target met or exceeded
11.8% (n = 8)
Improving36.8%
(n = 25)
Little or nodetectable
change44.1% (n = 30)
Measurable Objectives: 68
Total Objectives: 77
Developmental11.7% (n = 9)
Measurable88.3%
(n = 68)
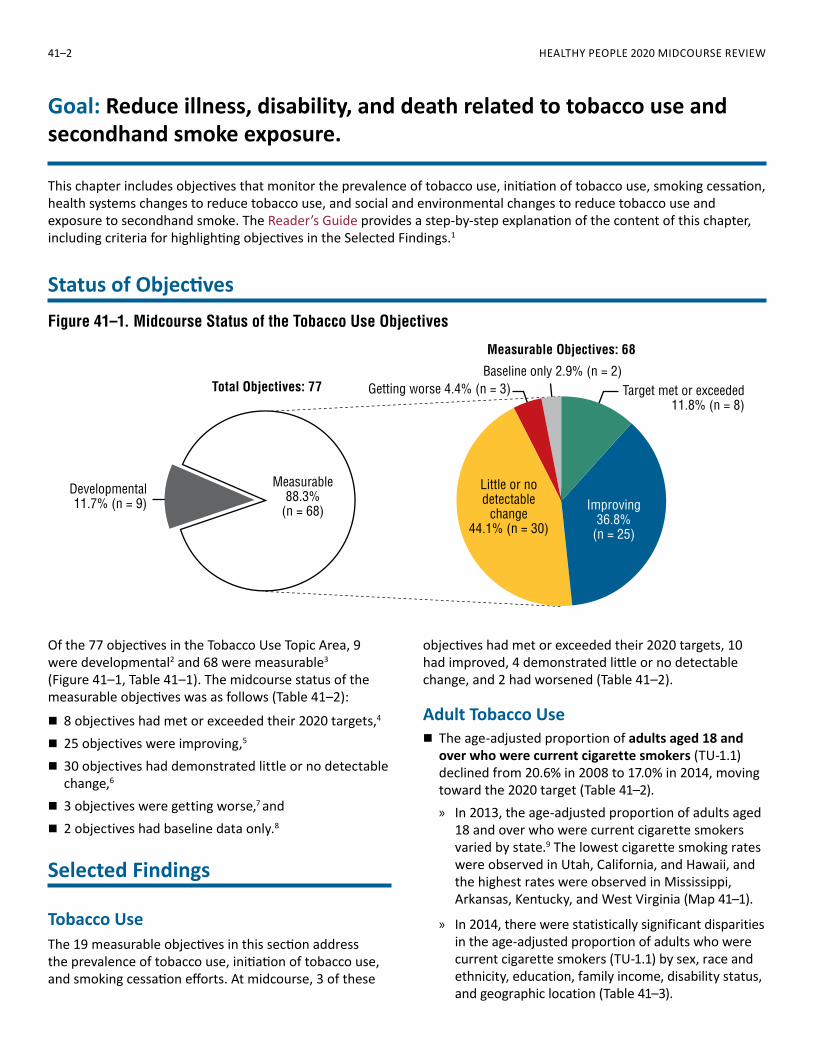
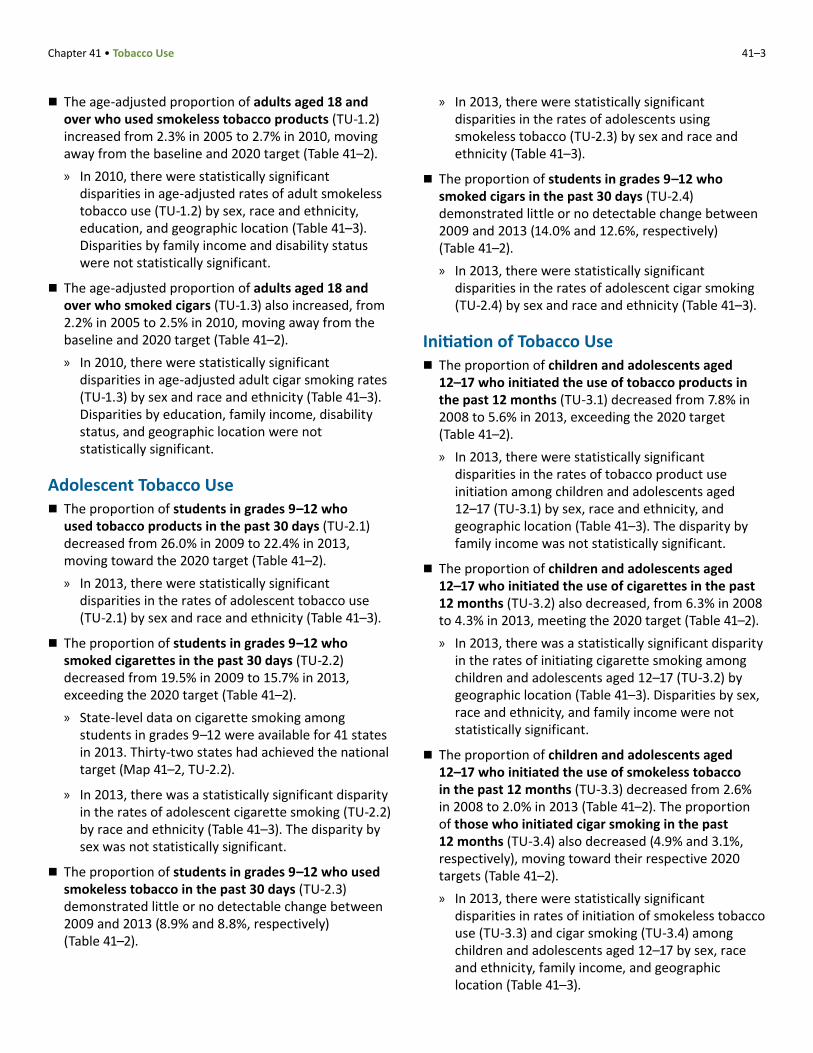
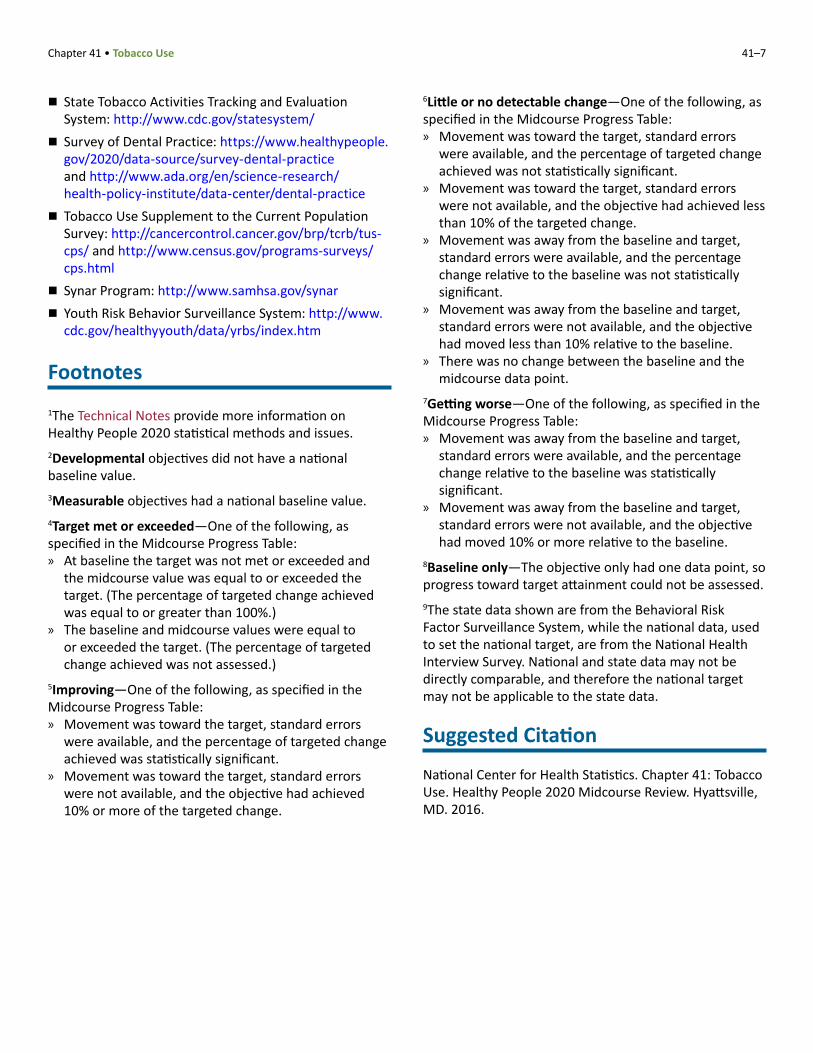
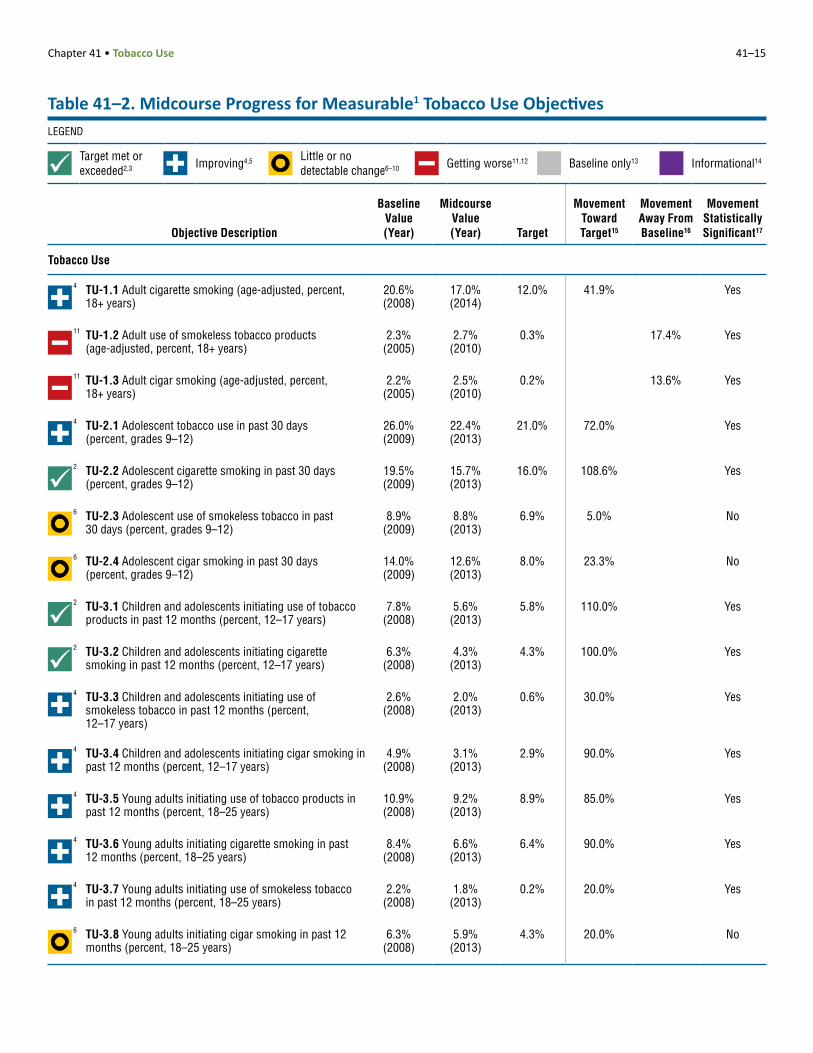
Of the 77 objectives in the Tobacco Use Topic Area, 9 were developmental2 and 68 were measurable3 (Figure 41–1, Table 41–1). The midcourse status of the measurable objectives was as follows (Table 41–2):
� 8 objectives had met or exceeded their 2020 targets,4
� 25 objectives were improving,5
� 30 objectives had demonstrated little or no detectable change,6
� 3 objectives were getting worse,7 and � 2 objectives had baseline data only.8
Selected Findings
Tobacco UseThe 19 measurable objectives in this section address the prevalence of tobacco use, initiation of tobacco use, and smoking cessation efforts. At midcourse, 3 of these
objectives had met or exceeded their 2020 targets, 10 had improved, 4 demonstrated little or no detectable change, and 2 had worsened (Table 41–2).
Adult Tobacco Use � The age-adjusted proportion of adults aged 18 and over who were current cigarette smokers (TU-1.1) declined from 20.6% in 2008 to 17.0% in 2014, moving toward the 2020 target (Table 41–2). » In 2013, the age-adjusted proportion of adults aged
18 and over who were current cigarette smokers varied by state.9 The lowest cigarette smoking rates were observed in Utah, California, and Hawaii, and the highest rates were observed in Mississippi, Arkansas, Kentucky, and West Virginia (Map 41–1).
» In 2014, there were statistically significant disparities in the age-adjusted proportion of adults who were current cigarette smokers (TU-1.1) by sex, race and ethnicity, education, family income, disability status, and geographic location (Table 41–3).
Chapter 41 • Tobacco Use 41–3
� The age-adjusted proportion of adults aged 18 and over who used smokeless tobacco products (TU-1.2) increased from 2.3% in 2005 to 2.7% in 2010, moving away from the baseline and 2020 target (Table 41–2). » In 2010, there were statistically significant
disparities in age-adjusted rates of adult smokeless tobacco use (TU-1.2) by sex, race and ethnicity, education, and geographic location (Table 41–3). Disparities by family income and disability status were not statistically significant.
� The age-adjusted proportion of adults aged 18 and over who smoked cigars (TU-1.3) also increased, from 2.2% in 2005 to 2.5% in 2010, moving away from the baseline and 2020 target (Table 41–2). » In 2010, there were statistically significant
disparities in age-adjusted adult cigar smoking rates (TU-1.3) by sex and race and ethnicity (Table 41–3). Disparities by education, family income, disability status, and geographic location were not statistically significant.
Adolescent Tobacco Use � The proportion of students in grades 9–12 who used tobacco products in the past 30 days (TU-2.1) decreased from 26.0% in 2009 to 22.4% in 2013, moving toward the 2020 target (Table 41–2). » In 2013, there were statistically significant
disparities in the rates of adolescent tobacco use (TU-2.1) by sex and race and ethnicity (Table 41–3).
� The proportion of students in grades 9–12 who smoked cigarettes in the past 30 days (TU-2.2) decreased from 19.5% in 2009 to 15.7% in 2013, exceeding the 2020 target (Table 41–2). » State-level data on cigarette smoking among
students in grades 9–12 were available for 41 states in 2013. Thirty-two states had achieved the national target (Map 41–2, TU-2.2).
» In 2013, there was a statistically significant disparity in the rates of adolescent cigarette smoking (TU-2.2) by race and ethnicity (Table 41–3). The disparity by sex was not statistically significant.
� The proportion of students in grades 9–12 who used smokeless tobacco in the past 30 days (TU-2.3) demonstrated little or no detectable change between 2009 and 2013 (8.9% and 8.8%, respectively) (Table 41–2).
» In 2013, there were statistically significant disparities in the rates of adolescents using smokeless tobacco (TU-2.3) by sex and race and ethnicity (Table 41–3).
� The proportion of students in grades 9–12 who smoked cigars in the past 30 days (TU-2.4) demonstrated little or no detectable change between 2009 and 2013 (14.0% and 12.6%, respectively) (Table 41–2). » In 2013, there were statistically significant
disparities in the rates of adolescent cigar smoking (TU-2.4) by sex and race and ethnicity (Table 41–3).
Initiation of Tobacco Use � The proportion of children and adolescents aged 12–17 who initiated the use of tobacco products in the past 12 months (TU-3.1) decreased from 7.8% in 2008 to 5.6% in 2013, exceeding the 2020 target (Table 41–2). » In 2013, there were statistically significant
disparities in the rates of tobacco product use initiation among children and adolescents aged 12–17 (TU-3.1) by sex, race and ethnicity, and geographic location (Table 41–3). The disparity by family income was not statistically significant.
� The proportion of children and adolescents aged 12–17 who initiated the use of cigarettes in the past 12 months (TU-3.2) also decreased, from 6.3% in 2008 to 4.3% in 2013, meeting the 2020 target (Table 41–2). » In 2013, there was a statistically significant disparity
in the rates of initiating cigarette smoking among children and adolescents aged 12–17 (TU-3.2) by geographic location (Table 41–3). Disparities by sex, race and ethnicity, and family income were not statistically significant.
� The proportion of children and adolescents aged 12–17 who initiated the use of smokeless tobacco in the past 12 months (TU-3.3) decreased from 2.6% in 2008 to 2.0% in 2013 (Table 41–2). The proportion of those who initiated cigar smoking in the past 12 months (TU-3.4) also decreased (4.9% and 3.1%, respectively), moving toward their respective 2020 targets (Table 41–2). » In 2013, there were statistically significant
disparities in rates of initiation of smokeless tobacco use (TU-3.3) and cigar smoking (TU-3.4) among children and adolescents aged 12–17 by sex, race and ethnicity, family income, and geographic location (Table 41–3).
41–4 HEALTHY PEOPLE 2020 MIDCOURSE REVIEW
� Between 2008 and 2013, the proportion of young adults aged 18–25 who initiated the use of the following tobacco products in the past 12 months declined: any tobacco product, from 10.9% to 9.2% (TU-3.5); cigarettes, from 8.4% to 6.6% (TU-3.6); and smokeless tobacco, from 2.2% to 1.8% (TU-3.7), all moving toward their respective 2020 targets (Table 41–2). » In 2013, there were statistically significant
disparities in the rates of tobacco product use initiation among young adults aged 18–25 (TU-3.5) by sex, race and ethnicity, family income, and geographic location (Table 41–3).
» In 2013, there were statistically significant disparities in rates of initiation of cigarette smoking (TU-3.6) and smokeless tobacco use (TU-3.7) among young adults aged 18–25 by sex, race and ethnicity, and geographic location (Table 41–3). For both objectives, the disparity by family income was not statistically significant.
� The proportion of young adults aged 18–25 who initiated cigar smoking in the past 12 months (TU-3.8) demonstrated little or no detectable change between 2008 and 2013 (6.3% and 5.9%, respectively) (Table 41–2). » In 2013, there were statistically significant
disparities in rates of initiation of cigar smoking among young adults aged 18–25 (TU-3.8) by sex, race and ethnicity, and family income (Table 41–3). The disparity by geographic location was not statistically significant.
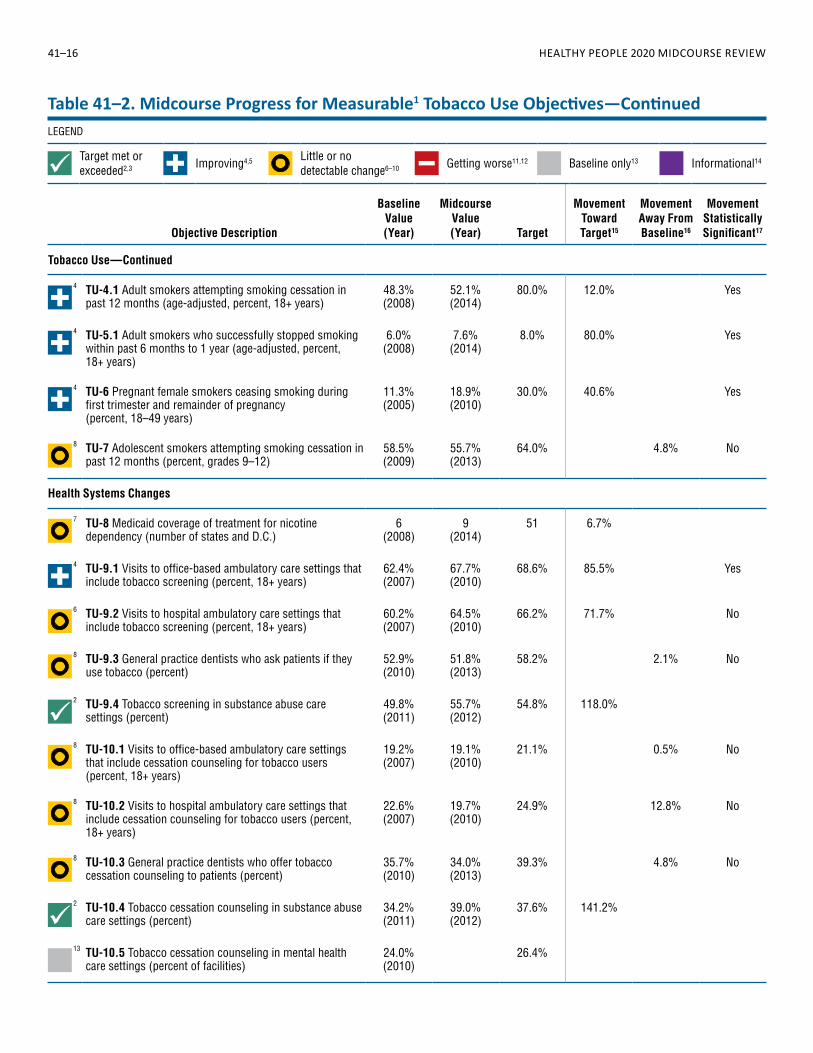
Smoking Cessation � The age-adjusted proportion of adult smokers aged 18 and over who attempted smoking cessation in the past 12 months (TU-4.1) increased from 48.3% in 2008 to 52.1% in 2014, moving toward the 2020 target (Table 41–2). » In 2014, there was a statistically significant disparity
in age-adjusted rates of smoking cessation attempts among adult smokers (TU-4.1) by sex (Table 41–3). Disparities by race and ethnicity, education, family income, disability status, and geographic location were not statistically significant.
� The age-adjusted proportion of adult smokers aged 18 and over who successfully stopped smoking 6 months to 1 year ago (TU-5.1) increased from 6.0% in 2008 to 7.6% in 2014, moving toward the 2020 target (Table 41–2).
» In 2014, there was a statistically significant disparity in age-adjusted rates of adult smokers who successfully stopped smoking 6 months to 1 year ago (TU-5.1) by family income (Table 41–3). Disparities by sex, race and ethnicity, education, disability status, and geographic location were not statistically significant.
� The proportion of pregnant smokers aged 18–49 who stopped smoking during the first trimester and did not smoke during the remainder of their pregnancy (TU-6) increased from 11.3% in 2005 to 18.9% in 2010, moving toward the 2020 target (Table 41–2).
� The proportion of adolescent smokers in grades 9–12 who attempted smoking cessation in the past 12 months (TU-7) demonstrated little or no detectable change between 2009 and 2013 (58.5% and 55.7%, respectively) (Table 41–2). » In 2013, there was a statistically significant disparity
by sex in rates of adolescent smokers in grades 9–12 who attempted smoking cessation (Table 41–3, TU-7). The disparity by race and ethnicity was not statistically significant.
Health Systems ChangesThe objectives in this section focus on policies and strategies to increase access to and use of smoking cessation services and treatments. Two of the 10 measurable objectives in this section had met or exceeded their 2020 targets, 1 objective had improved, and 6 demonstrated little or no detectable change. One objective had baseline data only, so progress toward the 2020 target could not be assessed (Table 41–2).
� The proportion of visits to office-based ambulatory care settings by adults aged 18 and over that included tobacco use screening (TU-9.1) increased from 62.4% in 2007 to 67.7% in 2010, moving toward the 2020 target (Table 41–2). » In 2010, there was a statistically significant
disparity in the proportion of visits to office-based ambulatory care settings by adults aged 18 and over that included tobacco use screening (TU-9.1) by geographic location of the health care provider (Table 41–3). The disparities by sex and race and ethnicity were not statistically significant.
� The proportion of visits to hospital ambulatory care settings by adults aged 18 and over that included tobacco screening (TU-9.2) demonstrated little or no detectable change between 2007 and 2010 (60.2% and 64.5%, respectively) (Table 41–2).
Chapter 41 • Tobacco Use 41–5
» In 2010, disparities in the proportion of visits to hospital ambulatory care settings by adults aged 18 and over that included tobacco screening (TU-9.2) were not statistically significant by sex, race and ethnicity, or geographic location of the health care provider (Table 41–3).
� The proportion of substance abuse care facilities that offered tobacco use screening services (TU-9.4) increased from 49.8% in 2011 to 55.7% in 2012, exceeding the 2020 target (Table 41–2).
� Between 2007 and 2010, the proportion of visits to ambulatory care settings that included cessation counseling for tobacco users aged 18 and over demonstrated little to no detectable change in the following settings (Table 41–2): office-based ambulatory care settings (TU-10.1: 19.2% and 19.1%, respectively) and hospital ambulatory care settings (TU-10.2: 22.6% and 19.7%, respectively). » In 2010, there were no statistically significant
disparities in the proportion of visits to office-based ambulatory care settings (TU-10.1) or hospital ambulatory care settings (TU-10.2) with cessation counseling for adult tobacco users aged 18 and over by sex, race and ethnicity, or health care provider’s geographic location (Table 41–3).
� The proportion of substance abuse care facilities that offered tobacco cessation counseling (TU-10.4) increased from 34.2% in 2011 to 39.0% in 2012, exceeding the 2020 target (Table 41–2).
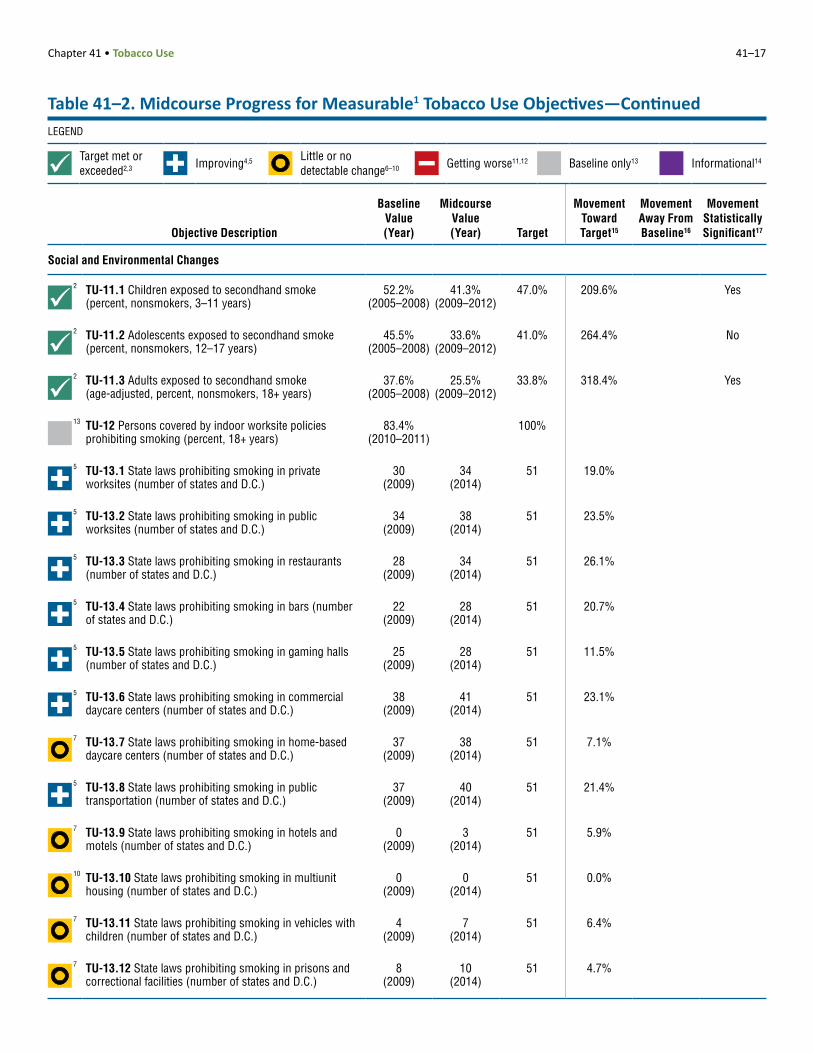
Social and Environmental ChangesThe objectives in this section monitor progress toward the establishment of policies to reduce exposure to secondhand smoke, increase the cost of tobacco, restrict tobacco advertising, and reduce illegal sales to minors. Of the 39 measurable objectives in this section, 3 had met or exceeded their 2020 targets, 14 had improved, 20 demonstrated little or no detectable change, and 1 had worsened. One objective had baseline data only, so progress toward the 2020 target could not be assessed (Table 41–2).
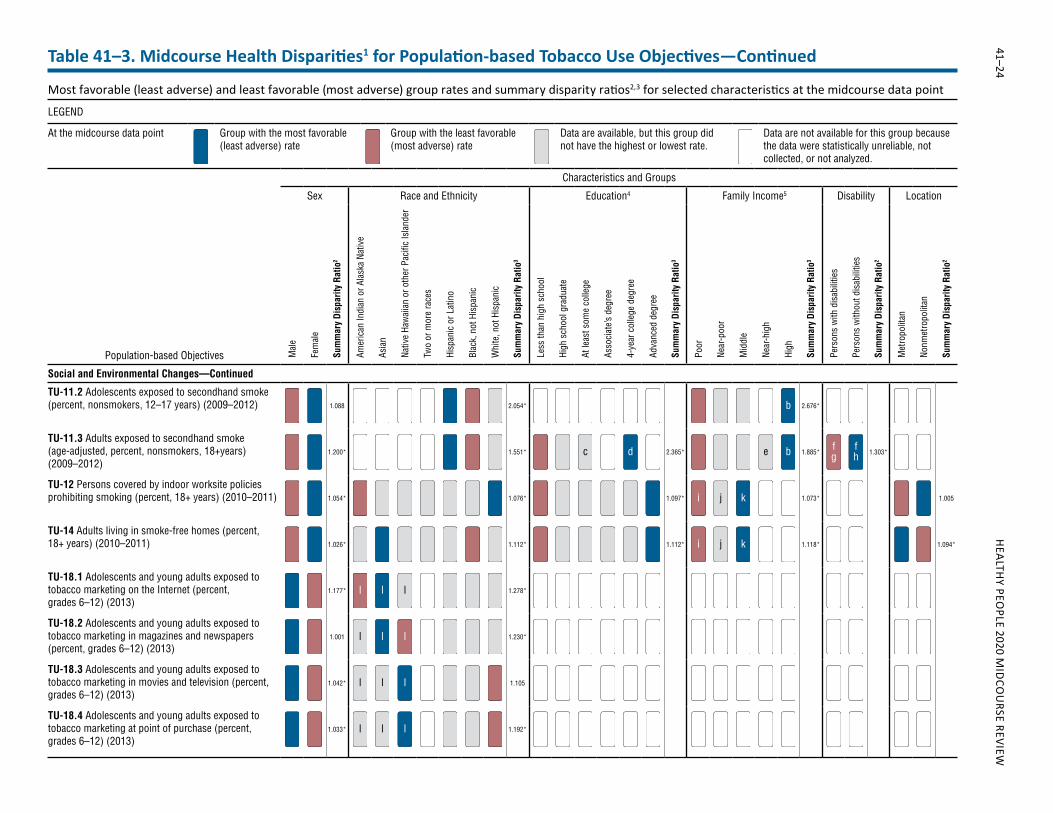
Exposure to Secondhand Smoke � Between 2005–2008 and 2009–2012, the proportion of nonsmokers exposed to secondhand smoke decreased in the following population groups, exceeding their 2020 targets (Table 41–2): children aged 3–11 years, from 52.2% to 41.3% (TU-11.1); adolescents aged 12–17, from 45.5% to 33.6% (TU-11.2); and adults aged 18 and over (age-adjusted), from 37.6% to 25.5% (TU-11.3).
» In 2009–2012, there were statistically significant disparities by race and ethnicity and family income in the proportion of nonsmoking children aged 3–11 years (TU-11.1) and adolescents aged 12–17 (TU-11.2) exposed to secondhand smoke (Table 41–3). For both objectives, the disparity by sex was not statistically significant.
» In 2009–2012, there were statistically significant disparities by sex, race and ethnicity, education, family income, and disability status in the age-adjusted proportion of nonsmoking adults exposed to secondhand smoke (Table 41–3, TU-11.3).
Smoke-free Environments � The proportion of persons aged 18 and over covered by indoor worksite policies prohibiting smoking (TU-12) was 83.4% in 2010–2011. Data beyond the baseline were not available, so progress could not be assessed (Table 41–2). » In 2010–2011, there were statistically significant
disparities by sex, race and ethnicity, education, and family income in the proportion of adults covered by indoor worksite policies prohibiting smoking (Table 41–3, TU-12). The disparity by geographic location was not statistically significant.
� Between 2009 and 2014, the number of states (including the District of Columbia) with laws that prohibit smoking in the following venues increased, moving toward their 2020 targets (Table 41–2): private worksites, from 30 to 34 (TU-13.1); public worksites, from 34 to 38 (TU-13.2); restaurants, from 28 to 34 (TU-13.3); bars, from 22 to 28 (TU-13.4); gaming halls, from 25 to 28 (TU-13.5); commercial daycare centers, from 38 to 41 (TU-13.6); and public transportation, from 37 to 40 (TU-13.8). » Map 41–3 presents a composite picture of state
laws prohibiting indoor smoking in private worksites (TU-13.1), restaurants (TU-13.3), and bars (TU-13.4). In 2014, 27 states had laws prohibiting smoking in all three types of locations.
� The proportion of adults aged 18 and over who lived in smoke-free homes (TU-14) increased from 79.1% in 2006–2007 to 83.9% in 2010–2011, moving toward the 2020 target (Table 41–2). » In 2010–2011, there were statistically significant
disparities by sex, race and ethnicity, education, family income, and geographic location in the proportion of adults who lived in smoke-free homes (Table 41–3, TU-14).
41–6 HEALTHY PEOPLE 2020 MIDCOURSE REVIEW
� The proportion of high schools with tobacco-free environments (TU-15.3) increased from 66.1% in 2006 to 74.5% in 2014, moving toward the 2020 target (Table 41–2).
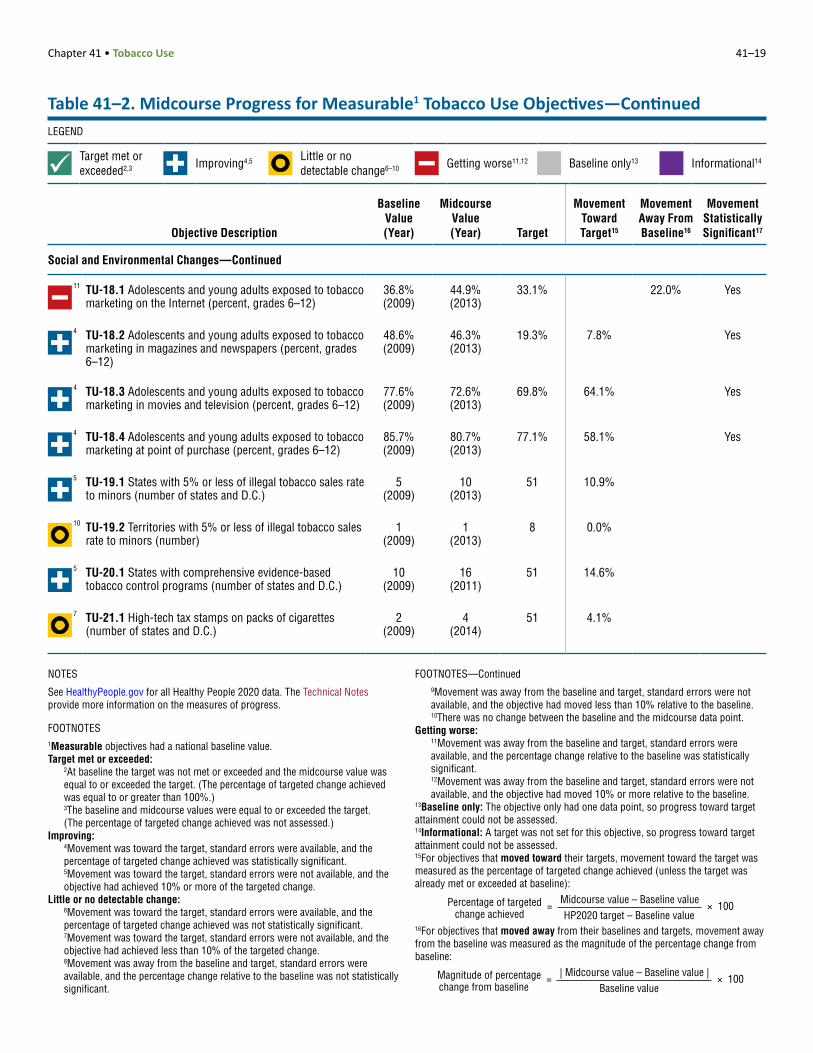
Tobacco Marketing � The proportion of students in grades 6–12 exposed to tobacco marketing on the Internet (TU-18.1) increased from 36.8% in 2009 to 44.9% in 2013, moving away from the baseline and 2020 target (Table 41–2). » In 2013, there were statistically significant
disparities by sex and race and ethnicity in the proportion of students in grades 6–12 exposed to tobacco marketing on the Internet (Table 41–3, TU-18.1).
� Between 2009 and 2013, the proportion of students in grades 6–12 exposed to tobacco marketing in the following media and locations decreased, moving toward their 2020 targets (Table 41–2): magazines and newspapers, from 48.6% to 46.3% (TU-18.2); movies and television, from 77.6% to 72.6% (TU-18.3); and at point of purchase, from 85.7% to 80.7% (TU-18.4). » In 2013, there was a statistically significant disparity
by race and ethnicity in the proportion of students in grades 6–12 exposed to tobacco marketing in magazines and newspapers (Table 41–3, TU-18.2). The disparity by sex was not statistically significant.
» In 2013, there was a statistically significant disparity by sex in the proportion of students in grades 6–12 exposed to tobacco marketing in movies and television (Table 41–3, TU-18.3). The disparity by race and ethnicity was not statistically significant.
» In 2013, there were statistically significant disparities by sex and race and ethnicity in the proportion of students in grades 6–12 exposed to tobacco marketing at point of purchase (Table 41–3, TU-18.4).
State Tobacco Control Efforts � The number of states (including the District of Columbia) with 5% or less of illegal tobacco sales rates to minors (TU-19.1) increased from 5 in 2009 to 10 in 2013, moving toward the 2020 target (Table 41–2).
� The number of states (including the District of Columbia) with comprehensive evidence-based tobacco control programs, or that increased total expenditures for comprehensive evidence-based
tobacco control programs by 25% or more over the decade (TU-20.1), increased from 10 in 2009 to 16 in 2011, moving toward the 2020 target (Table 41–2).
More Information
Readers interested in more detailed information about the objectives in this topic area are invited to visit the HealthyPeople.gov website, where extensive substantive and technical information is available:
� For the background and importance of the topic area, see: https://www.healthypeople.gov/2020/topics-objectives/topic/tobacco-use
� For data details for each objective, including definitions, numerators, denominators, calculations, and data limitations, see: https://www.healthypeople.gov/2020/topics-objectives/topic/tobacco-use/objectivesSelect an objective, then click on the “Data Details” icon.
� For objective data by population group (e.g., sex, race and ethnicity, or family income), including rates, percentages, or counts for multiple years, see: https://www.healthypeople.gov/2020/topics-objectives/topic/tobacco-use/objectivesSelect an objective, then click on the “Data2020” icon.
Data for the measurable objectives in this chapter were from the following data sources:
� Behavioral Risk Factor Surveillance System: http://www.cdc.gov/brfss/
� National Ambulatory Medical Care Survey: http://www.cdc.gov/nchs/ahcd.htm
� National Health and Nutrition Examination Survey: http://www.cdc.gov/nchs/nhanes.htm
� National Health Interview Survey: http://www.cdc.gov/nchs/nhis.htm
� National Hospital Ambulatory Medical Care Survey: http://www.cdc.gov/nchs/ahcd.htm
� National Mental Health Services Survey: http://www.samhsa.gov/data/mental-health-facilities-data-nmhss
� National Survey of Substance Abuse Treatment Services: http://wwwdasis.samhsa.gov/dasis2/nssats.htm
� National Survey on Drug Use and Health: http://www.samhsa.gov/data/population-data-nsduh
� National Youth Tobacco Survey: http://www.cdc.gov/tobacco/data_statistics/surveys/nyts/
� School Health Policies and Practices Study: http://www.cdc.gov/healthyyouth/data/shpps/index.htm
Chapter 41 • Tobacco Use 41–7
� State Tobacco Activities Tracking and Evaluation System: http://www.cdc.gov/statesystem/
� Survey of Dental Practice: https://www.healthypeople.gov/2020/data-source/survey-dental-practice and http://www.ada.org/en/science-research/health-policy-institute/data-center/dental-practice
� Tobacco Use Supplement to the Current Population Survey: http://cancercontrol.cancer.gov/brp/tcrb/tus-cps/ and http://www.census.gov/programs-surveys/cps.html
� Synar Program: http://www.samhsa.gov/synar � Youth Risk Behavior Surveillance System: http://www.cdc.gov/healthyyouth/data/yrbs/index.htm
Footnotes
1The Technical Notes provide more information on Healthy People 2020 statistical methods and issues.2Developmental objectives did not have a national baseline value.3Measurable objectives had a national baseline value. 4Target met or exceeded—One of the following, as specified in the Midcourse Progress Table: » At baseline the target was not met or exceeded and
the midcourse value was equal to or exceeded the target. (The percentage of targeted change achieved was equal to or greater than 100%.)
» The baseline and midcourse values were equal to or exceeded the target. (The percentage of targeted change achieved was not assessed.)
5Improving—One of the following, as specified in the Midcourse Progress Table: » Movement was toward the target, standard errors
were available, and the percentage of targeted change achieved was statistically significant.
» Movement was toward the target, standard errors were not available, and the objective had achieved 10% or more of the targeted change.
6Little or no detectable change—One of the following, as specified in the Midcourse Progress Table: » Movement was toward the target, standard errors
were available, and the percentage of targeted change achieved was not statistically significant.
» Movement was toward the target, standard errors were not available, and the objective had achieved less than 10% of the targeted change.
» Movement was away from the baseline and target, standard errors were available, and the percentage change relative to the baseline was not statistically significant.
» Movement was away from the baseline and target, standard errors were not available, and the objective had moved less than 10% relative to the baseline.
» There was no change between the baseline and the midcourse data point.
7Getting worse—One of the following, as specified in the Midcourse Progress Table: » Movement was away from the baseline and target,
standard errors were available, and the percentage change relative to the baseline was statistically significant.
» Movement was away from the baseline and target, standard errors were not available, and the objective had moved 10% or more relative to the baseline.
8Baseline only—The objective only had one data point, so progress toward target attainment could not be assessed.9The state data shown are from the Behavioral Risk Factor Surveillance System, while the national data, used to set the national target, are from the National Health Interview Survey. National and state data may not be directly comparable, and therefore the national target may not be applicable to the state data.
Suggested Citation
National Center for Health Statistics. Chapter 41: Tobacco Use. Healthy People 2020 Midcourse Review. Hyattsville, MD. 2016.
41–8 HEALTHY PEOPLE 2020 MIDCOURSE REVIEW
Objective Number Objective Statement Data Sources
Midcourse Data Availability
Tobacco Use
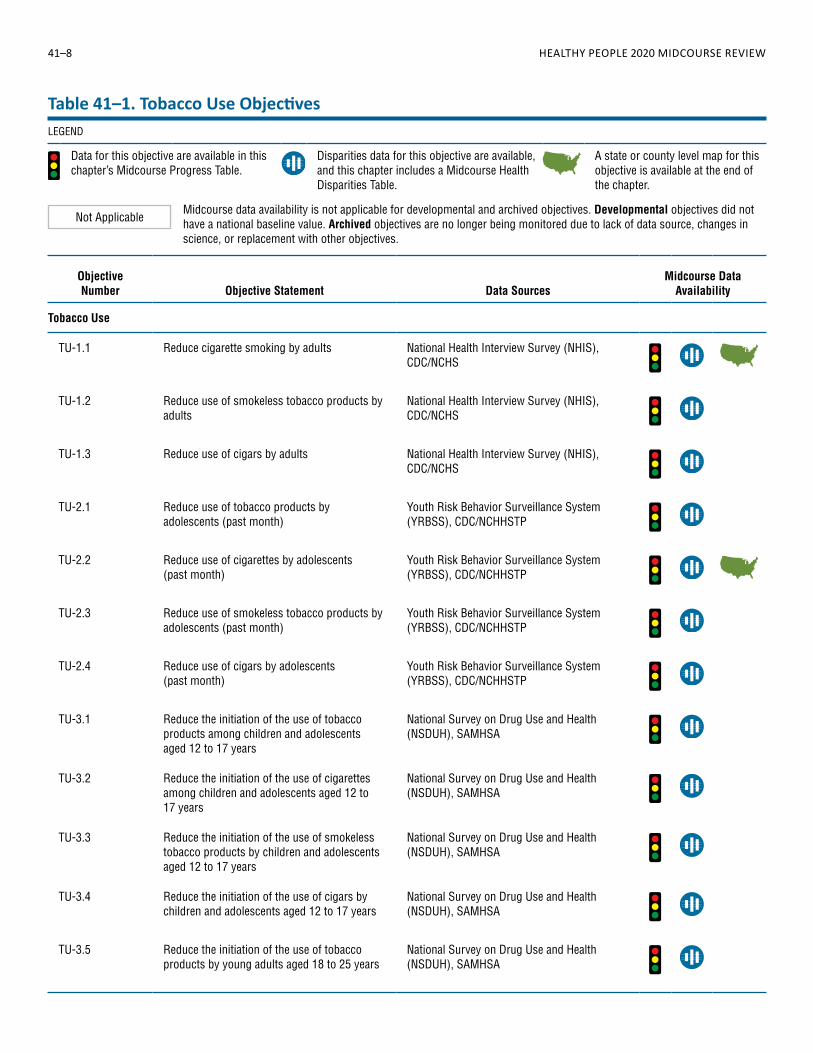
TU-1.1 Reduce cigarette smoking by adults National Health Interview Survey (NHIS), CDC/NCHS
TU-1.2 Reduce use of smokeless tobacco products by adults
National Health Interview Survey (NHIS), CDC/NCHS
TU-1.3 Reduce use of cigars by adults National Health Interview Survey (NHIS), CDC/NCHS
TU-2.1 Reduce use of tobacco products by adolescents (past month)
Youth Risk Behavior Surveillance System (YRBSS), CDC/NCHHSTP
TU-2.2 Reduce use of cigarettes by adolescents (past month)
Youth Risk Behavior Surveillance System (YRBSS), CDC/NCHHSTP
TU-2.3 Reduce use of smokeless tobacco products by adolescents (past month)
Youth Risk Behavior Surveillance System (YRBSS), CDC/NCHHSTP
TU-2.4 Reduce use of cigars by adolescents (past month)
Youth Risk Behavior Surveillance System (YRBSS), CDC/NCHHSTP
TU-3.1 Reduce the initiation of the use of tobacco products among children and adolescents aged 12 to 17 years
National Survey on Drug Use and Health (NSDUH), SAMHSA
TU-3.2 Reduce the initiation of the use of cigarettes among children and adolescents aged 12 to 17 years
National Survey on Drug Use and Health (NSDUH), SAMHSA
TU-3.3 Reduce the initiation of the use of smokeless tobacco products by children and adolescents aged 12 to 17 years
National Survey on Drug Use and Health (NSDUH), SAMHSA
TU-3.4 Reduce the initiation of the use of cigars by children and adolescents aged 12 to 17 years
National Survey on Drug Use and Health (NSDUH), SAMHSA
TU-3.5 Reduce the initiation of the use of tobacco products by young adults aged 18 to 25 years
National Survey on Drug Use and Health (NSDUH), SAMHSA
Table 41–1. Tobacco Use Objectives LEGEND
Data for this objective are available in this chapter’s Midcourse Progress Table.
Disparities data for this objective are available, and this chapter includes a Midcourse Health Disparities Table.
A state or county level map for this objective is available at the end of the chapter.
Not ApplicableMidcourse data availability is not applicable for developmental and archived objectives. Developmental objectives did not have a national baseline value. Archived objectives are no longer being monitored due to lack of data source, changes in science, or replacement with other objectives.
Chapter 41 • Tobacco Use 41–9
Objective Number Objective Statement Data Sources
Midcourse Data Availability
Tobacco Use—Continued
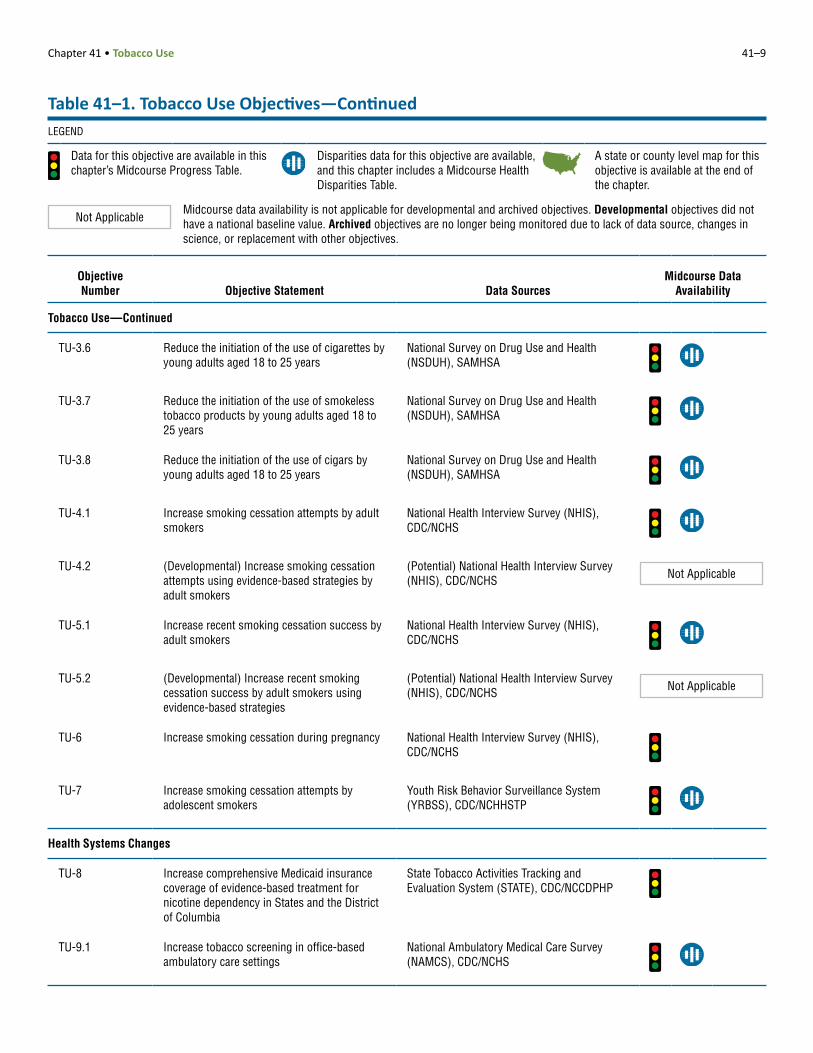
TU-3.6 Reduce the initiation of the use of cigarettes by young adults aged 18 to 25 years
National Survey on Drug Use and Health (NSDUH), SAMHSA
TU-3.7 Reduce the initiation of the use of smokeless tobacco products by young adults aged 18 to 25 years
National Survey on Drug Use and Health (NSDUH), SAMHSA
TU-3.8 Reduce the initiation of the use of cigars by young adults aged 18 to 25 years
National Survey on Drug Use and Health (NSDUH), SAMHSA
TU-4.1 Increase smoking cessation attempts by adult smokers
National Health Interview Survey (NHIS), CDC/NCHS
TU-4.2 (Developmental) Increase smoking cessation attempts using evidence-based strategies by adult smokers
(Potential) National Health Interview Survey (NHIS), CDC/NCHS Not Applicable
TU-5.1 Increase recent smoking cessation success by adult smokers
National Health Interview Survey (NHIS), CDC/NCHS
TU-5.2 (Developmental) Increase recent smoking cessation success by adult smokers using evidence-based strategies
(Potential) National Health Interview Survey (NHIS), CDC/NCHS Not Applicable
TU-6 Increase smoking cessation during pregnancy National Health Interview Survey (NHIS), CDC/NCHS
TU-7 Increase smoking cessation attempts by adolescent smokers
Youth Risk Behavior Surveillance System (YRBSS), CDC/NCHHSTP
Health Systems Changes
TU-8 Increase comprehensive Medicaid insurance coverage of evidence-based treatment for nicotine dependency in States and the District of Columbia
State Tobacco Activities Tracking and Evaluation System (STATE), CDC/NCCDPHP
TU-9.1 Increase tobacco screening in office-based ambulatory care settings
National Ambulatory Medical Care Survey (NAMCS), CDC/NCHS
Table 41–1. Tobacco Use Objectives—ContinuedLEGEND
Data for this objective are available in this chapter’s Midcourse Progress Table.
Disparities data for this objective are available, and this chapter includes a Midcourse Health Disparities Table.
A state or county level map for this objective is available at the end of the chapter.
Not ApplicableMidcourse data availability is not applicable for developmental and archived objectives. Developmental objectives did not have a national baseline value. Archived objectives are no longer being monitored due to lack of data source, changes in science, or replacement with other objectives.
41–10 HEALTHY PEOPLE 2020 MIDCOURSE REVIEW
Objective Number Objective Statement Data Sources
Midcourse Data Availability
Health Systems Changes—Continued
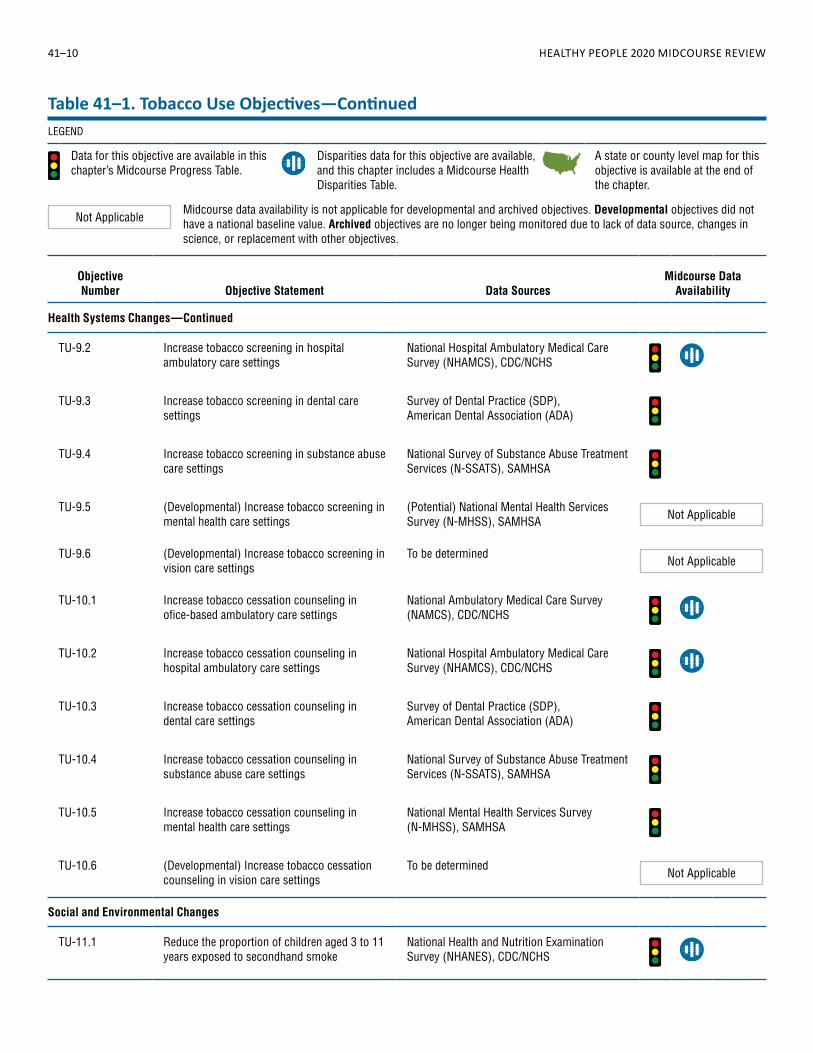
TU-9.2 Increase tobacco screening in hospital ambulatory care settings
National Hospital Ambulatory Medical Care Survey (NHAMCS), CDC/NCHS
TU-9.3 Increase tobacco screening in dental care settings
Survey of Dental Practice (SDP), American Dental Association (ADA)
TU-9.4 Increase tobacco screening in substance abuse care settings
National Survey of Substance Abuse Treatment Services (N-SSATS), SAMHSA
TU-9.5 (Developmental) Increase tobacco screening in mental health care settings
(Potential) National Mental Health Services Survey (N-MHSS), SAMHSA Not Applicable
TU-9.6 (Developmental) Increase tobacco screening in vision care settings
To be determinedNot Applicable
TU-10.1 Increase tobacco cessation counseling in ofice-based ambulatory care settings
National Ambulatory Medical Care Survey (NAMCS), CDC/NCHS
TU-10.2 Increase tobacco cessation counseling in hospital ambulatory care settings
National Hospital Ambulatory Medical Care Survey (NHAMCS), CDC/NCHS
TU-10.3 Increase tobacco cessation counseling in dental care settings
Survey of Dental Practice (SDP), American Dental Association (ADA)
TU-10.4 Increase tobacco cessation counseling in substance abuse care settings
National Survey of Substance Abuse Treatment Services (N-SSATS), SAMHSA
TU-10.5 Increase tobacco cessation counseling in mental health care settings
National Mental Health Services Survey (N-MHSS), SAMHSA
TU-10.6 (Developmental) Increase tobacco cessation counseling in vision care settings
To be determinedNot Applicable
Social and Environmental Changes
TU-11.1 Reduce the proportion of children aged 3 to 11 years exposed to secondhand smoke
National Health and Nutrition Examination Survey (NHANES), CDC/NCHS
Table 41–1. Tobacco Use Objectives—ContinuedLEGEND
Data for this objective are available in this chapter’s Midcourse Progress Table.
Disparities data for this objective are available, and this chapter includes a Midcourse Health Disparities Table.
A state or county level map for this objective is available at the end of the chapter.
Not ApplicableMidcourse data availability is not applicable for developmental and archived objectives. Developmental objectives did not have a national baseline value. Archived objectives are no longer being monitored due to lack of data source, changes in science, or replacement with other objectives.
Chapter 41 • Tobacco Use 41–11
Objective Number Objective Statement Data Sources
Midcourse Data Availability
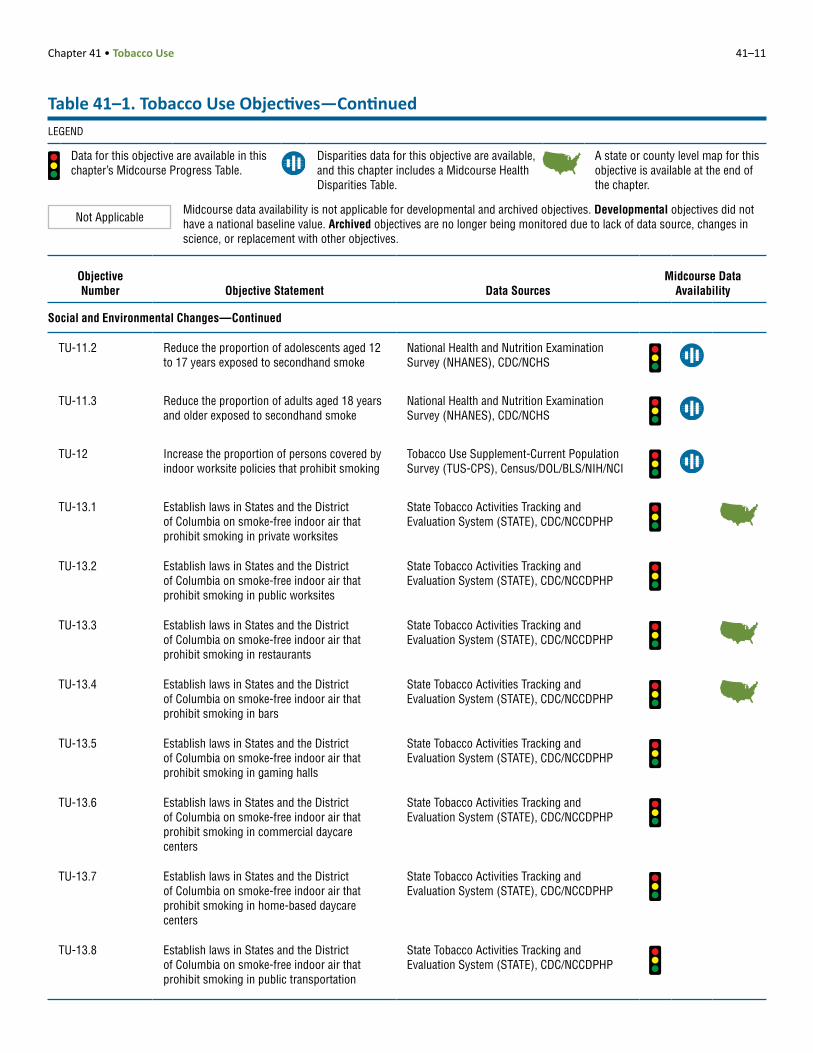
Social and Environmental Changes—Continued
TU-11.2 Reduce the proportion of adolescents aged 12 to 17 years exposed to secondhand smoke
National Health and Nutrition Examination Survey (NHANES), CDC/NCHS
TU-11.3 Reduce the proportion of adults aged 18 years and older exposed to secondhand smoke
National Health and Nutrition Examination Survey (NHANES), CDC/NCHS
TU-12 Increase the proportion of persons covered by indoor worksite policies that prohibit smoking
Tobacco Use Supplement-Current Population Survey (TUS-CPS), Census/DOL/BLS/NIH/NCI
TU-13.1 Establish laws in States and the District of Columbia on smoke-free indoor air that prohibit smoking in private worksites
State Tobacco Activities Tracking and Evaluation System (STATE), CDC/NCCDPHP
TU-13.2 Establish laws in States and the District of Columbia on smoke-free indoor air that prohibit smoking in public worksites
State Tobacco Activities Tracking and Evaluation System (STATE), CDC/NCCDPHP
TU-13.3 Establish laws in States and the District of Columbia on smoke-free indoor air that prohibit smoking in restaurants
State Tobacco Activities Tracking and Evaluation System (STATE), CDC/NCCDPHP
TU-13.4 Establish laws in States and the District of Columbia on smoke-free indoor air that prohibit smoking in bars
State Tobacco Activities Tracking and Evaluation System (STATE), CDC/NCCDPHP
TU-13.5 Establish laws in States and the District of Columbia on smoke-free indoor air that prohibit smoking in gaming halls
State Tobacco Activities Tracking and Evaluation System (STATE), CDC/NCCDPHP
TU-13.6 Establish laws in States and the District of Columbia on smoke-free indoor air that prohibit smoking in commercial daycare centers
State Tobacco Activities Tracking and Evaluation System (STATE), CDC/NCCDPHP
TU-13.7 Establish laws in States and the District of Columbia on smoke-free indoor air that prohibit smoking in home-based daycare centers
State Tobacco Activities Tracking and Evaluation System (STATE), CDC/NCCDPHP
TU-13.8 Establish laws in States and the District of Columbia on smoke-free indoor air that prohibit smoking in public transportation
State Tobacco Activities Tracking and Evaluation System (STATE), CDC/NCCDPHP
Table 41–1. Tobacco Use Objectives—ContinuedLEGEND
Data for this objective are available in this chapter’s Midcourse Progress Table.
Disparities data for this objective are available, and this chapter includes a Midcourse Health Disparities Table.
A state or county level map for this objective is available at the end of the chapter.
Not ApplicableMidcourse data availability is not applicable for developmental and archived objectives. Developmental objectives did not have a national baseline value. Archived objectives are no longer being monitored due to lack of data source, changes in science, or replacement with other objectives.
41–12 HEALTHY PEOPLE 2020 MIDCOURSE REVIEW
Objective Number Objective Statement Data Sources
Midcourse Data Availability
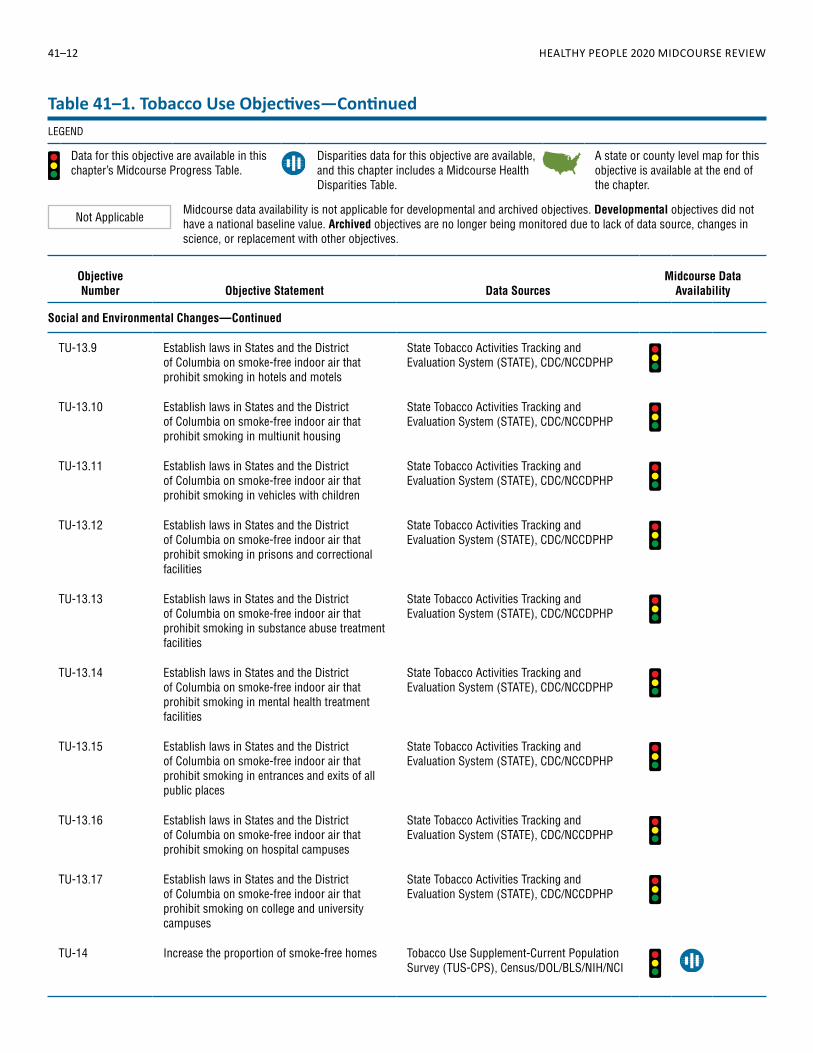
Social and Environmental Changes—Continued
TU-13.9 Establish laws in States and the District of Columbia on smoke-free indoor air that prohibit smoking in hotels and motels
State Tobacco Activities Tracking and Evaluation System (STATE), CDC/NCCDPHP
TU-13.10 Establish laws in States and the District of Columbia on smoke-free indoor air that prohibit smoking in multiunit housing
State Tobacco Activities Tracking and Evaluation System (STATE), CDC/NCCDPHP
TU-13.11 Establish laws in States and the District of Columbia on smoke-free indoor air that prohibit smoking in vehicles with children
State Tobacco Activities Tracking and Evaluation System (STATE), CDC/NCCDPHP
TU-13.12 Establish laws in States and the District of Columbia on smoke-free indoor air that prohibit smoking in prisons and correctional facilities
State Tobacco Activities Tracking and Evaluation System (STATE), CDC/NCCDPHP
TU-13.13 Establish laws in States and the District of Columbia on smoke-free indoor air that prohibit smoking in substance abuse treatment facilities
State Tobacco Activities Tracking and Evaluation System (STATE), CDC/NCCDPHP
TU-13.14 Establish laws in States and the District of Columbia on smoke-free indoor air that prohibit smoking in mental health treatment facilities
State Tobacco Activities Tracking and Evaluation System (STATE), CDC/NCCDPHP
TU-13.15 Establish laws in States and the District of Columbia on smoke-free indoor air that prohibit smoking in entrances and exits of all public places
State Tobacco Activities Tracking and Evaluation System (STATE), CDC/NCCDPHP
TU-13.16 Establish laws in States and the District of Columbia on smoke-free indoor air that prohibit smoking on hospital campuses
State Tobacco Activities Tracking and Evaluation System (STATE), CDC/NCCDPHP
TU-13.17 Establish laws in States and the District of Columbia on smoke-free indoor air that prohibit smoking on college and university campuses
State Tobacco Activities Tracking and Evaluation System (STATE), CDC/NCCDPHP
TU-14 Increase the proportion of smoke-free homes Tobacco Use Supplement-Current Population Survey (TUS-CPS), Census/DOL/BLS/NIH/NCI
Table 41–1. Tobacco Use Objectives—ContinuedLEGEND
Data for this objective are available in this chapter’s Midcourse Progress Table.
Disparities data for this objective are available, and this chapter includes a Midcourse Health Disparities Table.
A state or county level map for this objective is available at the end of the chapter.
Not ApplicableMidcourse data availability is not applicable for developmental and archived objectives. Developmental objectives did not have a national baseline value. Archived objectives are no longer being monitored due to lack of data source, changes in science, or replacement with other objectives.
Chapter 41 • Tobacco Use 41–13
Objective Number Objective Statement Data Sources
Midcourse Data Availability
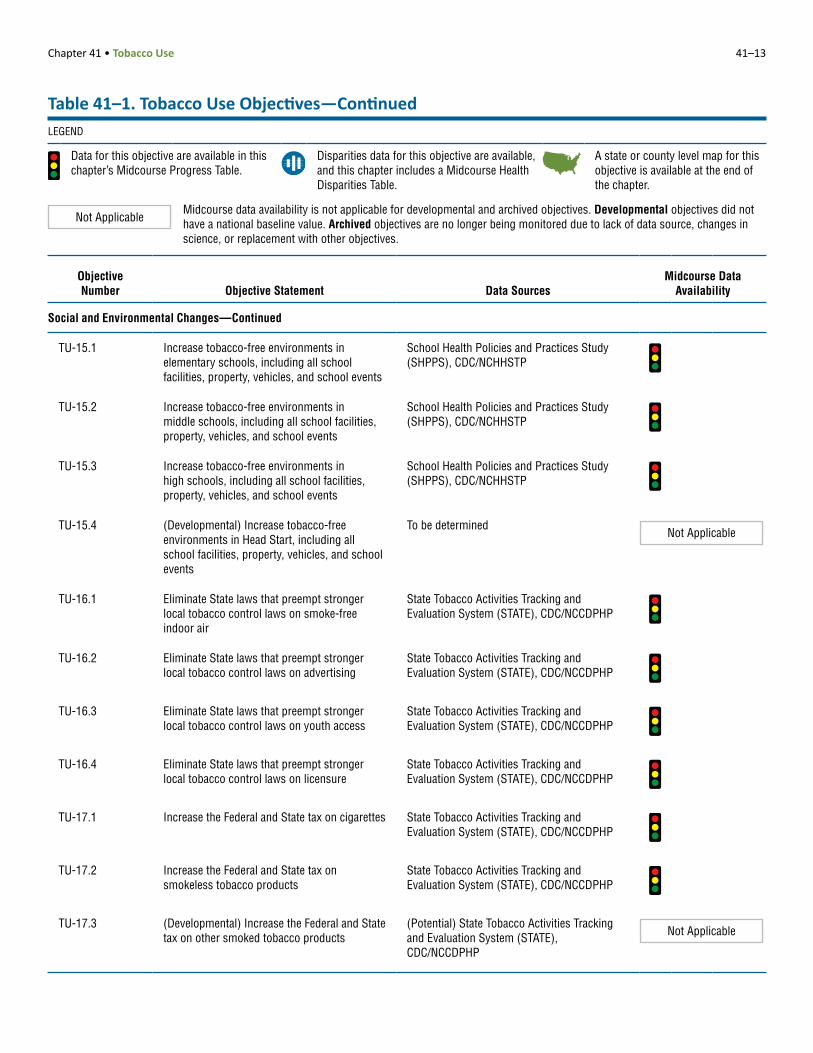
Social and Environmental Changes—Continued
TU-15.1 Increase tobacco-free environments in elementary schools, including all school facilities, property, vehicles, and school events
School Health Policies and Practices Study (SHPPS), CDC/NCHHSTP
TU-15.2 Increase tobacco-free environments in middle schools, including all school facilities, property, vehicles, and school events
School Health Policies and Practices Study (SHPPS), CDC/NCHHSTP
TU-15.3 Increase tobacco-free environments in high schools, including all school facilities, property, vehicles, and school events
School Health Policies and Practices Study (SHPPS), CDC/NCHHSTP
TU-15.4 (Developmental) Increase tobacco-free environments in Head Start, including all school facilities, property, vehicles, and school events
To be determinedNot Applicable
TU-16.1 Eliminate State laws that preempt stronger local tobacco control laws on smoke-free indoor air
State Tobacco Activities Tracking and Evaluation System (STATE), CDC/NCCDPHP
TU-16.2 Eliminate State laws that preempt stronger local tobacco control laws on advertising
State Tobacco Activities Tracking and Evaluation System (STATE), CDC/NCCDPHP
TU-16.3 Eliminate State laws that preempt stronger local tobacco control laws on youth access
State Tobacco Activities Tracking and Evaluation System (STATE), CDC/NCCDPHP
TU-16.4 Eliminate State laws that preempt stronger local tobacco control laws on licensure
State Tobacco Activities Tracking and Evaluation System (STATE), CDC/NCCDPHP
TU-17.1 Increase the Federal and State tax on cigarettes State Tobacco Activities Tracking and Evaluation System (STATE), CDC/NCCDPHP
TU-17.2 Increase the Federal and State tax on smokeless tobacco products
State Tobacco Activities Tracking and Evaluation System (STATE), CDC/NCCDPHP
TU-17.3 (Developmental) Increase the Federal and State tax on other smoked tobacco products
(Potential) State Tobacco Activities Tracking and Evaluation System (STATE), CDC/NCCDPHP
Not Applicable
Table 41–1. Tobacco Use Objectives—ContinuedLEGEND
Data for this objective are available in this chapter’s Midcourse Progress Table.
Disparities data for this objective are available, and this chapter includes a Midcourse Health Disparities Table.
A state or county level map for this objective is available at the end of the chapter.
Not ApplicableMidcourse data availability is not applicable for developmental and archived objectives. Developmental objectives did not have a national baseline value. Archived objectives are no longer being monitored due to lack of data source, changes in science, or replacement with other objectives.
41–14 HEALTHY PEOPLE 2020 MIDCOURSE REVIEW
Objective Number Objective Statement Data Sources
Midcourse Data Availability
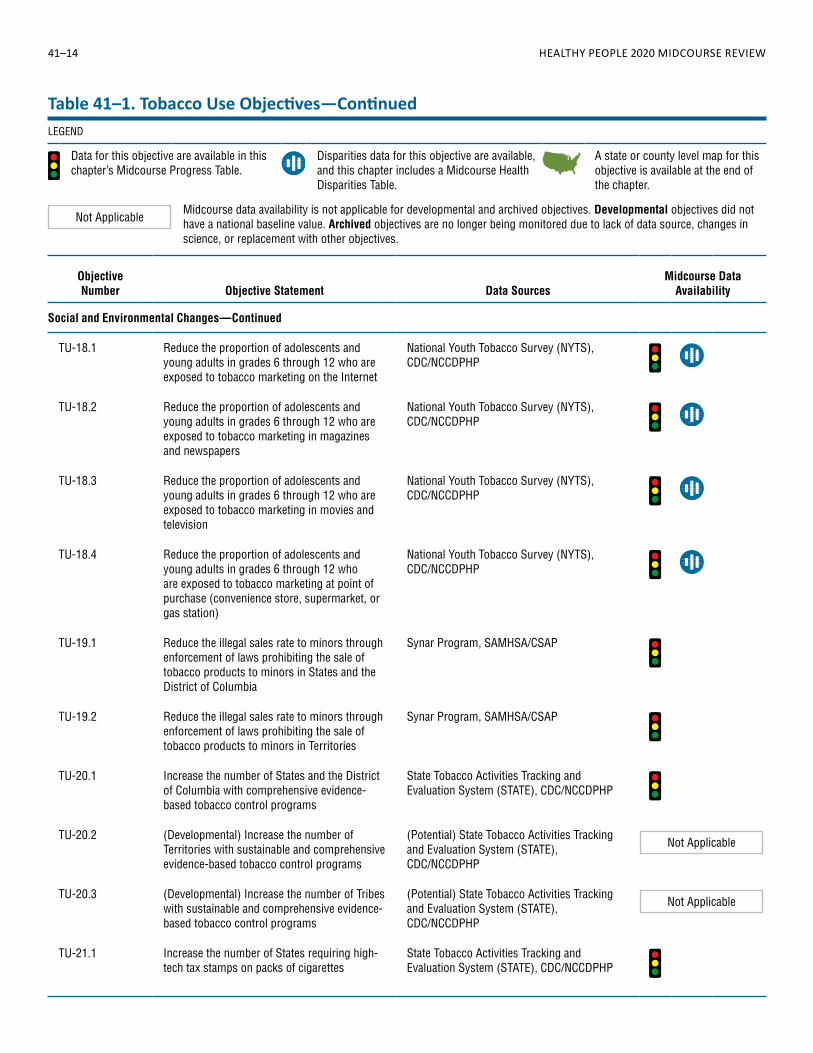
Social and Environmental Changes—Continued
TU-18.1 Reduce the proportion of adolescents and young adults in grades 6 through 12 who are exposed to tobacco marketing on the Internet
National Youth Tobacco Survey (NYTS), CDC/NCCDPHP
TU-18.2 Reduce the proportion of adolescents and young adults in grades 6 through 12 who are exposed to tobacco marketing in magazines and newspapers
National Youth Tobacco Survey (NYTS), CDC/NCCDPHP
TU-18.3 Reduce the proportion of adolescents and young adults in grades 6 through 12 who are exposed to tobacco marketing in movies and television
National Youth Tobacco Survey (NYTS), CDC/NCCDPHP
TU-18.4 Reduce the proportion of adolescents and young adults in grades 6 through 12 who are exposed to tobacco marketing at point of purchase (convenience store, supermarket, or gas station)
National Youth Tobacco Survey (NYTS), CDC/NCCDPHP
TU-19.1 Reduce the illegal sales rate to minors through enforcement of laws prohibiting the sale of tobacco products to minors in States and the District of Columbia
Synar Program, SAMHSA/CSAP
TU-19.2 Reduce the illegal sales rate to minors through enforcement of laws prohibiting the sale of tobacco products to minors in Territories
Synar Program, SAMHSA/CSAP
TU-20.1 Increase the number of States and the District of Columbia with comprehensive evidence-based tobacco control programs
State Tobacco Activities Tracking and Evaluation System (STATE), CDC/NCCDPHP
TU-20.2 (Developmental) Increase the number of Territories with sustainable and comprehensive evidence-based tobacco control programs
(Potential) State Tobacco Activities Tracking and Evaluation System (STATE), CDC/NCCDPHP
Not Applicable
TU-20.3 (Developmental) Increase the number of Tribes with sustainable and comprehensive evidence-based tobacco control programs
(Potential) State Tobacco Activities Tracking and Evaluation System (STATE), CDC/NCCDPHP
Not Applicable
TU-21.1 Increase the number of States requiring high-tech tax stamps on packs of cigarettes
State Tobacco Activities Tracking and Evaluation System (STATE), CDC/NCCDPHP
Table 41–1. Tobacco Use Objectives—ContinuedLEGEND
Data for this objective are available in this chapter’s Midcourse Progress Table.
Disparities data for this objective are available, and this chapter includes a Midcourse Health Disparities Table.
A state or county level map for this objective is available at the end of the chapter.
Not ApplicableMidcourse data availability is not applicable for developmental and archived objectives. Developmental objectives did not have a national baseline value. Archived objectives are no longer being monitored due to lack of data source, changes in science, or replacement with other objectives.
Chapter 41 • Tobacco Use 41–15
Table 41–2. Midcourse Progress for Measurable1 Tobacco Use ObjectivesLEGEND
Target met or exceeded2,3 Improving4,5 Little or no
detectable change6–10 Getting worse11,12 Baseline only13
Informational14
Objective Description
Baseline Value (Year)
Midcourse Value (Year) Target
Movement Toward Target15
Movement Away From Baseline16
Movement Statistically Significant17
Tobacco Use
4 TU-1.1 Adult cigarette smoking (age-adjusted, percent, 18+ years)
20.6% (2008)
17.0% (2014)
12.0% 41.9% Yes
11 TU-1.2 Adult use of smokeless tobacco products (age-adjusted, percent, 18+ years)
2.3% (2005)
2.7% (2010)
0.3% 17.4%
Yes
11 TU-1.3 Adult cigar smoking (age-adjusted, percent, 18+ years)
2.2% (2005)
2.5% (2010)
0.2% 13.6%
Yes
4 TU-2.1 Adolescent tobacco use in past 30 days (percent, grades 9–12)
26.0% (2009)
22.4% (2013)
21.0% 72.0% Yes
2 TU-2.2 Adolescent cigarette smoking in past 30 days (percent, grades 9–12)
19.5% (2009)
15.7% (2013)
16.0% 108.6% Yes
6 TU-2.3 Adolescent use of smokeless tobacco in past 30 days (percent, grades 9–12)
8.9% (2009)
8.8% (2013)
6.9% 5.0% No
6 TU-2.4 Adolescent cigar smoking in past 30 days (percent, grades 9–12)
14.0% (2009)
12.6% (2013)
8.0% 23.3% No
2 TU-3.1 Children and adolescents initiating use of tobacco products in past 12 months (percent, 12–17 years)
7.8% (2008)
5.6% (2013)
5.8% 110.0% Yes
2 TU-3.2 Children and adolescents initiating cigarette smoking in past 12 months (percent, 12–17 years)
6.3% (2008)
4.3% (2013)
4.3% 100.0% Yes
4 TU-3.3 Children and adolescents initiating use of smokeless tobacco in past 12 months (percent, 12–17 years)
2.6% (2008)
2.0% (2013)
0.6% 30.0% Yes
4 TU-3.4 Children and adolescents initiating cigar smoking in past 12 months (percent, 12–17 years)
4.9% (2008)
3.1% (2013)
2.9% 90.0% Yes
4 TU-3.5 Young adults initiating use of tobacco products in past 12 months (percent, 18–25 years)
10.9% (2008)
9.2% (2013)
8.9% 85.0% Yes
4 TU-3.6 Young adults initiating cigarette smoking in past 12 months (percent, 18–25 years)
8.4% (2008)
6.6% (2013)
6.4% 90.0% Yes
4 TU-3.7 Young adults initiating use of smokeless tobacco in past 12 months (percent, 18–25 years)
2.2% (2008)
1.8% (2013)
0.2% 20.0% Yes
6 TU-3.8 Young adults initiating cigar smoking in past 12 months (percent, 18–25 years)
6.3% (2008)
5.9% (2013)
4.3% 20.0% No
41–16 HEALTHY PEOPLE 2020 MIDCOURSE REVIEW
Objective Description
Baseline Value (Year)
Midcourse Value (Year) Target
Movement Toward Target15
Movement Away From Baseline16
Movement Statistically Significant17
Tobacco Use—Continued
4 TU-4.1 Adult smokers attempting smoking cessation in past 12 months (age-adjusted, percent, 18+ years)
48.3% (2008)
52.1% (2014)
80.0% 12.0% Yes
4 TU-5.1 Adult smokers who successfully stopped smoking within past 6 months to 1 year (age-adjusted, percent, 18+ years)
6.0% (2008)
7.6% (2014)
8.0% 80.0% Yes
4 TU-6 Pregnant female smokers ceasing smoking during first trimester and remainder of pregnancy (percent, 18–49 years)
11.3% (2005)
18.9% (2010)
30.0% 40.6% Yes
8 TU-7 Adolescent smokers attempting smoking cessation in past 12 months (percent, grades 9–12)
58.5% (2009)
55.7% (2013)
64.0% 4.8%
No
Health Systems Changes
7 TU-8 Medicaid coverage of treatment for nicotine dependency (number of states and D.C.)
6 (2008)
9 (2014)
51 6.7%
4 TU-9.1 Visits to office-based ambulatory care settings that include tobacco screening (percent, 18+ years)
62.4% (2007)
67.7% (2010)
68.6% 85.5% Yes
6 TU-9.2 Visits to hospital ambulatory care settings that include tobacco screening (percent, 18+ years)
60.2% (2007)
64.5% (2010)
66.2% 71.7% No
8 TU-9.3 General practice dentists who ask patients if they use tobacco (percent)
52.9% (2010)
51.8% (2013)
58.2% 2.1%
No
2 TU-9.4 Tobacco screening in substance abuse care settings (percent)
49.8% (2011)
55.7% (2012)
54.8% 118.0%
8 TU-10.1 Visits to office-based ambulatory care settings that include cessation counseling for tobacco users (percent, 18+ years)
19.2% (2007)
19.1% (2010)
21.1% 0.5%
No
8 TU-10.2 Visits to hospital ambulatory care settings that include cessation counseling for tobacco users (percent, 18+ years)
22.6% (2007)
19.7% (2010)
24.9% 12.8%
No
8 TU-10.3 General practice dentists who offer tobacco cessation counseling to patients (percent)
35.7% (2010)
34.0% (2013)
39.3% 4.8%
No
2 TU-10.4 Tobacco cessation counseling in substance abuse care settings (percent)
34.2% (2011)
39.0% (2012)
37.6% 141.2%
13 TU-10.5 Tobacco cessation counseling in mental health care settings (percent of facilities)
24.0% (2010)
26.4%
Table 41–2. Midcourse Progress for Measurable1 Tobacco Use Objectives—ContinuedLEGEND
Target met or exceeded2,3 Improving4,5 Little or no
detectable change6–10 Getting worse11,12 Baseline only13
Informational14
Chapter 41 • Tobacco Use 41–17
Objective Description
Baseline Value (Year)
Midcourse Value (Year) Target
Movement Toward Target15
Movement Away From Baseline16
Movement Statistically Significant17
Social and Environmental Changes
2 TU-11.1 Children exposed to secondhand smoke (percent, nonsmokers, 3–11 years)
52.2% (2005–2008)
41.3% (2009–2012)
47.0% 209.6% Yes
2 TU-11.2 Adolescents exposed to secondhand smoke (percent, nonsmokers, 12–17 years)
45.5% (2005–2008)
33.6% (2009–2012)
41.0% 264.4% No
2 TU-11.3 Adults exposed to secondhand smoke (age-adjusted, percent, nonsmokers, 18+ years)
37.6% (2005–2008)
25.5% (2009–2012)
33.8% 318.4% Yes
13 TU-12 Persons covered by indoor worksite policies prohibiting smoking (percent, 18+ years)
83.4% (2010–2011)
100%
5 TU-13.1 State laws prohibiting smoking in private worksites (number of states and D.C.)
30 (2009)
34 (2014)
51 19.0%
5 TU-13.2 State laws prohibiting smoking in public worksites (number of states and D.C.)
34 (2009)
38 (2014)
51 23.5%
5 TU-13.3 State laws prohibiting smoking in restaurants (number of states and D.C.)
28 (2009)
34 (2014)
51 26.1%
5 TU-13.4 State laws prohibiting smoking in bars (number of states and D.C.)
22 (2009)
28 (2014)
51 20.7%
5 TU-13.5 State laws prohibiting smoking in gaming halls (number of states and D.C.)
25 (2009)
28 (2014)
51 11.5%
5 TU-13.6 State laws prohibiting smoking in commercial daycare centers (number of states and D.C.)
38 (2009)
41 (2014)
51 23.1%
7 TU-13.7 State laws prohibiting smoking in home-based daycare centers (number of states and D.C.)
37 (2009)
38 (2014)
51 7.1%
5 TU-13.8 State laws prohibiting smoking in public transportation (number of states and D.C.)
37 (2009)
40 (2014)
51 21.4%
7 TU-13.9 State laws prohibiting smoking in hotels and motels (number of states and D.C.)
0 (2009)
3 (2014)
51 5.9%
10 TU-13.10 State laws prohibiting smoking in multiunit housing (number of states and D.C.)
0 (2009)
0 (2014)
51 0.0%
7 TU-13.11 State laws prohibiting smoking in vehicles with children (number of states and D.C.)
4 (2009)
7 (2014)
51 6.4%
7 TU-13.12 State laws prohibiting smoking in prisons and correctional facilities (number of states and D.C.)
8 (2009)
10 (2014)
51 4.7%
Table 41–2. Midcourse Progress for Measurable1 Tobacco Use Objectives—ContinuedLEGEND
Target met or exceeded2,3 Improving4,5 Little or no
detectable change6–10 Getting worse11,12 Baseline only13
Informational14

41–18 HEALTHY PEOPLE 2020 MIDCOURSE REVIEW
Objective Description
Baseline Value (Year)
Midcourse Value (Year) Target
Movement Toward Target15
Movement Away From Baseline16
Movement Statistically Significant17
Social and Environmental Changes—Continued
7 TU-13.13 State laws prohibiting smoking in substance abuse treatment facilities (number of states and D.C.)
10 (2009)
13 (2014)
51 7.3%
7 TU-13.14 State laws prohibiting smoking in mental health treatment facilities (number of states and D.C.)
10 (2009)
13 (2014)
51 7.3%
10 TU-13.15 State laws prohibiting smoking at entrances and exits of all public places (number of states and D.C.)
1 (2009)
1 (2014)
51 0.0%
7 TU-13.16 State laws prohibiting smoking on hospital campuses (number of states and D.C.)
1 (2009)
2 (2014)
51 2.0%
10 TU-13.17 State laws prohibiting smoking on college and university campuses (number of states and D.C.)
1 (2009)
1 (2014)
51 0.0%
4 TU-14 Adults living in smoke-free homes (percent, 18+ years)
79.1% (2006–2007)
83.9% (2010–2011)
87.0% 60.8% Yes
8 TU-15.1 Tobacco-free environments in elementary schools (percent)
65.4% (2006)
61.2% (2014)
100% 6.4%
No
6 TU-15.2 Tobacco-free environments in middle schools (percent)
58.7% (2006)
66.2% (2014)
100% 18.2% No
4 TU-15.3 Tobacco-free environments in high schools (percent)
66.1% (2006)
74.5% (2014)
100% 24.8% Yes
10 TU-16.1 State laws preempting stronger local laws on smoke-free indoor air (number of states and D.C.)
12 (2009)
12 (2014)
0 0.0%
10 TU-16.2 State laws preempting stronger local laws on tobacco advertising (number of states and D.C.)
18 (2009)
18 (2014)
0 0.0%
10 TU-16.3 State laws preempting stronger local laws on youth access to tobacco (number of states and D.C.)
22 (2009)
22 (2014)
0 0.0%
10 TU-16.4 State laws preempting stronger local laws on licensure (number of states and D.C.)
9 (2009)
9 (2014)
0 0.0%
7 TU-17.1 Increases of $1.50 in taxes on cigarettes (number of States, D.C., and federal government)
1 (2010)
2 (2014)
52 2.0%
10 TU-17.2 Increases of $1.50 in taxes on smokeless tobacco products (number of States, D.C., and federal government)
0 (2010)
0 (2014)
52 0.0%
Table 41–2. Midcourse Progress for Measurable1 Tobacco Use Objectives—ContinuedLEGEND
Target met or exceeded2,3 Improving4,5 Little or no
detectable change6–10 Getting worse11,12 Baseline only13
Informational14
Chapter 41 • Tobacco Use 41–19
Objective Description
Baseline Value (Year)
Midcourse Value (Year) Target
Movement Toward Target15
Movement Away From Baseline16
Movement Statistically Significant17
Social and Environmental Changes—Continued
11 TU-18.1 Adolescents and young adults exposed to tobacco marketing on the Internet (percent, grades 6–12)
36.8% (2009)
44.9% (2013)
33.1% 22.0%
Yes
4 TU-18.2 Adolescents and young adults exposed to tobacco marketing in magazines and newspapers (percent, grades 6–12)
48.6% (2009)
46.3% (2013)
19.3% 7.8% Yes
4 TU-18.3 Adolescents and young adults exposed to tobacco marketing in movies and television (percent, grades 6–12)
77.6% (2009)
72.6% (2013)
69.8% 64.1% Yes
4 TU-18.4 Adolescents and young adults exposed to tobacco marketing at point of purchase (percent, grades 6–12)
85.7% (2009)
80.7% (2013)
77.1% 58.1% Yes
5 TU-19.1 States with 5% or less of illegal tobacco sales rate to minors (number of states and D.C.)
5 (2009)
10 (2013)
51 10.9%
10 TU-19.2 Territories with 5% or less of illegal tobacco sales rate to minors (number)
1 (2009)
1 (2013)
8 0.0%
5 TU-20.1 States with comprehensive evidence-based tobacco control programs (number of states and D.C.)
10 (2009)
16 (2011)
51 14.6%
7 TU-21.1 High-tech tax stamps on packs of cigarettes (number of states and D.C.)
2 (2009)
4 (2014)
51 4.1%
NOTES
See HealthyPeople.gov for all Healthy People 2020 data. The Technical Notes provide more information on the measures of progress.
FOOTNOTES1Measurable objectives had a national baseline value.Target met or exceeded:
2At baseline the target was not met or exceeded and the midcourse value was equal to or exceeded the target. (The percentage of targeted change achieved was equal to or greater than 100%.)3The baseline and midcourse values were equal to or exceeded the target. (The percentage of targeted change achieved was not assessed.)
Improving:4Movement was toward the target, standard errors were available, and the percentage of targeted change achieved was statistically significant.5Movement was toward the target, standard errors were not available, and the objective had achieved 10% or more of the targeted change.
Little or no detectable change:6Movement was toward the target, standard errors were available, and the percentage of targeted change achieved was not statistically significant.7Movement was toward the target, standard errors were not available, and the objective had achieved less than 10% of the targeted change.8Movement was away from the baseline and target, standard errors were available, and the percentage change relative to the baseline was not statistically significant.
FOOTNOTES—Continued9Movement was away from the baseline and target, standard errors were not available, and the objective had moved less than 10% relative to the baseline.10There was no change between the baseline and the midcourse data point.
Getting worse:11Movement was away from the baseline and target, standard errors were available, and the percentage change relative to the baseline was statistically significant.12Movement was away from the baseline and target, standard errors were not available, and the objective had moved 10% or more relative to the baseline.
13Baseline only: The objective only had one data point, so progress toward target attainment could not be assessed.14Informational: A target was not set for this objective, so progress toward target attainment could not be assessed.15For objectives that moved toward their targets, movement toward the target was measured as the percentage of targeted change achieved (unless the target was already met or exceeded at baseline):
Percentage of targeted = Midcourse value – Baseline value
× 100change achieved HP2020 target – Baseline value
16For objectives that moved away from their baselines and targets, movement away from the baseline was measured as the magnitude of the percentage change from baseline:
Magnitude of percentage = | Midcourse value – Baseline value |
× 100change from baseline Baseline value
Table 41–2. Midcourse Progress for Measurable1 Tobacco Use Objectives—ContinuedLEGEND
Target met or exceeded2,3 Improving4,5 Little or no
detectable change6–10 Getting worse11,12 Baseline only13
Informational14
41–20 HEALTHY PEOPLE 2020 MIDCOURSE REVIEW
Table 41–2. Midcourse Progress for Measurable1 Tobacco Use Objectives—Continued
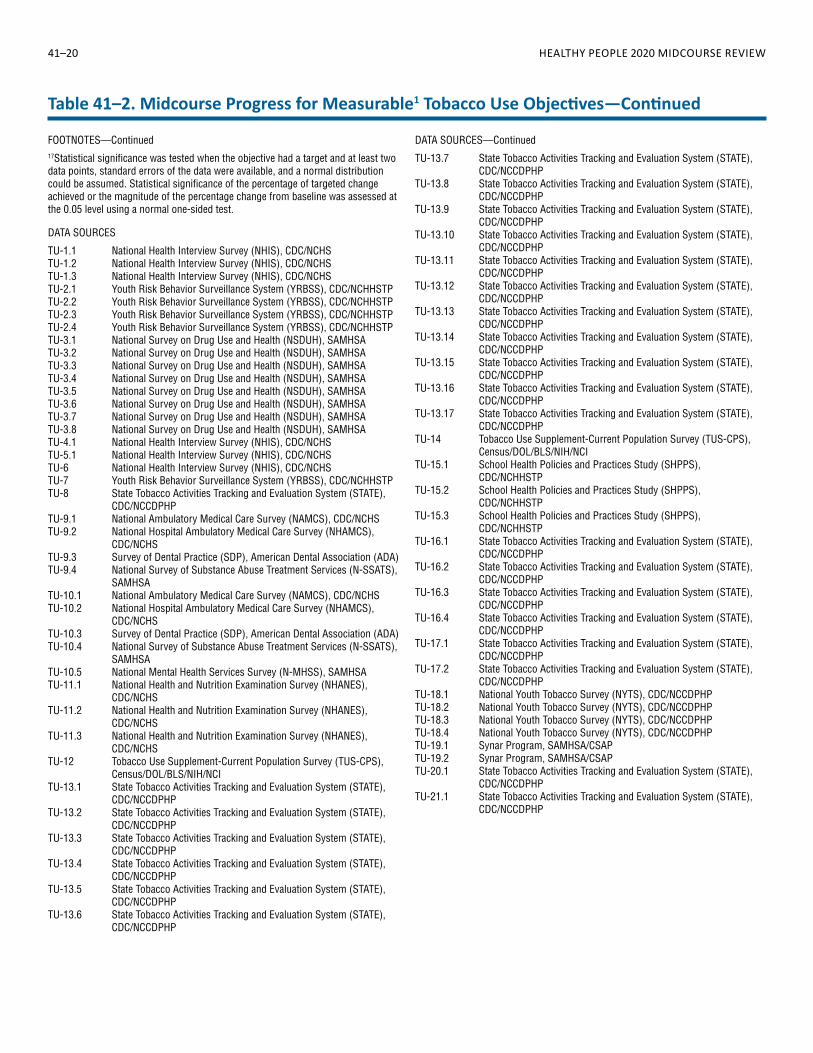
FOOTNOTES—Continued17Statistical significance was tested when the objective had a target and at least two data points, standard errors of the data were available, and a normal distribution could be assumed. Statistical significance of the percentage of targeted change achieved or the magnitude of the percentage change from baseline was assessed at the 0.05 level using a normal one-sided test.
DATA SOURCES
TU-1.1 National Health Interview Survey (NHIS), CDC/NCHSTU-1.2 National Health Interview Survey (NHIS), CDC/NCHSTU-1.3 National Health Interview Survey (NHIS), CDC/NCHSTU-2.1 Youth Risk Behavior Surveillance System (YRBSS), CDC/NCHHSTPTU-2.2 Youth Risk Behavior Surveillance System (YRBSS), CDC/NCHHSTPTU-2.3 Youth Risk Behavior Surveillance System (YRBSS), CDC/NCHHSTPTU-2.4 Youth Risk Behavior Surveillance System (YRBSS), CDC/NCHHSTPTU-3.1 National Survey on Drug Use and Health (NSDUH), SAMHSATU-3.2 National Survey on Drug Use and Health (NSDUH), SAMHSATU-3.3 National Survey on Drug Use and Health (NSDUH), SAMHSATU-3.4 National Survey on Drug Use and Health (NSDUH), SAMHSATU-3.5 National Survey on Drug Use and Health (NSDUH), SAMHSATU-3.6 National Survey on Drug Use and Health (NSDUH), SAMHSATU-3.7 National Survey on Drug Use and Health (NSDUH), SAMHSATU-3.8 National Survey on Drug Use and Health (NSDUH), SAMHSATU-4.1 National Health Interview Survey (NHIS), CDC/NCHSTU-5.1 National Health Interview Survey (NHIS), CDC/NCHSTU-6 National Health Interview Survey (NHIS), CDC/NCHSTU-7 Youth Risk Behavior Surveillance System (YRBSS), CDC/NCHHSTPTU-8 State Tobacco Activities Tracking and Evaluation System (STATE),
CDC/NCCDPHPTU-9.1 National Ambulatory Medical Care Survey (NAMCS), CDC/NCHSTU-9.2 National Hospital Ambulatory Medical Care Survey (NHAMCS),
CDC/NCHSTU-9.3 Survey of Dental Practice (SDP), American Dental Association (ADA)TU-9.4 National Survey of Substance Abuse Treatment Services (N-SSATS),
SAMHSATU-10.1 National Ambulatory Medical Care Survey (NAMCS), CDC/NCHSTU-10.2 National Hospital Ambulatory Medical Care Survey (NHAMCS),
CDC/NCHSTU-10.3 Survey of Dental Practice (SDP), American Dental Association (ADA)TU-10.4 National Survey of Substance Abuse Treatment Services (N-SSATS),
SAMHSATU-10.5 National Mental Health Services Survey (N-MHSS), SAMHSATU-11.1 National Health and Nutrition Examination Survey (NHANES),
CDC/NCHSTU-11.2 National Health and Nutrition Examination Survey (NHANES),
CDC/NCHSTU-11.3 National Health and Nutrition Examination Survey (NHANES),
CDC/NCHSTU-12 Tobacco Use Supplement-Current Population Survey (TUS-CPS),
Census/DOL/BLS/NIH/NCITU-13.1 State Tobacco Activities Tracking and Evaluation System (STATE),
CDC/NCCDPHPTU-13.2 State Tobacco Activities Tracking and Evaluation System (STATE),
CDC/NCCDPHPTU-13.3 State Tobacco Activities Tracking and Evaluation System (STATE),
CDC/NCCDPHPTU-13.4 State Tobacco Activities Tracking and Evaluation System (STATE),
CDC/NCCDPHPTU-13.5 State Tobacco Activities Tracking and Evaluation System (STATE),
CDC/NCCDPHPTU-13.6 State Tobacco Activities Tracking and Evaluation System (STATE),
CDC/NCCDPHP
DATA SOURCES—Continued
TU-13.7 State Tobacco Activities Tracking and Evaluation System (STATE), CDC/NCCDPHP
TU-13.8 State Tobacco Activities Tracking and Evaluation System (STATE), CDC/NCCDPHP
TU-13.9 State Tobacco Activities Tracking and Evaluation System (STATE), CDC/NCCDPHP
TU-13.10 State Tobacco Activities Tracking and Evaluation System (STATE), CDC/NCCDPHP
TU-13.11 State Tobacco Activities Tracking and Evaluation System (STATE), CDC/NCCDPHP
TU-13.12 State Tobacco Activities Tracking and Evaluation System (STATE), CDC/NCCDPHP
TU-13.13 State Tobacco Activities Tracking and Evaluation System (STATE), CDC/NCCDPHP
TU-13.14 State Tobacco Activities Tracking and Evaluation System (STATE), CDC/NCCDPHP
TU-13.15 State Tobacco Activities Tracking and Evaluation System (STATE), CDC/NCCDPHP
TU-13.16 State Tobacco Activities Tracking and Evaluation System (STATE), CDC/NCCDPHP
TU-13.17 State Tobacco Activities Tracking and Evaluation System (STATE), CDC/NCCDPHP
TU-14 Tobacco Use Supplement-Current Population Survey (TUS-CPS), Census/DOL/BLS/NIH/NCI
TU-15.1 School Health Policies and Practices Study (SHPPS), CDC/NCHHSTP
TU-15.2 School Health Policies and Practices Study (SHPPS), CDC/NCHHSTP
TU-15.3 School Health Policies and Practices Study (SHPPS), CDC/NCHHSTP
TU-16.1 State Tobacco Activities Tracking and Evaluation System (STATE), CDC/NCCDPHP
TU-16.2 State Tobacco Activities Tracking and Evaluation System (STATE), CDC/NCCDPHP
TU-16.3 State Tobacco Activities Tracking and Evaluation System (STATE), CDC/NCCDPHP
TU-16.4 State Tobacco Activities Tracking and Evaluation System (STATE), CDC/NCCDPHP
TU-17.1 State Tobacco Activities Tracking and Evaluation System (STATE), CDC/NCCDPHP
TU-17.2 State Tobacco Activities Tracking and Evaluation System (STATE), CDC/NCCDPHP
TU-18.1 National Youth Tobacco Survey (NYTS), CDC/NCCDPHPTU-18.2 National Youth Tobacco Survey (NYTS), CDC/NCCDPHPTU-18.3 National Youth Tobacco Survey (NYTS), CDC/NCCDPHPTU-18.4 National Youth Tobacco Survey (NYTS), CDC/NCCDPHPTU-19.1 Synar Program, SAMHSA/CSAPTU-19.2 Synar Program, SAMHSA/CSAPTU-20.1 State Tobacco Activities Tracking and Evaluation System (STATE),
CDC/NCCDPHPTU-21.1 State Tobacco Activities Tracking and Evaluation System (STATE),
CDC/NCCDPHP
Chapter 41 • Tobacco Use
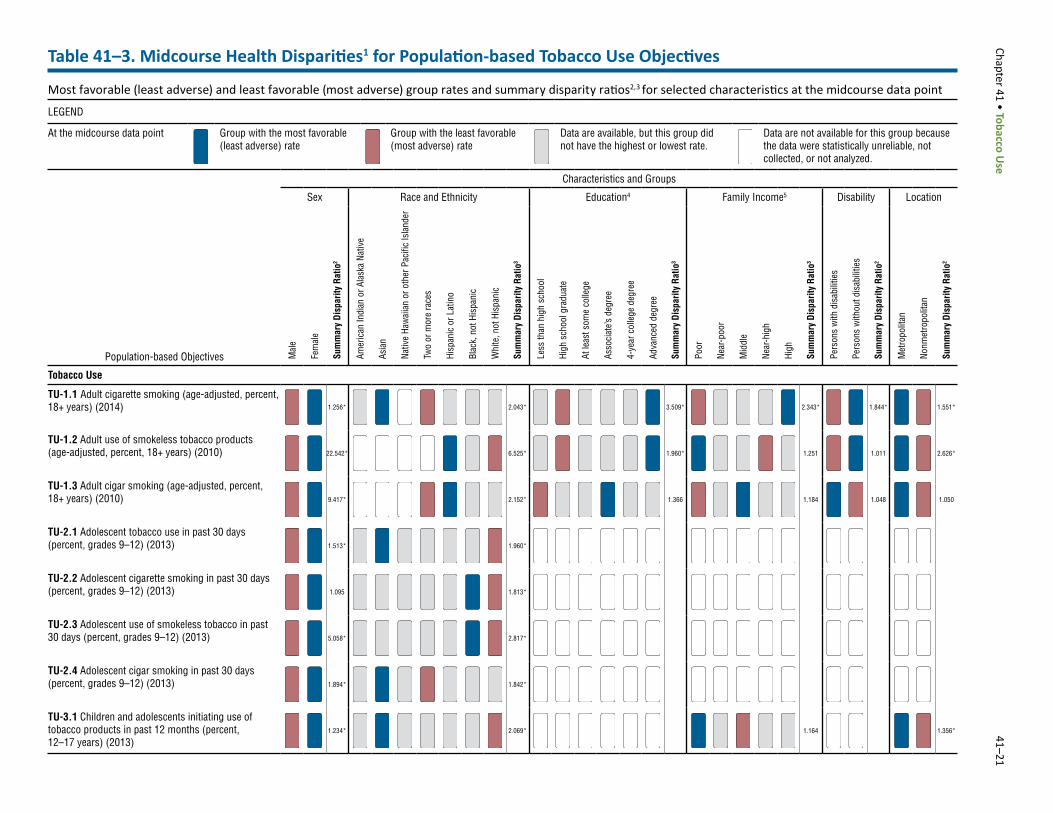
41–21Table 41–3. Midcourse Health Disparities1 for Population-based Tobacco Use Objectives
Most favorable (least adverse) and least favorable (most adverse) group rates and summary disparity ratios2,3 for selected characteristics at the midcourse data point
LEGEND
At the midcourse data point Group with the most favorable (least adverse) rate
Group with the least favorable (most adverse) rate
Data are available, but this group did not have the highest or lowest rate.
Data are not available for this group because the data were statistically unreliable, not collected, or not analyzed.
Population-based Objectives
Characteristics and Groups
Sex Race and Ethnicity Education4 Family Income5 Disability Location
Mal
e
Fem
ale
Sum
mar
y Di
spar
ity R
atio
2
Amer
ican
Indi
an o
r Ala
ska
Nativ
e
Asia
n
Nativ
e Ha
wai
ian
or o
ther
Pac
ific
Isla
nder
Two
or m
ore
race
s
Hisp
anic
or L
atin
o
Blac
k, n
ot H
ispa
nic
Whi
te, n
ot H
ispa
nic
Sum
mar
y Di
spar
ity R
atio
3
Less
than
hig
h sc
hool
High
sch
ool g
radu
ate
At le
ast s
ome
colle
ge
Asso
ciat
e’s d
egre
e
4-ye
ar c
olle
ge d
egre
e
Adva
nced
deg
ree
Sum
mar
y Di
spar
ity R
atio
3
Poor
Near
-poo
r
Mid
dle
Near
-hig
h
High
Sum
mar
y Di
spar
ity R
atio
3
Pers
ons
with
dis
abili
ties
Pers
ons
with
out d
isab
ilitie
s
Sum
mar
y Di
spar
ity R
atio
2
Met
ropo
litan
Nonm
etro
polit
an
Sum
mar
y Di
spar
ity R
atio
2
Tobacco Use
TU-1.1 Adult cigarette smoking (age-adjusted, percent, 18+ years) (2014) 1.256* 2.043* 3.509* 2.343* 1.844* 1.551*
TU-1.2 Adult use of smokeless tobacco products (age-adjusted, percent, 18+ years) (2010) 22.542* 6.525* 1.960* 1.251 1.011 2.626*
TU-1.3 Adult cigar smoking (age-adjusted, percent, 18+ years) (2010) 9.417* 2.152* 1.366 1.184 1.048 1.050
TU-2.1 Adolescent tobacco use in past 30 days (percent, grades 9–12) (2013) 1.513* 1.960*
TU-2.2 Adolescent cigarette smoking in past 30 days (percent, grades 9–12) (2013) 1.095 1.813*
TU-2.3 Adolescent use of smokeless tobacco in past 30 days (percent, grades 9–12) (2013) 5.058* 2.817*
TU-2.4 Adolescent cigar smoking in past 30 days (percent, grades 9–12) (2013) 1.894* 1.842*
TU-3.1 Children and adolescents initiating use of tobacco products in past 12 months (percent, 12–17 years) (2013)
1.234* 2.069* 1.164 1.356*
41–22 H
EALTHY PEO
PLE 2020 MID
COU
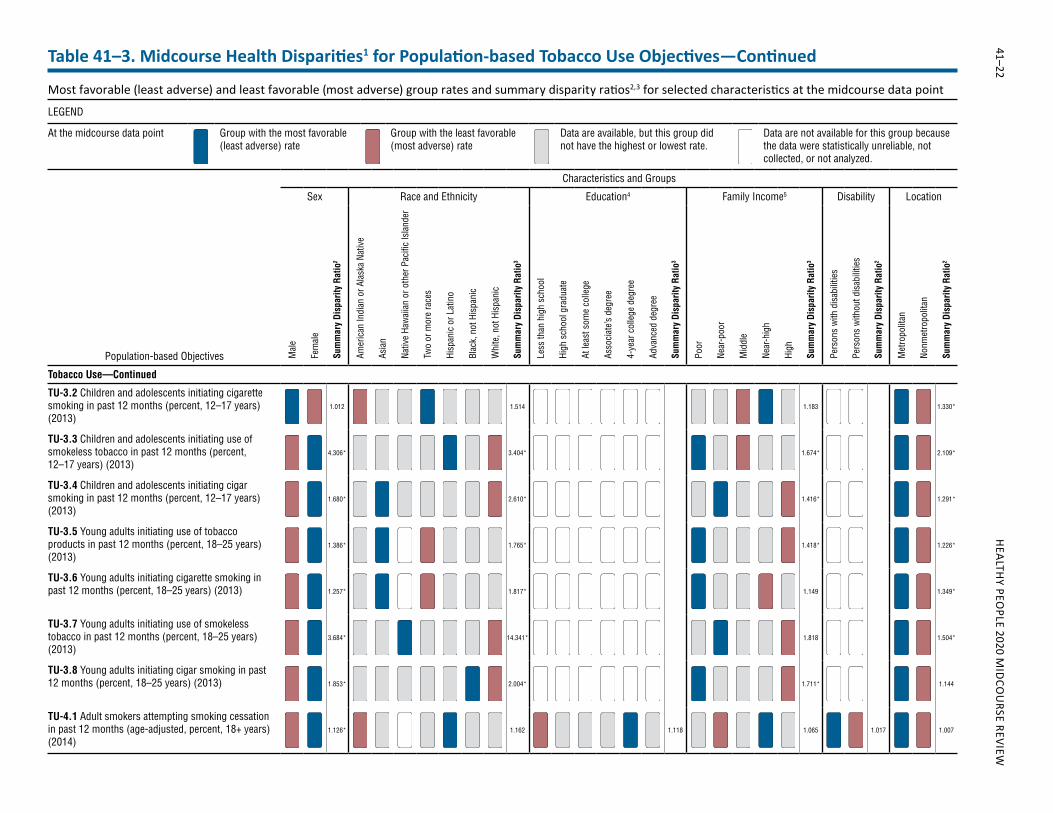
RSE REVIEWTable 41–3. Midcourse Health Disparities1 for Population-based Tobacco Use Objectives—Continued
Most favorable (least adverse) and least favorable (most adverse) group rates and summary disparity ratios2,3 for selected characteristics at the midcourse data point
LEGEND
At the midcourse data point Group with the most favorable (least adverse) rate
Group with the least favorable (most adverse) rate
Data are available, but this group did not have the highest or lowest rate.
Data are not available for this group because the data were statistically unreliable, not collected, or not analyzed.
Population-based Objectives
Characteristics and Groups
Sex Race and Ethnicity Education4 Family Income5 Disability Location
Mal
e
Fem
ale
Sum
mar
y Di
spar
ity R
atio
2
Amer
ican
Indi
an o
r Ala
ska
Nativ
e
Asia
n
Nativ
e Ha
wai
ian
or o
ther
Pac
ific
Isla
nder
Two
or m
ore
race
s
Hisp
anic
or L
atin
o
Blac
k, n
ot H
ispa
nic
Whi
te, n
ot H
ispa
nic
Sum
mar
y Di
spar
ity R
atio
3
Less
than
hig
h sc
hool
High
sch
ool g
radu
ate
At le
ast s
ome
colle
ge
Asso
ciat
e’s d
egre
e
4-ye
ar c
olle
ge d
egre
e
Adva
nced
deg
ree
Sum
mar
y Di
spar
ity R
atio
3
Poor
Near
-poo
r
Mid
dle
Near
-hig
h
High
Sum
mar
y Di
spar
ity R
atio
3
Pers
ons
with
dis
abili
ties
Pers
ons
with
out d
isab
ilitie
s
Sum
mar
y Di
spar
ity R
atio
2
Met
ropo
litan
Nonm
etro
polit
an
Sum
mar
y Di
spar
ity R
atio
2
Tobacco Use—Continued
TU-3.2 Children and adolescents initiating cigarette smoking in past 12 months (percent, 12–17 years) (2013)
1.012 1.514 1.183 1.330*
TU-3.3 Children and adolescents initiating use of smokeless tobacco in past 12 months (percent, 12–17 years) (2013)
4.306* 3.404* 1.674* 2.109*
TU-3.4 Children and adolescents initiating cigar smoking in past 12 months (percent, 12–17 years) (2013)
1.680* 2.610* 1.416* 1.291*
TU-3.5 Young adults initiating use of tobacco products in past 12 months (percent, 18–25 years) (2013)
1.386* 1.765* 1.418* 1.226*
TU-3.6 Young adults initiating cigarette smoking in past 12 months (percent, 18–25 years) (2013) 1.257* 1.817* 1.149 1.349*
TU-3.7 Young adults initiating use of smokeless tobacco in past 12 months (percent, 18–25 years) (2013)
3.684* 14.341* 1.818 1.504*
TU-3.8 Young adults initiating cigar smoking in past 12 months (percent, 18–25 years) (2013) 1.853* 2.004* 1.711* 1.144
TU-4.1 Adult smokers attempting smoking cessation in past 12 months (age-adjusted, percent, 18+ years) (2014)
1.126* 1.162 1.118 1.065 1.017 1.007
Chapter 41 • Tobacco Use
41–23
Population-based Objectives
Characteristics and Groups
Sex Race and Ethnicity Education4 Family Income5 Disability Location
Mal
e
Fem
ale
Sum
mar
y Di
spar
ity R
atio
2
Amer
ican
Indi
an o
r Ala
ska
Nativ
e
Asia
n
Nativ
e Ha
wai
ian
or o
ther
Pac
ific
Isla
nder
Two
or m
ore
race
s
Hisp
anic
or L
atin
o
Blac
k, n
ot H
ispa
nic
Whi
te, n
ot H
ispa
nic
Sum
mar
y Di
spar
ity R
atio
3
Less
than
hig
h sc
hool
High
sch
ool g
radu
ate
At le
ast s
ome
colle
ge
Asso
ciat
e’s d
egre
e
4-ye
ar c
olle
ge d
egre
e
Adva
nced
deg
ree
Sum
mar
y Di
spar
ity R
atio
3
Poor
Near
-poo
r
Mid
dle
Near
-hig
h
High
Sum
mar
y Di
spar
ity R
atio
3
Pers
ons
with
dis
abili
ties
Pers
ons
with
out d
isab
ilitie
s
Sum
mar
y Di
spar
ity R
atio
2
Met
ropo
litan
Nonm
etro
polit
an
Sum
mar
y Di
spar
ity R
atio
2
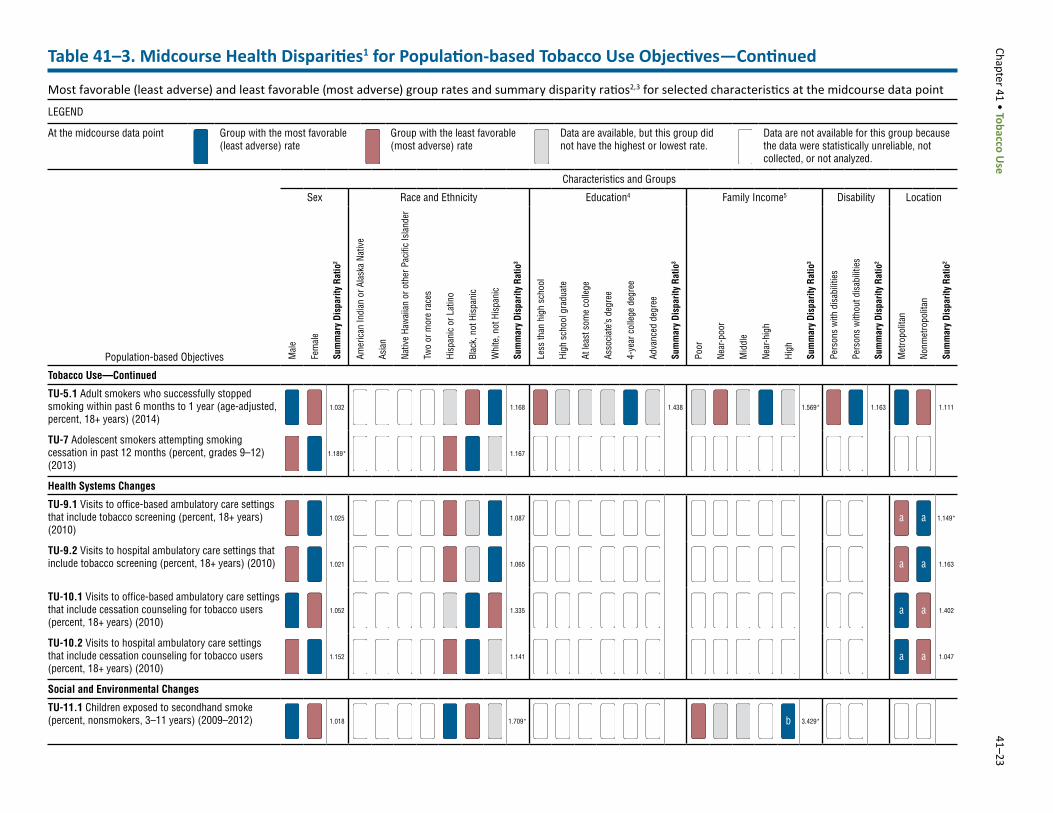
Tobacco Use—Continued
TU-5.1 Adult smokers who successfully stopped smoking within past 6 months to 1 year (age-adjusted, percent, 18+ years) (2014)
1.032 1.168 1.438 1.569* 1.163 1.111
TU-7 Adolescent smokers attempting smoking cessation in past 12 months (percent, grades 9–12) (2013)
1.189* 1.167
Health Systems Changes
TU-9.1 Visits to office-based ambulatory care settings that include tobacco screening (percent, 18+ years) (2010)
1.025 1.087 a a 1.149*
TU-9.2 Visits to hospital ambulatory care settings that include tobacco screening (percent, 18+ years) (2010) 1.021 1.065 a a 1.163
TU-10.1 Visits to office-based ambulatory care settings that include cessation counseling for tobacco users (percent, 18+ years) (2010)
1.052 1.335 a a 1.402
TU-10.2 Visits to hospital ambulatory care settings that include cessation counseling for tobacco users (percent, 18+ years) (2010)
1.152 1.141 a a 1.047
Social and Environmental Changes
TU-11.1 Children exposed to secondhand smoke (percent, nonsmokers, 3–11 years) (2009–2012) 1.018 1.709* b 3.429*
Table 41–3. Midcourse Health Disparities1 for Population-based Tobacco Use Objectives—Continued
Most favorable (least adverse) and least favorable (most adverse) group rates and summary disparity ratios2,3 for selected characteristics at the midcourse data point
LEGEND
At the midcourse data point Group with the most favorable (least adverse) rate
Group with the least favorable (most adverse) rate
Data are available, but this group did not have the highest or lowest rate.
Data are not available for this group because the data were statistically unreliable, not collected, or not analyzed.
41–24 H
EALTHY PEO
PLE 2020 MID
COU
RSE REVIEW
Population-based Objectives
Characteristics and Groups
Sex Race and Ethnicity Education4 Family Income5 Disability Location
Mal
e
Fem
ale
Sum
mar
y Di
spar
ity R
atio
2
Amer
ican
Indi
an o
r Ala
ska
Nativ
e
Asia
n
Nativ
e Ha
wai
ian
or o
ther
Pac
ific
Isla
nder
Two
or m
ore
race
s
Hisp
anic
or L
atin
o
Blac
k, n
ot H
ispa
nic
Whi
te, n
ot H
ispa
nic
Sum
mar
y Di
spar
ity R
atio
3
Less
than
hig
h sc
hool
High
sch
ool g
radu
ate
At le
ast s
ome
colle
ge
Asso
ciat
e’s d
egre
e
4-ye
ar c
olle
ge d
egre
e
Adva
nced
deg
ree
Sum
mar
y Di
spar
ity R
atio
3
Poor
Near
-poo
r
Mid
dle
Near
-hig
h
High
Sum
mar
y Di
spar
ity R
atio
3
Pers
ons
with
dis
abili
ties
Pers
ons
with
out d
isab
ilitie
s
Sum
mar
y Di
spar
ity R
atio
2
Met
ropo
litan
Nonm
etro
polit
an
Sum
mar
y Di
spar
ity R
atio
2
Social and Environmental Changes—Continued
TU-11.2 Adolescents exposed to secondhand smoke (percent, nonsmokers, 12–17 years) (2009–2012) 1.088 2.054* b 2.676*
TU-11.3 Adults exposed to secondhand smoke (age-adjusted, percent, nonsmokers, 18+years) (2009–2012)
1.200* 1.551* c d 2.365* e b 1.885*fg
fh 1.303*
TU-12 Persons covered by indoor worksite policies prohibiting smoking (percent, 18+ years) (2010–2011) 1.054* 1.076* 1.097* i j k 1.073* 1.005
TU-14 Adults living in smoke-free homes (percent, 18+ years) (2010–2011) 1.026* 1.112* 1.112* i j k 1.118* 1.094*
TU-18.1 Adolescents and young adults exposed to tobacco marketing on the Internet (percent, grades 6–12) (2013)
1.177* l l l 1.278*
TU-18.2 Adolescents and young adults exposed to tobacco marketing in magazines and newspapers (percent, grades 6–12) (2013)
1.001 l l l 1.230*
TU-18.3 Adolescents and young adults exposed to tobacco marketing in movies and television (percent, grades 6–12) (2013)
1.042* l l l 1.105
TU-18.4 Adolescents and young adults exposed to tobacco marketing at point of purchase (percent, grades 6–12) (2013)
1.033* l l l 1.192*
Table 41–3. Midcourse Health Disparities1 for Population-based Tobacco Use Objectives—Continued
Most favorable (least adverse) and least favorable (most adverse) group rates and summary disparity ratios2,3 for selected characteristics at the midcourse data point
LEGEND
At the midcourse data point Group with the most favorable (least adverse) rate
Group with the least favorable (most adverse) rate
Data are available, but this group did not have the highest or lowest rate.
Data are not available for this group because the data were statistically unreliable, not collected, or not analyzed.
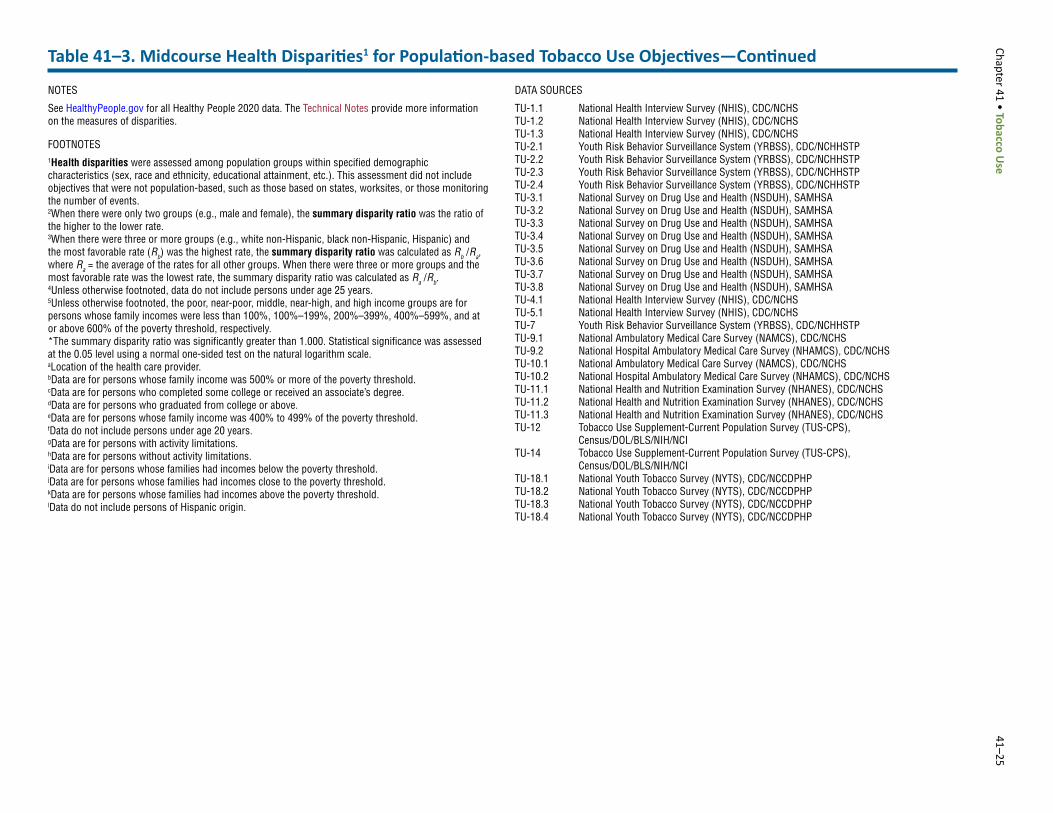
Chapter 41 • Tobacco Use
41–25Table 41–3. Midcourse Health Disparities1 for Population-based Tobacco Use Objectives—Continued
NOTES
See HealthyPeople.gov for all Healthy People 2020 data. The Technical Notes provide more information on the measures of disparities.
FOOTNOTES1Health disparities were assessed among population groups within specified demographic characteristics (sex, race and ethnicity, educational attainment, etc.). This assessment did not include objectives that were not population-based, such as those based on states, worksites, or those monitoring the number of events.2When there were only two groups (e.g., male and female), the summary disparity ratio was the ratio of the higher to the lower rate. 3When there were three or more groups (e.g., white non-Hispanic, black non-Hispanic, Hispanic) and the most favorable rate (Rb) was the highest rate, the summary disparity ratio was calculated as Rb /Ra, where Ra = the average of the rates for all other groups. When there were three or more groups and the most favorable rate was the lowest rate, the summary disparity ratio was calculated as Ra /Rb.4Unless otherwise footnoted, data do not include persons under age 25 years.5Unless otherwise footnoted, the poor, near-poor, middle, near-high, and high income groups are for persons whose family incomes were less than 100%, 100%–199%, 200%–399%, 400%–599%, and at or above 600% of the poverty threshold, respectively.*The summary disparity ratio was significantly greater than 1.000. Statistical significance was assessed at the 0.05 level using a normal one-sided test on the natural logarithm scale.aLocation of the health care provider.bData are for persons whose family income was 500% or more of the poverty threshold.cData are for persons who completed some college or received an associate’s degree.dData are for persons who graduated from college or above.eData are for persons whose family income was 400% to 499% of the poverty threshold.fData do not include persons under age 20 years.gData are for persons with activity limitations.hData are for persons without activity limitations.iData are for persons whose families had incomes below the poverty threshold. jData are for persons whose families had incomes close to the poverty threshold.kData are for persons whose families had incomes above the poverty threshold.lData do not include persons of Hispanic origin.
DATA SOURCES
TU-1.1 National Health Interview Survey (NHIS), CDC/NCHSTU-1.2 National Health Interview Survey (NHIS), CDC/NCHSTU-1.3 National Health Interview Survey (NHIS), CDC/NCHSTU-2.1 Youth Risk Behavior Surveillance System (YRBSS), CDC/NCHHSTPTU-2.2 Youth Risk Behavior Surveillance System (YRBSS), CDC/NCHHSTPTU-2.3 Youth Risk Behavior Surveillance System (YRBSS), CDC/NCHHSTPTU-2.4 Youth Risk Behavior Surveillance System (YRBSS), CDC/NCHHSTPTU-3.1 National Survey on Drug Use and Health (NSDUH), SAMHSATU-3.2 National Survey on Drug Use and Health (NSDUH), SAMHSATU-3.3 National Survey on Drug Use and Health (NSDUH), SAMHSATU-3.4 National Survey on Drug Use and Health (NSDUH), SAMHSATU-3.5 National Survey on Drug Use and Health (NSDUH), SAMHSATU-3.6 National Survey on Drug Use and Health (NSDUH), SAMHSATU-3.7 National Survey on Drug Use and Health (NSDUH), SAMHSATU-3.8 National Survey on Drug Use and Health (NSDUH), SAMHSATU-4.1 National Health Interview Survey (NHIS), CDC/NCHSTU-5.1 National Health Interview Survey (NHIS), CDC/NCHSTU-7 Youth Risk Behavior Surveillance System (YRBSS), CDC/NCHHSTPTU-9.1 National Ambulatory Medical Care Survey (NAMCS), CDC/NCHSTU-9.2 National Hospital Ambulatory Medical Care Survey (NHAMCS), CDC/NCHSTU-10.1 National Ambulatory Medical Care Survey (NAMCS), CDC/NCHSTU-10.2 National Hospital Ambulatory Medical Care Survey (NHAMCS), CDC/NCHSTU-11.1 National Health and Nutrition Examination Survey (NHANES), CDC/NCHSTU-11.2 National Health and Nutrition Examination Survey (NHANES), CDC/NCHSTU-11.3 National Health and Nutrition Examination Survey (NHANES), CDC/NCHSTU-12 Tobacco Use Supplement-Current Population Survey (TUS-CPS),
Census/DOL/BLS/NIH/NCITU-14 Tobacco Use Supplement-Current Population Survey (TUS-CPS),
Census/DOL/BLS/NIH/NCITU-18.1 National Youth Tobacco Survey (NYTS), CDC/NCCDPHPTU-18.2 National Youth Tobacco Survey (NYTS), CDC/NCCDPHPTU-18.3 National Youth Tobacco Survey (NYTS), CDC/NCCDPHPTU-18.4 National Youth Tobacco Survey (NYTS), CDC/NCCDPHP
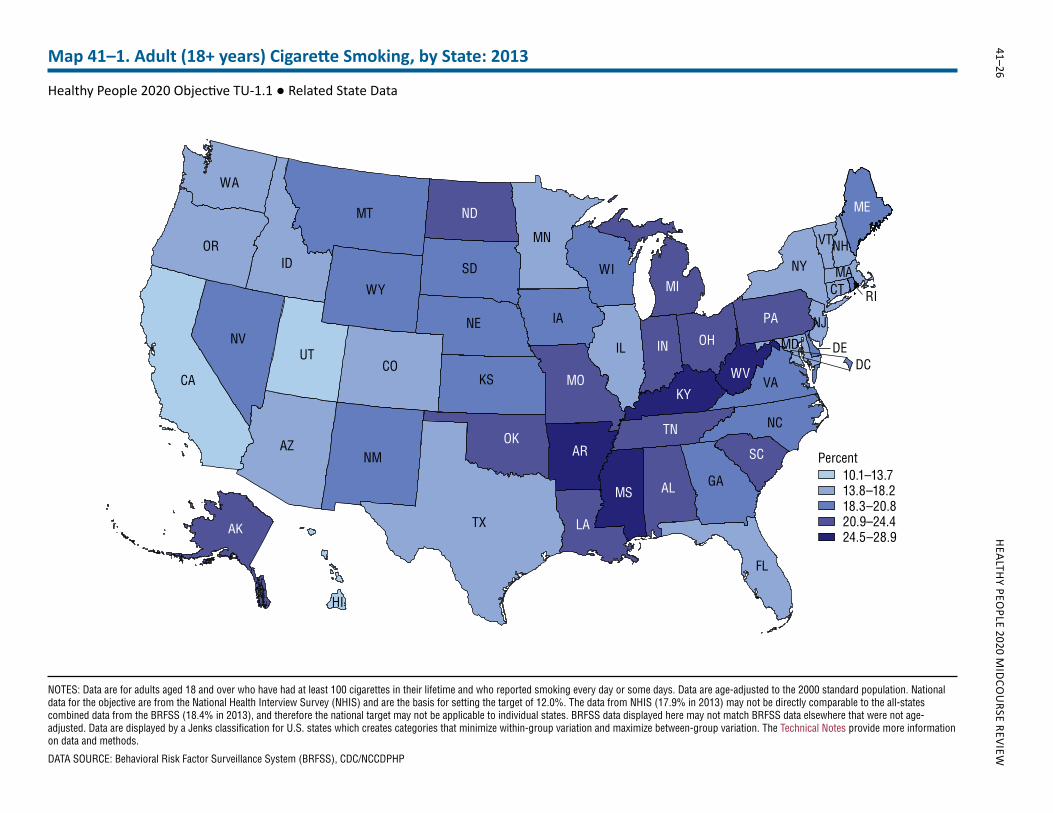
41–26 H
EALTHY PEO
PLE 2020 MID
COU
RSE REVIEWMap 41–1. Adult (18+ years) Cigarette Smoking, by State: 2013
Healthy People 2020 Objective TU-1.1 ● Related State Data
NOTES: Data are for adults aged 18 and over who have had at least 100 cigarettes in their lifetime and who reported smoking every day or some days. Data are age-adjusted to the 2000 standard population. National data for the objective are from the National Health Interview Survey (NHIS) and are the basis for setting the target of 12.0%. The data from NHIS (17.9% in 2013) may not be directly comparable to the all-states combined data from the BRFSS (18.4% in 2013), and therefore the national target may not be applicable to individual states. BRFSS data displayed here may not match BRFSS data elsewhere that were not age-adjusted. Data are displayed by a Jenks classification for U.S. states which creates categories that minimize within-group variation and maximize between-group variation. The Technical Notes provide more information on data and methods.
DATA SOURCE: Behavioral Risk Factor Surveillance System (BRFSS), CDC/NCCDPHP
Percent10.1–13.713.8–18.2 18.3–20.8 20.9–24.424.5–28.9
AK TX
CA
MT
AZ
ID
NV
NM
COIL
OR
UT
KS
WY
IANE
SD
MN
FL
WI
WA
GA
NY
NC
VA
VTNH
NJ
MACT
MD
HI
ND
OK
MO
AL
LA
AR
MI
IN
PA
MS
TN
KY
OH
SC
ME
WV
RI
DEDC
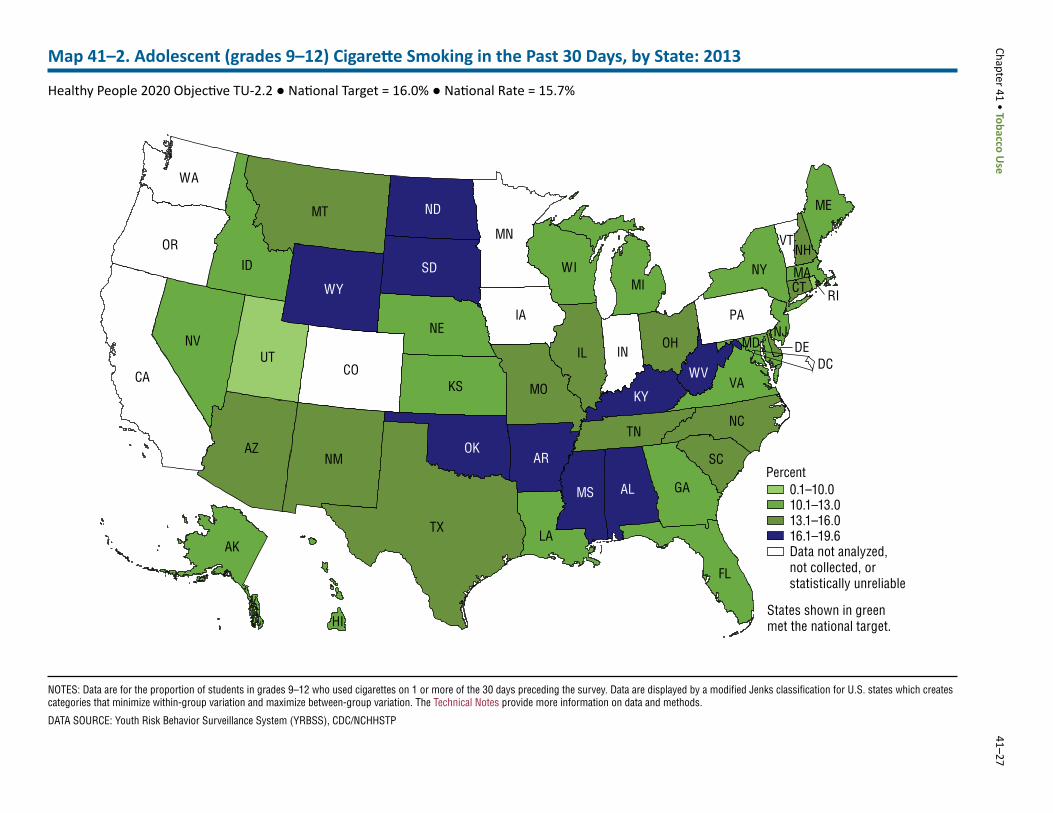
Chapter 41 • Tobacco Use
41–27Map 41–2. Adolescent (grades 9–12) Cigarette Smoking in the Past 30 Days, by State: 2013
Healthy People 2020 Objective TU-2.2 ● National Target = 16.0% ● National Rate = 15.7%
NOTES: Data are for the proportion of students in grades 9–12 who used cigarettes on 1 or more of the 30 days preceding the survey. Data are displayed by a modified Jenks classification for U.S. states which creates categories that minimize within-group variation and maximize between-group variation. The Technical Notes provide more information on data and methods.
DATA SOURCE: Youth Risk Behavior Surveillance System (YRBSS), CDC/NCHHSTP
WY
SD
ND
OK
AL
AR
MS
KY
WV
RI
DEDC
Percent0.1–10.0 10.1–13.0 13.1–16.0 16.1–19.6Data not analyzed,not collected, or statistically unreliable
States shown in green met the national target.
AKTX
CA
MT
AZ
ID
NV
NM
COIL
OR
UT
KS
IANE
MN
FL
WI
MO
WA
GA
LA
MI
IN
PA
NY
NCTN
VA
OH
SC
ME
VTNH
NJ
MACT
MD
HI
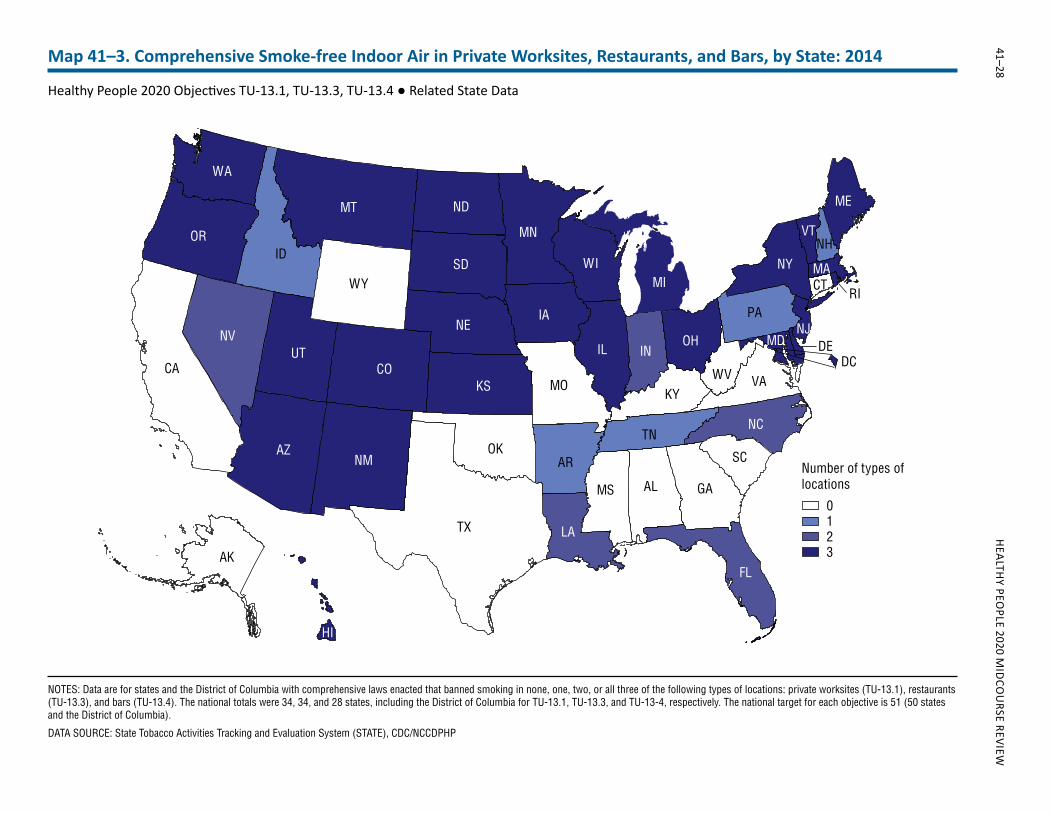
41–28 H
EALTHY PEO
PLE 2020 MID
COU
RSE REVIEWMap 41–3. Comprehensive Smoke-free Indoor Air in Private Worksites, Restaurants, and Bars, by State: 2014
Healthy People 2020 Objectives TU-13.1, TU-13.3, TU-13.4 ● Related State Data
NOTES: Data are for states and the District of Columbia with comprehensive laws enacted that banned smoking in none, one, two, or all three of the following types of locations: private worksites (TU-13.1), restaurants (TU-13.3), and bars (TU-13.4). The national totals were 34, 34, and 28 states, including the District of Columbia for TU-13.1, TU-13.3, and TU-13-4, respectively. The national target for each objective is 51 (50 states and the District of Columbia).
DATA SOURCE: State Tobacco Activities Tracking and Evaluation System (STATE), CDC/NCCDPHP
TX
MT
AZ
ID
NV
COIL
OR
UT
KS
IANE
SD
MN
FL
ND
OK
WI
MO
WA
AL GA
LA
AR
MI
IN
PA
NY
NC
MS
TN
VAKY
SC
ME
VTNH
NJ
MACT
MD
AK
HI
Number of types of locations
01 23
NM
WY
CA WV
OH
RI
DEDC