Embed Size (px)
Citation preview
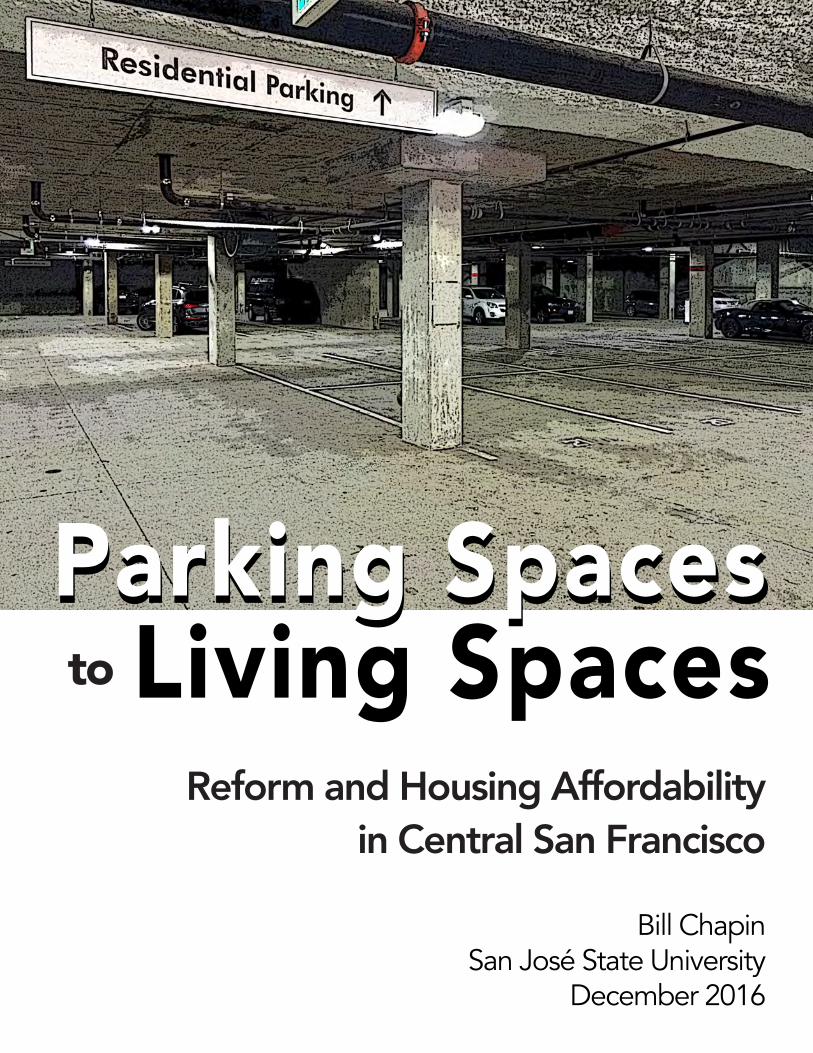
Parking SpacesParking SpacesLiving Spacesto
Reform and Housing Affordabilityin Central San Francisco
Bill ChapinSan José State University
December 2016
Reform and Housing Affordability in Central San Francisco
A planning report presented to the faculty of theDepartment of Urban and Regional Planning,
San Jose State University
In partial fulfillment of the requirements forthe degree of Master of Urban Planning
By Bill ChapinDecember 2016
Parking Spaces to Living Spaces

This page intentionally left blank
ii
Park
ing
Sp
aces
to L
ivin
g S
pac
es
Special thanks are due to my advisors, Ginnette Wessell and Asha Weinstein Agrawal, who guided the development of this study and improved its quality immeasurably through their thoughtful feedback.
Words cannot capture the love and gratitude I have for my wife and daughter, Anna and Elizabeth Chapin, who put up with my regular absences while I worked on this report and degree, and for my parents, Clark and Karen Chapin, whose support and encouragement has bolstered me throughout childhood and adulthood.
I am grateful to the entire San Jose State University Department of Urban and Regional Planning, particularly Richard Kos and Shishir Mathur; the lessons and skills they imparted in the classroom were put to use throughout this report. Department chair Hilary Nixon’s accessibility and positivity played a key role in convincing a former journalist who wasn’t getting any younger that he could make a go of it in a new career in urban planning.
I owe a debt to Tarryl Jackson, whose last-minute copyediting skills caught several typos and grammatical flubs.
Two former newspaper colleagues, Jeanne Mickle and Tiffany McCurley Bierlein, taught me nearly everything I know about page layout and design.
Thank you to Valerie Knepper, who first suggested that I get myself a copy of The High Cost of Free Parking.
I would also like to acknowledge the following individuals and organizations for their contributions, assistance, and inspiration:
• Donald Shoup• Martin Wachs• Richard Willson• James Howard Kunstler• Tim Cullenen• Lisa Messano• Wynne Kwan• Charles Rivasplata• Richard Lee• Andrea Nelson• Robert McClory• Garth Kriewall• Suzie Larsen• SF OpenData• Wescafe in Alameda, CA
AcknowledgmentsThis report would not have been possible without the assistance of Livable City Executive Director Tom Radulovich, whose detailed knowledge of parking requirements in San Francisco helped to identify the study area and made it possible to establish a timeline of reform by zoning district.
Tab
le o
f Co
nten
ts
List of Figures iv List of Tables v1 Introduction: Parking’s Privileged Position 1
1.1 Study Overview 2 1.2 What are Minimum Parking Requirements? 4 1.3 The Need for This Study 4 1.4 Report Overview 6
2 A Brief History of Parking Regulation (and Deregulation) 7 2.1 The Tandem Evolution of Zoning and Parking 7 2.2 How Parking Requirements Work in Practice 10 2.3 Mounting Criticism 12 2.4 The Reform Movement 15
3 The Study Area: Where Market Meets Van Ness 19 3.1 Defining the Study Parameters 20 3.2 The Intersection of Market & Van Ness 21 3.3 The Area Plans and Their Neighborhoods 21 3.4 Zoning in the Study Area 24 3.5 Suitability for a Comparative Study 25
4 Measuring the Effects of Parking Reform in San Francisco 31 4.1 Methodology 32 4.2 The Final Dataset 35 4.3 Analysis 42 4.4 Results 42 4.5 Summary 49
5 The Developer’s Viewpoint 51 5.1 Methodology 52 5.2 Developments Under Discussion 52 5.3 Findings 53 5.4 Summary 57
6 Conclusion: A Case for Reform 59 6.1 Summary of Findings 60 6.2 Study Limitations 62 6.3 Suggestions for Future Research 64 6.4 Implications of the Study 64 6.5 Final Thoughts 65
Bibliography 67Appendix A: Dataset with Selected Variables 72Appendix B: Interview Questions 74
Table of Contents
iii
iv
Park
ing
Sp
aces
to L
ivin
g S
pac
es
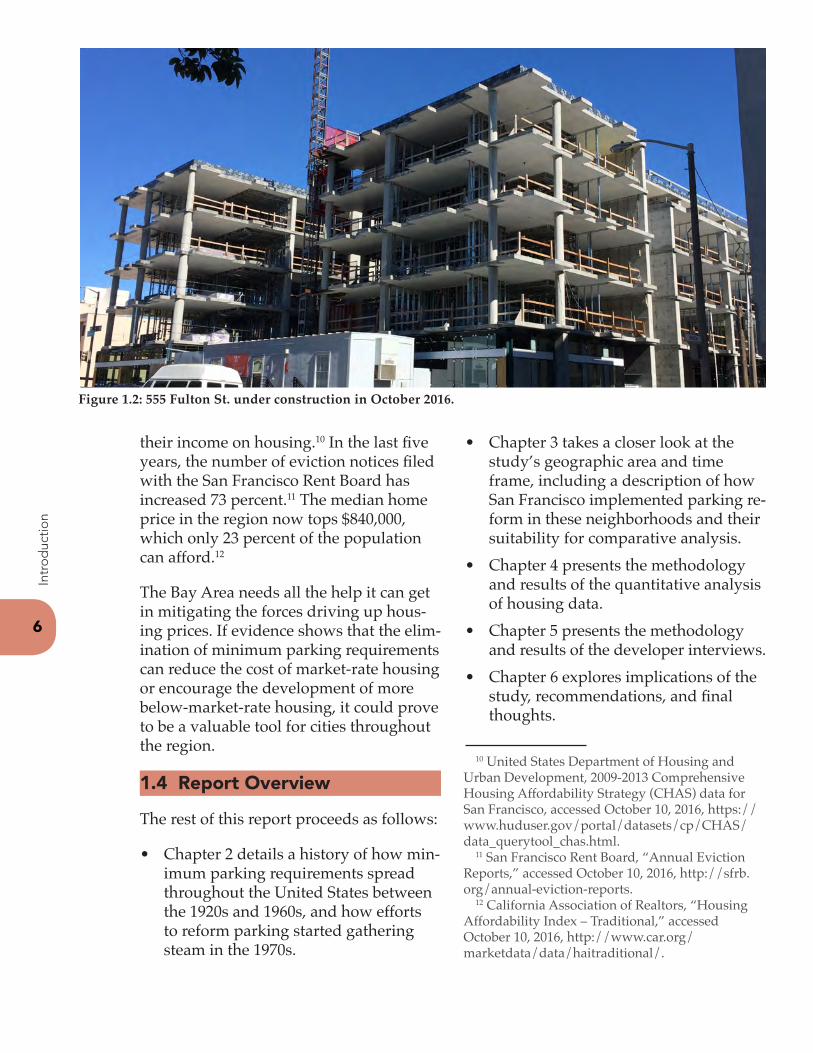
Figure 1.1: The study area 3Figure 1.2: 555 Fulton St. under construction in October 2016 6
Figure 2.1: Clay Street at Van Ness Avenue in San Francisco, facing east toward Polk Street, in 1888 9Figure 2.2: The same block of Clay Street, facing west toward Van Ness Avenue, in 1945 9Figure 2.3: A parking lot at AT&T Park in San Francisco 11Figure 2.4: Louisville, KY’s SoBro neighborhood 14Figure 2.5: Growth of parking reform in central San Francisco 17
Figure 3.1: Corner of Market Street and Octavia Boulevard 20Figure 3.2: Corner of Van Ness Avenue and Pine Street in the Van Ness Avenue Plan Area 22Figure 3.3: Corner of Market and Sanchez streets in the Market and Octavia Plan Area 23Figure 3.5: 2010 population density in central San Francisco 27Figure 3.6: Representative sample of recent developments and adaptive re-use projects in the study area 28
Figure 4.1: Progression of a typical project through the planning (PL) and building permit (BP) processes, as defined in San Francisco Pipeline Reports 33Figure 4.2: 1285 Sutter St. 34Figure 4.3: Project site for the 1433 Bush St. development 35Figure 4.4: Map of residential developments included in the analysis39Figure 4.5: Means and standard deviations of experimental variables 43Figure 4.6: Dwelling units vs. parking spaces 44Figure 4.7: Site area vs. dwelling units by minimum parking requirement 45Figure 4.8: Site area vs. dwelling units by maximum height limit 46Figure 4.9: Total dwelling units vs. affordable dwelling units 47Figure 4.10: Dwelling units vs. construction cost 48
Figure 5.1: Stalls with mechanical stackers 56
Figure 6.1: Garage entrance for 1960-1998 Market St. 61Figure 6.2: Garage entrance for 200 Dolores St. 63Figure 6.3: Garage entrance for the 55 Laguna development. 66
Cover and Main Chapter ImagesCover Image: Residential parking at the 55 Laguna development, adjusted with a Photoshop filterChapter 1: Cars parked in a garage in Oakland, CAChapter 2: Underground garage entrance to 2200 Market St. and surface lot at neighboring motelChapter 3: Corner of Market Street and Van Ness AvenueChapter 4: 1600 Market St. and 1 Franklin St.Chapter 5: 1545 Pine St. under construction in October 2016Chapter 6: Garage entrance at 1800 Van Ness Ave.
Sourcing note: Unless otherwise noted, all photos are the author’s original work.
List of Figures

v
List
of T
able
s
Table 3.1: Changes in zoning districts within the Market & Octavia Plan Area 25Table 4.1: Data sources, challenges, and assumptions 36Table 4.2: Characteristics of developments in the study by minimum parking requirement at time of approval 40
List of Tables
Chapter 1Chapter 1Introduction:
Parking’s Privileged Positione all like to complain about parking. The frustration of circling the block, looking for
a parking space, is familiar to any-one who has ever gotten behind the wheel of a car in a city. The reaction to this is natural: “Why aren’t there more places to park?!”
For the better part of a century, ur-ban planners looked at parking from the driver’s perspective. Parking was only a problem when it was in short supply, and the solution was to mandate the construction of more parking spaces. Donald Shoup, a recently retired professor of urban planning at the University of Califor-nia, Los Angeles, relentlessly cri-tiqued this approach in his book, The High Cost of Free Parking. Planners,
W1
he wrote, had failed to consider the conse-quences of too much parking.1
In the decade since Shoup’s book was first published, the planning field has shown a dramatic reversal in its attitude toward parking. Parking is now widely regarded as a demand problem: a limited public resource stretched too thin because it is underpriced. More and more cities are no longer asking how to increase parking, but how to limit it. Even the White House has taken a stand against local regulations that require additional parking, making the elimination of minimum parking require-ments one of 10 recommended actions included in a Housing Development Toolkit released in September 2016.2
1.1 Study Overview
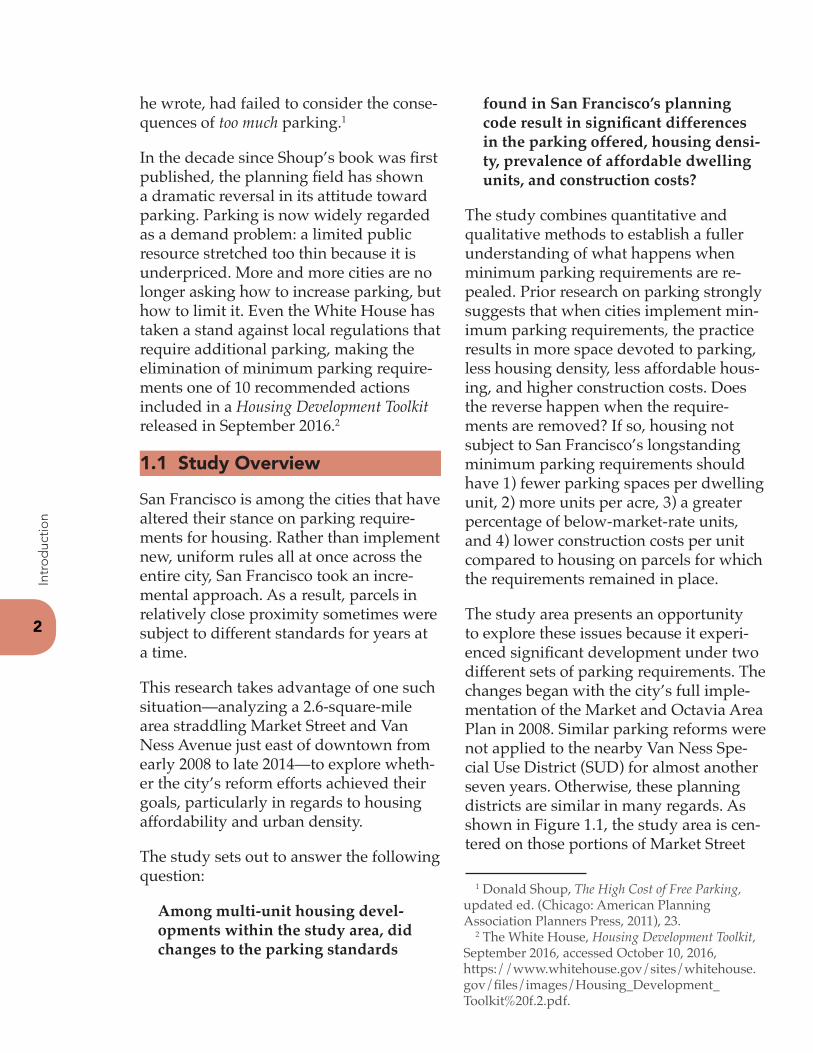
San Francisco is among the cities that have altered their stance on parking require-ments for housing. Rather than implement new, uniform rules all at once across the entire city, San Francisco took an incre-mental approach. As a result, parcels in relatively close proximity sometimes were subject to different standards for years at a time.
This research takes advantage of one such situation—analyzing a 2.6-square-mile area straddling Market Street and Van Ness Avenue just east of downtown from early 2008 to late 2014—to explore wheth-er the city’s reform efforts achieved their goals, particularly in regards to housing affordability and urban density.
The study sets out to answer the following question:
Among multi-unit housing devel-opments within the study area, did changes to the parking standards
found in San Francisco’s planning code result in significant differences in the parking offered, housing densi-ty, prevalence of affordable dwelling units, and construction costs?
The study combines quantitative and qualitative methods to establish a fuller understanding of what happens when minimum parking requirements are re-pealed. Prior research on parking strongly suggests that when cities implement min-imum parking requirements, the practice results in more space devoted to parking, less housing density, less affordable hous-ing, and higher construction costs. Does the reverse happen when the require-ments are removed? If so, housing not subject to San Francisco’s longstanding minimum parking requirements should have 1) fewer parking spaces per dwelling unit, 2) more units per acre, 3) a greater percentage of below-market-rate units, and 4) lower construction costs per unit compared to housing on parcels for which the requirements remained in place.
The study area presents an opportunity to explore these issues because it experi-enced significant development under two different sets of parking requirements. The changes began with the city’s full imple-mentation of the Market and Octavia Area Plan in 2008. Similar parking reforms were not applied to the nearby Van Ness Spe-cial Use District (SUD) for almost another seven years. Otherwise, these planning districts are similar in many regards. As shown in Figure 1.1, the study area is cen-tered on those portions of Market Street
2
Intr
od
uctio
n
1 Donald Shoup, The High Cost of Free Parking, updated ed. (Chicago: American Planning Association Planners Press, 2011), 23.
2 The White House, Housing Development Toolkit, September 2016, accessed October 10, 2016, https://www.whitehouse.gov/sites/whitehouse.gov/files/images/Housing_Development_Toolkit%20f.2.pdf.
3
Park
ing
Sp
aces
to L
ivin
g S
pac
es
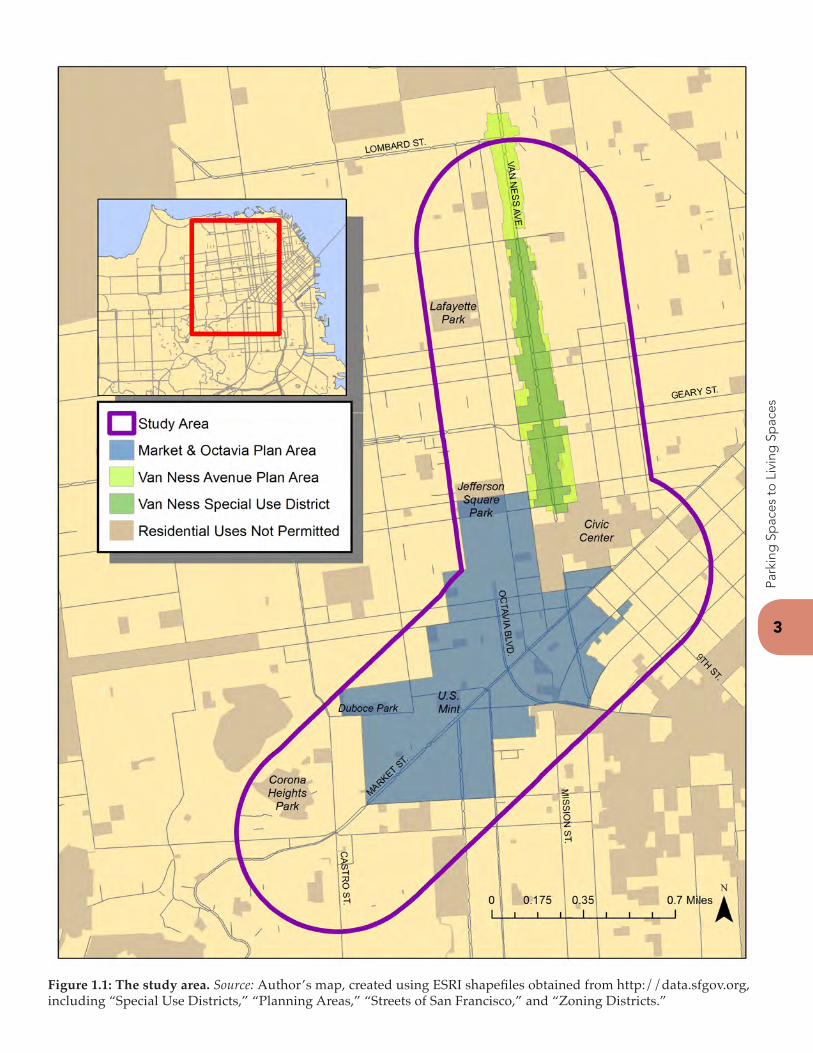
Figure 1.1: The study area. Source: Author’s map, created using ESRI shapefiles obtained from http://data.sfgov.org, including “Special Use Districts,” “Planning Areas,” “Streets of San Francisco,” and “Zoning Districts.”
and Van Ness Avenue that fall within these districts and encompasses all the parcels within an easy walking distance.
The study methodology utilized a variety of official City and County of San Francis-co documents and databases to identify all the residential development projects that took place within a clearly defined study area and time frame, as well as key attri-butes of each building. I calculated four experimental variables measuring parking supply, housing density, the prevalence of affordable units, and construction costs, then compared values for buildings that had a minimum parking requirement to those that did not.
To supplement these findings and to gauge the degree to which parking stan-dards were responsible for any differenc-es, I also interviewed six San Francisco real-estate developers who had been primarily responsible for projects includ-ed in the data analysis. These semi-struc-tured interviews focused on how parking had affected their plans and what might have changed under a different set of requirements.
1.2 What are Minimum Parking Requirements?
Nearly every city in the United States requires new real-estate developments to include a minimum number of off-street parking spaces based on the project’s land use, usually enforced through the city’s zoning code. The rules typically also apply to changes in use: a developer who wishes to convert an old warehouse into apartments must make sure the site in-cludes at least as much parking as would be required for a new residential building. These regulations are known as minimum
parking requirements, or sometimes sim-ply “parking minimums.”
Critics of standard parking policy main-tain that minimum parking requirements create more problems than they solve. They result in an oversupply of parking that, as Shoup puts it, “distorts trans-portation choices, debases urban design, damages the economy, and degrades the environment.”3 Many cities have noted these criticisms and have relaxed their minimum parking requirements. Some have even imposed upper limits on the number of parking spaces allowed, known as maximum parking requirements or “parking maximums.”
Urban planners also sometimes use the term “parking standards” as a catch-all that encompasses both minimum and maximum requirements, as well as speci-fications about the size of parking spaces and other design elements.
1.3 The Need for This Study
An examination of San Francisco’s push to ease parking standards presents an opportunity to enhance the planning profession’s understanding of such re-form efforts, which have not been widely researched to date. The study also holds real-world implications for cities in the San Francisco Bay Area, where housing affordability is an unrelenting problem.
1.3.1 Limited Research on Parking Reform
With more cities considering changes to their parking standards, it is important for urban planners to understand what these reform efforts might be able to accomplish—how changing the way that
4
Intr
od
uctio
n
3 Shoup, Free Parking, xxxi.
5
Park
ing
Sp
aces
to L
ivin
g S
pac
es
parking is regulated can make cities better, more efficient, more livable places.
To accomplish this, it is necessary to exam-ine both what is wrong with the current system and what happens when that sys-tem is altered. The literature is beginning to clearly establish the facts of the former. The latter remains largely uncertain.
Preparations for this study included the review of 30 research studies and policy papers that examined the effects of min-imum parking requirements on parking supply, housing affordability, and urban density. Of these, only five attempted to gauge what happens when cities elimi-nate—as opposed to implement—mini-mum parking requirements:
These studies were all intriguing and important, but they each presented only a partial—and, in one case, contradictory—
picture of the effects of parking reform. Hollowell and Stoy4 limited their study to rental properties. Manville5 was only able to look at adaptive-reuse projects. Guo and Ren,6 as well as a follow-up study by Li and Guo,7 focused on parking supply and did not consider other issues related to housing. Nelson, Meyer, and Ross8 also looked only at parking supply, and their study was based on commercial devel-opment. And, of course, each study was based on policies within a single city; more research is necessary to see whether their findings can be applied more broadly.
In addition, only four of the five studies showed that reform efforts had an effect. Nelson, Meyer, and Ross found no ap-preciable relationship between minimum parking requirements and parking supply, contradicting nearly all of the existing lit-erature on parking. While it’s possible that regional differences, the age of the build-ings, the focus on commercial properties, or a small sample size played a role, the inconsistency casts doubt on the effective-ness of parking reform.
None of the research thus far has analyzed data on how parking reform relates to housing density or the availability of sub-sidized, below-market-rate housing. The current study is a first.
1.3.2 San Francisco’s Housing Crisis
Understanding the policies that influence housing affordability is especially criti-cal in the San Francisco Bay Area, which continues to experience a “historic afford-ability crisis.”9 According to the latest data from the U.S. Department of Housing and Urban Development, 21 percent of renters in the city are spending more than half
4 Alexandra Hallowell and Kelan Stoy, “The Rent is Too Damn High: Parking and Affordability in Portland, Oregon,” paper presented at Transportation Review Board 94th Annual Meeting, Washington, DC, January 11-15, 2015.
5 Michael Manville, “Parking Requirements and Housing Development: Regulation and Reform in Los Angeles,” Journal of the American Planning Association 79, no. 1 (2013): 49-66.
6 Zhan Guo and Shuai Ren, “From Minimum to Maximum: Impact of the London Parking Reform on Residential Parking Supply from 2004 to 2010,” Urban Studies 50, no. 6 (2013): 1183-1200.
7 Fei Li and Zhan Guo, “Do Parking Standards Matter? Evaluating the London Parking Reform with a Matched-Pair Approach,” Transportation Research Part A: Policy & Practice 67 (2014): 352-365.
8 Arthur Nelson, Michael Meyer, and Catherine Ross, “Parking Supply Policy and Transit use: Case Study of Atlanta, Georgia,” Transportation Research Record: Journal of the Transportation Research Board 1604 (1997): 60-66.
9 Marcia Rosen and Wendy Sullivan, “From Urban Renewal and Displacement to Economic Inclusion: San Francisco Affordable Housing Policy 1978-2014,” Stanford Law & Policy Review 25, no. 1 (2014): 155.
10 United States Department of Housing and Urban Development, 2009-2013 Comprehensive Housing Affordability Strategy (CHAS) data for San Francisco, accessed October 10, 2016, https://www.huduser.gov/portal/datasets/cp/CHAS/data_querytool_chas.html.
11 San Francisco Rent Board, “Annual Eviction Reports,” accessed October 10, 2016, http://sfrb.org/annual-eviction-reports.
12 California Association of Realtors, “Housing Affordability Index – Traditional,” accessed October 10, 2016, http://www.car.org/marketdata/data/haitraditional/.
their income on housing.10 In the last five years, the number of eviction notices filed with the San Francisco Rent Board has increased 73 percent.11 The median home price in the region now tops $840,000, which only 23 percent of the population can afford.12
The Bay Area needs all the help it can get in mitigating the forces driving up hous-ing prices. If evidence shows that the elim-ination of minimum parking requirements can reduce the cost of market-rate housing or encourage the development of more below-market-rate housing, it could prove to be a valuable tool for cities throughout the region.
1.4 Report Overview
The rest of this report proceeds as follows:
• Chapter 2 details a history of how min-imum parking requirements spread throughout the United States between the 1920s and 1960s, and how efforts to reform parking started gathering steam in the 1970s.
• Chapter 3 takes a closer look at the study’s geographic area and time frame, including a description of how San Francisco implemented parking re-form in these neighborhoods and their suitability for comparative analysis.
• Chapter 4 presents the methodology and results of the quantitative analysis of housing data.
• Chapter 5 presents the methodology and results of the developer interviews.
• Chapter 6 explores implications of the study, recommendations, and final thoughts.
6
Intr
od
uctio
n
Figure 1.2: 555 Fulton St. under construction in October 2016.
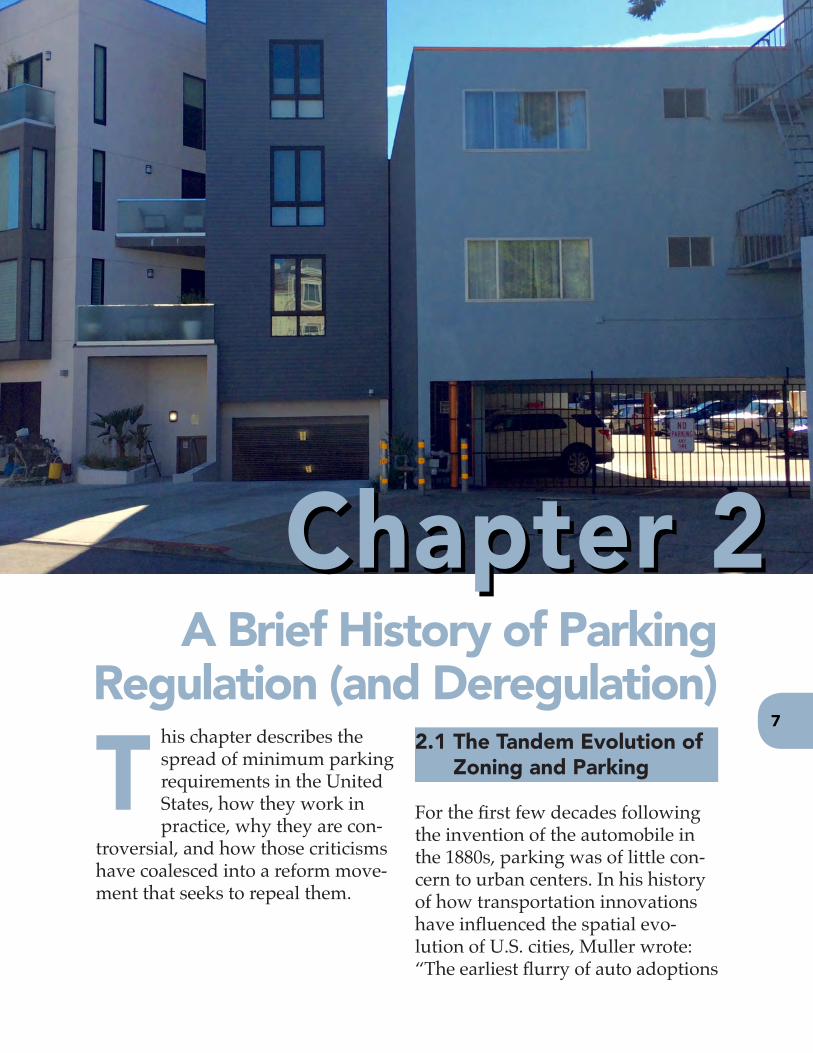
Chapter 2Chapter 2A Brief History of Parking
Regulation (and Deregulation)his chapter describes the spread of minimum parking requirements in the United States, how they work in practice, why they are con-
troversial, and how those criticisms have coalesced into a reform move-ment that seeks to repeal them.
2.1 The Tandem Evolution of Zoning and Parking
For the first few decades following the invention of the automobile in the 1880s, parking was of little con-cern to urban centers. In his history of how transportation innovations have influenced the spatial evo-lution of U.S. cities, Muller wrote: “The earliest flurry of auto adoptions
T7
13 Peter O. Muller, “Transportation and Urban Form: Stages in the Spatial Evolution of the American Metropolis,” in The Geography of Urban Transportation, 3rd ed., ed. Susan Hanson and Genevieve Giuliano (New York: The Guilford Press, 2004), 70.
14 New York City Department of City Planning, ”Zoning Background,” accessed May 12, 2016, http://www1.nyc.gov/site/planning/zoning/background.page.
15 Muller, 70.16 Ibid.17 James J. Flink, The Car Culture (Cambridge,
MA: MIT Press, 1975), 164.18 Wayne Batchis, “Enabling Urban Sprawl:
Revisiting the Supreme Court’s Seminal Zoning Decision Euclid V. Ambler in the 21st Century,” Virginia Journal of Social Policy & the Law 17, no. 3 (2010): 388.
19 Batchis, 397-400.20 Donald Shoup, Free Parking, 1.21 Flink, 163.
8
A B
rief H
isto
ry o
f Par
king
Reg
ulat
ion
had been in rural areas … . In the cities, cars were initially used for weekend out-ings … .”13 Innovations in manufacturing, however, soon led to a surge in the num-ber of vehicles on the road. This happened alongside a different sort of innovation that gave cities broad new powers to regu-late land use. These two trends eventually came together in the form of minimum parking requirements.
As assembly-line production made cars affordable to more Americans, the number of vehicles on the road increased rapidly. In 1916, the year that New York City ad-opted the nation’s first citywide zoning ordinance,14 there were more than 2 million registered automobiles in the United States; by the end of the 1920s, the number of ve-hicles had grown more than tenfold.15
The increasing ubiquity of cars and the spread of zoning both contributed to the emergence of auto-oriented suburban development. Facilitated by the person-al freedom that cars offered, developers began to build more housing further away from rail lines.16 As of 1922, within 60 met-ropolitan areas there were already 135,000 suburban homes whose inhabitants de-pended on cars for transportation.17
That same year, the Cleveland suburb of Euclid, Ohio, adopted a zoning code that separated land uses into distinct, geographic districts.18 The United States Supreme Court upheld the law in a land-mark 1926 case, Village of Euclid v. Am-bler Realty Co. The high court’s decision cleared the way for the abandonment of traditional street grids in favor of sprawl-ing systems of collector roads and cul-de-sacs, which are useful in preserving separate land uses but increase travel distances.19
In The High Cost of Free Parking, Shoup explained that the first city drivers quite naturally stashed their cars in the same place that previous generations had tied up their horses: at the curb in front of their destination. As the number of cars in-creased, however, curb parking became a scarcer and scarcer commodity. “… There were no longer enough spaces for every-one to park whenever and wherever they wanted. Drivers circled in vain looking for a vacant curb space, and their cars con-gested traffic.”20 The dilemma had already become apparent by 1916, when an edi-torial in Automobile magazine lamented: “Every day in big cities the parking prob-lem grows more acute. If it is bad today, and indeed it is so, what will be the situa-tion in three years?”21
Cities saw the issue as a supply problem. In zoning, they happened to have a tool, newly sanctioned by the courts, that could compel developers to increase the supply of parking.
Columbus, Ohio, holds the distinction of being “the first city to establish a parking
9
Park
ing
Sp
aces
to L
ivin
g S
pac
es
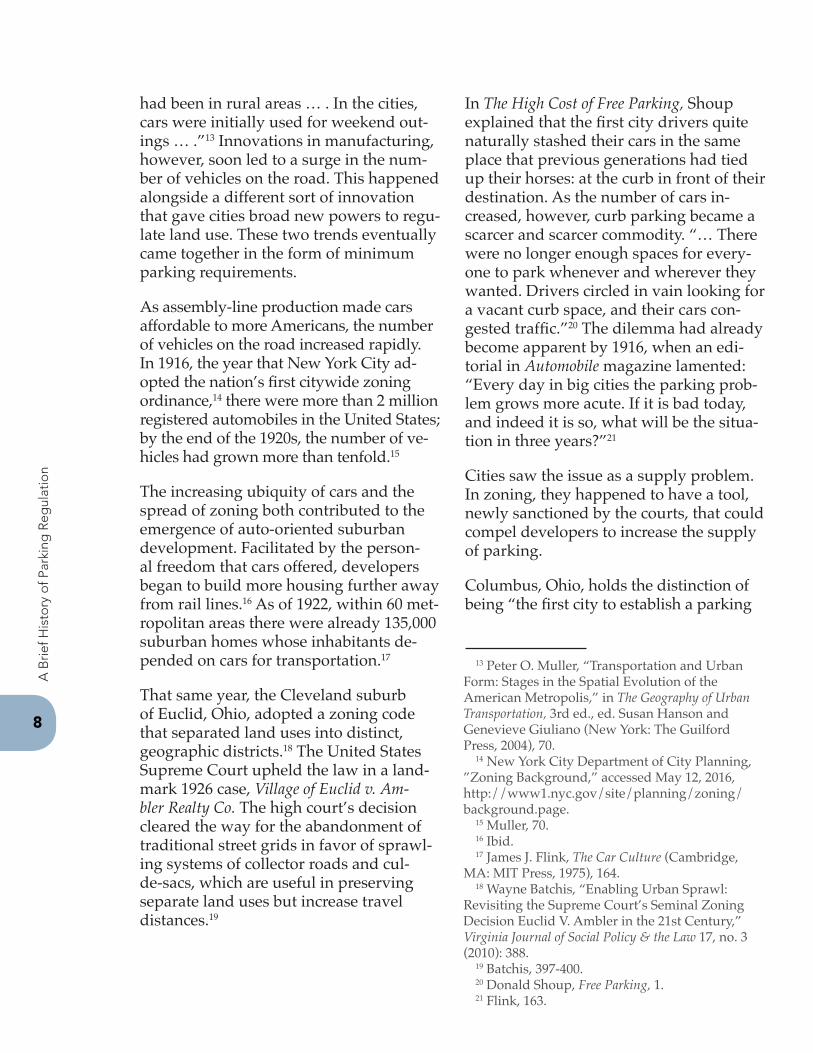
Figure 2.1: Clay Street at Van Ness Avenue in San Francisco, facing east toward Polk Street, in 1888. Prior to the arrival of the automobile, the streets in the Van Ness Corridor were relatively free and open. Source: Used by permission of San Francisco Photo Center, San Francisco Public Library.
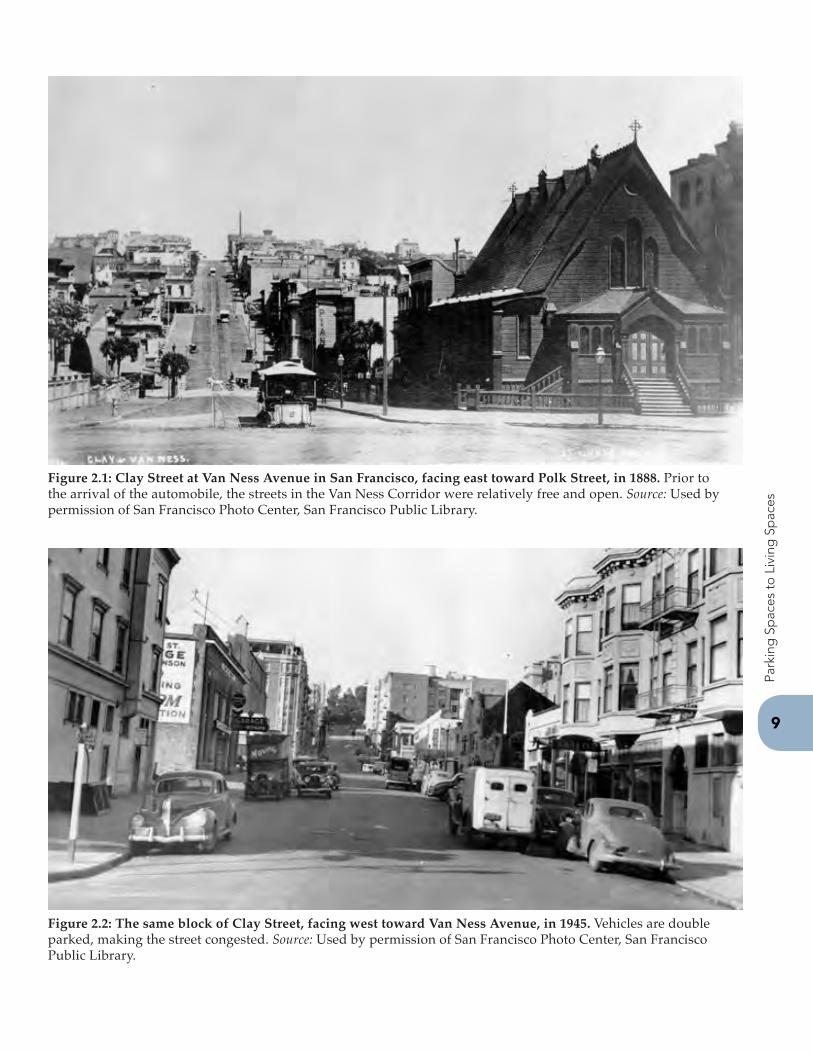
Figure 2.2: The same block of Clay Street, facing west toward Van Ness Avenue, in 1945. Vehicles are double parked, making the street congested. Source: Used by permission of San Francisco Photo Center, San Francisco Public Library.
22 Flink, 607.23 Erik Ferguson, “Zoning for Parking as Policy
Process: A Historical Review,” Transport Reviews 24, no. 2 (2004): 182.
24 Ferguson, 181.25 Ibid., 182.26 Ibid., 177.27 Shoup, Free Parking, 26.28 Wesley Marshall and Norman Garrick,
“Parking at Mixed-use Centers in Small Cities,” Transportation Research Record: Journal of the Transportation Research Board 1977 (2006): 165.
29 San Francisco Planning Code, sec. 150 (2013), accessed November 2, 2016, http://planning.sanfranciscocode.org/1.5/150/.
30 San José Municipal Code, title 20, sec. 20.90.010 (2016), accessed November 2, 2016, https://www.municode.com/library/ca/san_jose/codes/code_of_ordinances?nodeId=TIT20ZO_CH20.90PALO_PT1GEPR_20.90.010PU.
10
A B
rief H
isto
ry o
f Par
king
Reg
ulat
ion
requirement for any type of land use”22 with a 1923 standard for multi-family housing, but the practice did not become widespread until after World War II. In 1946, a national survey found that just 12 percent of those cities with a zoning code included a parking requirement; by 1969, more than 95 percent of cities with pop-ulations greater than 25,000 had adopted parking requirements.23 Based on a review of historic literature, Ferguson determined that large cities in the Northeast, Midwest, and California led the way, and other areas gradually followed suit.24 In 1939, Fresno, California, became the first city to require parking for nonresidential uses. Six years later, Pasadena, California, became the first city to require parking for all devel-opments. San Francisco instituted its first parking standard in 1955, requiring one parking space for each new dwelling unit.
Among those cities with parking require-ments in 1946, the standards applied to uses that covered just 27 percent of their land area. By 1969, the coverage rate had increased to 87 percent.25 Ferguson con-cluded: “Zoning for parking began as an occasional or piecemeal approach to resolving specific problems associated with growing automobile storage require-ments. It gradually became the preferred method to ensure adequate parking space in an automobile-oriented society.”26 Even Houston, which famously does not have a traditional zoning ordinance, has a sec-tion of its municipal code that dictates the required minimum number of parking spaces for different land uses.27
2.2 How Parking Requirements Work in Practice
As cities incorporated parking policy into their zoning codes, “in general, their goal was to ensure that enough parking was
provided so as not to affect businesses and traffic mobility or to disturb nearby uses.”28 Specifically, minimum parking requirements are intended to make sure that every new development provides enough parking spaces to satisfy whatever demand the land use will generate.
When it comes to explaining the purpose of off-street parking requirements, San Francisco’s current Planning Code is rela-tively progressive, immediately establish-ing its intent to make parking “part of a balanced transportation system that makes suitable provision for walking, cycling, public transit, private vehicles, and the movement of goods.”29 The San José Mu-nicipal Code, in contrast, is more typical of the older language found in many zoning codes. The chapter on parking and loading prioritizes the need to “promote adequate off-street vehicle parking and off-street ve-hicle loading to meet the needs generated by a specific use and promote the efficient utilization of off-street parking facilities.” This is followed by the need to “promote effective vehicle circulation, reduce con-gestion, increase safety and aesthetics,” and “mitigate potential adverse impacts on adjacent land uses.”30
11
Park
ing
Sp
aces
to L
ivin
g S
pac
es
Shoup observed that all minimum parking requirements are defined via a three-step process: The zoning code must 1) define the land use, 2) establish some measure that will serve as the basis for the require-ment, and 3) stipulate how many parking spaces are required per unit of the basis.31
2.2.1 DefiningLandUse
While zoning maps and density require-ments typically utilize broad categories of land use (such as “general commercial” or “medium-density residential”), parking requirements are often broken down into nearly every imaginable residential, com-mercial, industrial, recreational, public, and quasi-public use imaginable. The San Francisco code specifies the parking necessary for 33 different uses, plus more than 50 exceptions to these rules for cer-tain zoning districts. The San José code lists requirements for about five times as many land uses, including distinct rules for trade and vocational schools, skating rinks, drinking establishments, pawn shops, crematories, animal grooming fa-cilities, junkyards, stockyards and slaugh-terhouses, freestanding ATMs, community television antenna systems, recycling transfer facilities, servants quarters, fra-ternities and sororities, data centers, and auto glass shops.32
2.2.2 EstablishingtheBasis
Depending on the land use, any number of measures can serve as the basis, includ-ing building floor area, total acreage, seats available for customers, or the number of employees. For residential uses, the re-
quirement is usually defined by the num-ber of bedrooms or dwelling units. San Francisco uses the latter.
2.2.3 StipulatingSpaces
How do cities determine the appropriate number of spaces to require for each of these uses? Shoup’s research has shown planners most often simply copy what other cities are doing—without any insight into the parking demand or supply within their own city.33 The American Planning Association’s Planning Advisory Service (PAS) has occasionally conducted surveys of practicing planners and compiled infor-mation on parking standards, but PAS has not done so since 2002. Planners continue to consult this data, in spite of its age and PAS’s self-proclaimed reservations about its usefulness. “As a result,” Shoup wrote, “most parking requirements amount to little more than a collective hunch.”34
31 Shoup, Free Parking, 75.32 San José Municipal Code, title 20, table 20-190
(2016).33 Shoup, Free Parking, 27.34 Ibid., 28.
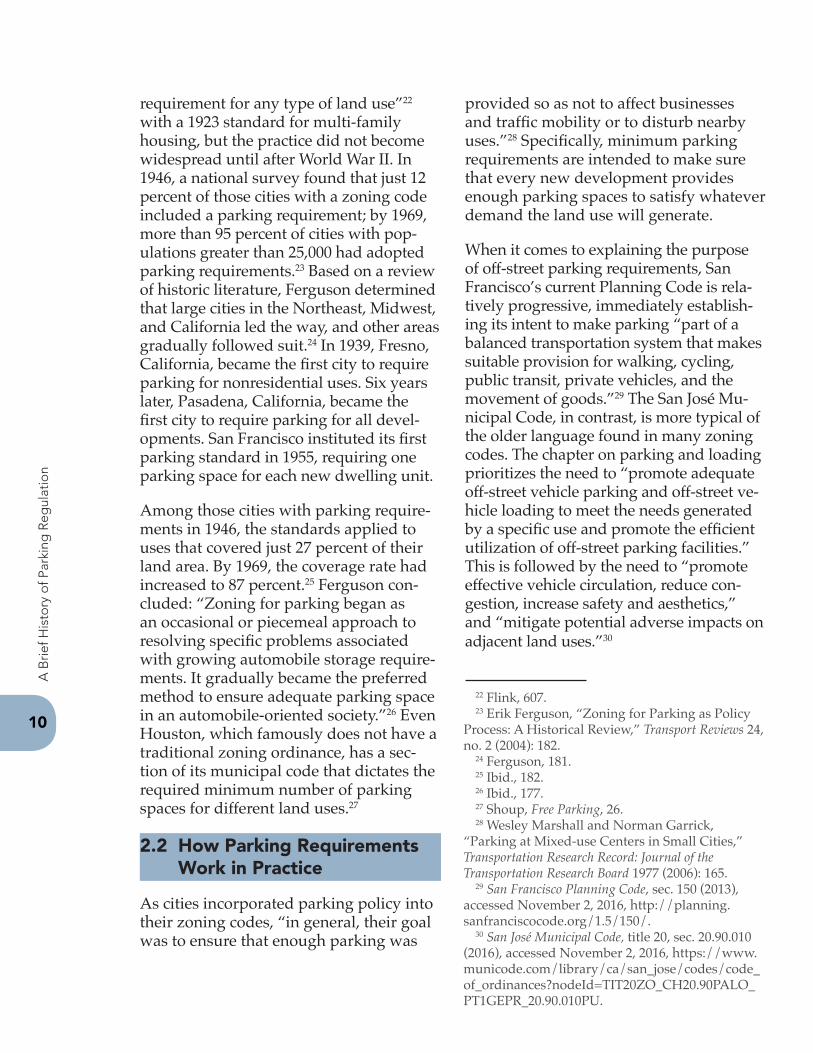
Figure 2.3: A parking lot at AT&T Park in San Francisco. The San Francisco Planning Code requires stadiums and arenas to have one parking spot for every 15 seats. With nearly 42,000 seats, the baseball park needs at least 2,794 parking spaces. It has more than 4,000. Source: By Tobias Kleinlercher / Wikipedia (Own work) [CC BY-SA 3.0 (https://creativecommons.org/licenses/by-sa/3.0/)], via Wikimedia Commons.
35 Shoup, Free Parking, 32.36 Ibid.37 Vicki Been, Caitlyn Brazill, Josiah Madar,
and Simon McDonnell, Searching for the Right Spot: Minimum Parking Requirements and Housing Affordability in New York City (New York: Furman Center for Real Estate and Urban Policy, March 2012), 9-10.
38 Ibid., 11.39 Ibid.40 Ferguson, 177.41 David Levinson, review of The High Cost of Free
Parking by Donald Shoup, Journal of the American Planning Association 71, no. 4 (2005): 459.
42 The Shoupistas, public Facebook group, accessed October 10, 2016, https://www.facebook.com/groups/70015940360/.
12
A B
rief H
isto
ry o
f Par
king
Reg
ulat
ion
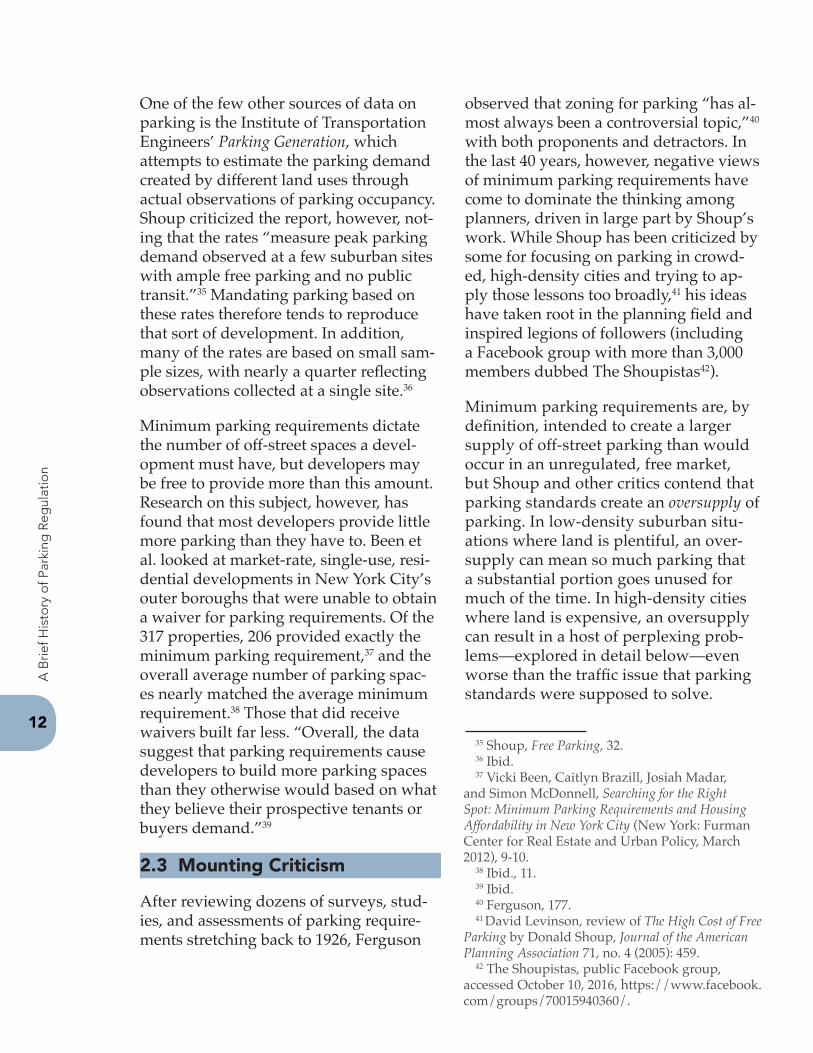
One of the few other sources of data on parking is the Institute of Transportation Engineers’ Parking Generation, which attempts to estimate the parking demand created by different land uses through actual observations of parking occupancy. Shoup criticized the report, however, not-ing that the rates “measure peak parking demand observed at a few suburban sites with ample free parking and no public transit.”35 Mandating parking based on these rates therefore tends to reproduce that sort of development. In addition, many of the rates are based on small sam-ple sizes, with nearly a quarter reflecting observations collected at a single site.36
Minimum parking requirements dictate the number of off-street spaces a devel-opment must have, but developers may be free to provide more than this amount. Research on this subject, however, has found that most developers provide little more parking than they have to. Been et al. looked at market-rate, single-use, resi-dential developments in New York City’s outer boroughs that were unable to obtain a waiver for parking requirements. Of the 317 properties, 206 provided exactly the minimum parking requirement,37 and the overall average number of parking spac-es nearly matched the average minimum requirement.38 Those that did receive waivers built far less. “Overall, the data suggest that parking requirements cause developers to build more parking spaces than they otherwise would based on what they believe their prospective tenants or buyers demand.”39
2.3 Mounting Criticism
After reviewing dozens of surveys, stud-ies, and assessments of parking require-ments stretching back to 1926, Ferguson
observed that zoning for parking “has al-most always been a controversial topic,”40 with both proponents and detractors. In the last 40 years, however, negative views of minimum parking requirements have come to dominate the thinking among planners, driven in large part by Shoup’s work. While Shoup has been criticized by some for focusing on parking in crowd-ed, high-density cities and trying to ap-ply those lessons too broadly,41 his ideas have taken root in the planning field and inspired legions of followers (including a Facebook group with more than 3,000 members dubbed The Shoupistas42).
Minimum parking requirements are, by definition, intended to create a larger supply of off-street parking than would occur in an unregulated, free market, but Shoup and other critics contend that parking standards create an oversupply of parking. In low-density suburban situ-ations where land is plentiful, an over-supply can mean so much parking that a substantial portion goes unused for much of the time. In high-density cities where land is expensive, an oversupply can result in a host of perplexing prob-lems—explored in detail below—even worse than the traffic issue that parking standards were supposed to solve.
13
Park
ing
Sp
aces
to L
ivin
g S
pac
es
2.3.1 EffectsonHousing
Providing space to store cars comes with large up-front, ongoing, and indirect ex-penses. Minimum parking requirements take these costs and fold them into the housing market. This drives up the cost of housing for everyone, regardless of whether or not they own a car. “When local governments require onsite parking for new housing, the cost of housing rises and the price of driving falls,” Manville wrote. “The cost of parking, which drivers should arguably pay at the end of their trips, is instead paid by developers at the start of their projects. The terminal cost of driving becomes an upfront cost of prop-erty development.”43
The outcome of this, planning theorists and economists say, is more expensive housing, either because developers pass the extra expenses on to renters and home buyers or by restricting the local housing supply. Developers may build fewer units as a cost-reduction strategy or because they must devote a greater share of the de-velopable area to parking—both of which mean that any parking expenses will be spread among a smaller pool of residents. Another developer strategy, identified by
Jia and Wachs, is to deal with higher costs by appealing to high-end buyers through more luxury amenities and better-quality materials, which of course causes “prices to rise even further.”44 Other developers may give up entirely on a project that they deem not profitable enough due to park-ing regulations.45
“By restricting the supply of housing, parking requirements inevitably increase rents,” Shoup said.46 Manville further speculated that minimum parking re-quirements may make “it difficult to build housing for certain types of people, in certain types of buildings, or in certain neighborhoods.”47 Parking requirements could therefore affect housing variety in addition to housing costs, density, and overall supply.
2.3.2 EffectsonLandUseandUrbanForm
An oversupply of parking consumes space available for development. In suburban lo-cations, the number of required spaces of-ten results in more land devoted to park-ing lots than to the buildings they serve.48 At this point, “development becomes too spread out for pedestrians to negotiate.”49 Not only are destinations too far apart, but the experience of walking becomes unpleasant. “Off-street parking is often deadening, dull, and hostile to pedestri-ans … ,” Manville and Shoup remarked in their 2005 study of how parking require-ments influence urban form.50
The effect is the same when parking dis-places other activity in a downtown set-ting. In their plea for an emphasis on park-ing quality over parking quantity, Mukhija and Shoup noted that “a massive parking
43 Manville. 49.44 Wenyu Jia and Martin Wachs, “Parking
Requirements and Housing Affordability: Case Study of San Francisco,” Transportation Research Record: Journal of the Transportation Research Board 1685 (1999): 156.
45 Been et al., 6.46 Shoup, Free Parking, 143.47 Manville, 51.48 Todd Litman, Parking Requirement Impacts
on Housing Affordability (Victoria, BC: Victoria Transportation Policy Institute, 2016), 9.
49 Marshall and Garrick, 165.50 Michael Manville and Donald Shoup, “Parking,
People, and Cities,” Journal of Urban Planning and Development 131, no. 4 (2005): 233.
51 Vinit Mukhija and Donald Shoup, “Quantity Versus Quality in Off-Street Parking Requirements,” Journal of the American Planning Association 72, no. 3 (2006): 307.
52 Ibid., 296.53 Jane Jacobs, “Downtown Planning,” reprinted
in Ideas That Matter, the Worlds of Jane Jacobs, ed. Max Allen (Owen Sound, Ontario: The Ginger Press, 1997), 19, quoted in Donald Shoup, The High Cost of Free Parking (Chicago: American Planning Association Planners Press, 2011), 161.
54 Shoup, Free Parking, 137.55 Michael Manville, Alex Beata, and Donald
Shoup, “Turning Housing into Driving: Parking Requirements and Density in Los Angeles and New York,” Housing Policy Debate 23, no. 2 (2013): 351.
14
A B
rief H
isto
ry o
f Par
king
Reg
ulat
ion
supply … is difficult to camouflage”51 whether in lot form or garage form. Either one “tends to interrupt the streetscape, ex-pand the distances between destinations, and undermine walkability.”52 In 1962, Jane Jacobs lamented that cities were “try-ing to combat the suburbs on their own terms” by sacrificing density in favor of parking. “The more downtown is broken up and interspersed with parking lots and garages, the duller and deader it becomes in appearance, and there is nothing more repellent than a dead downtown.”53
Parking standards emphasize the need for car storage over other needs, and they alter the urban form accordingly. Architects find that buildings become an afterthought; they first must worry about providing sufficient parking, then work their designs into the remaining space.54 Having identified a statistical correla-tion between parking requirements and measures of density in New York City, Manville, Beata, and Shoup reasoned that
“parking requirements treat vehicle densi-ty as an inevitable cost of population den-sity, and respond by restricting population to accommodate vehicles.”55
2.3.3 OtherEffects
In addition to the negative consequences of minimum parking requirements explored in this study, critics also accuse free, off-site parking of distorting people’s transporta-tion choices and local economies.
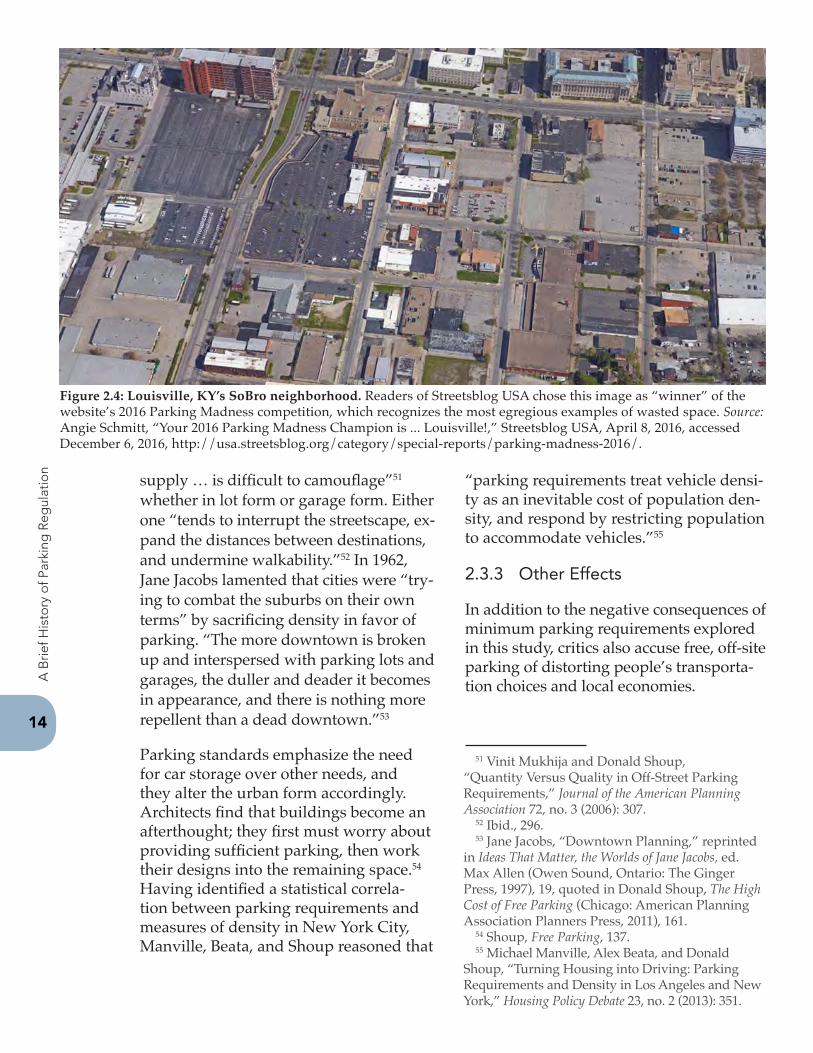
Figure 2.4: Louisville, KY’s SoBro neighborhood. Readers of Streetsblog USA chose this image as “winner” of the website’s 2016 Parking Madness competition, which recognizes the most egregious examples of wasted space. Source: Angie Schmitt, “Your 2016 Parking Madness Champion is ... Louisville!,” Streetsblog USA, April 8, 2016, accessed December 6, 2016, http://usa.streetsblog.org/category/special-reports/parking-madness-2016/.
15
Park
ing
Sp
aces
to L
ivin
g S
pac
es
Shoup and others argue that free parking functions as a subsidy that encourages driving. The knowledge that parking will be available and cheap at one’s desti-nation makes driving a more attractive, convenient transportation option. The result is a self-reinforcing cycle: Vast amounts of parking create places that are poorly suited to other forms of trans-portation. This creates a dependence on cars and promotes more driving, which in turn creates a need for more parking.56 “Because we buy and use cars without thinking about the cost of parking, we congest traffic, waste fuel, and pollute the air more than we would if we each paid for our own parking,”57 Shoup wrote.
Inci declared that the costs of parking “are embedded pretty much in the pric-es of everything else in the city.”58 This goes beyond just housing. Grocery stores and restaurants have to pay for the construction and maintenance of their parking lots, and a portion of the prices they charge goes toward those expens-es. Shoup concluded, “We don’t pay for parking in our role as motorists, but in all
our other roles—as consumers, investors, workers, residents, and taxpayers—we pay a high price.”59
2.4 The Reform Movement
The first parking reforms were the result of the federal government stepping in to impose air quality standards. In the 1970s, lawsuits brought under the federal Clean Air Act led Boston, New York City, and Portland, Oregon, to institute caps on parking that effectively overruled the cities’ minimum parking requirements in certain areas.60 In Boston, for example, the state plan for compliance included a “freeze” intended to keep the number of commercial off-street parking spaces in parts of Boston and Cambridge at 1973 levels.61 In 1982, New York City did away with minimum parking requirements for residential development in most of Man-hattan, replacing them with a maximum cap that limited parking spaces.62 In 1997, Portland instituted a similar system of maximum requirements that allowed more flexibility than the city’s parking freeze.63
With a few exceptions, “there was very little innovation in parking policy for the next 20 years” following the Clean Air Act reforms, according to a survey of practices in U.S. cities prepared by the Institute for Transportation and Development Policy (ITDP);64 however, the report noted, since 2000 “U.S. transportation planners have become much more aware of the effect parking has on congestion, air quality, economic development, and the pedes-trian environment.”65 Numerous jurisdic-tions have eliminated minimum parking requirements in central business districts or near transit stops. Based on a search of local newspaper articles, Shoup identified 129 cities that eliminated minimum re-
56 Shoup, Free Parking, 129.57 Ibid., 128.58 Eren Inci, “A Review of the Economics of
Parking,” Economics of Transportation 4, no. 1 (2015), 56.
59 Ibid., 2.60 Rachel Weinberger, John Kaehny, and Matthew
Rufo, U.S. Parking Strategies: An Overview of Management Strategies (New York: Institute for Transportation and Development Policy, 2010), 43-44.
61 City of Boston Air Pollution Control Commission, Procedures and Criteria for Issuance of Parking Freeze Permits, updated March 15, 2006, accessed May 16, 2016, https://www.cityofboston.gov/images_documents/town_freeze_reg_tcm3-12843.pdf.
62 Been et al., 4.63 Weinberger, Kaehny, and Rufo, 54.64 Ibid., 23.65 Ibid., 12.
16
A B
rief H
isto
ry o
f Par
king
Reg
ulat
ion
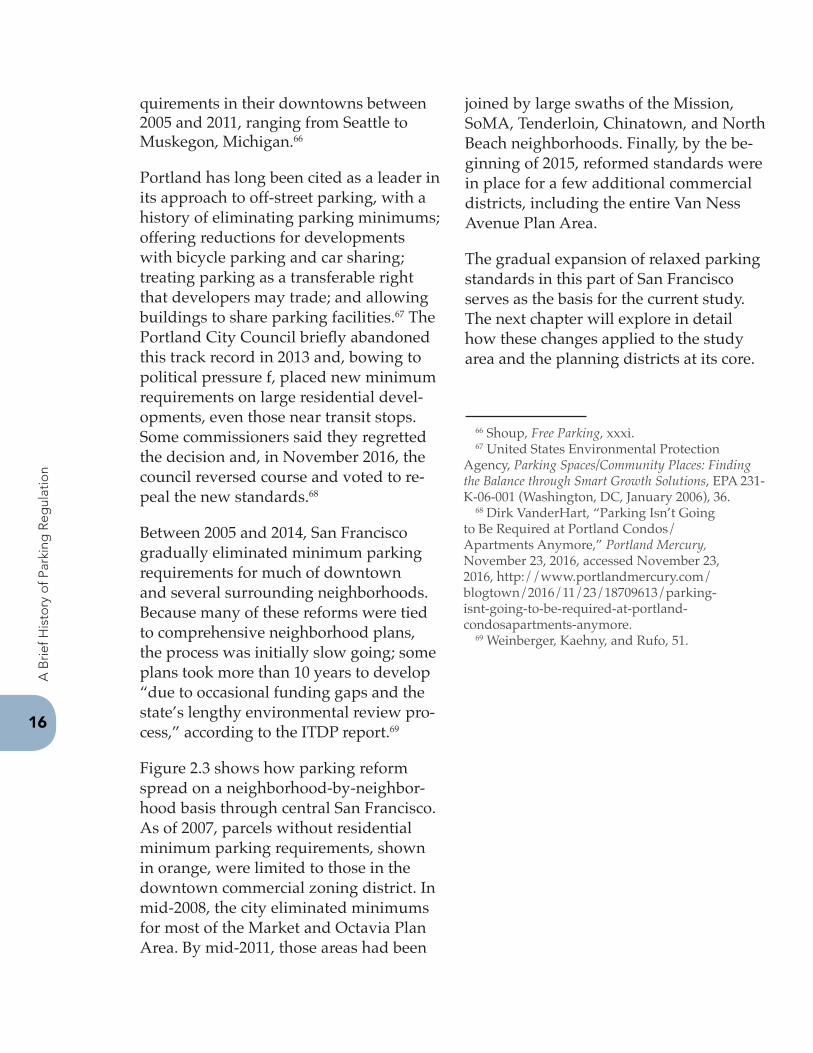
quirements in their downtowns between 2005 and 2011, ranging from Seattle to Muskegon, Michigan.66
Portland has long been cited as a leader in its approach to off-street parking, with a history of eliminating parking minimums; offering reductions for developments with bicycle parking and car sharing; treating parking as a transferable right that developers may trade; and allowing buildings to share parking facilities.67 The Portland City Council briefly abandoned this track record in 2013 and, bowing to political pressure f, placed new minimum requirements on large residential devel-opments, even those near transit stops. Some commissioners said they regretted the decision and, in November 2016, the council reversed course and voted to re-peal the new standards.68
Between 2005 and 2014, San Francisco gradually eliminated minimum parking requirements for much of downtown and several surrounding neighborhoods. Because many of these reforms were tied to comprehensive neighborhood plans, the process was initially slow going; some plans took more than 10 years to develop “due to occasional funding gaps and the state’s lengthy environmental review pro-cess,” according to the ITDP report.69
Figure 2.3 shows how parking reform spread on a neighborhood-by-neighbor-hood basis through central San Francisco. As of 2007, parcels without residential minimum parking requirements, shown in orange, were limited to those in the downtown commercial zoning district. In mid-2008, the city eliminated minimums for most of the Market and Octavia Plan Area. By mid-2011, those areas had been
joined by large swaths of the Mission, SoMA, Tenderloin, Chinatown, and North Beach neighborhoods. Finally, by the be-ginning of 2015, reformed standards were in place for a few additional commercial districts, including the entire Van Ness Avenue Plan Area.
The gradual expansion of relaxed parking standards in this part of San Francisco serves as the basis for the current study. The next chapter will explore in detail how these changes applied to the study area and the planning districts at its core.
66 Shoup, Free Parking, xxxi.67 United States Environmental Protection
Agency, Parking Spaces/Community Places: Finding the Balance through Smart Growth Solutions, EPA 231-K-06-001 (Washington, DC, January 2006), 36.
68 Dirk VanderHart, “Parking Isn’t Going to Be Required at Portland Condos/Apartments Anymore,” Portland Mercury, November 23, 2016, accessed November 23, 2016, http://www.portlandmercury.com/blogtown/2016/11/23/18709613/parking-isnt-going-to-be-required-at-portland-condosapartments-anymore.
69 Weinberger, Kaehny, and Rufo, 51.
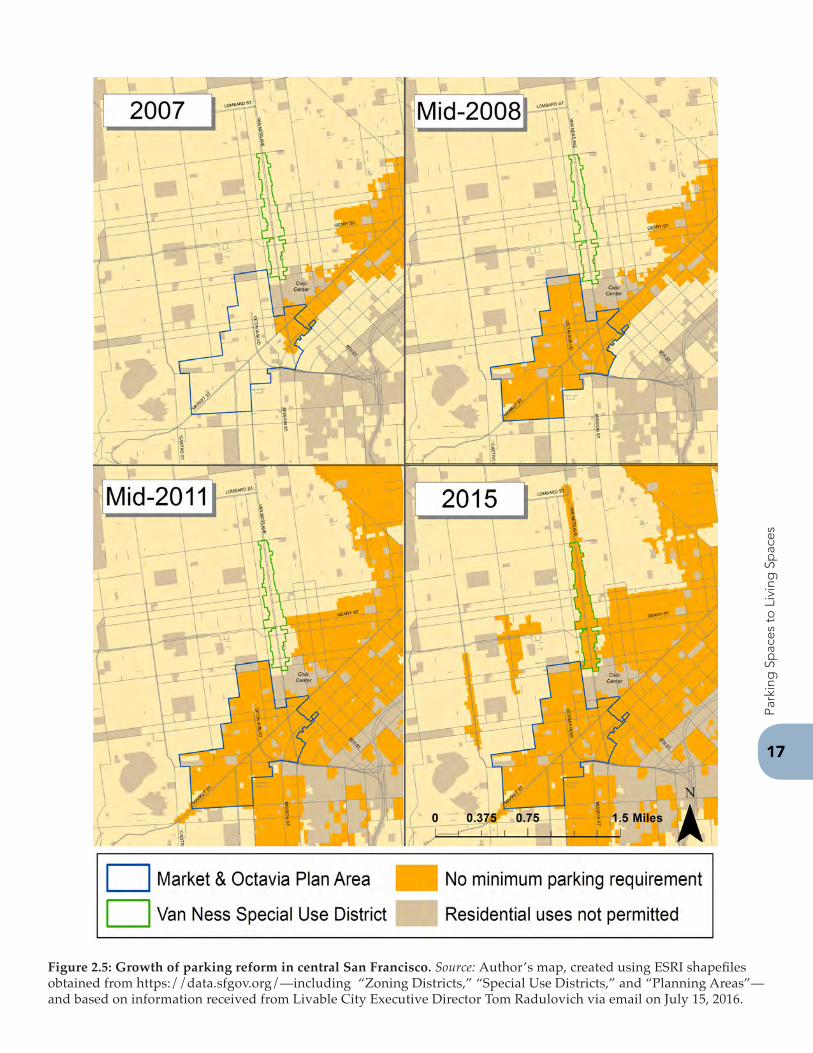
Figure 2.5: Growth of parking reform in central San Francisco. Source: Author’s map, created using ESRI shapefiles obtained from https://data.sfgov.org/—including “Zoning Districts,” “Special Use Districts,” and “Planning Areas”—and based on information received from Livable City Executive Director Tom Radulovich via email on July 15, 2016.
17Pa
rkin
g S
pac
es to
Liv
ing
Sp
aces

Thispageintentionallyleftblank
Chapter 3Chapter 3The Study Area: Where
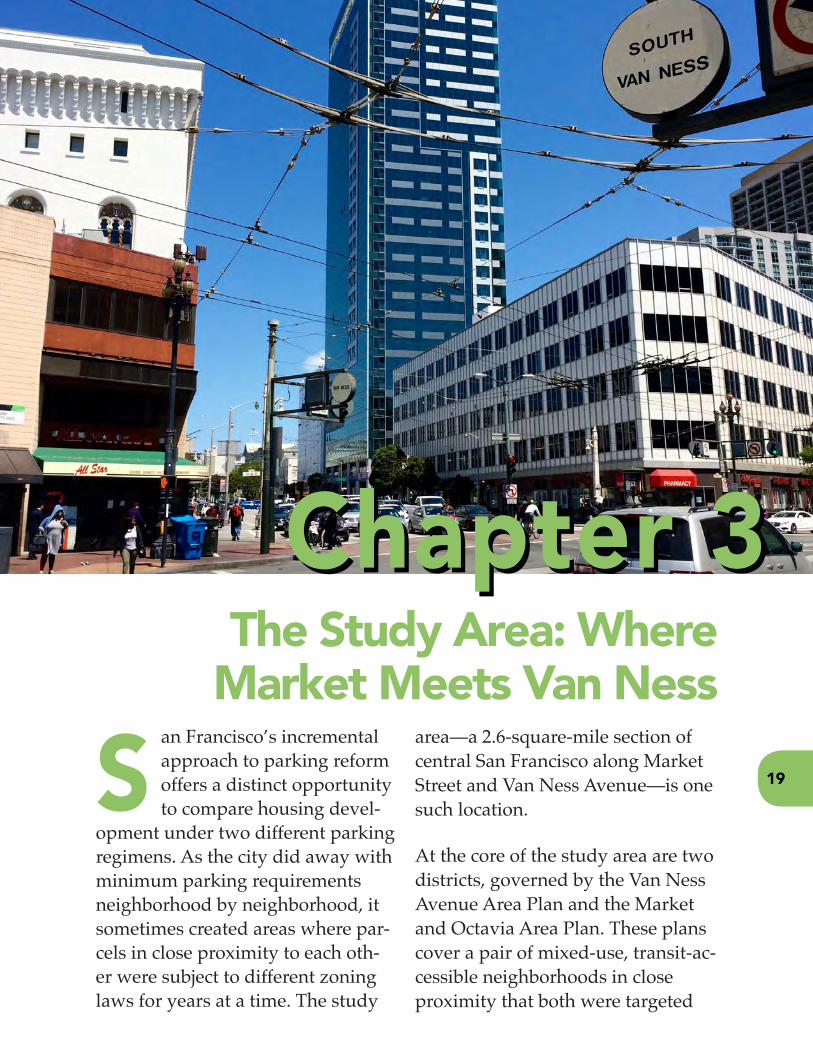
Market Meets Van Ness an Francisco’s incremental approach to parking reform offers a distinct opportunity to compare housing devel-
opment under two different parking regimens. As the city did away with minimum parking requirements neighborhood by neighborhood, it sometimes created areas where par-cels in close proximity to each oth-er were subject to different zoning laws for years at a time. The study
area—a 2.6-square-mile section of central San Francisco along Market Street and Van Ness Avenue—is one such location.
At the core of the study area are two districts, governed by the Van Ness Avenue Area Plan and the Market and Octavia Area Plan. These plans cover a pair of mixed-use, transit-ac-cessible neighborhoods in close proximity that both were targeted
S 19
70 Planning Code Amendments to Implement the Market and Octavia Area Plan, Ordinance No. 72-08, San Francisco Board of Supervisors (April 8, 2008), accessed September 21, 2016, https://sfgov.legistar.com/View.ashx?M=F&ID=710871&GUID=822BCE5D-1185-4FF9-B83A-32F2DFE41835
71 Planning Code: Uses, Conformity of Uses, Parking Requirements for Uses, and Special Use Districts, Ordinance No. 232-14, San Francisco Board of Supervisors (November 18, 2014), accessed September 21, 2016, https://sfgov.legistar.com/View.ashx?M=F&ID=3395373&GUID=865394CC-7771-46ED-9D30-39F6987DA43B
for new housing development. But while one has been managed since early 2008 by zoning that explicitly set out to encourage development with reduced parking, the other continued under the city’s old ap-proach until late 2014.
This chapter first defines the parameters of the study, both in terms of geography and time. This is followed by an in-depth look at the study area, beginning with the major intersection at its center. From there it expands outward to examine the two Area Plans and the neighborhoods they govern, and finally a survey of the broader study area, how it is zoned, and its suit-ability for a comparative study. The final section addresses how exemptions from parking requirements play into the design of the study.
3.1 DefiningtheStudyParameters
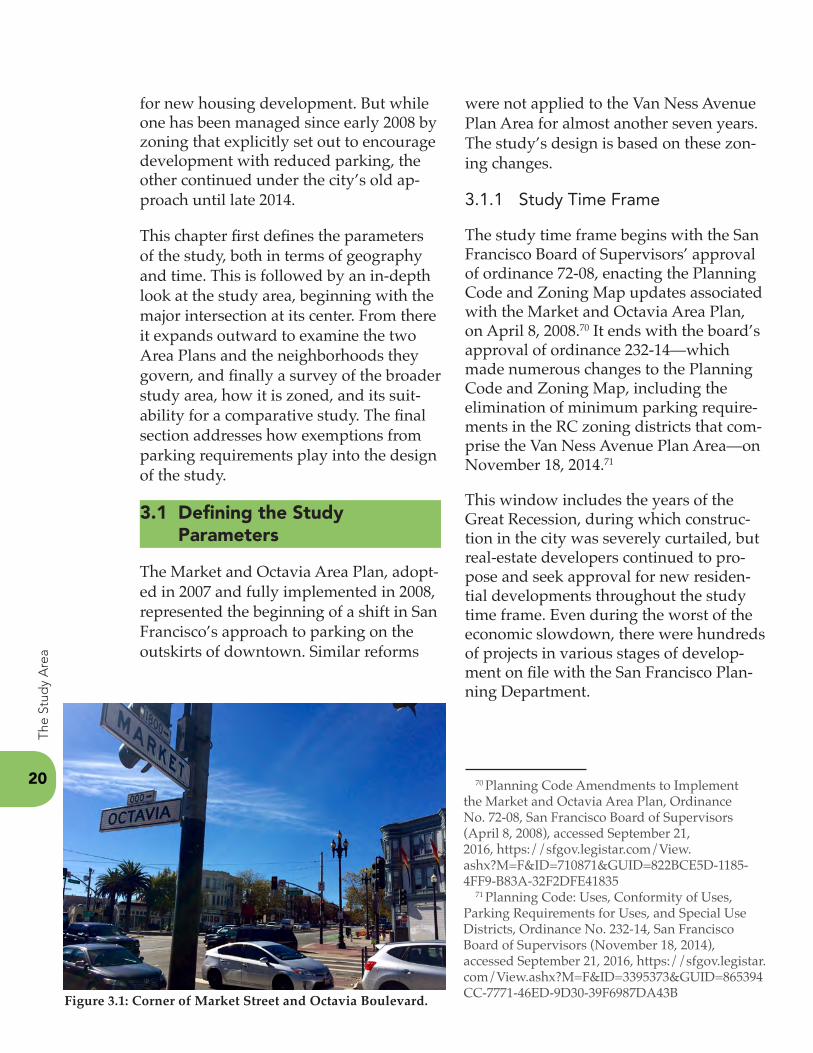
The Market and Octavia Area Plan, adopt-ed in 2007 and fully implemented in 2008, represented the beginning of a shift in San Francisco’s approach to parking on the outskirts of downtown. Similar reforms
were not applied to the Van Ness Avenue Plan Area for almost another seven years. The study’s design is based on these zon-ing changes.
3.1.1 Study Time Frame
The study time frame begins with the San Francisco Board of Supervisors’ approval of ordinance 72-08, enacting the Planning Code and Zoning Map updates associated with the Market and Octavia Area Plan, on April 8, 2008.70 It ends with the board’s approval of ordinance 232-14—which made numerous changes to the Planning Code and Zoning Map, including the elimination of minimum parking require-ments in the RC zoning districts that com-prise the Van Ness Avenue Plan Area—on November 18, 2014.71
This window includes the years of the Great Recession, during which construc-tion in the city was severely curtailed, but real-estate developers continued to pro-pose and seek approval for new residen-tial developments throughout the study time frame. Even during the worst of the economic slowdown, there were hundreds of projects in various stages of develop-ment on file with the San Francisco Plan-ning Department.
20
The
Stud
y A
rea
Figure 3.1: Corner of Market Street and Octavia Boulevard.
21Pa
rkin
g S
pac
es to
Liv
ing
Sp
aces
3.1.2 Study Area
The study area is defined as all parcels within 2,000 feet of those segments of Market Street and Van Ness Avenue that fall within either the Market and Octavia Plan Area or Van Ness Special Use District (SUD), a subset of the Van Ness Avenue Plan Area (see Figure 1.1). The 2,000-foot measurement is roughly equivalent to four blocks. This distance puts all parcels with-in a reasonable, half-mile walk of the main roads and their frequent transit stops.
This distance also means that nearly the entire Market and Octavia Plan Area is included in the study. Along Van Ness Av-enue, the study area extends beyond the Van Ness SUD by several blocks, but these areas were subject to the same parking requirements during the time frame.
While the differences in parking standards for the Market and Octavia Area Plan and Van Ness SUD provided a conceptual framework for the study, it is ultimately not a comparison of one planning district to another. Instead, the analysis looks at each parcel marked for development and determines what requirements were in place at the time the project was ap-proved.
In this way, even parcels that may have been subject to different parking stan-dards at different points during the study time frame could still be included in the analysis. For example, the study area includes some areas near Market Street that fall within the Mission, West SoMa, and East SoMa plan areas, as well as the Upper Market Neighborhood Commer-
cial District. These areas all underwent parking reforms similar to the Market and Octavia Area Plan between 2008 and 2011. So a building approved for SoMa in 2008 might be grouped with developments in the Van Ness SUD that had a minimum requirement of one parking space per unit, while a building approved for that same block in 2012 might be grouped with developments in the Market and Octavia Plan Area that had no minimum parking requirement.
3.2 TheIntersectionofMarket&Van Ness
At the center of the study area is one of the most important intersections in all of San Francisco. Market Street is the city’s de facto main street, while Van Ness Ave-nue is the primary road connecting central San Francisco to the northern waterfront. It is not only the meeting point of two major automobile routes but also the place where all the city’s streetcar lines and major street grids converge. One devel-oper called the intersection “the most transit-rich site … in the western United States, [with] 36 transit lines within a cou-ple blocks.”
3.3 TheAreaPlansandTheirNeighborhoods
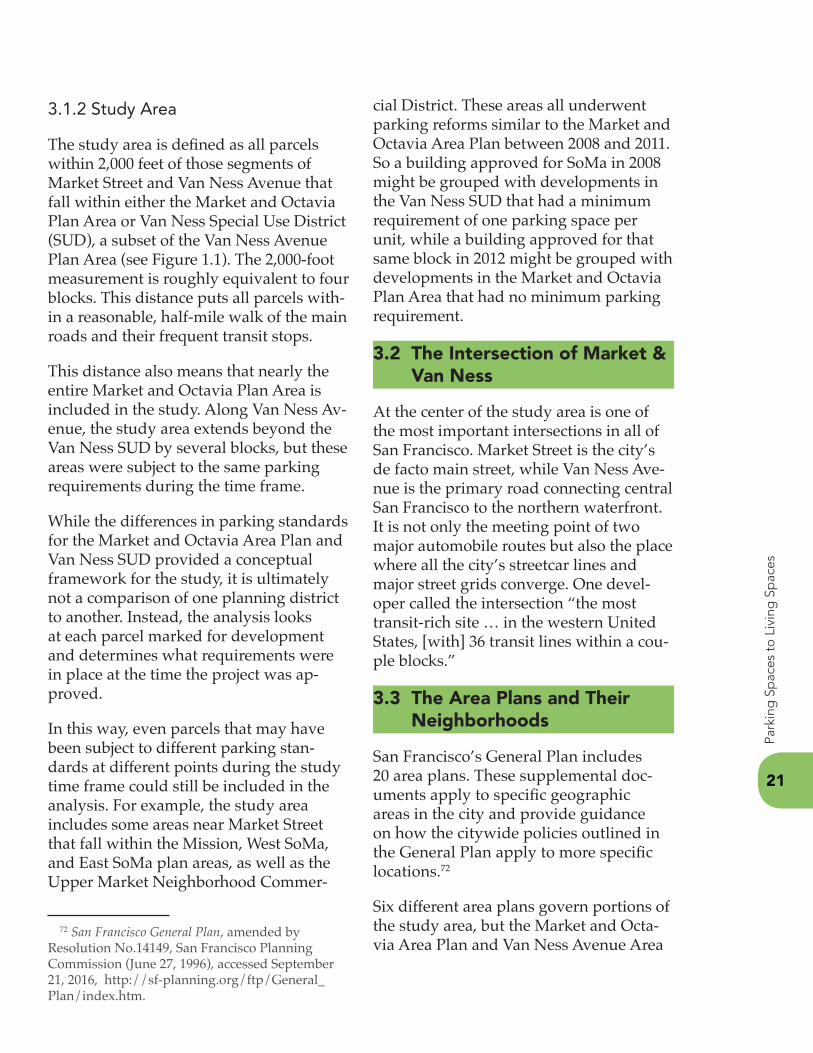
San Francisco’s General Plan includes 20 area plans. These supplemental doc-uments apply to specific geographic areas in the city and provide guidance on how the citywide policies outlined in the General Plan apply to more specific locations.72
Six different area plans govern portions of the study area, but the Market and Octa-via Area Plan and Van Ness Avenue Area
72 San Francisco General Plan, amended by Resolution No.14149, San Francisco Planning Commission (June 27, 1996), accessed September 21, 2016, http://sf-planning.org/ftp/General_Plan/index.htm.
73 Van Ness Avenue Area Plan, amended by Resolution 13907, San Francisco Planning Commission (July 6, 1995), accessed September 21, 2016, http://sf-planning.org/ftp/General_Plan/Van_Ness_Ave.htm
74 San Francisco Planning Department, Van Ness Avenue Plan Initial Study, Case No. 82.392EZTM (San Francisco: June 10, 1983), accessed September 21, 2016, https://archive.org/stream/vannessavenuepla1019sanf#page/n1/mode/2up
75 John McCloud, New York Times News Service, “San Francisco Developing a ‘Champs-Elysees,’” Chicago Tribune, June 19, 1992, accessed September 21, 2016, http://articles.chicagotribune.com/1992-01-19/business/9201060060_1_retail-space-residential-projects-feet-of-residential-space.
22
The
Stud
y A
rea
Plan have been especially crucial in guid-ing development along the transportation corridors. The neighborhoods they govern serve as a transition between the intense commercial development of downtown San Francisco and the primarily residen-tial areas to the west. Influenced by two major earthquakes, they have developed into mixed-use districts featuring con-dominium and apartment towers above ground-floor retail storefronts.
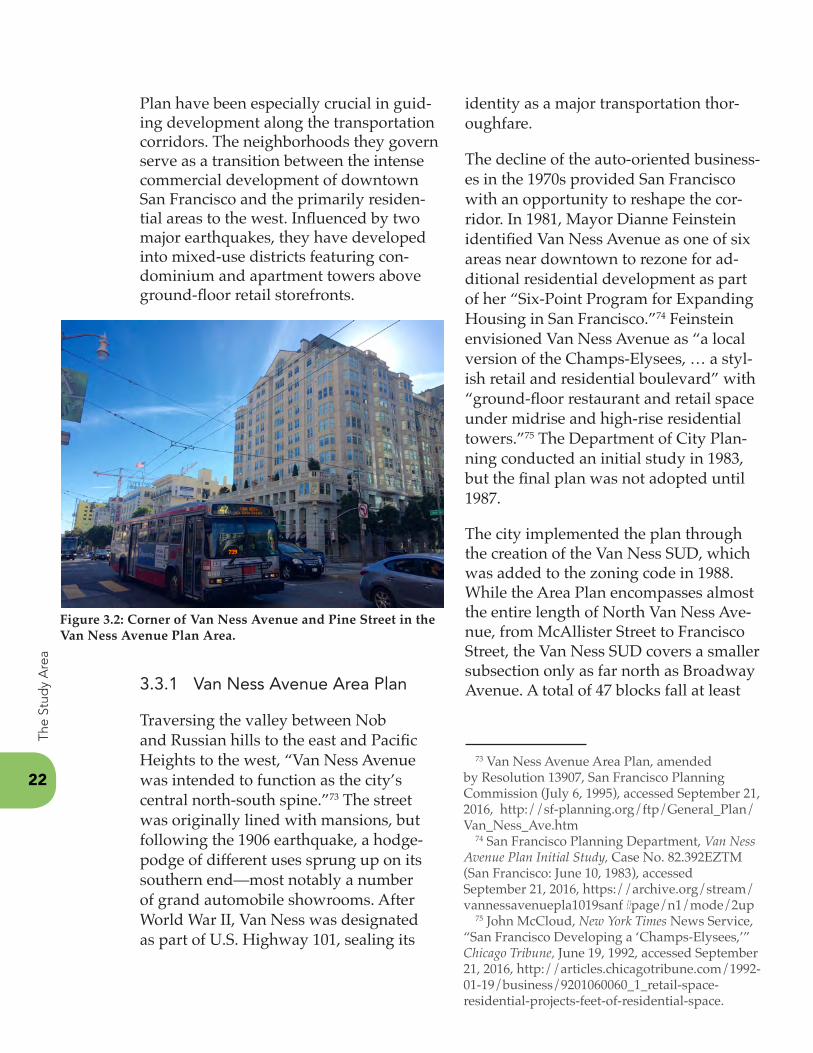
3.3.1 Van Ness Avenue Area Plan
Traversing the valley between Nob and Russian hills to the east and Pacific Heights to the west, “Van Ness Avenue was intended to function as the city’s central north-south spine.”73 The street was originally lined with mansions, but following the 1906 earthquake, a hodge-podge of different uses sprung up on its southern end—most notably a number of grand automobile showrooms. After World War II, Van Ness was designated as part of U.S. Highway 101, sealing its
identity as a major transportation thor-oughfare.
The decline of the auto-oriented business-es in the 1970s provided San Francisco with an opportunity to reshape the cor-ridor. In 1981, Mayor Dianne Feinstein identified Van Ness Avenue as one of six areas near downtown to rezone for ad-ditional residential development as part of her “Six-Point Program for Expanding Housing in San Francisco.”74 Feinstein envisioned Van Ness Avenue as “a local version of the Champs-Elysees, … a styl-ish retail and residential boulevard” with “ground-floor restaurant and retail space under midrise and high-rise residential towers.”75 The Department of City Plan-ning conducted an initial study in 1983, but the final plan was not adopted until 1987.
The city implemented the plan through the creation of the Van Ness SUD, which was added to the zoning code in 1988. While the Area Plan encompasses almost the entire length of North Van Ness Ave-nue, from McAllister Street to Francisco Street, the Van Ness SUD covers a smaller subsection only as far north as Broadway Avenue. A total of 47 blocks fall at least
Figure 3.2: Corner of Van Ness Avenue and Pine Street in the Van Ness Avenue Plan Area.
23Pa
rkin
g S
pac
es to
Liv
ing
Sp
aces
partially within the district.76 Prior to the adoption of the Van Ness SUD, the mini-mum parking requirement for residential uses in this area had been one space for every four units, but the new zoning in-creased the requirement to one space per unit within the district. This was the last time a zoning change sought to increase parking requirements in San Francisco.
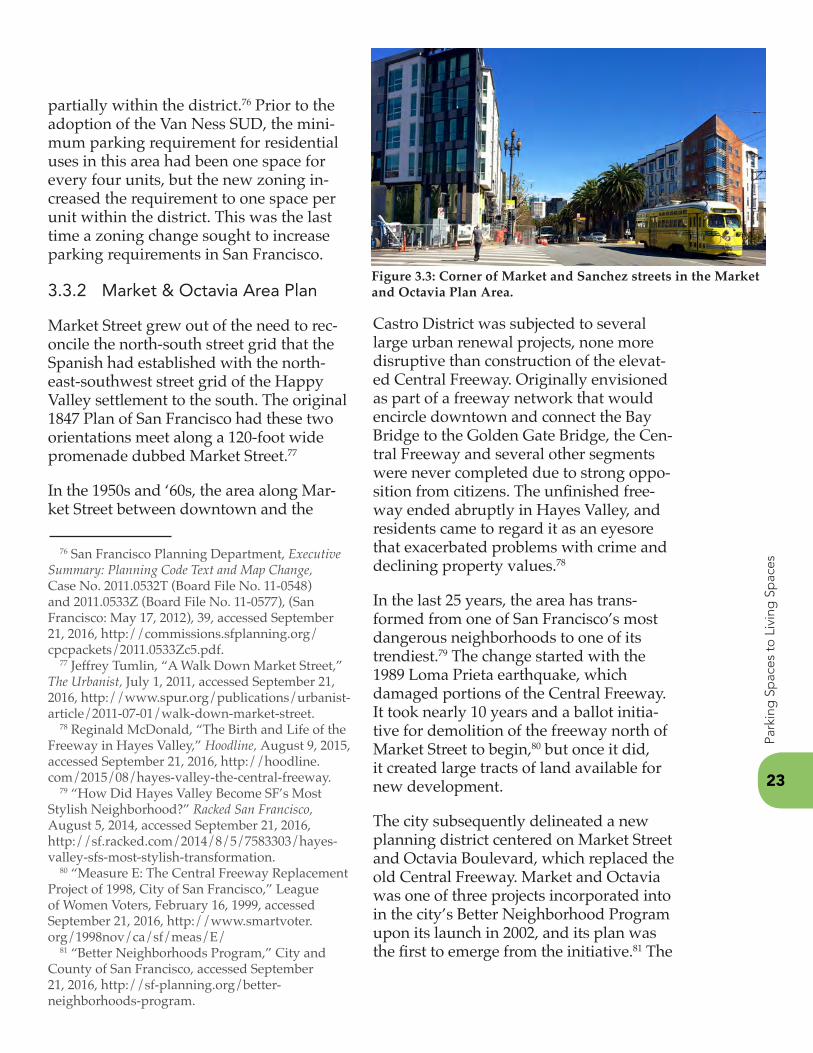
3.3.2 Market & Octavia Area Plan
Market Street grew out of the need to rec-oncile the north-south street grid that the Spanish had established with the north-east-southwest street grid of the Happy Valley settlement to the south. The original 1847 Plan of San Francisco had these two orientations meet along a 120-foot wide promenade dubbed Market Street.77
In the 1950s and ‘60s, the area along Mar-ket Street between downtown and the
Castro District was subjected to several large urban renewal projects, none more disruptive than construction of the elevat-ed Central Freeway. Originally envisioned as part of a freeway network that would encircle downtown and connect the Bay Bridge to the Golden Gate Bridge, the Cen-tral Freeway and several other segments were never completed due to strong oppo-sition from citizens. The unfinished free-way ended abruptly in Hayes Valley, and residents came to regard it as an eyesore that exacerbated problems with crime and declining property values.78
In the last 25 years, the area has trans-formed from one of San Francisco’s most dangerous neighborhoods to one of its trendiest.79 The change started with the 1989 Loma Prieta earthquake, which damaged portions of the Central Freeway. It took nearly 10 years and a ballot initia-tive for demolition of the freeway north of Market Street to begin,80 but once it did, it created large tracts of land available for new development.
The city subsequently delineated a new planning district centered on Market Street and Octavia Boulevard, which replaced the old Central Freeway. Market and Octavia was one of three projects incorporated into in the city’s Better Neighborhood Program upon its launch in 2002, and its plan was the first to emerge from the initiative.81 The
76 San Francisco Planning Department, Executive Summary: Planning Code Text and Map Change, Case No. 2011.0532T (Board File No. 11-0548) and 2011.0533Z (Board File No. 11-0577), (San Francisco: May 17, 2012), 39, accessed September 21, 2016, http://commissions.sfplanning.org/cpcpackets/2011.0533Zc5.pdf.
77 Jeffrey Tumlin, “A Walk Down Market Street,” The Urbanist, July 1, 2011, accessed September 21, 2016, http://www.spur.org/publications/urbanist-article/2011-07-01/walk-down-market-street.
78 Reginald McDonald, “The Birth and Life of the Freeway in Hayes Valley,” Hoodline, August 9, 2015, accessed September 21, 2016, http://hoodline.com/2015/08/hayes-valley-the-central-freeway.
79 “How Did Hayes Valley Become SF’s Most Stylish Neighborhood?” Racked San Francisco, August 5, 2014, accessed September 21, 2016, http://sf.racked.com/2014/8/5/7583303/hayes-valley-sfs-most-stylish-transformation.
80 “Measure E: The Central Freeway Replacement Project of 1998, City of San Francisco,” League of Women Voters, February 16, 1999, accessed September 21, 2016, http://www.smartvoter.org/1998nov/ca/sf/meas/E/
81 “Better Neighborhoods Program,” City and County of San Francisco, accessed September 21, 2016, http://sf-planning.org/better-neighborhoods-program.
Figure 3.3: Corner of Market and Sanchez streets in the Market and Octavia Plan Area.
82 Market and Octavia Area Plan, Ordinance No. 0246-07, San Francisco Board of Supervisors (October 23, 2007), accessed September 21, 2016, http://sf-planning.org/ftp/General_Plan/Market_Octavia.htm
24
The
Stud
y A
rea
city formally adopted and incorporated the Market and Octavia Area Plan into its General Plan in 2007.
The plan describes Market and Octavia as “a crossroads,” “a natural point of entry to the downtown from the rest of the city,” and “a truly urban place … that supports a variety of lifestyles, ages, and incomes.” Based on the neighborhood’s “excellent access to city and regional public transit,” the plan pointedly calls for future devel-opment that supports car-free living and reduces the “space devoted to moving and storing” automobiles.82
3.4 ZoningintheStudyArea
Prior to the rezoning of the Market and Octavia Plan Area, the RH-3 (Residential, House, Three Family) zoning designation represented the largest share of land in the neighborhood (see Table 3.1). The zoning district, which allows houses with three dwelling units per lot, accounted for 18 percent of the land area. The remainder was distributed among 12 other zoning districts, including some lower-density RH zones, mixed residential zones of varying density (RM-1, -2 and -3) that allowed for both houses and apartments, and Neighborhood Commercial Districts (NCD) that encouraged continuous com-mercial development at the street level with housing on upper floors. The eastern corner of the plan area was part of the Downtown General Commercial (C-3-G) zoning district.
With the exception of C-3-G, all of these zoning designations came with the city’s standard minimum parking requirement of one space per dwelling unit.
Ordinance 72-08 created two new zoning districts intended for areas that are well-served by transit. Nearly all of the residen-tial districts in the plan area were rezoned as Residential, Transit-Oriented (RTO), while the NCD parcels were changed to Neighborhood Commercial Transit (NCT) districts. Neither of these new districts had minimum parking requirements. NCT districts established a maximum require-ment of one space for every two units, with up to three spaces for every four units allowed with approval from the San Francisco Planning Commission. In RTO districts, developers could provide three spaces per four units by right and seek ap-proval for as much as one space per unit.
In contrast, the Van Ness SUD was uni-formly zoned as RC-4 (Residential-Com-mercial-Combined, High Density). These districts “encourage a combination of high-density dwellings, with compatible commercial uses on the ground floor.” Surrounding parcels included additional RC-4 and lower-density RC-3 districts, as well as a mix of RH, RM, NCD, and C-3-G districts somewhat similar to what had been found in the Market and Octavia Plan Area prior to rezoning. Again, with the exception of C-3-G, all of these districts required one space per dwelling unit.
When parking reform came to Van Ness Avenue in 2014, the city did not create any new zoning districts or rezone any parcels. The Board of Supervisors just approved language in the planning code that altered the parking requirements for all RC districts, both within and outside the Van Ness SUD.
25Pa
rkin
g S
pac
es to
Liv
ing
Sp
aces
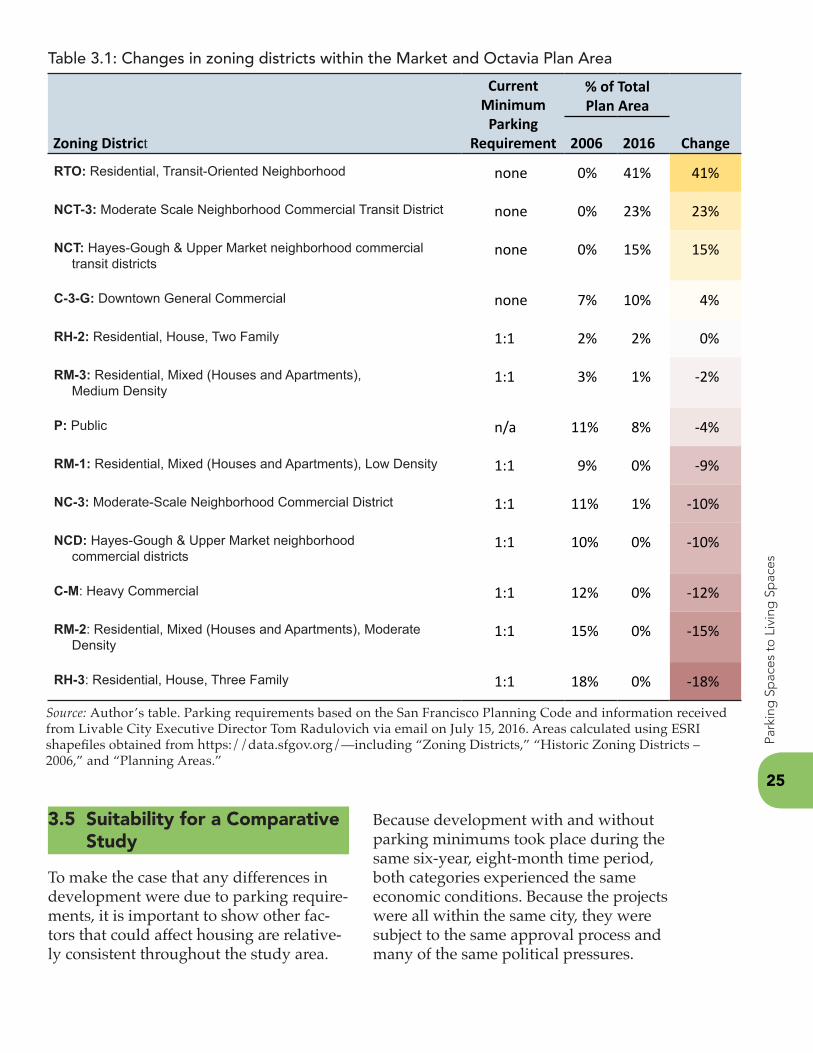
3.5 SuitabilityforaComparativeStudy
To make the case that any differences in development were due to parking require-ments, it is important to show other fac-tors that could affect housing are relative-ly consistent throughout the study area.
Because development with and without parking minimums took place during the same six-year, eight-month time period, both categories experienced the same economic conditions. Because the projects were all within the same city, they were subject to the same approval process and many of the same political pressures.
Zoning District
CurrentMinimum
ParkingRequirement
% of Total Plan Area
Change2006 2016
RTO: Residential, Transit-Oriented Neighborhood none 0% 41% 41%
NCT-3: Moderate Scale Neighborhood Commercial Transit District none 0% 23% 23%
NCT: Hayes-Gough & Upper Market neighborhood commercial transit districts
none 0% 15% 15%
C-3-G: Downtown General Commercial none 7% 10% 4%
RH-2: Residential, House, Two Family 1:1 2% 2% 0%
RM-3: Residential, Mixed (Houses and Apartments), Medium Density
1:1 3% 1% -2%
P: Public n/a 11% 8% -4%
RM-1: Residential, Mixed (Houses and Apartments), Low Density 1:1 9% 0% -9%
NC-3: Moderate-Scale Neighborhood Commercial District 1:1 11% 1% -10%
NCD: Hayes-Gough & Upper Market neighborhood commercial districts
1:1 10% 0% -10%
C-M: Heavy Commercial 1:1 12% 0% -12%
RM-2: Residential, Mixed (Houses and Apartments), Moderate Density
1:1 15% 0% -15%
RH-3: Residential, House, Three Family 1:1 18% 0% -18%
Source: Author’s table. Parking requirements based on the San Francisco Planning Code and information received from Livable City Executive Director Tom Radulovich via email on July 15, 2016. Areas calculated using ESRI shapefiles obtained from https://data.sfgov.org/—including “Zoning Districts,” “Historic Zoning Districts – 2006,” and “Planning Areas.”
Table 3.1: Changes in zoning districts within the Market and Octavia Plan Area
While the neighborhoods that make up the study area are not identical, they have much in common. As defined by the local advocacy group TransForm, the vast ma-jority of the study area is a High Quality Transit Area, meaning that residents have to walk a half mile or less to reach a rail or bus station with service at least every 15 minutes.83 Only parts of a few blocks on the western edge of the Van Ness corridor—one section around Eddy Street and another north of Broadway—fail to meet this definition.84
There are more transit options in the Market and Octavia Plan Area, which benefits from the presence of streetcar lines along Market, Church, and Dubose streets, as well as the Civic Center BART station just east of the plan area. Transit in the northern section of the Van Ness SUD is generally limited to bus service, but there is frequent service along Van Ness Avenue. Three more high-frequency, east-west lines cross at Clay/Sacramento, Geary/O’Farrell, and McAllister streets.85
Both planning areas are dense, urban neighborhoods. Most of the census block groups found within their boundaries have population densities greater than the San Francisco’s overall citywide density of about 17,000 people per square mile (see Figure 3.5). While the block groups on the west side of Van Ness Avenue are comparable to the majority of the Market and Octavia Plan Area, those on the east side are notably denser. This is partly due to the fact that the block groups extend eastward into downtown and some of the city’s densest areas.
Tall and mid-rise residential towers are the norm along the major streets. The height and bulk districts in the city’s zon-
ing code allow 400-foot skyscrapers right at the intersection of Market and Van Ness while limiting buildings to 40 feet in some outlying areas. In general, buildings up to 85 feet are allowed along Market Street,86 while they can reach 130 feet along much of Van Ness Avenue.87
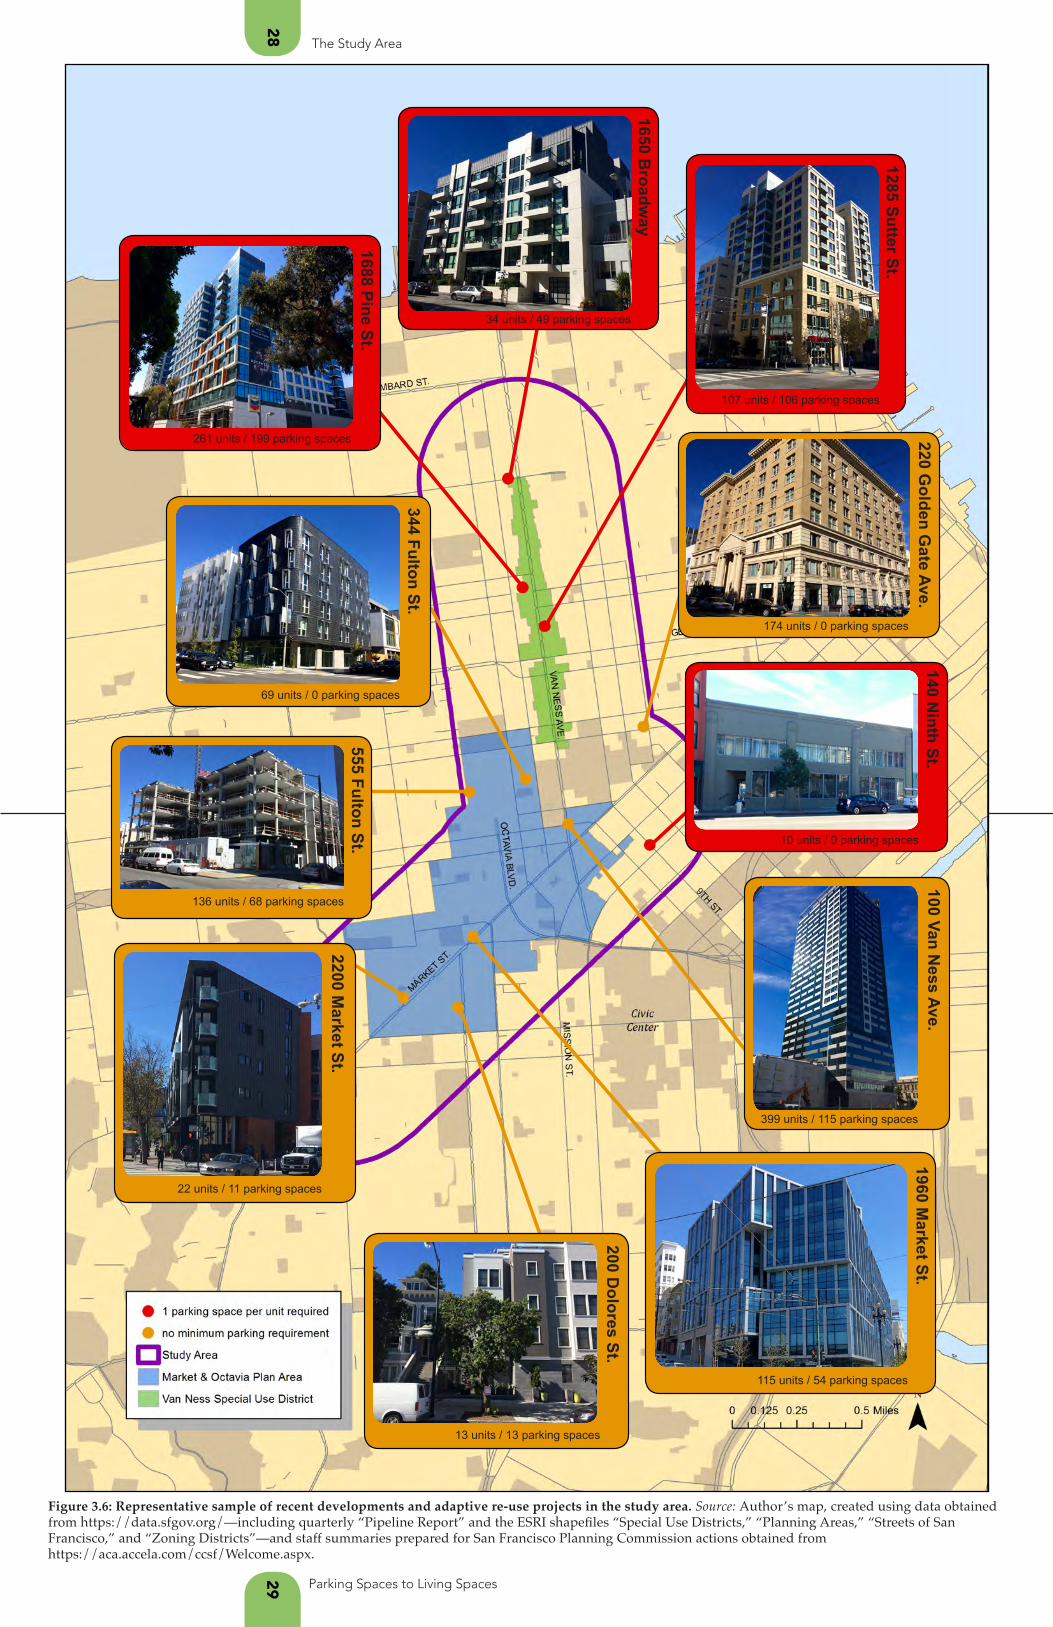
Figure 3.6 shows a representative sample of recent developments and adaptive re-use within the study area, all of which are included in the analysis in Chapter 4.
83 “GreenTrip Connect – Glossary of Terms,” TransForm, accessed September 21, 2016, http://www.transformca.org/GreenTRIP/Connect/Glossary; Southern California Association of Governments, “Sustainable Communities Strategy,” 2012 Regional Transportation Plan (Los Angeles: 2012), 112, accessed September 21, 2016, http://rtpscs.scag.ca.gov/Documents/2012/draft/2012dRTP_04_SCS.pdf.
84 “GreenTrip Connect beta,” TransForm, accessed September 21, 2016, http://connect.greentrip.org/map-tool.php.
85 David Wiggins and Jay Primus, “San Francisco Transit Map” (map), 2014, accessed September 21, 2016, http://sf.streetsblog.org/wp-content/uploads/sites/3/2014/10/New-Muni-Map.jpg.
86 San Francisco Planning Department, “Height and Bulk Districts” (map), 1:14,000, Zoning Map of the City and County of San Francisco, sheet HT07 (San Francisco: City and County of San Francisco, 2016), accessed September 21, 2016, http://library.amlegal.com/nxt/gateway.dll/California/zoningmaps/dat/0-0-0-1523.pdf?f=templates$fn=document-frame.htm$3.0.
87 San Francisco Planning Department, “Height and Bulk Districts” (map), 1:14,000, Zoning Map of the City and County of San Francisco, sheet HT02 (San Francisco: City and County of San Francisco, 2016), accessed September 21, 2016, http://library.amlegal.com/nxt/gateway.dll/California/zoningmaps/dat/0-0-0-1519.pdf?f=templates$fn=document-frame.htm$3.0.
26
The
Stud
y A
rea
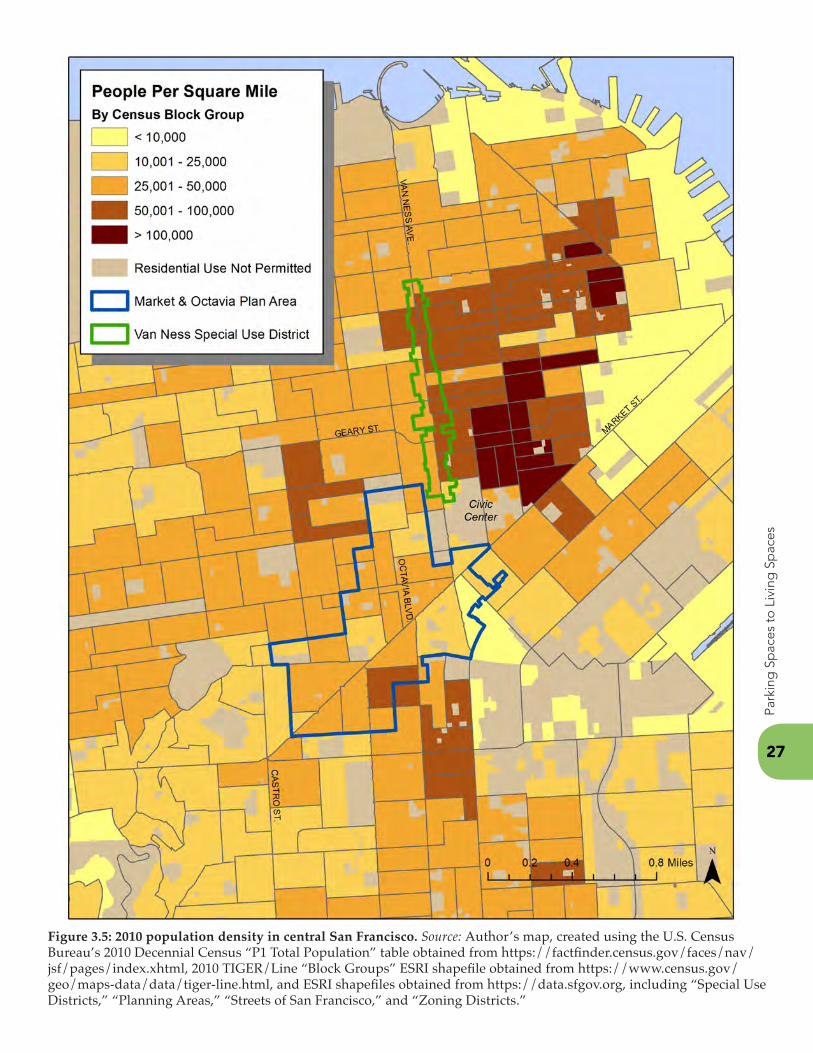
Figure 3.5: 2010 population density in central San Francisco. Source: Author’s map, created using the U.S. Census Bureau’s 2010 Decennial Census “P1 Total Population” table obtained from https://factfinder.census.gov/faces/nav/jsf/pages/index.xhtml, 2010 TIGER/Line “Block Groups” ESRI shapefile obtained from https://www.census.gov/geo/maps-data/data/tiger-line.html, and ESRI shapefiles obtained from https://data.sfgov.org, including “Special Use Districts,” “Planning Areas,” “Streets of San Francisco,” and “Zoning Districts.”
27Pa
rkin
g S
pac
es to
Liv
ing
Sp
aces
28
The Study Area
29 Parking Spaces to Living Spaces
Figure 3.6: Representative sample of recent developments and adaptive re-use projects in the study area. Source: Author’s map, created using data obtained from https://data.sfgov.org/—including quarterly “Pipeline Report” and the ESRI shapefiles “Special Use Districts,” “Planning Areas,” “Streets of San Francisco,” and “Zoning Districts”—and staff summaries prepared for San Francisco Planning Commission actions obtained fromhttps://aca.accela.com/ccsf/Welcome.aspx.
1650 Broadw
ay
34 units / 49 parking spaces
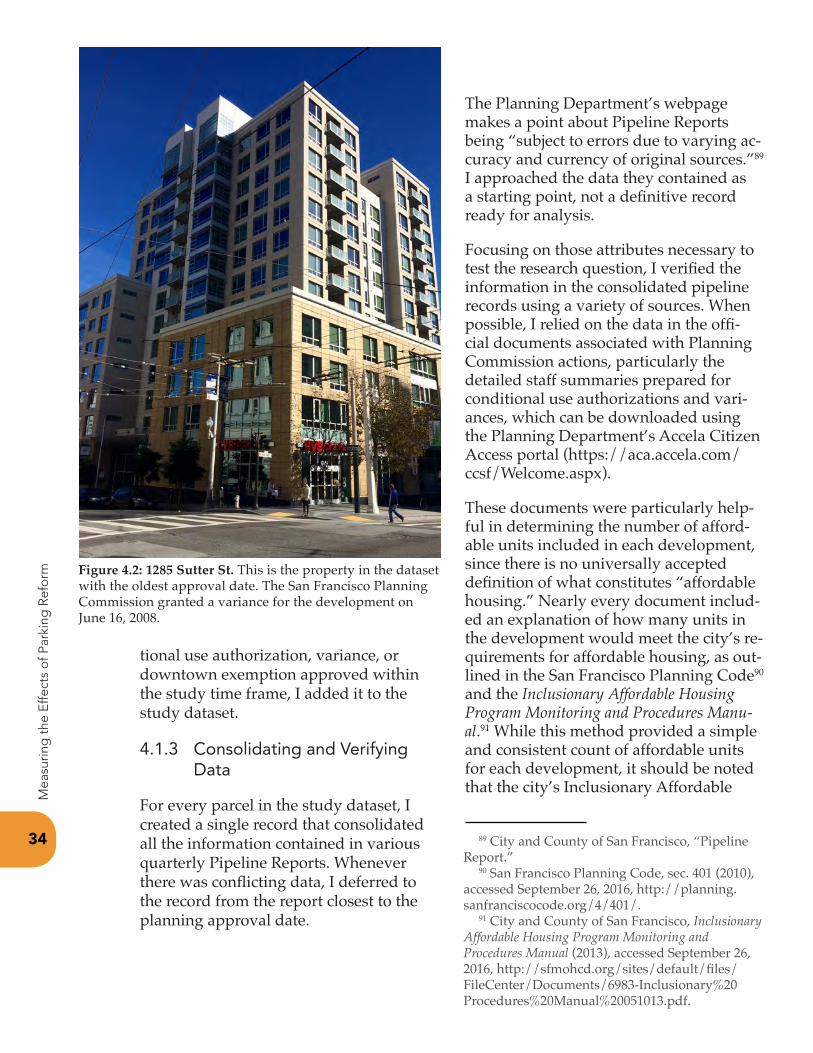
1285 Sutter St.
107 units / 106 parking spaces
555 Fulton St.
136 units / 68 parking spaces
344 Fulton St.
69 units / 0 parking spaces
2200 Market St.
22 units / 11 parking spaces
200 Dolores St.
13 units / 13 parking spaces
1960 Market St.
115 units / 54 parking spaces
100 Van Ness Ave.
399 units / 115 parking spaces
140 Ninth St.
10 units / 0 parking spaces
220 Golden G
ate Ave.
174 units / 0 parking spaces
1688 Pine St.
261 units / 199 parking spaces

This page intentionally left blank
Chapter 4Chapter 4Measuring the Effects of
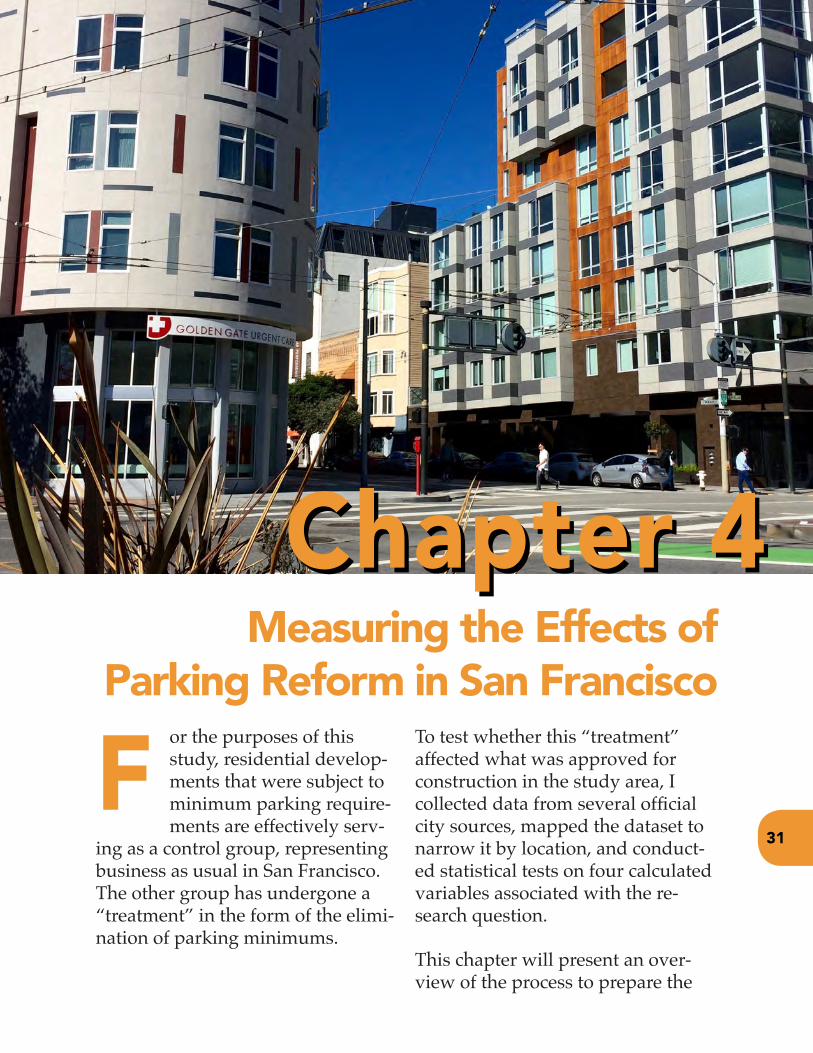
Parking Reform in San Franciscoor the purposes of this study, residential develop-ments that were subject to minimum parking require-ments are effectively serv-
ing as a control group, representing business as usual in San Francisco. The other group has undergone a “treatment” in the form of the elimi-nation of parking minimums.
To test whether this “treatment” affected what was approved for construction in the study area, I collected data from several official city sources, mapped the dataset to narrow it by location, and conduct-ed statistical tests on four calculated variables associated with the re-search question.
This chapter will present an over-view of the process to prepare the
F31
32
Mea
surin
g t
he E
ffect
s o
f Par
king
Ref
orm
data and calculate the variables, the results of the analysis, and what those results im-ply about parking reform in San Francisco.
4.1 Methodology
The first step in the analysis was to identi-fy all of the development projects that:
• Fall within the study area, as defined in Section 3.2.2.
• Received final approval from the San Francisco Planning Commission be-tween April 8, 2008, and November 18, 2014.
• Increased the city’s housing stock by at least 10 dwelling units.
The reason for the final criterion was partially due to limitations of the primary data source: Pipeline Reports produced by the San Francisco Planning Department, which are described in greater detail below. Prior to 2012, the reports included only residential developments of at least 10 units. Although later reports listed development projects of all sizes, I did not include anything smaller than 10 units in my analysis in order to maintain consis-tency. In addition, a review of five small properties found in later Pipeline Reports showed they were often fundamentally different in nature than the larger residen-tial developments—adding only a few new units to existing residential structures through additions or conversions.
4.1.1 Preparing a Dataset from the San Francisco Pipeline Report
The Pipeline Report is intended to be a quarterly snapshot of every project in San Francisco that would add residential units or commercial space and for which a de-veloper has submitted a land-use or build-
ing-permit application. The data mainly comes from databases maintained by the San Francisco Planning Department and Department of Building Inspection (DBI) and reflects projects in various stages of development.88
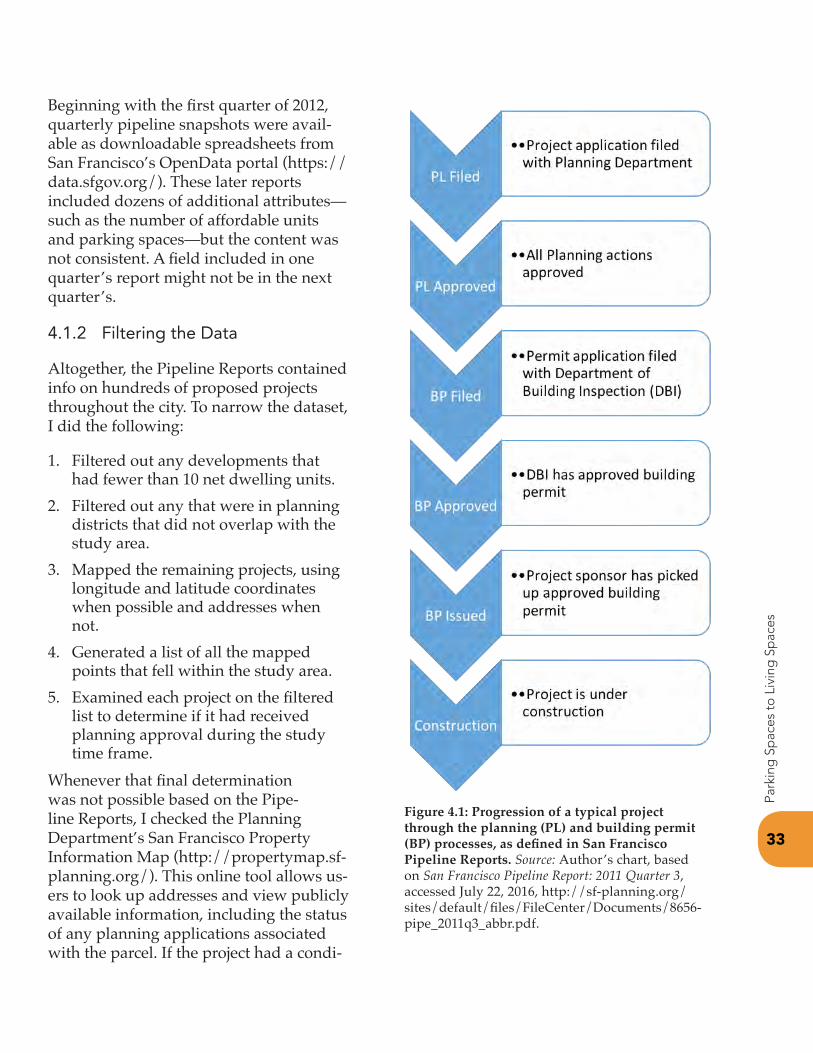
Because it can take a project years to prog-ress from its first filing to construction, the same location is often listed in many consecutive Pipeline Reports with differ-ent statuses. Figure 4.1 shows a typical progression. Information is not always consistent across these reports, reflecting updates to the proposal itself, staffing changes at the development firm, new geographic classifications used by the city, corrections of errors, and unknown causes.
The report format changed significantly over the study time frame. Reports prior to the first quarter of 2012 were issued as PDF files and contained only static listings with a limited amount of information: the project’s address, parcel number, planning district, net commercial square footage, net dwelling units, land use designation, current status, and the date at which it achieved that status.
No Pipeline Reports were posted for the third and fourth quarter of 2008, first and third quarter of 2009, first and fourth quarter of 2010, and fourth quarter of 2011, and it was unclear whether the Plan-ning Department even produced reports for those quarters; however, given the length of the development process in San Francisco, it is extremely unlikely that any project approved in those quarters would not have appeared in any of the prior or subsequent Pipeline Reports.
88 City and County of San Francisco, “The Pipeline Report,” accessed September 27, 2016, http://sf-planning.org/pipeline-report.
33
Park
ing
Sp
aces
to L
ivin
g S
pac
es
Beginning with the first quarter of 2012, quarterly pipeline snapshots were avail-able as downloadable spreadsheets from San Francisco’s OpenData portal (https://data.sfgov.org/). These later reports included dozens of additional attributes—such as the number of affordable units and parking spaces—but the content was not consistent. A field included in one quarter’s report might not be in the next quarter’s.
4.1.2 Filtering the Data
Altogether, the Pipeline Reports contained info on hundreds of proposed projects throughout the city. To narrow the dataset, I did the following:
1. Filtered out any developments that had fewer than 10 net dwelling units.
2. Filtered out any that were in planning districts that did not overlap with the study area.
3. Mapped the remaining projects, using longitude and latitude coordinates when possible and addresses when not.
4. Generated a list of all the mapped points that fell within the study area.
5. Examined each project on the filtered list to determine if it had received planning approval during the study time frame.
Whenever that final determination was not possible based on the Pipe-line Reports, I checked the Planning Department’s San Francisco Property Information Map (http://propertymap.sf-planning.org/). This online tool allows us-ers to look up addresses and view publicly available information, including the status of any planning applications associated with the parcel. If the project had a condi-
Figure 4.1: Progression of a typical project through the planning (PL) and building permit (BP) processes, as defined in San Francisco Pipeline Reports. Source: Author’s chart, based on San Francisco Pipeline Report: 2011 Quarter 3, accessed July 22, 2016, http://sf-planning.org/sites/default/files/FileCenter/Documents/8656-pipe_2011q3_abbr.pdf.
89 City and County of San Francisco, “Pipeline Report.”
90 San Francisco Planning Code, sec. 401 (2010), accessed September 26, 2016, http://planning.sanfranciscocode.org/4/401/.
91 City and County of San Francisco, Inclusionary Affordable Housing Program Monitoring and Procedures Manual (2013), accessed September 26, 2016, http://sfmohcd.org/sites/default/files/FileCenter/Documents/6983-Inclusionary%20Procedures%20Manual%20051013.pdf.
tional use authorization, variance, or downtown exemption approved within the study time frame, I added it to the study dataset.
4.1.3 Consolidating and Verifying Data
For every parcel in the study dataset, I created a single record that consolidated all the information contained in various quarterly Pipeline Reports. Whenever there was conflicting data, I deferred to the record from the report closest to the planning approval date.
The Planning Department’s webpage makes a point about Pipeline Reports being “subject to errors due to varying ac-curacy and currency of original sources.”89
I approached the data they contained as a starting point, not a definitive record ready for analysis.
Focusing on those attributes necessary to test the research question, I verified the information in the consolidated pipeline records using a variety of sources. When possible, I relied on the data in the offi-cial documents associated with Planning Commission actions, particularly the detailed staff summaries prepared for conditional use authorizations and vari-ances, which can be downloaded using the Planning Department’s Accela Citizen Access portal (https://aca.accela.com/ccsf/Welcome.aspx).
These documents were particularly help-ful in determining the number of afford-able units included in each development, since there is no universally accepted definition of what constitutes “affordable housing.” Nearly every document includ-ed an explanation of how many units in the development would meet the city’s re-quirements for affordable housing, as out-lined in the San Francisco Planning Code90 and the Inclusionary Affordable Housing Program Monitoring and Procedures Manu-al.91 While this method provided a simple and consistent count of affordable units for each development, it should be noted that the city’s Inclusionary Affordable
34
Mea
surin
g t
he E
ffect
s o
f Par
king
Ref
orm Figure 4.2: 1285 Sutter St. This is the property in the dataset
with the oldest approval date. The San Francisco Planning Commission granted a variance for the development on June 16, 2008.
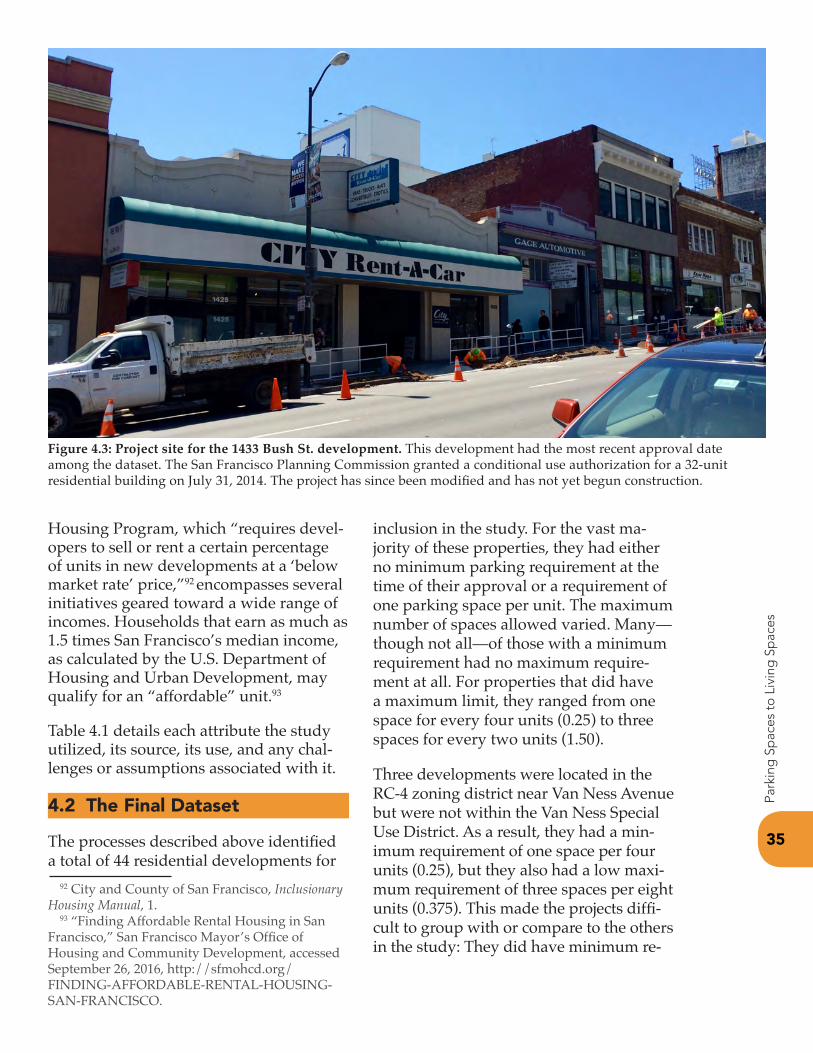
35
Park
ing
Sp
aces
to L
ivin
g S
pac
es
Housing Program, which “requires devel-opers to sell or rent a certain percentage of units in new developments at a ‘below market rate’ price,”92 encompasses several initiatives geared toward a wide range of incomes. Households that earn as much as 1.5 times San Francisco’s median income, as calculated by the U.S. Department of Housing and Urban Development, may qualify for an “affordable” unit.93
Table 4.1 details each attribute the study utilized, its source, its use, and any chal-lenges or assumptions associated with it.
4.2 The Final Dataset
The processes described above identified a total of 44 residential developments for
inclusion in the study. For the vast ma-jority of these properties, they had either no minimum parking requirement at the time of their approval or a requirement of one parking space per unit. The maximum number of spaces allowed varied. Many—though not all—of those with a minimum requirement had no maximum require-ment at all. For properties that did have a maximum limit, they ranged from one space for every four units (0.25) to three spaces for every two units (1.50).
Three developments were located in the RC-4 zoning district near Van Ness Avenue but were not within the Van Ness Special Use District. As a result, they had a min-imum requirement of one space per four units (0.25), but they also had a low maxi-mum requirement of three spaces per eight units (0.375). This made the projects diffi-cult to group with or compare to the others in the study: They did have minimum re-
92 City and County of San Francisco, Inclusionary Housing Manual, 1.
93 “Finding Affordable Rental Housing in San Francisco,” San Francisco Mayor’s Office of Housing and Community Development, accessed September 26, 2016, http://sfmohcd.org/FINDING-AFFORDABLE-RENTAL-HOUSING-SAN-FRANCISCO.
Figure 4.3: Project site for the 1433 Bush St. development. This development had the most recent approval date among the dataset. The San Francisco Planning Commission granted a conditional use authorization for a 32-unit residential building on July 31, 2014. The project has since been modified and has not yet begun construction.
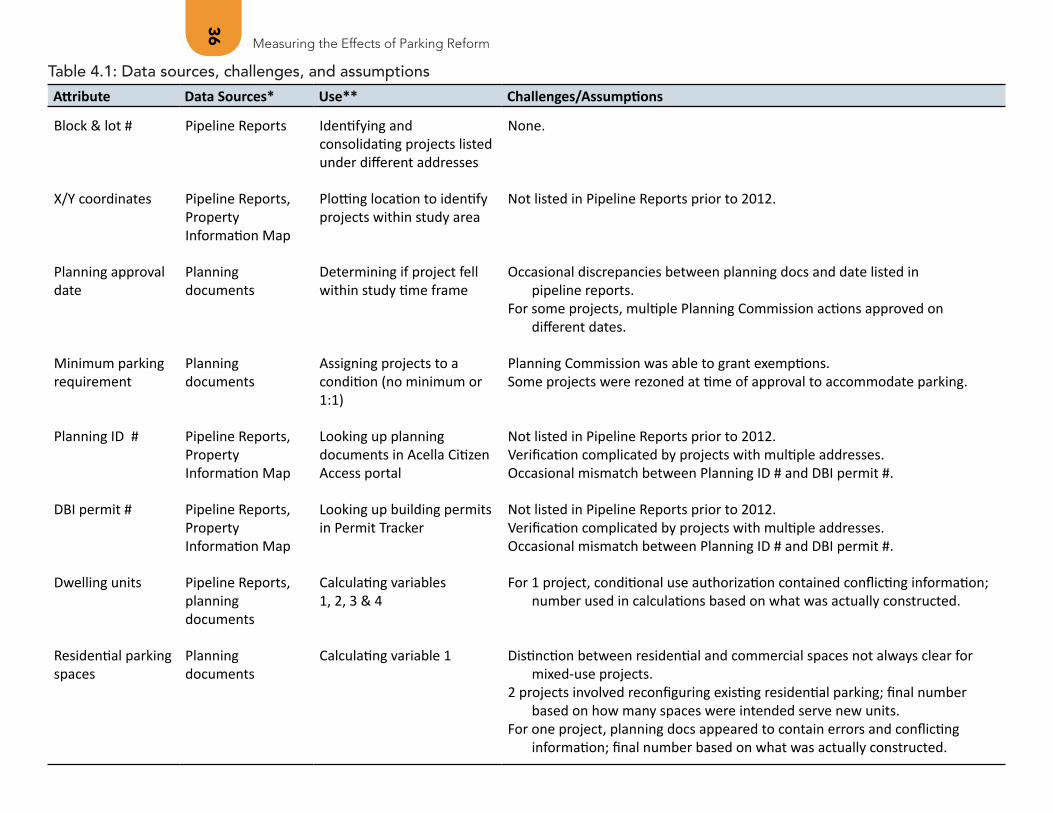
36
Measuring the Effects of Parking Reform
Attribute Data Sources* Use** Challenges/Assumptions
Block & lot # Pipeline Reports Identifying and consolidating projects listed under different addresses
None.
X/Y coordinates Pipeline Reports, Property Information Map
Plotting location to identify projects within study area
Not listed in Pipeline Reports prior to 2012.
Planning approval date
Planning documents
Determining if project fell within study time frame
Occasional discrepancies between planning docs and date listed in pipeline reports.
For some projects, multiple Planning Commission actions approved on different dates.
Minimum parking requirement
Planning documents
Assigning projects to a condition (no minimum or 1:1)
Planning Commission was able to grant exemptions.Some projects were rezoned at time of approval to accommodate parking.
Planning ID # Pipeline Reports, Property Information Map
Looking up planning documents in Acella Citizen Access portal
Not listed in Pipeline Reports prior to 2012.Verification complicated by projects with multiple addresses.Occasional mismatch between Planning ID # and DBI permit #.
DBI permit # Pipeline Reports, Property Information Map
Looking up building permits in Permit Tracker
Not listed in Pipeline Reports prior to 2012.Verification complicated by projects with multiple addresses.Occasional mismatch between Planning ID # and DBI permit #.
Dwelling units Pipeline Reports, planning documents
Calculating variables 1, 2, 3 & 4
For 1 project, conditional use authorization contained conflicting information; number used in calculations based on what was actually constructed.
Residential parking spaces
Planning documents
Calculating variable 1 Distinction between residential and commercial spaces not always clear for mixed-use projects.
2 projects involved reconfiguring existing residential parking; final number based on how many spaces were intended serve new units.
For one project, planning docs appeared to contain errors and conflicting information; final number based on what was actually constructed.
Table 4.1: Data sources, challenges, and assumptions
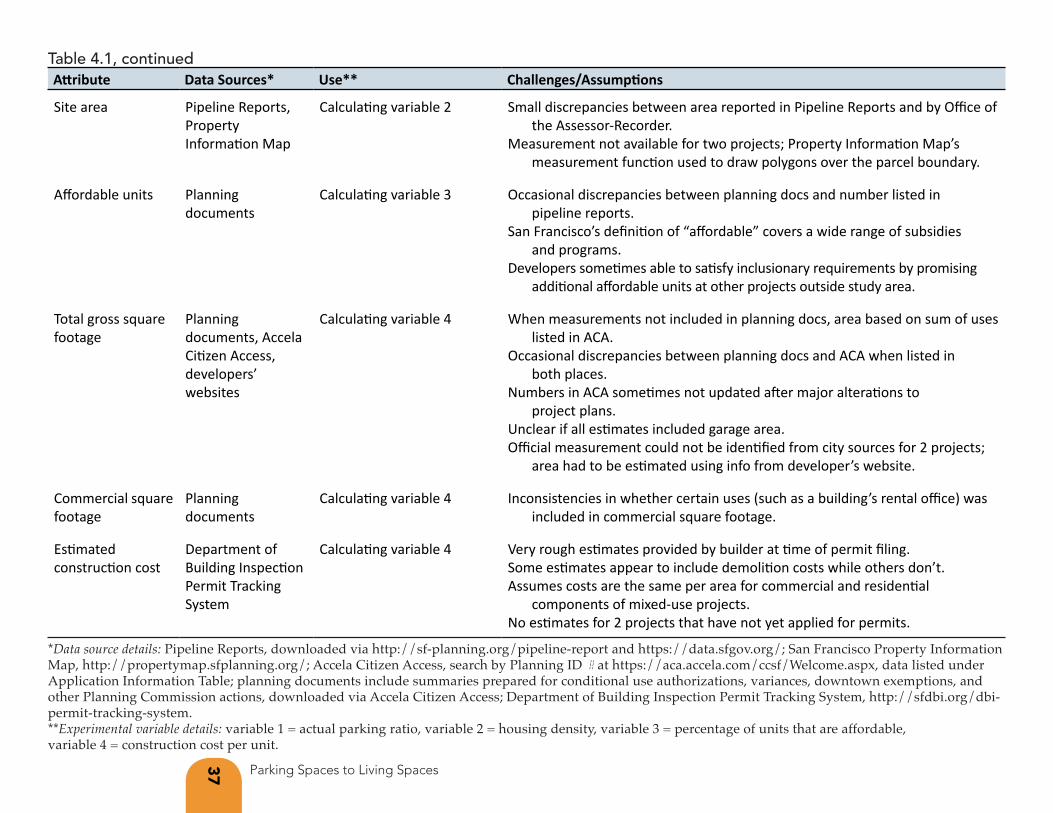
37 Parking Spaces to Living Spaces
Attribute Data Sources* Use** Challenges/Assumptions
Site area Pipeline Reports, Property Information Map
Calculating variable 2 Small discrepancies between area reported in Pipeline Reports and by Office of the Assessor-Recorder.
Measurement not available for two projects; Property Information Map’s measurement function used to draw polygons over the parcel boundary.
Affordable units Planning documents
Calculating variable 3 Occasional discrepancies between planning docs and number listed in pipeline reports.
San Francisco’s definition of “affordable” covers a wide range of subsidies and programs.
Developers sometimes able to satisfy inclusionary requirements by promising additional affordable units at other projects outside study area.
Total gross square footage
Planning documents, Accela Citizen Access, developers’ websites
Calculating variable 4 When measurements not included in planning docs, area based on sum of uses listed in ACA.
Occasional discrepancies between planning docs and ACA when listed in both places.
Numbers in ACA sometimes not updated after major alterations to project plans.
Unclear if all estimates included garage area.Official measurement could not be identified from city sources for 2 projects;
area had to be estimated using info from developer’s website.
Commercial square footage
Planning documents
Calculating variable 4 Inconsistencies in whether certain uses (such as a building’s rental office) was included in commercial square footage.
Estimated construction cost
Department of Building Inspection Permit Tracking System
Calculating variable 4 Very rough estimates provided by builder at time of permit filing.Some estimates appear to include demolition costs while others don’t.Assumes costs are the same per area for commercial and residential
components of mixed-use projects.No estimates for 2 projects that have not yet applied for permits.
*Data source details: Pipeline Reports, downloaded via http://sf-planning.org/pipeline-report and https://data.sfgov.org/; San Francisco Property Information Map, http://propertymap.sfplanning.org/; Accela Citizen Access, search by Planning ID # at https://aca.accela.com/ccsf/Welcome.aspx, data listed under Application Information Table; planning documents include summaries prepared for conditional use authorizations, variances, downtown exemptions, and other Planning Commission actions, downloaded via Accela Citizen Access; Department of Building Inspection Permit Tracking System, http://sfdbi.org/dbi-permit-tracking-system.**Experimental variable details: variable 1 = actual parking ratio, variable 2 = housing density, variable 3 = percentage of units that are affordable, variable 4 = construction cost per unit.
Table 4.1, continued
38
Mea
surin
g t
he E
ffect
s o
f Par
king
Ref
orm
quirements, but they also had less parking than many of the developments with no minimums. I made the decision to exclude them from the analysis, reducing the total number of developments in the study to 44. A table of the final dataset with key variables is included as Appendix A.
The final 44 developments in the study represent a range of residential build-ings. While the majority were standard, mixed-use developments geared toward the general housing market, the proposals included housing specifically designated for the chronically homeless, veterans, seniors, and students. One project aimed to convert an old furniture store into a group-housing complex for 10 artists with shared studio space.
Table 4.2 shows how the developments in the study are distributed among various categories of attributes.
4.2.1 Location
Nearly half of the developments are within the Market and Octavia Plan Area, most of them zoned as part of a Neighbor-hood Commercial Transit district. All but five are within 1,500 feet of either Market Street or Van Ness Avenue.
Figure 4.4 shows the location of the devel-opments, as well as their size in terms of dwelling units. The map shows the prop-erties with no minimum parking require-ment mostly clustered around the Market and Octavia Plan Area. Those with mini-mum parking requirements are clustered along the northern section of Van Ness Avenue, although there are two in SoMa and one in the Upper Market Neighbor-hood Commercial District just outside the Market and Octavia Plan Area.
4.2.2 Parking Provision
Fourteen of the 44 developments were subject to a minimum parking require-ment at the time of their approval. It should be noted that plans for these devel-opments did not necessarily feature one actual parking space per unit. The Plan-ning Commission was usually able to, and often did, grant conditional use authori-zations that included exemptions from the parking requirements. This does not, however, conflict with the intent of this research. The study is based on the prem-ise that, even when developers anticipate receiving an exemption from a parking requirement, its mere presence in the zon-ing code influences what they propose. The requirement may serve as a starting point for the architect’s designs, or it may serve to make parking part of the political process—one more compromise for which the developer must win approval.
Nine of the projects included no parking for residents. Most were on parcels with-out a minimum parking requirement, but one did have a minimum in effect at the time of its approval.
4.2.3 Affordability
San Francisco’s Inclusionary Housing Ordinance means that most developments were required to include a certain number of units set aside for low- to moderate-in-come residents and offered at less than the market rate. The rule provides some flexibility, however, allowing developers in some cases to build the required units elsewhere as part of another project or to pay an in-lieu fee. Accordingly, 39 percent of the developments in the study have no affordable units. Four developments offer nothing but subsidized, affordable units;
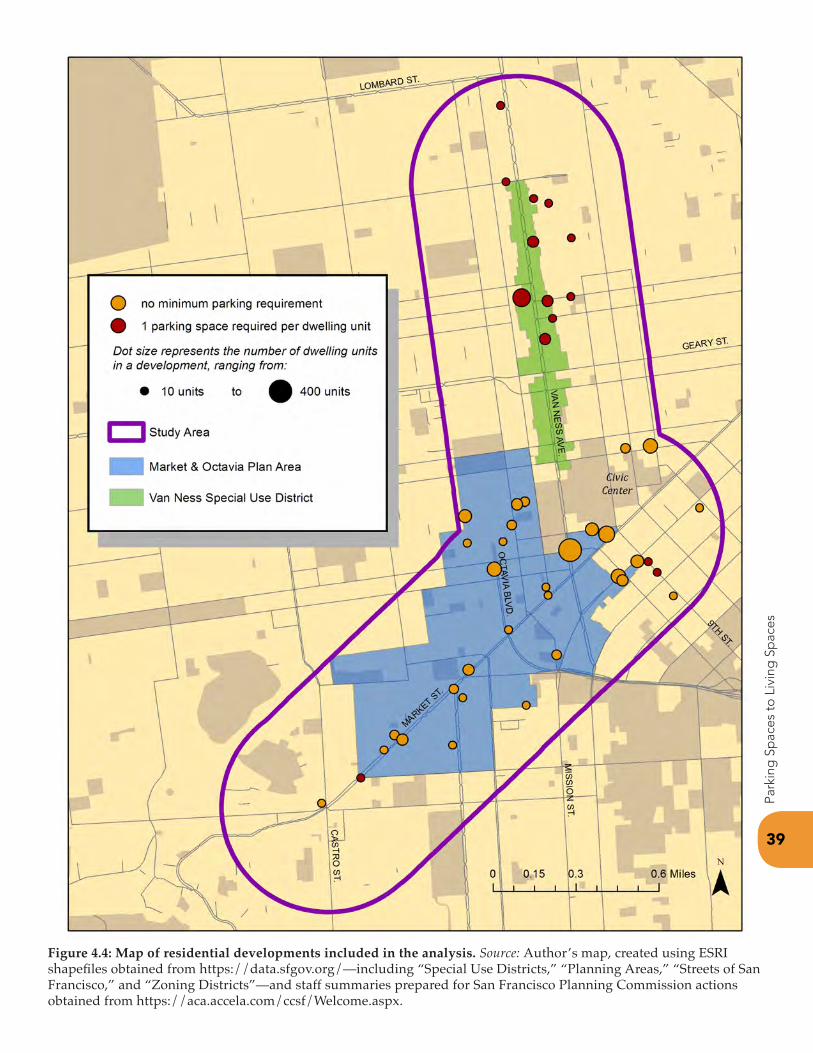
Figure 4.4: Map of residential developments included in the analysis. Source: Author’s map, created using ESRI shapefiles obtained from https://data.sfgov.org/—including “Special Use Districts,” “Planning Areas,” “Streets of San Francisco,” and “Zoning Districts”—and staff summaries prepared for San Francisco Planning Commission actions obtained from https://aca.accela.com/ccsf/Welcome.aspx.
39
Park
ing
Sp
aces
to L
ivin
g S
pac
es
39
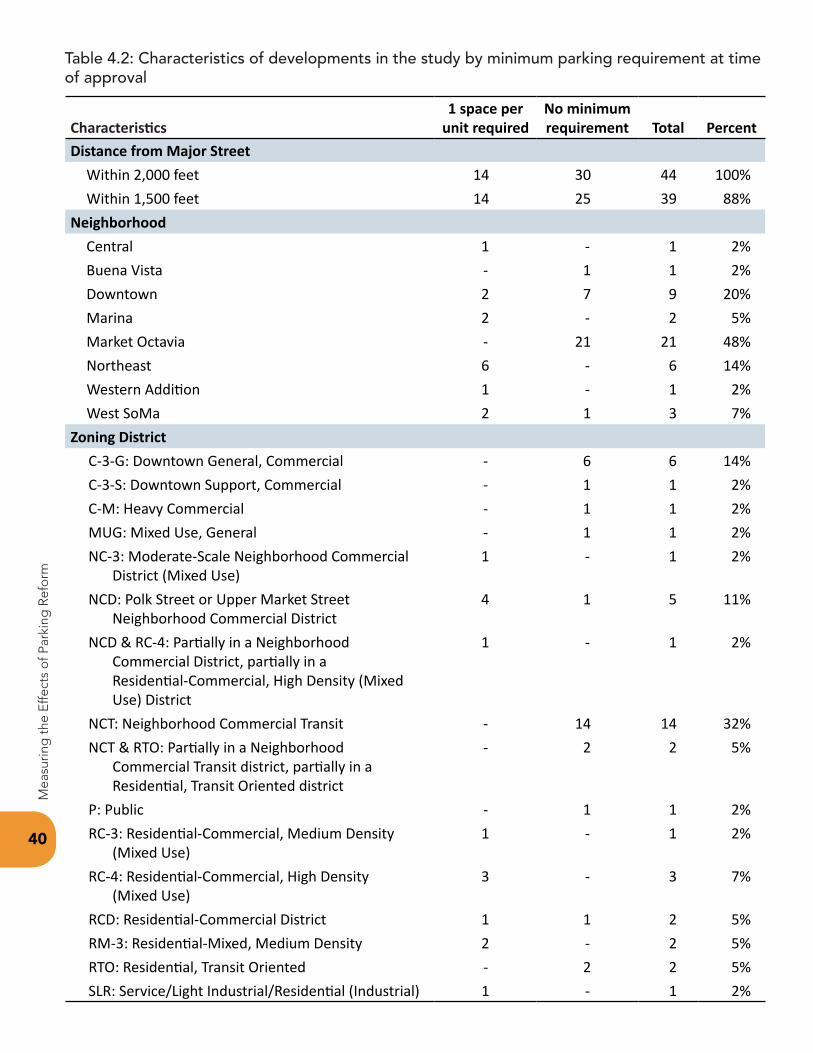
40
Mea
surin
g t
he E
ffect
s o
f Par
king
Ref
orm
Characteristics1 space per
unit requiredNo minimum requirement Total Percent
Distance from Major Street Within 2,000 feet 14 30 44 100%Within 1,500 feet 14 25 39 88%
Neighborhood Central 1 - 1 2%Buena Vista - 1 1 2%Downtown 2 7 9 20%Marina 2 - 2 5%Market Octavia - 21 21 48%Northeast 6 - 6 14%Western Addition 1 - 1 2%West SoMa 2 1 3 7%
Zoning District C-3-G: Downtown General, Commercial - 6 6 14%C-3-S: Downtown Support, Commercial - 1 1 2%C-M: Heavy Commercial - 1 1 2%MUG: Mixed Use, General - 1 1 2%NC-3: Moderate-Scale Neighborhood Commercial
District (Mixed Use)1 - 1 2%
NCD: Polk Street or Upper Market Street Neighborhood Commercial District
4 1 5 11%
NCD & RC-4: Partially in a Neighborhood Commercial District, partially in a Residential-Commercial, High Density (Mixed Use) District
1 - 1 2%
NCT: Neighborhood Commercial Transit - 14 14 32%NCT & RTO: Partially in a Neighborhood
Commercial Transit district, partially in a Residential, Transit Oriented district
- 2 2 5%
P: Public - 1 1 2%RC-3: Residential-Commercial, Medium Density
(Mixed Use)1 - 1 2%
RC-4: Residential-Commercial, High Density (Mixed Use)
3 - 3 7%
RCD: Residential-Commercial District 1 1 2 5%RM-3: Residential-Mixed, Medium Density 2 - 2 5%RTO: Residential, Transit Oriented - 2 2 5%SLR: Service/Light Industrial/Residential (Industrial) 1 - 1 2%
Table 4.2: Characteristics of developments in the study by minimum parking requirement at time of approval
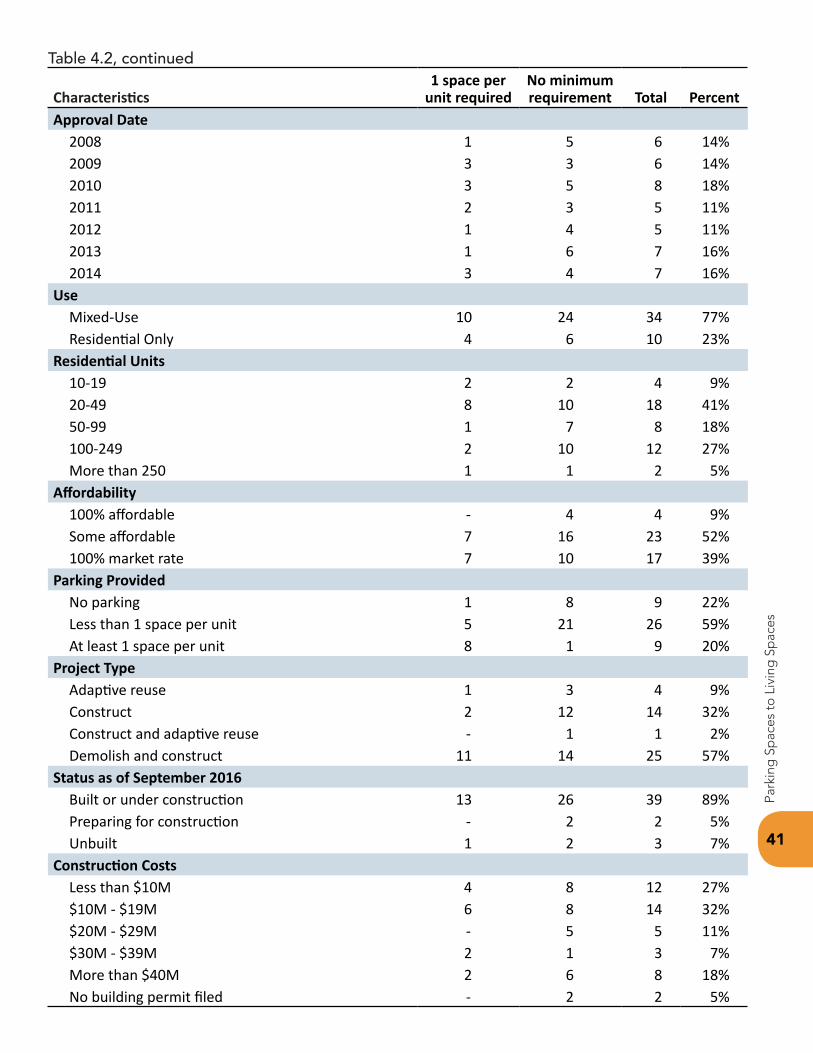
41
Park
ing
Sp
aces
to L
ivin
g S
pac
es
Characteristics1 space per
unit requiredNo minimum requirement Total Percent
Approval Date 2008 1 5 6 14%2009 3 3 6 14%2010 3 5 8 18%2011 2 3 5 11%2012 1 4 5 11%2013 1 6 7 16%2014 3 4 7 16%
Use Mixed-Use 10 24 34 77%Residential Only 4 6 10 23%
Residential Units 10-19 2 2 4 9%20-49 8 10 18 41%50-99 1 7 8 18%100-249 2 10 12 27%More than 250 1 1 2 5%
Affordability 100% affordable - 4 4 9%Some affordable 7 16 23 52%100% market rate 7 10 17 39%
Parking Provided No parking 1 8 9 22%Less than 1 space per unit 5 21 26 59%At least 1 space per unit 8 1 9 20%
Project Type Adaptive reuse 1 3 4 9%Construct 2 12 14 32%Construct and adaptive reuse - 1 1 2%Demolish and construct 11 14 25 57%
Status as of September 2016 Built or under construction 13 26 39 89%Preparing for construction - 2 2 5%Unbuilt 1 2 3 7%
Construction Costs Less than $10M 4 8 12 27%$10M - $19M 6 8 14 32%$20M - $29M - 5 5 11%$30M - $39M 2 1 3 7%More than $40M 2 6 8 18%No building permit filed - 2 2 5%
Table 4.2, continued
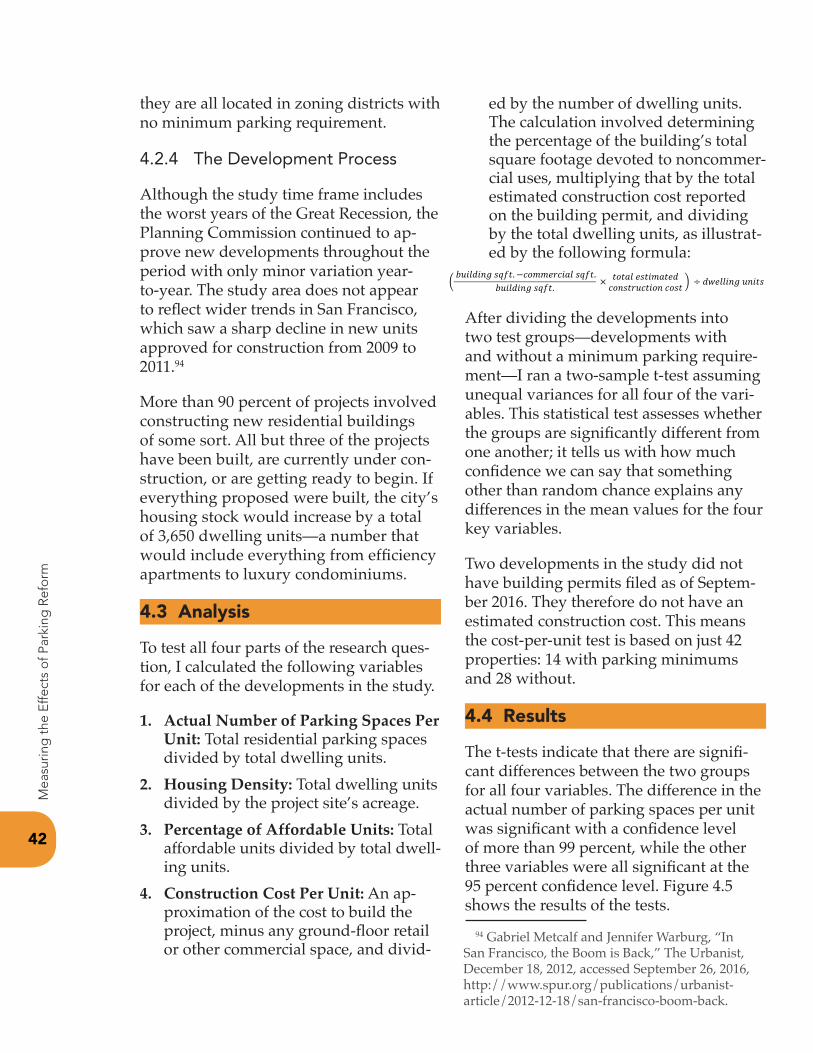
94 Gabriel Metcalf and Jennifer Warburg, “In San Francisco, the Boom is Back,” The Urbanist, December 18, 2012, accessed September 26, 2016, http://www.spur.org/publications/urbanist-article/2012-12-18/san-francisco-boom-back.
42
Mea
surin
g t
he E
ffect
s o
f Par
king
Ref
orm
they are all located in zoning districts with no minimum parking requirement.
4.2.4 The Development Process
Although the study time frame includes the worst years of the Great Recession, the Planning Commission continued to ap-prove new developments throughout the period with only minor variation year-to-year. The study area does not appear to reflect wider trends in San Francisco, which saw a sharp decline in new units approved for construction from 2009 to 2011.94
More than 90 percent of projects involved constructing new residential buildings of some sort. All but three of the projects have been built, are currently under con-struction, or are getting ready to begin. If everything proposed were built, the city’s housing stock would increase by a total of 3,650 dwelling units—a number that would include everything from efficiency apartments to luxury condominiums.
4.3 Analysis
To test all four parts of the research ques-tion, I calculated the following variables for each of the developments in the study.
1. Actual Number of Parking Spaces Per Unit: Total residential parking spaces divided by total dwelling units.
2. Housing Density: Total dwelling units divided by the project site’s acreage.
3. Percentage of Affordable Units: Total affordable units divided by total dwell-ing units.
4. Construction Cost Per Unit: An ap-proximation of the cost to build the project, minus any ground-floor retail or other commercial space, and divid-
ed by the number of dwelling units. The calculation involved determining the percentage of the building’s total square footage devoted to noncommer-cial uses, multiplying that by the total estimated construction cost reported on the building permit, and dividing by the total dwelling units, as illustrat-ed by the following formula:
After dividing the developments into two test groups—developments with and without a minimum parking require-ment—I ran a two-sample t-test assuming unequal variances for all four of the vari-ables. This statistical test assesses whether the groups are significantly different from one another; it tells us with how much confidence we can say that something other than random chance explains any differences in the mean values for the four key variables.
Two developments in the study did not have building permits filed as of Septem-ber 2016. They therefore do not have an estimated construction cost. This means the cost-per-unit test is based on just 42 properties: 14 with parking minimums and 28 without.
4.4 Results
The t-tests indicate that there are signifi-cant differences between the two groups for all four variables. The difference in the actual number of parking spaces per unit was significant with a confidence level of more than 99 percent, while the other three variables were all significant at the 95 percent confidence level. Figure 4.5 shows the results of the tests.
𝑏𝑏𝑏𝑏𝑏𝑏𝑏𝑏𝑏𝑏𝑏𝑏𝑏𝑏𝑏𝑏𝑠𝑠𝑠𝑠𝑠𝑠𝑠𝑠. −𝑐𝑐𝑐𝑐𝑐𝑐𝑐𝑐𝑐𝑐𝑐𝑐𝑐𝑐𝑏𝑏𝑐𝑐𝑏𝑏𝑠𝑠𝑠𝑠𝑠𝑠𝑠𝑠.𝑏𝑏𝑏𝑏𝑏𝑏𝑏𝑏𝑏𝑏𝑏𝑏𝑏𝑏𝑏𝑏𝑠𝑠𝑠𝑠𝑠𝑠𝑠𝑠. × 𝑠𝑠𝑐𝑐𝑠𝑠𝑐𝑐𝑏𝑏𝑐𝑐𝑠𝑠𝑠𝑠𝑏𝑏𝑐𝑐𝑐𝑐𝑠𝑠𝑐𝑐𝑏𝑏𝑐𝑐𝑐𝑐𝑏𝑏𝑠𝑠𝑠𝑠𝑐𝑐𝑏𝑏𝑐𝑐𝑠𝑠𝑏𝑏𝑐𝑐𝑏𝑏𝑐𝑐𝑐𝑐𝑠𝑠𝑠𝑠 ÷ 𝑏𝑏𝑑𝑑𝑐𝑐𝑏𝑏𝑏𝑏𝑏𝑏𝑏𝑏𝑏𝑏𝑏𝑏𝑏𝑏𝑏𝑏𝑠𝑠𝑠𝑠
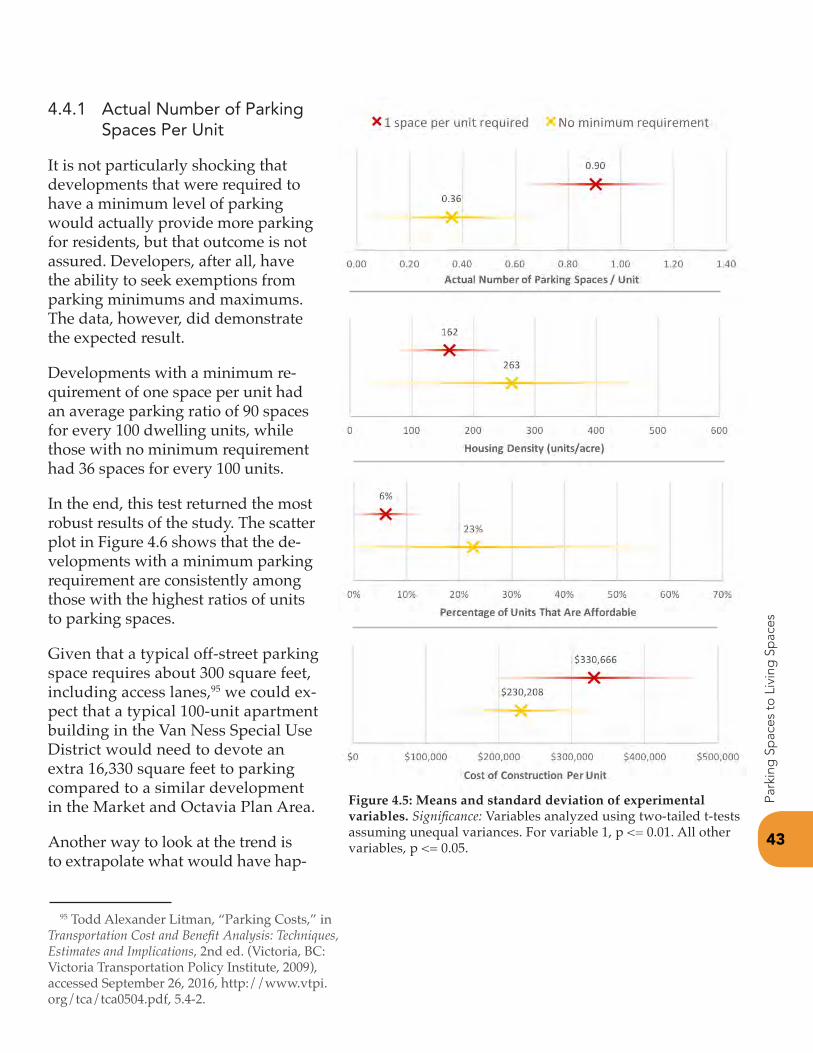
4.4.1 Actual Number of Parking Spaces Per Unit
It is not particularly shocking that developments that were required to have a minimum level of parking would actually provide more parking for residents, but that outcome is not assured. Developers, after all, have the ability to seek exemptions from parking minimums and maximums. The data, however, did demonstrate the expected result.
Developments with a minimum re-quirement of one space per unit had an average parking ratio of 90 spaces for every 100 dwelling units, while those with no minimum requirement had 36 spaces for every 100 units.
In the end, this test returned the most robust results of the study. The scatter plot in Figure 4.6 shows that the de-velopments with a minimum parking requirement are consistently among those with the highest ratios of units to parking spaces.
Given that a typical off-street parking space requires about 300 square feet, including access lanes,95 we could ex-pect that a typical 100-unit apartment building in the Van Ness Special Use District would need to devote an extra 16,330 square feet to parking compared to a similar development in the Market and Octavia Plan Area.
Another way to look at the trend is to extrapolate what would have hap-
43
Park
ing
Sp
aces
to L
ivin
g S
pac
es
95 Todd Alexander Litman, “Parking Costs,” in Transportation Cost and Benefit Analysis: Techniques, Estimates and Implications, 2nd ed. (Victoria, BC: Victoria Transportation Policy Institute, 2009), accessed September 26, 2016, http://www.vtpi.org/tca/tca0504.pdf, 5.4-2.
Figure 4.5: Means and standard deviation of experimental variables. Significance: Variables analyzed using two-tailed t-tests assuming unequal variances. For variable 1, p <= 0.01. All other variables, p <= 0.05.
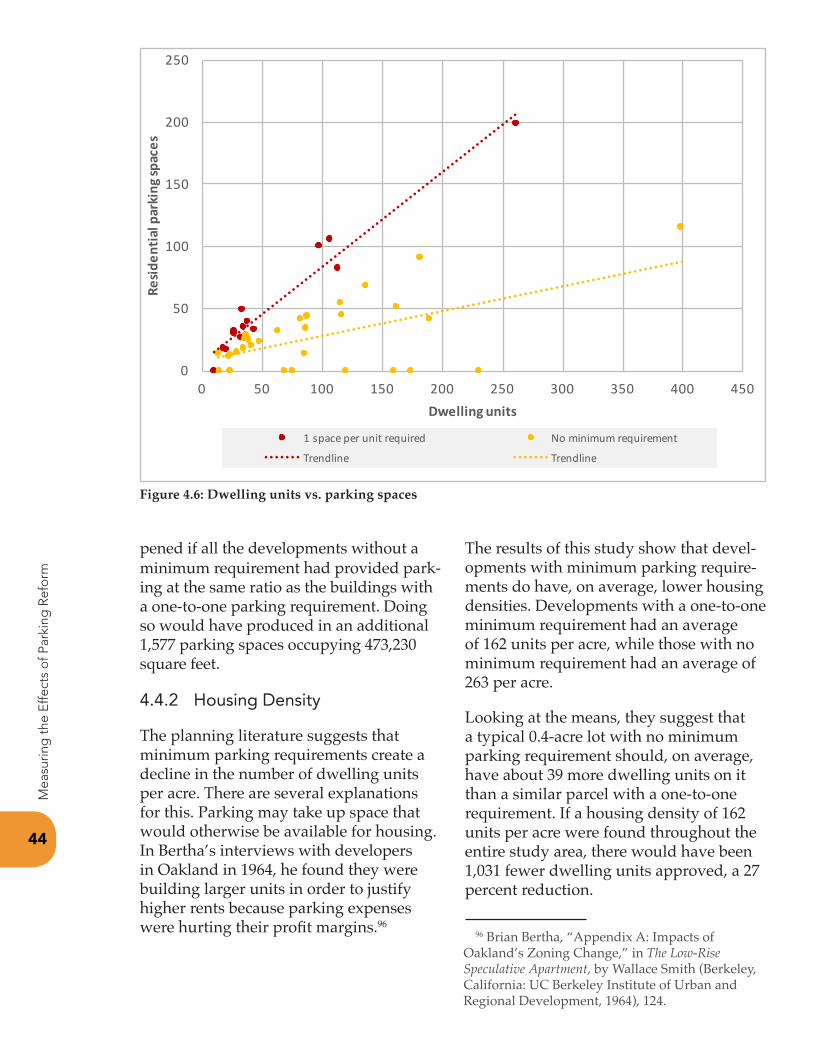
96 Brian Bertha, “Appendix A: Impacts of Oakland’s Zoning Change,” in The Low-Rise Speculative Apartment, by Wallace Smith (Berkeley, California: UC Berkeley Institute of Urban and Regional Development, 1964), 124.
44
Mea
surin
g t
he E
ffect
s o
f Par
king
Ref
orm
pened if all the developments without a minimum requirement had provided park-ing at the same ratio as the buildings with a one-to-one parking requirement. Doing so would have produced in an additional 1,577 parking spaces occupying 473,230 square feet.
4.4.2 Housing Density
The planning literature suggests that minimum parking requirements create a decline in the number of dwelling units per acre. There are several explanations for this. Parking may take up space that would otherwise be available for housing. In Bertha’s interviews with developers in Oakland in 1964, he found they were building larger units in order to justify higher rents because parking expenses were hurting their profit margins.96
The results of this study show that devel-opments with minimum parking require-ments do have, on average, lower housing densities. Developments with a one-to-one minimum requirement had an average of 162 units per acre, while those with no minimum requirement had an average of 263 per acre.
Looking at the means, they suggest that a typical 0.4-acre lot with no minimum parking requirement should, on average, have about 39 more dwelling units on it than a similar parcel with a one-to-one requirement. If a housing density of 162 units per acre were found throughout the entire study area, there would have been 1,031 fewer dwelling units approved, a 27 percent reduction.
Figure 4.6: Dwelling units vs. parking spaces
0
50
100
150
200
250
0 50 100 150 200 250 300 350 400 450
Resid
entia
lparkingsp
aces
Dwellingunits
1spaceperunitrequired Nominimumrequirement
Trendline Trendline
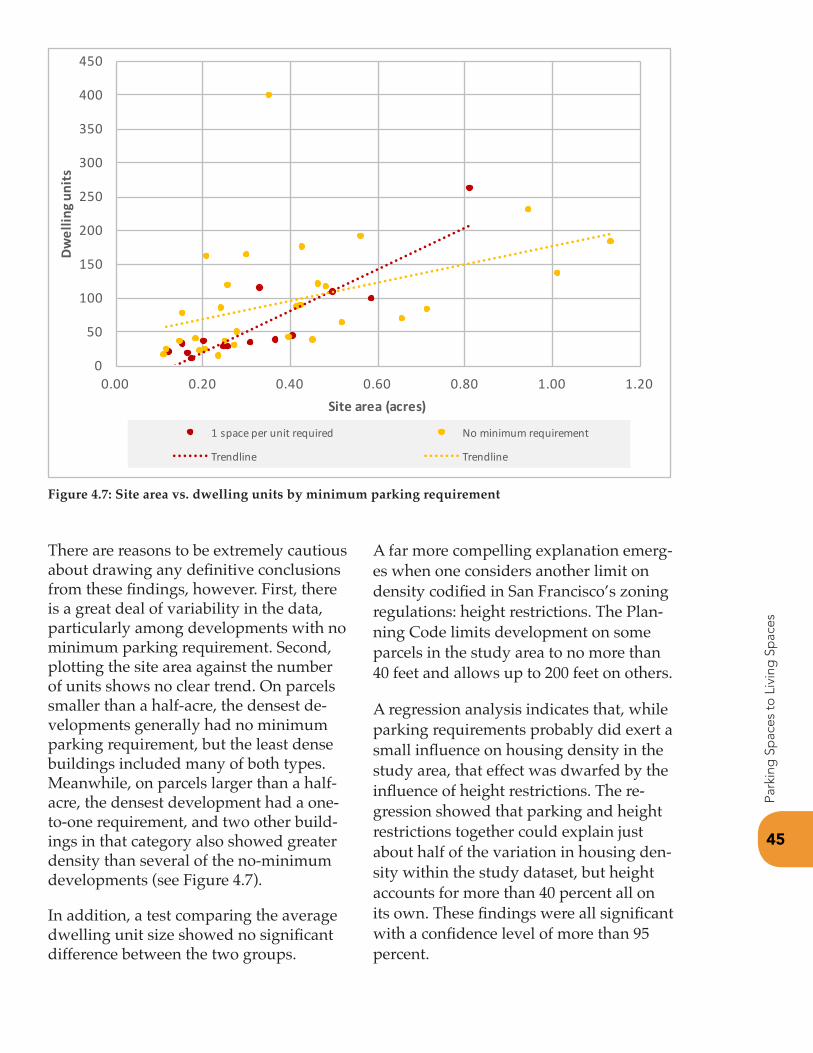
45
Park
ing
Sp
aces
to L
ivin
g S
pac
es
There are reasons to be extremely cautious about drawing any definitive conclusions from these findings, however. First, there is a great deal of variability in the data, particularly among developments with no minimum parking requirement. Second, plotting the site area against the number of units shows no clear trend. On parcels smaller than a half-acre, the densest de-velopments generally had no minimum parking requirement, but the least dense buildings included many of both types. Meanwhile, on parcels larger than a half-acre, the densest development had a one-to-one requirement, and two other build-ings in that category also showed greater density than several of the no-minimum developments (see Figure 4.7).
In addition, a test comparing the average dwelling unit size showed no significant difference between the two groups.
A far more compelling explanation emerg-es when one considers another limit on density codified in San Francisco’s zoning regulations: height restrictions. The Plan-ning Code limits development on some parcels in the study area to no more than 40 feet and allows up to 200 feet on others.
A regression analysis indicates that, while parking requirements probably did exert a small influence on housing density in the study area, that effect was dwarfed by the influence of height restrictions. The re-gression showed that parking and height restrictions together could explain just about half of the variation in housing den-sity within the study dataset, but height accounts for more than 40 percent all on its own. These findings were all significant with a confidence level of more than 95 percent.
Figure 4.7: Site area vs. dwelling units by minimum parking requirement
0
50
100
150
200
250
300
350
400
450
0.00 0.20 0.40 0.60 0.80 1.00 1.20
Dwellin
gunits
Sitearea(acres)
1spaceperunitrequired Nominimumrequirement
Trendline Trendline
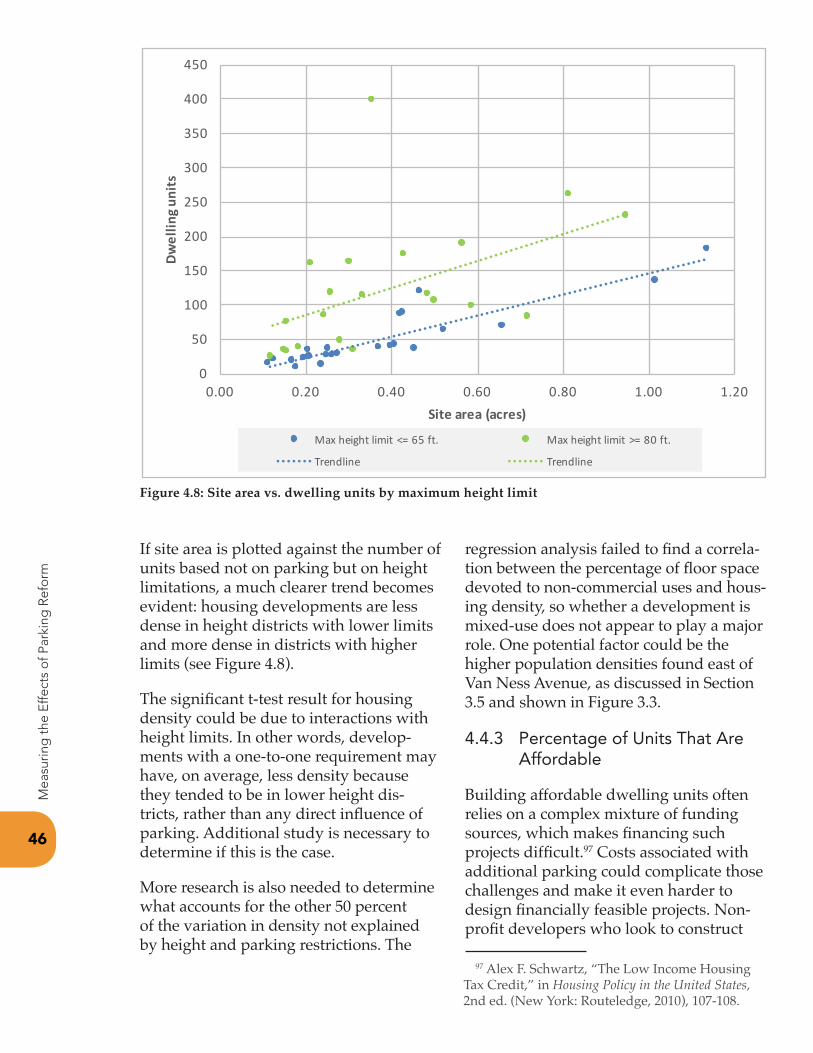
97 Alex F. Schwartz, “The Low Income Housing Tax Credit,” in Housing Policy in the United States, 2nd ed. (New York: Routeledge, 2010), 107-108.
46
Mea
surin
g t
he E
ffect
s o
f Par
king
Ref
orm
If site area is plotted against the number of units based not on parking but on height limitations, a much clearer trend becomes evident: housing developments are less dense in height districts with lower limits and more dense in districts with higher limits (see Figure 4.8).
The significant t-test result for housing density could be due to interactions with height limits. In other words, develop-ments with a one-to-one requirement may have, on average, less density because they tended to be in lower height dis-tricts, rather than any direct influence of parking. Additional study is necessary to determine if this is the case.
More research is also needed to determine what accounts for the other 50 percent of the variation in density not explained by height and parking restrictions. The
regression analysis failed to find a correla-tion between the percentage of floor space devoted to non-commercial uses and hous-ing density, so whether a development is mixed-use does not appear to play a major role. One potential factor could be the higher population densities found east of Van Ness Avenue, as discussed in Section 3.5 and shown in Figure 3.3.
4.4.3 Percentage of Units That Are Affordable
Building affordable dwelling units often relies on a complex mixture of funding sources, which makes financing such projects difficult.97 Costs associated with additional parking could complicate those challenges and make it even harder to design financially feasible projects. Non-profit developers who look to construct
Figure 4.8: Site area vs. dwelling units by maximum height limit
0
50
100
150
200
250
300
350
400
450
0.00 0.20 0.40 0.60 0.80 1.00 1.20
Dwellin
gunits
Sitearea(acres)
Maxheightlimit<=65ft. Maxheightlimit>=80ft.
Trendline Trendline
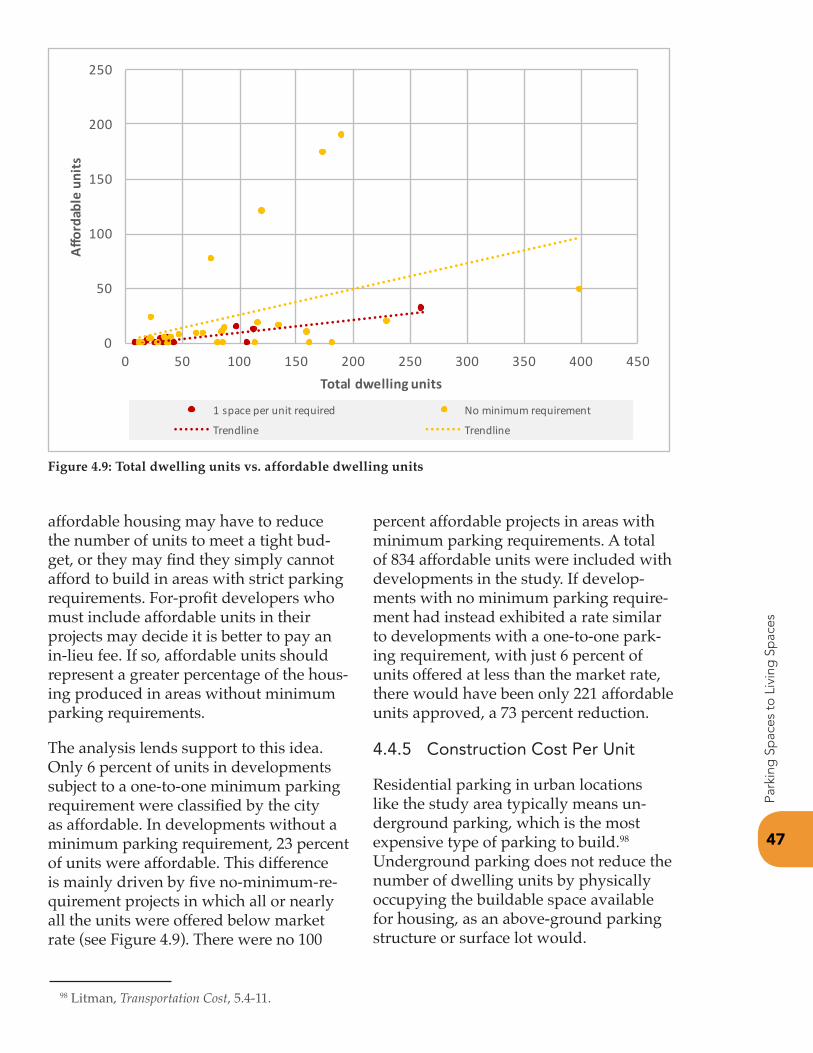
47
Park
ing
Sp
aces
to L
ivin
g S
pac
es
98 Litman, Transportation Cost, 5.4-11.
affordable housing may have to reduce the number of units to meet a tight bud-get, or they may find they simply cannot afford to build in areas with strict parking requirements. For-profit developers who must include affordable units in their projects may decide it is better to pay an in-lieu fee. If so, affordable units should represent a greater percentage of the hous-ing produced in areas without minimum parking requirements.
The analysis lends support to this idea. Only 6 percent of units in developments subject to a one-to-one minimum parking requirement were classified by the city as affordable. In developments without a minimum parking requirement, 23 percent of units were affordable. This difference is mainly driven by five no-minimum-re-quirement projects in which all or nearly all the units were offered below market rate (see Figure 4.9). There were no 100
percent affordable projects in areas with minimum parking requirements. A total of 834 affordable units were included with developments in the study. If develop-ments with no minimum parking require-ment had instead exhibited a rate similar to developments with a one-to-one park-ing requirement, with just 6 percent of units offered at less than the market rate, there would have been only 221 affordable units approved, a 73 percent reduction.
4.4.5 Construction Cost Per Unit
Residential parking in urban locations like the study area typically means un-derground parking, which is the most expensive type of parking to build.98 Underground parking does not reduce the number of dwelling units by physically occupying the buildable space available for housing, as an above-ground parking structure or surface lot would.
Figure 4.9: Total dwelling units vs. affordable dwelling units
0
50
100
150
200
250
0 50 100 150 200 250 300 350 400 450
Affordableunits
Totaldwellingunits
1spaceperunitrequired Nominimumrequirement
Trendline Trendline
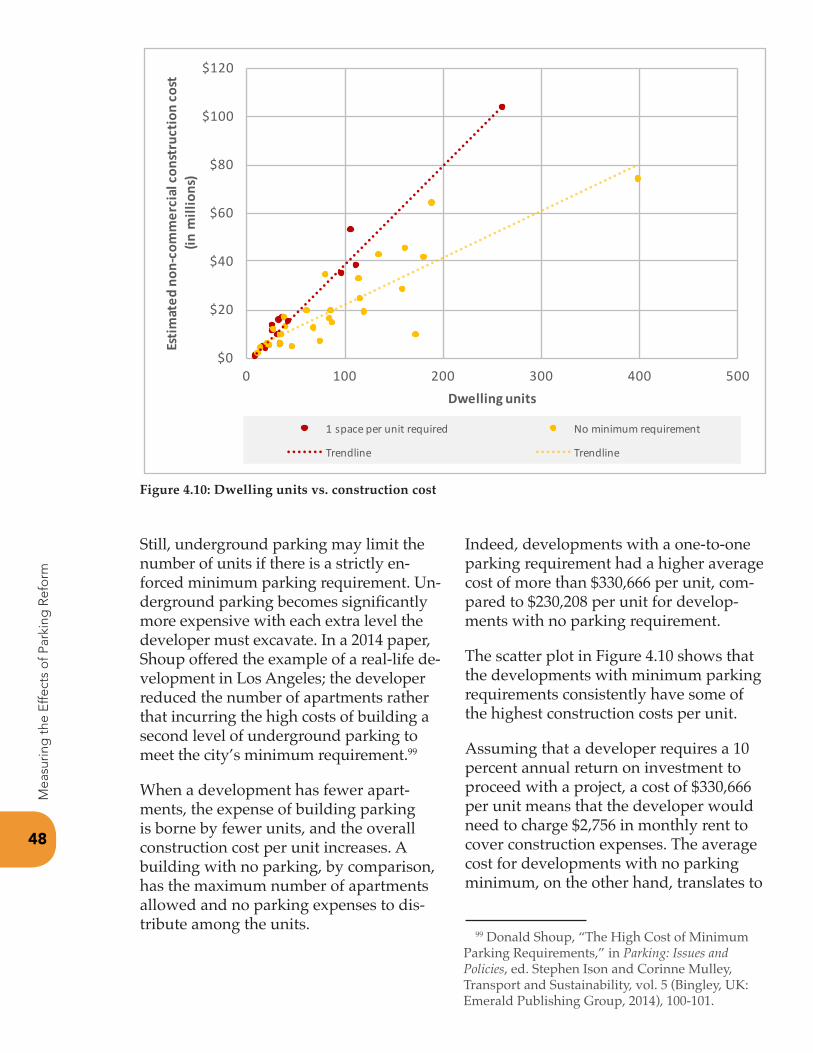
99 Donald Shoup, “The High Cost of Minimum Parking Requirements,” in Parking: Issues and Policies, ed. Stephen Ison and Corinne Mulley, Transport and Sustainability, vol. 5 (Bingley, UK: Emerald Publishing Group, 2014), 100-101.
48
Mea
surin
g t
he E
ffect
s o
f Par
king
Ref
orm
Still, underground parking may limit the number of units if there is a strictly en-forced minimum parking requirement. Un-derground parking becomes significantly more expensive with each extra level the developer must excavate. In a 2014 paper, Shoup offered the example of a real-life de-velopment in Los Angeles; the developer reduced the number of apartments rather that incurring the high costs of building a second level of underground parking to meet the city’s minimum requirement.99
When a development has fewer apart-ments, the expense of building parking is borne by fewer units, and the overall construction cost per unit increases. A building with no parking, by comparison, has the maximum number of apartments allowed and no parking expenses to dis-tribute among the units.
Indeed, developments with a one-to-one parking requirement had a higher average cost of more than $330,666 per unit, com-pared to $230,208 per unit for develop-ments with no parking requirement.
The scatter plot in Figure 4.10 shows that the developments with minimum parking requirements consistently have some of the highest construction costs per unit.
Assuming that a developer requires a 10 percent annual return on investment to proceed with a project, a cost of $330,666 per unit means that the developer would need to charge $2,756 in monthly rent to cover construction expenses. The average cost for developments with no parking minimum, on the other hand, translates to
Figure 4.10: Dwelling units vs. construction cost
$0
$20
$40
$60
$80
$100
$120
0 100 200 300 400 500
Estim
ated
non
-com
mercialco
nstructio
ncost
(inm
illions)
Dwellingunits
1spaceperunitrequired Nominimumrequirement
Trendline Trendline
49
Park
ing
Sp
aces
to L
ivin
g S
pac
es
$1,918 in monthly rent. For a two-person household earning San Francisco’s medi-an income, that extra $800 per month in rent is the difference between housing that is affordable versus unaffordable. In order for $2,756 per month to not be a burden requiring more than 30 percent of their income, that two-person household would need earn at least 1.3 times the median income, or $110,240 annually.
4.5 Summary
The findings of this analysis are consis-tent with most prior research on park-ing. Compared to developments built on parcels that were subject to a minimum re-quirement of one parking space per dwell-ing unit, those within the study area that were not subject to a minimum require-ment had less parking, greater housing density, a larger percentage of units classi-fied as affordable, and lower construction costs per unit.

This page intentionally left blank
Chapter 5Chapter 5The Developer’s
Viewpointhe results in Chapter 4 make a compelling case about San Francisco’s ef-forts to eliminate mini-
mum parking requirements in the Mid-Market and Van Ness corridors. The analysis is consistent with the idea that these reforms have made a difference in encouraging housing that is more affordable and devotes less space to parking.
The results do not, however, con-clusively prove that the reforms directly led to the differences ob-served in residential development. Causality is notoriously difficult to prove in something so complicated as the housing market. Any number of factors—from economic bubbles to school quality—can have drastic effects on what gets built and when. The analysis’s design attempts to compensate for some of this by
T51
focusing on a specific area and time frame, but even small differences in the consis-tency of the study area can sew doubt about the relevance of the results.
For this reason, I spoke directly to six of the people who made the decisions about what got built in the study area: the re-al-estate developers responsible for the projects. Indeed, their responses present a more nuanced picture, in which meeting the parking requirements in the zoning code is one of many considerations that influences what gets proposed, approved, and eventually built.
This chapter will explain how the inter-views were arranged and conducted, followed by a summary of some of the key themes that emerged from the discussions.
5.1 Methodology
Using the same data analyzed in Chapter 4, I identified the largest developments in terms of dwelling units among properties with no minimum parking requirement and with a one-to-one parking require-ment. The consolidated information from the Pipeline Reports usually included the name and contact information of whoever had been the primary contact at the devel-opment firm. Internet research confirmed whether the contact was still with the firm or had changed jobs.
I sent email requests for interviews with a total of 10 developers. Potential interview-ees received a general explanation about the purpose of the study and an assurance that any insights included in the final report would be kept free of identifying information.
Six developers responded to the requests. One of the subjects had moved outside the
Bay Area and had to be interviewed by phone, but the other interviews all took place in person at the subjects’ offices in San Francisco.
The interviews consisted of a set of six questions, tailored for each development based on whether or not it had been sub-ject to a minimum parking requirement. A flexible, open format allowed for spon-taneous questions and requests for clarifi-cation. Questions concerned what factors had led to a residential development on the site, how parking affected plans for the development, how those plans might have changed under a different set of parking requirements, and the developer’s atti-tudes and opinions on parking regulation in general. Sample questionnaires for each group are included in Appendix B.
Audio recordings of the conversations aided in the creation of transcripts, which subjects later had an opportunity to re-view and revise.
5.2 Developments Under Discussion
Each interview request concerned a single development, but several of the inter-viewees revealed that they had worked on multiple projects within the study area. As such, conversations with the six subjects touched on a total of 14 major develop-ments, seven of which had been part of the analysis in Chapter 4. Of these seven developments, four had not been subject to minimum parking requirements at the time of their approval, while three had a requirement of one space per dwelling unit. The properties included two parcels in the Market and Octavia Plan Area, three in the Van Ness SUD, and two just out-side these planning areas on the western
52
The
Dev
elo
per
’s V
iew
po
int
53
Park
ing
Sp
aces
to
Liv
ing
Sp
aces
edge of downtown San Francisco. Most of the projects had the minimum number of affordable units required by the city’s Inclusionary Housing Program, but two consisted entirely of market-rate units.
The other seven developments had re-ceived Planning Commission approval either before or after the study time frame, but their parking situations all provided additional insight into the development and entitlement process.
5.3 Findings
The following are some of the common themes that emerged from the conversa-tions.
5.3.1 The Importance of Parking
There was agreement among all the inter-viewees that parking plays a major role in the development process for condos, affecting designs and financial profiles of projects. They said it exerts “substantial” or “large” influence on their projects. “It’s something that behooves you to figure out early on. It is sort of all about the park-ing,” said one interviewee, who oversaw a development in the Market and Octavia Plan Area with more than 150 dwelling units for a real-estate investment firm.
Only one interviewee said that parking, when weighed against all the other con-siderations that go into a large residential development, was not a primary concern for the developer’s company. This was because the firm is currently focused on rental projects. The real-estate indus-try has long assumed that those buying property care more about parking than renters because they are making a lon-ger-term commitment. In addition, condo buyers who don’t own a car may avoid
a unit without parking because they are worried it may be harder to resell it in the future. If the company were building con-dominiums, the developer said, it would be looking at the demand for parking more closely.
5.3.2 EvidenceofZoning’sInfluence
Two interviewees indicated that parking requirements in the zoning code serve as a starting point when putting together a proposal. One of them, who is in charge of a development with more than 50 units just outside the Van Ness SUD, said the company typically just tries to comply with whatever the minimum parking requirement is.
Two developers related stories of projects they had worked on, for which they felt that parking requirements had resulted in an oversupply of unnecessary parking. These were both developments near the edges of the study area, but they predated the Market and Octavia Area Plan. “It’s been around 16 years, and parking has never been full. Never,” one interviewee said of an approximately 250-unit devel-opment. It has more than 200 parking spaces, even though it is blocks from a BART station.
The other development comprised near-ly 100 below-market-rate units next to a streetcar stop. Some neighbors were strongly opposed to the affordable apart-ments, so the developer decided not to seek any variances to avoid subjecting the entire project to Planning Commission re-view. The one-to-one parking requirement meant constructing a level and a half of underground parking, 75 percent of which goes unused, the interviewee said. “It was just a tragedy of wasted money,” the
54
The
Dev
elo
per
’s V
iew
po
int
developer said. “It was the wrong way for planning to happen in San Francisco.”
5.3.3 What If … ?
Interviewees whose developments were not subject to a minimum parking re-quirement were asked what would have happened if there had instead been a one-to-one requirement in effect. They agreed that such a scenario would have changed their projects, but there were a variety of answers about what, specifically, those changes might have involved. Five devel-opers said they may have tried to put in more parking, and three of them noted that this would have made the project more expensive. The developer of a mixed-in-come project in which a third of the units are affordable explicitly stated that rents would have gone up to cover the addition-al construction costs. Two developers said they might have sought a variance that would have allowed them to have less than the required amount of parking.
The developer of a project with more than 150 units located just outside the Market and Octavia Plan Area said it was “possi-ble” that such a requirement would have made the project “infeasible.” In fact, none of the residential projects the interview-ee’s company has considered recently have been financially attractive enough to pursue—due in part to San Francisco’s
new, higher inclusionary housing require-ments—“and that’s without having to do an extra level of parking that you don’t feel is needed,” the developer said.
“You look at a project as income—total revenue [minus] the costs—and if it barely makes any money … you’re not going to do it, your investors aren’t going to invest in it, your lender isn’t going to lend on it,” the interviewee said. “Having to do an additional floor of parking at $1.5 million to $2 million is going to be an additional cost that we don’t feel like you need … in the marketplace.”
The same developer said, “I don’t know what you would have done” if a one-to-one requirement had applied to the nearly 400-unit adaptive reuse project the company completed in the Market and Octavia Plan Area. The development utilized an existing garage with about 100 parking spaces.
“It was just a tragedy of wasted money. … It was the wrong way for planning to happen in San Francisco.”
—Interviewee #1, on an affordable housing development where 75 percent of the parking
goes unused
“You look at a project as income—total revenue [minus] the costs—and if it barely makes any money … you’re not going to do it, your investors aren’t going to invest in it, your lender isn’t going to lend on it. Having to do an additional floor of parking at $1.5 million to $2 million is going to be an additional cost that we don’t feel like you need … in the marketplace.”
—Interviewee #6
55
Park
ing
Sp
aces
to
Liv
ing
Sp
aces
Another interviewee wished that a strictly enforced one-to-one requirement had still been in place when the developer sought approval for a roughly 250-unit building in the Van Ness SUD. Such a minimum would have allowed the project to include additional parking. “[With] market-rate housing, we are looking to maximize the amount of parking that we can get,” the developer said.
For those projects that were required to build one parking space per unit, it is less clear that things would have turned out differently if there had been no minimum in place. Two developers said there would have been no change to their plans.
5.3.4 The Entitlement Process
Even if a parcel has a minimum parking requirement based on zoning, there is no guarantee that the developer will actual be required to build that amount of parking. “In San Francisco, there’s what’s in the Planning Code and then there’s current policy—unwritten policy,” said one inter-viewee. For a project with more than 250 units in the Van Ness SUD, the developer said, the Planning Department clearly sig-naled that it would not support one park-ing space for every unit—even though that was what the Planning Code called for. The developer proposed about 0.75 spaces per unit, and the department recommend-ed that the Planning Commission grant an exemption from the minimum require-ment. One block away, another interview-ee’s development ended up with a similar percentage of parking spaces for more than 100 units, despite also being in the Van Ness SUD. These developments were both approved toward the end of the study time frame, as momentum was building within city government to reform parking requirements in the Van Ness corridor.
Some developers indicated that the amount of parking proposed for a project is often more of a political consideration. “I really believe in having less parking, but I believe in having housing,” said a development director. “We can’t just not have projects approved just because of parking, right? So you look at it as ... a mechanism to get projects approved.” If adding more parking will help a project win support, the developer will add more regardless of whether the building actual-ly needs it from a practical standpoint.
5.3.5 OtherInfluentialFactors
The interviewees emphasized several fac-tors other than minimum parking require-ments that influence how much parking a project has. In particular, the building
“In San Francisco, there’s what’s in the Planning Code and then there’s current policy—unwritten policy.”
—Interviewee #3
“We can’t just not have projects approved just because of parking, right? So you look at it as ... a mechanism to get projects approved.”
—Interviewee #5
56
The
Dev
elo
per
’s V
iew
po
int
footprint plays a large role. Each addi-tional level of underground parking not only adds a construction cost, but digging deeper increases the danger of encounter-ing contaminated soil or a historic artifact, either of which can lead to expensive de-lays. Going below the water table means adding costly waterproofing measures. For these reasons, four developers said they often plan on simply fitting as much parking as possible on one underground level and seeking an exemption from min-imum parking requirements if necessary. Mechanical stackers are also becoming more common and can help meet a mini-mum requirement without digging deeper (see Figure 5.1).
Developers also pointed to the power of neigh-borhood asso-ciations in San Francisco’s ap-proval process. “Each neighbor-hood group has a very differ-ent feel about parking,” said a development director who had projects in the Van Ness SUD and Market and Octavia Plan Area. “[They] have so much ability to affect whether or not you get a project entitled that you have to kind of work with them on those important issues” like parking. While most neighborhood groups typically push for more off-street parking because members are worried about new residents taking on-street parking spaces, the Hayes Valley Neighborhood Association often pushes developers to include even less than the maximum limits set by the Mar-
ket and Octavia Area Plan. Four different developers remarked on this. “The com-munity actually wanted us to go to zero (parking),” said the developer of a site with more than 150 units in the Market and Octavia Plan Area. “That’s the first time I ever experienced that.”
5.3.6 AttitudesAboutParking Reform
The developers were generally supportive of San Francisco’s approach to parking, including efforts to reduce space devoted to parking in urban neighborhoods like the study area and the emphasis on “tran-
sit first.” One interviewee characterized the Planning Department’s perspective on parking as “en-lightened rea-sonableness.”
Only one devel-oper expressed a degree of sup-port for main-taining mini-mum parking
requirements. The developer didn’t think the city government or neighborhood associations should be actively trying to impose a car-free lifestyle on all residents. In addition, having zoning dictate the amount of parking “takes a little bit of the fight out of the community’s hands, be-cause parking requirements are what they are,” the developer said.
5.3.7 A Changing Marketplace
All of the developments discussed during the interviews had some parking. Only one
“The community actually wanted us to go to zero (parking). That’s the first time I ever experienced that.”
—Interviewee #2, on the Hayes Valley Neighborhood Association

57
Park
ing
Sp
aces
to
Liv
ing
Sp
aces
developer said they had considered zero parking as an option for a project. Most said that it’s difficult for a project to be suc-cessful and to provide less than one park-ing space for every four dwelling units.
Still, most interviewees said they believe the housing market is showing signs of change, with more prospective residents willing to consider living in a unit with-out parking. Some characterized the shift as being driven by younger millennials moving into the city, while current, older residents remain skeptical. One develop-ment director said educating these older residents is essential to the firm’s outreach efforts. The developer uses personal expe-rience to describe how it’s possible to live without a personal automobile by using new technology like the car-sharing app Getaround. “I feel like I have to really take them on a journey of what it looks like now to live in San Francisco versus when they moved here and their day-to-day patterns,” the developer said.
5.4 Summary
Interviewees indicated that parking is a major consideration when designing a large residential project, and they offered evidence that minimum parking require-ments can result in a building with more parking than the developer thinks is nec-essary. Developers of properties that had no minimum parking requirement were unsure what they would have done if they had been required to build one space per unit; in some cases, they said, they development may not have been feasi-ble. They are supportive of the Planning Department’s efforts to limit parking and encourage transit, in part because they see a changing market in San Francisco, in which prospective buyers and tenants are
more open to the idea of living without their own personal automobile.
Overall, the developers presented a por-trait of parking as a complex decision that depends on weighing a number of compet-ing factors, including what’s written in the zoning code, what the Planning Depart-ment and local neighborhood association will support, what can fit on the site with-out a big increase in costs, and what will attract enough buyers or renters to avoid vacancies. The word “balance” came up frequently. “It’s like everything else, … bal-ancing what the community really wants to see versus what you think is needed for your customer,” said one developer.
Figure 5.1: Stalls with mechanical stackers. Such parking arrangements are becoming a more common and accepted way to meet parking requirements without adding another complete underground level.

Thispageintentionallyleftblank
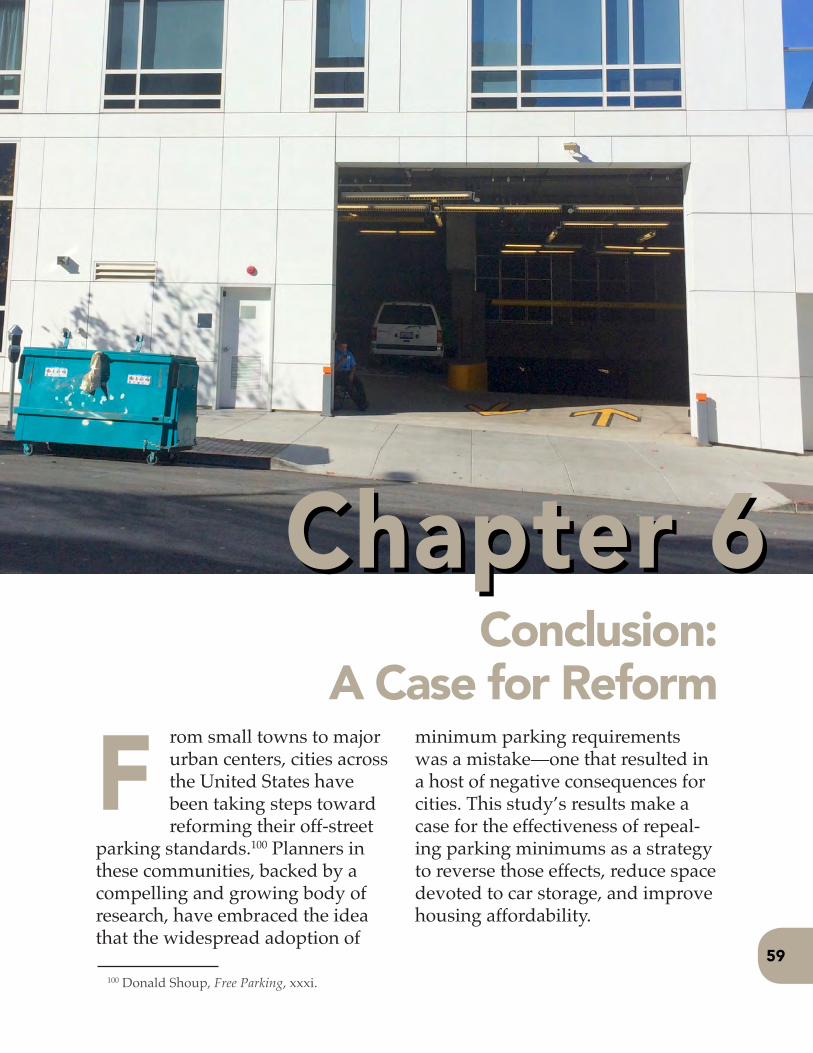
Chapter 6Chapter 6Conclusion:
A Case for Reformrom small towns to major urban centers, cities across the United States have been taking steps toward reforming their off-street
parking standards.100 Planners in these communities, backed by a compelling and growing body of research, have embraced the idea that the widespread adoption of
minimum parking requirements was a mistake—one that resulted in a host of negative consequences for cities. This study’s results make a case for the effectiveness of repeal-ing parking minimums as a strategy to reverse those effects, reduce space devoted to car storage, and improve housing affordability.
F59
100 Donald Shoup, Free Parking, xxxi.
6.1 Summary of Findings
Taken together, the results of the quanti-tative and qualitative analyses provide evi-dence that San Francisco’s efforts to reform off-street parking requirements did influ-ence residential development in the city.
Residential developments in zoning dis-tricts near Market Street and Van Ness Av-enue without minimum parking require-ments had, on average, significantly less parking, greater housing density, a larger percentage of units offered at affordable rates, and lower construction costs. Specif-ically, these developments had an average of 36 parking spaces for every 100 dwell-ing units, compared to 90 spaces per 100 units for developments with a minimum parking requirement of one space per unit. They had 262 units per acre, compared to 162 for developments with a minimum requirement. Of the total units they add-ed, 23 percent met the city’s definition of affordable housing, compared to 6 percent for developments with a minimum re-quirement. And their average construction cost was about $230,000 per unit, com-pared to more than $330,000 for develop-ments with a minimum requirement. Sta-tistical tests confirmed with greater than 95 percent confidence that these differenc-es are not due to chance—although the exact nature of the relationship between parking standards and housing density is unclear, and the results should be inter-preted with caution. A regression analysis indicated that there may be an interaction with San Francisco’s restrictions on build-ing heights, which exerted a much stron-ger influence on housing density in the study area than parking requirements did.
The qualitative analysis supports the idea that zoning changes adopted by the city
were responsible for some of these differ-ences. The developers interviewed stated that parking exerts a substantial influence on residential projects, especially condo-miniums. While factors other than the Planning Code can influence the amount of parking included with a project, and the standards in the code are not always enforced, some developers said that park-ing requirements often serve as a starting point for their proposals. Others offered examples of developments that ended up with more parking than necessary because of strictly enforced minimum require-ments. Those who had built developments in zoning districts with no minimum requirement said that the projects would have turned out differently or might not have happened at all if the city had insist-ed on one space per unit. Finally, most de-velopers said they are seeing evidence of a changing market in San Francisco, with more prospective residents willing to live in a unit that does not include parking.
6.1.1 What Parking Reform Achieved in San Francisco
It is impossible to say exactly how the Market and Octavia Plan Area might have turned out if the city had not made park-ing reform a key part of its vision for the neighborhood. Most likely, central San Francisco would have seen some combina-tion of more space devoted to parking and less to housing, fewer affordable units, and more expensive rents and sale prices.
The results of the data analysis can pro-vide some insight into what might have been, by taking the averages for the 14 developments that were subject to a minimum parking requirement and applying those characteristics to the 30 developments that were not. If those 30 60
Co
nclu
sio
n
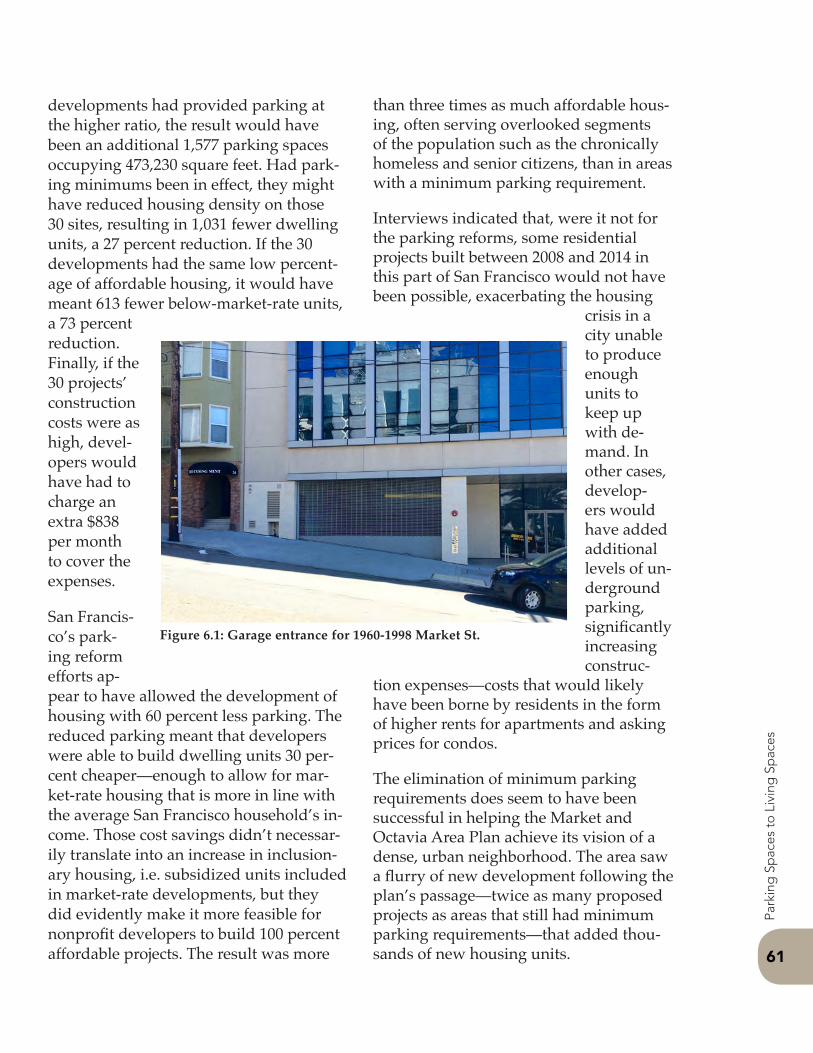
61
Park
ing
Sp
aces
to
Liv
ing
Sp
aces
developments had provided parking at the higher ratio, the result would have been an additional 1,577 parking spaces occupying 473,230 square feet. Had park-ing minimums been in effect, they might have reduced housing density on those 30 sites, resulting in 1,031 fewer dwelling units, a 27 percent reduction. If the 30 developments had the same low percent-age of affordable housing, it would have meant 613 fewer below-market-rate units, a 73 percent reduction. Finally, if the 30 projects’ construction costs were as high, devel-opers would have had to charge an extra $838 per month to cover the expenses.
San Francis-co’s park-ing reform efforts ap-pear to have allowed the development of housing with 60 percent less parking. The reduced parking meant that developers were able to build dwelling units 30 per-cent cheaper—enough to allow for mar-ket-rate housing that is more in line with the average San Francisco household’s in-come. Those cost savings didn’t necessar-ily translate into an increase in inclusion-ary housing, i.e. subsidized units included in market-rate developments, but they did evidently make it more feasible for nonprofit developers to build 100 percent affordable projects. The result was more
than three times as much affordable hous-ing, often serving overlooked segments of the population such as the chronically homeless and senior citizens, than in areas with a minimum parking requirement.
Interviews indicated that, were it not for the parking reforms, some residential projects built between 2008 and 2014 in this part of San Francisco would not have been possible, exacerbating the housing
crisis in a city unable to produce enough units to keep up with de-mand. In other cases, develop-ers would have added additional levels of un-derground parking, significantly increasing construc-
tion expenses—costs that would likely have been borne by residents in the form of higher rents for apartments and asking prices for condos.
The elimination of minimum parking requirements does seem to have been successful in helping the Market and Octavia Area Plan achieve its vision of a dense, urban neighborhood. The area saw a flurry of new development following the plan’s passage—twice as many proposed projects as areas that still had minimum parking requirements—that added thou-sands of new housing units.
Figure 6.1: Garage entrance for 1960-1998 Market St.
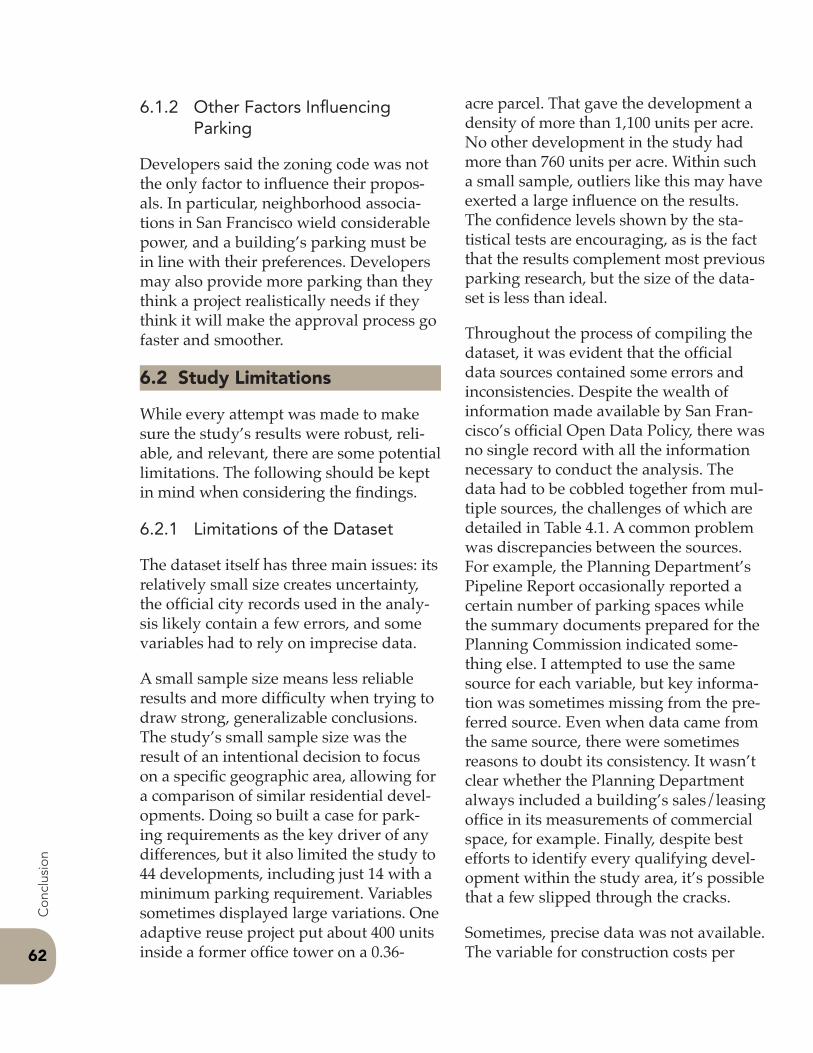
6.1.2 OtherFactorsInfluencing Parking
Developers said the zoning code was not the only factor to influence their propos-als. In particular, neighborhood associa-tions in San Francisco wield considerable power, and a building’s parking must be in line with their preferences. Developers may also provide more parking than they think a project realistically needs if they think it will make the approval process go faster and smoother.
6.2 Study Limitations
While every attempt was made to make sure the study’s results were robust, reli-able, and relevant, there are some potential limitations. The following should be kept in mind when considering the findings.
6.2.1 Limitations of the Dataset
The dataset itself has three main issues: its relatively small size creates uncertainty, the official city records used in the analy-sis likely contain a few errors, and some variables had to rely on imprecise data.
A small sample size means less reliable results and more difficulty when trying to draw strong, generalizable conclusions. The study’s small sample size was the result of an intentional decision to focus on a specific geographic area, allowing for a comparison of similar residential devel-opments. Doing so built a case for park-ing requirements as the key driver of any differences, but it also limited the study to 44 developments, including just 14 with a minimum parking requirement. Variables sometimes displayed large variations. One adaptive reuse project put about 400 units inside a former office tower on a 0.36-
acre parcel. That gave the development a density of more than 1,100 units per acre. No other development in the study had more than 760 units per acre. Within such a small sample, outliers like this may have exerted a large influence on the results. The confidence levels shown by the sta-tistical tests are encouraging, as is the fact that the results complement most previous parking research, but the size of the data-set is less than ideal.
Throughout the process of compiling the dataset, it was evident that the official data sources contained some errors and inconsistencies. Despite the wealth of information made available by San Fran-cisco’s official Open Data Policy, there was no single record with all the information necessary to conduct the analysis. The data had to be cobbled together from mul-tiple sources, the challenges of which are detailed in Table 4.1. A common problem was discrepancies between the sources. For example, the Planning Department’s Pipeline Report occasionally reported a certain number of parking spaces while the summary documents prepared for the Planning Commission indicated some-thing else. I attempted to use the same source for each variable, but key informa-tion was sometimes missing from the pre-ferred source. Even when data came from the same source, there were sometimes reasons to doubt its consistency. It wasn’t clear whether the Planning Department always included a building’s sales/leasing office in its measurements of commercial space, for example. Finally, despite best efforts to identify every qualifying devel-opment within the study area, it’s possible that a few slipped through the cracks.
Sometimes, precise data was not available. The variable for construction costs per 62
Co
nclu
sio
n
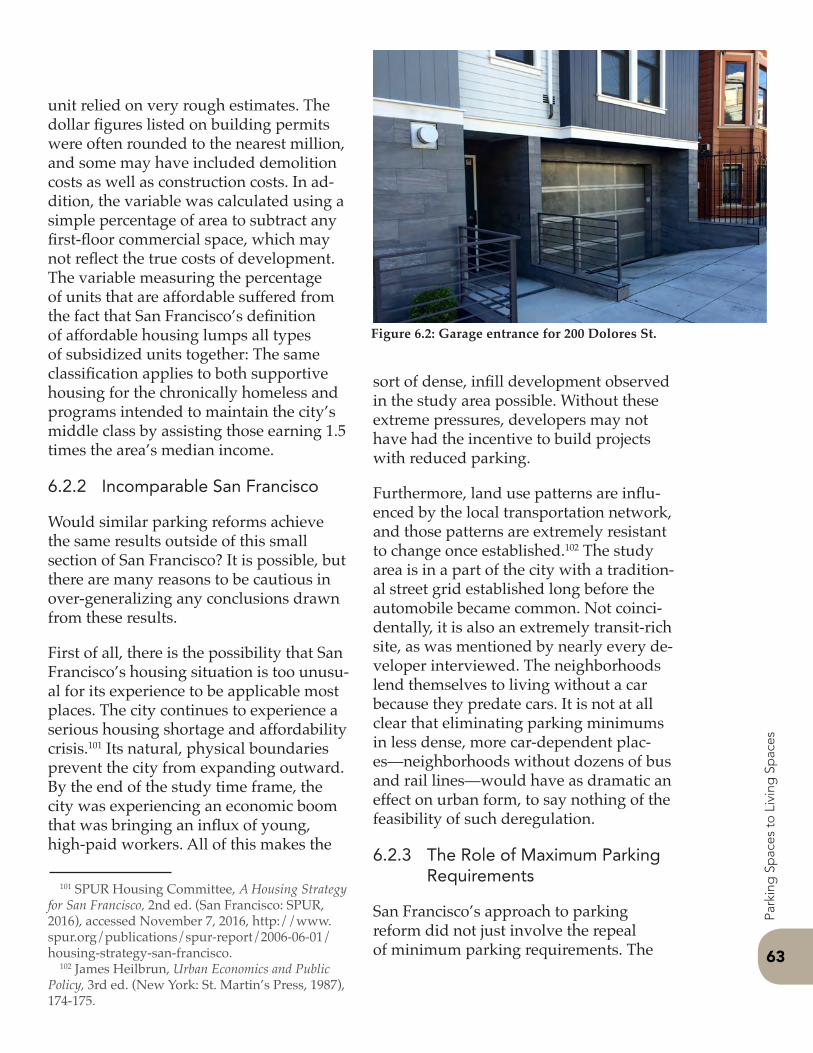
63
Park
ing
Sp
aces
to
Liv
ing
Sp
aces
unit relied on very rough estimates. The dollar figures listed on building permits were often rounded to the nearest million, and some may have included demolition costs as well as construction costs. In ad-dition, the variable was calculated using a simple percentage of area to subtract any first-floor commercial space, which may not reflect the true costs of development. The variable measuring the percentage of units that are affordable suffered from the fact that San Francisco’s definition of affordable housing lumps all types of subsidized units together: The same classification applies to both supportive housing for the chronically homeless and programs intended to maintain the city’s middle class by assisting those earning 1.5 times the area’s median income.
6.2.2 Incomparable San Francisco
Would similar parking reforms achieve the same results outside of this small section of San Francisco? It is possible, but there are many reasons to be cautious in over-generalizing any conclusions drawn from these results.
First of all, there is the possibility that San Francisco’s housing situation is too unusu-al for its experience to be applicable most places. The city continues to experience a serious housing shortage and affordability crisis.101 Its natural, physical boundaries prevent the city from expanding outward. By the end of the study time frame, the city was experiencing an economic boom that was bringing an influx of young, high-paid workers. All of this makes the
sort of dense, infill development observed in the study area possible. Without these extreme pressures, developers may not have had the incentive to build projects with reduced parking.
Furthermore, land use patterns are influ-enced by the local transportation network, and those patterns are extremely resistant to change once established.102 The study area is in a part of the city with a tradition-al street grid established long before the automobile became common. Not coinci-dentally, it is also an extremely transit-rich site, as was mentioned by nearly every de-veloper interviewed. The neighborhoods lend themselves to living without a car because they predate cars. It is not at all clear that eliminating parking minimums in less dense, more car-dependent plac-es—neighborhoods without dozens of bus and rail lines—would have as dramatic an effect on urban form, to say nothing of the feasibility of such deregulation.
6.2.3 TheRoleofMaximumParkingRequirements
San Francisco’s approach to parking reform did not just involve the repeal of minimum parking requirements. The
101 SPUR Housing Committee, A Housing Strategy for San Francisco, 2nd ed. (San Francisco: SPUR, 2016), accessed November 7, 2016, http://www.spur.org/publications/spur-report/2006-06-01/housing-strategy-san-francisco.
102 James Heilbrun, Urban Economics and Public Policy, 3rd ed. (New York: St. Martin’s Press, 1987), 174-175.
Figure 6.2: Garage entrance for 200 Dolores St.
103 Guo and Ren, 1198.104 Bertha, 124.105 Christopher McCahill, Jessica Haerter-
Ratchford, Norman Garrick, and Carol Atkinson-Palombo, “Parking in Urban Centers: Policies, Supplies, and Implications in Six Cities,” Transportation Research Record: Journal of the Transportation Research Board 2469 (2014): 49-56.
zoning changes typically also involved the creation of new maximum limits on parking. The analysis did not consider how different maximum requirements may have affected parking in the study area. Guo and Ren’s 2013 study of parking reform in London found that the removal of minimum standards was responsible for nearly all of the observed reduction in parking that occurred; however, they were surprised to find that post-reform developments in the city’s densest neigh-borhoods actually had more parking than those in less-dense areas nearby. The au-thors concluded that the maximum limits in Central London were likely set too high to be effective, and that removal of min-imum standards alone is not enough to create an efficient system. “Complemen-tary policies such as a restrictive maxi-mum standard or a special parking tax are needed to control the ‘excessive parking’ in transit-rich and dense areas.”103
The maximums in the Market and Octavia Plan Area are lower than the maximums Guo and Ren found in Central London, so it’s possible that the limits were effective in preventing excessive parking. This also ties in with what one interviewee said: when it came to market-rate housing, the developer was looking to include as much parking as zoning rules and the building footprint would allow. In other words, simple deregulation of parking may not be enough to have an appreciable effect on housing; cities may need to actively im-pose strict limits on parking.
6.3 Suggestions for Future Research
For urban planners to be able to say with certainty what the elimination of mini-mum parking requirements can realisti-
cally achieve, researchers need to conduct more studies in locations beyond San Francisco to see if they find similar results. To date, there have been only a limited number of studies looking at the effects of parking reform, and they have focused on large metropolises, such as London and Los Angeles. These papers, like the cur-rent study, have generally supported the case for eliminating parking minimums; however, there is very little evidence of how these policies might play out in small towns, suburban settings, or expanding metro areas like Atlanta and Las Vegas. With the ideas espoused by Shoup gaining wider acceptance in a growing number of cities, there will be more and more oppor-tunities for this type of research.
The ambiguous results regarding hous-ing density make this an area for further study, too. Researchers including Bertha104 and McCahill et al.105 found evidence that minimum parking requirements produce less dense housing, but there is little data on whether removing those requirements can spur greater density. The results of the current study are consistent with that out-come, but they are not conclusive. More thorough research is needed on whether there is any relationship between parking, density, and other zoning controls like height limits.
6.4 Implications of the Study
Any city confronting a crisis in housing affordability should look closely at its parking policy. The more the city’s sit-uation mirrors San Francisco’s—a large metropolitan center with a housing short-
64
Co
nclu
sio
n
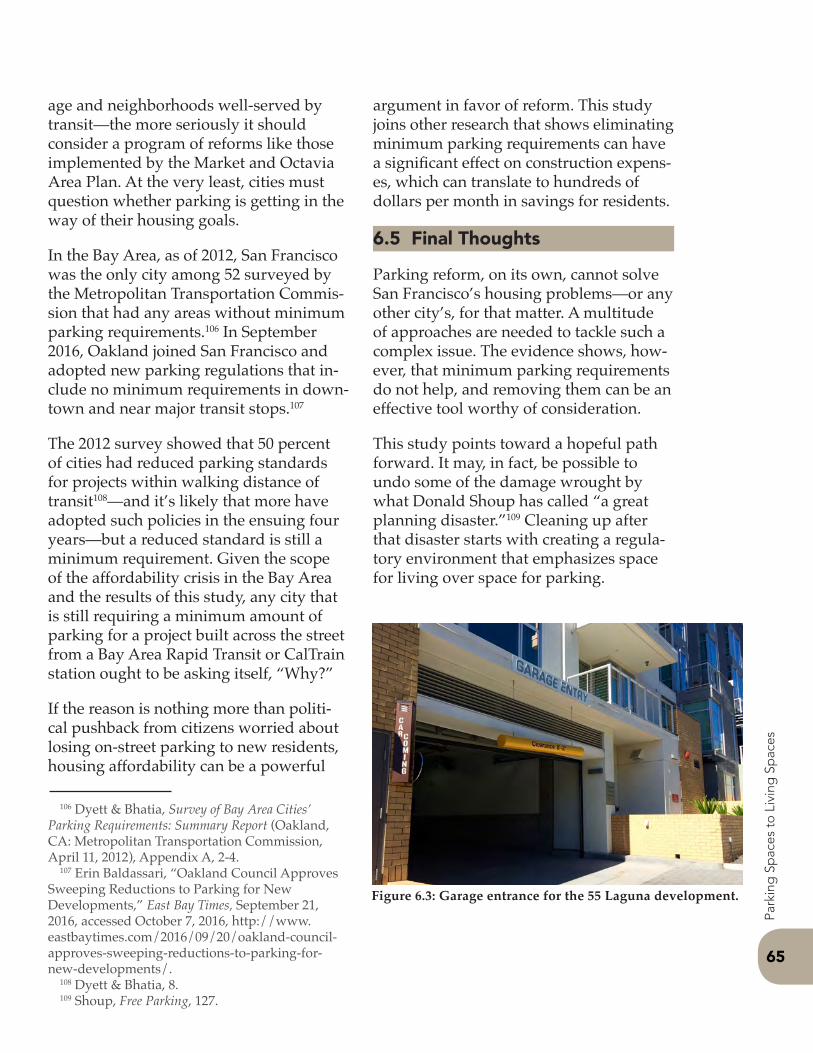
65
Park
ing
Sp
aces
to
Liv
ing
Sp
aces
age and neighborhoods well-served by transit—the more seriously it should consider a program of reforms like those implemented by the Market and Octavia Area Plan. At the very least, cities must question whether parking is getting in the way of their housing goals.
In the Bay Area, as of 2012, San Francisco was the only city among 52 surveyed by the Metropolitan Transportation Commis-sion that had any areas without minimum parking requirements.106 In September 2016, Oakland joined San Francisco and adopted new parking regulations that in-clude no minimum requirements in down-town and near major transit stops.107
The 2012 survey showed that 50 percent of cities had reduced parking standards for projects within walking distance of transit108—and it’s likely that more have adopted such policies in the ensuing four years—but a reduced standard is still a minimum requirement. Given the scope of the affordability crisis in the Bay Area and the results of this study, any city that is still requiring a minimum amount of parking for a project built across the street from a Bay Area Rapid Transit or CalTrain station ought to be asking itself, “Why?”
If the reason is nothing more than politi-cal pushback from citizens worried about losing on-street parking to new residents, housing affordability can be a powerful
argument in favor of reform. This study joins other research that shows eliminating minimum parking requirements can have a significant effect on construction expens-es, which can translate to hundreds of dollars per month in savings for residents.
6.5 Final Thoughts
Parking reform, on its own, cannot solve San Francisco’s housing problems—or any other city’s, for that matter. A multitude of approaches are needed to tackle such a complex issue. The evidence shows, how-ever, that minimum parking requirements do not help, and removing them can be an effective tool worthy of consideration.
This study points toward a hopeful path forward. It may, in fact, be possible to undo some of the damage wrought by what Donald Shoup has called “a great planning disaster.”109 Cleaning up after that disaster starts with creating a regula-tory environment that emphasizes space for living over space for parking.
106 Dyett & Bhatia, Survey of Bay Area Cities’ Parking Requirements: Summary Report (Oakland, CA: Metropolitan Transportation Commission, April 11, 2012), Appendix A, 2-4.
107 Erin Baldassari, “Oakland Council Approves Sweeping Reductions to Parking for New Developments,” East Bay Times, September 21, 2016, accessed October 7, 2016, http://www.eastbaytimes.com/2016/09/20/oakland-council-approves-sweeping-reductions-to-parking-for-new-developments/.
108 Dyett & Bhatia, 8.109 Shoup, Free Parking, 127.
Figure 6.3: Garage entrance for the 55 Laguna development.

This page intentionally left blank
67
Park
ing
Sp
aces
to L
ivin
g S
pac
es
Baldassari, Erin. “Oakland Council Approves Sweeping Reductions to Parking for New Developments.” East Bay Times, September 21, 2016. Accessed October 7, 2016. http://www.eastbaytimes.com/2016/09/20/oakland-council-approves-sweeping-reductions-to-parking-for-new-developments/.
Been, Vicki, Caitlyn Brazill, Josiah Madar, and Simon McDonnell. Searching for the Right Spot: Minimum Parking Requirements and Housing Affordability in New York City. New York: Furman Center for Real Estate and Urban Policy, March 2012.
Bertha, Brian. “Appendix A: Impacts of Oakland’s Zoning Change.” In The Low-Rise Speculative Apartment, by Wallace Smith. Berkeley, California: UC Berkeley Institute of Urban and Regional Development, 1964.
Batchis, Wayne. “Enabling Urban Sprawl: Revisiting the Supreme Court’s Seminal Zoning Decision Euclid V. Ambler in the 21st Century.” Virginia Journal of Social Policy & the Law 17, no. 3 (2010): 373-403.
California Association of Realtors. “Housing Affordability Index – Traditional.” Accessed October 10, 2016. http://www.car.org/marketdata/data/haitraditional/.
City and County of San Francisco. “Better Neighborhoods Program.” Accessed September 21, 2016. http://sf-planning.org/better-neighborhoods-program.
———. Inclusionary Affordable Housing Program Monitoring and Procedures Manual. 2013. Accessed September 26, 2016. http://sfmohcd.org/sites/default/files/FileCenter/Documents/6983-Inclusionary%20Procedures%20Manual%20051013.pdf.
———. “The Pipeline Report.” Accessed September 27, 2016. http://sf-planning.org/pipeline-report.
City of Boston Air Pollution Control Commission. Procedures and Criteria for Issuance of Parking Freeze Permits. Updated March 15, 2006. Accessed May 16, 2016. https://www.cityofboston.gov/images_documents/town_freeze_reg_tcm3-12843.pdf.
Dyett & Bhatia. Survey of Bay Area Cities’ Parking Requirements: Summary Report. Oakland, CA: Metropolitan Transportation Commission, April 11, 2012.
Ferguson, Erik. “Zoning for Parking as Policy Process: A Historical Review.” Transport Reviews 24, no. 2 (2004): 177-194.
Flink, James J. The Car Culture. Cambridge, MA: MIT Press, 1975.
Guo, Zhan, and Shuai Ren. “From Minimum to Maximum: Impact of the London Parking Reform on Residential Parking Supply from 2004 to 2010.” Urban Studies 50, no. 6 (2013): 1183-1200.
Hallowell, Alexandra, and Kelan Stoy. “The Rent is Too Damn High: Parking and Affordability in Portland, Oregon.” Paper presented at Transportation Review Board 94th Annual Meeting, Washington, DC, January 11-15, 2015.
Heilbrun, James. Urban Economics and Public Policy. 3rd ed. New York: St. Martin’s Press, 1987.
Inci, Eren. “A Review of the Economics of Parking.” Economics of Transportation 4, no. 1 (2015), 50-63.
Bibliography
68
Bib
liog
rap
hy
Jia, Wenyu, and Martin Wachs. “Parking Requirements and Housing Affordability: Case Study of San Francisco.” Transportation Research Record: Journal of the Transportation Research Board 1685 (1999): 156-160.
League of Women Voters. “Measure E: The Central Freeway Replacement Project of 1998, City of San Francisco.” February 16, 1999. Accessed September 21, 2016. http://www.smartvoter.org/1998nov/ca/sf/meas/E/.
Levinson, David. Review of The High Cost of Free Parking by Donald Shoup. Journal of the American Planning Association 71, no. 4 (2005): 459.
Li, Fei and Zhan Guo. “Do Parking Standards Matter? Evaluating the London Parking Reform with a Matched-Pair Approach.” Transportation Research Part A: Policy & Practice 67 (2014): 352-365.
Litman, Todd. Parking Requirement Impacts on Housing Affordability. Victoria, BC: Victoria Transportation Policy Institute, 2016.
———. “Parking Costs.” In Transportation Cost and Benefit Analysis: Techniques, Estimates and Implications. 2nd ed. Victoria, BC: Victoria Transportation Policy Institute, 2009.
Manville, Michael. “Parking Requirements and Housing Development: Regulation and Reform in Los Angeles.” Journal of the American Planning Association 79, no. 1 (2013): 49-66.
Manville, Michael, Alex Beata, and Donald Shoup. “Turning Housing into Driving: Parking Requirements and Density in Los Angeles and New York.” Housing Policy Debate 23, no. 2 (2013): 350-375.
Manville, Michael, and Donald Shoup. “Parking, People, and Cities.” Journal of Urban Planning and Development 131, no. 4 (2005): 233-245.
Marshall, Wesley, and Norman Garrick. “Parking at Mixed-Use Centers in Small Cities.” Transportation Research Record: Journal of the Transportation Research Board 1977 (2006): 164-171.
McCahill, Christopher, Jessica Haerter-Ratchford, Norman Garrick, and Carol Atkinson-Palombo. “Parking in Urban Centers: Policies, Supplies, and Implications in Six Cities.” Transportation Research Record: Journal of the Transportation Research Board 2469 (2014): 49-56.
McCloud, John. New York Times News Service. “San Francisco Developing a ‘Champs-Elysees.’” Chicago Tribune, June 19, 1992. Accessed September 21, 2016. http://articles.chicagotribune.com/1992-01-19/business/9201060060_1_retail-space-residential-projects-feet-of-residential-space.
McDonald, Reginald. “The Birth and Life of the Freeway in Hayes Valley.” Hoodline, August 9, 2015. Accessed September 21, 2016. http://hoodline.com/2015/08/hayes-valley-the-central-freeway.
Metcalf, Gabriel, and Jennifer Warburg. “In San Francisco, the Boom is Back.” The Urbanist, December 18, 2012. Accessed September 26, 2016. http://www.spur.org/publications/urbanist-article/2012-12-18/san-francisco-boom-back.
Mukhija, Vinit, and Donald Shoup. “Quantity Versus Quality in Off-Street Parking Requirements.” Journal of the American Planning Association 72, no. 3 (2006): 296-308.
69
Park
ing
Sp
aces
to L
ivin
g S
pac
es
Muller, Peter O. “Transportation and Urban Form: Stages in the Spatial Evolution of the American Metropolis.” In The Geography of Urban Transportation, 3rd ed., edited by Susan Hanson and Genevieve Giuliano. New York: The Guilford Press, 2004.
Nelson, Arthur, Michael Meyer, and Catherine Ross. “Parking Supply Policy and Transit use: Case Study of Atlanta, Georgia.” Transportation Research Record: Journal of the Transportation Research Board 1604 (1997): 60-66.
New York City Department of City Planning. “Zoning Background.” Accessed May 12, 2016. http://www1.nyc.gov/site/planning/zoning/background.page.
Racked San Francisco. “How Did Hayes Valley Become SF’s Most Stylish Neighborhood?” August 5, 2014. Accessed September 21, 2016. http://sf.racked.com/2014/8/5/7583303/hayes-valley-sfs-most-stylish-transformation.
Rosen, Marcia, and Wendy Sullivan. “From Urban Renewal and Displacement to Economic Inclusion: San Francisco Affordable Housing Policy 1978-2014.” Stanford Law & Policy Review 25, no. 1 (2014): 121-162.
San Francisco Board of Supervisors. San Francisco Planning Code. Accessed November 2, 2016. http://planning.sanfranciscocode.org/.
———. Planning Code: Amendments to Implement the Market and Octavia Area Plan. Ordinance No. 72-08, April 8, 2008. Accessed September 21, 2016. https://sfgov.legistar.com/View.ashx? M=F&ID=710871&GUID=822BCE5D-1185-4FF9-B83A-32F2DFE41835.
———. Planning Code: Uses, Conformity of Uses, Parking Requirements for Uses, and Special Use Districts. Ordinance No. 232-14, November 18, 2014. Accessed September 21, 2016. https://sfgov.legistar.com/View.ashx?M=F&ID=3395373&GUID=865394CC-7771-46ED-9D30-39F6987DA43B.
San Francisco Mayor’s Office of Housing and Community Development. “Finding Affordable Rental Housing in San Francisco.” Accessed September 26, 2016. http://sfmohcd.org/FINDING-AFFORDABLE-RENTAL-HOUSING-SAN-FRANCISCO.
San Francisco Planning Commission. San Francisco General Plan. Amended by Resolution No.14149, June 27, 1996. Accessed September 21, 2016. http://sf-planning.org/ftp/General_Plan/index.htm.
San Francisco Planning Department. Executive Summary: Planning Code Text and Map Change. Case No. 2011.0532T (Board File No. 11-0548) and 2011.0533Z (Board File No. 11-0577). San Francisco: May 17, 2012. Accessed September 21, 2016. http://commissions.sfplanning.org/cpcpackets/2011.0533Zc5.pdf.
———. “Height and Bulk Districts” (map). 1:14,000. Zoning Map of the City and County of San Francisco. San Francisco: City and County of San Francisco, 2016. Accessed September 21, 2016. http://library.amlegal.com/nxt/gateway.dll/California/zoningmaps/dat/0-0-0-1523.pdf?f=templates$fn=document-frame.htm$3.0.
70
Bib
liog
rap
hy
———. Van Ness Avenue Plan Initial Study. Case No. 82.392EZTM. San Francisco: June 10, 1983. Accessed September 21, 2016. https://archive.org/stream/vannessavenuepla1019sanf#page/n1/mode/2up.
San Francisco Rent Board. “Annual Eviction Reports.” Accessed October 10, 2016. http://sfrb.org/annual-eviction-reports.
San José City Council. San José Municipal Code. Accessed November 2, 2016. https://www.municode.com/library/ca/san_jose/codes/code_of_ordinances.
Schwartz, Alex F. “The Low Income Housing Tax Credit.” In Housing Policy in the United States. 2nd ed. New York: Routeledge, 2010.
Shoup, Donald. The High Cost of Free Parking. Updated ed. Chicago: American Planning Association Planners Press, 2011.
———. “The High Cost of Minimum Parking Requirements.” In Parking: Issues and Policies. Edited by Stephen Ison and Corinne Mulley. Transport and Sustainability, vol. 5. Bingley, UK: Emerald Publishing Group, 2014.
Southern California Association of Governments. “Sustainable Communities Strategy.” 2012 Regional Transportation Plan. Los Angeles, 2012. Accessed September 21, 2016. http://rtpscs.scag.ca.gov/Documents/2012/draft/2012dRTP_04_SCS.pdf.
SPUR Housing Committee. A Housing Strategy for San Francisco. 2nd ed. San Francisco: SPUR, 2016. Accessed November 7, 2016. http://www.spur.org/publications/spur-report/2006-06-01/housing-strategy-san-francisco.
TransForm. “GreenTrip Connect beta.” Accessed September 21, 2016. http://connect.greentrip.org/map-tool.php.
———. “GreenTrip Connect – Glossary of Terms.” Accessed September 21, 2016. http://www.transformca.org/GreenTRIP/Connect/Glossary.
Tumlin, Jeffrey. “A Walk Down Market Street.” The Urbanist, July 1, 2011. Accessed September 21, 2016. http://www.spur.org/publications/urbanist-article/2011-07-01/walk-down-market-street.
United States Department of Housing and Urban Development. 2009-2013 Comprehensive Housing Affordable Strategy (CHAS) data for San Francisco. Accessed October 16, 2016. https://www.huduser.gov/portal/datasets/cp/CHAS/data_querytool_chas.html.
United States Environmental Protection Agency. Parking Spaces/Community Places: Finding the Balance through Smart Growth Solutions. EPA 231-K-06-001, Washington, DC, January 2006.
VanderHart, Dirk. “Parking Isn’t Going to Be Required at Portland Condos/Apartments Anymore.” Portland Mercury, November 23, 2016. Accessed November 23, 2016. http://www.portlandmercury.com/blogtown/2016/11/23/18709613/parking-isnt-going-to-be-required-at-portland-condosapartments-anymore.
Weinberger, Rachel, John Kaehny, and Matthew Rufo. U.S. Parking Strategies: An Overview of Management Strategies. New York: Institute for Transportation and Development Policy, 2010.
71
Park
ing
Sp
aces
to L
ivin
g S
pac
es
The White House. Housing Development Toolkit. September 2016. Accessed October 10, 2016. https://www.whitehouse.gov/sites/whitehouse.gov/files/images/Housing_Development_Toolkit%20f.2.pdf.
Wiggins, David, and Jay Primus. “San Francisco Transit Map” (map). 2014. Accessed September 21. 2016. http://sf.streetsblog.org/wp-content/uploads/sites/3/2014/10/New-Muni-Map.jpg.
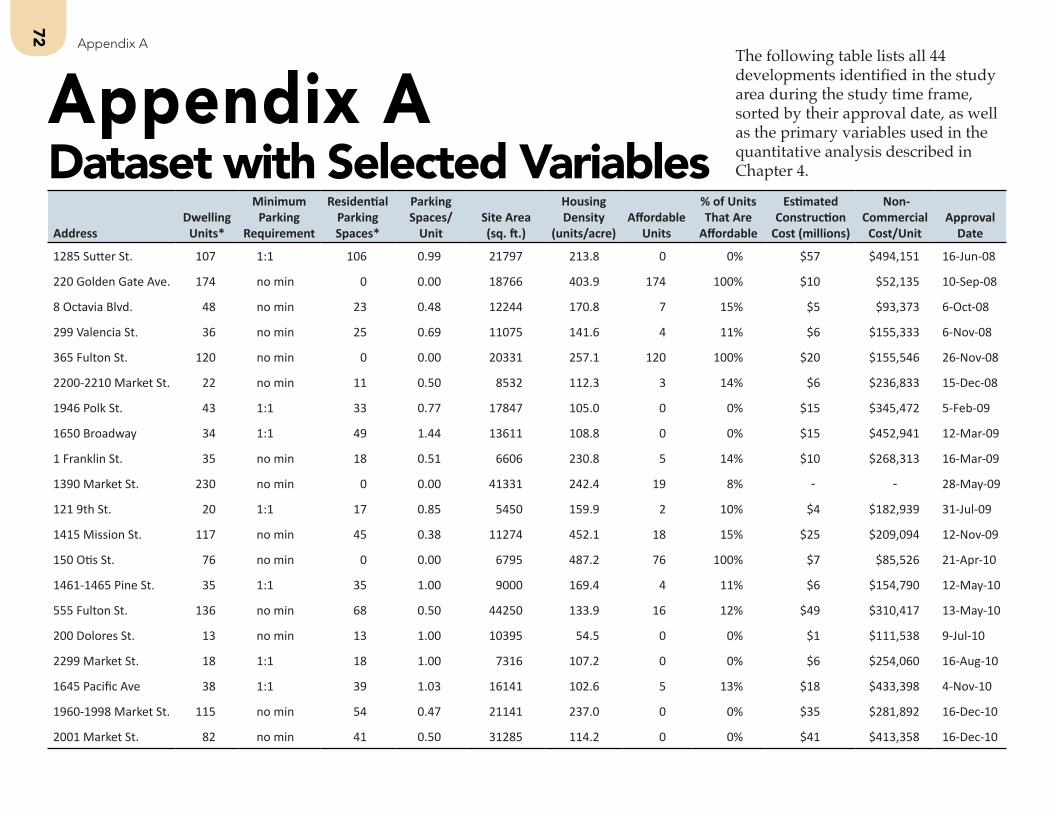
72
Appendix A
Appendix ADataset with Selected Variables
The following table lists all 44 developments identified in the study area during the study time frame, sorted by their approval date, as well as the primary variables used in the quantitative analysis described in Chapter 4.
AddressDwelling
Units*
MinimumParking
Requirement
Residential Parking Spaces*
Parking Spaces/
UnitSite Area(sq. ft.)
Housing Density
(units/acre)Affordable
Units
% of Units That Are
Affordable
EstimatedConstruction
Cost (millions)
Non-Commercial
Cost/Unit Approval
Date
1285 Sutter St. 107 1:1 106 0.99 21797 213.8 0 0% $57 $494,151 16-Jun-08
220 Golden Gate Ave. 174 no min 0 0.00 18766 403.9 174 100% $10 $52,135 10-Sep-08
8 Octavia Blvd. 48 no min 23 0.48 12244 170.8 7 15% $5 $93,373 6-Oct-08
299 Valencia St. 36 no min 25 0.69 11075 141.6 4 11% $6 $155,333 6-Nov-08
365 Fulton St. 120 no min 0 0.00 20331 257.1 120 100% $20 $155,546 26-Nov-08
2200-2210 Market St. 22 no min 11 0.50 8532 112.3 3 14% $6 $236,833 15-Dec-08
1946 Polk St. 43 1:1 33 0.77 17847 105.0 0 0% $15 $345,472 5-Feb-09
1650 Broadway 34 1:1 49 1.44 13611 108.8 0 0% $15 $452,941 12-Mar-09
1 Franklin St. 35 no min 18 0.51 6606 230.8 5 14% $10 $268,313 16-Mar-09
1390 Market St. 230 no min 0 0.00 41331 242.4 19 8% - - 28-May-09
121 9th St. 20 1:1 17 0.85 5450 159.9 2 10% $4 $182,939 31-Jul-09
1415 Mission St. 117 no min 45 0.38 11274 452.1 18 15% $25 $209,094 12-Nov-09
150 Otis St. 76 no min 0 0.00 6795 487.2 76 100% $7 $85,526 21-Apr-10
1461-1465 Pine St. 35 1:1 35 1.00 9000 169.4 4 11% $6 $154,790 12-May-10
555 Fulton St. 136 no min 68 0.50 44250 133.9 16 12% $49 $310,417 13-May-10
200 Dolores St. 13 no min 13 1.00 10395 54.5 0 0% $1 $111,538 9-Jul-10
2299 Market St. 18 1:1 18 1.00 7316 107.2 0 0% $6 $254,060 16-Aug-10
1645 Pacific Ave 38 1:1 39 1.03 16141 102.6 5 13% $18 $433,398 4-Nov-10
1960-1998 Market St. 115 no min 54 0.47 21141 237.0 0 0% $35 $281,892 16-Dec-10
2001 Market St. 82 no min 41 0.50 31285 114.2 0 0% $41 $413,358 16-Dec-10
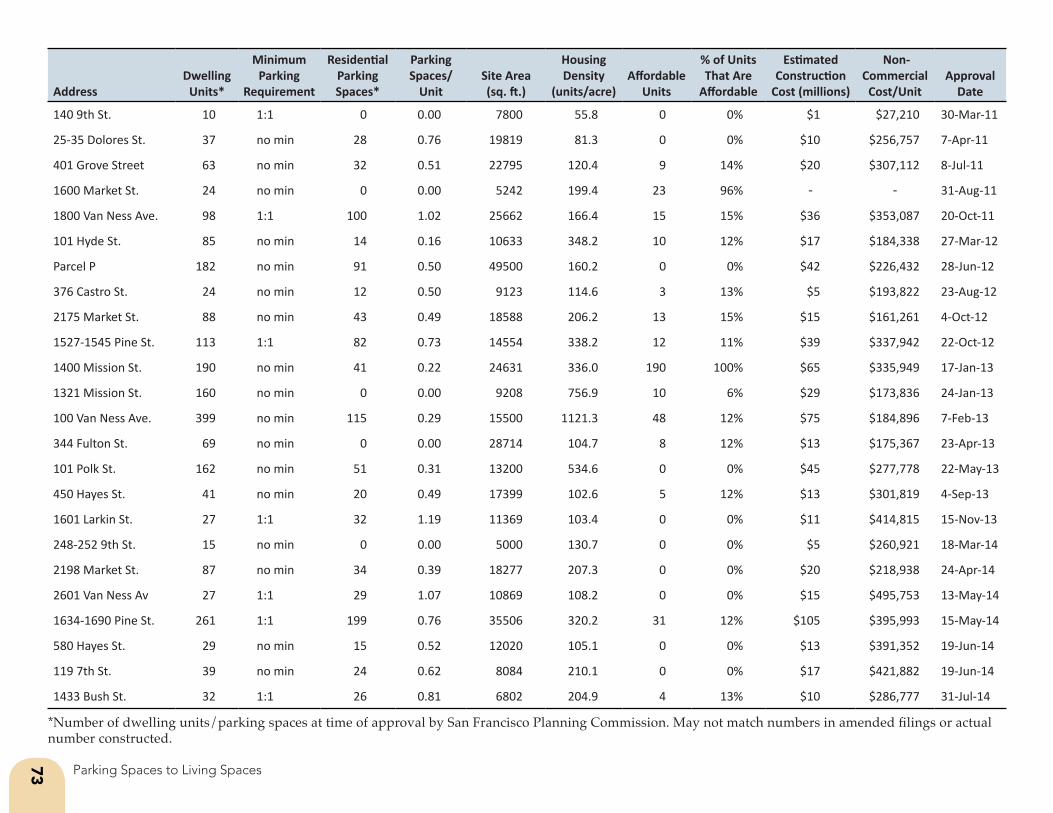
73 Parking Spaces to Living Spaces
AddressDwelling
Units*
MinimumParking
Requirement
Residential Parking Spaces*
Parking Spaces/
UnitSite Area(sq. ft.)
Housing Density
(units/acre)Affordable
Units
% of Units That Are
Affordable
EstimatedConstruction
Cost (millions)
Non-Commercial
Cost/Unit Approval
Date
140 9th St. 10 1:1 0 0.00 7800 55.8 0 0% $1 $27,210 30-Mar-11
25-35 Dolores St. 37 no min 28 0.76 19819 81.3 0 0% $10 $256,757 7-Apr-11
401 Grove Street 63 no min 32 0.51 22795 120.4 9 14% $20 $307,112 8-Jul-11
1600 Market St. 24 no min 0 0.00 5242 199.4 23 96% - - 31-Aug-11
1800 Van Ness Ave. 98 1:1 100 1.02 25662 166.4 15 15% $36 $353,087 20-Oct-11
101 Hyde St. 85 no min 14 0.16 10633 348.2 10 12% $17 $184,338 27-Mar-12
Parcel P 182 no min 91 0.50 49500 160.2 0 0% $42 $226,432 28-Jun-12
376 Castro St. 24 no min 12 0.50 9123 114.6 3 13% $5 $193,822 23-Aug-12
2175 Market St. 88 no min 43 0.49 18588 206.2 13 15% $15 $161,261 4-Oct-12
1527-1545 Pine St. 113 1:1 82 0.73 14554 338.2 12 11% $39 $337,942 22-Oct-12
1400 Mission St. 190 no min 41 0.22 24631 336.0 190 100% $65 $335,949 17-Jan-13
1321 Mission St. 160 no min 0 0.00 9208 756.9 10 6% $29 $173,836 24-Jan-13
100 Van Ness Ave. 399 no min 115 0.29 15500 1121.3 48 12% $75 $184,896 7-Feb-13
344 Fulton St. 69 no min 0 0.00 28714 104.7 8 12% $13 $175,367 23-Apr-13
101 Polk St. 162 no min 51 0.31 13200 534.6 0 0% $45 $277,778 22-May-13
450 Hayes St. 41 no min 20 0.49 17399 102.6 5 12% $13 $301,819 4-Sep-13
1601 Larkin St. 27 1:1 32 1.19 11369 103.4 0 0% $11 $414,815 15-Nov-13
248-252 9th St. 15 no min 0 0.00 5000 130.7 0 0% $5 $260,921 18-Mar-14
2198 Market St. 87 no min 34 0.39 18277 207.3 0 0% $20 $218,938 24-Apr-14
2601 Van Ness Av 27 1:1 29 1.07 10869 108.2 0 0% $15 $495,753 13-May-14
1634-1690 Pine St. 261 1:1 199 0.76 35506 320.2 31 12% $105 $395,993 15-May-14
580 Hayes St. 29 no min 15 0.52 12020 105.1 0 0% $13 $391,352 19-Jun-14
119 7th St. 39 no min 24 0.62 8084 210.1 0 0% $17 $421,882 19-Jun-14
1433 Bush St. 32 1:1 26 0.81 6802 204.9 4 13% $10 $286,777 31-Jul-14
*Number of dwelling units/parking spaces at time of approval by San Francisco Planning Commission. May not match numbers in amended filings or actual number constructed.
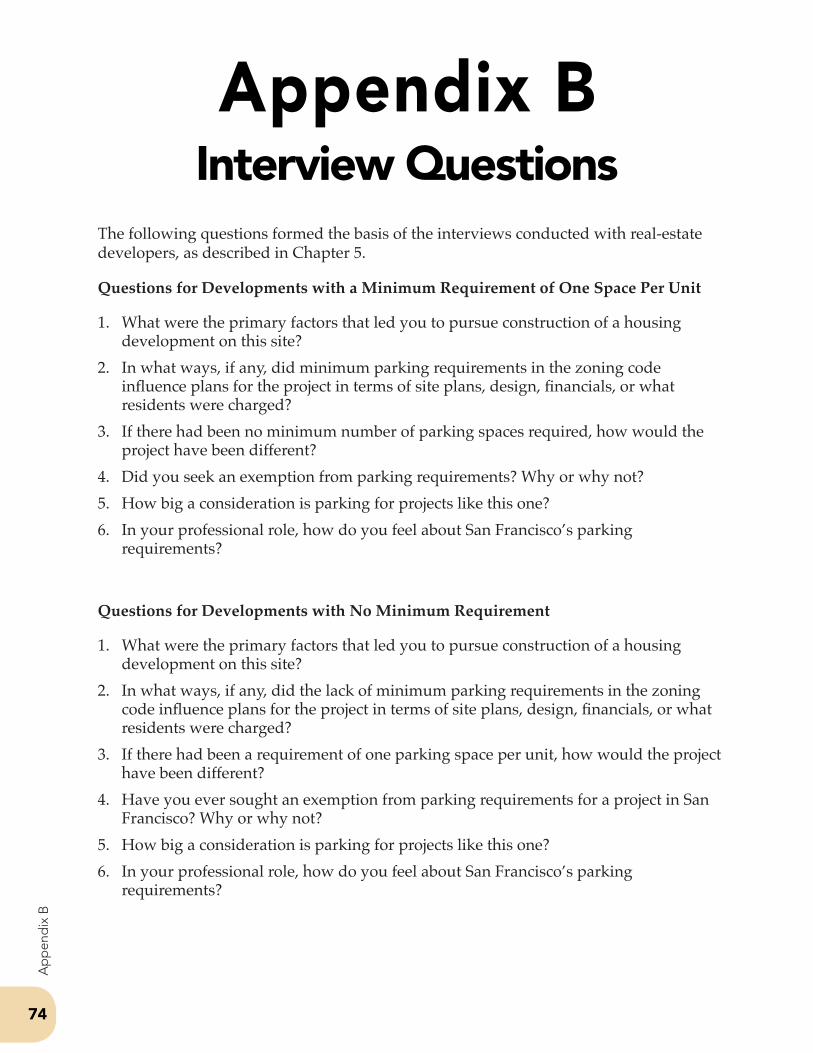
74
Ap
pen
dix
B
Appendix BInterview Questions
The following questions formed the basis of the interviews conducted with real-estate developers, as described in Chapter 5.
Questions for Developments with a Minimum Requirement of One Space Per Unit
1. What were the primary factors that led you to pursue construction of a housing development on this site?
2. In what ways, if any, did minimum parking requirements in the zoning code influence plans for the project in terms of site plans, design, financials, or what residents were charged?
3. If there had been no minimum number of parking spaces required, how would the project have been different?
4. Did you seek an exemption from parking requirements? Why or why not?5. How big a consideration is parking for projects like this one?6. In your professional role, how do you feel about San Francisco’s parking
requirements?
Questions for Developments with No Minimum Requirement
1. What were the primary factors that led you to pursue construction of a housing development on this site?
2. In what ways, if any, did the lack of minimum parking requirements in the zoning code influence plans for the project in terms of site plans, design, financials, or what residents were charged?
3. If there had been a requirement of one parking space per unit, how would the project have been different?
4. Have you ever sought an exemption from parking requirements for a project in San Francisco? Why or why not?
5. How big a consideration is parking for projects like this one?6. In your professional role, how do you feel about San Francisco’s parking
requirements?