Embed Size (px)
Citation preview
IDOCUMENT RESUME
ED 022 885 VT 004 813
ESTIMATING AGRICULTURAL EMPLOYMENT FROM A SAMPLE OF EMPLOYERS. TECHNICAL PAPER
SERIES-M-73.California State Dept. of Education, Sacramento. Research and Statistics Section.
Pub Date 2 Nov 64Note-16p.EDRS Price MF-$025 HC-$0.72Descriptors-*AGRICULTURAL LABORERS, EMPLOYERS, *EMPLOYMENT PATTERNS, EMPLOYMENT STATISTICS,
*OCCUPATIONAL SURVEYS, *SAMPLING, SEASONAL EMPLOYMENTIdentifiers-California, Fresno County
To explore the feasibility of sample selection to predict agricultural employment, astratified sample of 360 employers was drawn from the employers reportingemployment in the Disability Insurance Program for agricultural workers in FresnoCounty. Month-to-month changes were examined for seven industry strata, andestimates were made by the link-relative method. Employment estimates werecompared with the reported universe employment for the corresponding month todetermine the accuracy of the sample as a means of estimating. Data indicated thatthe method may be feasible, but that the sample must be designed to includeemployers whose seasonal labor needs occur at different periods of the year. (JM)
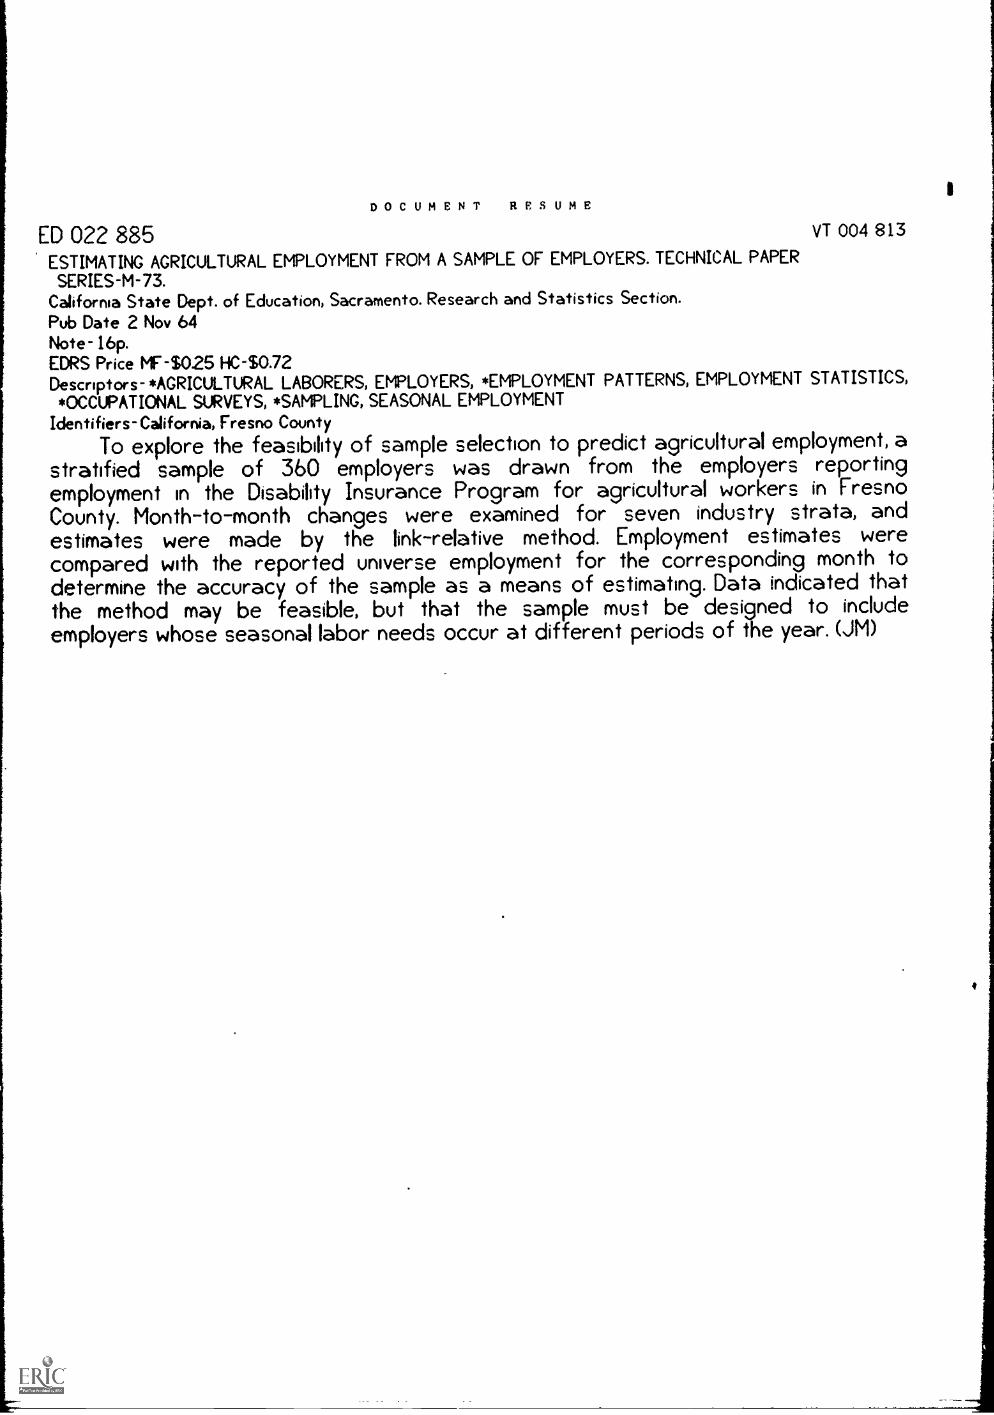
U.S. DEPARTMENT OF HEALTH, EDUCATION & WELFARE
OFFICE OF EDUCATION
State of California THIS DOCUMENT HAS BEEN REPRODUCED EXACTLY AS RECEIVED FROM THE Teohnioal PaperDepartment of EmploymeniPERSON OR ORGANIZATION ORIGINATING IT. POINTS OF VIEW OR OPINIONSSeriee M 7 3Researoh and Statistics STATED DO NOT NECESSARILY REPRESENT OFFICIAL OFFICE OF EDUCATION November 2, 1964
POSITION OR POLICY.
Estimating Agricultural Ehployment from a Sample of Ehployers
Current estimates of agricultural employment in California are based on FhrmLabor Representatives' estimates of the amount of labor needed in activitiescurrently in progress. Estimates of current employment in non-agricultural
vilindustries are based on responses from a sample of employers. Thus, the twoco kinds of estimates are not strictly comparable, and the agricultural estimates
may be subject to errors which do not affect the non-agricultural estimates.4.74! Another, and a particularly troublesome problem, is the likelihood of over-
estimating employment in certain agriculture-related industries, by countingr\J workers 45 belonging to both the agricultural and non-agricultural segments.(:) Attempts have been made in other states, e.g., Wisconsin, Oregon, Washington,
.4.4)to estimate agricultural employment through an establishment reporting system.
4, California is uniquely fortunate in having as a source of information theemployment and payroll figures submitted by agricultural employers for theadministration of the disability insurance program for agricultural workers. Thisinformation is not only useful for providing a frame from which to select asample, but it can also serve to check the reliability of the sample after ithad been selected.
o0
.1
This paper will describe the method by which a sample of agricultural employerswas selected, and the means used to validate the sample by comparison with knownuniverse values. The purpose of the study was to explore the feasibility ofsample selection and the accuracy with which a sample of a given size couldpredict employment over a period of months, and particularly for differentseasons of the year. Not considered were the technical and administrative problemsinvolved in initiating an establishment reports system in the field, of whichprobably the chief is obtaining the cooperation of employers in submitting accurateand timely reports. Also excluded from consideration was the validity of the datasubmitted by agricultural employers on Disability Insurance contribution returns.Fbr the purpose of this report, it is assumed that they are the most accuratesource of employment information, and that they are comparable to non-agriculturalcontribution returns.
I. SELECTION OF SAKPLE
A. Criteria for SelectionThe sample of employers selected was drawn from a frame consisting of employerswho reported employment covered by the Disability Insurance program foragricultural workers in Ftesno County during the third quarter of 1962. FresnoCounty was selected primarily because it is the looation of the Ftesno PhrmLabor Ptoject. It was expected that the additional facilities provided by theproject would assist in the implementation of field testing of establishmentreporting, once a Suitable sample was developed. In addition, Fresno County isthe most important agricultural county in California, and accounts for about12 percent of the total agricultural employment in the State, so that develop-
co ment of an adequate sample for Ftesno County would contribute materially toTml development of a sample for the State as a whole. September 1962, was chosen00 as a benohmark period because September is the month of maximum agricultural
CD
40
-2-
employment in Fresno County, and the selection of 1962 as a benchmark year
would allow a sufficient time following the period of selectian for universe
information to be available for validation of a complete year's data.
Initially, a sample design was tried in which the sample was stratified by
industry and size of firm in September 1962. However, when an attempt was
made to validate this sample it became apparent that a biaswas introduced
because employers whose highest employment was in months other than September
were underrepresented. As a result, employment for these months was seriously
underestimated.
The sample design as finally adopted was based on the following considerations:
(1) The sample was stratified by industry group, and within' the industry
Fruit and Tree Nut Farms, (emeal citrus), by crop.
(2) All employers with over 100 employees at any time duriag the September,
1962 through September, 1963 period were included.
(3) Otherwise, allocation to,the strata was based on seasonal variability.
(4) The sample consisted of about 360 employers.
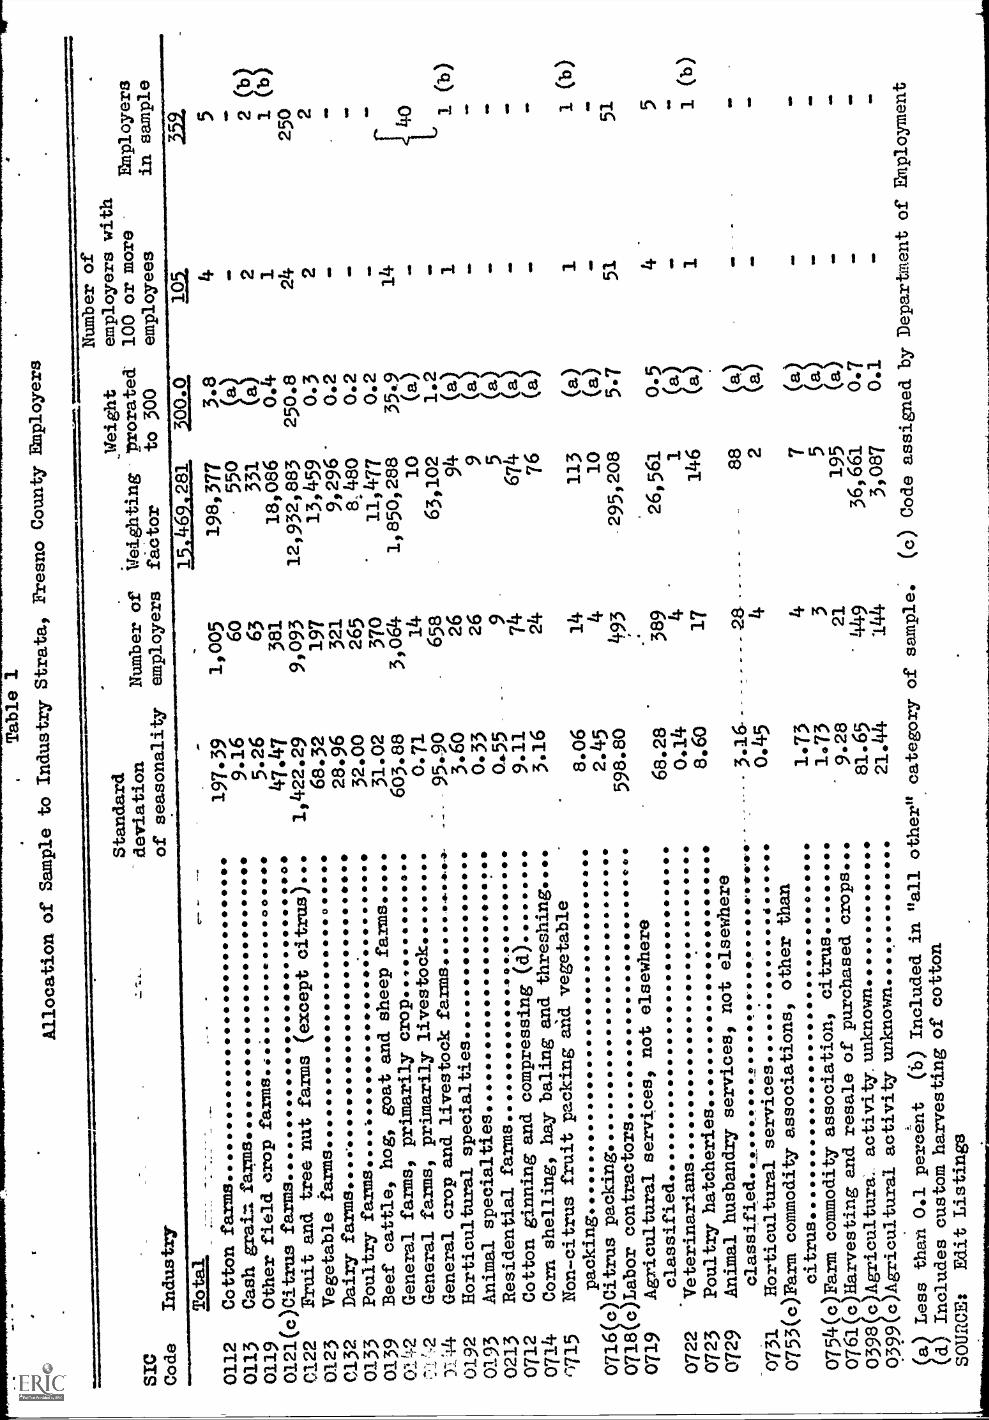
B. MethodoloaThe standard deviation of seasonal variability of employment was'calculated for
each four.:digit Standard Industrial Classification group in agrimlture in
Fresno County by using the employment totals by month as cumulated on group
prints of employer tax returns. In figuring the standard deviation, employment
for each Month was treated as one item in the frequency distribution. The
standard deviations in each stratum were weighted by the number'pf employers,
and the weights were pro-rated to 300 to give an approximation of the number of
cases needed in each stratum for a total sample of 300. Because of the,
necessity for augmenting the allocatian to the Fruit and.Tree Nut Atrms
:(astat citrus),stratuwthefinal'sample'consisted of 359 employers.
Control cards are maintained routinely in the Research and Statistics Section
showing mOnth-to-month changes in employment for all agricultural employers
who have had 100 or more employees at any time since the inceptiron of Pisability
Insurance agricultural coverage.These cards were used as an additional source
of.information, and any employer operating in Fresno County who had 100 or more
workers at any time between October, 1962 and September, 1963, was included in
the sample. The final sample allocation and determination of the strata,
therefore, was based on a combination of weighting by seasonal variability and
inclusion of all large employers. As finally selected, the sample included
359 employers, grouped into seven industry strata, of which one was an "all
. other" category including six employers in unrelated industries. There were
108 employers with 100 or more employees. Employers in four industry groups:
Fruit and Tree Nut Farms (except-1 citrus); General Farms; Cottaq, Farms; le:
ricultural Services, N.E.C., with a maximum of 50 to 99 employees were also
addod to the sample. When the number of employers in a size group exceeded
the number required for the sample, anunbiassedsubsample was taken by selecting
every all employer in the group. For one inaUstry group, Fruit and Nut 21as,
(emItat citrus) it was necessary to incLeee all employers with over 50 employees
and anunbiassed sample of employers with 40 to 49 employees. The methods of
weighting the strata, and the final allocation are shown in Table 1.
II. USING TIE SAMPLE TO ESTIMATE LIPLOYMENT
After the sample employers were selected, their reported employment for the
period from September 1962 through September 1963 was determined by reference
to the control cards and employer contribution returns. If a change of legal
entity occurred during the year, the reports of the successor employer were
used for the remainder of the year. Estimates of employment for the October
1962 - September 1963 period were made by the link-relative method, using
the September 1962 universe as a benchmark. The derivation of these estimates
appears in Table 2. Table 2a shows similar estimates for October 1963 through
March 1964 using September 1963 as a benchmaiik.
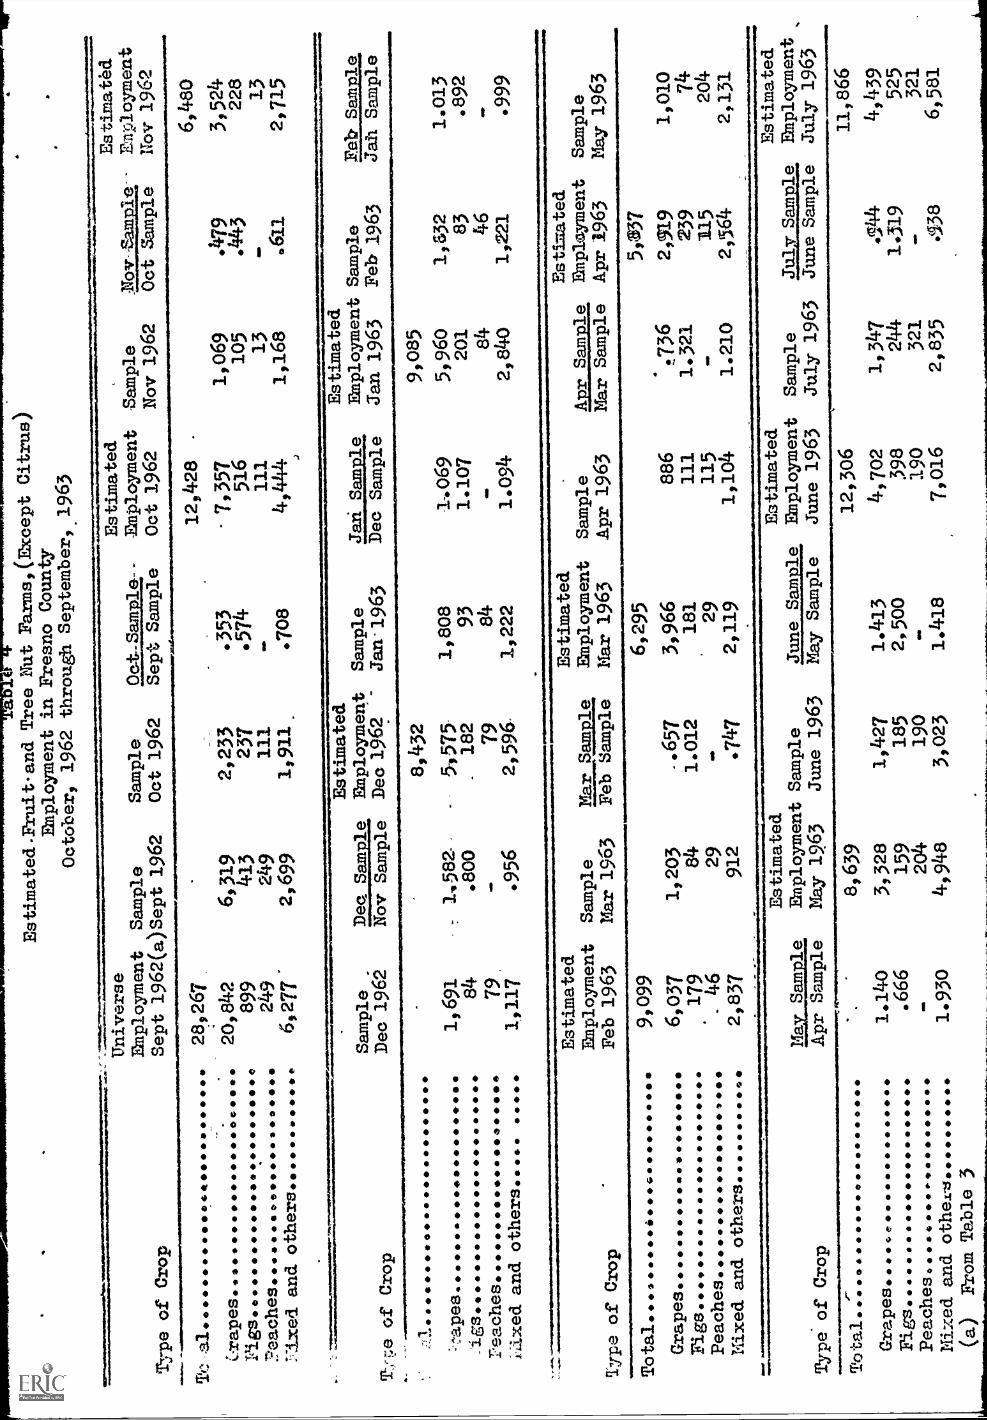
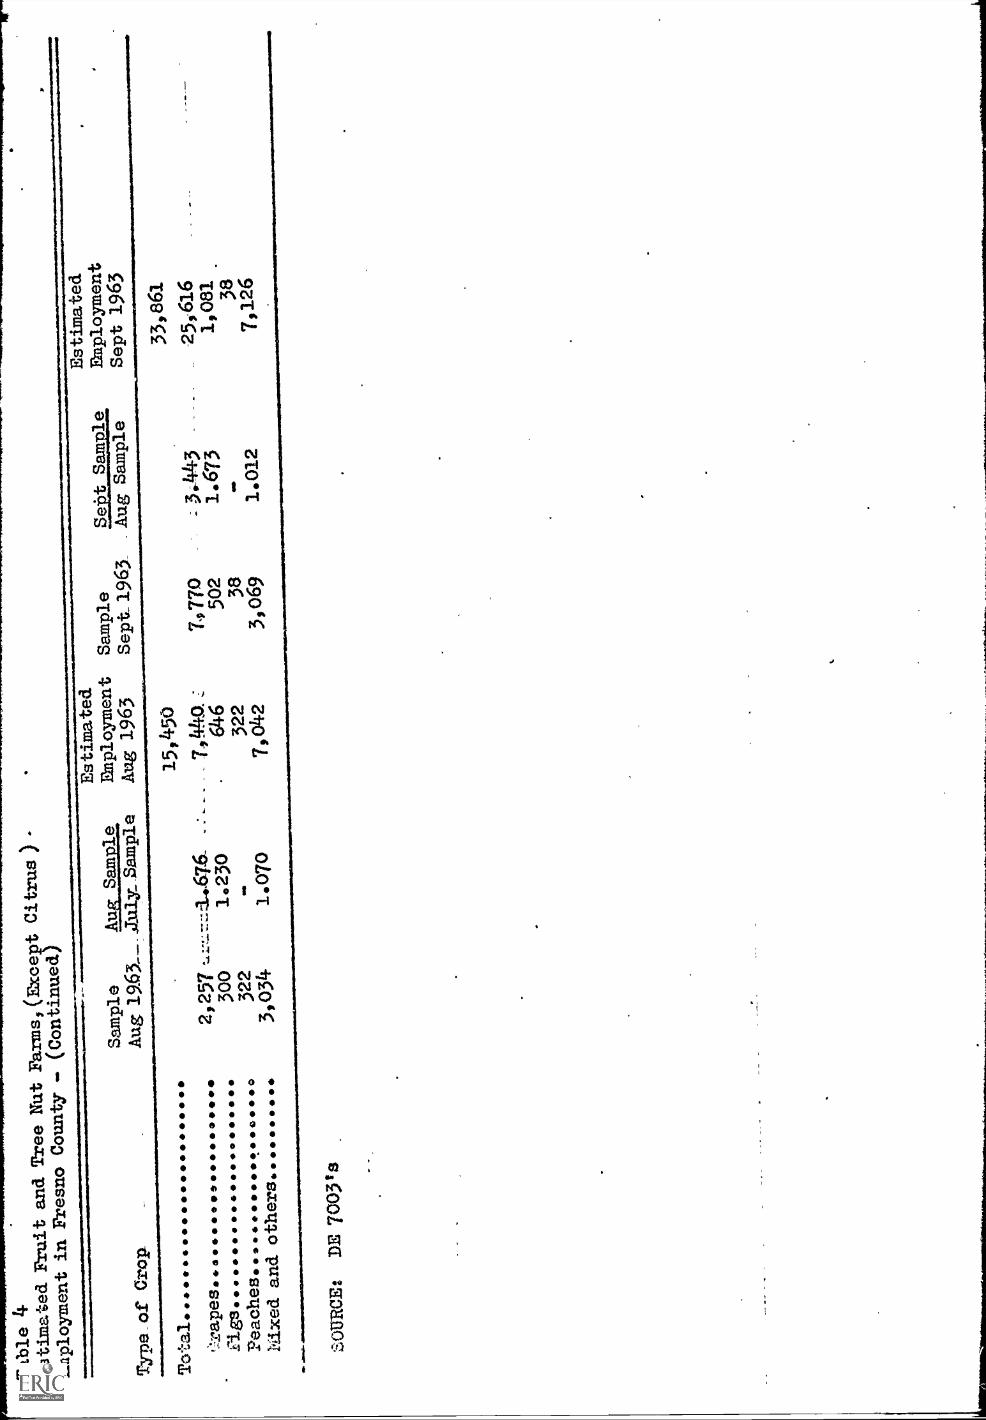
The largest industry group, Fruit and Tree Nut Farms, (sant citrus), presented
problems in estimating because of the large number of employers, relatively
small average employment and high seasonal variation. It was necessary to
divide this group into four categories of employers by type of crop: grapes,
figs, peaches, and other fruit and tree nuts. The classification wasbased on
the employer's statement on his registration form. The distribution of universe
employment among these four cat6gories in September 1962 was estimated by
drawing an additional sample of the employers on the basis of size categories,
as shown on Table 3. The sample results were then expanded to the September
1962 universe. Using this September 1962 universe, estimates 01 employment
were made by the link-relative method for each of these four groups for the
October 1962 through September 1963 period, as shown on Table 49 and the sum of
these estimates was used as the estimate fox the Preit and Tree Nut Farms, (g.xceDt
citrus)-category. Similarly the sample wa; expanded to the September, 1963,
universe, and this universe, shown on Table 3a, was used as a benchmark for
estimates of employment for the October, 1963 through March, 1944 perio0,
These estimates are shown on Table 4a.
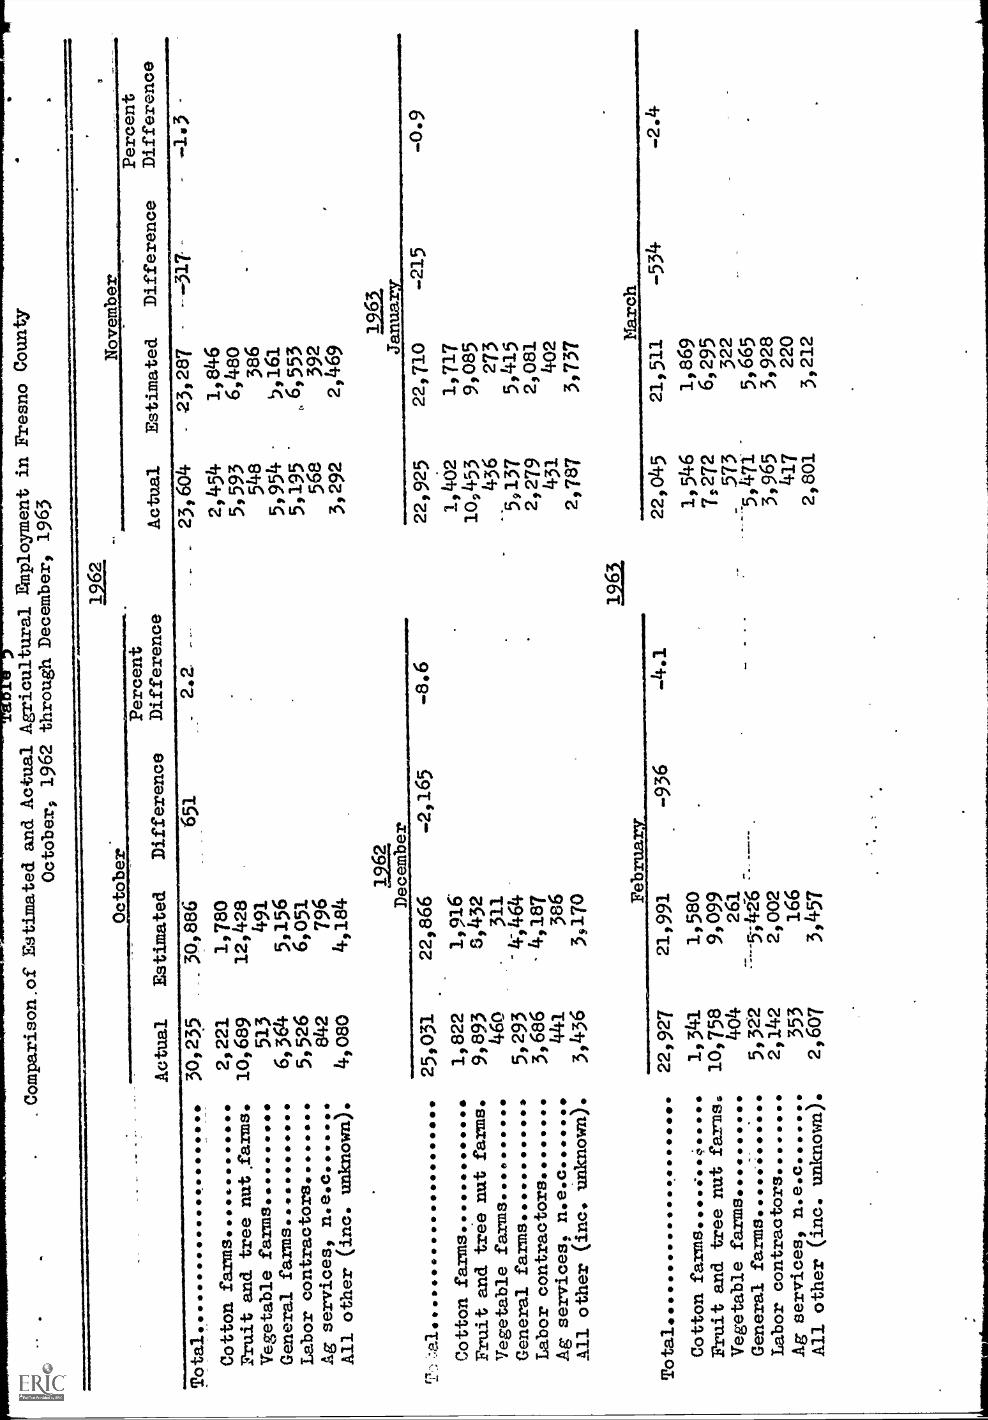
III. VALIDATION OF THE SAMPLE
The employment estimates made by the link-relative method were compared veeth
the reported universe employment for the corresponding month, te determine
the accuracy of the sample as a means of estimating. As shown in Table 5,
errors of estimate ranged from +16.2 to -11.2 percent, or in absolute terms
from +3,752 to .6,775. For ten of the eighteen months, the sample estimates
were less than five percent in error.
IV. CONCLUSIONS
The data cited above and appearing in Tables 2, 2a, 4, 4a, and 5 indicate 6hat
drawing a sample of employers from Disability Insurance records may be feasible.
However, the sample must be designed to include employers whose seasonal labor
needs occur at different periods of the year, and therefore employment records
for a given month cannot be used as a frame. The data also indipate that the
sample drawn wae not euffioiee,i4r larco to provide the required degree of
precision. In this connection it should be noted that the degree of precision
added with the addition of each employer over the 359 finally selected would
tend to diminish, because the excluded employers are those with a smaller number
of employees than those included in the sample.
The method of verifying sample design by reference to accessible universe data
proved a very helpful device in evaluation of the accuracy of the sample. In
fact, it probably resulted in rejection of an insufficiently prease sample
which without this validation would likely have been accepted. This study may
prove helpful in evaluating de accuracy of estimates of agrio4tural workers
based on samples for which no universe figures are available. Perhaps the
methodology used for this study will also suggest applications far sample design
outside of agricultural labor force estimating, where estimates6ust be made in
advance of universe figures which are not accessible immediately but which become
available at a less timely date.
,Table 1
Allocation of Sample to Industry
Strata, Fresno Caunty
Employers
SIC
Code
--a--
Indus tx7
Total
.:.
==r-
Number of
Standard
Weight
employers with
deviation
Number of
of seasonality
employers
iieighting
factor
prorated 100 or more
Employers
to 300
employees
in sample
C".
"
0112
Cotton farms.. 000000000000 ,..,..,,..,...,.,...
0113
Cash gratm farms....
,
0119
Other field crop farms
-'
0....
0121(c)Citrus farms. 000000 ........... 000000 .....0.
0122
Fruit and tree nut farms
(except citrus)...
0123
Vegetable farms.... 000 0000 .. 00000...., 00000
0132
Dairy farms. o o 0-. o ..........................
0133
Poultry farms
.
0139
Beef cattle, hog, goatand sheep farms.....
014-2
General farms, primarily crop
%2
General farms, primarilylivestock
)1114
General crop and livestock
farms
.......,.
0192
Horticultural specialties
0193
Animal specialties. ......... 00000 ........,
0213
Residential farms ..................... 000000
0712
Cotton ginning and compressing
(d)
0714
Corn shelling, hay balingand threshing
(-)715
Non-citrus fruit packingarid vegetable
packing
.
0716(c)Citrus packing
0718(c)Labor contractors o
197.39
9.16
5.26
47.47
1,422.29
68.32
28.96
32.00
31.02
603.88
0.71
_ 95.90
3.60
0.33
0,55
9.11
3,16
8.06
2.45
598.80
0719
Agricultural services,
not elsewhere
classified
68.28
0722
Veterinarians
0.14
0723
Poultry hatcheries. 0000 00000000.,.........,
8.60
0729
Animal husbandry services,
not elsewhere
classified
lar
- 3.
16-
0731
Horticultural services
0.45
0753(c)Farm commodity associations,
other than
citrus
1.73
0754(c)Farm commodity association,
citrus o 0000
1,73
0761 c)Harvesting and. resale
of purchased crops
9.28
0398 c)Agricultura, activity,unknown
81.65
0399 c)Agricultural activityunknown
.
-
21.44
Less than 0.1 percent
(b) Included in "all
other"
d Includes custom harvestingof cotton
SOURCE:
Edit Listings
category of
2,15
.062
,2a.
300.0
1,005
198,377
3.8
aE3
6o
-
550
63
331
381
18,086
9,093
12,932,883
197
13,459
321
9,296-
265
8,480
370
11,477
3,064
1,850,288
14
10
658
63,102
26
9426
99
574
674
24
76
14 4
4,93
389 4
'
17
-213
11310
-295,208
26,5
611
146
88
0.4
250.8
0.3
0.2
0.2
0.2
350
(a)
1.2
(a)
(a)
(aS
(a)
(a)
5-7
0.5
MIN
IMI1
10.1
.11
2 1 24 2 1 51 4 1
3.52
. 5
250 2 W
O
1111
.
ear
Oa
4 4 321
449
144
2 7 5195
36,661
3,087
0.7
0.1
4111
110
1111
11P
4111
10
1111
11P
OM
.
OW
sample.
(c) Code assigned by Department
of Employment
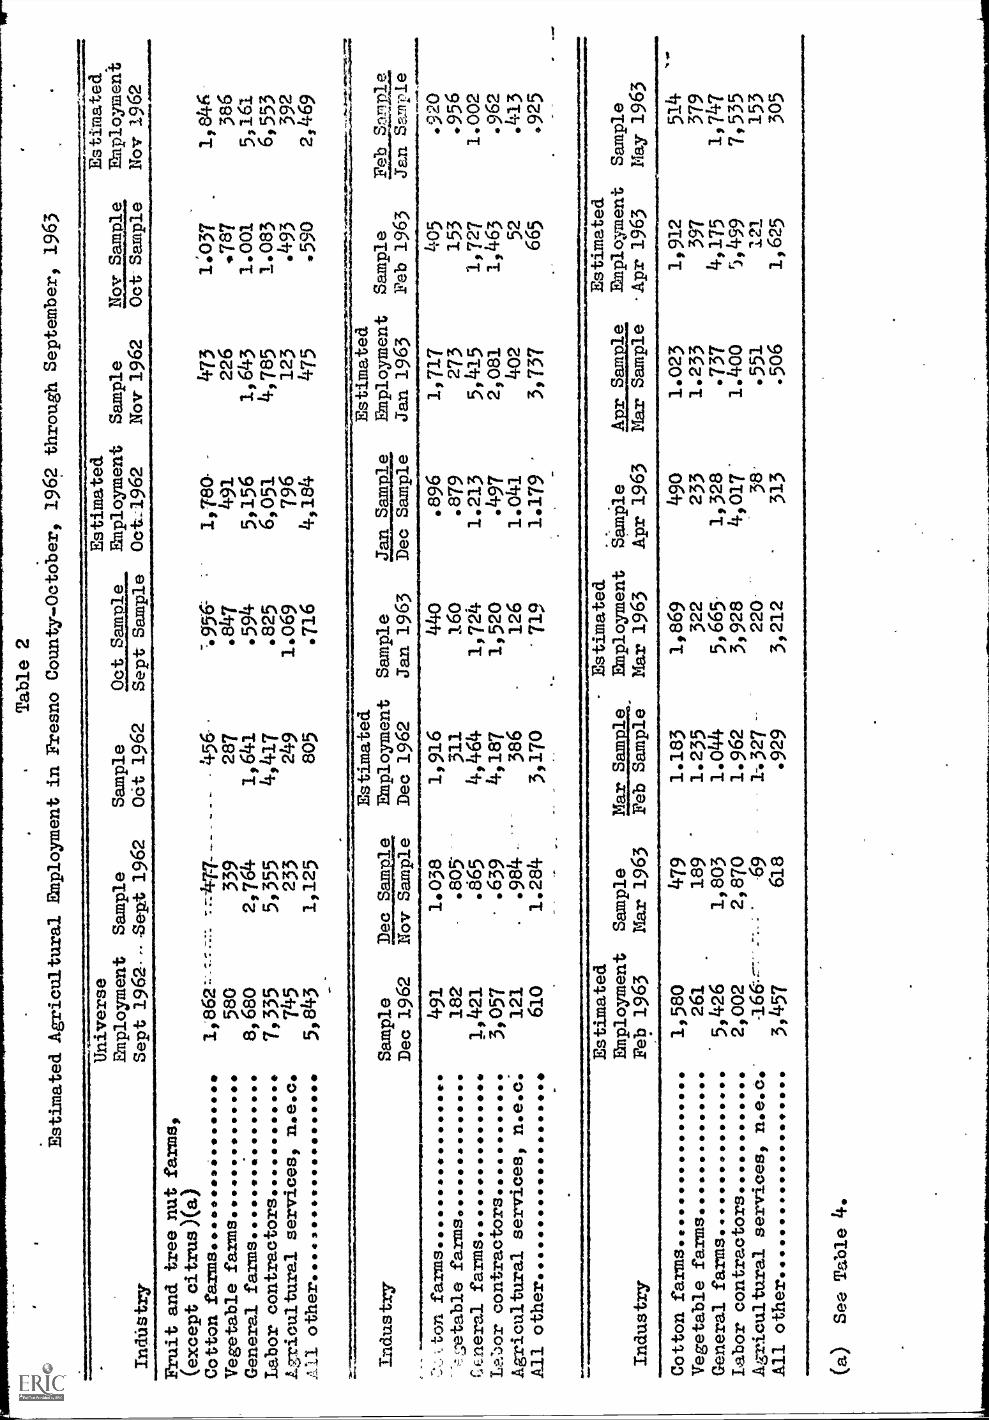
Table 2
Estimated Agricultural Employment in Fresno County-October,
1962 through September, 1963
IndUstry
Universe
Employment
Sample
Sample
Sept 1962 .Segt 1962
OCt 1962
Oct Sample
Estimated
Employment
Oci_1962
Sample
Nov 1962
Nov Sample
Estimated.
Etployment
Nov 1962
Sept Sample
Oct Sample
Fruit and tree nut farms,
(except citrus)(a)
.0.1
.1...
Cotton farms...dim...m...4p
1,862
":147-7.-------
-456--
1,780-
473
1,037
1,846
Vegetable farms
580
339
287
.847
491
226
.787
386
General farms
8,680
2,764
1,641
.594
5,156
1,643
1.001
5,161
Labor contractors
7,335
5,355
4,417
.825
6,051
4,785
1.083
6,553
Lzricultural services, n.e.c.
745
233
249
1.069
796
123
.493
392
All other ***** *******
5,843
1,125
805
.716
4,184
475
.590
2,469
Industry
Sample
pee ftgle
Dec 1962
Nov Sample
ton farms
etable farms
Ccneral farms***** ***
La:Jor contractors
Agricultural services, n.e.c
All other.
*****
491
182
1,421
3,057
121
610
1.038
.805'
.865
.639
..984-
1.284
_
Estimated
Employment
Dec 1962
1,916
311
4,464
4,187
386
3,170
Sample
Jan sqmat
Jan 1963
Dec Sample
/140
.896
160
.879
1,724
1.213
1,520
.497
126
1.041
719
1.179
Estimated
Employment
Jan 1963
Sample
Feb 1963
Feb Sault
Jan Sample ....1
11...
1011
1,717
405
.920
273
153
.956
5,415
1,727
1.002
2,081
1,463
.962
402
52
.413
3,737
665
.925
..41
0.1.
0.1.
....1
.101
01.6
Industry
Estimated
Employment
Feb 1963
Cotton farmswee ********** lb
1,580
Vegetable farms
261
General farms
5,426
Labor contractors
22002
Agricultural services, n.e.c
-166-,--
All other
3,457
Sample
Mar 1963
Mar Saulail.
Estimated
Employment
Mar 1963
Feb Sample
479
1.183
1,869
189
1.235
322
1,803
1.044
5,665,
2,870
1.962
3,928
69
1:327-
220
618
.929
3,212
Estimated
Sample
ARE_Aliale
Etployment
Sample
Apr 1963
Mar Sample
-Apr 1963
May 1963
490
233
1,328
4,01
7'38-
313
1.023
1:912
514
1.233
397
379
.737
4,175
1,747
1.400
5,499
7,535
.551
121
153
.506
1,625
305
(a)
See Table 4.
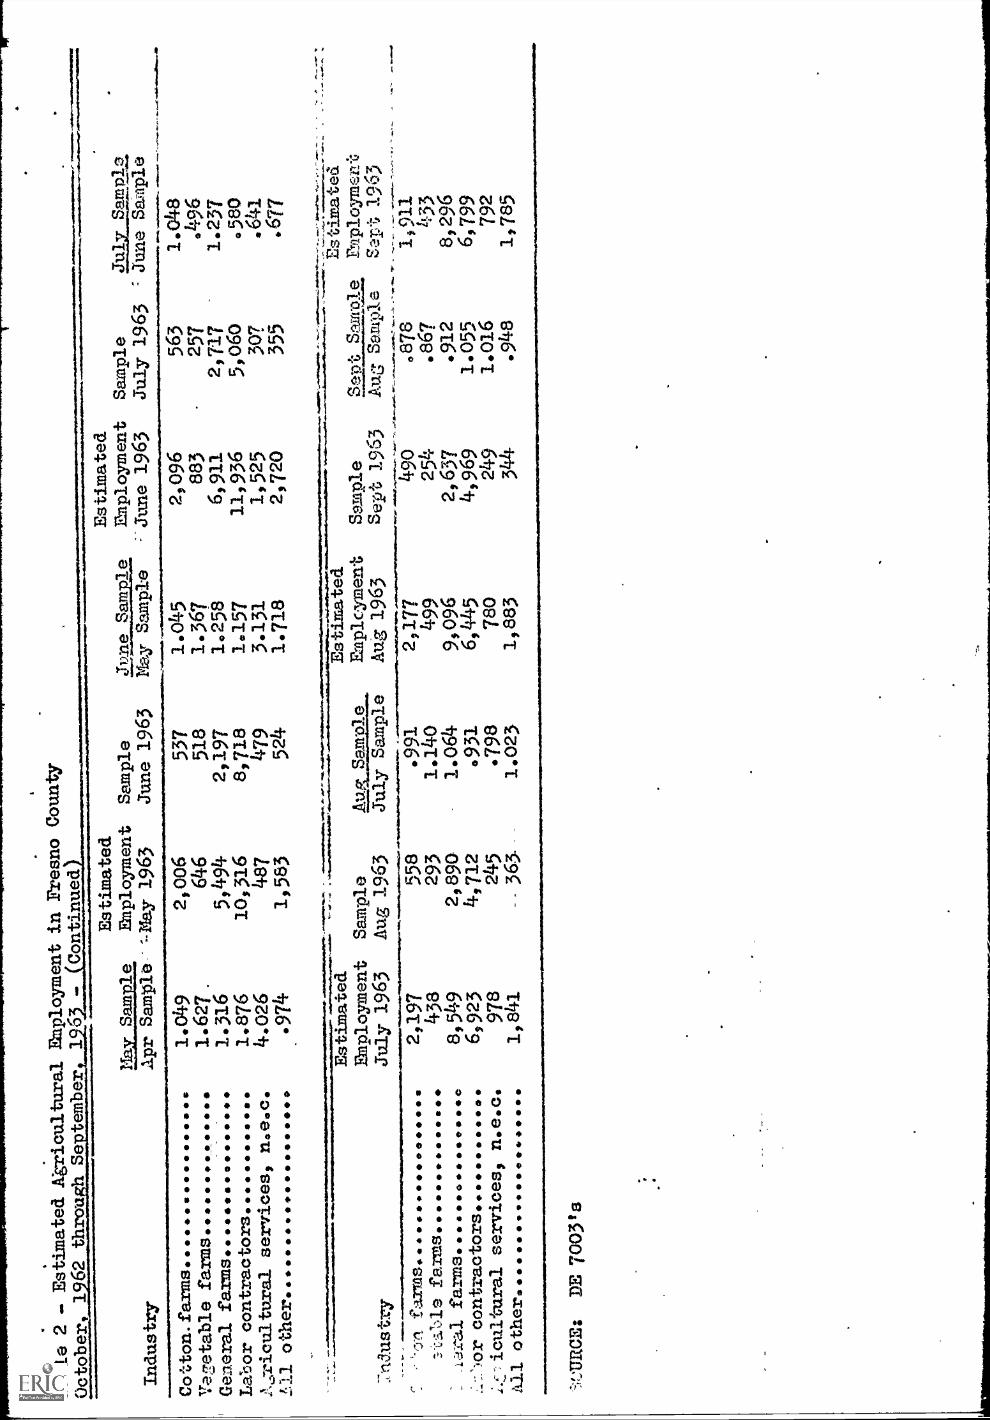
Table 2 - Estimated Agricultural
Employment in Fresno County
Industry
Cotton.farms
Va7etab1e farms
***** . OO
General farms..
Labor contractors
services, n.e.c
la/ other
aySan
_l_n_
Apr Sample
1.049
1.627.
1.316
1.876
4.026
.974
Estimated
Employment
--May 1963
2,006
646
5,494
10,316
487
1,583
7nau
stry farms *****
*****
sc3.12,1s farms
1-Jra1 farms........ ******* 0
'sor contractors... ...... .0.
icultural services, n.e.c.
All other ************ ........
...M
.IIRCE:
DE 7003's
Sample
June 1963
537
518
2,197
8,718
479
524
Estimated
Dmployment
June 1963
Sample
July 1963
m pj.
June Sample
liz7 Sample
1.045
2,096
563
1.04
81.367
883
257
.496
1.258
6,91/
2,717
1.237
1.157
11,936
5,060
.580
3.131
1,525
307
.641
1.718
2,720
355
.677
Estimated
EMployment
July 1963
Sample
Aug 1963
AUP SamDle
Sample
Sept 1963
Sept Sa..sfiAle
EstImated
Fraployment
Sept 1963
Emplcyment
Aug 1963
July Sample
AuG Sample
2,197
558
a -.
.....1
11,-
.a-.
...11
-.9
912,177
490
.878
1,911
438
293
1.140
499
254
.867
433
8,549
2,890
1.064
9,096
2,637
.912
8,296
6,923
4,712
6931
6,445
4,969
1.055
6,799
978
245
.798
780
249
1.016
792
1,841
363-
1.023
1,883
344
.948
1,785
ME
Na
mri
mea
!
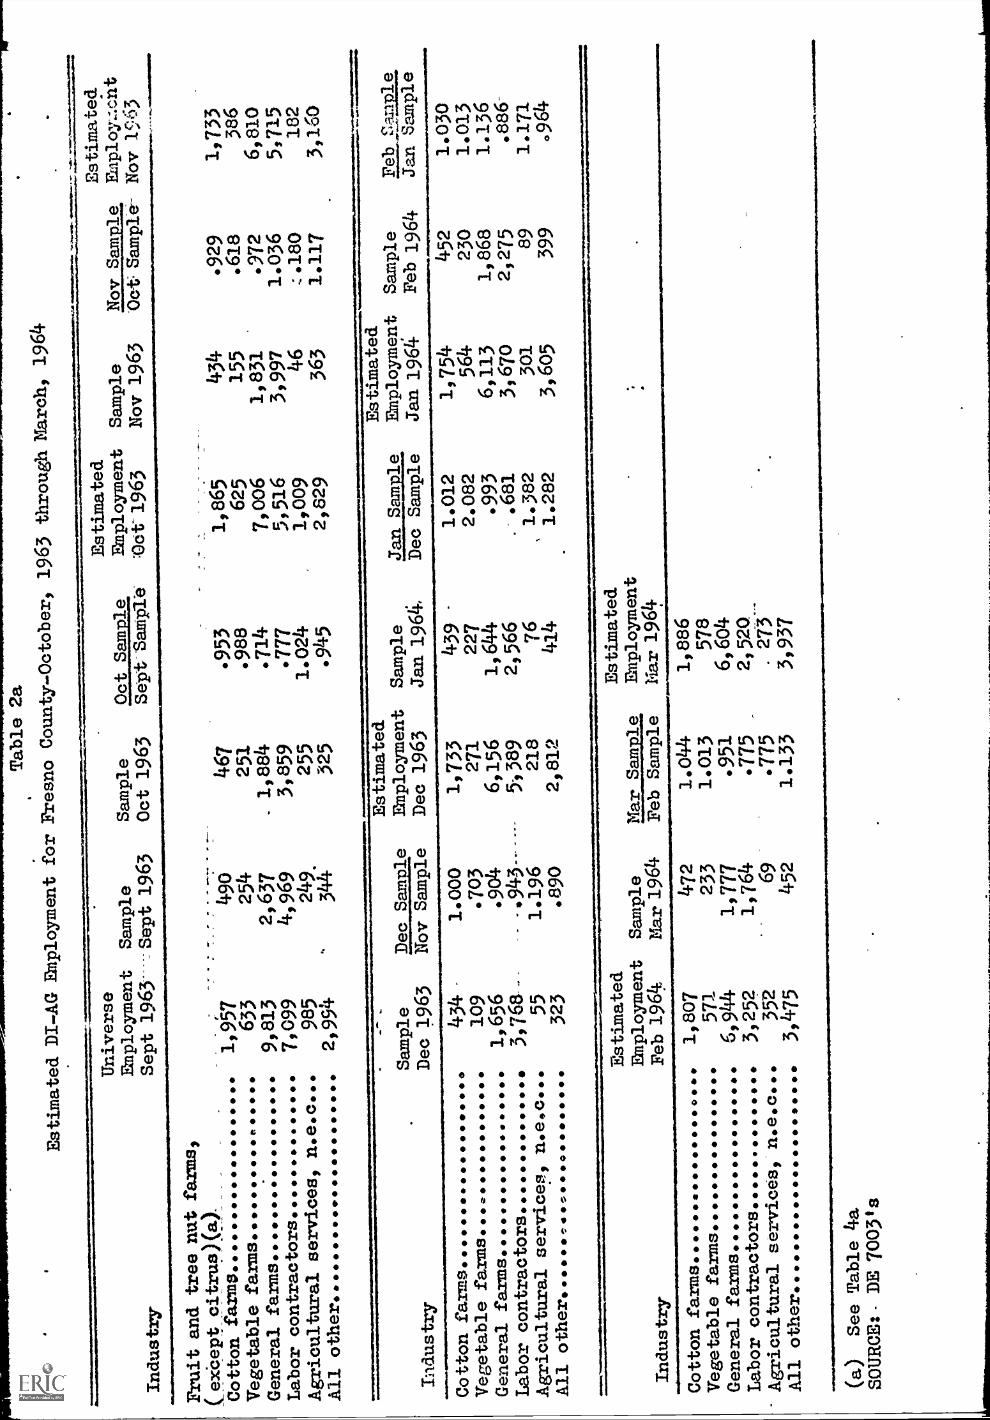
Table 2a
Estimated DI-AG Employment
for Fresno County-October,
1963 through March,
1964
Industry
Universe
Enployment
Sept 1963
Fruit and tree nut farms,
(exCept citrus)(a)
.._
,
Cotton farms
1,957
Vegetable farms Of OOOOO me
633
General farms
9,813
Labor contractors
7:099
Agricultural services, n.e.c
985
All other. OOOOO .000.041100.00 OOOOO
21994
.....
Ale
.11.
1....
.011
.,....
0.0.
11.4
.0.4
1
Estimated
Estimateg.
Sample
Sample
(221.k..ap2e
EMployment
Sample
Nov Sample
Employ...-4nt
_Sept 1963
Oct 1963
Sept -Samp-re
:0ct-1963
Nov 1963
Oct'Sample- Nov 1963
: _ ...._
496
254
2,637
4,969
249.
344
Industry
Sample
Dec Sample
Dec 1963
Nbv Sample
Cotton farms OOOOOOOOOO
Vegetable farms...
General farms
Labor contractors... 0000.00000410
Agricultural serviceo,
All other.
OOOOO
434
109
1,656
3,768
55
323
1.000
.703
.904
-.943-
1.196
.890
467
251
.1,884
3,859
255
325
.953
.988
.714
.777
1.024
.945
P.1
1711
MM
IIIIN
IMM
INIM
NI.1
1111
001M
NIO
W
Estimated
Employment
Dec 1963
Sample
Jan 1964,
1,733
439
-
271
227
6,156
1,644
54389
2,566
218
76
2,812
414
1111
0110
00,7
MIN
IMIO
.IMIN
IMIN
MP
IIIIII
IINV
IMIII
IIMIO
WN
IVO
I.S
r...
.IIm
elln
.q..P
MO
MM
IMN
P.=
.MM
IOM
ll..f
.1...
..IM
IIIN
INW
MII1
11.1
110.
Ii
Industry
Estimated
Employment
Feb 19%
Sample
Mar 1964
Feb Sample
Cotton farms 0000 OOOOOOOOOO 00.00
1,807
472
1.044
Vegetable farms
571
233
1.013
General farms
6,944
1:777
.951
Labor contractors ollimodloomet.
3,252
1,764
.775
Agricultural services, n.e.c
352
69
.775
All other
3:475
452
1.133
amift
s11/
1111
.111
1.11
11.1
11A
ben
(a)
See Table 4a
SOURCE:- DE 7003Is
1,865
625
7,006
5,516
1,009
2,829
434
155
1,831
3999746
363
.929
.618
.972
1.036
z.180
1.117
1:733
386
6,810
5:715
182
3,160 *f
...ra
ms.
1.1m
1011
1.1.
1101
.
Jan Sample.
Estimated
Employment
Jan 1964
Sample
Feb 1964
Feb fjpple
Dec Sample
Jan Sample
1.012
1,754
452
1.030
2.082
564
230
1.013
.993
6,113
1,868
1.136
..681
3,670
2,275
.886-
1.382
301
89
1.171
1.282
3,605
399
.964
Estimated
Enployment
Mar 1964
1,886
578
6,604
2,520
.273'
39937
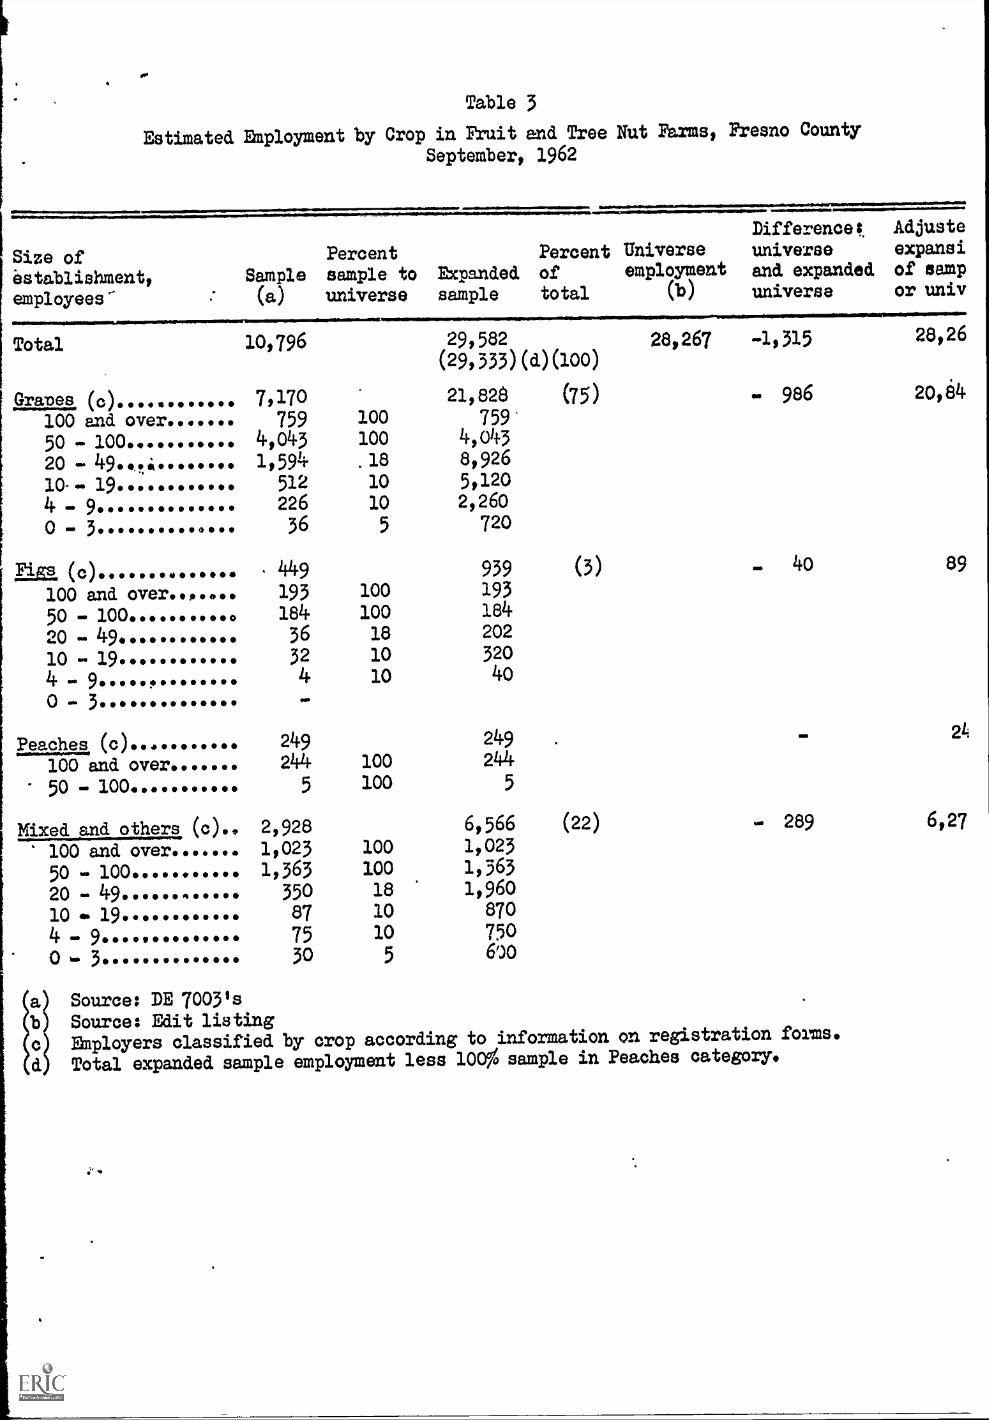
Table 3
Estimated Employment by Crop in Fruit end Tree Nut Farms, Fresno County
September, 19621. 11111MROM.Size ofestablishment,employees-
Sample
(a)
OSII11111111111101NallimmMTotal 10,796
Grapes (0) ............100 and over.. ..
50 - 100 .......
20 -10- -
4 . 9..............O . 3. .. ...
ELM (0).,00 .... ***lb*
100 and over. op04,00
50 100009.441100.00)
20 -10 - 19 .. ..
4 .O . 3.... ..
Peaches (c).... .. ...
100 and over..50 - 100.. .... .
..Mixed and others
100 and over. .....
50 - 100. .....
20 - 49... .... .
10 ft 19.......
(0)..
4 . 9............... 3.... .........
7,170
7594,031,594
51222636
4491931843632
4
Percentsample touniverse
apandedsample
Percentoftotal
Universeemployment
(b)
Difference!, Adjuste
universe expansiand expanded of sampuniverse or univ
29,582 28,267 -1,315 28,26
(29,333)(d)(100)
21,828 (75) . 986 20,64
loo 759'100 4,03.18 8,926
10 5,120
10 2,260
5 720
939 (3) - 4o
loo 193
loo 184
18 202
10 320
10 40
249244 loo
5 loo
2,9281,0231,363
350877530
249244
5
6,566 (22) . 289
100 1,023
100 1,363
18 1,960
10 870
10 750
5 600
ia Source: DE 70031s
b Source: Edit listing
c EMployers classified by crop according to information on registration forms.
d Total expanded sample employment less 100% sample in Peaches category.
6,27
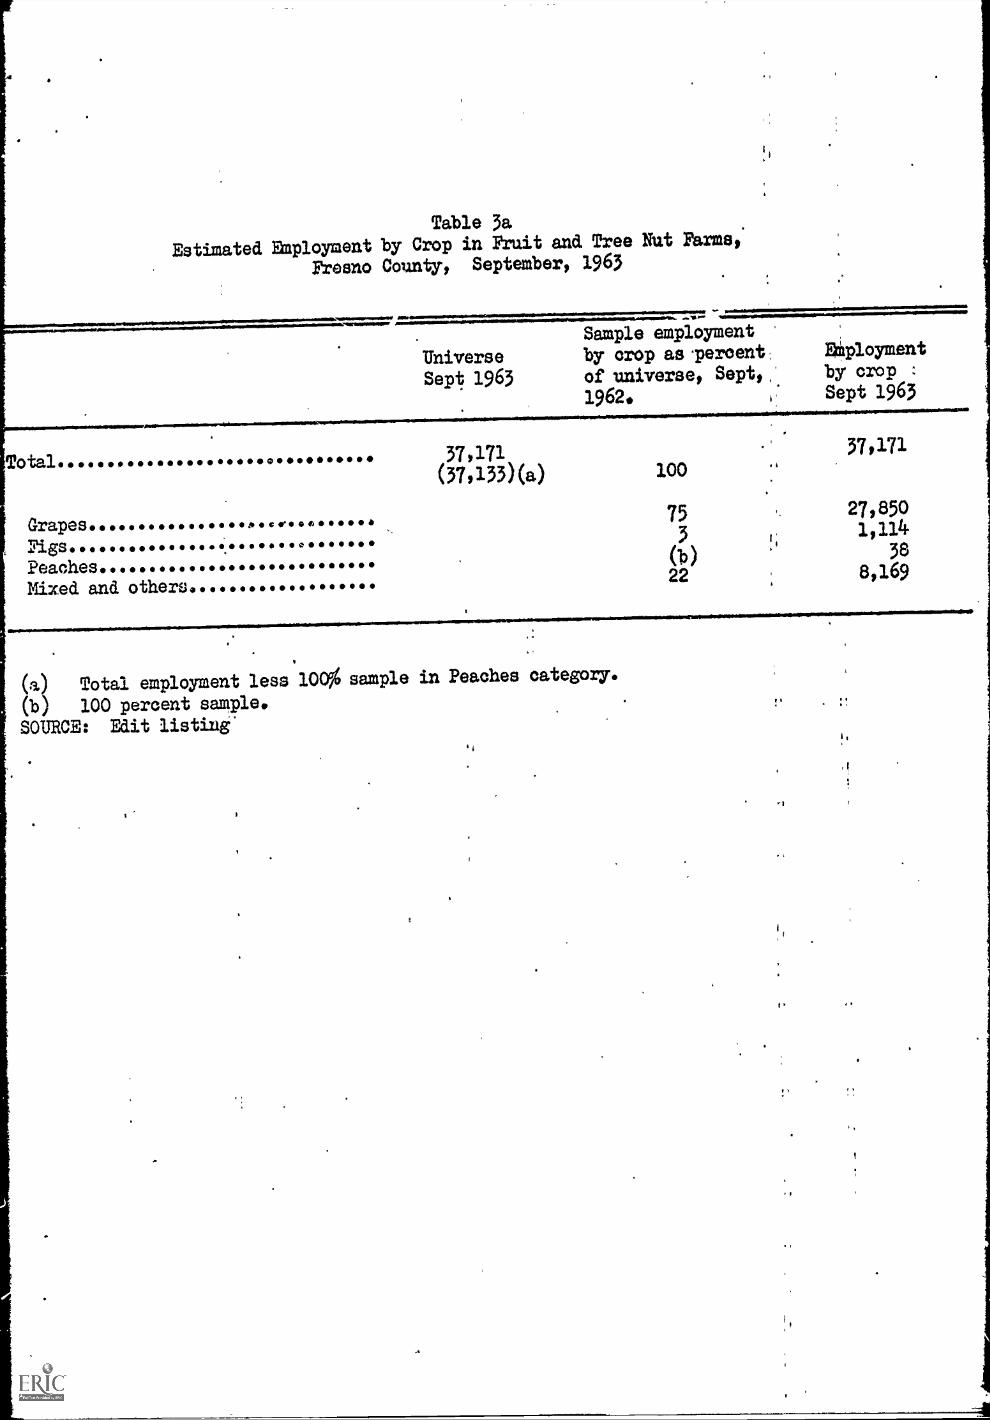
Table 3a
Estimated Employment by Crop in Fruit and Tree Nut Farms;
Fresno County, September, 1963
-ms.geml 41~~~...sams~~amtNIMONNWINNw AINNIIMIIIIINN1~~~1IMOMMINN.1
Nilipeols
Sample employment
Universe by crop as Texcent 4Mp1oyment
Sept 1963 of universe, Sept,, by crop :
1962. Sept 1963
37,171 37,171
(371133)(a) 100
grapes ... ***** ................ 75 27,850
Figs3 1,114
(b) 38
Mixed and others, .......... *****22 8,169
IIMPIMIIMIMO.11.0111.
(a) Total employment less 10Q% sample in Peaches category.
(b) 100 percent sample.
SOURCE: Edit listing"
ANIIMEIMINNIMW
Typ
eof Crop
Estimated -Fruit- and Tree Nut Farms,(Except Citrus
Employment in Fresno County
October, 1962 through September,
1963
Universe
Em
ploy
men
tSa
mpl
eSept 1962(a)Sept
1962
Estimated.
Sample
004-Sample--
-Employment Sample
Oct 1962
Sept Sample
Oct 1962
Nov 1962
Estimated
-149M24.1.421t EraPloYeat
Oct Sample
Nov 1962
Te.: -al..
0000
0000.*0
::rapes..
****
****
***...e.....
Peaches O0000000000 ****** 00040
`Axed. and others
of Crop
28., 267
24,842
899
249
6,27
7
ffrIN
FA
MN
ON
O.M
.0.1
1.21
11.0
.11n
Sample
Dec 1962
6,319
413
249
2,699
2,233
.353
237
.574
111
.
1,911.
.708
Est
imat
edDeg Sample
Employment
Sample
Nov Sample
Dec
1962
Jan-
196
3
8,43
21.
582-
5,575
.800
.18
279
.956
2,59
6
apes
****
***
4104
1100
0,41
00
Peaches.. *
:Faxed and.
01,0
4100
4000
,410
****
*00040.010
**** 0004141410414140010
others
- sr
, Im
m.m
wom
orw
omm
iPm
mim
i.
Type of Crop
Total... * ****
Grapes
Figs
Peaches.
****
** *
****
...v
Mixed. and. others
1,69
1 84
79
1,117
12,428
7,357
516
111
4,4111!
Jari
Sample
Dec Sample
1,06
910
5 131,
168
6,480
.479
3,524
.443
228 13
.61/
2,71
5
Estimated
Employment Sample
Jan
1963
Feb
1963
Eek
skpe
.s...
..nJa
h Sa
mpl
e
9,085
1,80
81.
069
5,96
01,
632
93
1.10
720
183
84
84
46
1,22
21.094
2,84
01,
221
1.01
3.8
92
.999
Est
imat
edE
stim
ated
Employment
Sample
Mar Sample
Employment
Sample
Feb
1963
Mar
1963
Feb Sample
Mar
1963
Apr
1963
Estfriated
di in.:J.2_2_1n
le
Employment
Sample
Mar Sample Apr
1963
May
1963
9,099
6,037
179
.46
2,83
7
1,20
3 84 29 912
-.65
71.
012
.747
Esttnated
BALAInalt
EMployment Sample
Type. of Crop
Apr Sample
May
1963
June
1963
Total
8, 39
Grapes.....e ** **********
1.140
3,328
Figs
.666
159
Peaches
204
Nixed and
1.930
4,948
(a)
From Table 3
6,295
3,966
181 29
2,11
9
886
111
115
1,104
*!736
1.32
1
1.210
Estimated
June Sample
EMployment
Sample
May Sample
June
1963
July
196
3
5037
2,919
1,010
239
74
115
204
2,564
2,131
July Sample
June Sample
Estimated
Etployment
July
196
3
1,42
718
5190
3,023
1.41
32,
500
1.41
8
12,306
4,70
2398
:190
7,01
6
11,866
1,34
7.54k
4,439
244
1.51
9525
321
321
2,83
5.5
386,
581
Tab
le 4
Est
imat
ed F
ruit
and
Tre
e N
ut F
arm
s,(E
xcep
t Citr
us )
Rup
loym
ent i
n Fr
esno
Cou
nty
-(C
ontin
ued)
Typ
e of
Cro
p_
Tot
al...
..:e
apes
..fi
gsPe
ache
s0004114,410004114,410
/Axe
d an
d ot
hers
.. **
****
SOU
RC
E:
DE
700
3ts
...11
1111
1.11
/001
1...
Sam
ple
Auf
c_ S
ampl
eA
ug 1
9_63
_ A
uly_
.Sam
ple
300
1.23
032
23,
034
1.07
0
Est
imat
edD
mpl
oym
ent
Sem
ple
attS
axm
l...e
Aug
196
3Se
pt_
1963
.A
ug S
ampl
e
15,4
507
****
*64
632
27,
04-2
7477
050
2 383,
069
3,44
31.
673
1.01
2
Est
imat
edE
kupl
oym
ent
Sept
196
3
33, 8
61
25, 6
16 081 38
7,12
6
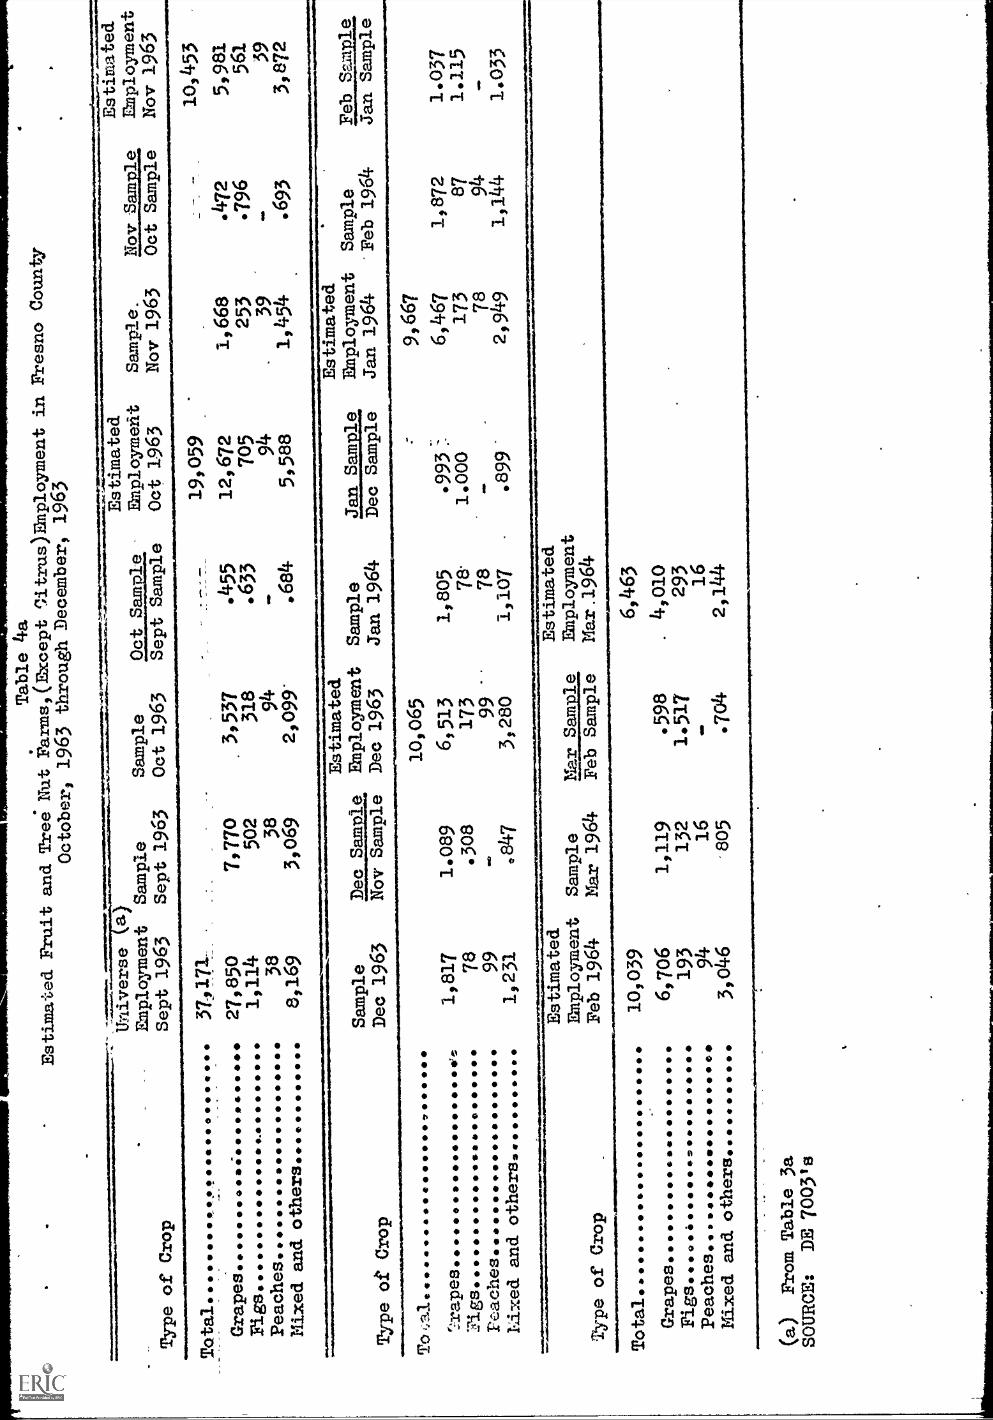
Table 4a
Estimated Fruit and Tree Nut
Farms,(Except Oitrus)EMployment in
Fresno County
October, 1963 through December,
1963
Type of Crop
4
Estimated
Estimated
Dmployment
Sample
Sample
p_staajLp...11e
Employment
Sample.
Nov SaiRat
EMployment
Sept 1963
Sept 1963
Oct 1963
Sept Sample
Oct 1963
Nov 1963
Oct Sample
Nov 1963
Total.. oo OOO 001,1610 OOOOOOOOOO 00
37.,171,._
Grapes.
OOOOO 0.000.0004,4,
27,850
Figs OOOOOOOOOO mew.. OOOOO
1,114
Peaches
OOOOO .............
38
Mixed and others... 00 OOOOO OS
8,169
7,77
050
2 38
3,069
3,537
318 94
2,099-
.455
.633
.684 ..
19,059
12,672
1,668
705
253
94
39
5,588
1,454
.472
10,453
5,981
.796
561 39
3,872
.693
Type of Crop
Estimated
Sample
112.2E1114 Employment
Sample
Dec 1963
Nov Sample
Dec 1963
Jan 1964
Estimated
Jan Sample
Employment
Sample
Dec Sample
Jan 1964
Feb 1964
Feb Saap
Jan Sample
To sl
10,065
9,667
'drapes
1,817
1.089
6,513
1,805
.993--
6,467
1,872
1.037
2igs OOOOO
***** ..........
78
.308
173
78'
1.000
173
87
1.115
Peaches
99
-99
78
78
94
Lixed and others *
1,231
.847
3,280
1,107
.899
-
2,949
1,144
1.033
Type of Crop
Estimated
Estimated
Employment
Sample
Mar Sample
Employment
Feb 1964
Mar 1964
Feb Sample
Mar.1964
Total
102039
6,463
Grapes
6,706
1,119
.598
4,010
Figs.... *
0000 ..=....******
193
132
1.517
293
Peaches..
94
16
16
Mixed and others.
3,046
-805
.704
2,144
(a)
From Table 3a
SOURCE:
DE 7003's
r
.Comparison.of Estimated and Actual
Agricultural 4mployment in Fresno
County
October, 1962 through December,
1963
Total
Cotton farms
Fruit and tree nut.farms
Vegetable farms .
General farms. 041100 *****
Labor contractors
Ag services, n.e.c
All other
(inc. unknown)
October
November
Actual
Estimated
Difference
Percent
Difference
Actual
Estimated
----,........
.........
Percent
Difference
Difference
30,235
30,886
651
2.2.
23,604
2392
87-1.3
2,221
1,780
2,454
1,846
10,689
12,428
59593
6,480
513
491
548
386
6,364
5,156
51954
5,161
5,526
6,051
5,195
,.69553
842
796
568
392
4,080
4,184
3,292
2,469
December
*************
259031
22,866
-2,165
-8.6
Cotton farms * 000000
1,822
1,916
Fruit and tree nut farms
99893
6,432
Vegetable farms
000000
46o
311
General farms
59293
-4;464
Labor contractors
3,686
-4,187
Ag services, n.e c
441
386
All other (inc.
unknown).
3,436
39170
Total
22,927
21,9
91-936
-4.1
Cotton farms
1,341
1,580
Fruit and tree nutfarms
10,758
9,099
Vegetable farms
General farms
44D4
5,322
261
Labor contractors
2,142
21002
Ag services, n.e c
353
166
All other (inc.
unknown).
2,607
31457
January
22,925
1,462
10,453
436
-59137
2,279
431
2,787
22,710
1,717
9,085
273
5,415
2,081
402
31737
-215
-0.9
March
-534
22,045
21,511
1,546
1,869
7.272
6,295
_573
322
-5,471
5,665
31965
3,928
417
220
2,801
3,212
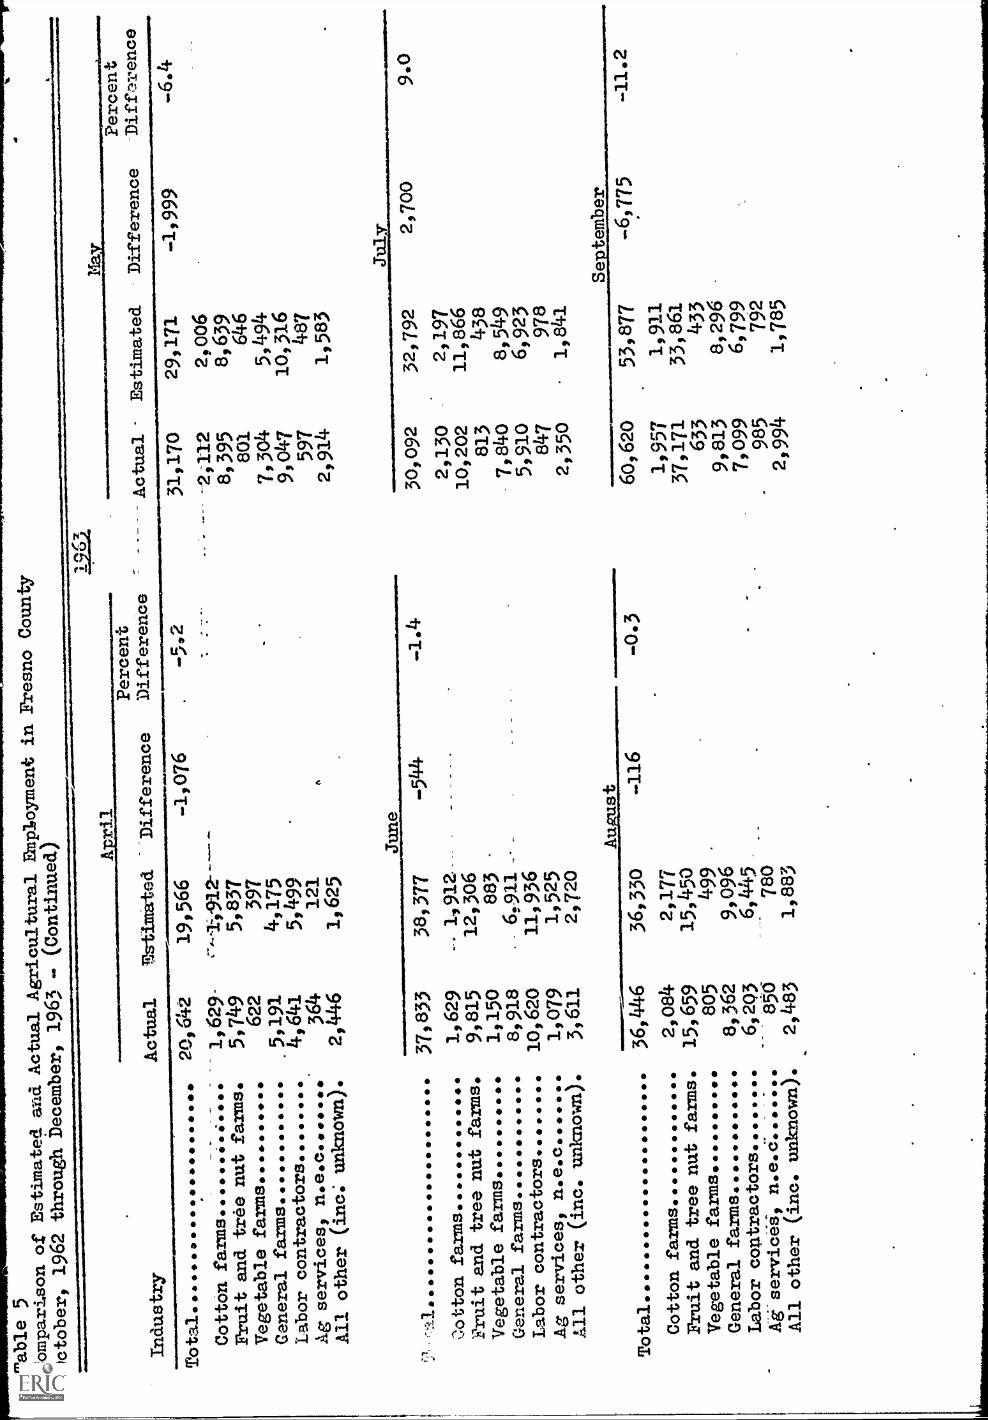
Table 5
Comparison of Estimatedana Actual Agricultural
Employment in Fresno
County
October, 1962 through December,
1963 - (Continued)
Industry
Actual
Tfttimated
Total . .... .00 ..... 4 ..... 40.0
20,642
19,566
Cotton farms ........i...:-
1, 629
c---- -1-9-91Z-
Fruit and tree nut farms.
5,749
5,837
Vegetable farms
622
397
General farms
.5,191
4,175
Labor contractors
4,641
5,499
Ag services, n.e.c
364
121
Al/ other
(inc: unknown)
2,446
1,625
SIO
NN
YIN
NIII
III00
101.
710.
..I.P
IIIIM
IIIIW
INIO
NIV
IllaN
IIIM
IPIIM
III.4
*/.1
01.1
Aril
1.963.
11a
Difference
Percent
Difference
Actual-
Estimated
Difference
-1,076
g 2
31,170
-12,112
8,395
801
7,304
9,047
597
2,914
29,171
21006
8,639
646
5,494
10,316
487
1,583
-1,999
June
37,833
38,377
-544
,1:otton farms
1,629
11912
Fruit and tree nut farms
9,815
12,306
Vegetable farms... 00.0411,41
1,150
883
General farms
8,918
6.911
Labor contractors
10,620
11,936
Ag services, n.e.c
1,079
1,525
All other
(inc. unknown)
3,611
2,720
August
Percent
DiMrence
-6.4
July
30,092
32,792
2,700
9.0
2,130
2,197
10,202
11,866
813
438
7,840
8,549
5,910
6,923
847
978
2,350
1,841
September
Total
36,446
36,330
-116
-0.3
60,620
53,877
-6,775
-11.2
Cotton farms
2,084
2,177
Fruit and tree nut farms
15,659
15,450
Vegetable farms. ..... 10.0
805
499
.
General farms.. .....
8,362
9,096
Labor contractors .... .
612Q3
6,445
Ag servicdd, n.e.6-
856
780
All other (inc.
unknown)
2,483
1,883
1,957
1,911
37,171
33,861
633
433
9,813
8,296
7,099
6,799
-985
792
2,994
1,785
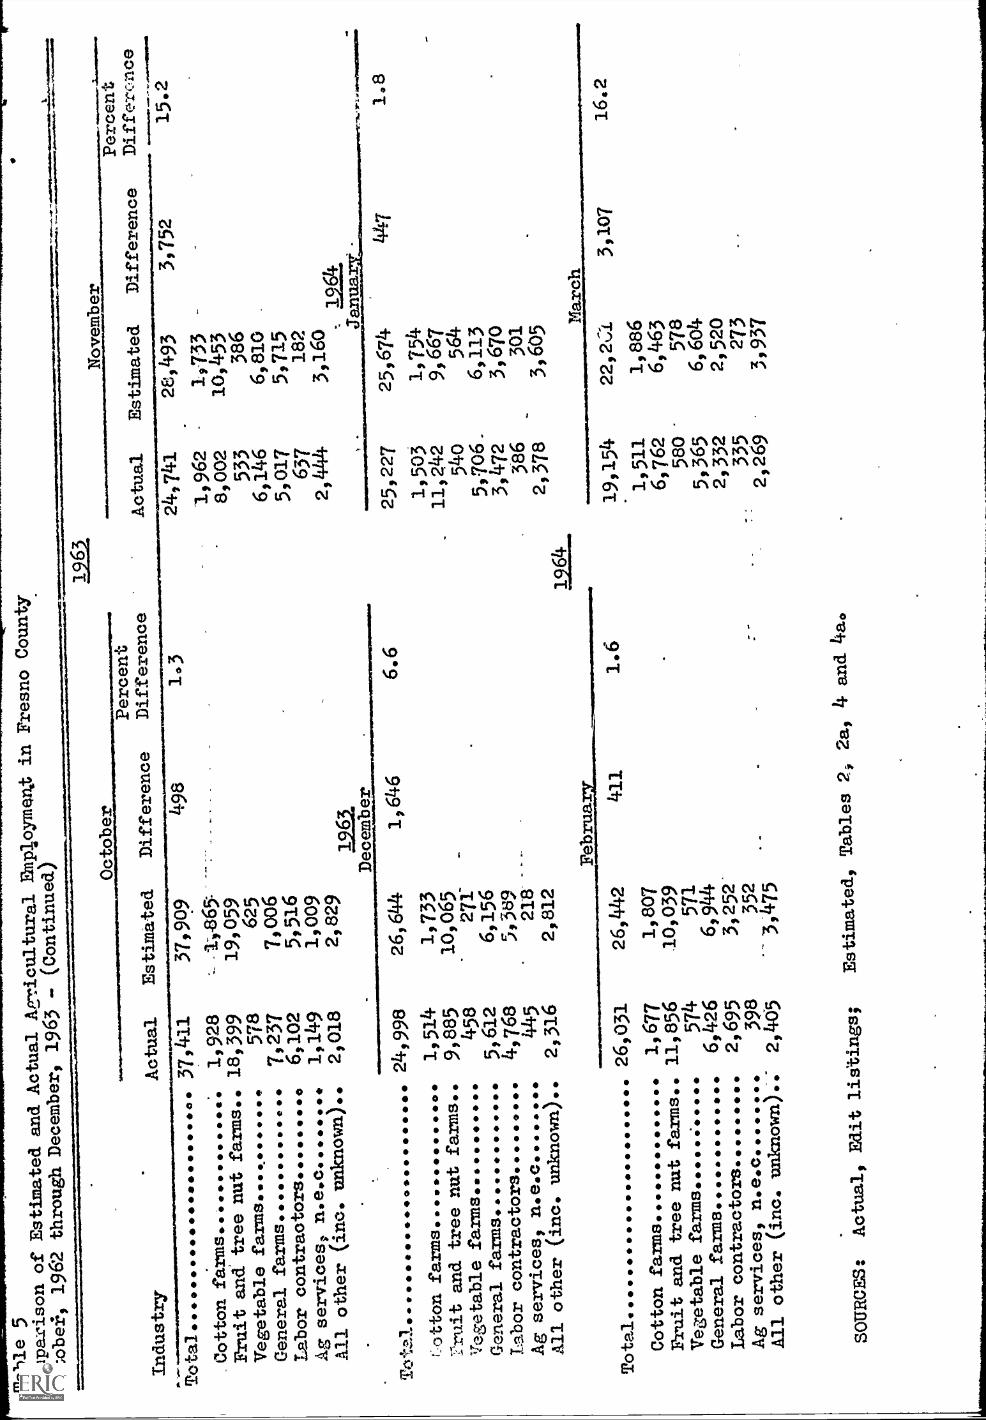
Table 5
Compax.ison of Estimatedand Actual
APTicultural Etriploymen,Xin Fresno County
Octobei., 1962 throughDecember, 1963 -
(Continued)
.1 oes.dMigew
aloo
k.A
.
Industry
October
1963
November
Actual
Estimated
Difference
Percent
Difference
Actual
Estimated
Difference
Percent
Differc.nce
Total.
*****
37,411
37,909
498
1*3
24,741
28,493
3,752
15.2
Cotton farms....
1,928
-14-865
1,962
1,733
Fruit and tree nutfarms
18,399
19,059
8,002
10,453
Vegetable farms
578
625
533
386
General farms
7,237
7,006
6,146
6010
Labor contraotors *** ** 40.40
6,102
5,516
5,017
5,715
As servicest n.e.c.
1,149
1,009
637
182
All other
(inc. unknown)
2,018
2,829
2,444
3,160
126a
December
4Janus,
2.21
.,ft.e
nasi
mes
Olu
p
TA
tal.m
401,
***
****
s0.
011,
0000
024,998
26,644
1,64
66.
625,227
25,674
447
1.8
Lotton farms
1,514
1,733
1,503
1,754
Yruit and tree nut
farms
9,885
101065
11,242
9,667
Vegetable farms
458
271
540
564
General farms
5,612
6,156
5,06-
6,113
Labor contractors . OOOOO
4,768
5,369
3,472
3,670
Ag services, n.e.c
445
218
386
301
All other
(inc. unknown)
2,316
2, 812
2,378
3,605
Feb
rua
Mar
ch
Total
26,031
26,442
411
1.6
19,154
22,21
3,10
716
.2
Cotton farms
1,677
1,807
1,511
1,886
Fruit and tree nut farms
11,856
10,039
6,762
6,463
Vegetable farms... **
***
574
571
580
578
General farms
6,426
6,944
5,365
6,604
Labor contractors.. *****
2,695
3,252
2,332
2,520
Ag services, n.e.c
398
352
335
273
All other
(inc. unknown).:
2,405
3,475
2,269
3,937
SOURCES:
Actual, Edit
listings;
Estimated, Tables
2, 2a,
4 and 4a*