Embed Size (px)
Citation preview
Title Strain gradient effects on concrete stress-strain curve
Author(s) Peng, J; Ho, JCM
Citation Proceedings of the Institution of Civil Engineers: Structures andBuildings, 2012, v. 165 n. 10, p. 543-565
Issued Date 2012
URL http://hdl.handle.net/10722/180924
Rights Creative Commons: Attribution 3.0 Hong Kong License
Proceedings of the Institution of Civil Engineers
Structures and Buildings 165 November 2012 Issue SB10
Pages 543–565 http://dx.doi.org/10.1680/stbu.10.00056
Paper 1000056
Received 19/10/2010 Accepted 10/10/2011
Published online 22/02/2012
Keywords: columns/concrete structures/design methods & aids
ICE Publishing: All rights reserved
Structures and BuildingsVolume 165 Issue SB10
Strain gradient effects on concretestress–strain curvePeng and Ho
Strain gradient effects onconcrete stress–strain curvej1 Jun Peng MPhil
PhD Student, Department of Civil Engineering, University of HongKong, Hong Kong
j2 Johnny Ching Ming Ho PhD, MHKIE, MIEAust, CPEngAssistant Professor, Department of Civil Engineering, University ofHong Kong, Hong Kong
j1 j2
The stress–strain characteristic of concrete developed in flexure is one of the essential parameters for the ultimate
flexural strength design of reinforced concrete (RC) members. Currently, the stress–strain curve of concrete
developed in flexure is obtained by scaling down the uniaxial stress–strain curve. In current RC design codes, it is
represented by an equivalent rectangular concrete stress block depending solely on the concrete strength. By
comparing the theoretical strength evaluated for the stress block with the measured strength, the authors found
that current codes underestimate the actual flexural strength of RC beams and columns by 9% and 19%, respectively.
Since the underestimation is different for beams and columns, which are subjected to different strain gradients at
ultimate, it is suggested that the maximum concrete stresses developed in flexure should depend also on strain
gradient. The effects of strain gradient on the concrete stress developed in flexure were investigated in this work by
testing RC columns under concentric and eccentric axial loads or horizontal loads. The concrete stress–strain curves
of the eccentrically/horizontally loaded specimens were derived by modifying those of concentrically loaded
counterparts based on axial force and moment equilibriums. The results indicate that the maximum concrete stress
developed in flexure depends significantly on strain gradient. Formulas were developed to correlate the maximum
and equivalent concrete stresses developed in flexure to the strain gradient. Their applicability was verified by
comparing the results with measured flexural strengths of RC beams and columns.
NotationAc area of concrete compression zone
Ag column cross-section area
As area of steel bar
b width of cross-section
c neutral axis depth
d effective depth of column section
di distance of longitudinal steel bar to extreme
compressive fibre or effective depth of cross-section in
Equations 3, 4 and 5
Es Young’s modulus of steel bar
fav average concrete compressive stress over compression
area in flexural members
f 9c uniaxial concrete compressive strength represented by
cylinder strength
fcu uniaxial concrete compressive strength represented by
cube strength
fmax maximum concrete compressive stress developed under
flexure
fs stress of steel bar in Equations 3, 4 and 5
fy yield strength of steel bar
h height of cross-section
k1 ratio of average stress ( fav) over compression area to
maximum stress developed under flexure ( fmax)
k2 ratio of distance between extreme compressive fibre
and resultant force of compressive stress block (Pc) to
that between the same fibre to the neutral axis (c)
k3 ratio of fmax to concrete cube strength fcu
k93 ratio of fmax to the maximum uniaxial concrete strength
�max
M moment or flexural strength
MACI moment calculated based on ACI 318 (ACI, 2008)
MEC moment calculated based on Eurocode 2 (CEN, 2004)
MNZ moment calculated based on NZS 3101 (SNZ, 2006)
Mp moment calculated based on the proposed values of
equivalent rectangular concrete stress block parameters
obtained in this study
Mt measured moment capacity
n number of longitudinal steel bars
P axial load
543
Pc resultant force of concrete compressive stress block
Æ ratio of equivalent concrete compressive stress
developed under flexure to concrete cube strength ( fcu)
� ratio of height of equivalent rectangular concrete
compressive stress block to neutral axis depth
� concrete strain
�cu ultimate concrete strain at extreme compressive fibre
measured at maximum load of eccentrically or
horizontally loaded specimen
rs longitudinal reinforcement ratio
� concrete stress
�max maximum concrete compressive stress developed in
concentrically loaded specimen
� strain gradient
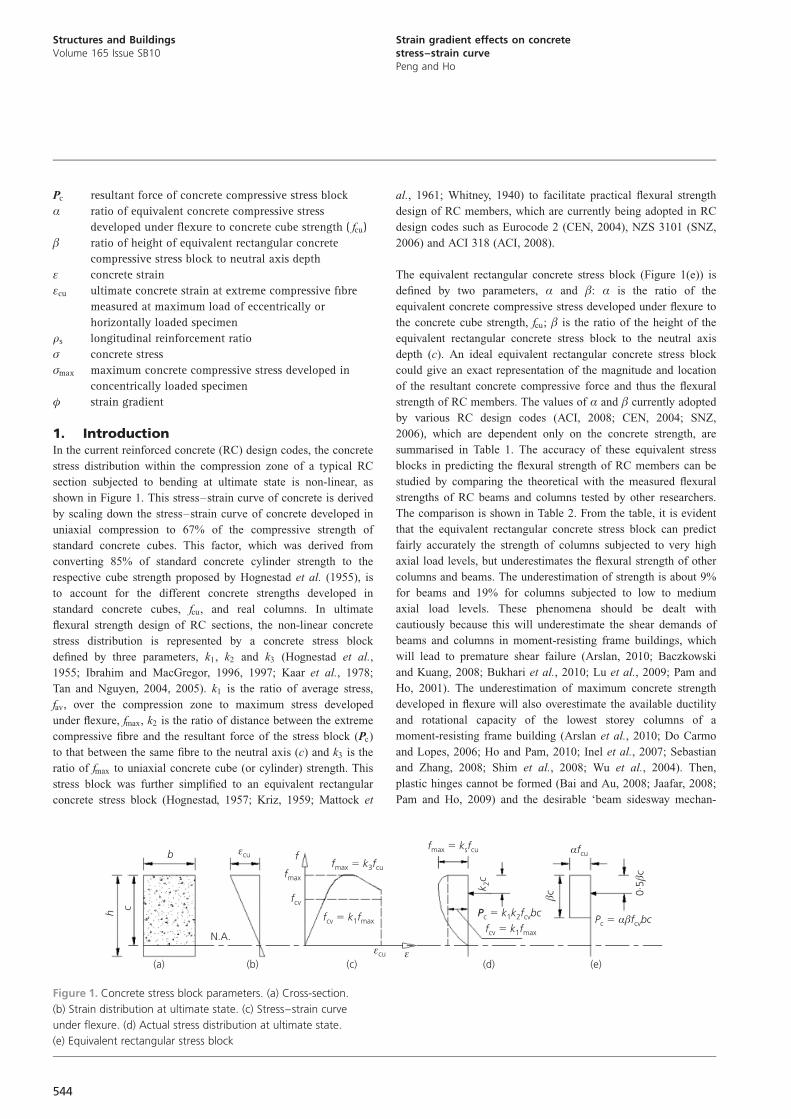
1. IntroductionIn the current reinforced concrete (RC) design codes, the concrete
stress distribution within the compression zone of a typical RC
section subjected to bending at ultimate state is non-linear, as
shown in Figure 1. This stress–strain curve of concrete is derived
by scaling down the stress–strain curve of concrete developed in
uniaxial compression to 67% of the compressive strength of
standard concrete cubes. This factor, which was derived from
converting 85% of standard concrete cylinder strength to the
respective cube strength proposed by Hognestad et al. (1955), is
to account for the different concrete strengths developed in
standard concrete cubes, fcu, and real columns. In ultimate
flexural strength design of RC sections, the non-linear concrete
stress distribution is represented by a concrete stress block
defined by three parameters, k1, k2 and k3 (Hognestad et al.,
1955; Ibrahim and MacGregor, 1996, 1997; Kaar et al., 1978;
Tan and Nguyen, 2004, 2005). k1 is the ratio of average stress,
fav, over the compression zone to maximum stress developed
under flexure, fmax, k2 is the ratio of distance between the extreme
compressive fibre and the resultant force of the stress block (Pc)
to that between the same fibre to the neutral axis (c) and k3 is the
ratio of fmax to uniaxial concrete cube (or cylinder) strength. This
stress block was further simplified to an equivalent rectangular
concrete stress block (Hognestad, 1957; Kriz, 1959; Mattock et
al., 1961; Whitney, 1940) to facilitate practical flexural strength
design of RC members, which are currently being adopted in RC
design codes such as Eurocode 2 (CEN, 2004), NZS 3101 (SNZ,
2006) and ACI 318 (ACI, 2008).
The equivalent rectangular concrete stress block (Figure 1(e)) is
defined by two parameters, Æ and �: Æ is the ratio of the
equivalent concrete compressive stress developed under flexure to
the concrete cube strength, fcu; � is the ratio of the height of the
equivalent rectangular concrete stress block to the neutral axis
depth (c). An ideal equivalent rectangular concrete stress block
could give an exact representation of the magnitude and location
of the resultant concrete compressive force and thus the flexural
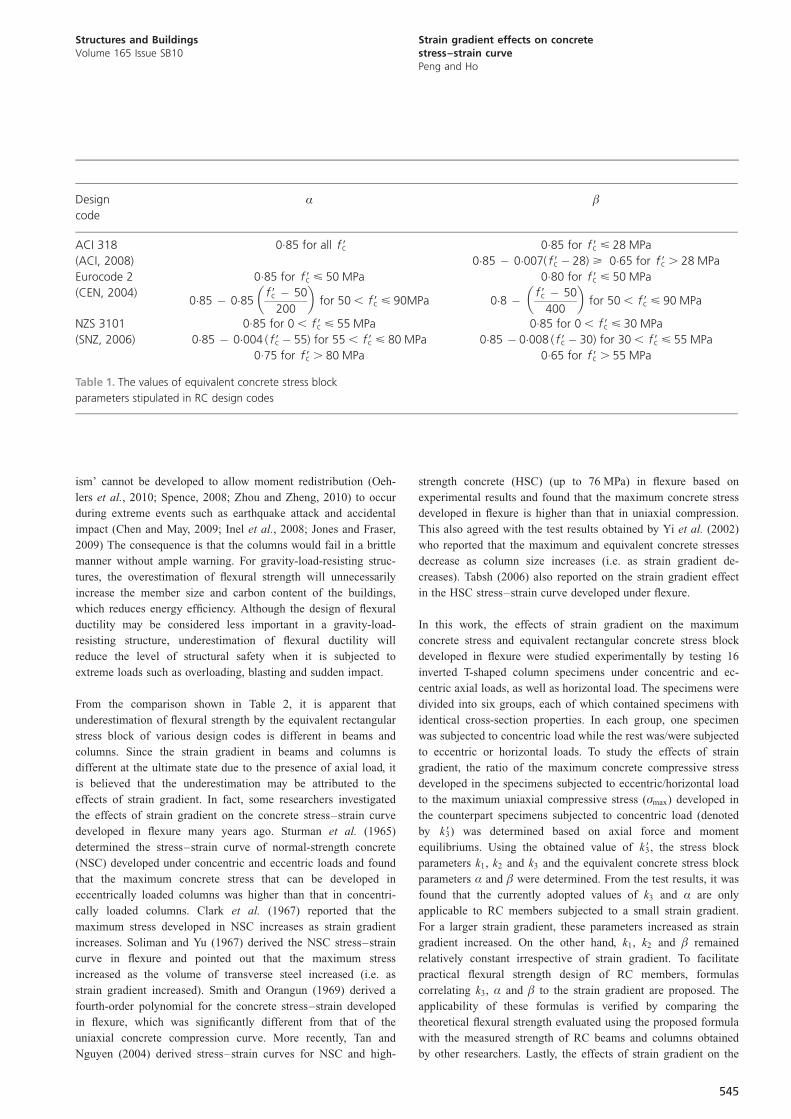
strength of RC members. The values of Æ and � currently adopted
by various RC design codes (ACI, 2008; CEN, 2004; SNZ,
2006), which are dependent only on the concrete strength, are
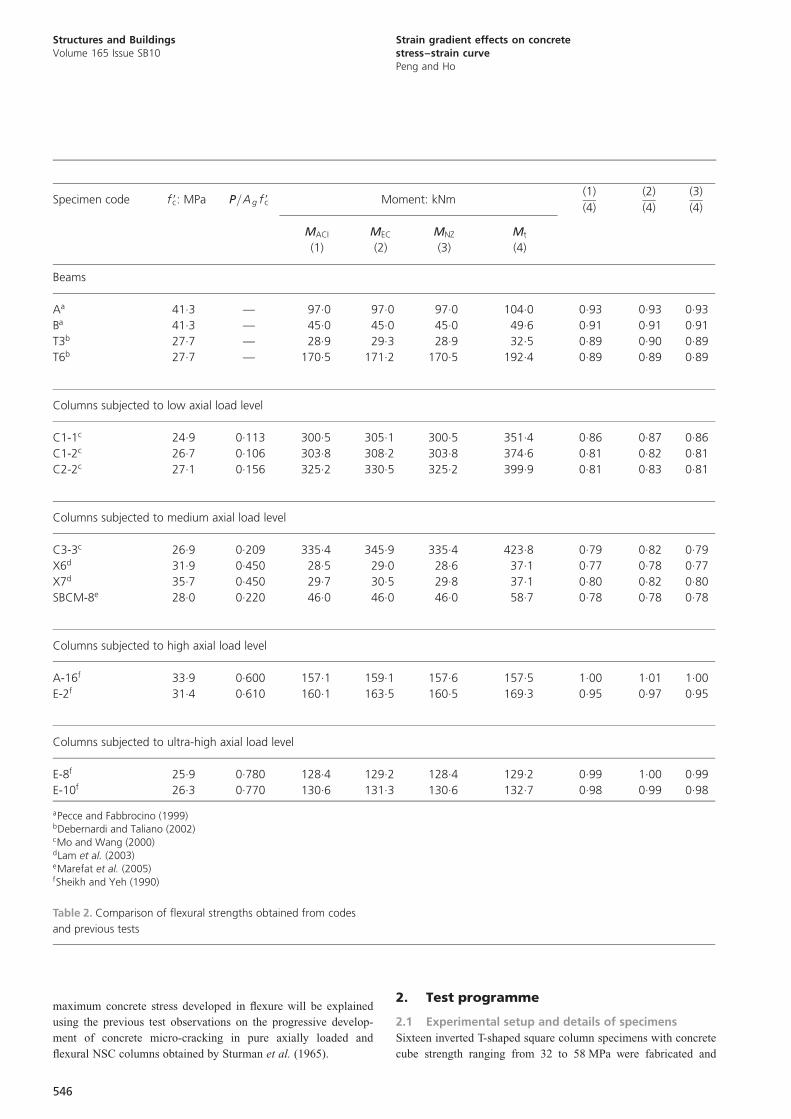
summarised in Table 1. The accuracy of these equivalent stress
blocks in predicting the flexural strength of RC members can be
studied by comparing the theoretical with the measured flexural
strengths of RC beams and columns tested by other researchers.
The comparison is shown in Table 2. From the table, it is evident
that the equivalent rectangular concrete stress block can predict
fairly accurately the strength of columns subjected to very high
axial load levels, but underestimates the flexural strength of other
columns and beams. The underestimation of strength is about 9%
for beams and 19% for columns subjected to low to medium
axial load levels. These phenomena should be dealt with
cautiously because this will underestimate the shear demands of
beams and columns in moment-resisting frame buildings, which
will lead to premature shear failure (Arslan, 2010; Baczkowski
and Kuang, 2008; Bukhari et al., 2010; Lu et al., 2009; Pam and
Ho, 2001). The underestimation of maximum concrete strength
developed in flexure will also overestimate the available ductility
and rotational capacity of the lowest storey columns of a
moment-resisting frame building (Arslan et al., 2010; Do Carmo
and Lopes, 2006; Ho and Pam, 2010; Inel et al., 2007; Sebastian
and Zhang, 2008; Shim et al., 2008; Wu et al., 2004). Then,
plastic hinges cannot be formed (Bai and Au, 2008; Jaafar, 2008;
Pam and Ho, 2009) and the desirable ‘beam sidesway mechan-
b
h c
N.A.
εcu f
fmax
fcv
f k fmax 3 cu�
f k fcv 1 max�
εcu ε(a) (b) (c) (d) (e)
f k fmax s cu�
kc 2
Pc 1 2 cv� k k f bc
f k fcv 1 max�
αfcu
�c 0·5�
c
P f bcc cv� α�
Figure 1. Concrete stress block parameters. (a) Cross-section.
(b) Strain distribution at ultimate state. (c) Stress–strain curve
under flexure. (d) Actual stress distribution at ultimate state.
(e) Equivalent rectangular stress block
544
Structures and BuildingsVolume 165 Issue SB10
Strain gradient effects on concretestress–strain curvePeng and Ho
ism’ cannot be developed to allow moment redistribution (Oeh-
lers et al., 2010; Spence, 2008; Zhou and Zheng, 2010) to occur
during extreme events such as earthquake attack and accidental
impact (Chen and May, 2009; Inel et al., 2008; Jones and Fraser,
2009) The consequence is that the columns would fail in a brittle
manner without ample warning. For gravity-load-resisting struc-
tures, the overestimation of flexural strength will unnecessarily
increase the member size and carbon content of the buildings,
which reduces energy efficiency. Although the design of flexural
ductility may be considered less important in a gravity-load-
resisting structure, underestimation of flexural ductility will
reduce the level of structural safety when it is subjected to
extreme loads such as overloading, blasting and sudden impact.
From the comparison shown in Table 2, it is apparent that
underestimation of flexural strength by the equivalent rectangular
stress block of various design codes is different in beams and
columns. Since the strain gradient in beams and columns is
different at the ultimate state due to the presence of axial load, it
is believed that the underestimation may be attributed to the
effects of strain gradient. In fact, some researchers investigated
the effects of strain gradient on the concrete stress–strain curve
developed in flexure many years ago. Sturman et al. (1965)
determined the stress–strain curve of normal-strength concrete
(NSC) developed under concentric and eccentric loads and found
that the maximum concrete stress that can be developed in
eccentrically loaded columns was higher than that in concentri-
cally loaded columns. Clark et al. (1967) reported that the
maximum stress developed in NSC increases as strain gradient
increases. Soliman and Yu (1967) derived the NSC stress–strain
curve in flexure and pointed out that the maximum stress
increased as the volume of transverse steel increased (i.e. as
strain gradient increased). Smith and Orangun (1969) derived a
fourth-order polynomial for the concrete stress–strain developed
in flexure, which was significantly different from that of the
uniaxial concrete compression curve. More recently, Tan and
Nguyen (2004) derived stress–strain curves for NSC and high-
strength concrete (HSC) (up to 76 MPa) in flexure based on
experimental results and found that the maximum concrete stress
developed in flexure is higher than that in uniaxial compression.
This also agreed with the test results obtained by Yi et al. (2002)
who reported that the maximum and equivalent concrete stresses
decrease as column size increases (i.e. as strain gradient de-
creases). Tabsh (2006) also reported on the strain gradient effect
in the HSC stress–strain curve developed under flexure.
In this work, the effects of strain gradient on the maximum
concrete stress and equivalent rectangular concrete stress block
developed in flexure were studied experimentally by testing 16
inverted T-shaped column specimens under concentric and ec-
centric axial loads, as well as horizontal load. The specimens were
divided into six groups, each of which contained specimens with
identical cross-section properties. In each group, one specimen
was subjected to concentric load while the rest was/were subjected
to eccentric or horizontal loads. To study the effects of strain
gradient, the ratio of the maximum concrete compressive stress
developed in the specimens subjected to eccentric/horizontal load
to the maximum uniaxial compressive stress (�max) developed in
the counterpart specimens subjected to concentric load (denoted
by k93) was determined based on axial force and moment
equilibriums. Using the obtained value of k93, the stress block
parameters k1, k2 and k3 and the equivalent concrete stress block
parameters Æ and � were determined. From the test results, it was
found that the currently adopted values of k3 and Æ are only
applicable to RC members subjected to a small strain gradient.
For a larger strain gradient, these parameters increased as strain
gradient increased. On the other hand, k1, k2 and � remained
relatively constant irrespective of strain gradient. To facilitate
practical flexural strength design of RC members, formulas
correlating k3, Æ and � to the strain gradient are proposed. The
applicability of these formulas is verified by comparing the
theoretical flexural strength evaluated using the proposed formula
with the measured strength of RC beams and columns obtained
by other researchers. Lastly, the effects of strain gradient on the
Design
code
Æ �
ACI 318
(ACI, 2008)
0.85 for all f 9c 0.85 for f 9c < 28 MPa
0:85 � 0:007( f 9c � 28) > 0:65 for f 9c . 28 MPa
Eurocode 2
(CEN, 2004)
0.85 for f 9c < 50 MPa
0:85 � 0:85f 9c � 50
200
� �for 50 , f 9c < 90MPa
0.80 for f 9c < 50 MPa
0:8 � f 9c � 50
400
� �for 50 , f 9c < 90 MPa
NZS 3101
(SNZ, 2006)
0.85 for 0 , f 9c < 55 MPa
0:85 � 0:004 ( f 9c � 55) for 55 , f 9c < 80 MPa
0.75 for f 9c . 80 MPa
0.85 for 0 , f 9c < 30 MPa
0:85 � 0:008 ( f 9c � 30) for 30 , f 9c < 55 MPa
0.65 for f 9c . 55 MPa
Table 1. The values of equivalent concrete stress block
parameters stipulated in RC design codes
545
Structures and BuildingsVolume 165 Issue SB10
Strain gradient effects on concretestress–strain curvePeng and Ho
maximum concrete stress developed in flexure will be explained
using the previous test observations on the progressive develop-
ment of concrete micro-cracking in pure axially loaded and
flexural NSC columns obtained by Sturman et al. (1965).
2. Test programme
2.1 Experimental setup and details of specimens
Sixteen inverted T-shaped square column specimens with concrete
cube strength ranging from 32 to 58 MPa were fabricated and
Specimen code f 9c: MPa P=Ag f 9c Moment: kNm(1)
(4)
(2)
(4)
(3)
(4)
MACI
(1)
MEC
(2)
MNZ
(3)
Mt
(4)
Beams
Aa 41.3 — 97.0 97.0 97.0 104.0 0.93 0.93 0.93
Ba 41.3 — 45.0 45.0 45.0 49.6 0.91 0.91 0.91
T3b 27.7 — 28.9 29.3 28.9 32.5 0.89 0.90 0.89
T6b 27.7 — 170.5 171.2 170.5 192.4 0.89 0.89 0.89
Columns subjected to low axial load level
C1-1c 24.9 0.113 300.5 305.1 300.5 351.4 0.86 0.87 0.86
C1-2c 26.7 0.106 303.8 308.2 303.8 374.6 0.81 0.82 0.81
C2-2c 27.1 0.156 325.2 330.5 325.2 399.9 0.81 0.83 0.81
Columns subjected to medium axial load level
C3-3c 26.9 0.209 335.4 345.9 335.4 423.8 0.79 0.82 0.79
X6d 31.9 0.450 28.5 29.0 28.6 37.1 0.77 0.78 0.77
X7d 35.7 0.450 29.7 30.5 29.8 37.1 0.80 0.82 0.80
SBCM-8e 28.0 0.220 46.0 46.0 46.0 58.7 0.78 0.78 0.78
Columns subjected to high axial load level
A-16f 33.9 0.600 157.1 159.1 157.6 157.5 1.00 1.01 1.00
E-2f 31.4 0.610 160.1 163.5 160.5 169.3 0.95 0.97 0.95
Columns subjected to ultra-high axial load level
E-8f 25.9 0.780 128.4 129.2 128.4 129.2 0.99 1.00 0.99
E-10f 26.3 0.770 130.6 131.3 130.6 132.7 0.98 0.99 0.98
aPecce and Fabbrocino (1999)bDebernardi and Taliano (2002)cMo and Wang (2000)dLam et al. (2003)eMarefat et al. (2005)fSheikh and Yeh (1990)
Table 2. Comparison of flexural strengths obtained from codes
and previous tests
546
Structures and BuildingsVolume 165 Issue SB10
Strain gradient effects on concretestress–strain curvePeng and Ho
tested under concentric and eccentric axial loads or horizontal
loads. They were divided into six groups, with each group
comprising specimens with identical cross-section and material
strength properties. Concrete for the same group of specimens
was cast from the same batch of concrete transported by the same
truck from the same plant. They were also cured under the same
environmental conditions and thus the concrete strength for all
specimens within the same group can be regarded as identical.
One of the specimens in each group was tested under concentric
load, while the rest were tested under eccentric axial load (for
small strain gradient) or horizontal load (for large strain gradi-
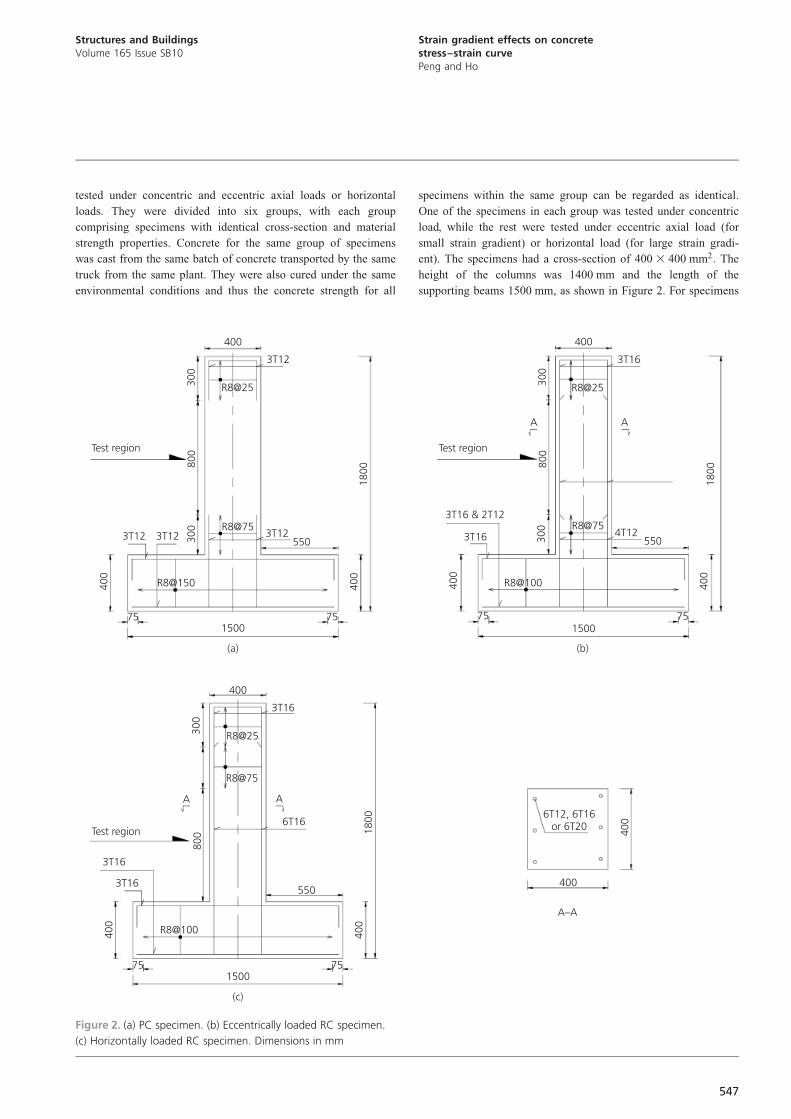
ent). The specimens had a cross-section of 400 3 400 mm2: The
height of the columns was 1400 mm and the length of the
supporting beams 1500 mm, as shown in Figure 2. For specimens
400
3T12
Test region
300
800
300
3T12 3T12
400
R8@25
R8@75
R8@150
150075 75
(a)
3T12550
1800
400
400
3T16
Test region
300
800
300
3T16
3T16 & 2T12
400
R8@25
R8@75
R8@100
150075 75
(b)
4T12550
1800
400
A A
400
3T16
Test region
300
800
3T16
3T16
400
R8@25
R8@75
R8@100
150075 75
(c)
6T16
550
1800
400
A A
400
400
A–A
6T12, 6T16or 6T20
Figure 2. (a) PC specimen. (b) Eccentrically loaded RC specimen.
(c) Horizontally loaded RC specimen. Dimensions in mm
547
Structures and BuildingsVolume 165 Issue SB10
Strain gradient effects on concretestress–strain curvePeng and Ho

tested under concentric and eccentric axial loads, the testing
regions were in the middle 800 mm of the column height. For
specimens tested under horizontal load, the testing regions were
within 800 mm from the beam–column interface. Outside the
testing regions, the columns were heavily confined with trans-
verse steel and/or square hollow steel tube (400 3 400 mm2) so
that failure would always take place in the pre-determined testing
regions. The plain concrete (PC) specimens did not contain any
longitudinal steel within the testing region, while RC specimens
contained different amounts of longitudinal steel with steel ratios
of 0.42–1.18%. The cross-section properties and material
strengths of each test specimen are listed in Table 3; the values
are those commonly adopted by other researchers (Ahn and Shin,
2007; Choi et al., 2009; Han et al., 2010; Kim et al., 2007; Sim
et al., 2009; Supaviriyakit et al., 2007; Xiao et al., 2008). The
specimens were coded as follows. The first number refers to the
concrete cube strength on day 28 and the second number refers to
the percentage longitudinal steel ratio.
The uniaxial concrete stress–strain behaviour in each group of
specimens was obtained by testing one of the specimens under
concentric axial load. For RC specimens, the concrete stress was
obtained by subtracting the steel force from the total applied load
and then the difference was divided by the concrete area. The
strain was obtained by dividing axial shortening of the specimen
(measured with linear variable displacement transducer (LVDTs))
by its gauge length. The concrete stress–strain curve developed
in flexure (with strain gradient) was obtained by modifying the
obtained uniaxial concrete stress–strain curve such that the
theoretical axial force and moment matched the experimentally
measured values. For the specimens tested under eccentric
loading, different eccentricities (ranging from 50 to 140 mm as
summarised in Table 3) were used to simulate different extents of
strain gradient in columns at ultimate state. Nevertheless, since
the maximum eccentricity, which is restricted by the column size,
was about 150 mm, specimens that needed to be tested under
larger eccentricities to simulate the effects of large strain gradient
were tested under simultaneous axial and horizontal loads.
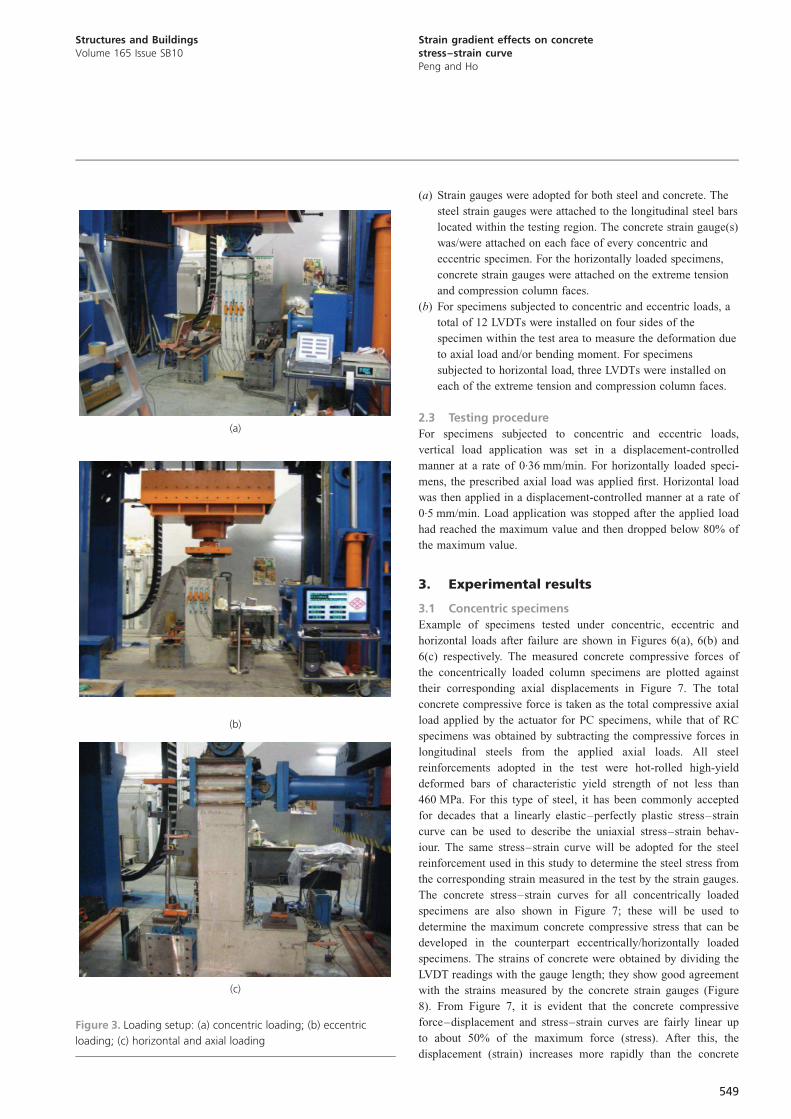
The test setup for the three types of loading is shown in Figure 3.
The axial and horizontal loads applied to the columns were
produced by a computerised electro-hydraulic servo controlled
multi-purpose testing machine having a maximum loading capa-
cities of 10 000 and 1500 kN, respectively.
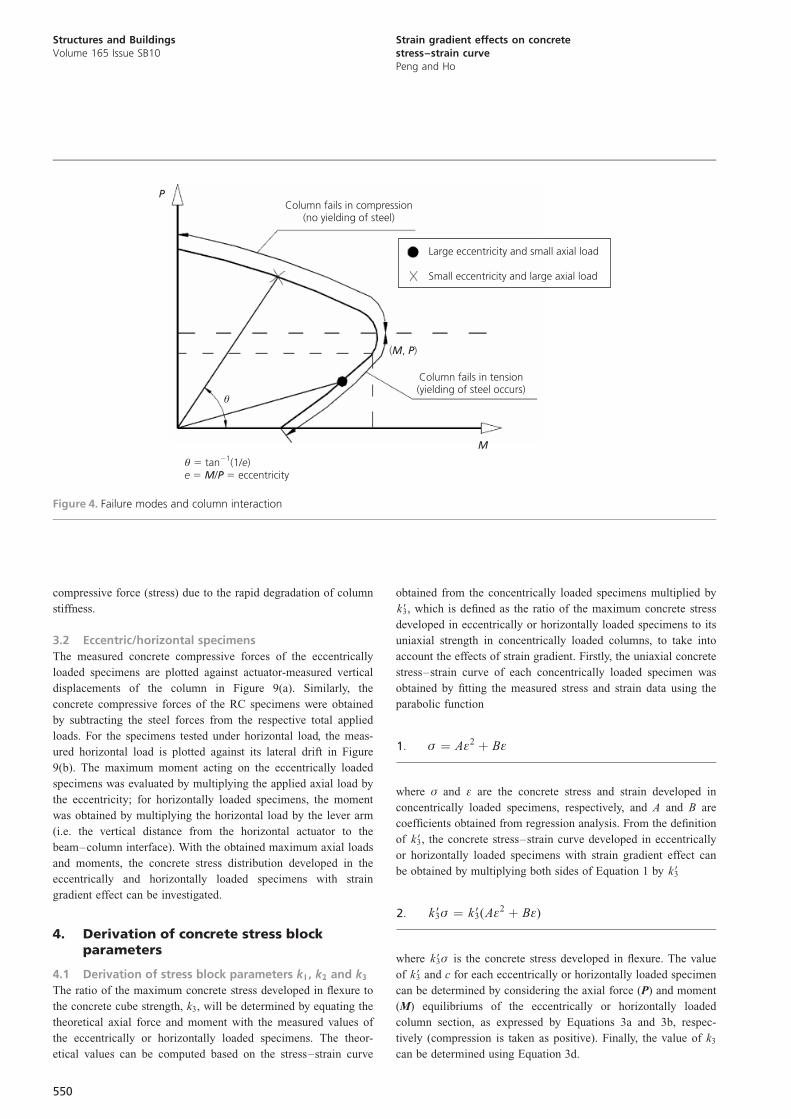
Because of the different loading arrangements, the failure modes
of the specimens were different. When a column was subjected to
concentric load or small eccentricity, it would fail in compression
where the tension steel would not yield. However, when a column
was subjected to large eccentricity or simultaneous axial and
horizontal loads, it would fail in tension where the tension steel
would yield. These failure modes are represented by different
locations on the interaction curve of the column specimens
(Figure 4).
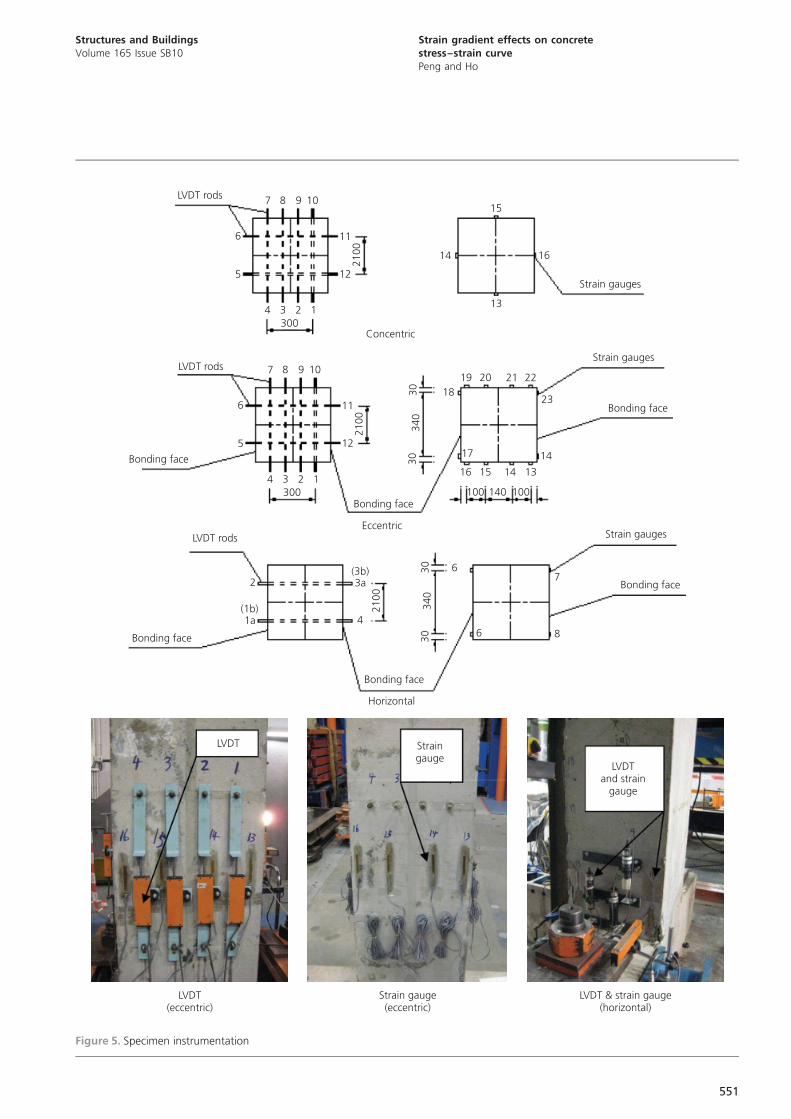
2.2 Instrumentation
Instrumentation to monitor the behaviour of the column speci-
mens included strain gauges and LVDTs (Figure 5)
Group Specimen code Loading
mode
Longitudinal steel fcu: MPa Eccentricity: mm
rs: % Detail fy: MPa Es: GPa Day 28 Testing
day
1 PC35-0-CON Concentric 0 — — — 35.0 35.0 0
PC35-0-ECC Eccentric 0 — — — 35.3 120
2 RC30-0.42-CON Concentric 0.42 6T12 538 203 30.0 35.9 0
RC30-0.42-ECC Eccentric 35.9 140
3 RC28-0.75-CON Concentric 0.75 6T16 533 203 28.2 33.6 0
RC28-0.75-ECC Eccentric 31.6 140
4 RC38-1.18-CON Concentric 1.18 6T20 536 200 38.4 43.2 0
RC38-1.18-ECC Eccentric 42.8 110
5 RC50-0.75-CON Concentric 0.75 6T16 515 203 50.3 50.3 0
RC50-0.75-ECC-1 Eccentric 58.2 120
RC50-0.75-ECC-2 Eccentric 58.2 140
6 RC41-0.75-CON Concentric 0.75 6T16 498 198 40.6 42.1 0
RC41-0.75-ECC-1 Eccentric 49.1 50
RC41-0.75-ECC-2 Eccentric 49.1 130
RC41-0.75-HOR-1 Horizontal 46.4 —
RC41-0.75-HOR-2 Horizontal 46.4 —
Table 3. Specimen properties
548
Structures and BuildingsVolume 165 Issue SB10
Strain gradient effects on concretestress–strain curvePeng and Ho
(a) Strain gauges were adopted for both steel and concrete. The
steel strain gauges were attached to the longitudinal steel bars
located within the testing region. The concrete strain gauge(s)
was/were attached on each face of every concentric and
eccentric specimen. For the horizontally loaded specimens,
concrete strain gauges were attached on the extreme tension
and compression column faces.
(b) For specimens subjected to concentric and eccentric loads, a
total of 12 LVDTs were installed on four sides of the
specimen within the test area to measure the deformation due
to axial load and/or bending moment. For specimens
subjected to horizontal load, three LVDTs were installed on
each of the extreme tension and compression column faces.
2.3 Testing procedure
For specimens subjected to concentric and eccentric loads,
vertical load application was set in a displacement-controlled
manner at a rate of 0.36 mm/min. For horizontally loaded speci-
mens, the prescribed axial load was applied first. Horizontal load
was then applied in a displacement-controlled manner at a rate of
0.5 mm/min. Load application was stopped after the applied load
had reached the maximum value and then dropped below 80% of
the maximum value.
3. Experimental results
3.1 Concentric specimens
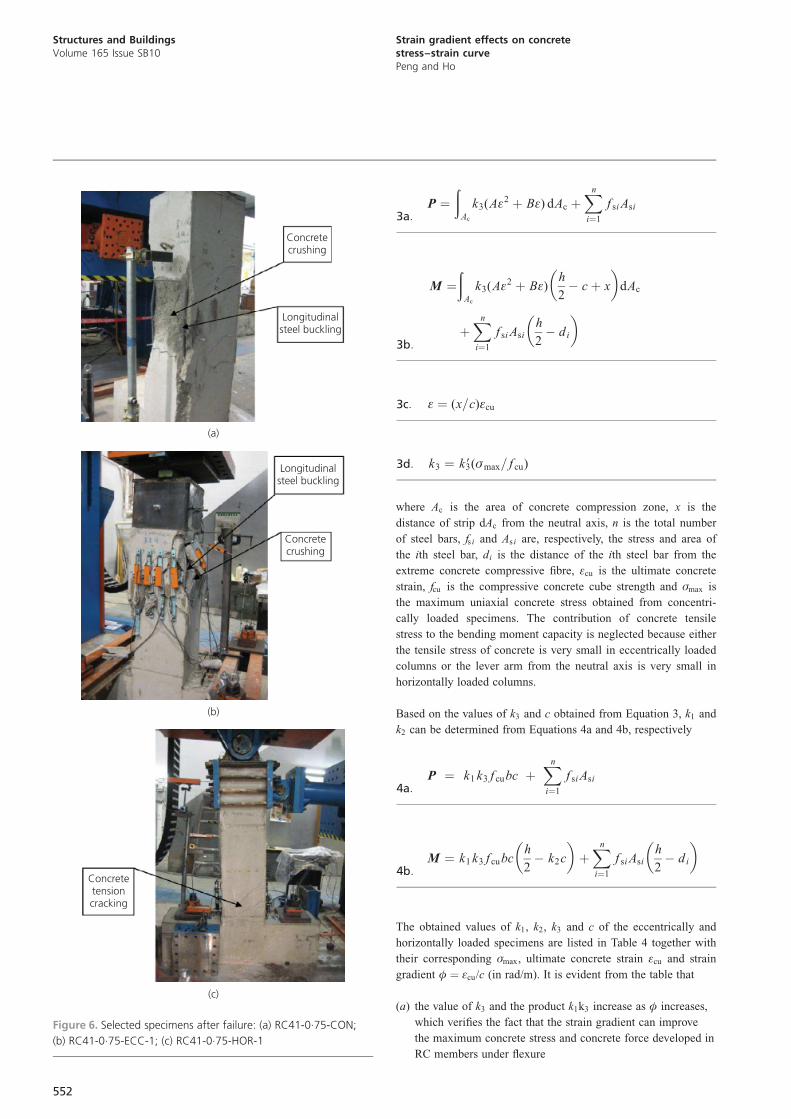
Example of specimens tested under concentric, eccentric and
horizontal loads after failure are shown in Figures 6(a), 6(b) and
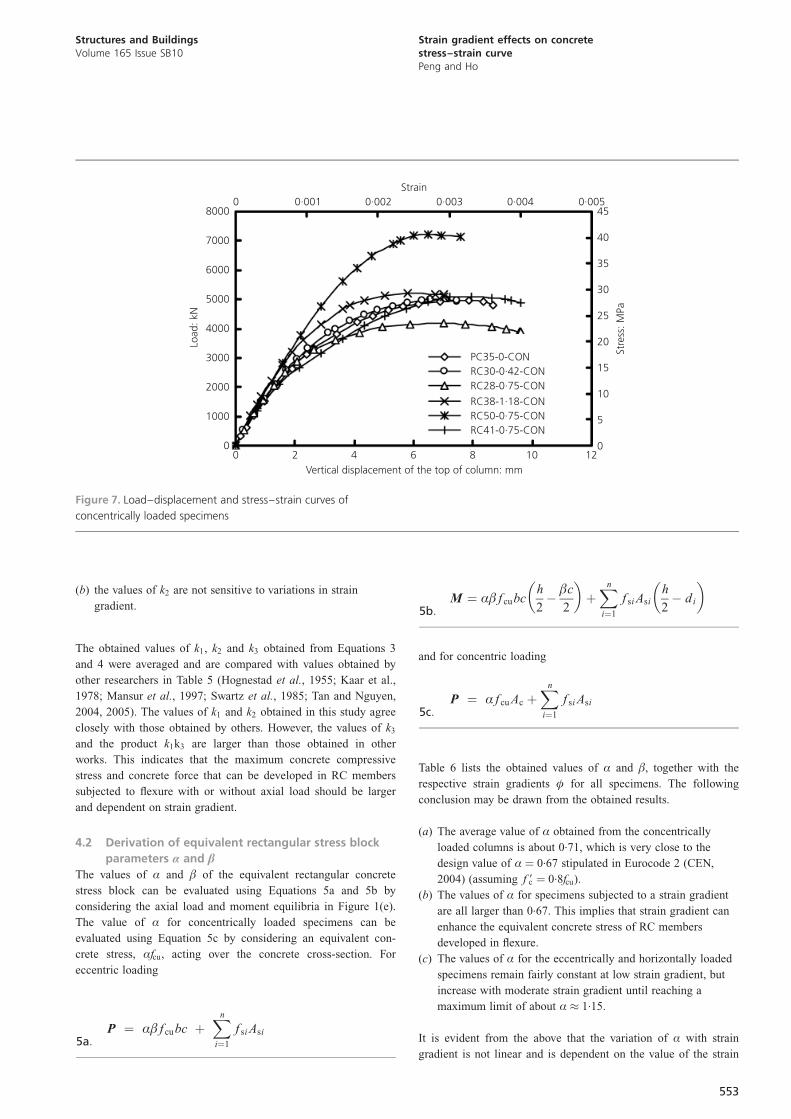
6(c) respectively. The measured concrete compressive forces of
the concentrically loaded column specimens are plotted against
their corresponding axial displacements in Figure 7. The total
concrete compressive force is taken as the total compressive axial
load applied by the actuator for PC specimens, while that of RC
specimens was obtained by subtracting the compressive forces in
longitudinal steels from the applied axial loads. All steel
reinforcements adopted in the test were hot-rolled high-yield
deformed bars of characteristic yield strength of not less than
460 MPa. For this type of steel, it has been commonly accepted
for decades that a linearly elastic–perfectly plastic stress–strain
curve can be used to describe the uniaxial stress–strain behav-
iour. The same stress–strain curve will be adopted for the steel
reinforcement used in this study to determine the steel stress from
the corresponding strain measured in the test by the strain gauges.
The concrete stress–strain curves for all concentrically loaded
specimens are also shown in Figure 7; these will be used to
determine the maximum concrete compressive stress that can be
developed in the counterpart eccentrically/horizontally loaded
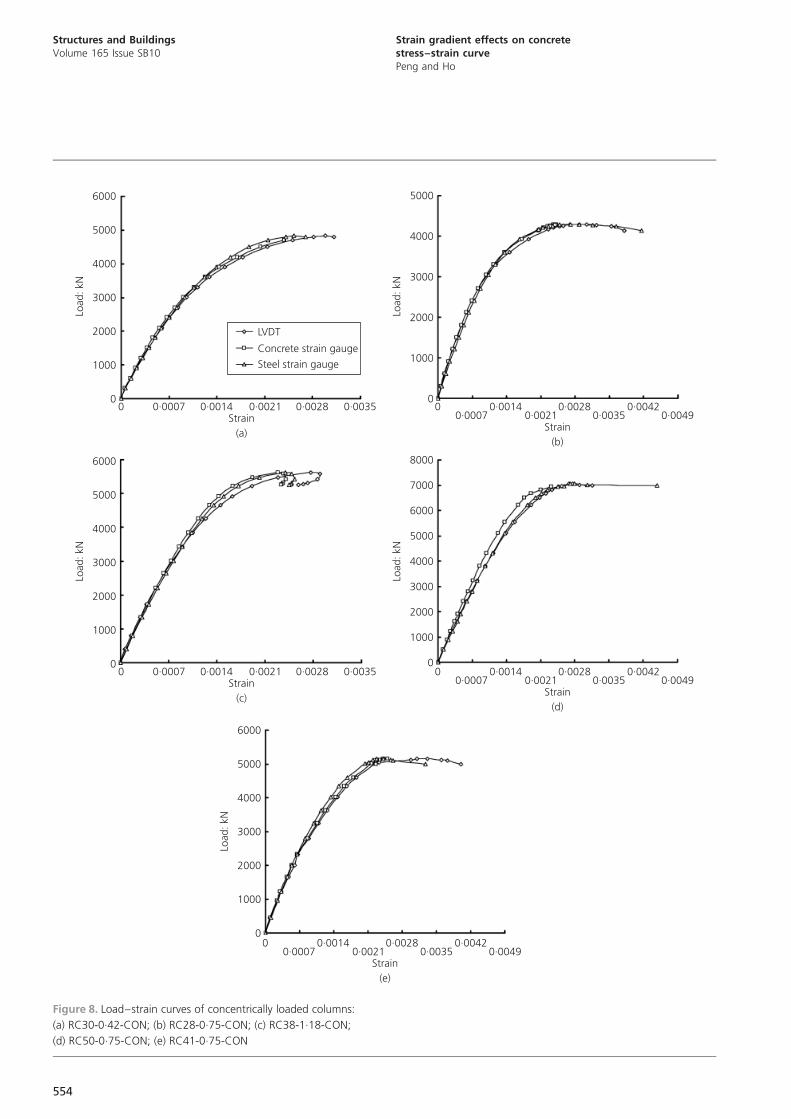
specimens. The strains of concrete were obtained by dividing the
LVDT readings with the gauge length; they show good agreement
with the strains measured by the concrete strain gauges (Figure
8). From Figure 7, it is evident that the concrete compressive
force–displacement and stress–strain curves are fairly linear up
to about 50% of the maximum force (stress). After this, the
displacement (strain) increases more rapidly than the concrete
(a)
(b)
(c)
Figure 3. Loading setup: (a) concentric loading; (b) eccentric
loading; (c) horizontal and axial loading
549
Structures and BuildingsVolume 165 Issue SB10
Strain gradient effects on concretestress–strain curvePeng and Ho
compressive force (stress) due to the rapid degradation of column
stiffness.
3.2 Eccentric/horizontal specimens
The measured concrete compressive forces of the eccentrically
loaded specimens are plotted against actuator-measured vertical
displacements of the column in Figure 9(a). Similarly, the
concrete compressive forces of the RC specimens were obtained
by subtracting the steel forces from the respective total applied
loads. For the specimens tested under horizontal load, the meas-
ured horizontal load is plotted against its lateral drift in Figure
9(b). The maximum moment acting on the eccentrically loaded
specimens was evaluated by multiplying the applied axial load by
the eccentricity; for horizontally loaded specimens, the moment
was obtained by multiplying the horizontal load by the lever arm
(i.e. the vertical distance from the horizontal actuator to the
beam–column interface). With the obtained maximum axial loads
and moments, the concrete stress distribution developed in the
eccentrically and horizontally loaded specimens with strain
gradient effect can be investigated.
4. Derivation of concrete stress blockparameters
4.1 Derivation of stress block parameters k1, k2 and k3
The ratio of the maximum concrete stress developed in flexure to
the concrete cube strength, k3, will be determined by equating the
theoretical axial force and moment with the measured values of
the eccentrically or horizontally loaded specimens. The theor-
etical values can be computed based on the stress–strain curve
obtained from the concentrically loaded specimens multiplied by
k93, which is defined as the ratio of the maximum concrete stress
developed in eccentrically or horizontally loaded specimens to its
uniaxial strength in concentrically loaded columns, to take into
account the effects of strain gradient. Firstly, the uniaxial concrete
stress–strain curve of each concentrically loaded specimen was
obtained by fitting the measured stress and strain data using the
parabolic function
� ¼ A�2 þ B�1:
where � and � are the concrete stress and strain developed in
concentrically loaded specimens, respectively, and A and B are
coefficients obtained from regression analysis. From the definition
of k93, the concrete stress–strain curve developed in eccentrically
or horizontally loaded specimens with strain gradient effect can
be obtained by multiplying both sides of Equation 1 by k93
k93� ¼ k93(A�2 þ B�)2:
where k93� is the concrete stress developed in flexure. The value
of k93 and c for each eccentrically or horizontally loaded specimen
can be determined by considering the axial force (P) and moment
(M) equilibriums of the eccentrically or horizontally loaded
column section, as expressed by Equations 3a and 3b, respec-
tively (compression is taken as positive). Finally, the value of k3
can be determined using Equation 3d.
Small eccentricity and large axial load
( , )M P
Column fails in tension(yielding of steel occurs)
M
θ tan (1/ )/ eccentricity
�� �
�1 ee M P
P
θ
Column fails in compression(no yielding of steel)
Large eccentricity and small axial load
Figure 4. Failure modes and column interaction
550
Structures and BuildingsVolume 165 Issue SB10
Strain gradient effects on concretestress–strain curvePeng and Ho
LVDT rods
Bonding face
2
(1b)1a
2100
(3b)3a
4
Bonding face
Strain gauges
Bonding face7
86
6
340
3030
Horizontal
LVDT(eccentric)
Strain gauge(eccentric)
LVDT & strain gauge(horizontal)
LVDT Straingauge
LVDTand strain
gauge
LVDT rods
1234
5
6
7 8 9 10
11
12
Concentric
14
13
15
16
Strain gauges
2100
300
LVDT rods
1234
5
6
7 8 9 10
11
12
Eccentric
14 131516
Strain gauges21
00
300
Bonding face
Bonding face
Bonding face
17 14
1819 20 21 22
2334
030
30
100 100140
Figure 5. Specimen instrumentation
551
Structures and BuildingsVolume 165 Issue SB10
Strain gradient effects on concretestress–strain curvePeng and Ho
P ¼ð
Ac
k3(A�2 þ B�) dAc þXn
i¼1
f si Asi
3a:
M ¼ð
Ac
k3(A�2 þ B�)h
2� cþ x
� �dAc
þXn
i¼1
f si Asi
h
2� di
� �3b:
� ¼ (x=c)�cu3c:
k3 ¼ k93(�max= f cu)3d:
where Ac is the area of concrete compression zone, x is the
distance of strip dAc from the neutral axis, n is the total number
of steel bars, fs i and As i are, respectively, the stress and area of
the ith steel bar, di is the distance of the ith steel bar from the
extreme concrete compressive fibre, �cu is the ultimate concrete
strain, fcu is the compressive concrete cube strength and �max is
the maximum uniaxial concrete stress obtained from concentri-
cally loaded specimens. The contribution of concrete tensile
stress to the bending moment capacity is neglected because either
the tensile stress of concrete is very small in eccentrically loaded
columns or the lever arm from the neutral axis is very small in
horizontally loaded columns.
Based on the values of k3 and c obtained from Equation 3, k1 and
k2 can be determined from Equations 4a and 4b, respectively
P ¼ k1 k3 f cubc þXn
i¼1
f si Asi
4a:
M ¼ k1 k3 f cubch
2� k2c
� �þXn
i¼1
f si Asi
h
2� di
� �4b:
The obtained values of k1, k2, k3 and c of the eccentrically and
horizontally loaded specimens are listed in Table 4 together with
their corresponding �max, ultimate concrete strain �cu and strain
gradient � ¼ �cu/c (in rad/m). It is evident from the table that
(a) the value of k3 and the product k1k3 increase as � increases,
which verifies the fact that the strain gradient can improve
the maximum concrete stress and concrete force developed in
RC members under flexure
Concretecrushing
Longitudinalsteel buckling
(a)
(b)
(c)
Concretecrushing
Longitudinalsteel buckling
Concretetensioncracking
Figure 6. Selected specimens after failure: (a) RC41-0.75-CON;
(b) RC41-0.75-ECC-1; (c) RC41-0.75-HOR-1
552
Structures and BuildingsVolume 165 Issue SB10
Strain gradient effects on concretestress–strain curvePeng and Ho
(b) the values of k2 are not sensitive to variations in strain
gradient.
The obtained values of k1, k2 and k3 obtained from Equations 3
and 4 were averaged and are compared with values obtained by
other researchers in Table 5 (Hognestad et al., 1955; Kaar et al.,
1978; Mansur et al., 1997; Swartz et al., 1985; Tan and Nguyen,
2004, 2005). The values of k1 and k2 obtained in this study agree
closely with those obtained by others. However, the values of k3
and the product k1k3 are larger than those obtained in other
works. This indicates that the maximum concrete compressive
stress and concrete force that can be developed in RC members
subjected to flexure with or without axial load should be larger
and dependent on strain gradient.
4.2 Derivation of equivalent rectangular stress block
parameters Æ and �The values of Æ and � of the equivalent rectangular concrete
stress block can be evaluated using Equations 5a and 5b by
considering the axial load and moment equilibria in Figure 1(e).
The value of Æ for concentrically loaded specimens can be
evaluated using Equation 5c by considering an equivalent con-
crete stress, Æfcu, acting over the concrete cross-section. For
eccentric loading
P ¼ Æ� f cubc þXn
i¼1
f si Asi
5a:
M ¼ Æ� f cubch
2� �c
2
� �þXn
i¼1
f si Asi
h
2� di
� �5b:
and for concentric loading
P ¼ Æ f cu Ac þXn
i¼1
f si Asi
5c:
Table 6 lists the obtained values of Æ and �, together with the
respective strain gradients � for all specimens. The following
conclusion may be drawn from the obtained results.
(a) The average value of Æ obtained from the concentrically
loaded columns is about 0.71, which is very close to the
design value of Æ ¼ 0.67 stipulated in Eurocode 2 (CEN,
2004) (assuming f 9c ¼ 0.8fcu).
(b) The values of Æ for specimens subjected to a strain gradient
are all larger than 0.67. This implies that strain gradient can
enhance the equivalent concrete stress of RC members
developed in flexure.
(c) The values of Æ for the eccentrically and horizontally loaded
specimens remain fairly constant at low strain gradient, but
increase with moderate strain gradient until reaching a
maximum limit of about Æ � 1.15.
It is evident from the above that the variation of Æ with strain
gradient is not linear and is dependent on the value of the strain
8000
7000
6000
5000
4000
3000
2000
1000
0
Load
: kN
0 2 4 6 8 10 12Vertical displacement of the top of column: mm
0 0·001 0·002 0·003 0·004 0·005Strain
45
40
35
30
25
20
15
10
5
0
Stre
ss: M
Pa
PC35-0-CONRC30-0·42-CONRC28-0·75-CON
RC38-1·18-CONRC50-0·75-CONRC41-0·75-CON
Figure 7. Load–displacement and stress–strain curves of
concentrically loaded specimens
553
Structures and BuildingsVolume 165 Issue SB10
Strain gradient effects on concretestress–strain curvePeng and Ho
6000
5000
4000
3000
2000
1000
0
Load
: kN
LVDT
Concrete strain gauge
Steel strain gauge
0 0·0007 0·0014 0·0021 0·0028 0·0035Strain
(a)
5000
4000
3000
2000
1000
0Lo
ad: k
N0
0·00070·0014
0·00210·0028
0·0035Strain
(b)
0·00420·0049
6000
5000
4000
3000
2000
1000
0
Load
: kN
0 0·0007 0·0014 0·0021 0·0028 0·0035Strain
(c)
5000
4000
3000
2000
1000
0
Load
: kN
00·0007
0·00140·0021
0·00280·0035
Strain(d)
0·00420·0049
6000
7000
8000
5000
4000
3000
2000
1000
0
Load
: kN
00·0007
0·00140·0021
0·00280·0035
Strain(e)
0·00420·0049
6000
Figure 8. Load–strain curves of concentrically loaded columns:
(a) RC30-0.42-CON; (b) RC28-0.75-CON; (c) RC38-1.18-CON;
(d) RC50-0.75-CON; (e) RC41-0.75-CON
554
Structures and BuildingsVolume 165 Issue SB10
Strain gradient effects on concretestress–strain curvePeng and Ho
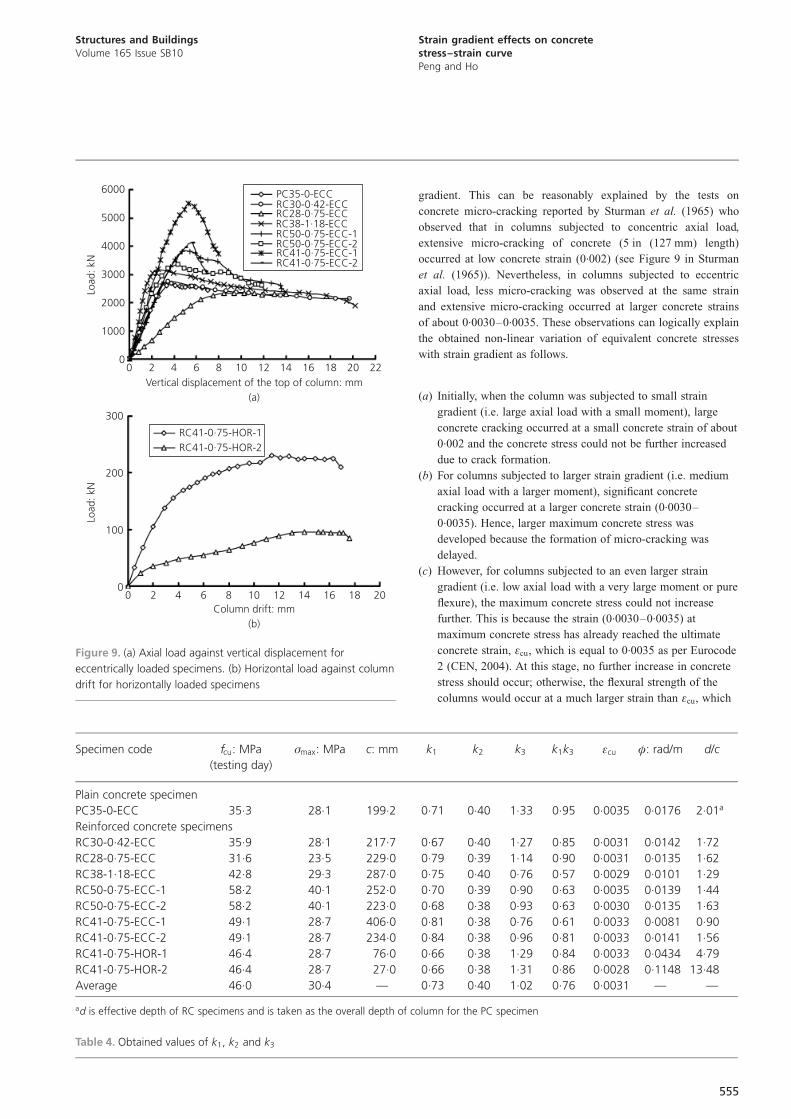
gradient. This can be reasonably explained by the tests on
concrete micro-cracking reported by Sturman et al. (1965) who
observed that in columns subjected to concentric axial load,
extensive micro-cracking of concrete (5 in (127 mm) length)
occurred at low concrete strain (0.002) (see Figure 9 in Sturman
et al. (1965)). Nevertheless, in columns subjected to eccentric
axial load, less micro-cracking was observed at the same strain
and extensive micro-cracking occurred at larger concrete strains
of about 0.0030–0.0035. These observations can logically explain
the obtained non-linear variation of equivalent concrete stresses
with strain gradient as follows.
(a) Initially, when the column was subjected to small strain
gradient (i.e. large axial load with a small moment), large
concrete cracking occurred at a small concrete strain of about
0.002 and the concrete stress could not be further increased
due to crack formation.
(b) For columns subjected to larger strain gradient (i.e. medium
axial load with a larger moment), significant concrete
cracking occurred at a larger concrete strain (0.0030–
0.0035). Hence, larger maximum concrete stress was
developed because the formation of micro-cracking was
delayed.
(c) However, for columns subjected to an even larger strain
gradient (i.e. low axial load with a very large moment or pure
flexure), the maximum concrete stress could not increase
further. This is because the strain (0.0030–0.0035) at
maximum concrete stress has already reached the ultimate
concrete strain, �cu, which is equal to 0.0035 as per Eurocode
2 (CEN, 2004). At this stage, no further increase in concrete
stress should occur; otherwise, the flexural strength of the
columns would occur at a much larger strain than �cu, which
6000
5000
4000
3000
2000
1000
0
Load
: kN
0 2 4 6 8 10 12Vertical displacement of the top of column: mm
(a)
PC35-0-ECCRC30-0·42-ECCRC28-0·75-ECCRC38-1·18-ECCRC50-0·75-ECC-1
RC41-0·75-ECC-1
14 16 18 20 22
RC50-0·75-ECC-2
RC41-0·75-ECC-2
RC41-0·75-HOR-1RC41-0·75-HOR-2
300
200
100
0
Load
: kN
0 2 4 6 8 10 12Column drift: mm
(b)
14 16 18 20
Figure 9. (a) Axial load against vertical displacement for
eccentrically loaded specimens. (b) Horizontal load against column
drift for horizontally loaded specimens
Specimen code fcu: MPa
(testing day)
�max: MPa c: mm k1 k2 k3 k1k3 �cu �: rad/m d/c
Plain concrete specimen
PC35-0-ECC 35.3 28.1 199.2 0.71 0.40 1.33 0.95 0.0035 0.0176 2.01a
Reinforced concrete specimens
RC30-0.42-ECC 35.9 28.1 217.7 0.67 0.40 1.27 0.85 0.0031 0.0142 1.72
RC28-0.75-ECC 31.6 23.5 229.0 0.79 0.39 1.14 0.90 0.0031 0.0135 1.62
RC38-1.18-ECC 42.8 29.3 287.0 0.75 0.40 0.76 0.57 0.0029 0.0101 1.29
RC50-0.75-ECC-1 58.2 40.1 252.0 0.70 0.39 0.90 0.63 0.0035 0.0139 1.44
RC50-0.75-ECC-2 58.2 40.1 223.0 0.68 0.38 0.93 0.63 0.0030 0.0135 1.63
RC41-0.75-ECC-1 49.1 28.7 406.0 0.81 0.38 0.76 0.61 0.0033 0.0081 0.90
RC41-0.75-ECC-2 49.1 28.7 234.0 0.84 0.38 0.96 0.81 0.0033 0.0141 1.56
RC41-0.75-HOR-1 46.4 28.7 76.0 0.66 0.38 1.29 0.84 0.0033 0.0434 4.79
RC41-0.75-HOR-2 46.4 28.7 27.0 0.66 0.38 1.31 0.86 0.0028 0.1148 13.48
Average 46.0 30.4 — 0.73 0.40 1.02 0.76 0.0031 — —
ad is effective depth of RC specimens and is taken as the overall depth of column for the PC specimen
Table 4. Obtained values of k1, k2 and k3
555
Structures and BuildingsVolume 165 Issue SB10
Strain gradient effects on concretestress–strain curvePeng and Ho

has never been observed in previous experimental tests for
unconfined columns.
From the above comparison, it is believed that the current design
codes can predict fairly accurately the strengths of RC columns
subjected to pure axial load without strain gradient, but under-
estimate the strengths of RC beams and columns subjected to
flexure with or without axial load. This is because the equivalent
rectangular concrete stress that is currently adopted for flexural
strength design does not take into account the enhancement of
concrete stress due to the strain gradient effect.
5. Modification of stress block parametersby incorporating strain gradient effects
The stress block parameters of k1, k2, k3, Æ and � obtained
in this study are summarised in Tables 4 and 6, together with
their corresponding strain gradients � ¼ �cu/c (rad/m). How-
ever, since � is non-dimensionless, the formula that correlates
these stress block parameters to � will include the effect of
Research f 9c: MPa k1 k2 k3 k1k3
Hognestad et al. (1955) 27.6 0.79 0.45 0.94 0.74
Hognestad et al. (1955) 34.5 0.75 0.44 0.92 0.69
Kaar et al. (1978) 45.0 0.72 0.40 0.97 0.70
Mansur et al. (1997) 57.2 0.70 0.42 0.98 0.69
Swartz et al. (1985) 57.0 0.71 0.42 0.98 0.70
Tan and Nguyen (2004, 2005) 48.3 0.70 0.38 0.93 0.65
Current work 46.0a 0.73 0.40 1.02 0.76
afcu (in MPa)
Table 5. Comparisons of k1, k2 and k3
Specimen code Æ � �cu �: rad/m d/c
PC35-0-CON 0.80 — — 0.0 0.0
RC30-0.42-CON 0.66 — — 0.0 0.0
RC28-0.75-CON 0.70 — — 0.0 0.0
RC38-1.18-CON 0.68 — — 0.0 0.0
RC50-0.75-CON 0.76 — — 0.0 0.0
RC41-0.75-CON 0.68 — — 0.0 0.0
Average 0.71 — — 0.0 0.0
PC35-0-ECC 1.18 0.80 0.0035 0.0176 2.01a
RC30-0.42-ECC 1.06 0.81 0.0031 0.0142 1.72
RC28-0.75-ECC 1.15 0.78 0.0031 0.0135 1.62
RC38-1.18-ECC 0.72 0.79 0.0029 0.0101 1.29
RC50-0.75-ECC-1 0.80 0.79 0.0035 0.0139 1.44
RC50-0.75-ECC-2 0.82 0.77 0.0030 0.0135 1.63
RC41-0.75-ECC-1 0.80 0.76 0.0033 0.0081 0.90
RC41-0.75-ECC-2 1.07 0.76 0.0033 0.0141 1.56
RC41-0.75-HOR-1 1.10 0.77 0.0033 0.0434 4.79
RC41-0.75-HOR-2 1.15 0.75 0.0028 0.1148 13.48
Average — 0.78 0.0031 — —
ad is effective depth of RC specimens and is taken as the overall depth of column for thePC specimen
Table 6. Obtained values of equivalent rectangular stress block
parameters and strain gradient
556
Structures and BuildingsVolume 165 Issue SB10
Strain gradient effects on concretestress–strain curvePeng and Ho

column dimensions. In order to eliminate the column size
effect, a dimensionless factor, d/c, is proposed to replace � to
represent strain gradient, where d and c are effective and
neutral axis depths respectively. To investigate the relationships
of k1, k2, k3, Æ and � with strain gradient in dimensionless
form, the values of these parameters obtained in the present
study are plotted against d/c in Figures 10 and 11. It is
apparent from Figures 10(a), 10(b) and 11(b) that k1, k2 and
� remain fairly constant at 0.73, 0.40 and 0.80, respectively.
However, Figures 10(c) and 11(a) show that k3 and Æ increase
with strain gradient in a tri-linear manner. Two formulas are
thus proposed to correlate k3 and Æ with strain gradient using
linear regression analysis
k3 ¼0:76 for 0 < d=c , 1:3
0:77(d=c)� 0:24 for 1:3 < d=c , 2:0
1:3 for 2:0 < d=c
8>><>>:
6:
Æ ¼0:67 for 0 < d=c , 1:3
0:69(d=c)� 0:23 for 1:3 < d=c , 2:0
1:15 for 2:0 < d=c
::
8>><>>:
7:
For the obtained value of k2 ¼ 0.40, the following fixed value of
� is proposed
� ¼ 2k2 ¼ 2 3 0:4 ¼ 0:88:
From Table 4, the value of ultimate concrete strain for design is
taken as �cu ¼ 0.0031.
0·76
0·77( / ) 0·24
1·3
d c �
⎧⎨⎩
for 0 � d c
d c
d c
/ 1·3
for 1·3 / 2·0
for 2·0 /
�
� �
�
1·5
1·2
0·9
0·6
0·3
0
k 1
0 5 10 15(a)
k1 0·73�
1·5
1·2
0·9
0·6
0·3
0
k 2
0 5 10 15(b)
k2 0·4�
1·5
1·2
0·9
0·6
0·3
0
k 3
0 5 10 15(c)
k3 �
Figure 10. Relationships of k1, k2 and k3 with strain gradient d/c
0·67
0·69( / ) 0·23
1·15
d c �
⎧⎨⎩
for 0 � d c
d c
d c
/ 1·3
for 1·3 / 2·0
for 2·0 /
�
� �
�
1·5
1·2
0·9
0·6
0·3
0
�
0 5 10 15(b)
� 0·8�
1·5
1·2
0·9
0·6
0·3
0
α
0 5 10 15d c/(a)
α �
Figure 11. Relationships of Æ and � with strain gradient d/c
557
Structures and BuildingsVolume 165 Issue SB10
Strain gradient effects on concretestress–strain curvePeng and Ho
Specimen code f 9c ¼ 0.8fcu: MPa Moment: kNm(1)
(5)
(2)
(5)
(3)
(5)
(4)
(5)
Mp
(1)
MACI
(2)
MEC
(3)
MNZ
(4)
Mt
(5)
Pecce and Fabbrocino (1999)
A 41.3 103.8 97.0 97.0 97.0 104.0 1.00 0.93 0.93 0.93
B 41.3 46.8 45.0 45.0 45.0 49.6 0.94 0.91 0.91 0.91
C 42.3 693.4 636.7 636.7 636.7 712.5 0.97 0.89 0.89 0.89
Ashour (2000)
B-N2 48.6 55.4 53.6 53.6 53.6 58.2 0.95 0.92 0.92 0.92
B-N3 48.6 81.1 77.1 77.1 77.1 80.6 1.01 0.96 0.96 0.96
B-N4 48.6 105.6 98.4 98.4 98.4 99.6 1.06 0.99 0.99 0.99
Pam et al. (2001)
1 29.9 58.3 56.1 56.1 56.1 77.6 0.75 0.72 0.72 0.72
2 29.4 85.0 80 80.0 80 103.5 0.82 0.77 0.77 0.77
3 29.1 128.5 114.1 111.5 114.1 126.5 1.02 0.90 0.88 0.90
4 33.8 122.6 112.0 112.7 112.0 129.0 0.95 0.87 0.87 0.87
5 37.1 148.4 133.8 134.8 133.8 142.8 1.04 0.94 0.94 0.94
6 34.6 173.9 144.8 139.6 144.8 162.0 1.07 0.89 0.86 0.89
7 46.9 158.4 145.7 162.3 145.7 164.6 0.96 0.89 0.89 0.89
8 45.7 176.8 160.6 161.4 160.6 166.2 1.06 0.97 0.97 0.97
Debernardi and Taliano (2002)
T1 27.7 11.1 10.8 10.8 10.8 13.6 0.82 0.79 0.79 0.79
T2 27.7 21.3 20.5 20.6 20.5 23.6 0.90 0.87 0.87 0.87
T3 27.7 30.9 28.9 29.3 28.9 32.5 0.95 0.89 0.90 0.89
T4 27.7 48.7 46.9 46.8 46.9 59.8 0.81 0.78 0.78 0.78
T5 27.7 92.6 93.1 93.1 93.1 107.5 0.86 0.87 0.87 0.87
T6 27.7 176.9 170.5 171.2 170.5 192.4 0.92 0.89 0.89 0.89
T7 27.7 242.0 217.2 221.7 217.2 221.6 1.09 0.98 1.00 0.98
T8 27.7 81.4 81.1 81.2 81.1 93.9 0.87 0.86 0.86 0.86
T9 27.7 152.0 152.0 151.9 152.0 182.7 0.83 0.83 0.83 0.83
T10 27.7 322.9 324.6 324.7 324.6 330.4 0.98 0.98 0.98 0.98
Lam et al. (2008)
L-C1 29.8 15.0 14.6 14.6 14.6 14.2 1.06 1.03 1.03 1.03
L-D 29.8 10.1 9.8 9.8 9.8 11.6 0.87 0.84 0.84 0.84
L-E 29.8 30.1 25.9 26.0 25.9 29.4 1.02 0.88 0.89 0.88
Fathifazl et al. (2009)
EV-1.5N 43.5 83.4 79.4 79.5 79.4 86.9 0.96 0.91 0.91 0.91
EV-2.7N 43.5 113.4 108.3 108.4 108.3 126.4 0.90 0.86 0.86 0.86
CG-2.7N 43.5 112.9 106.3 106.3 106.3 118.5 0.95 0.90 0.90 0.90
Average 0.95 0.89 0.90 0.89
Table 7. Proposed strength comparisons of beams
558
Structures and BuildingsVolume 165 Issue SB10
Strain gradient effects on concretestress–strain curvePeng and Ho
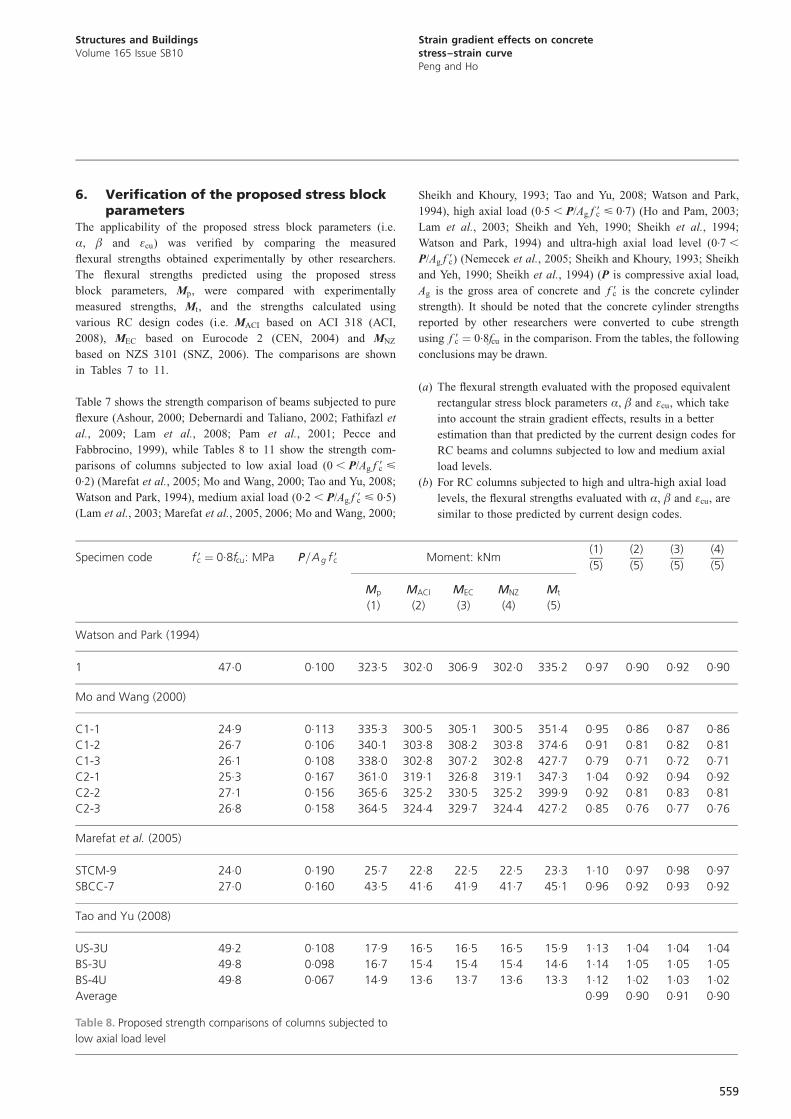
6. Verification of the proposed stress blockparameters
The applicability of the proposed stress block parameters (i.e.
Æ, � and �cu) was verified by comparing the measured
flexural strengths obtained experimentally by other researchers.
The flexural strengths predicted using the proposed stress
block parameters, Mp, were compared with experimentally
measured strengths, Mt, and the strengths calculated using
various RC design codes (i.e. MACI based on ACI 318 (ACI,
2008), MEC based on Eurocode 2 (CEN, 2004) and MNZ
based on NZS 3101 (SNZ, 2006). The comparisons are shown
in Tables 7 to 11.
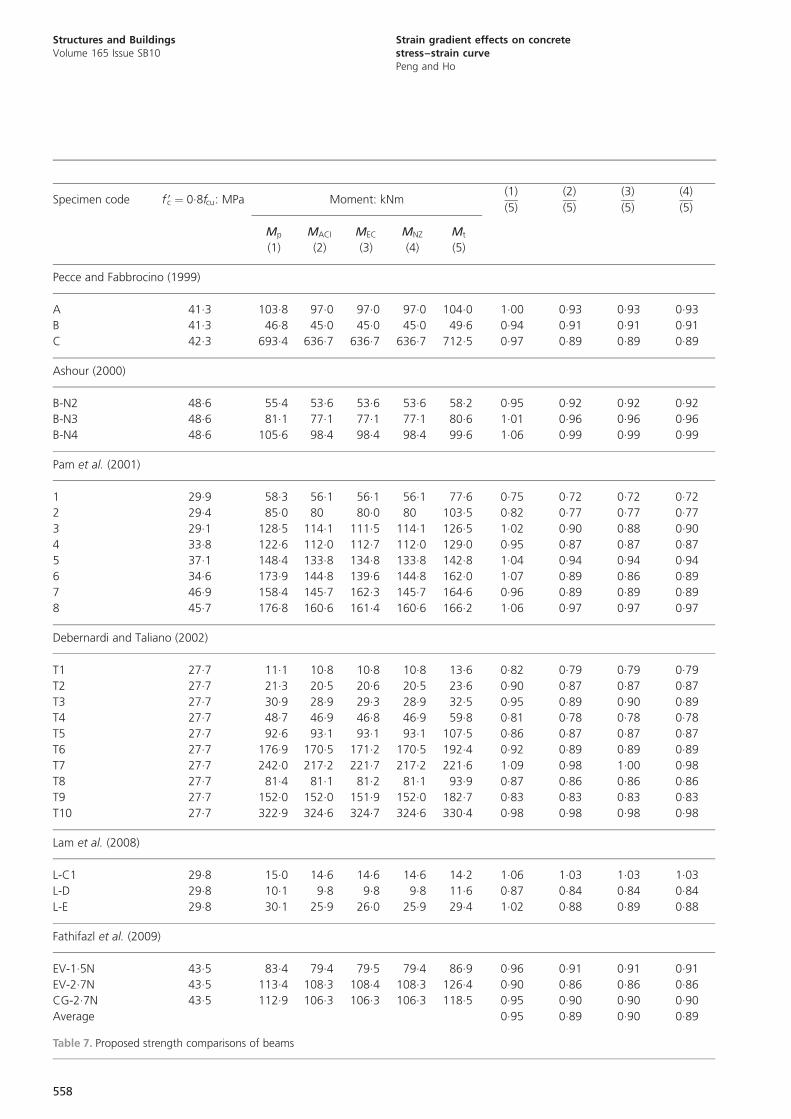
Table 7 shows the strength comparison of beams subjected to pure
flexure (Ashour, 2000; Debernardi and Taliano, 2002; Fathifazl et
al., 2009; Lam et al., 2008; Pam et al., 2001; Pecce and
Fabbrocino, 1999), while Tables 8 to 11 show the strength com-
parisons of columns subjected to low axial load (0 , P/Ag f 9c <
0.2) (Marefat et al., 2005; Mo and Wang, 2000; Tao and Yu, 2008;
Watson and Park, 1994), medium axial load (0.2 , P/Ag f 9c < 0.5)
(Lam et al., 2003; Marefat et al., 2005, 2006; Mo and Wang, 2000;
Sheikh and Khoury, 1993; Tao and Yu, 2008; Watson and Park,
1994), high axial load (0.5 , P/Ag f 9c < 0.7) (Ho and Pam, 2003;
Lam et al., 2003; Sheikh and Yeh, 1990; Sheikh et al., 1994;
Watson and Park, 1994) and ultra-high axial load level (0.7 ,
P/Ag f 9c) (Nemecek et al., 2005; Sheikh and Khoury, 1993; Sheikh
and Yeh, 1990; Sheikh et al., 1994) (P is compressive axial load,
Ag is the gross area of concrete and f 9c is the concrete cylinder
strength). It should be noted that the concrete cylinder strengths
reported by other researchers were converted to cube strength
using f 9c ¼ 0.8fcu in the comparison. From the tables, the following
conclusions may be drawn.
(a) The flexural strength evaluated with the proposed equivalent
rectangular stress block parameters Æ, � and �cu, which take
into account the strain gradient effects, results in a better
estimation than that predicted by the current design codes for
RC beams and columns subjected to low and medium axial
load levels.
(b) For RC columns subjected to high and ultra-high axial load
levels, the flexural strengths evaluated with Æ, � and �cu, are
similar to those predicted by current design codes.
Specimen code f 9c ¼ 0.8fcu: MPa P=Ag f 9c Moment: kNm(1)
(5)
(2)
(5)
(3)
(5)
(4)
(5)
Mp
(1)
MACI
(2)
MEC
(3)
MNZ
(4)
Mt
(5)
Watson and Park (1994)
1 47.0 0.100 323.5 302.0 306.9 302.0 335.2 0.97 0.90 0.92 0.90
Mo and Wang (2000)
C1-1 24.9 0.113 335.3 300.5 305.1 300.5 351.4 0.95 0.86 0.87 0.86
C1-2 26.7 0.106 340.1 303.8 308.2 303.8 374.6 0.91 0.81 0.82 0.81
C1-3 26.1 0.108 338.0 302.8 307.2 302.8 427.7 0.79 0.71 0.72 0.71
C2-1 25.3 0.167 361.0 319.1 326.8 319.1 347.3 1.04 0.92 0.94 0.92
C2-2 27.1 0.156 365.6 325.2 330.5 325.2 399.9 0.92 0.81 0.83 0.81
C2-3 26.8 0.158 364.5 324.4 329.7 324.4 427.2 0.85 0.76 0.77 0.76
Marefat et al. (2005)
STCM-9 24.0 0.190 25.7 22.8 22.5 22.5 23.3 1.10 0.97 0.98 0.97
SBCC-7 27.0 0.160 43.5 41.6 41.9 41.7 45.1 0.96 0.92 0.93 0.92
Tao and Yu (2008)
US-3U 49.2 0.108 17.9 16.5 16.5 16.5 15.9 1.13 1.04 1.04 1.04
BS-3U 49.8 0.098 16.7 15.4 15.4 15.4 14.6 1.14 1.05 1.05 1.05
BS-4U 49.8 0.067 14.9 13.6 13.7 13.6 13.3 1.12 1.02 1.03 1.02
Average 0.99 0.90 0.91 0.90
Table 8. Proposed strength comparisons of columns subjected to
low axial load level
559
Structures and BuildingsVolume 165 Issue SB10
Strain gradient effects on concretestress–strain curvePeng and Ho
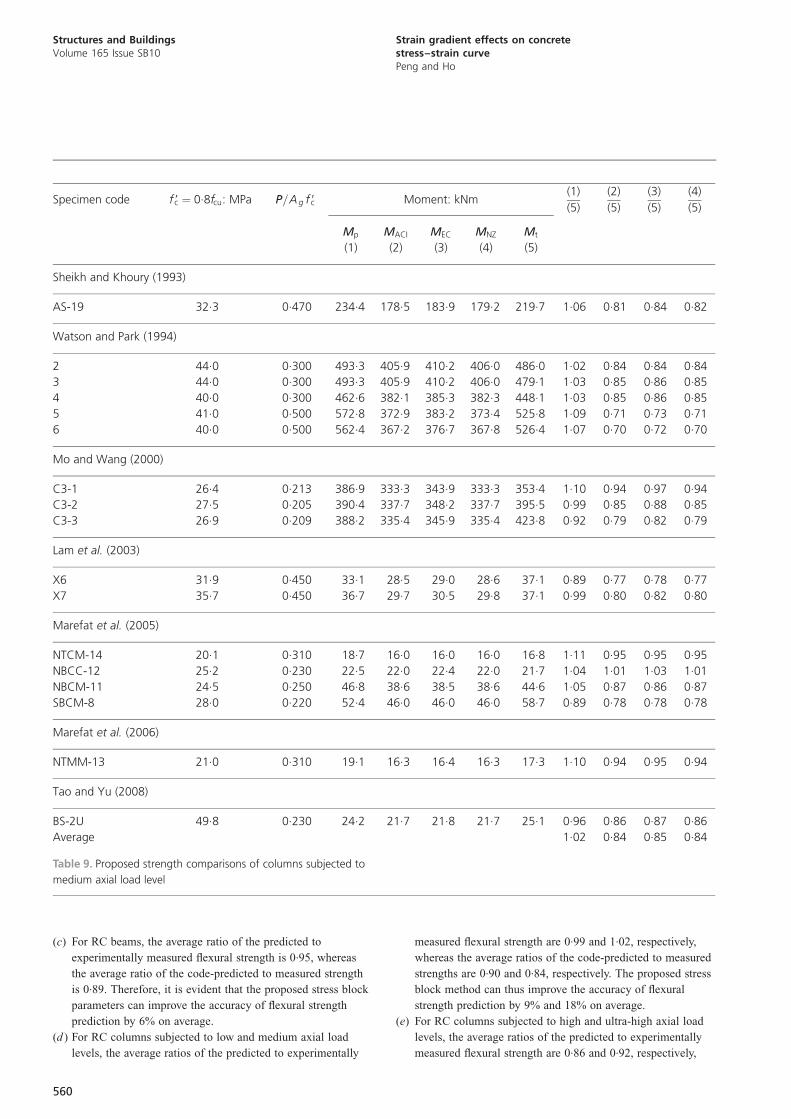
(c) For RC beams, the average ratio of the predicted to
experimentally measured flexural strength is 0.95, whereas
the average ratio of the code-predicted to measured strength
is 0.89. Therefore, it is evident that the proposed stress block
parameters can improve the accuracy of flexural strength
prediction by 6% on average.
(d ) For RC columns subjected to low and medium axial load
levels, the average ratios of the predicted to experimentally
measured flexural strength are 0.99 and 1.02, respectively,
whereas the average ratios of the code-predicted to measured
strengths are 0.90 and 0.84, respectively. The proposed stress
block method can thus improve the accuracy of flexural
strength prediction by 9% and 18% on average.
(e) For RC columns subjected to high and ultra-high axial load
levels, the average ratios of the predicted to experimentally
measured flexural strength are 0.86 and 0.92, respectively,
Specimen code f 9c ¼ 0.8fcu: MPa P=Ag f 9c Moment: kNm(1)
(5)
(2)
(5)
(3)
(5)
(4)
(5)
Mp
(1)
MACI
(2)
MEC
(3)
MNZ
(4)
Mt
(5)
Sheikh and Khoury (1993)
AS-19 32.3 0.470 234.4 178.5 183.9 179.2 219.7 1.06 0.81 0.84 0.82
Watson and Park (1994)
2 44.0 0.300 493.3 405.9 410.2 406.0 486.0 1.02 0.84 0.84 0.84
3 44.0 0.300 493.3 405.9 410.2 406.0 479.1 1.03 0.85 0.86 0.85
4 40.0 0.300 462.6 382.1 385.3 382.3 448.1 1.03 0.85 0.86 0.85
5 41.0 0.500 572.8 372.9 383.2 373.4 525.8 1.09 0.71 0.73 0.71
6 40.0 0.500 562.4 367.2 376.7 367.8 526.4 1.07 0.70 0.72 0.70
Mo and Wang (2000)
C3-1 26.4 0.213 386.9 333.3 343.9 333.3 353.4 1.10 0.94 0.97 0.94
C3-2 27.5 0.205 390.4 337.7 348.2 337.7 395.5 0.99 0.85 0.88 0.85
C3-3 26.9 0.209 388.2 335.4 345.9 335.4 423.8 0.92 0.79 0.82 0.79
Lam et al. (2003)
X6 31.9 0.450 33.1 28.5 29.0 28.6 37.1 0.89 0.77 0.78 0.77
X7 35.7 0.450 36.7 29.7 30.5 29.8 37.1 0.99 0.80 0.82 0.80
Marefat et al. (2005)
NTCM-14 20.1 0.310 18.7 16.0 16.0 16.0 16.8 1.11 0.95 0.95 0.95
NBCC-12 25.2 0.230 22.5 22.0 22.4 22.0 21.7 1.04 1.01 1.03 1.01
NBCM-11 24.5 0.250 46.8 38.6 38.5 38.6 44.6 1.05 0.87 0.86 0.87
SBCM-8 28.0 0.220 52.4 46.0 46.0 46.0 58.7 0.89 0.78 0.78 0.78
Marefat et al. (2006)
NTMM-13 21.0 0.310 19.1 16.3 16.4 16.3 17.3 1.10 0.94 0.95 0.94
Tao and Yu (2008)
BS-2U 49.8 0.230 24.2 21.7 21.8 21.7 25.1 0.96 0.86 0.87 0.86
Average 1.02 0.84 0.85 0.84
Table 9. Proposed strength comparisons of columns subjected to
medium axial load level
560
Structures and BuildingsVolume 165 Issue SB10
Strain gradient effects on concretestress–strain curvePeng and Ho
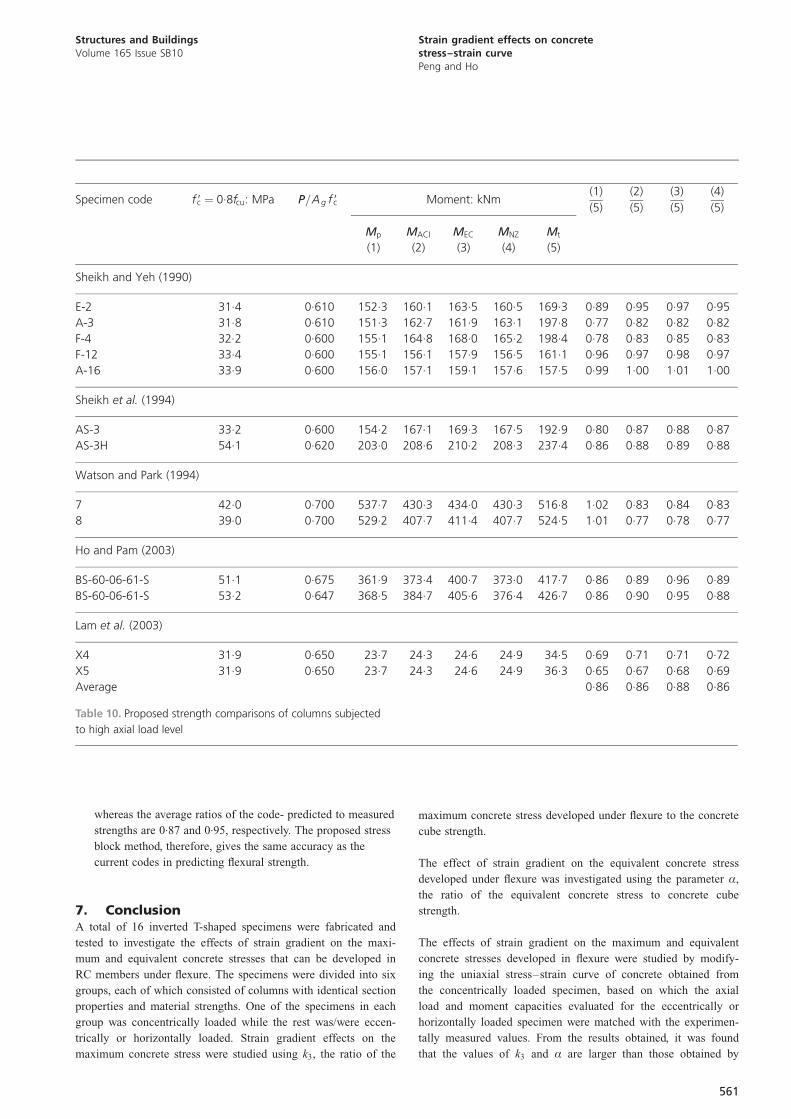
whereas the average ratios of the code- predicted to measured
strengths are 0.87 and 0.95, respectively. The proposed stress
block method, therefore, gives the same accuracy as the
current codes in predicting flexural strength.
7. ConclusionA total of 16 inverted T-shaped specimens were fabricated and
tested to investigate the effects of strain gradient on the maxi-
mum and equivalent concrete stresses that can be developed in
RC members under flexure. The specimens were divided into six
groups, each of which consisted of columns with identical section
properties and material strengths. One of the specimens in each
group was concentrically loaded while the rest was/were eccen-
trically or horizontally loaded. Strain gradient effects on the
maximum concrete stress were studied using k3, the ratio of the
maximum concrete stress developed under flexure to the concrete
cube strength.
The effect of strain gradient on the equivalent concrete stress
developed under flexure was investigated using the parameter Æ,
the ratio of the equivalent concrete stress to concrete cube
strength.
The effects of strain gradient on the maximum and equivalent
concrete stresses developed in flexure were studied by modify-
ing the uniaxial stress–strain curve of concrete obtained from
the concentrically loaded specimen, based on which the axial
load and moment capacities evaluated for the eccentrically or
horizontally loaded specimen were matched with the experimen-
tally measured values. From the results obtained, it was found
that the values of k3 and Æ are larger than those obtained by
Specimen code f 9c ¼ 0.8fcu: MPa P=Ag f 9c Moment: kNm(1)
(5)
(2)
(5)
(3)
(5)
(4)
(5)
Mp
(1)
MACI
(2)
MEC
(3)
MNZ
(4)
Mt
(5)
Sheikh and Yeh (1990)
E-2 31.4 0.610 152.3 160.1 163.5 160.5 169.3 0.89 0.95 0.97 0.95
A-3 31.8 0.610 151.3 162.7 161.9 163.1 197.8 0.77 0.82 0.82 0.82
F-4 32.2 0.600 155.1 164.8 168.0 165.2 198.4 0.78 0.83 0.85 0.83
F-12 33.4 0.600 155.1 156.1 157.9 156.5 161.1 0.96 0.97 0.98 0.97
A-16 33.9 0.600 156.0 157.1 159.1 157.6 157.5 0.99 1.00 1.01 1.00
Sheikh et al. (1994)
AS-3 33.2 0.600 154.2 167.1 169.3 167.5 192.9 0.80 0.87 0.88 0.87
AS-3H 54.1 0.620 203.0 208.6 210.2 208.3 237.4 0.86 0.88 0.89 0.88
Watson and Park (1994)
7 42.0 0.700 537.7 430.3 434.0 430.3 516.8 1.02 0.83 0.84 0.83
8 39.0 0.700 529.2 407.7 411.4 407.7 524.5 1.01 0.77 0.78 0.77
Ho and Pam (2003)
BS-60-06-61-S 51.1 0.675 361.9 373.4 400.7 373.0 417.7 0.86 0.89 0.96 0.89
BS-60-06-61-S 53.2 0.647 368.5 384.7 405.6 376.4 426.7 0.86 0.90 0.95 0.88
Lam et al. (2003)
X4 31.9 0.650 23.7 24.3 24.6 24.9 34.5 0.69 0.71 0.71 0.72
X5 31.9 0.650 23.7 24.3 24.6 24.9 36.3 0.65 0.67 0.68 0.69
Average 0.86 0.86 0.88 0.86
Table 10. Proposed strength comparisons of columns subjected
to high axial load level
561
Structures and BuildingsVolume 165 Issue SB10
Strain gradient effects on concretestress–strain curvePeng and Ho
previous researchers and those specified in current RC design
codes. More importantly, it was found that k3 and Æ are
dependent on strain gradient but the variations are non-linear.
The values of k3 and Æ remain relatively constant at low strain
gradient, but increase significantly with moderate strain gradient
until they reach the maximum limits of about 1.3 and 1.15
respectively. It was also found that the values of Æ for
concentrically loaded columns are very similar to those speci-
fied in the current design codes.
Based on the obtained values of k3 and Æ, empirical formulas
were proposed for k3 and Æ that incorporate strain gradient
effects; the values of the other stress block parameters, k1, k2, �and �cu, were found to remain relatively constant at about 0.73,
0.40, 0.80 and 0.0031 respectively. In order to verify the
applicability of the proposed equivalent rectangular stress block
parameters, they were used to predict the flexural strengths of RC
beams and columns subjected to various axial load levels in tests
carried out by previous researchers. The predicted strengths were
compared with experimental strengths and theoretical strengths
calculated using current RC design codes. The comparisons show
that the proposed strain-gradient-dependent equivalent concrete
stress block is more accurate in predictions of the flexural
strength of RC beams and columns subjected to low and medium
axial load levels than current codes. The improvements are 6%
for RC beams and 18% for columns subjected to a medium axial
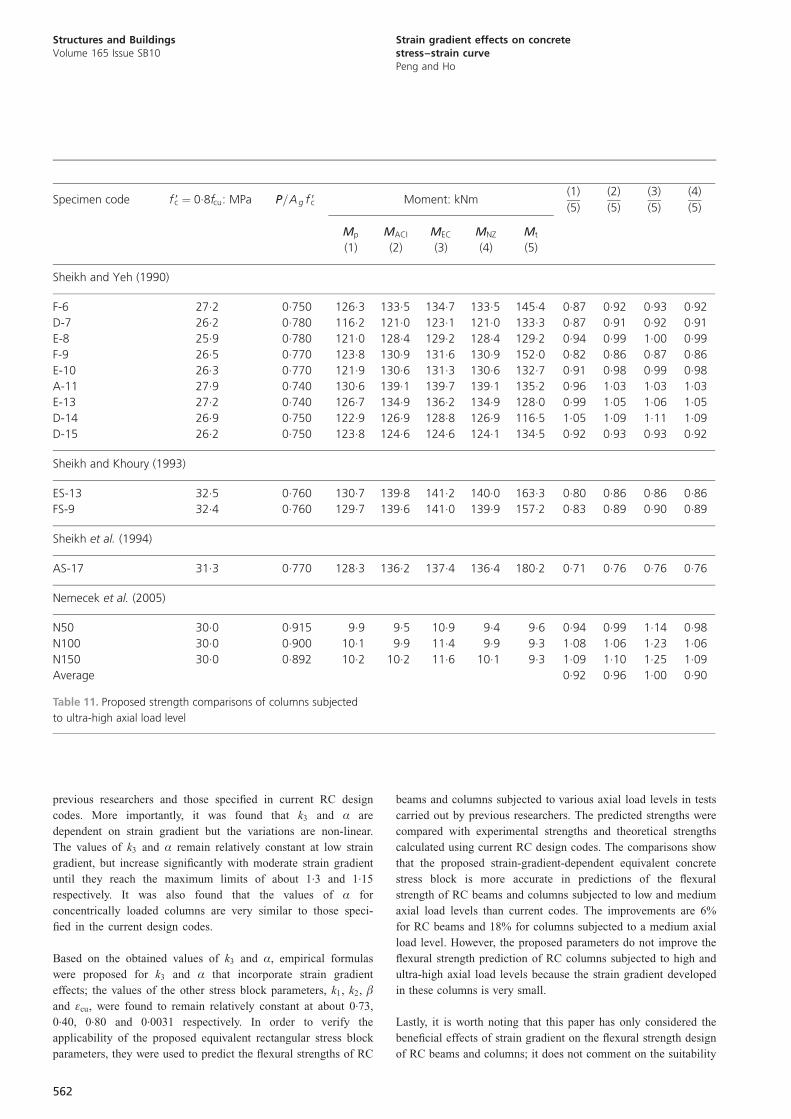
load level. However, the proposed parameters do not improve the
flexural strength prediction of RC columns subjected to high and
ultra-high axial load levels because the strain gradient developed
in these columns is very small.
Lastly, it is worth noting that this paper has only considered the
beneficial effects of strain gradient on the flexural strength design
of RC beams and columns; it does not comment on the suitability
Specimen code f 9c ¼ 0.8fcu: MPa P=Ag f 9c Moment: kNm(1)
(5)
(2)
(5)
(3)
(5)
(4)
(5)
Mp
(1)
MACI
(2)
MEC
(3)
MNZ
(4)
Mt
(5)
Sheikh and Yeh (1990)
F-6 27.2 0.750 126.3 133.5 134.7 133.5 145.4 0.87 0.92 0.93 0.92
D-7 26.2 0.780 116.2 121.0 123.1 121.0 133.3 0.87 0.91 0.92 0.91
E-8 25.9 0.780 121.0 128.4 129.2 128.4 129.2 0.94 0.99 1.00 0.99
F-9 26.5 0.770 123.8 130.9 131.6 130.9 152.0 0.82 0.86 0.87 0.86
E-10 26.3 0.770 121.9 130.6 131.3 130.6 132.7 0.91 0.98 0.99 0.98
A-11 27.9 0.740 130.6 139.1 139.7 139.1 135.2 0.96 1.03 1.03 1.03
E-13 27.2 0.740 126.7 134.9 136.2 134.9 128.0 0.99 1.05 1.06 1.05
D-14 26.9 0.750 122.9 126.9 128.8 126.9 116.5 1.05 1.09 1.11 1.09
D-15 26.2 0.750 123.8 124.6 124.6 124.1 134.5 0.92 0.93 0.93 0.92
Sheikh and Khoury (1993)
ES-13 32.5 0.760 130.7 139.8 141.2 140.0 163.3 0.80 0.86 0.86 0.86
FS-9 32.4 0.760 129.7 139.6 141.0 139.9 157.2 0.83 0.89 0.90 0.89
Sheikh et al. (1994)
AS-17 31.3 0.770 128.3 136.2 137.4 136.4 180.2 0.71 0.76 0.76 0.76
Nemecek et al. (2005)
N50 30.0 0.915 9.9 9.5 10.9 9.4 9.6 0.94 0.99 1.14 0.98
N100 30.0 0.900 10.1 9.9 11.4 9.9 9.3 1.08 1.06 1.23 1.06
N150 30.0 0.892 10.2 10.2 11.6 10.1 9.3 1.09 1.10 1.25 1.09
Average 0.92 0.96 1.00 0.90
Table 11. Proposed strength comparisons of columns subjected
to ultra-high axial load level
562
Structures and BuildingsVolume 165 Issue SB10
Strain gradient effects on concretestress–strain curvePeng and Ho
of implementing the proposed equations on Æ and � in existing
design codes. This is because the current study did not consider
any variability (e.g. material strength) and uncertainty, which
should also be taken into account when establishing design
clauses.
AcknowledgementsA research grant from the Seed Funding Programme for Basic
Research (account code 10401445) of The University of Hong
Kong (HKU) for the work presented here is gratefully acknowl-
edged. The authors gratefully thank the Department of Civil and
Structural Engineering, Hong Kong Polytechnic University
(PolyU), where most of the experimental tests were conducted.
The support of the technical staff in the structural laboratory of
PolyU and the Department of Civil Engineering of HKU is also
greatly appreciated.
REFERENCES
ACI (American Concrete Institute) (2008) ACI 318: Building
code requirements for reinforced concrete and commentary
ACI 318M-08. ACI, Farmington Hills, MI, USA.
Ahn JM and Shin SW (2007) An evaluation of ductility of
high-strength reinforced concrete columns subjected to
reverse cyclic loads under axial compression. Magazine of
Concrete Research 59(1): 29–44.
Ashour SA (2000) Effect of compressive strength and tensile
reinforcement ratio on flexural behaviour of high-strength
concrete beams. Engineering Structures 25(8): 1083–1096.
Arslan G (2010) Shear strength of reinforced concrete slender
beams. Proceedings of the Institution of Civil Engineers –
Structures and Buildings 163(3): 195–205.
Arslan MH, Yuksel I and Kaltakci MY (2010) An investigation on
global ductility of strengthened RC frames, Proceedings of
the Institution of Civil Engineers – Structures and Buildings
163(3): 177–194.
Baczkowski BJ and Kuang JS (2008) A new approach to testing
concrete coupling beams subjected to reversed cyclic loading.
Magazine of Concrete Research 60(4): 301–309.
Bai ZZ and Au FTK (2008) Ductility of symmetrically reinforced
concrete columns. Magazine of Concrete Research 61(5):
345–357.
Bukhari IA, Vollum RL, Ahmad S and Sagaseta J (2010) Shear
strengthening of reinforced concrete beams with CFRP.
Magazine of Concrete Research 62(1): 65–77.
CEN (European Committee for Standardization) (2004) BS EN
1992: Eurocode 2: Design of concrete structures. Part 1-1:
general rules and rules for buildings. CEN, Brussels,
Belgium.
Chen Y and May IM (2009) Reinforced concrete members under
drop-weight impacts. Proceedings of the Institution of Civil
Engineers – Structures and Buildings 162(1): 45–56.
Choi E, Park J, Nam TH and Yoon SJ (2009) A new steel jacketing
method for RC columns. Magazine of Concrete Research
61(10): 787–796.
Clark LE, Gerstle KH and Tulin LG (1967) Effect of strain gradient
on the stress–strain curve of mortar and concrete. ACI
Journal 64(50): 580–586.
Debernardi PG and Taliano M (2002) On evaluation of rotation
capacity for reinforced concrete beams. ACI Structural
Journal 99(3): 360–368.
Do Carmo RNF and Lopes SM (2006) Required plastic rotation of
RC beams. Proceedings of the Institution of Civil Engineers
– Structures and Buildings 159(2): 77–85.
Fathifazl G, Razaqpur AG, Isgor OB et al. (2009) Shear strength
of reinforced recycled concrete beams without stirrups.
Magazine of Concrete Research 61(7): 477–490.
Han TH, Stallings JM, Cho SK and Kang YJ (2010) Behaviour of a
hollow RC column with an internal tube. Magazine of
Concrete Research 62(1): 25–38.
Ho JCM and Pam HJ (2003) Influence of transverse steel
configuration on post-elastic behaviour of
high-strength reinforced concrete columns. Transactions of
the Hong Kong Institution of Engineers 10(2): 1–9.
Ho JCM and Pam HJ (2010) Deformability evaluation of high-
strength reinforced concrete columns. Magazine of Concrete
Research 62(8): 569–583.
Hognestad E (1957) Confirmation of inelastic stress distribution
in concrete. Proceedings of ASCE 83(2): 1–17.
Hognestad E, Hanson NW and McHenry D (1955) Concrete stress
distribution in ultimate strength design. ACI Journal 52(4):
455–479.
Ibrahim HHH and MacGregor JG (1996) Flexural behavior of
laterally reinforced high-strength concrete sections. ACI
Structural Journal 93(6): 674–684.
Ibrahim HHH and MacGregor JG (1997) Modification of the ACI
rectangular stress block for high-strength concrete. ACI
Structural Journal 94(1): 40–48.
Inel M, Aschheim MA and Pantazopoulou SJ (2007) Seismic
deformation capacity indices for concrete columns: model
estimates and experimental results. Magazine of Concrete
Research 59(4): 297–310.
Inel M, Bilgin H and Ozmen HB (2008) Seismic capacity
evaluation of school buildings in Turkey. Proceedings of the
Institution of Civil Engineers – Structures and Buildings
161(3): 147–159.
Jaafar K (2008) Shear behaviour of reinforced concrete beams
with confinement near plastic hinges. Magazine of Concrete
Research 60(9): 665–672.
Jones J and Fraser R (2009) Ship impact on concrete offshore
platform legs. Proceedings of the Institution of Civil
Engineers – Structures and Buildings 162(1): 21–25.
Kaar PH, Hanson NW and Capell HT (1978) Stress–strain
characteristics of high strength concrete. Douglas McHenry
International Symposium on Concrete and Concrete
Structures. American Concrete Institute, Farmington Hills,
MI, USA, pp. 161–185.
Kim TH, Kim YJ and Shin HM (2007) Seismic performance
assessment of reinforced concrete bridge columns under
variable axial load. Magazine of Concrete Research 59(2):
87–96.
563
Structures and BuildingsVolume 165 Issue SB10
Strain gradient effects on concretestress–strain curvePeng and Ho
Kriz LB (1959) Ultimate strength criteria for reinforced concrete.
Proceedings of ASCE 85(3): 95–110.
Lam SSE, Wu B, Wong YL et al. (2003) Drift capacity of
rectangular reinforced concrete columns with low lateral
confinement and high-axial load. Journal of Structural
Engineering ASCE 129(6): 733–742.
Lam SSE, Wu B, Liu ZQ and Wong YL (2008) Experimental study
on seismic performance of coupling beams not designed for
ductility. Structural Engineering and Mechanics 28(3): 317–
333.
Lu WY, Lin IJ and Hwang SJ (2009) Shear strength of reinforced
concrete corbels. Magazine of Concrete Research 61(10):
807–813.
Marefat MS, Khanmohammadi M, Bahrani MK and Goli A
(2005) Cyclic load testing and numerical modelling of
concrete columns with substandard seismic details.
Computers and Concrete 2(5): 367–380.
Marefat MS, Khanmohammadi M, Bahrani MK and Goli A
(2006) Experimental assessment of reinforced concrete
columns with deficient seismic details under cyclic load.
Advances in Structural Engineering 9(3): 337–347.
Mansur MA, Chin MS and Wee TH (1997) Flexural behavior of
high-strength concrete beams. ACI Structural Journal 94(6):
663–673.
Mattock AH, Kriz LB and Hognestad E (1961) Rectangular
concrete stress distribution in ultimate strength design. ACI
Journal 32(8): 875–927.
Mo YL and Wang SJ (2000) Seismic behavior of RC columns
with various tie configurations. Journal of Structural
Engineering, ASCE 126(10): 1122–1130.
Nemecek P, Padevet B, Patzak B and Bittnar Z (2005) Effect of
transversal reinforcement in normal and high strength
concrete columns. Materials and Structures 38(7):
665–671.
Oehlers DJ, Haskett M, Mohamed Ali MS and Griffith MC (2010)
Moment redistribution in reinforced concrete beams,
Proceedings of the Institution of Civil Engineers – Structures
and Buildings 163(3): 165–176.
Pam HJ and Ho JCM (2001) Flexural strength enhancement of
confined reinforced concrete columns. Proceedings of the
Institution of Civil Engineers – Structures and Buildings
146(4): 363–370.
Pam HJ and Ho JCM (2009) Length of critical region for
confinement steel in limited ductility high-strength reinforced
concrete columns. Engineering Structures 31(12): 2896–2908.
Pam HJ, Kwan AKH and Islam MS (2001) Flexural strength and
ductility of reinforced normal- and high-strength concrete
beams. Proceedings of the Institution of Civil Engineers –
Structures and Buildings 146(4): 381–389.
Pecce M and Fabbrocino G (1999) Plastic rotation capacity of
beams in normal and high-performance concrete. ACI
Structural Journal 96(2): 290–296.
Sebastian W and Zhang C (2008) Analysis of concrete structures
across the ductility spectrum. Magazine of Concrete Research
60(9): 685–690.
Sheikh SA and Khoury SS (1993) Confined concrete columns with
stubs. ACI Structural Journal 90(4): 414–431.
Sheikh SA and Yeh CC (1990) Tied concrete columns under axial
load and flexure. Journal of Structural Division, ASCE
116(10): 2780–2801.
Sheikh SA, Shah DV and Khoury SS (1994) Confinement of high-
strength concrete columns. ACI Structural Journal 91(1):
100–111.
Shim CS, Chung YS and Han JH (2008) Cyclic response of
concrete-encased composite columns with low steel ratio.
Proceedings of the Institution of Civil Engineers – Structures
and Buildings 161(2): 77–89.
Sim JI, Yang KH and Shim HJ (2009) Test on seismic
strengthening of RC columns using wire rope and T-plate
units. Magazine of Concrete Research 61(10): 823–836.
Smith RG and Orangun CO (1969) Evaluation of the stress–strain
curve of concrete in flexure using method of least squares.
ACI Journal 66(44): 805–822.
SNZ (Standards New Zealand ) (2006) NZS 3101: Concrete
Structures. Part 1: The design of concrete structures. SNZ,
Wellington, New Zealand.
Soliman MTM and Yu CW (1967) The flexural stress–strain
relationship of concrete confined by rectangular transverse
reinforcement. Magazine of Concrete Research 19(61): 223–
238.
Spence R (2008) Earthquake loss estimation for reinforced
concrete buildings: some problems. Magazine of Concrete
Research 60(9): 701–707.
Sturman GM, Shah SP and Winter G (1965) Effects of flexural
strain gradients on microcracking and stress–strain behavior
of concrete. ACI Journal 62(50): 805–822.
Supaviriyakit T, Pimanmas A and Warnitchai P (2007) Cyclic
response of non-seismically detailed interior RC beam-
column connection with varying column tributary area.
Magazine of Concrete Research 59(5): 351–365.
Swartz SE, Nikaeen A, Narayan BHD, Periyakaruppan N and
Refai TME (1985) Structural bending properties of high
strength concrete. ACI Special Publication 87(9): 147–178.
Tabsh SW (2006) Elimination of the effect of strain gradient from
concrete compressive strength test results. Computers and
Concrete 3(6): 375–388.
Tan TH and Nguyen NB (2004) Determination of stress–strain
curves of concrete from flexure tests. Magazine of Concrete
Research 56(4): 243–250.
Tan TH and Nguyen NB (2005) Flexural behavior of confined
high-strength concrete columns. ACI Structural Journal
102(2): 198–205.
Tao Z and Yu Q (2008) Behaviour of CFRP-strengthened slender
square RC columns. Magazine of Concrete Research 60(7):
523–533.
Watson S and Park R (1994) Simulated seismic load tests on
reinforced concrete columns. Journal of Structural
Engineering, ASCE 120(6): 1825–1849.
Whitney CS (1940) Plastic theory of reinforced concrete design.
Proceedings of ASCE 66(10): 1749–1780.
564
Structures and BuildingsVolume 165 Issue SB10
Strain gradient effects on concretestress–strain curvePeng and Ho
Wu YF, Oehlers DJ and Griffith MC (2004) Rational definition of
the flexural deformation capacity of RC column sections.
Engineering Structures 26(5): 641–650.
Xiao X, Guan FL and Yan S (2008) Use of ultra-high-strength bars
for seismic performance of rectangular high-strength concrete
frame columns. Magazine of Concrete Research 60(4): 253–
259.
Yi ST, Kim JHJ and Kim JK (2002) Effect of specimen sizes on
ACI rectangular stress block for concrete flexural members.
ACI Structural Journal 99(5): 701–708.
Zhou W and Zheng WZ (2010) Experimental research on plastic
design method and moment redistribution in continuous
concrete beams prestressed with unbonded tendons. Magazine
of Concrete Research 62(1): 51–64.
WHAT DO YOU THINK?
To discuss this paper, please email up to 500 words to the
editor at [email protected]. Your contribution will be
forwarded to the author(s) for a reply and, if considered
appropriate by the editorial panel, will be published as a
discussion in a future issue of the journal.
Proceedings journals rely entirely on contributions sent in
by civil engineering professionals, academics and students.
Papers should be 2000–5000 words long (briefing papers
should be 1000–2000 words long), with adequate illustra-
tions and references. You can submit your paper online via
www.icevirtuallibrary.com/content/journals, where you
will also find detailed author guidelines.
565
Structures and BuildingsVolume 165 Issue SB10
Strain gradient effects on concretestress–strain curvePeng and Ho