Embed Size (px)
Citation preview
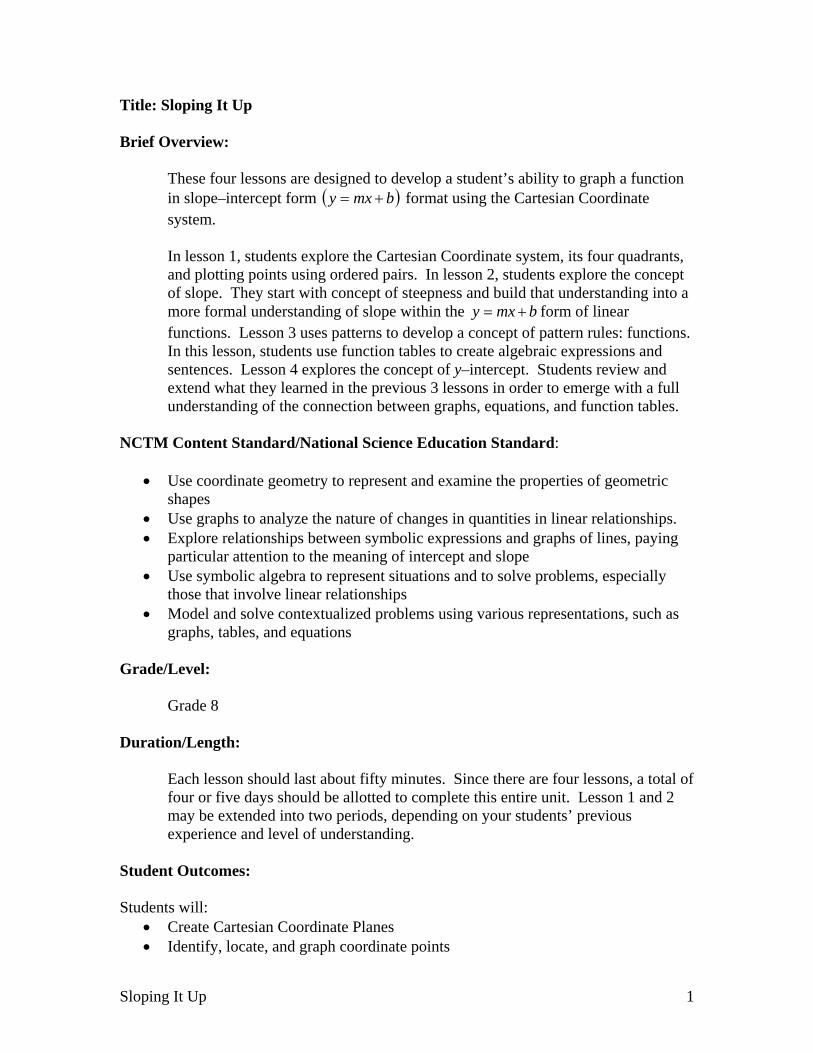
Title: Sloping It Up Brief Overview:
These four lessons are designed to develop a student’s ability to graph a function in slope–intercept form ( bmxy )+= format using the Cartesian Coordinate system. In lesson 1, students explore the Cartesian Coordinate system, its four quadrants, and plotting points using ordered pairs. In lesson 2, students explore the concept of slope. They start with concept of steepness and build that understanding into a more formal understanding of slope within the bmxy += form of linear functions. Lesson 3 uses patterns to develop a concept of pattern rules: functions. In this lesson, students use function tables to create algebraic expressions and sentences. Lesson 4 explores the concept of y–intercept. Students review and extend what they learned in the previous 3 lessons in order to emerge with a full understanding of the connection between graphs, equations, and function tables.
NCTM Content Standard/National Science Education Standard:
• Use coordinate geometry to represent and examine the properties of geometric shapes
• Use graphs to analyze the nature of changes in quantities in linear relationships. • Explore relationships between symbolic expressions and graphs of lines, paying
particular attention to the meaning of intercept and slope • Use symbolic algebra to represent situations and to solve problems, especially
those that involve linear relationships • Model and solve contextualized problems using various representations, such as
graphs, tables, and equations Grade/Level:
Grade 8 Duration/Length:
Each lesson should last about fifty minutes. Since there are four lessons, a total of four or five days should be allotted to complete this entire unit. Lesson 1 and 2 may be extended into two periods, depending on your students’ previous experience and level of understanding.
Student Outcomes: Students will:
• Create Cartesian Coordinate Planes • Identify, locate, and graph coordinate points
Sloping It Up 1
• Identify and describe slope • Identify the y–intercept • Create a function table • Graph linear equations
Materials and Resources:
String Raw Spaghetti Boxes Blocks Yard sticks Measuring tape Masking tape Scotch tape Black marker Cuisenaire rods Graphing Calculator Graph Paper T chart (Function Table) Geometric Shapes Scissors Index Cards Internet Sites
o National Virtual Library: http://nlvm.usu.edu/ o http://nlvm.usu.edu/en/nav/frames_asid_109_g_3_t_2.html?open=acti
vities&from=topic_t_2.html o http://nlvm.usu.edu/en/nav/frames_asid_191_g_4_t_2.html?from=topi
c_t_2.html • Worksheets
Lesson 1 o Blank Cartesian Coordinate Plane o Cartesian Coordinate Combat o Say Cheese! o Descartes o Now, Create Your Own Picture! o The Mouse Takes the Cheese
Lesson 2 o Pyramid as overhead or projection, with Blank Cartesian Coordinate
Plane transparency overlay. o Tread and Riser o Steps o Cuisenaire Rods o Steppin’ up o Assessment Tool
Lesson 3
Sloping It Up 2
o Preassessment o Countin’ it Down o You Can Count on Me o The Slope Formula o Patterns
Lesson 4 o Rules of Review o Matching It Up o Interception! o Linear Equations o Say Cheese! Part 2 o The Mouse Takes the Cheese – Again o Finding Equations o Sloping It Up! Summative Assessment
Development/Procedures: Lesson 1 Preassessment – Using a copy of Blank Cartesian Coordinate
Plane, direct students to create a Cartesian Coordinate plane. Ask them to level Quadrant I, II, III, IV and to plot points (5, 2) (-2,3), (6, -1), (-4, -3). Ask students to compare their graphs with a partner. Check and monitor progress.
Launch – Begin the lesson by distributing “Cartesian Coordinate
Combat: My Ships” and “Cartesian Coordinate Combat: Enemy Ships” to each student. Explain that the objective of the game is to sink their opponent’s ships by hitting all the coordinate points that make up the ships, similar to Battleship. Instruct the students to first lightly label each quadrant with highlighter or light marker. Divide the class into pairs, and have students check each other’s graphs and quadrants. Have the students draw four ships on the “My Ships” graph ONLY. They should keep the graph labeled “Enemy Ships” blank at this point. The “Enemy Ships” page will be used to record hits and misses. The ships should have the dimensions 2 by 3, 2 by 4, and 2 by 5, and 2 by 6 respectively. Note to teacher, these ships are line segments.
Explain the rules to students. For each attack, the attacking
student must say the Quadrant first and then the coordinate point. For example, a student would say, “Quadrant I: (8,5)” to attempt a hit at (8, 5). If the attacking student is aiming for an axis, then he or she must say the name of the axis and then the coordinate point. For example, “y–axis
Sloping It Up 3
(0,3)”. If the student calls an impossible point, such as “Quadrant I: –2, 3” or “y–axis 3, 0” it is an automatic miss. After each attack, the opponent responds “hit” or “miss” or “automatic miss”. After each attack, the attacking student should record the hit or miss on coordinate plane labeled “Enemy Ships” A ship is sunk when ALL of its coordinate points are hit. The first student to sink his or her opponent’s ship wins.
Teacher Facilitation – Distribute copies of “Say Cheese!”. Call out
the ordered pairs listed on the sheet, and have the students plot and connect the points. Remind the students that points are called out one after another, x after y, just like in the alphabet. Tell students to write down what picture is formed, as soon as they figure out what it is. Observe student work to make sure that their smiley face is the same as the points called out. Follow up with “Descartes”, where students will identify the points that make up the stick figure plotted. End the activity with “Now, Create Your Own Picture!”, The students create their own picture using coordinate points.
Student Application – The students will apply their knowledge of
coordinate points to move their way through a maze by completing “The Mouse Takes the Cheese” in groups. The objective is to use the fewest coordinate points possible. Coordinate points are not allowed to touch the walls of the maze.
Embedded Assessment – Assessment of students’ ability to use
the Cartesian Coordinate system and to identify, name, and graph coordinate points is embedded the various worksheets and activities in the lesson. Walk around the room and observe the students’ performance in each activity to assess understanding and mastery.
Reteaching/Extension –
Discuss “The Mouse Takes the Cheese.” What pattern do they notice? Draw out the fact that x or y value is always the same as the mouse moves from one place to another. When is the X value the same? (When the mouse is moving vertically.) When is the Y value the same? (When the mouse is moving horizontally.
To extend learning change the rules of the “The Mouse Takes the Cheese” maze. Ask, “If their mouse was a
Sloping It Up 4
superhero, and could fly, what would be the quickest route to the X at the end?” (Answer: -9, 10 to 8, -9)
Give the assignment of creating a new maze (with an answer key on a separate piece of paper) for homework. Encourage students to make their mazes colorful and interesting. You may use a copy of Blank Cartesian Coordinate Plane for students to use to create their maze.
Turn your classroom, cafeteria, playground, or other area into a giant Cartesian Coordinate plane. Hide a “treasure” somewhere in area and give students an opportunity to guide their classmates, one at a time, to the item, using only math terms to direct them.
If students are still having difficulty with ordered pairs, introduce them to the website: http://www.mathwarehouse.com/ordered–pairs/interactive–ordereded–pairs.html . Ask them to explore and record the pattern in their own words. Secondly, ask them to click on common error #1, then #2, and then #3. Ask them to label each error and describe what is INCORRECT about it.
Lesson 2 Preassessment – Have students measure their math book. Compare
answers for length and height. Then ask students to create as many ratios as they can to express the relationship between their math book’s length and height. Ask students to compare ratios with partners.
Launch – Post a large piece of chart paper on the board. Lead a
student discussion by asking, “What is meant by steepness?” Have students provide examples of what illustrates steepness. Extend the discussion by asking, “What ratio can be determined when measuring the steepness?” Record student answers on chart paper. Answers will vary. As this is brainstorming, any reasonable answer should be recorded.
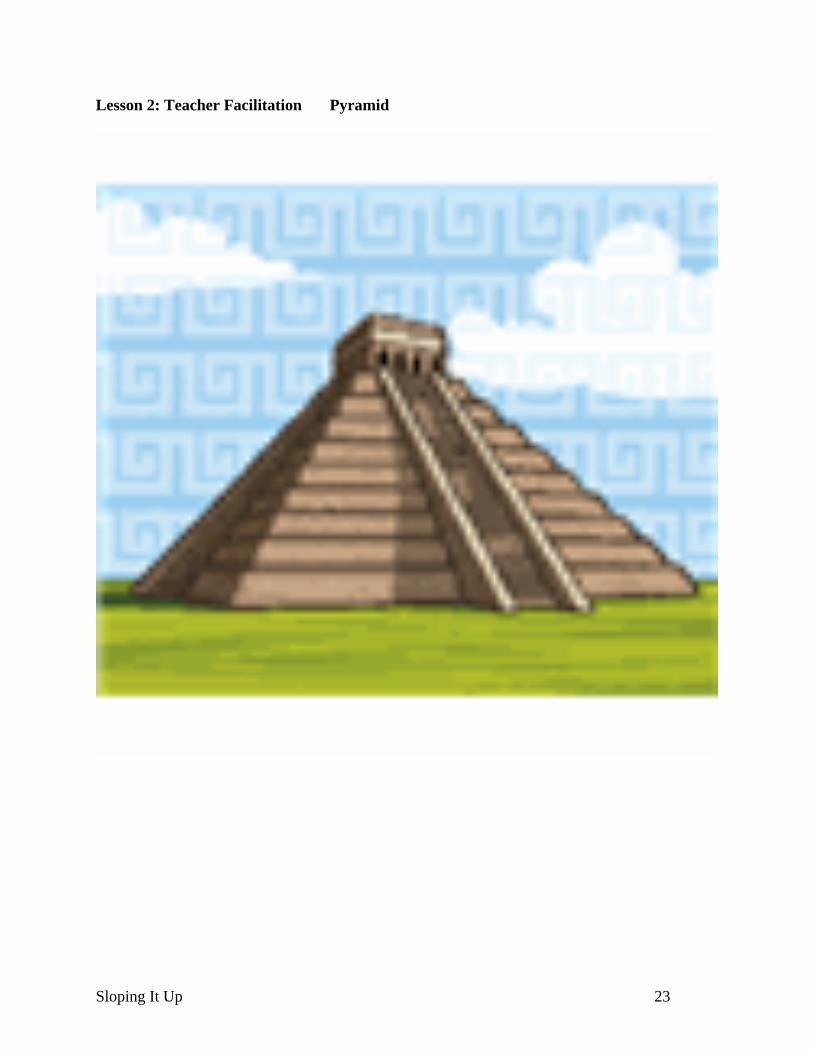
Teacher Facilitation – Introduce the term slope by asking, “What is
meant by term slope?” Add these answers on chart paper. Project “Pyramid” and ask the students to identify various lines in the Pyramid and describe their slopes/steepness.
Include the following words on the chart paper, if the
students have not already mentioned them:
Slope: the ratio of 12
12
xxyy
−− , where ( )11, yx and
( )22 , yx are ordered pairs on the line
Sloping It Up 5
Positive Slope–upward line Negative Slope–downward line No Slope–vertical line Zero Slope–horizontal line Vertical line–rise Horizontal line–run
Overlay a transparency of the “Blank Coordinate Grid” onto the “Pyramid” transparency. Model for the students how to count the slope of the various lines they identified in the picture. You may want to point out that the slope is the same even when the overlaid Cartesian Coordinate Plane is moved, as long as it is not turned. Lay uncooked spaghetti noodles onto the coordinate grid to emphasize the different lines in the pyramid. Invite students to the overhead to move the spaghetti to different locations and count the slopes.
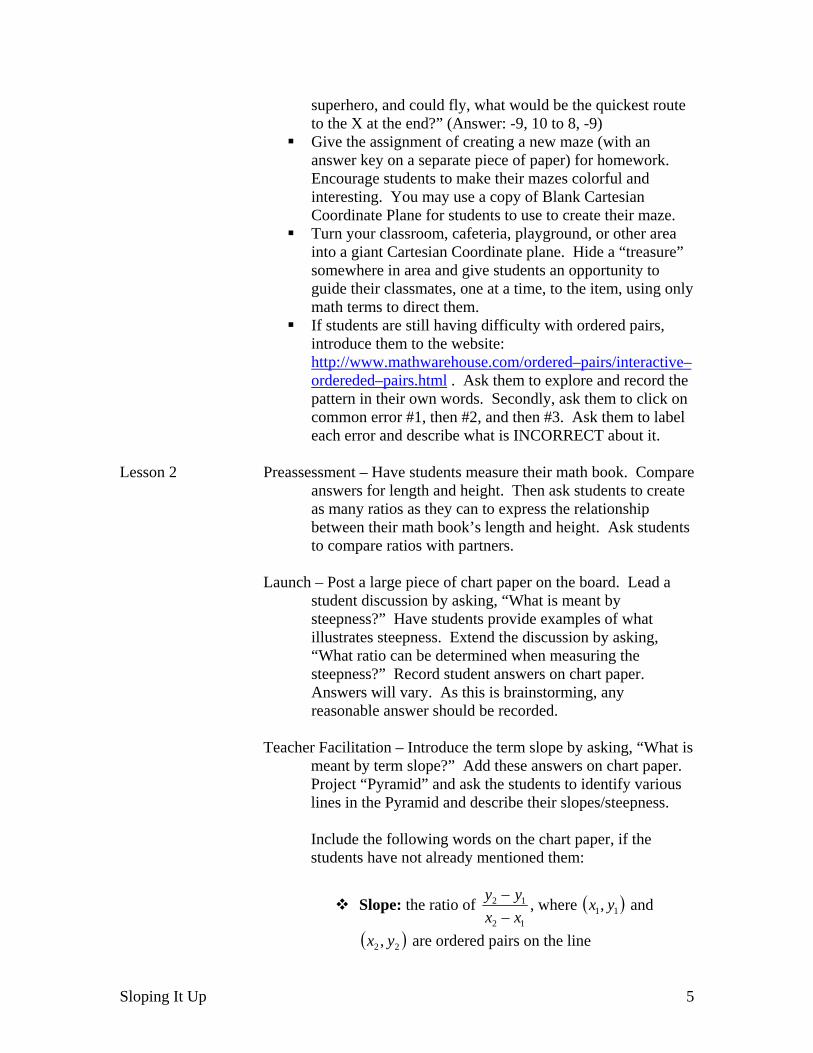
Project “Steps” and “Tread and Riser”. Connect the concept of slope to the tread and rise of the steps. Discuss the ratio of the tread and rise of the steps. Use a piece of uncooked spaghetti as a ‘railing’ along the steps. Identify the spaghetti as a line, and connect the ratio of the tread and rise to the concept of slope. Create steps using Cuisenaire rods, providing students with their own set of rods to model. Begin with modeling stairs with a rise (height) of 2 and a run (width) of 3, as shown. Lay the spaghetti railing
along the rods, and identify the slope as 32 .
Student Application –Call out various slopes, such as 21 ,
52 , and
53 , and have the students use Cuisenaire rods to build the
Sloping It Up 6
slopes. In groups of 3, have the students build and compare various slopes as they complete the “Cuisenaire Rods” worksheet.
Have the students work in pairs or groups to complete “Steppin’ up”, where the students will measure steps in their school community. Students will measure and record the length and the height of the steps in the halls, in front of the school building, and if possible, a neighbor or community business near by. Allow the students to develop and apply their knowledge of slope on their own.
Embedded Assessment – Students will complete a table in order to
record their measurements and answer discussion questions in “Steppin’ Up.” Walk to each group and assess student engagement and answer student questions. Allow students to assess their peers’ learning and their own learning using the “Assessment Tool”.
Reteaching—
Use the following reteaching strategies to assist the students with various concepts:
o When we talk about slope, the slant (point to the pyramid, the steps, the graphs) described is talking about the steepness of a line.
o Tell students, when we look at your tables of data, the riser represented the height and the tread represented the length.
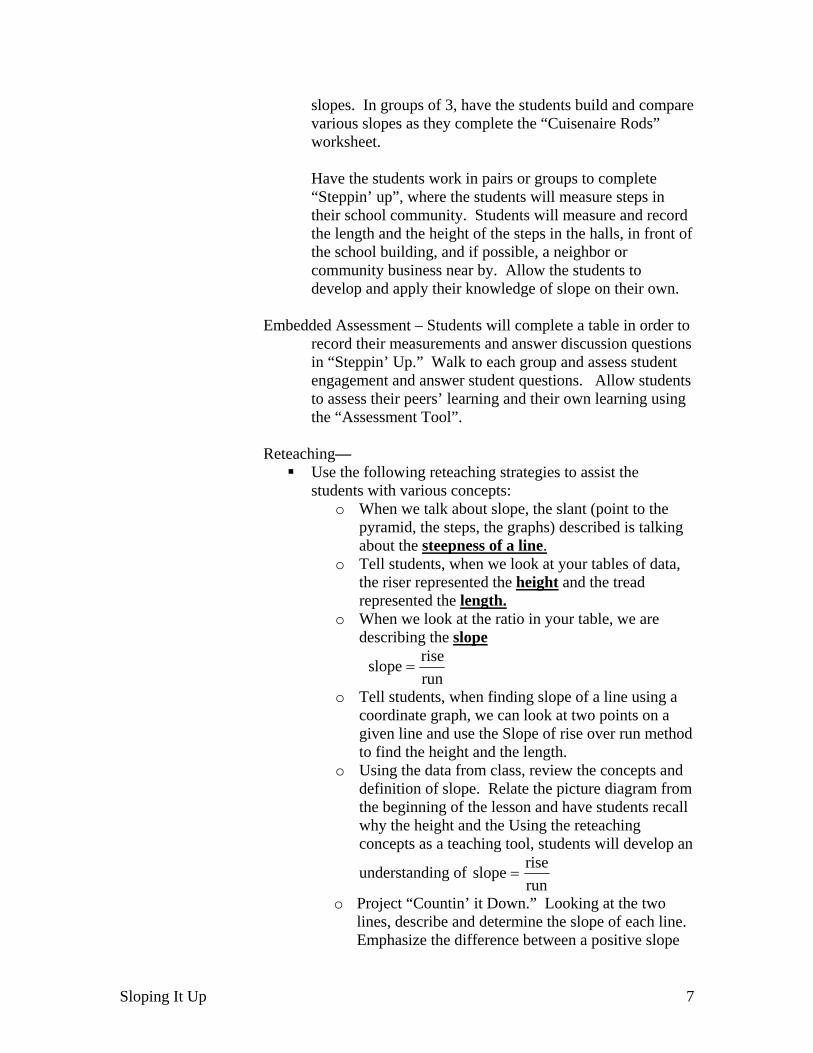
o When we look at the ratio in your table, we are describing the slope
runriseslope =
o Tell students, when finding slope of a line using a coordinate graph, we can look at two points on a given line and use the Slope of rise over run method to find the height and the length.
o Using the data from class, review the concepts and definition of slope. Relate the picture diagram from the beginning of the lesson and have students recall why the height and the Using the reteaching concepts as a teaching tool, students will develop an
understanding of runriseslope =
o Project “Countin’ it Down.” Looking at the two lines, describe and determine the slope of each line. Emphasize the difference between a positive slope
Sloping It Up 7
and a negative slope. Have the students practice with “You Can Count on Me.”
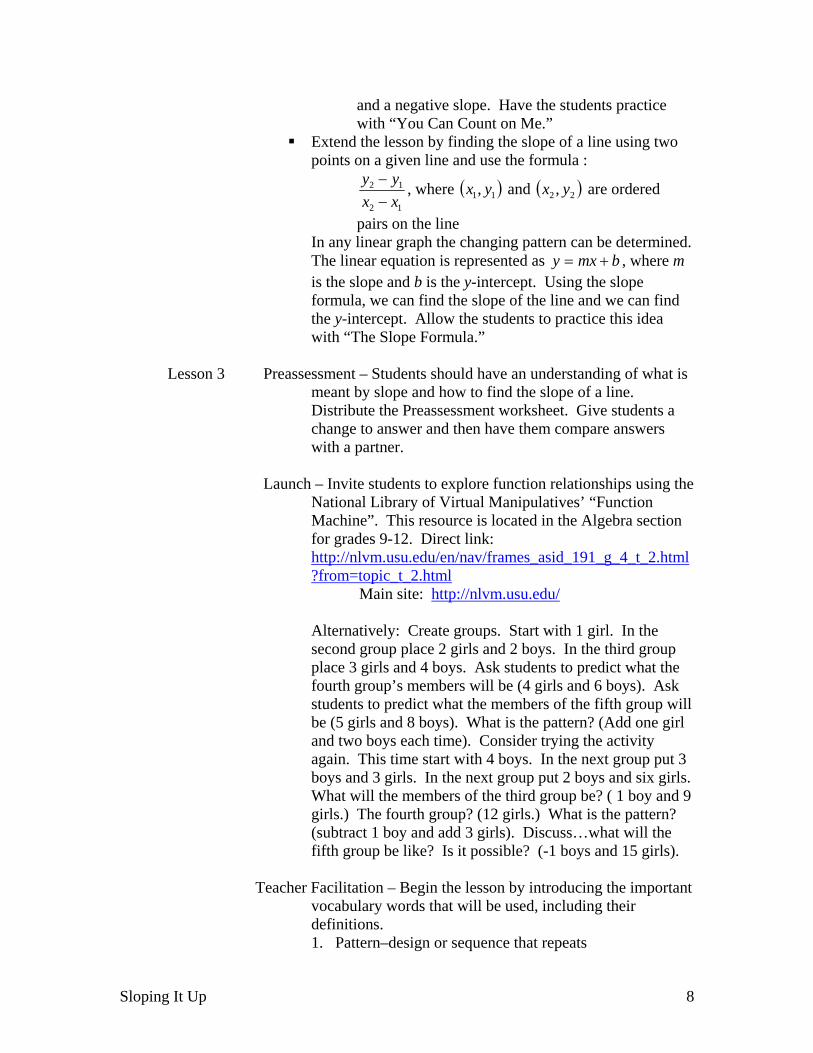
Extend the lesson by finding the slope of a line using two points on a given line and use the formula :
12
12
xxyy
−− , where ( )11, yx and ( )22 , yx are ordered
pairs on the line In any linear graph the changing pattern can be determined. The linear equation is represented as bmxy += , where m is the slope and b is the y-intercept. Using the slope formula, we can find the slope of the line and we can find the y-intercept. Allow the students to practice this idea with “The Slope Formula.”
Lesson 3 Preassessment – Students should have an understanding of what is
meant by slope and how to find the slope of a line. Distribute the Preassessment worksheet. Give students a change to answer and then have them compare answers with a partner.
Launch – Invite students to explore function relationships using the
National Library of Virtual Manipulatives’ “Function Machine”. This resource is located in the Algebra section for grades 9-12. Direct link: http://nlvm.usu.edu/en/nav/frames_asid_191_g_4_t_2.html?from=topic_t_2.html Main site: http://nlvm.usu.edu/ Alternatively: Create groups. Start with 1 girl. In the second group place 2 girls and 2 boys. In the third group place 3 girls and 4 boys. Ask students to predict what the fourth group’s members will be (4 girls and 6 boys). Ask students to predict what the members of the fifth group will be (5 girls and 8 boys). What is the pattern? (Add one girl and two boys each time). Consider trying the activity again. This time start with 4 boys. In the next group put 3 boys and 3 girls. In the next group put 2 boys and six girls. What will the members of the third group be? ( 1 boy and 9 girls.) The fourth group? (12 girls.) What is the pattern? (subtract 1 boy and add 3 girls). Discuss…what will the fifth group be like? Is it possible? (-1 boys and 15 girls).
Teacher Facilitation – Begin the lesson by introducing the important vocabulary words that will be used, including their definitions. 1. Pattern–design or sequence that repeats
Sloping It Up 8
2. T chart (function table)–similar to a function table show patterns of change.
3. Generalizing–communicate findings into a rule. 4. Term–first pattern in a sequence 5. Sequence–ordered set of numbers or objects 6. Variable–quantity that changes also a symbol, usually a
letter, that can stand for different values (dependent and independent or (x, y)
Distribute “Patterns” and model the pattern using figures cut out from index cards. Invite students to the board to complete the pattern using the cut-out pieces. Assist the students in completing a table to describe the pattern, and use the pattern to predict and verify future stages..
Student Application – Students will explore patterns by completing “Patterns” in order to predict and determine a rule or make a generalization. Students will describe building a model for stages 4 and 5 of the pattern. They will then predict and verify what stage 10 would look like. Have them create a table to record their data, search for the pattern and find a rule for the pattern.
Embedded Assessment – Walk to each group and ask students to explain their mathematical reasoning. Have students record their answers after the activity is completed on a whole class table. Students will self assess themselves and their peers.
Reteaching/Extension— Have students to review the table as a class and discuss
their findings. Describe iterative rules and explicit rules when making generalizations. Revisit the function machine. Ask students to work in groups in order to complete the function tables. In addition, ask them to describe each function rule in words.
Using the data in the table, student will enter the data into
the graphing calculator in order to further explore the relationship between (x and y)
Graphing Calculator Steps
Go to 2nd Y= and Turn Off Plots: Go to Stat then Edit–Enter Enter data for L1 for your Independent Variable (X) Enter data for L2 for your Dependent Variable (Y) Go to 2nd Y= and Turn on Plots
Sloping It Up 9
Select the Scatter Plot Graph Go to Zoom and Scroll to Zoom Stat and hit Enter
Have your students to describe what they see in the
graphing calculator. Ask, “What happens to the x and y axis?” Ask students to predict the number of pieces for a stage 20 and have them write a generalization.
Lesson 4 Preassessment – Distribute the “Rules of Review” Worksheet.
Students should complete this using words.
Launch – Divide the class into pairs, and ask students to complete “Matching It Up”. Invite the students to share their answers, and explain how they matched up the graphs to the equations. Center the discussion on the student answers to the questions below the graphs. Lead the students to focus on the y-intercepts of the graphs. Ask them to write the coordinate point for each line where that line crosses the y –axis. Ask them if they notice any pattern.
Examine transformations on graphing calculators. Activate the applications feature (APPS) of the graphing calculator. Click on the Transformations program. Go to Y = page. Use the alpha key to set up BAxy += . Press the graph button. Allow students time to manipulate the lines. Ask them to note patterns and changes, and make connections to the equation of the line, the slope and the y-intercept. Consider having the calculator in split-screen mode, where the table and graph can be seen simultaneously. To do this, hit MODE, and then scroll down to G–T.
If the applications feature of the calculator does not contain the Transformations program, consider the following website as an alternative: http://www.mathwarehouse.com/algebra/linear_equation/linear–equation–interactive–activity.php
Or, try: http://www.mathwarehouse.com/algebra/linear_equation/interactive–slope.php
Teacher Facilitation – Remind students that lines are graphic
representations of equations. Have the students complete “Interception!” Review the graphs and tables, asking the following key questions:
Sloping It Up 10
1) Were all of the coordinate points on the graph? Explain your thinking. Can you think of a counterexample?
2) Do you notice any patterns in the tables? 3) Identify where each of the lines cross the y – axis.
Can you predict this coordinate without doing any calculations?
4) Which lines are the steepest? 5) Can you predict the slope of the line without doing
any calculations?
Lead a discussion about the above questions. Point out that lines cross the y–axis when 0=x . Lead the students to identifying the m as the slope and the b as the y – intercept in the equation bmxy += .
Vocabulary to know: slope, Cartesian Coordinate Plane, x–Axis, y–Axis, Quadrant, y–intercept
Student Application – Project “Linear Equations”. Use a choral
response when having the students identify the slope and y-intercept of each equation. Invite students to describe how they arrived at their answers.
Assign “Say Cheese! Part 2” and “The Mouse Takes the
Cheese – Again!” to summarize the lesson. Embedded Assessment –Use the various activities in the lesson to
assess student understanding. By the choral responses to the “Linear Equations”, student understanding can be determined.
Reteaching/Extension – Pass out “Finding Equations”. Clarify any
misconceptions using the questions. Summative Assessment:
See the Summative Assessments that follow in the worksheets section. Students should be able to use coordinate points to locate, name, and create points; identify slope and slope within bmxy += ; and identify y–intercept of an equation in
and on a graph. bmxy += Authors:
John Bennett Kimberly Felton Fr. Kolbe School Diggs–Johnson Middle Archdiocese of Baltimore Baltimore City Public Schools
Sloping It Up 11
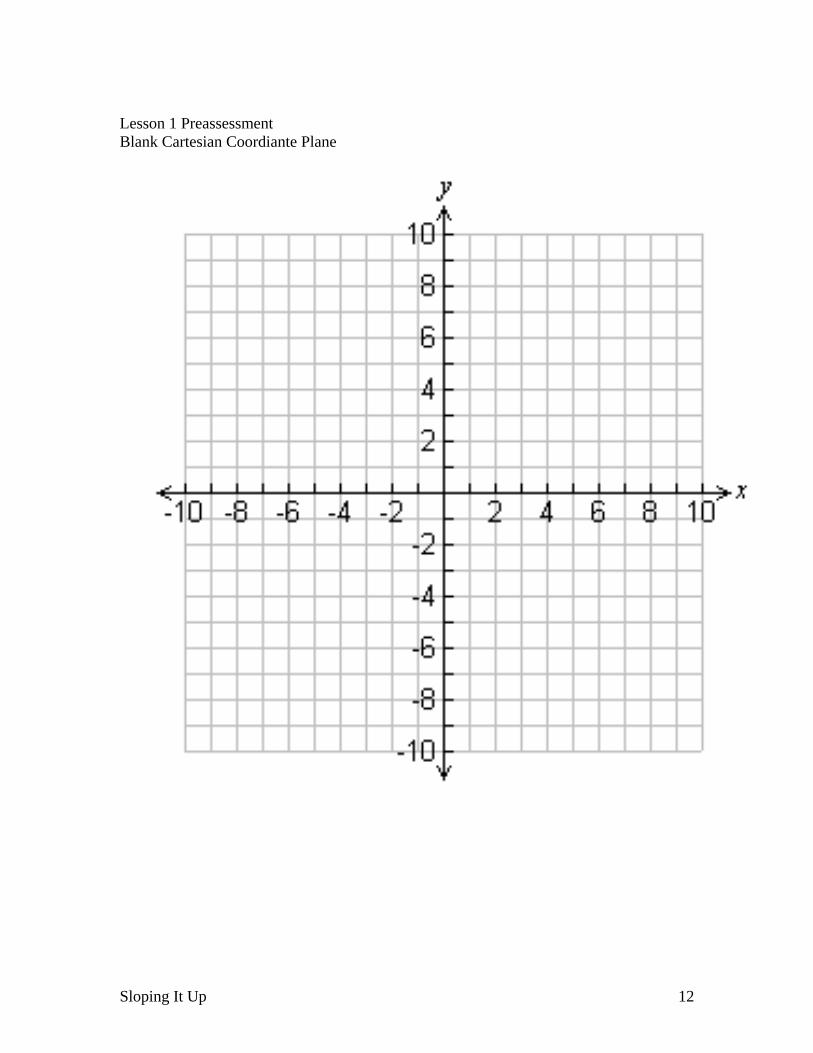
Lesson 1 Preassessment Blank Cartesian Coordiante Plane
Sloping It Up 12
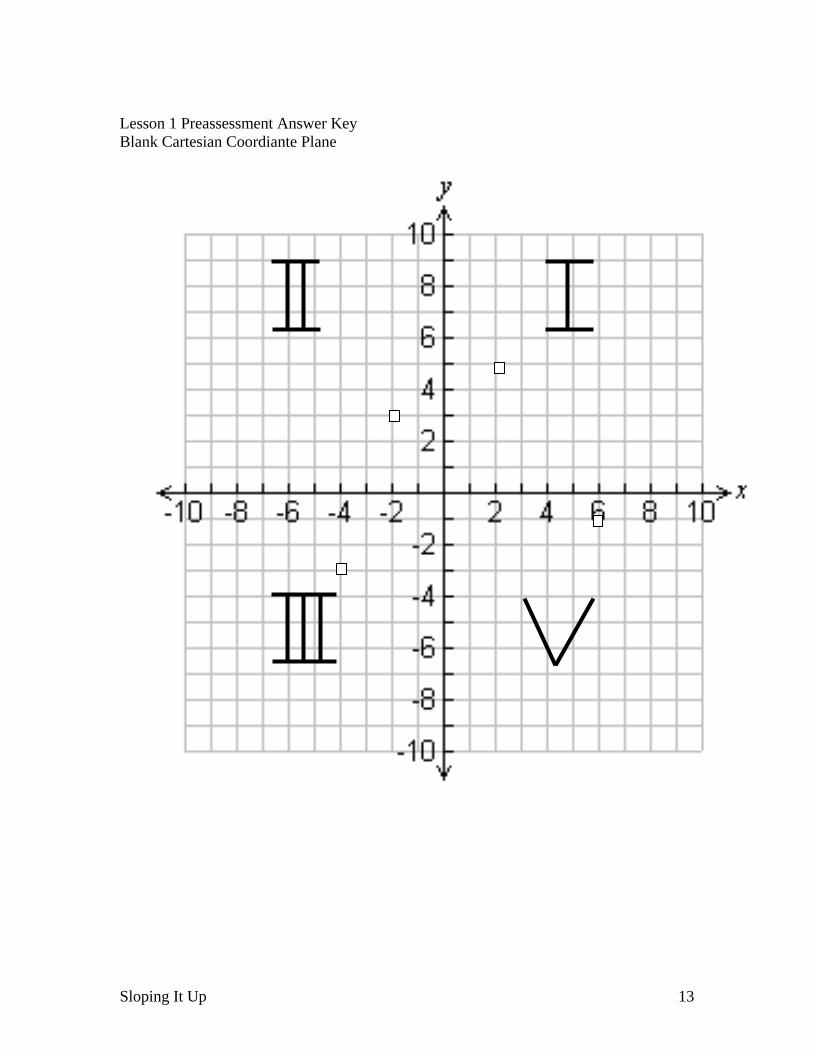
Lesson 1 Preassessment Answer Key Blank Cartesian Coordiante Plane
Sloping It Up 13
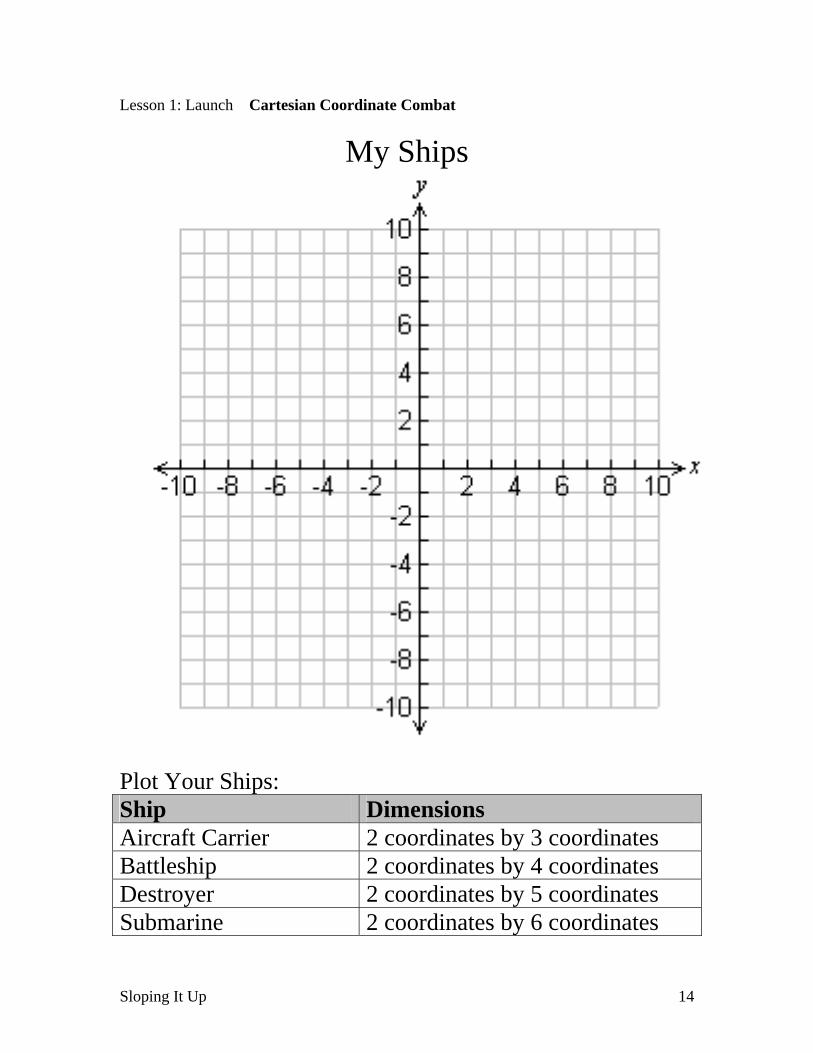
Lesson 1: Launch Cartesian Coordinate Combat
My Ships
Plot Your Ships: Ship Dimensions Aircraft Carrier 2 coordinates by 3 coordinates Battleship 2 coordinates by 4 coordinates Destroyer 2 coordinates by 5 coordinates Submarine 2 coordinates by 6 coordinates
Sloping It Up 14

Lesson 1: Launch Cartesian Coordinate Combat
Enemy Ships
Your Enemy Ships: Ship Dimensions Aircraft Carrier 2 coordinates by 3 coordinates Battleship 2 coordinates by 4 coordinates Destroyer 2 coordinates by 5 coordinates Submarine 2 coordinates by 6 coordinates
Sloping It Up 15
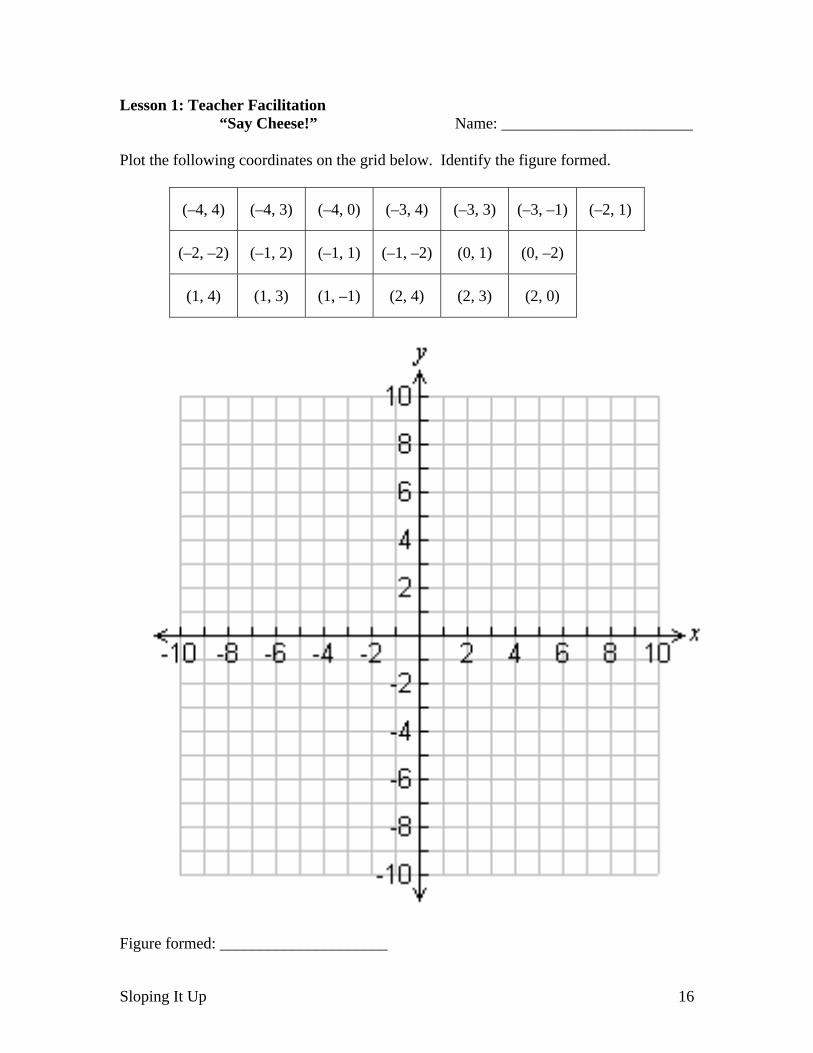
Lesson 1: Teacher Facilitation “Say Cheese!” Name: ________________________
Plot the following coordinates on the grid below. Identify the figure formed.
(–4, 4) (–4, 3) (–4, 0) (–3, 4) (–3, 3) (–3, –1) (–2, 1)
(–2, –2) (–1, 2) (–1, 1) (–1, –2) (0, 1) (0, –2)
(1, 4) (1, 3) (1, –1) (2, 4) (2, 3) (2, 0)
Figure formed: _____________________
Sloping It Up 16
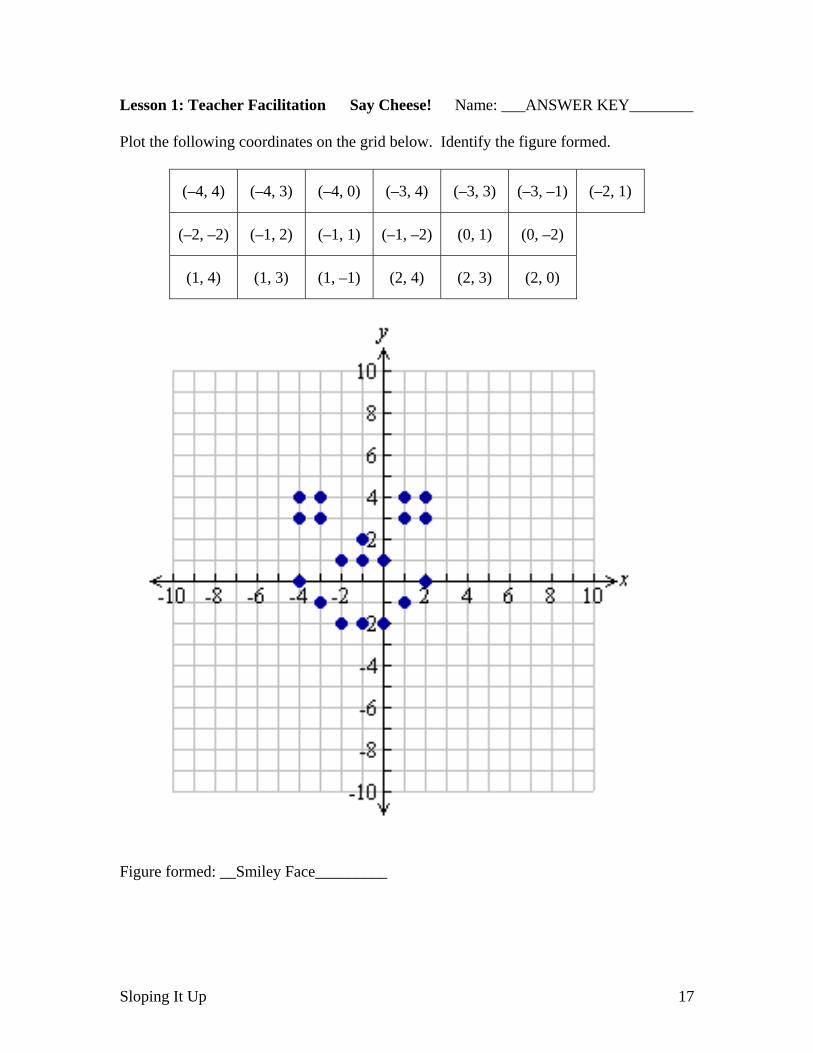
Lesson 1: Teacher Facilitation Say Cheese! Name: ___ANSWER KEY________ Plot the following coordinates on the grid below. Identify the figure formed.
(–4, 4) (–4, 3) (–4, 0) (–3, 4) (–3, 3) (–3, –1) (–2, 1)
(–2, –2) (–1, 2) (–1, 1) (–1, –2) (0, 1) (0, –2)
(1, 4) (1, 3) (1, –1) (2, 4) (2, 3) (2, 0)
Figure formed: __Smiley Face_________
Sloping It Up 17
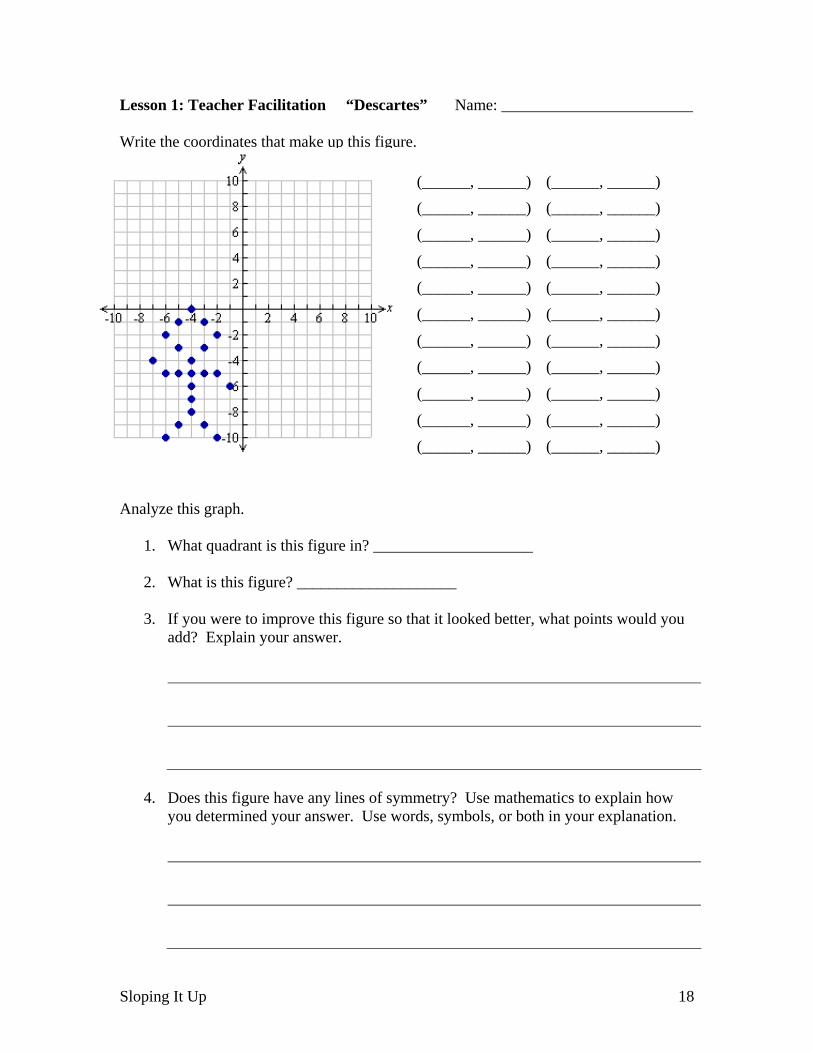
Lesson 1: Teacher Facilitation “Descartes” Name: ________________________ Write the coordinates that make up this figure.
(______, ______) (______, ______)
(______, ______) (______, ______)
(______, ______) (______, ______)
(______, ______) (______, ______)
(______, ______) (______, ______)
(______, ______) (______, ______)
(______, ______) (______, ______)
(______, ______) (______, ______)
(______, ______) (______, ______)
(______, ______) (______, ______)
(______, ______) (______, ______)
Analyze this graph.
1. What quadrant is this figure in? ____________________ 2. What is this figure? ____________________
3. If you were to improve this figure so that it looked better, what points would you
add? Explain your answer.
4. Does this figure have any lines of symmetry? Use mathematics to explain how
you determined your answer. Use words, symbols, or both in your explanation.
Sloping It Up 18
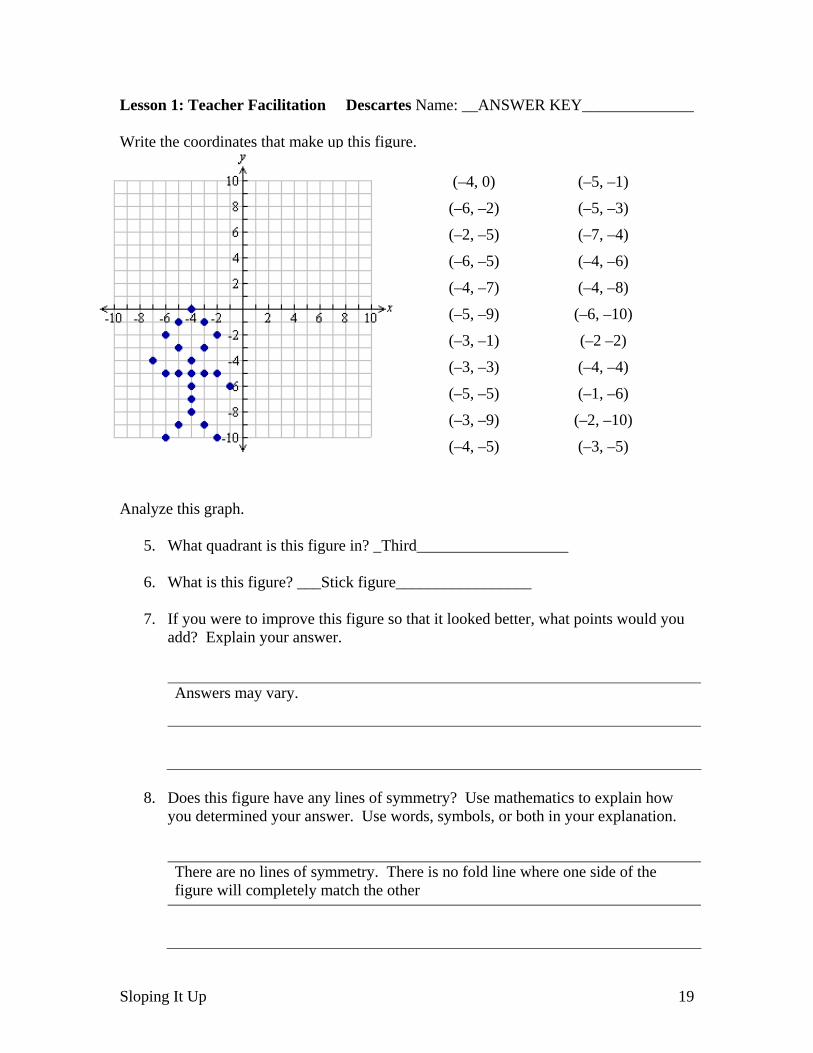
Lesson 1: Teacher Facilitation Descartes Name: __ANSWER KEY______________ Write the coordinates that make up this figure. (–4, 0) (–5, –1)
(–6, –2) (–5, –3) (–2, –5) (–7, –4) (–6, –5) (–4, –6)
(–4, –7) (–4, –8) (–5, –9) (–6, –10)
(–3, –1) (–2 –2) (–3, –3) (–4, –4)
(–5, –5) (–1, –6) (–3, –9) (–2, –10)
(–4, –5)
(–3, –5)
Analyze this graph.
5. What quadrant is this figure in? _Third___________________ 6. What is this figure? ___Stick figure_________________
7. If you were to improve this figure so that it looked better, what points would you
add? Explain your answer.
Answers may vary.
8. Does this figure have any lines of symmetry? Use mathematics to explain how
you determined your answer. Use words, symbols, or both in your explanation.
There are no lines of symmetry. There is no fold line where one side of the figure will completely match the other
Sloping It Up 19
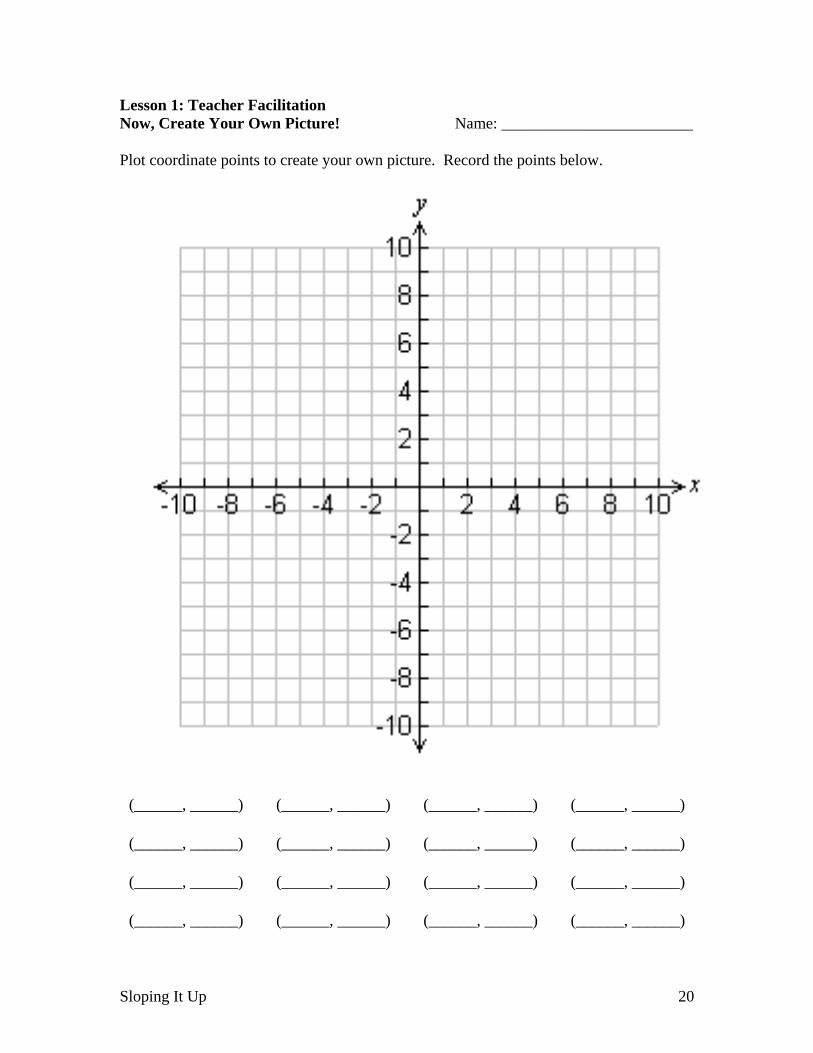
Lesson 1: Teacher Facilitation Now, Create Your Own Picture! Name: ________________________ Plot coordinate points to create your own picture. Record the points below.
(______, ______) (______, ______) (______, ______) (______, ______)
(______, ______) (______, ______) (______, ______) (______, ______)
(______, ______) (______, ______) (______, ______) (______, ______)
(______, ______) (______, ______) (______, ______) (______, ______)
Sloping It Up 20
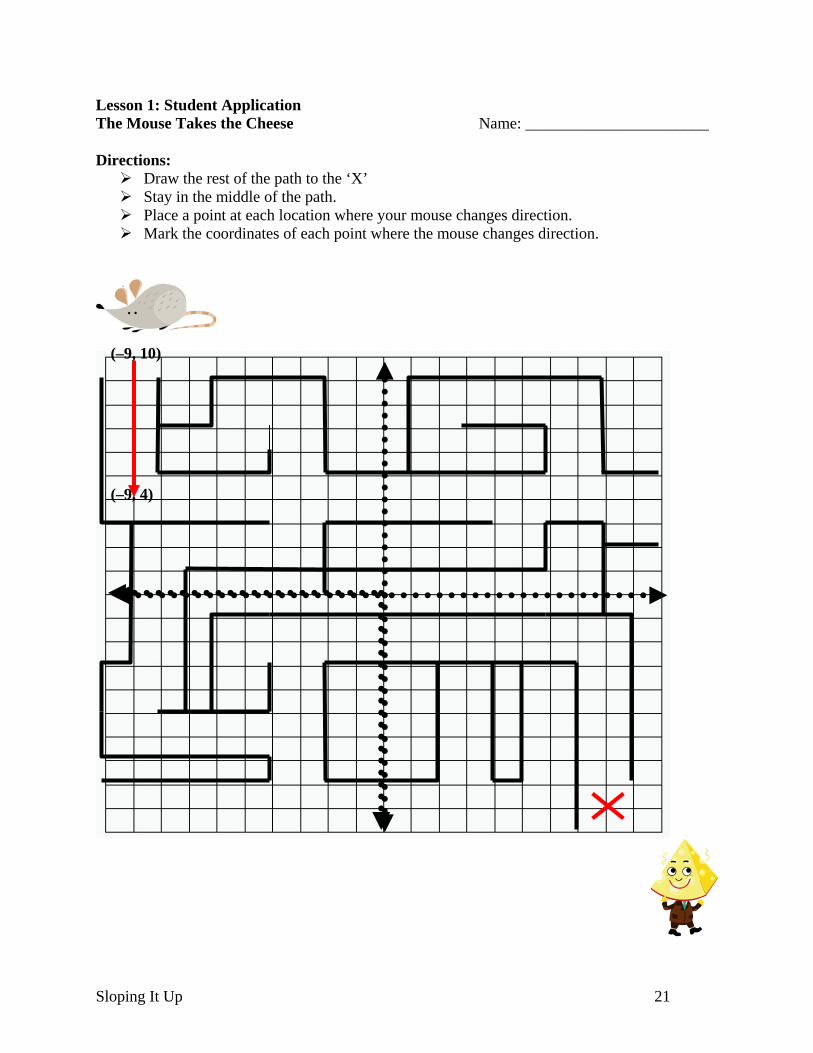
Lesson 1: Student Application The Mouse Takes the Cheese Name: _______________________ Directions:
Draw the rest of the path to the ‘X’ Stay in the middle of the path. Place a point at each location where your mouse changes direction. Mark the coordinates of each point where the mouse changes direction.
(–9, 10)
(–9, 4)
Sloping It Up 21
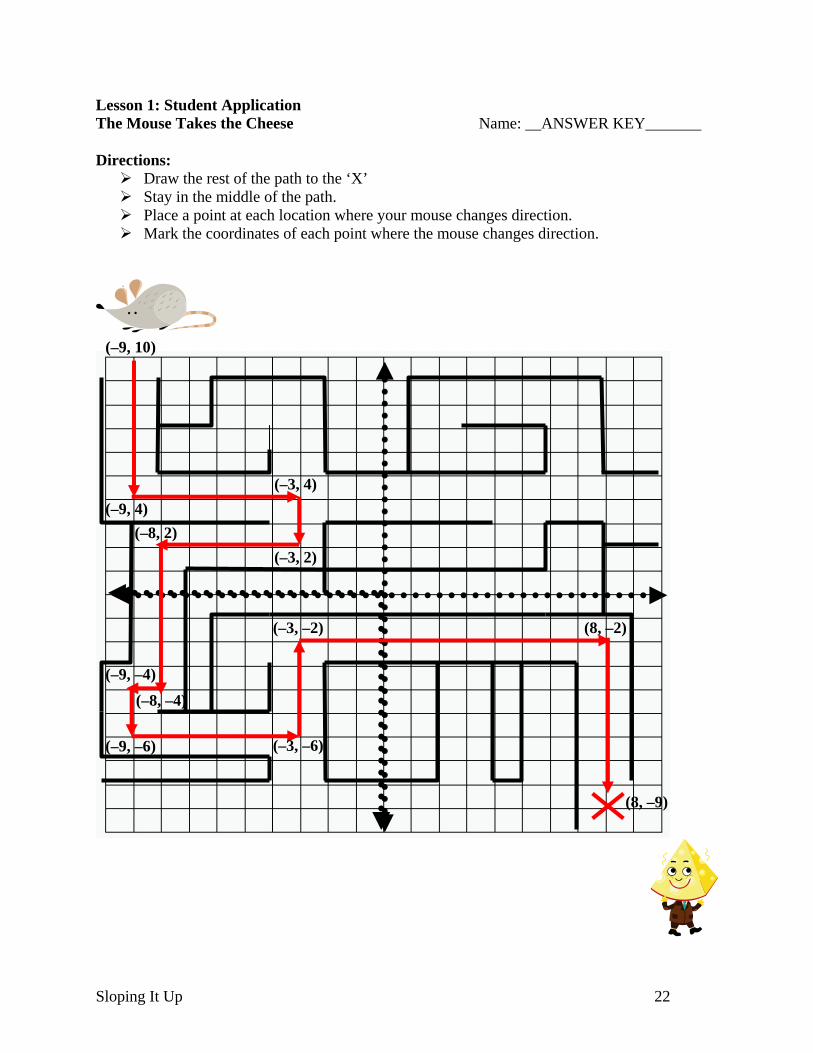
Lesson 1: Student Application The Mouse Takes the Cheese Name: __ANSWER KEY_______ Directions:
Draw the rest of the path to the ‘X’ Stay in the middle of the path. Place a point at each location where your mouse changes direction. Mark the coordinates of each point where the mouse changes direction.
(–9, 10)
(–9, 4) (–3, 4)
(–3, 2) (–8, 2)
(–8, –4) (–9, –4)
(–9, –6) (–3, –6)
(–3, –2) (8, –2)
(8, –9)
Sloping It Up 22
Lesson 2: Teacher Facilitation Pyramid
Sloping It Up 23
Lesson 2: Teacher Facilitation Blank Coordinate Grid
Sloping It Up 24
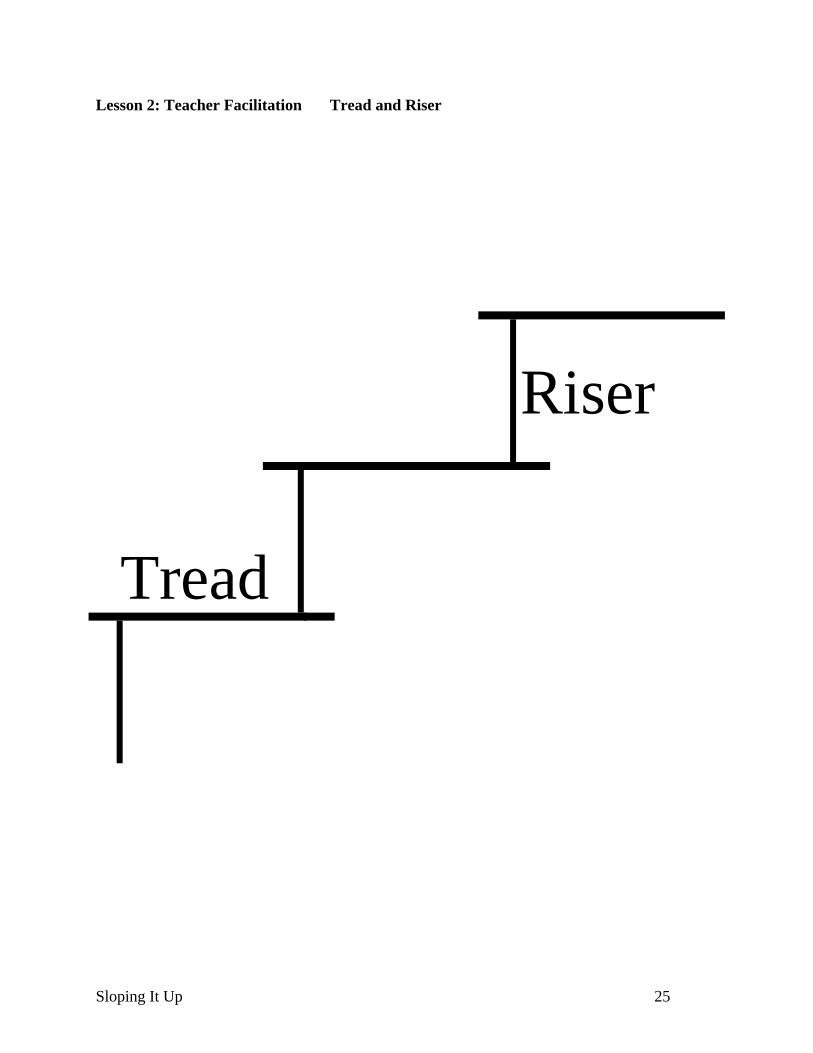
Lesson 2: Teacher Facilitation Tread and Riser
Riser
Tread
Sloping It Up 25
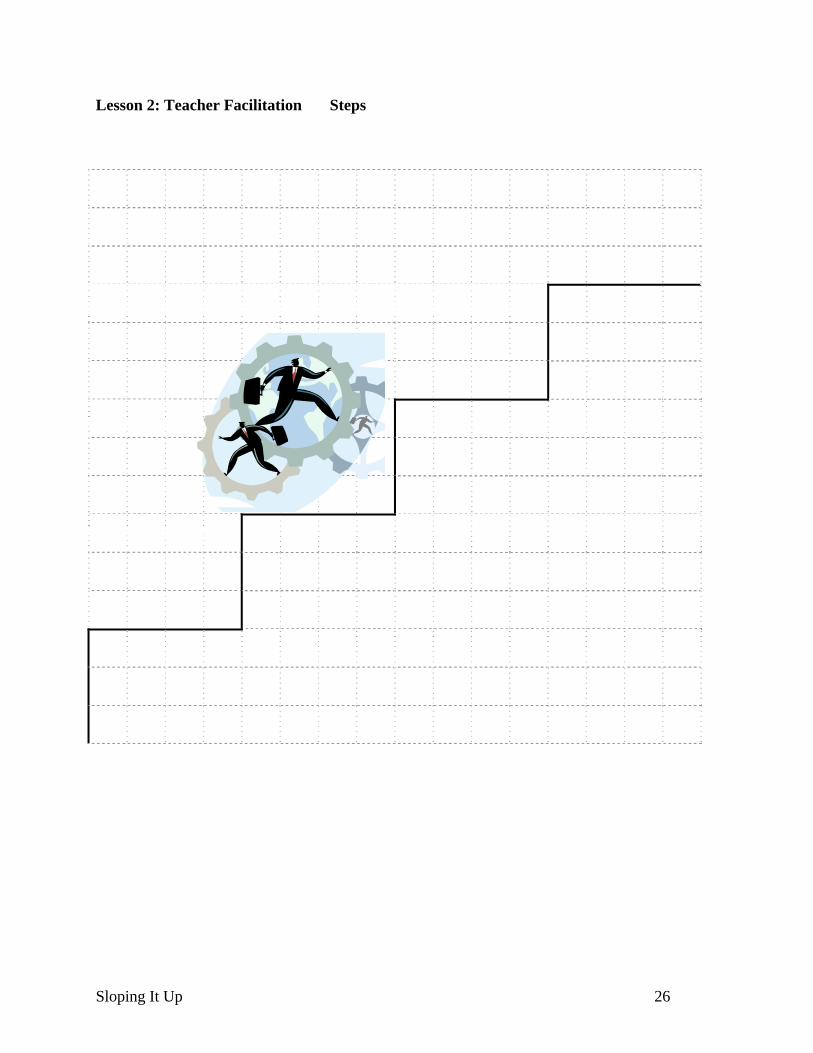
Lesson 2: Teacher Facilitation Steps
Sloping It Up 26
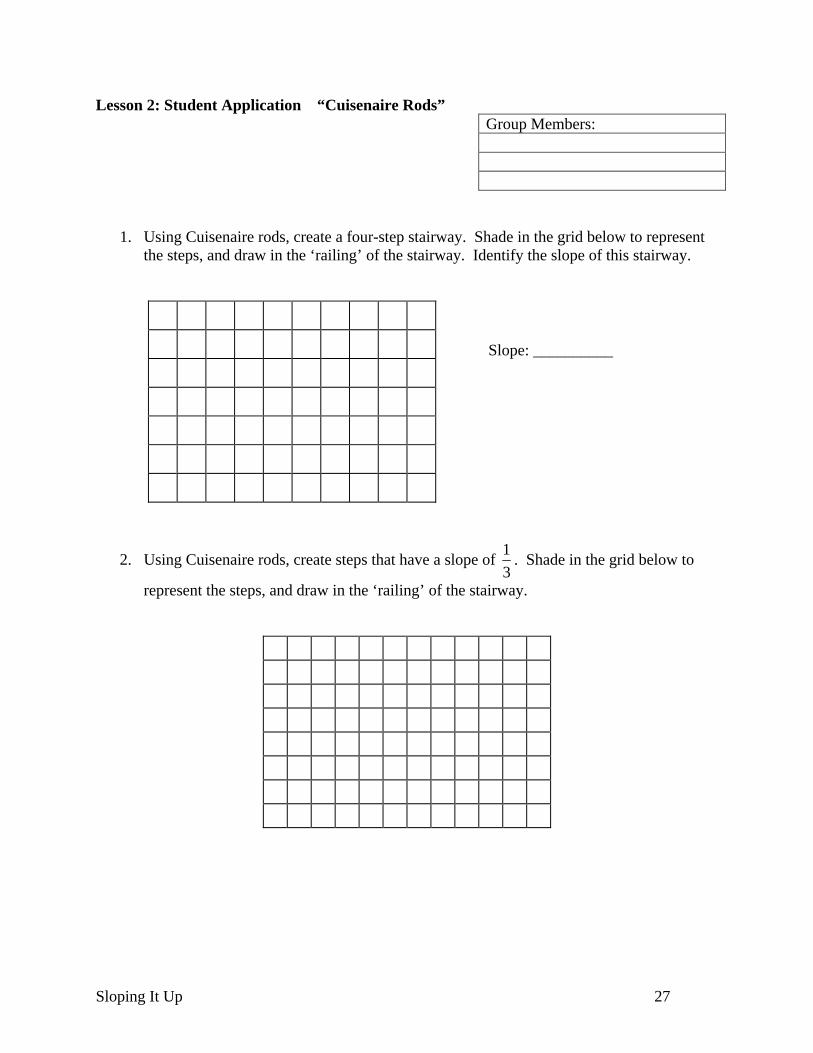
Lesson 2: Student Application “Cuisenaire Rods” Group Members:
1. Using Cuisenaire rods, create a four-step stairway. Shade in the grid below to represent the steps, and draw in the ‘railing’ of the stairway. Identify the slope of this stairway.
Slope: __________
2. Using Cuisenaire rods, create steps that have a slope of 31 . Shade in the grid below to
represent the steps, and draw in the ‘railing’ of the stairway.
Sloping It Up 27
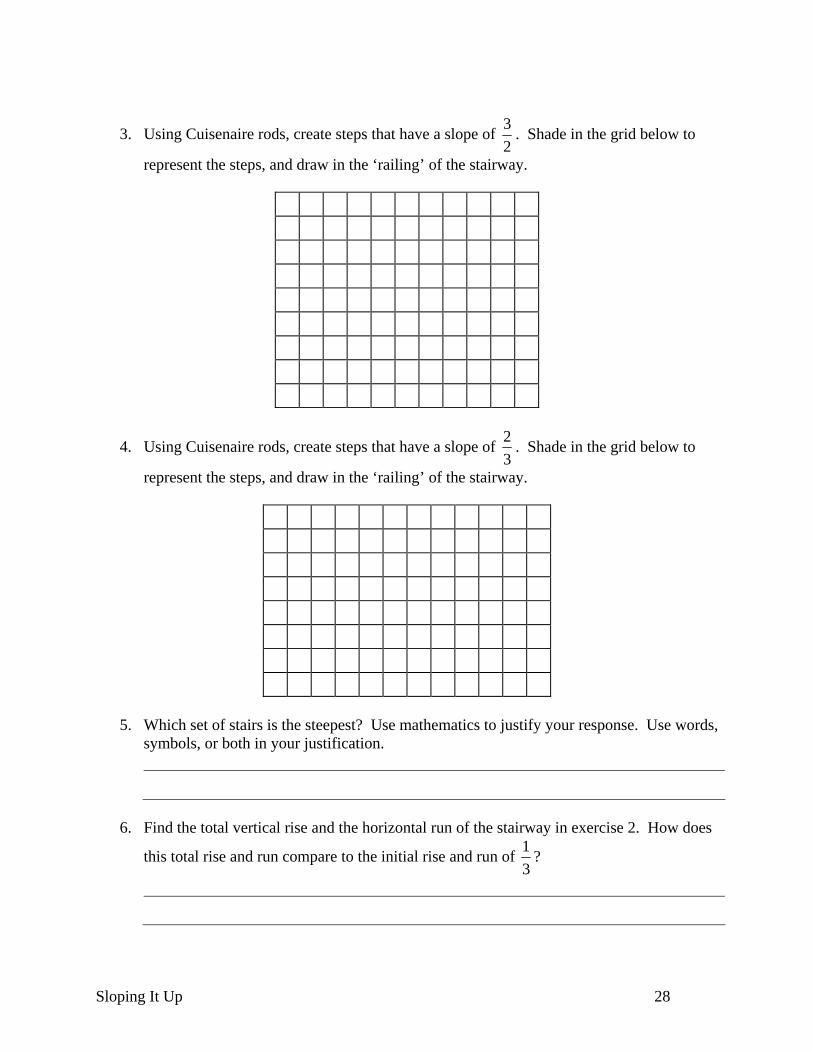
3. Using Cuisenaire rods, create steps that have a slope of 23 . Shade in the grid below to
represent the steps, and draw in the ‘railing’ of the stairway.
4. Using Cuisenaire rods, create steps that have a slope of 32 . Shade in the grid below to
represent the steps, and draw in the ‘railing’ of the stairway.
5. Which set of stairs is the steepest? Use mathematics to justify your response. Use words,
symbols, or both in your justification.
6. Find the total vertical rise and the horizontal run of the stairway in exercise 2. How does
this total rise and run compare to the initial rise and run of 31 ?
Sloping It Up 28
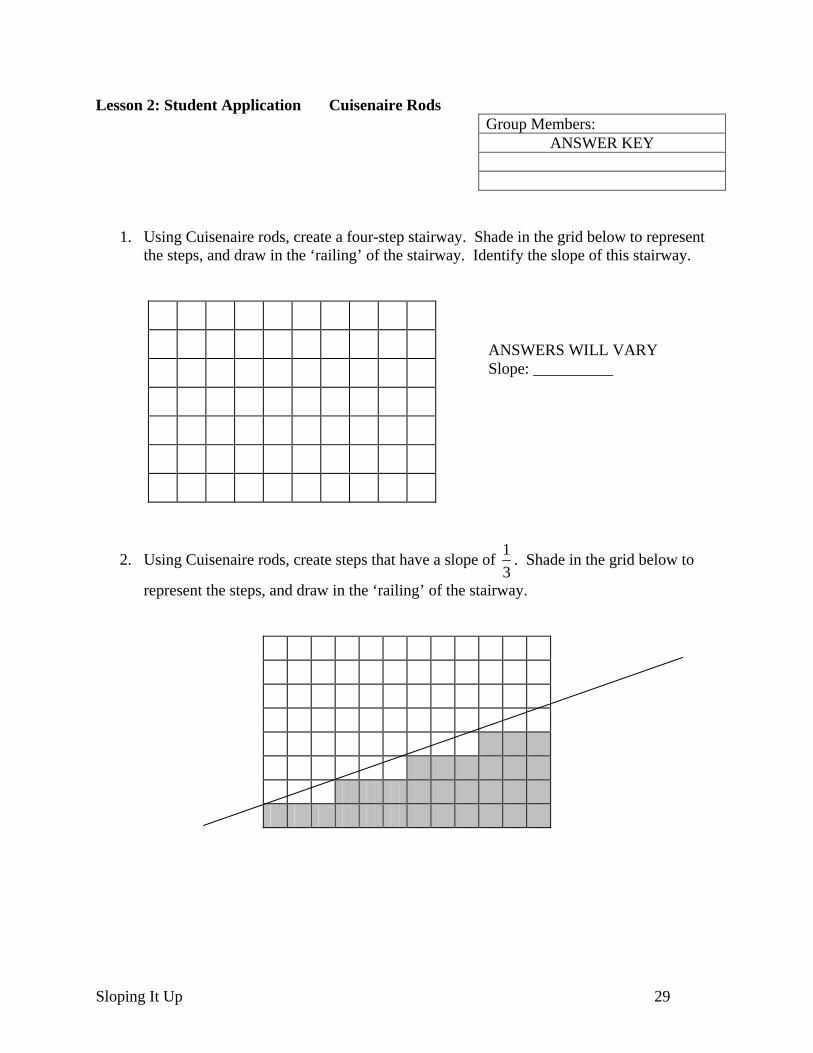
Lesson 2: Student Application Cuisenaire Rods Group Members:
ANSWER KEY
1. Using Cuisenaire rods, create a four-step stairway. Shade in the grid below to represent the steps, and draw in the ‘railing’ of the stairway. Identify the slope of this stairway.
2. Using Cuisenaire rods, create steps that have a slope of 31 . Shade in the grid below to
represent the steps, and draw in the ‘railing’ of the stairway.
ANSWERS WILL VARY Slope: __________
Sloping It Up 29
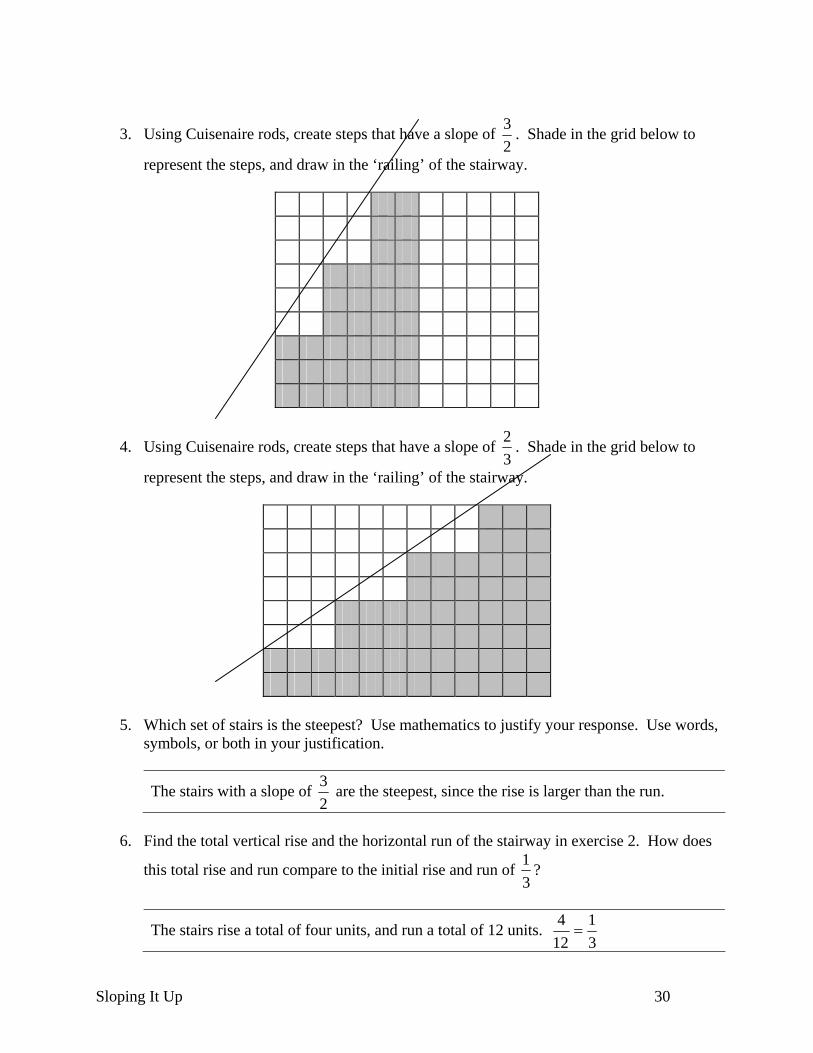
3. Using Cuisenaire rods, create steps that have a slope of 23 . Shade in the grid below to
represent the steps, and draw in the ‘railing’ of the stairway.
Sloping It Up 30
4. Using Cuisenaire rods, create steps that have a slope of 32 . Shade in the grid below to
represent the steps, and draw in the ‘railing’ of the stairway.
5. Which set of stairs is the steepest? Use mathematics to justify your response. Use words,
symbols, or both in your justification.
The stairs with a slope of 23 are the steepest, since the rise is larger than the run.
6. Find the total vertical rise and the horizontal run of the stairway in exercise 2. How does
this total rise and run compare to the initial rise and run of 31 ?
The stairs rise a total of four units, and run a total of 12 units. 31
124=
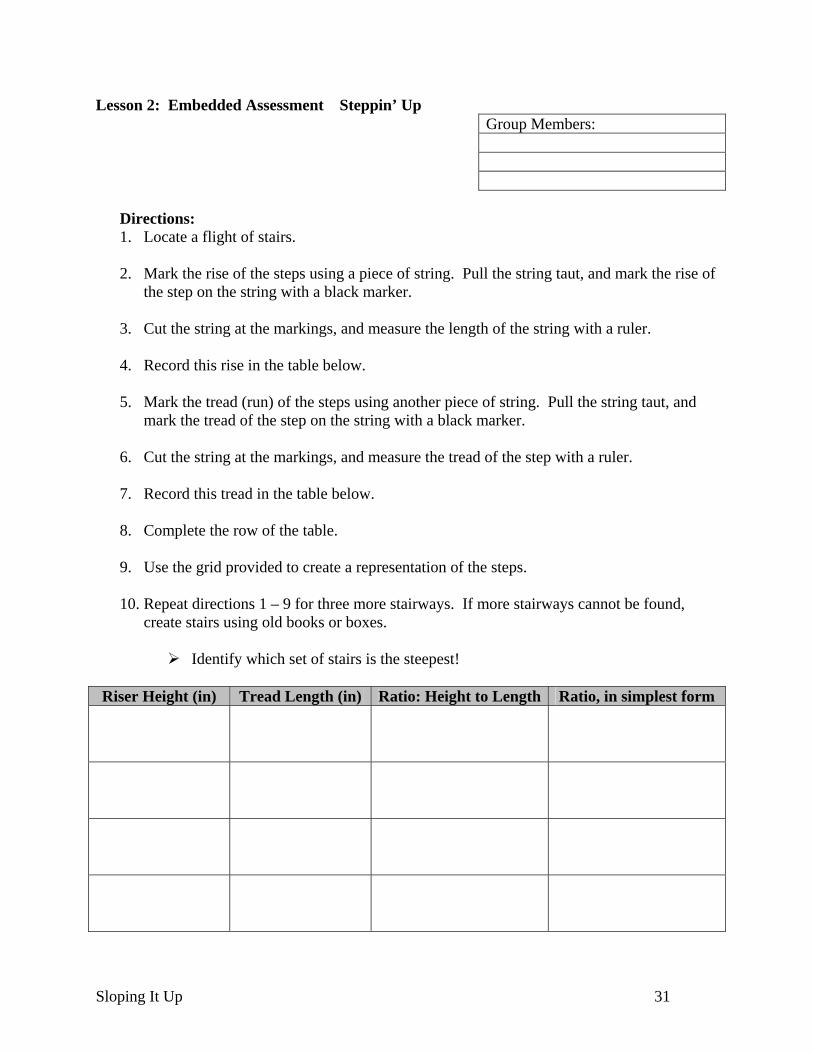
Lesson 2: Embedded Assessment Steppin’ Up Group Members:
Directions: 1. Locate a flight of stairs. 2. Mark the rise of the steps using a piece of string. Pull the string taut, and mark the rise of
the step on the string with a black marker.
3. Cut the string at the markings, and measure the length of the string with a ruler.
4. Record this rise in the table below.
5. Mark the tread (run) of the steps using another piece of string. Pull the string taut, and mark the tread of the step on the string with a black marker.
6. Cut the string at the markings, and measure the tread of the step with a ruler.
7. Record this tread in the table below.
8. Complete the row of the table.
9. Use the grid provided to create a representation of the steps.
10. Repeat directions 1 – 9 for three more stairways. If more stairways cannot be found,
create stairs using old books or boxes.
Identify which set of stairs is the steepest! Riser Height (in) Tread Length (in) Ratio: Height to Length Ratio, in simplest form
Sloping It Up 31
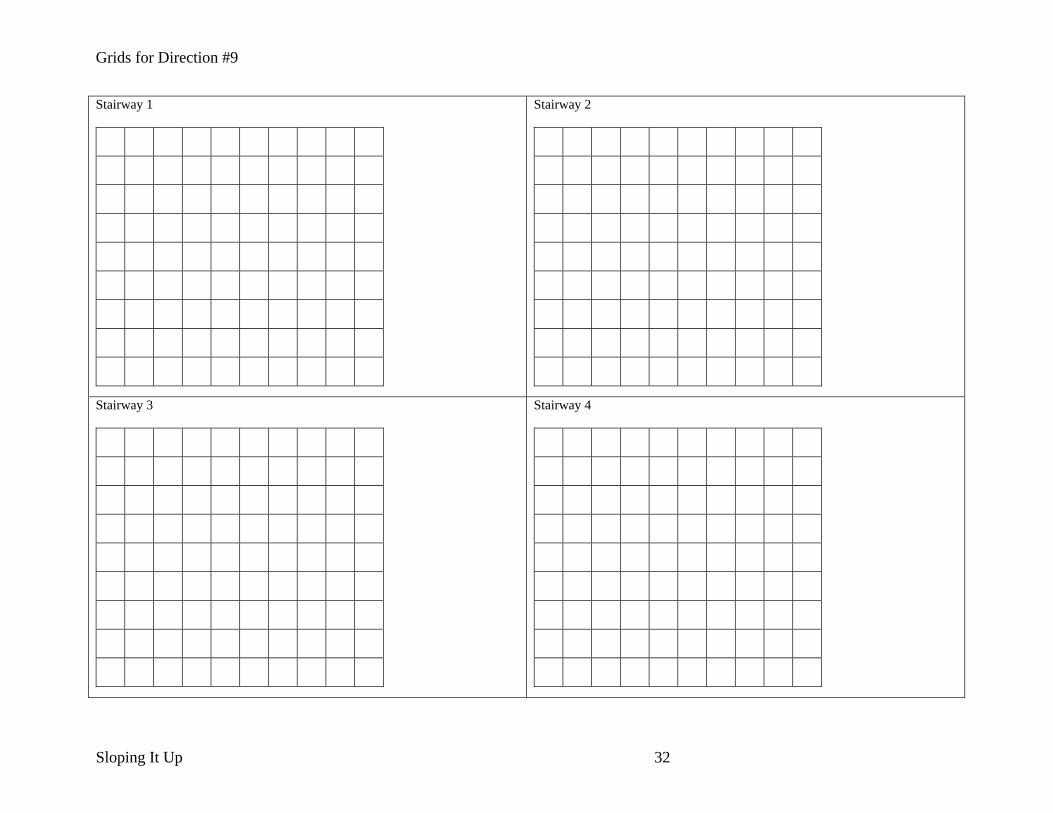
Grids for Direction #9
Stairway 1
Stairway 2
Stairway 3
Stairway 4
Sloping It Up 32
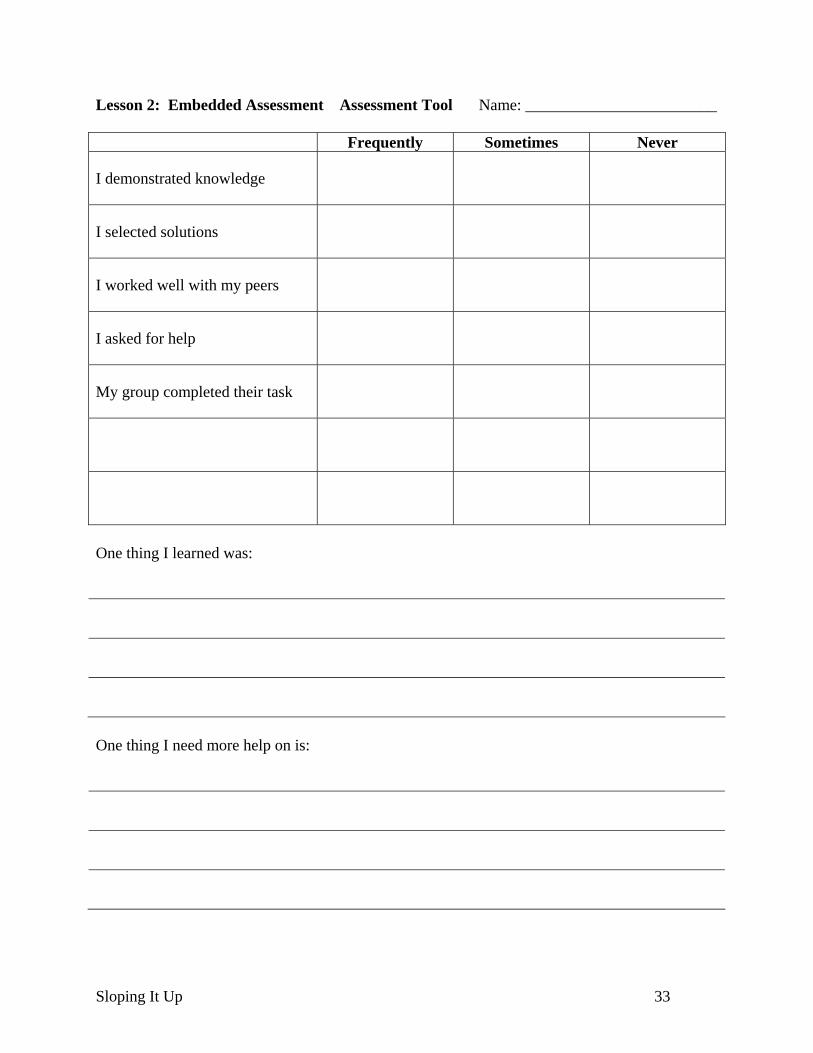
Lesson 2: Embedded Assessment Assessment Tool Name: ________________________ Frequently Sometimes Never
I demonstrated knowledge
I selected solutions
I worked well with my peers
I asked for help
My group completed their task
One thing I learned was:
One thing I need more help on is:
Sloping It Up 33
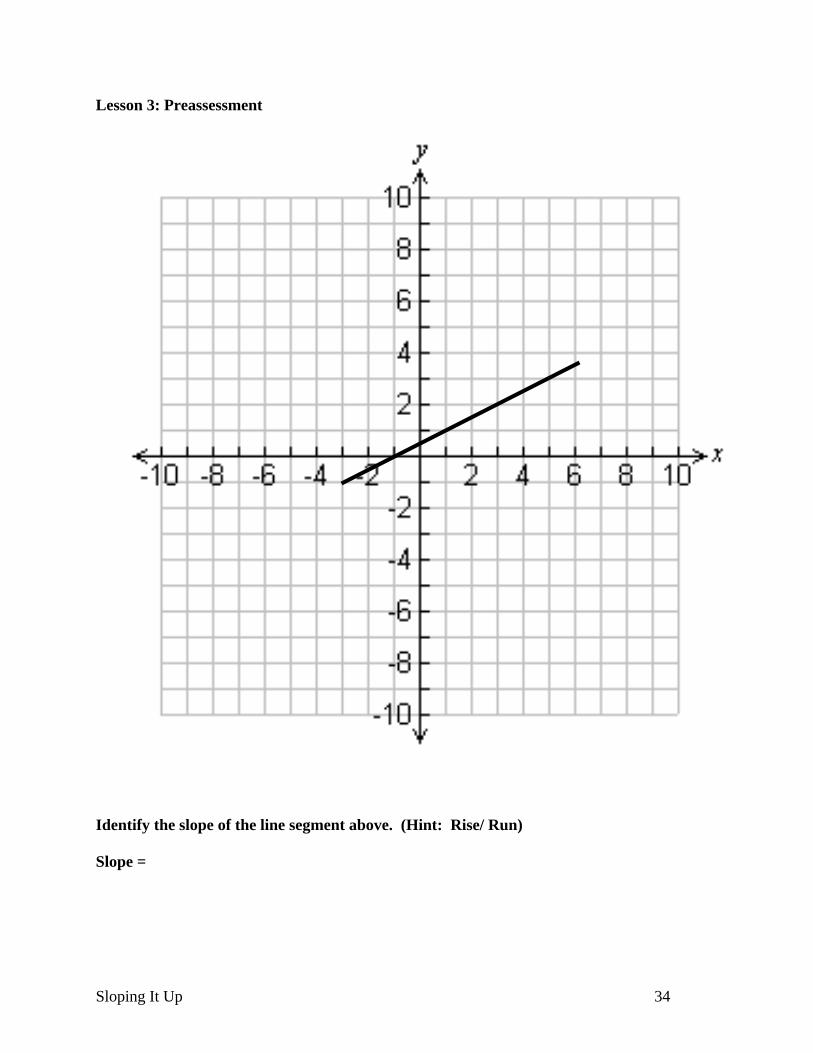
Lesson 3: Preassessment
Identify the slope of the line segment above. (Hint: Rise/ Run) Slope =
Sloping It Up 34
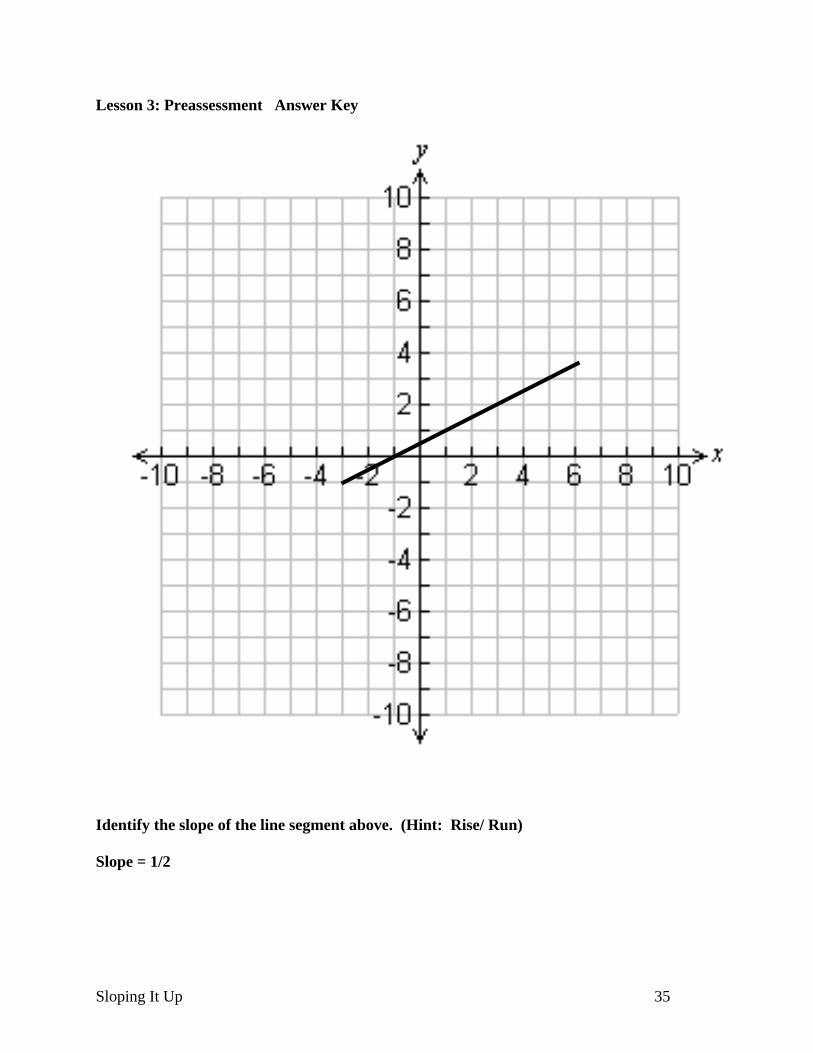
Lesson 3: Preassessment Answer Key
Identify the slope of the line segment above. (Hint: Rise/ Run) Slope = 1/2
Sloping It Up 35
Sloping It Up 36
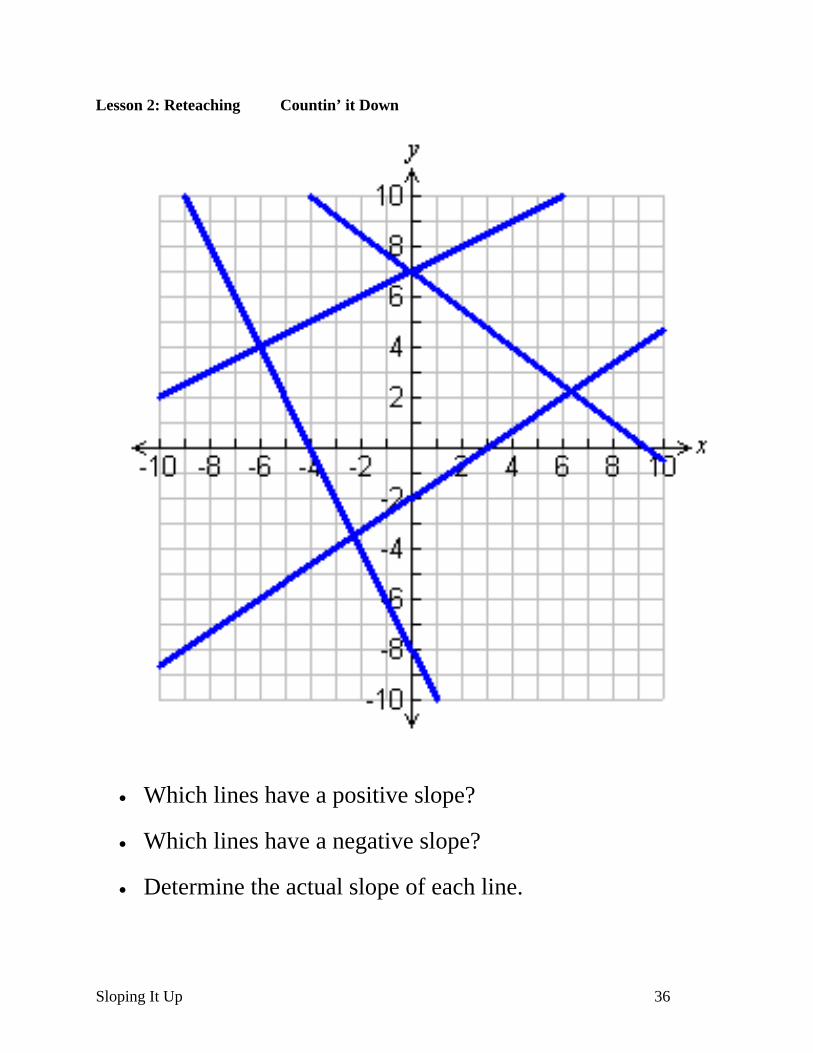
Lesson 2: Reteaching Countin’ it Down
• Which lines have a positive slope? • Which lines have a negative slope?
• Determine the actual slope of each line.
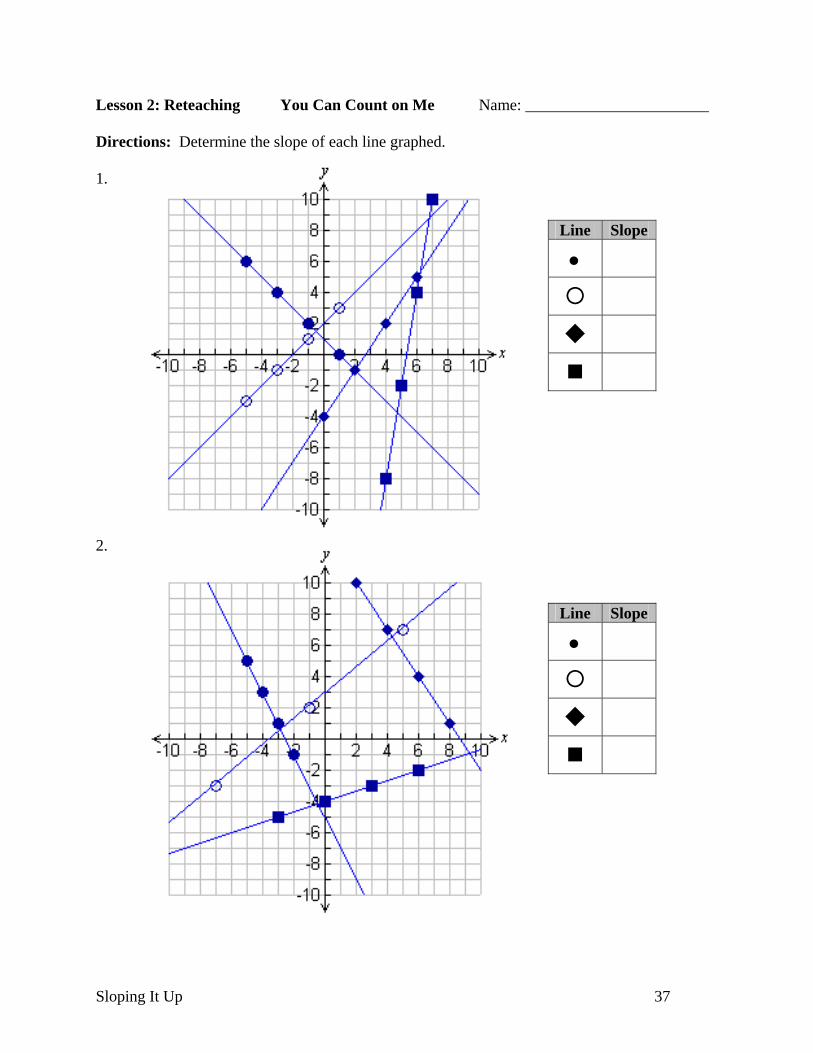
Lesson 2: Reteaching You Can Count on Me Name: _______________________ Directions: Determine the slope of each line graphed.
Line Slope
•
Line Slope
1. 2.
•
Sloping It Up 37
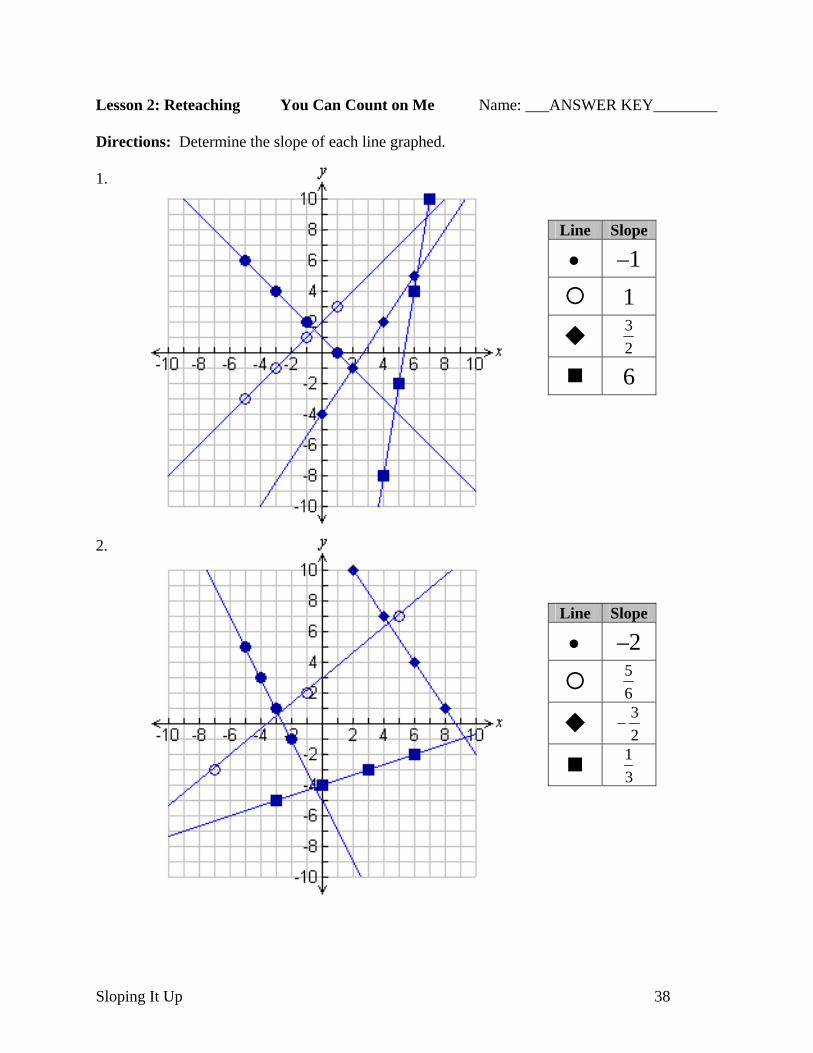
Lesson 2: Reteaching You Can Count on Me Name: ___ANSWER KEY________ Directions: Determine the slope of each line graphed.
1. 2.
Line Slope
–1 • 1
23
6
Line Slope
• –2
65
23
−
31
Sloping It Up 38
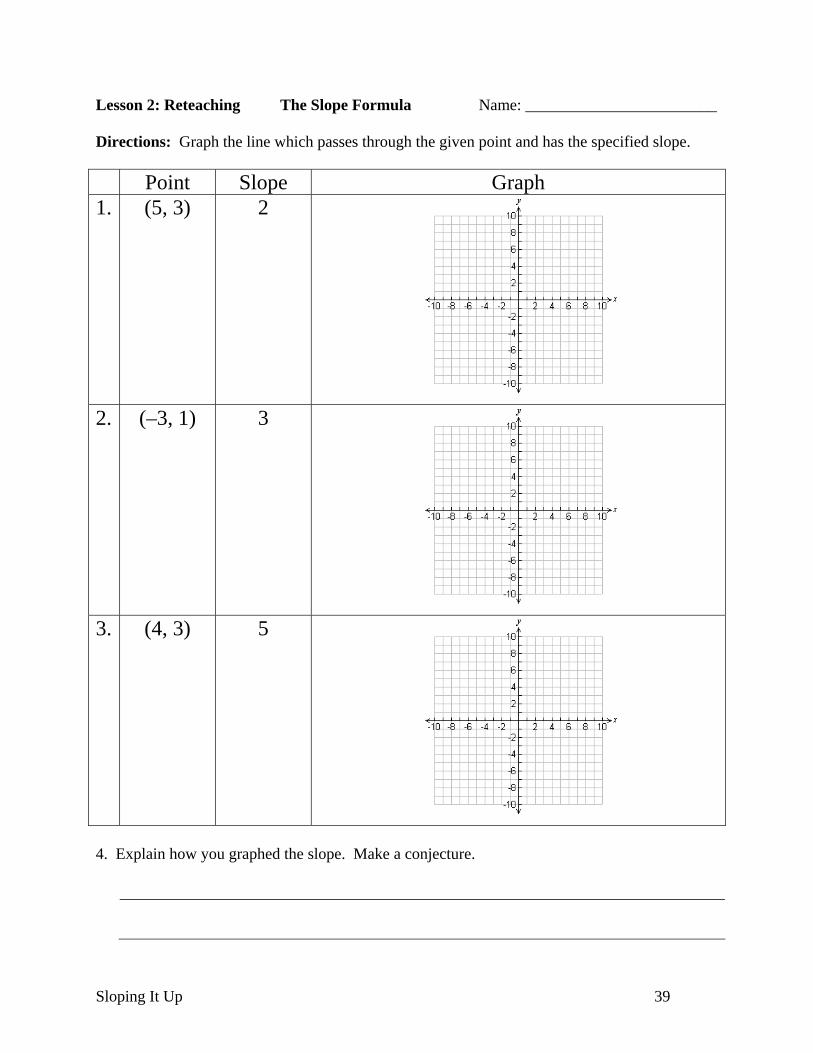
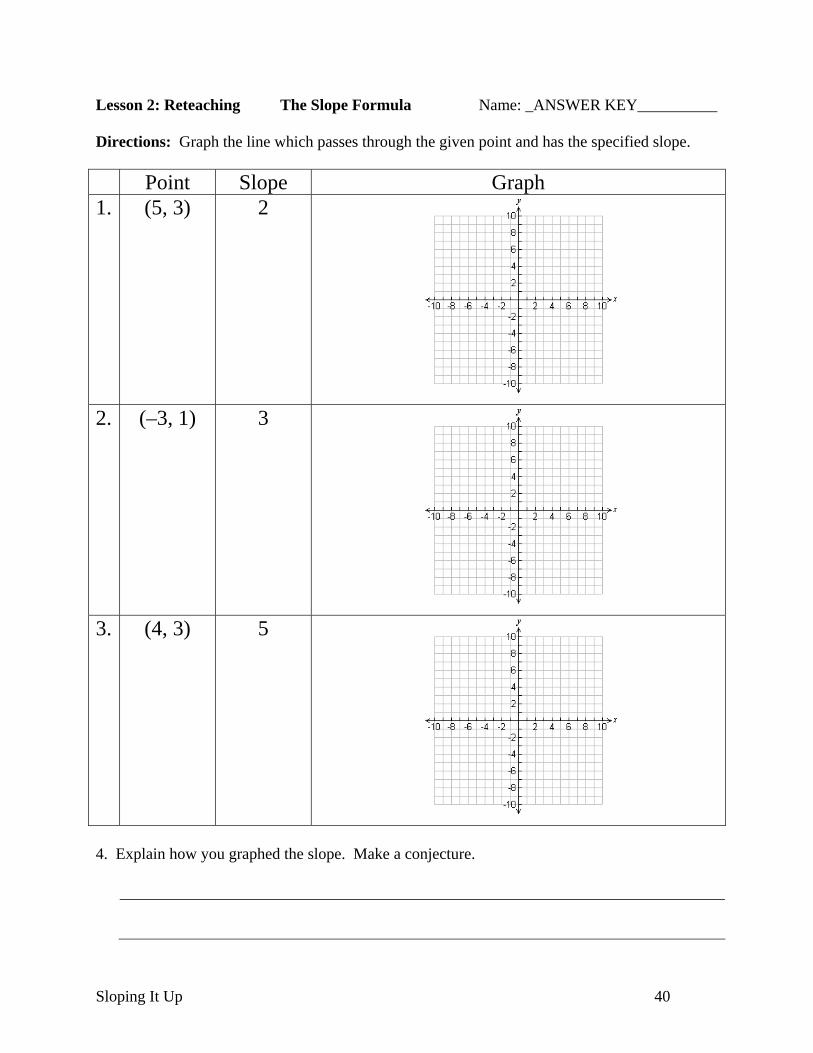
Lesson 2: Reteaching The Slope Formula Name: ________________________ Directions: Graph the line which passes through the given point and has the specified slope. Point Slope Graph 1. (5, 3) 2
2. (–3, 1) 3
3. (4, 3) 5
4. Explain how you graphed the slope. Make a conjecture.
Sloping It Up 39
Lesson 2: Reteaching The Slope Formula Name: _ANSWER KEY__________ Directions: Graph the line which passes through the given point and has the specified slope. Point Slope Graph 1. (5, 3) 2
2. (–3, 1) 3
3. (4, 3) 5
4. Explain how you graphed the slope. Make a conjecture.
Sloping It Up 40
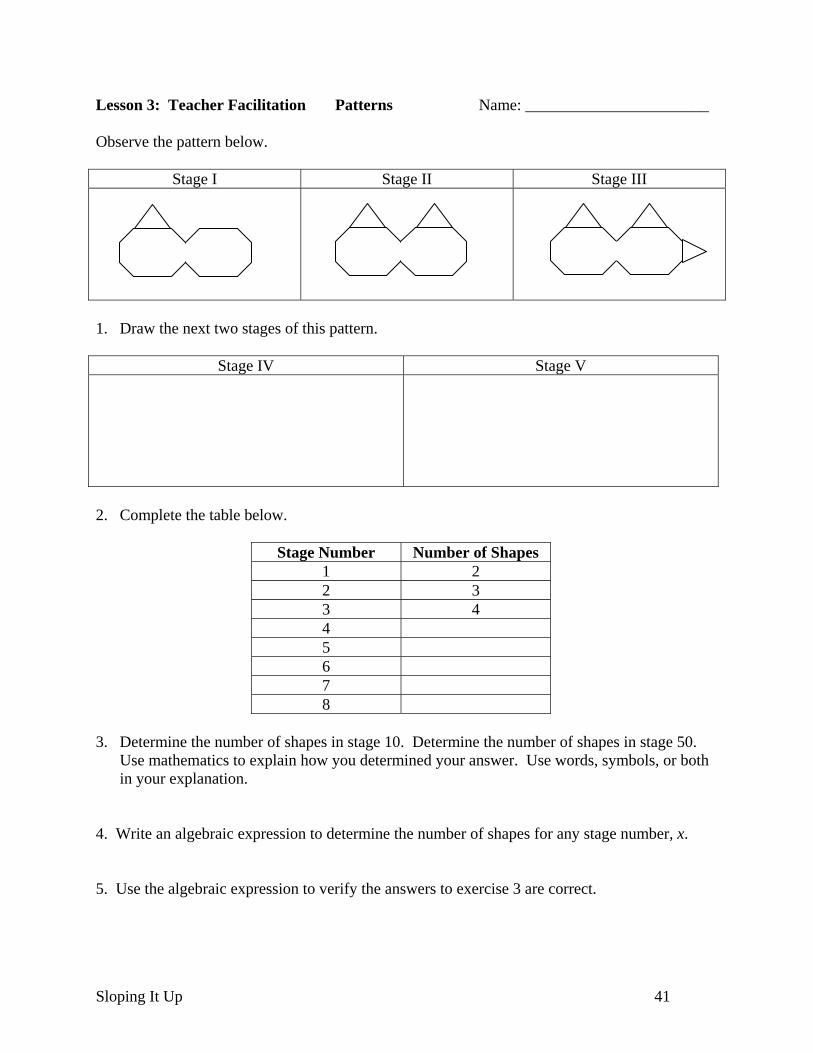
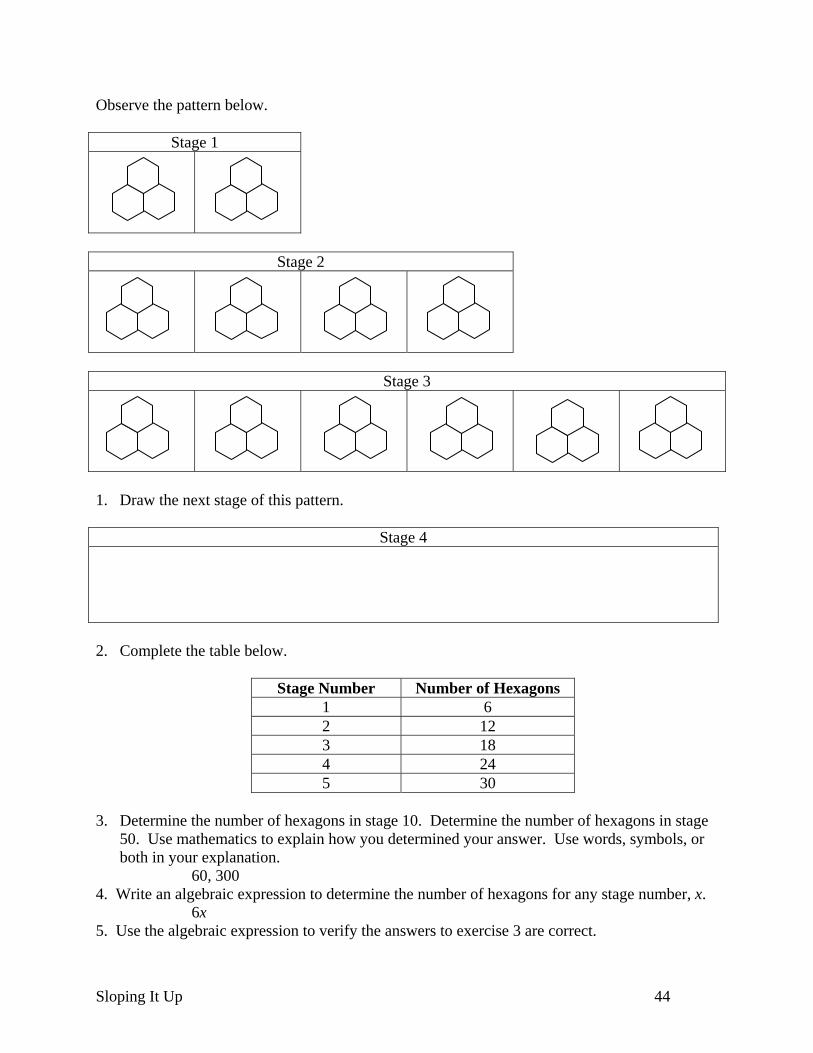
Lesson 3: Teacher Facilitation Patterns Name: _______________________ Observe the pattern below.
Stage I Stage II Stage III
1. Draw the next two stages of this pattern.
Stage IV Stage V
2. Complete the table below.
Stage Number Number of Shapes 1 2 2 3 3 4 4 5 6 7 8
3. Determine the number of shapes in stage 10. Determine the number of shapes in stage 50.
Use mathematics to explain how you determined your answer. Use words, symbols, or both in your explanation.
4. Write an algebraic expression to determine the number of shapes for any stage number, x. 5. Use the algebraic expression to verify the answers to exercise 3 are correct.
Sloping It Up 41
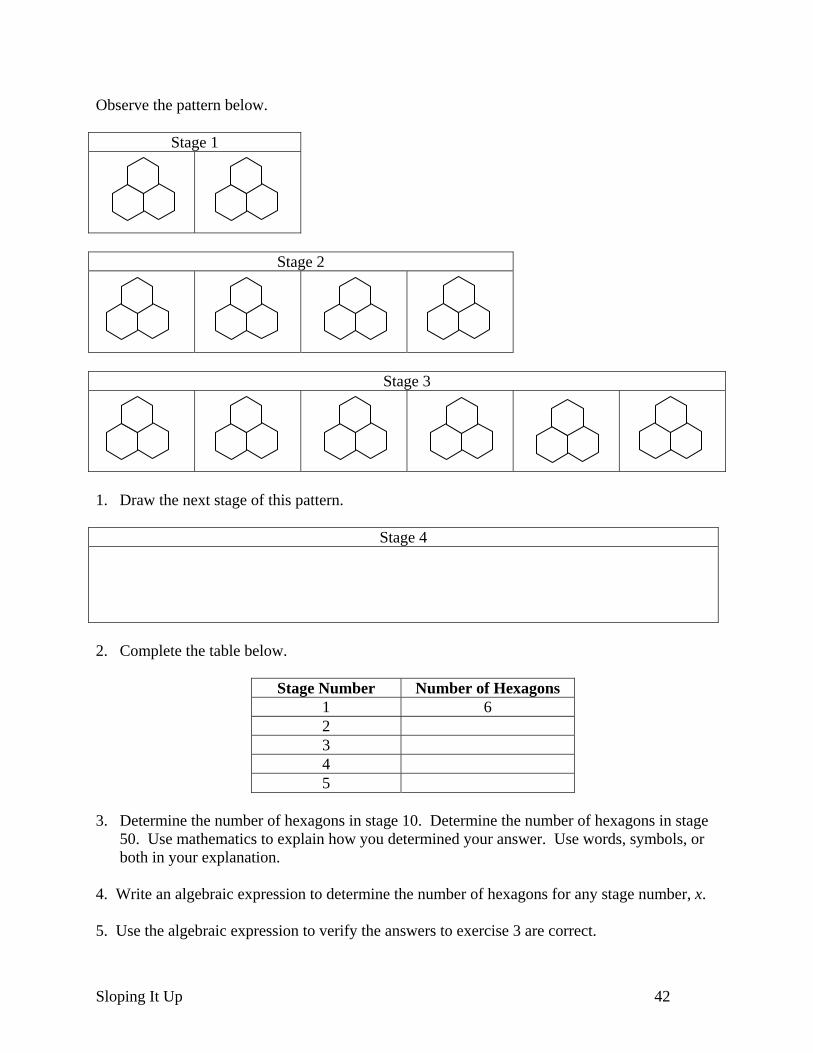
Observe the pattern below.
Stage 1
Stage 2
Stage 3
1. Draw the next stage of this pattern.
Stage 4
2. Complete the table below.
Stage Number Number of Hexagons 1 6 2 3 4 5
3. Determine the number of hexagons in stage 10. Determine the number of hexagons in stage
50. Use mathematics to explain how you determined your answer. Use words, symbols, or both in your explanation.
4. Write an algebraic expression to determine the number of hexagons for any stage number, x. 5. Use the algebraic expression to verify the answers to exercise 3 are correct.
Sloping It Up 42
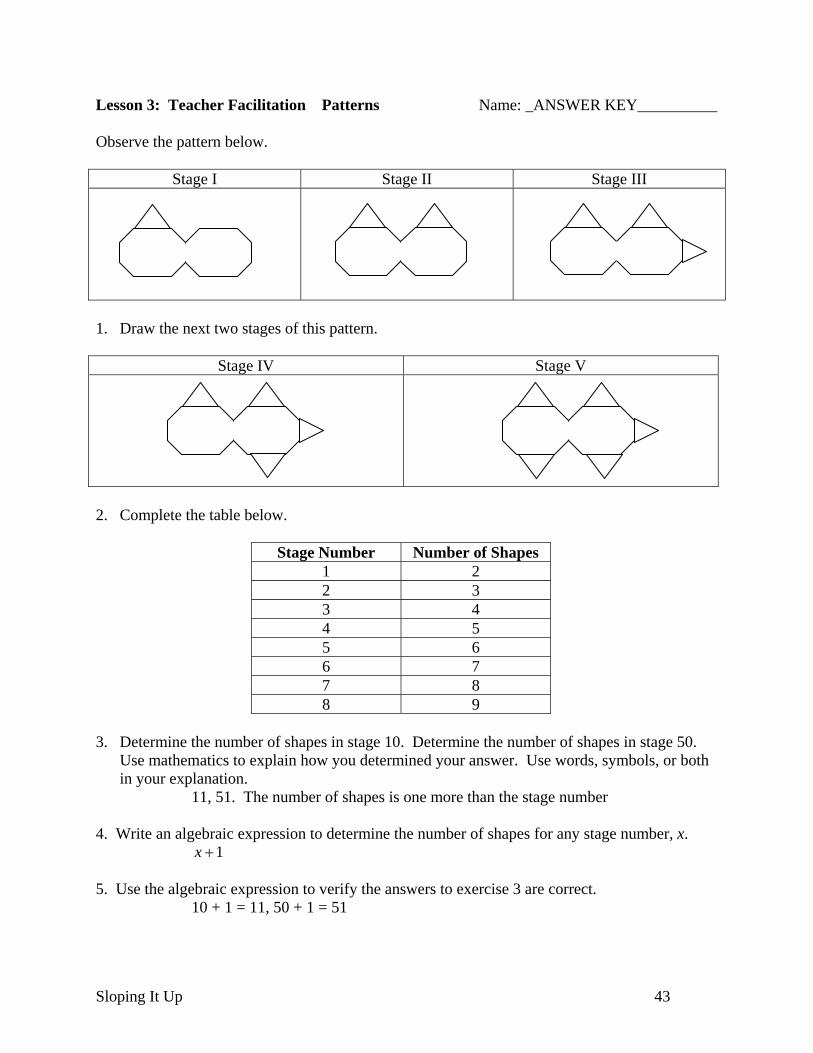
Lesson 3: Teacher Facilitation Patterns Name: _ANSWER KEY__________ Observe the pattern below.
Stage I Stage II Stage III
1. Draw the next two stages of this pattern.
Stage IV Stage V
2. Complete the table below.
Stage Number Number of Shapes 1 2 2 3 3 4 4 5 5 6 6 7 7 8 8 9
3. Determine the number of shapes in stage 10. Determine the number of shapes in stage 50.
Use mathematics to explain how you determined your answer. Use words, symbols, or both in your explanation.
11, 51. The number of shapes is one more than the stage number 4. Write an algebraic expression to determine the number of shapes for any stage number, x. 1+x 5. Use the algebraic expression to verify the answers to exercise 3 are correct. 10 + 1 = 11, 50 + 1 = 51
Sloping It Up 43
Observe the pattern below.
Stage 1
Stage 2
Stage 3
1. Draw the next stage of this pattern.
Stage 4
2. Complete the table below.
Stage Number Number of Hexagons 1 6 2 12 3 18 4 24 5 30
3. Determine the number of hexagons in stage 10. Determine the number of hexagons in stage
50. Use mathematics to explain how you determined your answer. Use words, symbols, or both in your explanation.
60, 300 4. Write an algebraic expression to determine the number of hexagons for any stage number, x. 6x 5. Use the algebraic expression to verify the answers to exercise 3 are correct.
Sloping It Up 44
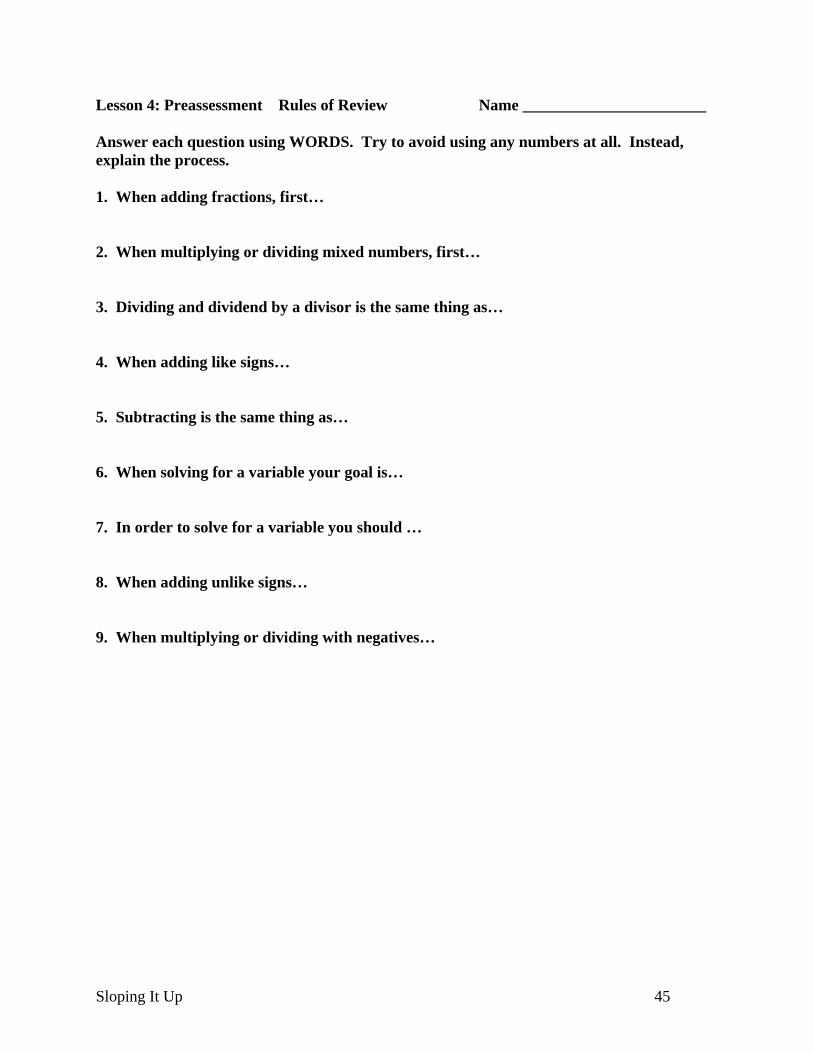
Lesson 4: Preassessment Rules of Review Name _______________________ Answer each question using WORDS. Try to avoid using any numbers at all. Instead, explain the process. 1. When adding fractions, first… 2. When multiplying or dividing mixed numbers, first… 3. Dividing and dividend by a divisor is the same thing as… 4. When adding like signs… 5. Subtracting is the same thing as… 6. When solving for a variable your goal is… 7. In order to solve for a variable you should … 8. When adding unlike signs… 9. When multiplying or dividing with negatives…
Sloping It Up 45
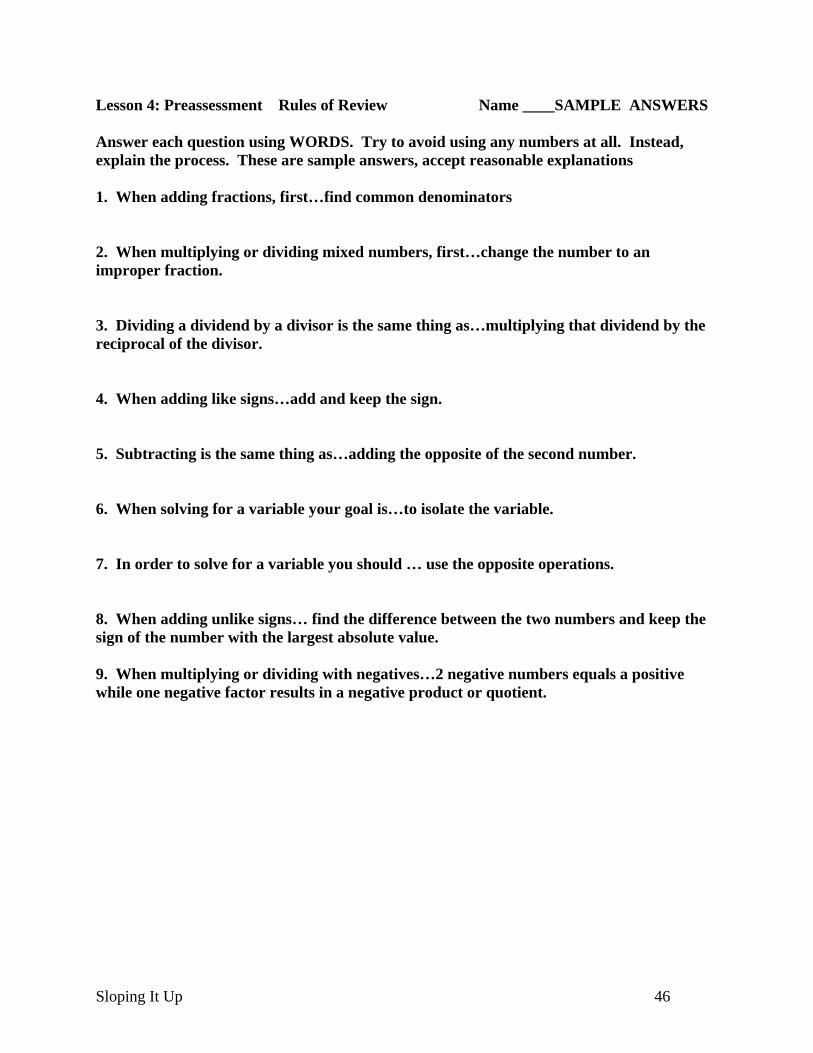
Lesson 4: Preassessment Rules of Review Name ____SAMPLE ANSWERS Answer each question using WORDS. Try to avoid using any numbers at all. Instead, explain the process. These are sample answers, accept reasonable explanations 1. When adding fractions, first…find common denominators 2. When multiplying or dividing mixed numbers, first…change the number to an improper fraction. 3. Dividing a dividend by a divisor is the same thing as…multiplying that dividend by the reciprocal of the divisor. 4. When adding like signs…add and keep the sign. 5. Subtracting is the same thing as…adding the opposite of the second number. 6. When solving for a variable your goal is…to isolate the variable. 7. In order to solve for a variable you should … use the opposite operations. 8. When adding unlike signs… find the difference between the two numbers and keep the sign of the number with the largest absolute value. 9. When multiplying or dividing with negatives…2 negative numbers equals a positive while one negative factor results in a negative product or quotient.
Sloping It Up 46
Sloping It Up 47
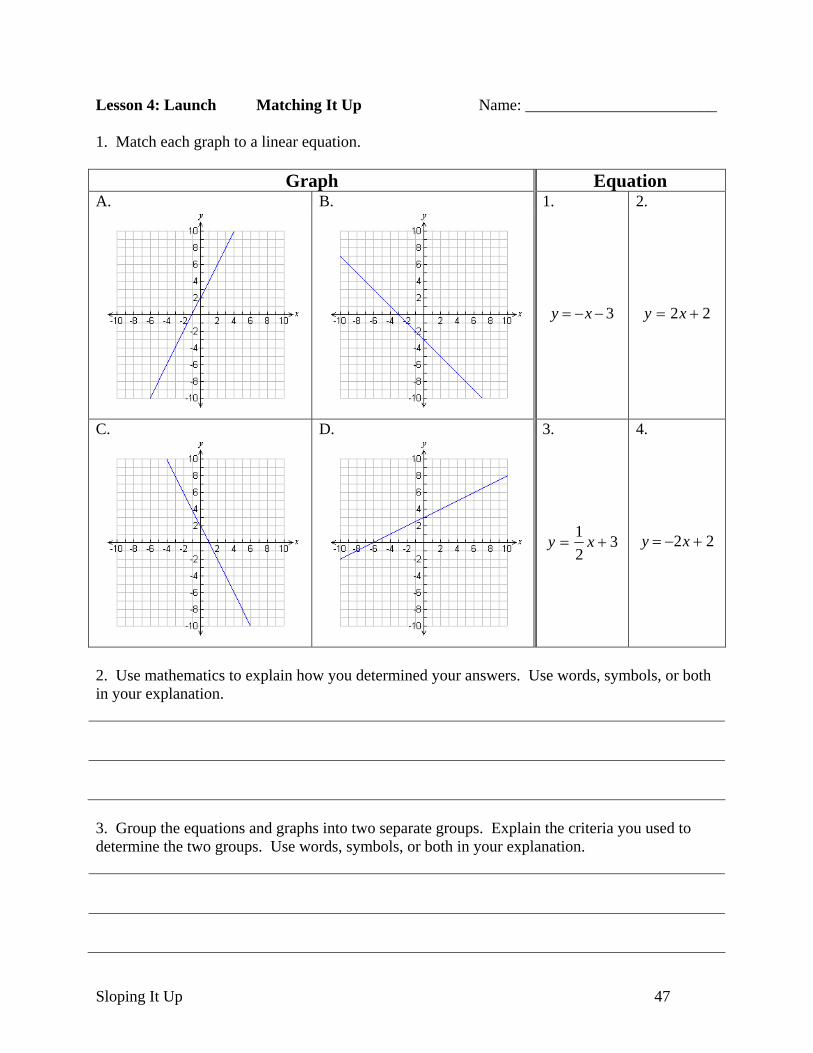
Lesson 4: Launch Matching It Up Name: ________________________ 1. Match each graph to a linear equation.
Graph Equation A. B. 1. 2.
3−−= xy 22 += xy
C. D. 3. 4.
321
+= xy 22 +−= xy
2. Use mathematics to explain how you determined your answers. Use words, symbols, or both in your explanation.
3. Group the equations and graphs into two separate groups. Explain the criteria you used to determine the two groups. Use words, symbols, or both in your explanation.
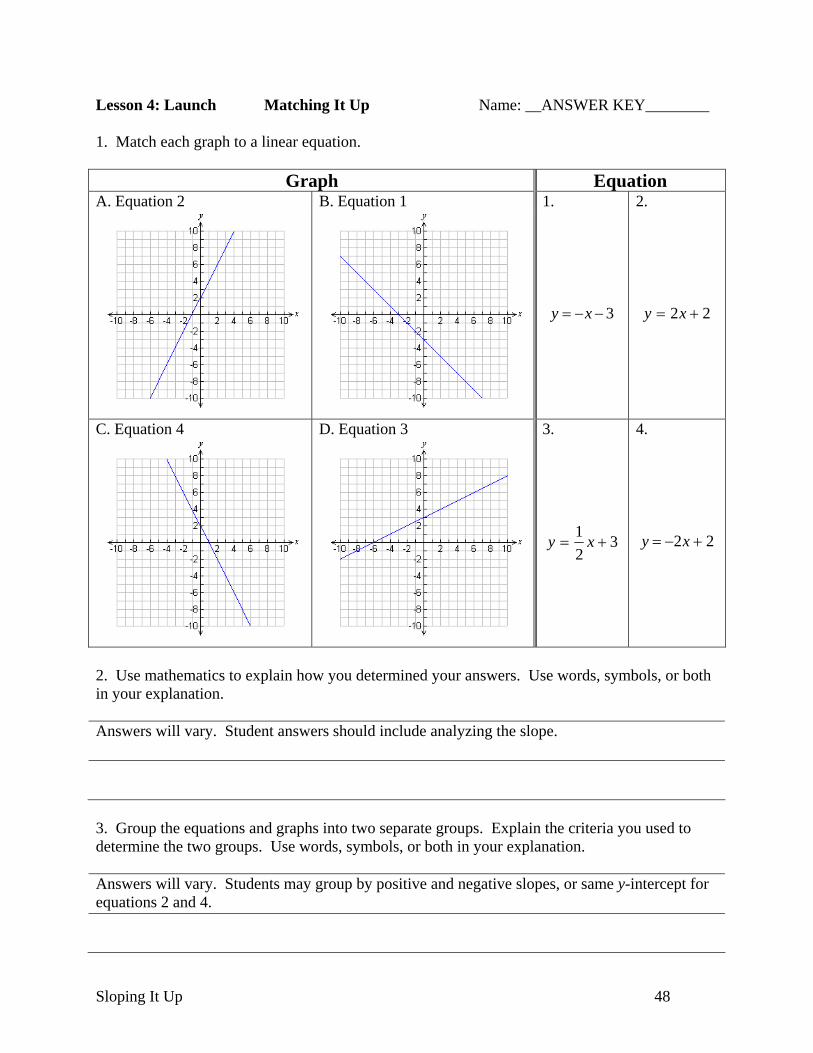
Lesson 4: Launch Matching It Up Name: __ANSWER KEY________ 1. Match each graph to a linear equation.
Graph Equation A. Equation 2 B. Equation 1 1. 2.
3−−= xy 22 += xy
C. Equation 4 D. Equation 3 3. 4.
321
+= xy 22 +−= xy
2. Use mathematics to explain how you determined your answers. Use words, symbols, or both in your explanation. Answers will vary. Student answers should include analyzing the slope.
3. Group the equations and graphs into two separate groups. Explain the criteria you used to determine the two groups. Use words, symbols, or both in your explanation. Answers will vary. Students may group by positive and negative slopes, or same y-intercept for equations 2 and 4.
Sloping It Up 48
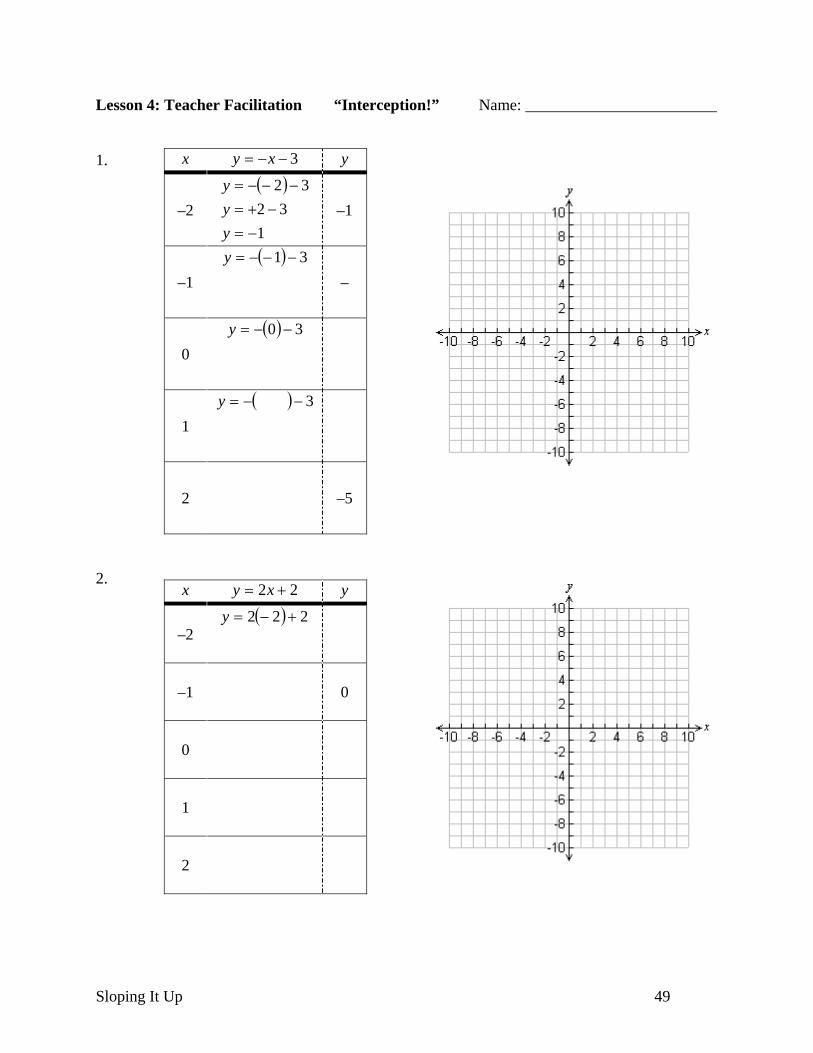
Lesson 4: Teacher Facilitation “Interception!” Name: ________________________ 1. x 3−−= xy y
–2 ( )
3232
−+=−−−=
yy
1−=y –1
–1 ( ) 31 −−−=y
–
0 ( ) 30 −−=y
1 ( ) 3−−=y
2 –5
2.
x 22 += xy y
–2 ( ) 222 +−=y
–1 0
0
1
2
Sloping It Up 49
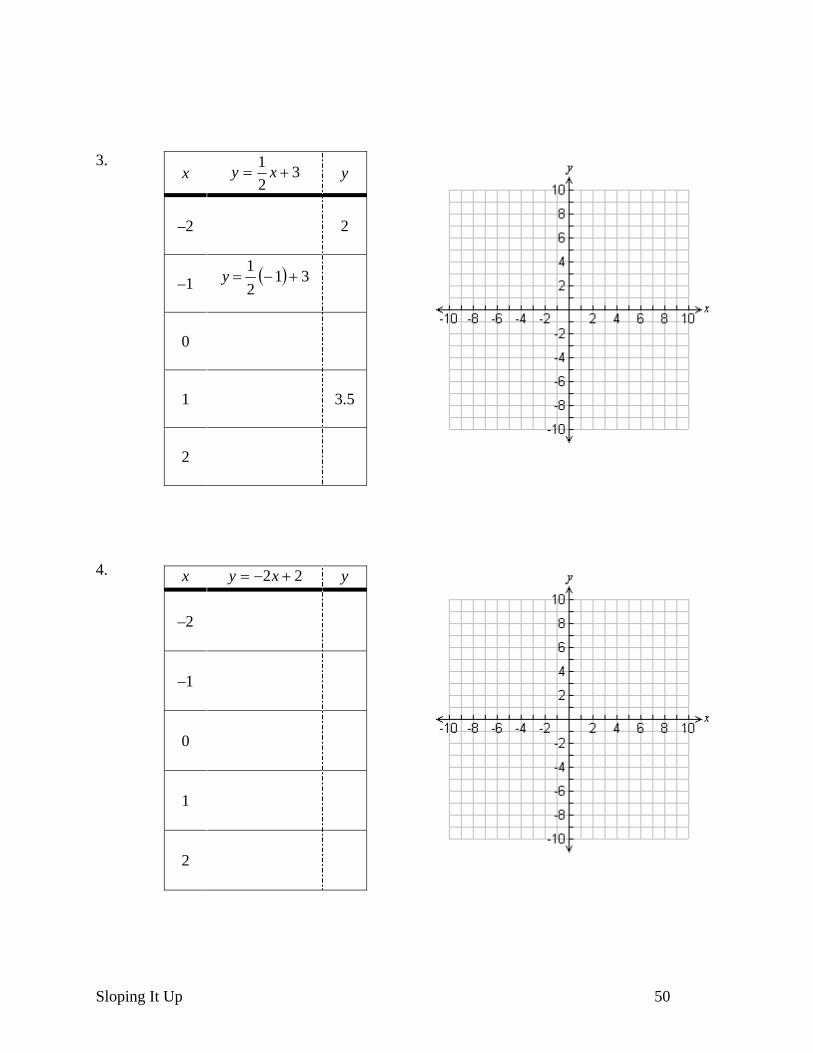
3.
x 321
+= xy y
–2 2
–1 ( ) 3121
+−=y
0
1 3.5
2
4. x 22 +−= xy y
–2
–1
0
1
2
Sloping It Up 50
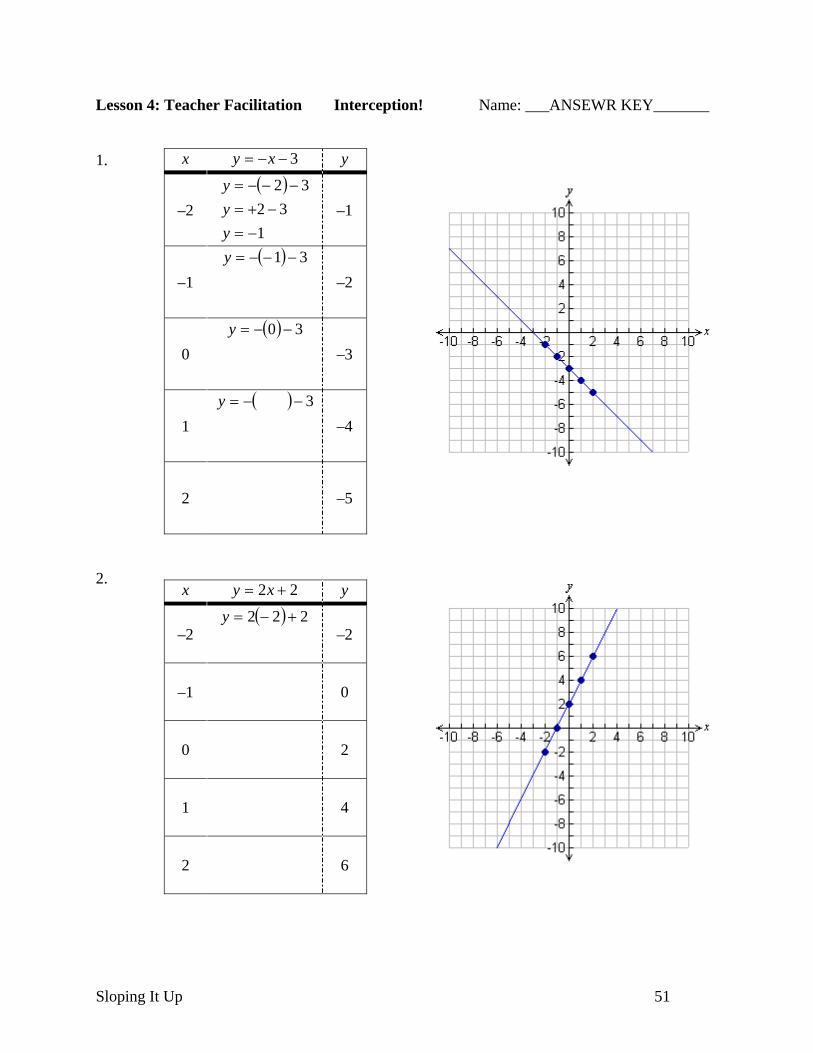
Lesson 4: Teacher Facilitation Interception! Name: ___ANSEWR KEY_______ 1. x 3−−= xy y
–2 ( )
3232
−+=−−−=
yy
1−=y –1
–1 ( ) 31 −−−=y
–2
0 ( ) 30 −−=y
–3
1 ( ) 3−−=y
–4
2 –5
2.
x 22 += xy y
–2 ( ) 222 +−=y
–2
–1 0
0 2
1 4
2 6
Sloping It Up 51
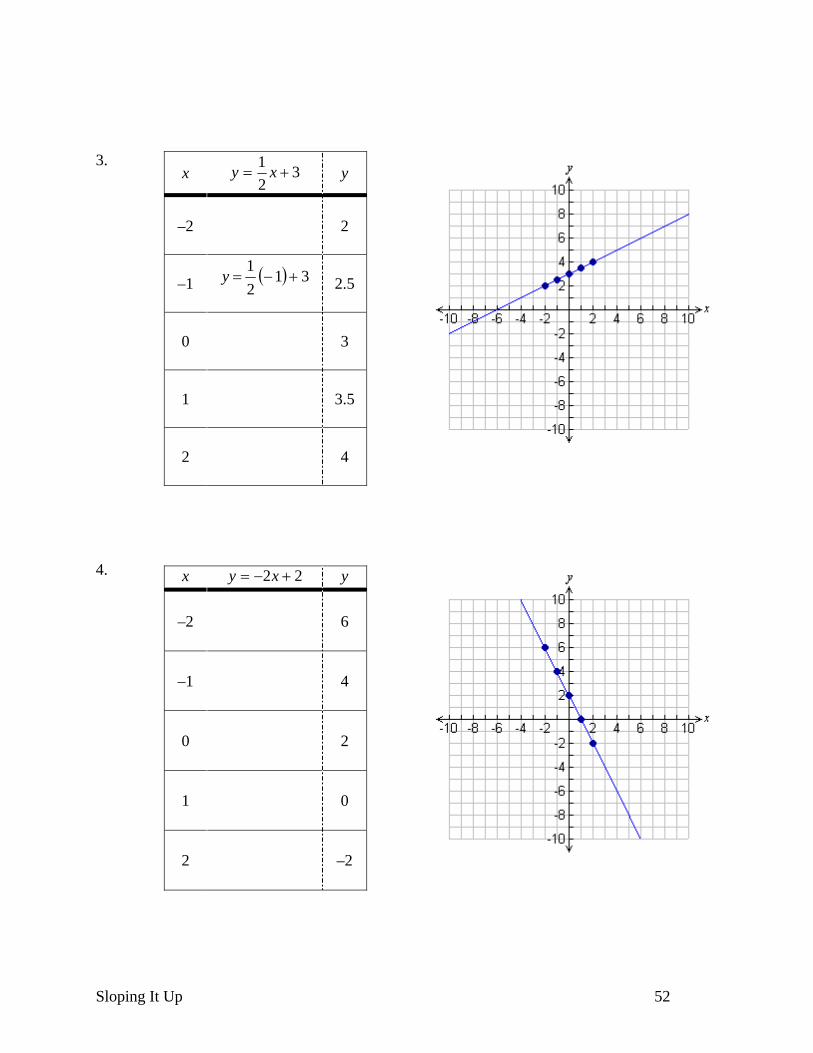
3.
x 321
+= xy y
–2 2
–1 ( ) 3121
+−=y 2.5
0 3
1 3.5
2 4
4. x 22 +−= xy y
–2 6
–1 4
0 2
1 0
2 –2
Sloping It Up 52
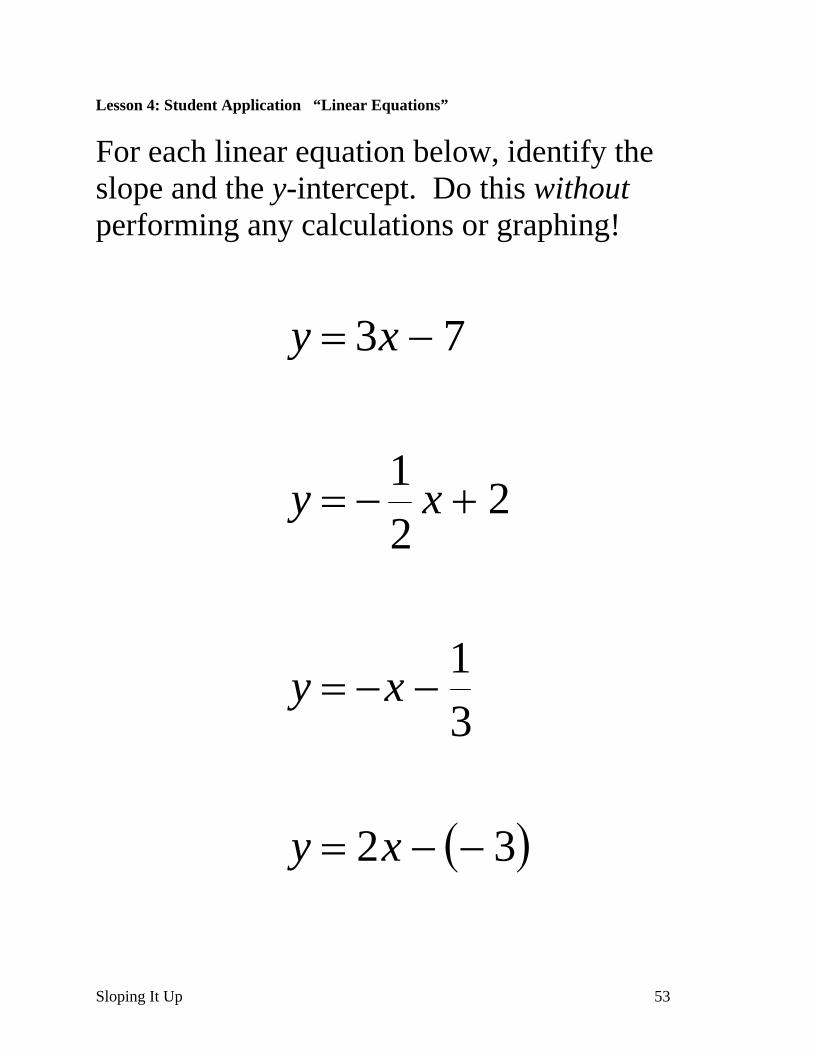
Lesson 4: Student Application “Linear Equations”
For each linear equation below, identify the slope and the y-intercept. Do this without performing any calculations or graphing!
( )32
31
221
73
−−=
−−=
+−=
−=
xy
xy
xy
xy
Sloping It Up 53
Sloping It Up 54
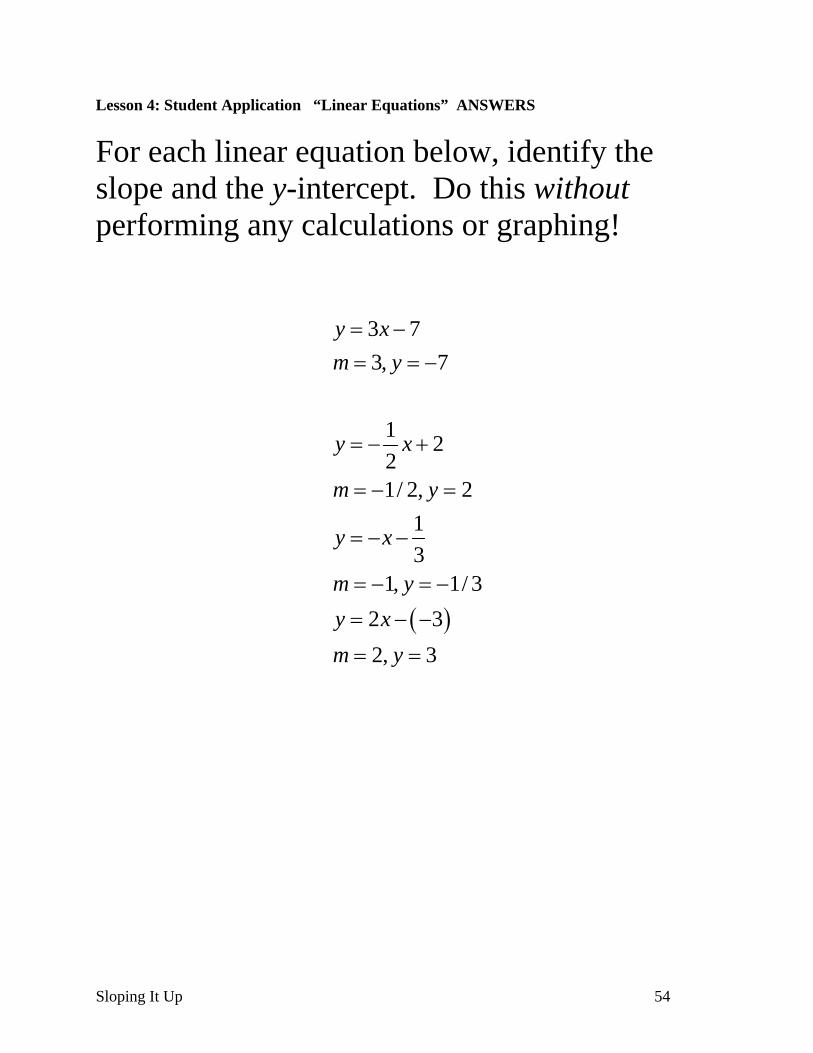
Lesson 4: Student Application “Linear Equations” ANSWERS
For each linear equation below, identify the slope and the y-intercept. Do this without performing any calculations or graphing!
( )
3 73, 7
1 221/ 2, 2
13
1, 1/ 32 32, 3
y xm y
y x
m y
y x
m yy xm y
= −= = −
= − +
= − =
= − −
= − = −
= − −
= =
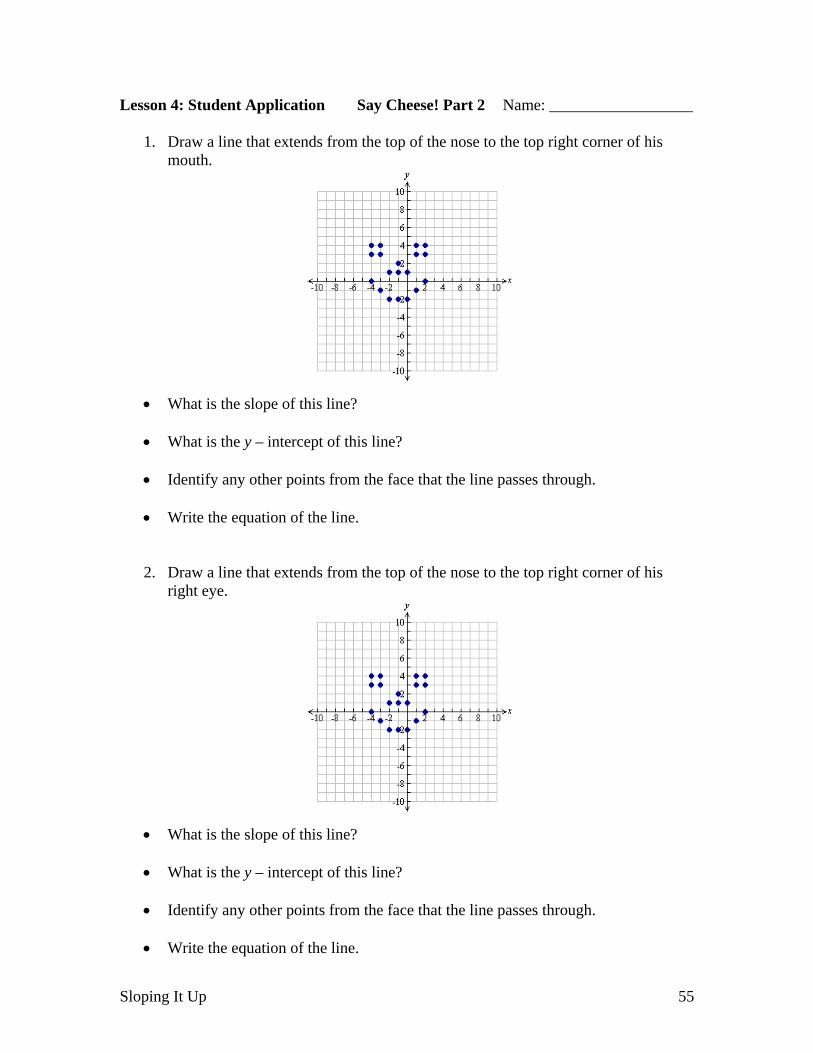
Lesson 4: Student Application Say Cheese! Part 2 Name: __________________
1. Draw a line that extends from the top of the nose to the top right corner of his mouth.
• What is the slope of this line? • What is the y – intercept of this line?
• Identify any other points from the face that the line passes through.
• Write the equation of the line.
2. Draw a line that extends from the top of the nose to the top right corner of his right eye.
• What is the slope of this line? • What is the y – intercept of this line?
• Identify any other points from the face that the line passes through.
• Write the equation of the line.
Sloping It Up 55
Sloping It Up 56
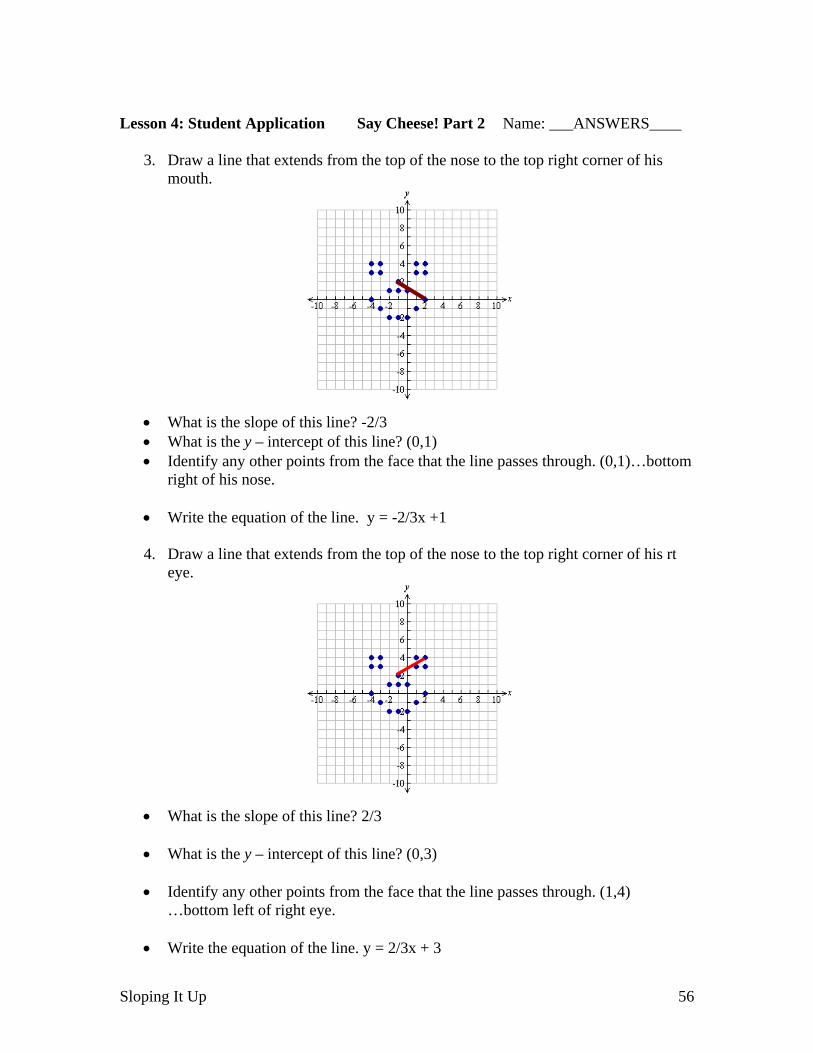
esson 4: Student Application Say Cheese! Part 2 Name: ___ANSWERS____
3. Draw a line that extends from the top of the nose to the top right corner of his
L
mouth.
• What is the slope of this line? -2/3
? (0,1) the line passes through. (0,1)…bottom
• Write the equation of the line. y = -2/3x +1
4. Draw a line that extends from the top of the nose to the top right corner of his rt
• What is the y – intercept of this line• Identify any other points from the face that
right of his nose.
eye.
• What is the slope of this line? 2/3
What is the y – intercept of this line? (0,3)
• Identify any other points from the face that the line passes through. (1,4)
• Write the equation of the line. y = 2/3x + 3
•
…bottom left of right eye.

Lesson 4: Student Application Name: _______________________
Imagine the mouse can fly! What is the quickest way the mouse can get to the cheese?
The Mouse Takes the Cheese – Again!
1. Connect the two red X’s together with one line, to show the mouse’s flight path. 2. What is the slope of this line? 3. What is the y – intercept of this line?
4. Write the equation of the line.
Sloping It Up 57
Sloping It Up 58
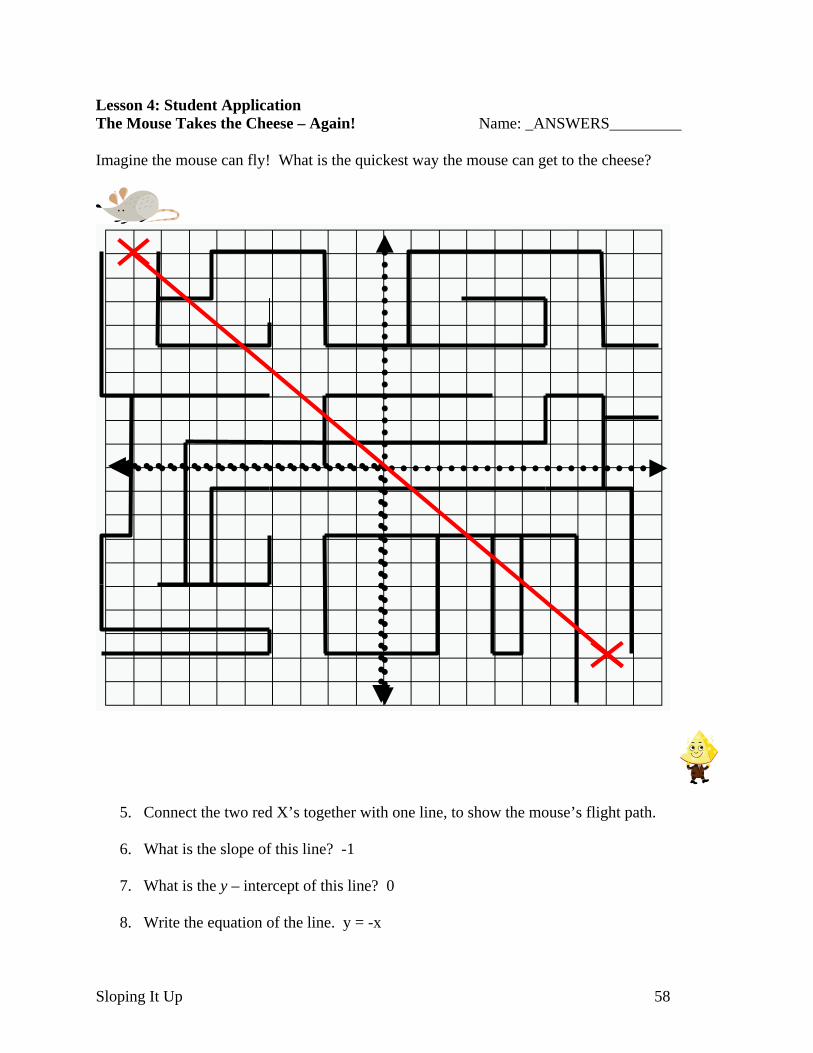
Lesson 4: Student Application The Mouse Takes the Cheese – Again! Name: _ANSWERS_________ Imagine the mouse can fly! What is the quickest way the mouse can get to the cheese?
5. Connect the two red X’s together with one line, to show the mouse’s flight path. 6. What is the slope of this line? -1
0
y = -x
7. What is the y – intercept of this line?
8. Write the equation of the line.
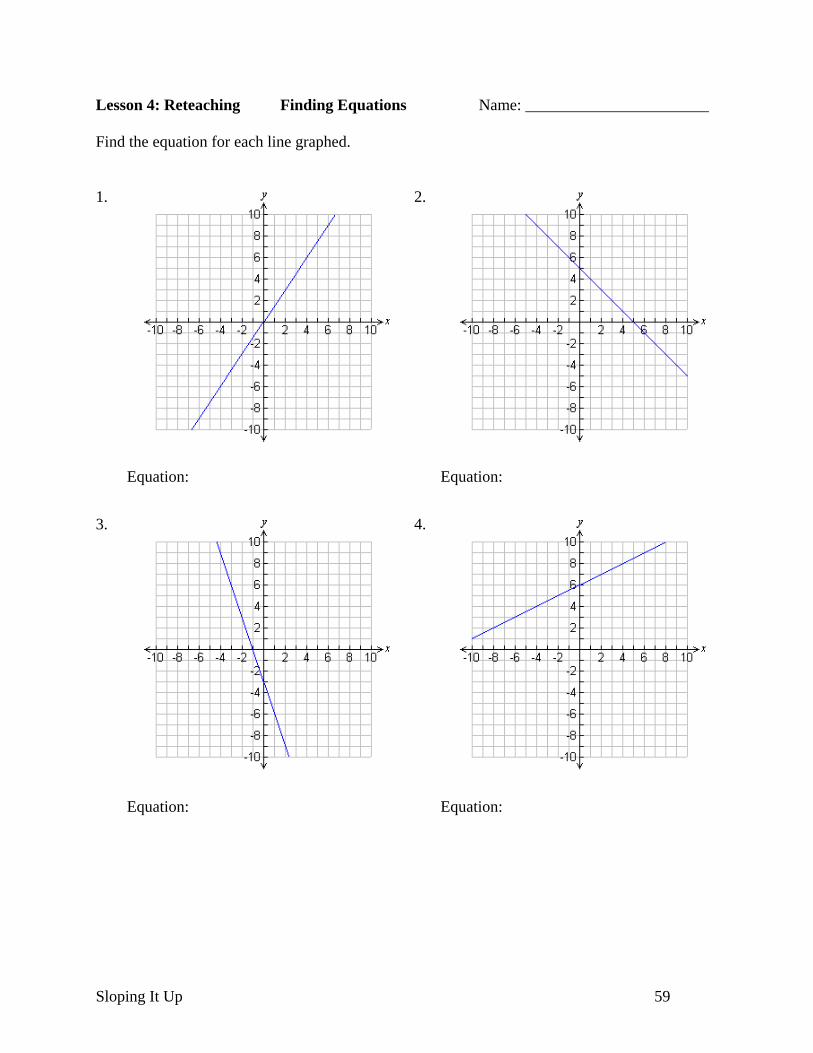
Lesson 4: Reteaching Finding Equations Name: _______________________
ind the equation for each line graphed.
1.
F
2.
Equation: Equation:
3.
4.
Equation: Equation:
Sloping It Up 59

Lesson 4: Reteaching Finding Equations Name: _ANSWER KEY__________ Find the equation for each line graphed.
2.1.
Equation: xy23
= Equation: 5+−= xy
3.
4.
Equation: 33 −−= xy Equation: 621
+= xy
Sloping It Up 60
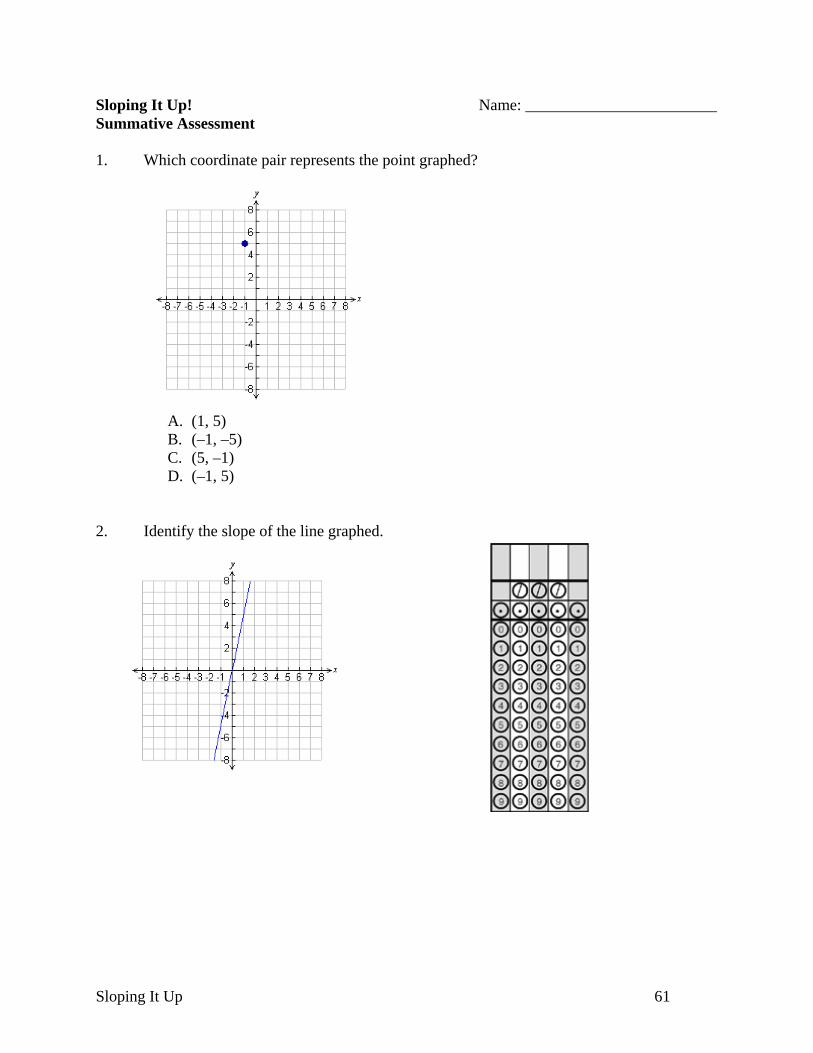
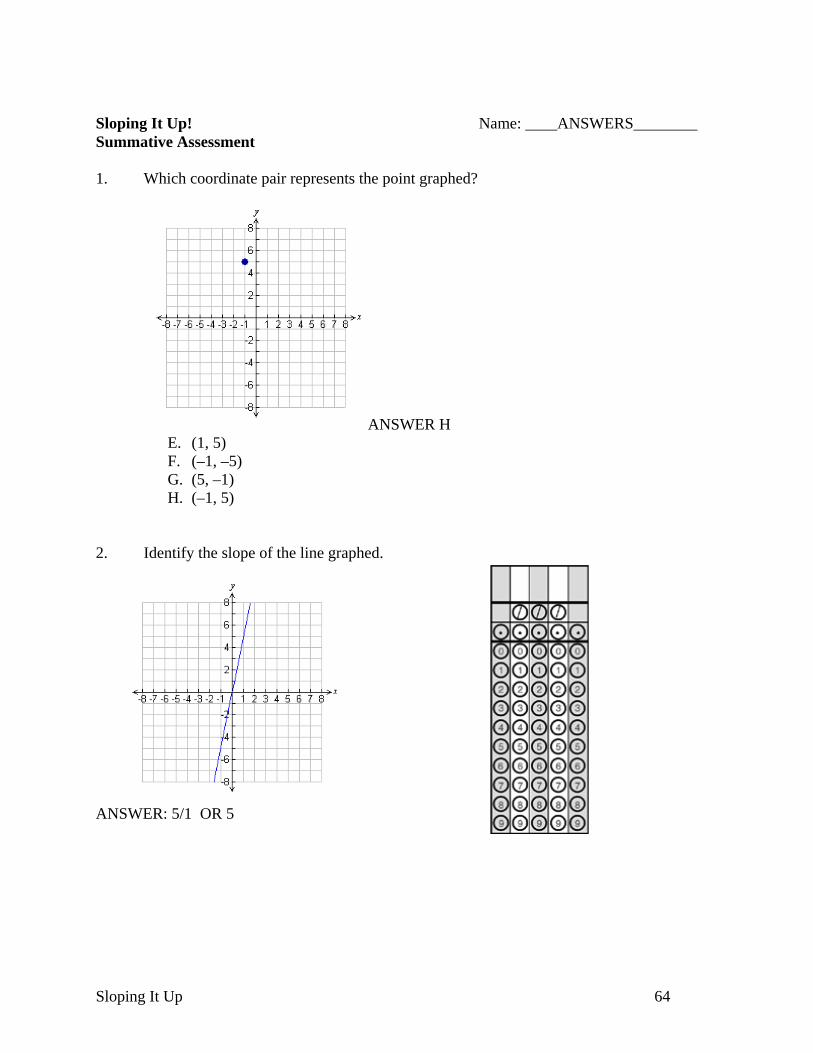
Sloping It Up! Name: ________________________ Summative Assessment
. Which coordinate pair represents the point graphed? 1
A. (1, 5) B. (–1, –5) C. (5, –1)
Identify the slope of the line graphed.
D. (–1, 5)
2.
Sloping It Up 61
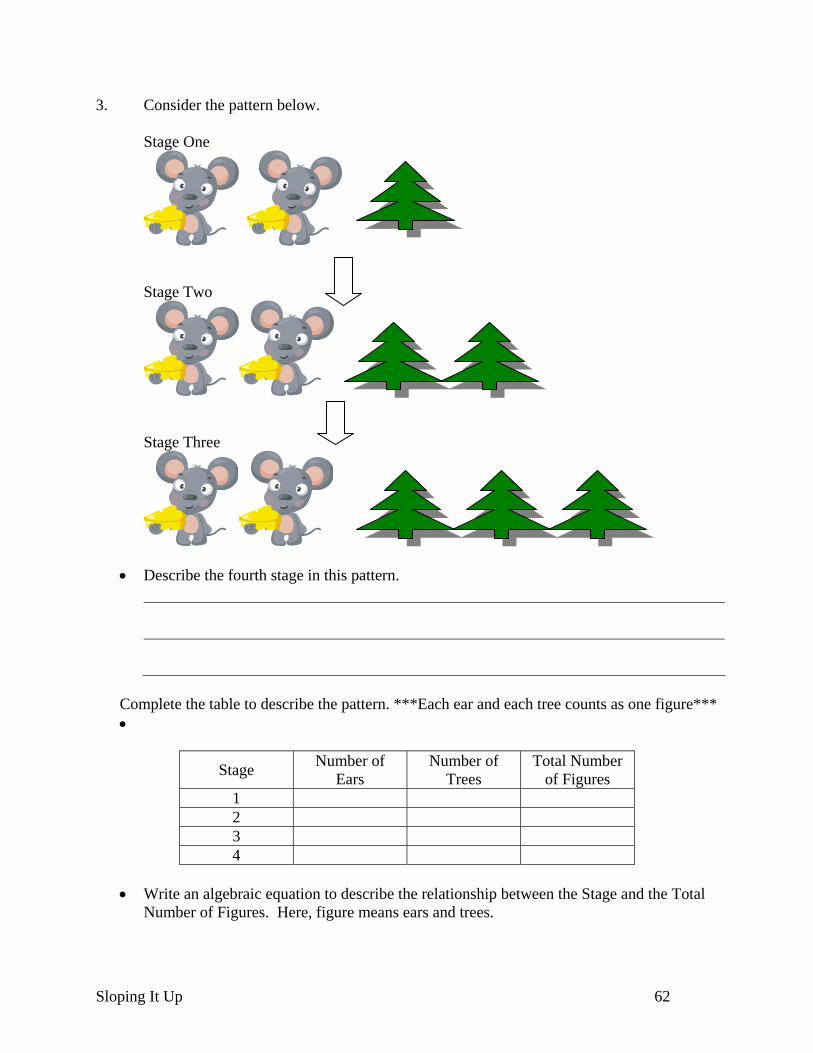
3. Consider the pattern below.
Stage One
Stage Two
Stage Three
• Describe the fourth stage in this pattern.
Complete the table to describe the pattern. ***Each ear and each tree counts as one figure*** •
Stage Number of Ears
Number of Trees
Total Number of Figures
1 2 3 4
• Write an algebraic equation to describe the relationship between the Stage and the Total
Number of Figures. Here, figure means ears and trees.
Sloping It Up 62
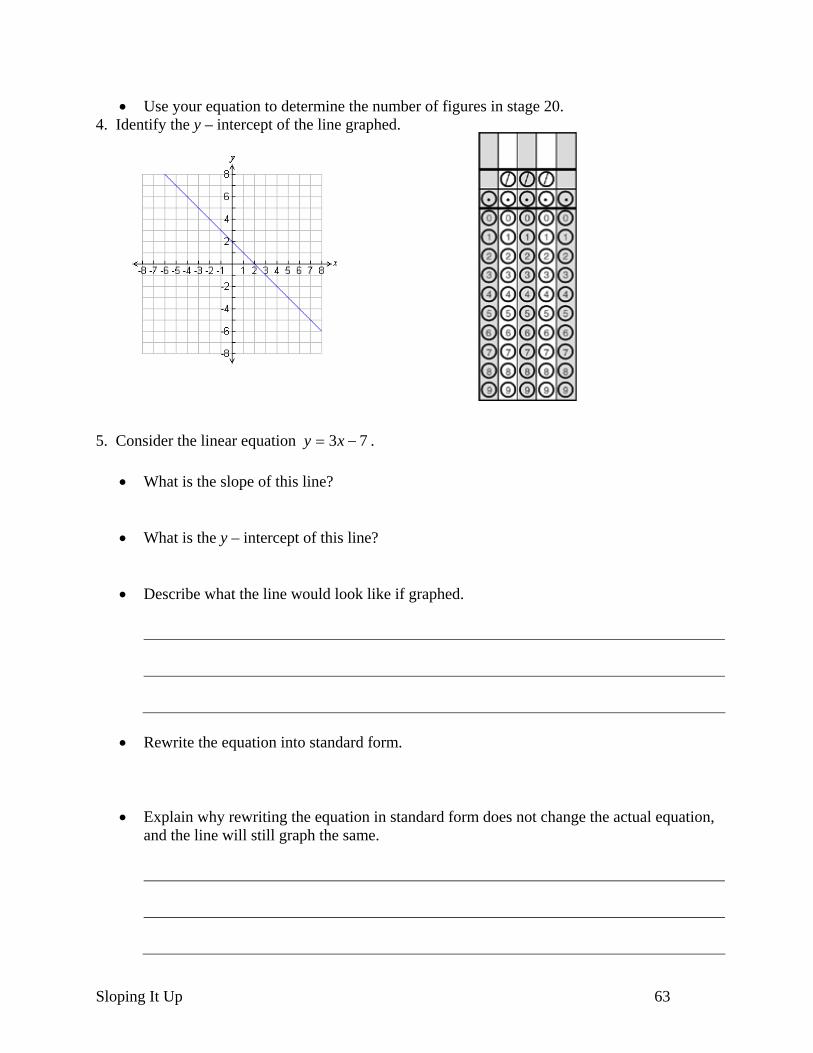
• mber of figures in stage 20. . Identify the y – intercept of the line graphed.
Use your equation to determine the nu4
5. Consider the linear equation 73 −= xy .
• What is the slope of this line?
• What is the y – intercept of this line?
• Describe what the line would look like if graphed.
• Rewrite the equation into standard form.
• Explain why rewriting the equation in standard fo does not change the actual equation,
and the line will still graph the same.
rm
Sloping It Up 63
Sloping It Up! Name: ____ANSWERS________
ummative Assessment 1. Which coordinate pair represents the point graphed?
S
ANSWER H
F. (–1, –5)
H. (–1, 5)
. Identify the slope of the line graphed.
E. (1, 5)
G. (5, –1)
2
ANSWER: 5/1 OR 5
Sloping It Up 64
3. Consider the pattern below.
Stage One
Stage Two
Stage Three
Describe the fourth stage in this pattern. •
Two mice, 4 trees
• Complete the table to describe the pattern.
Stage Number of Ears
Number of Trees
Total Number of Figures
1 4 1 5 2 4 2 6 3 4 3 7 4 4 4 8
• Write an algebraic equation to describe the relationship between the Stage and the Total
Number of Figures y = x + 4 ….where x represents the stage and y represents the number of figures.
• Use your equation to determine the number of figures in stage 20.
Sloping It Up 65
Sloping It Up 66
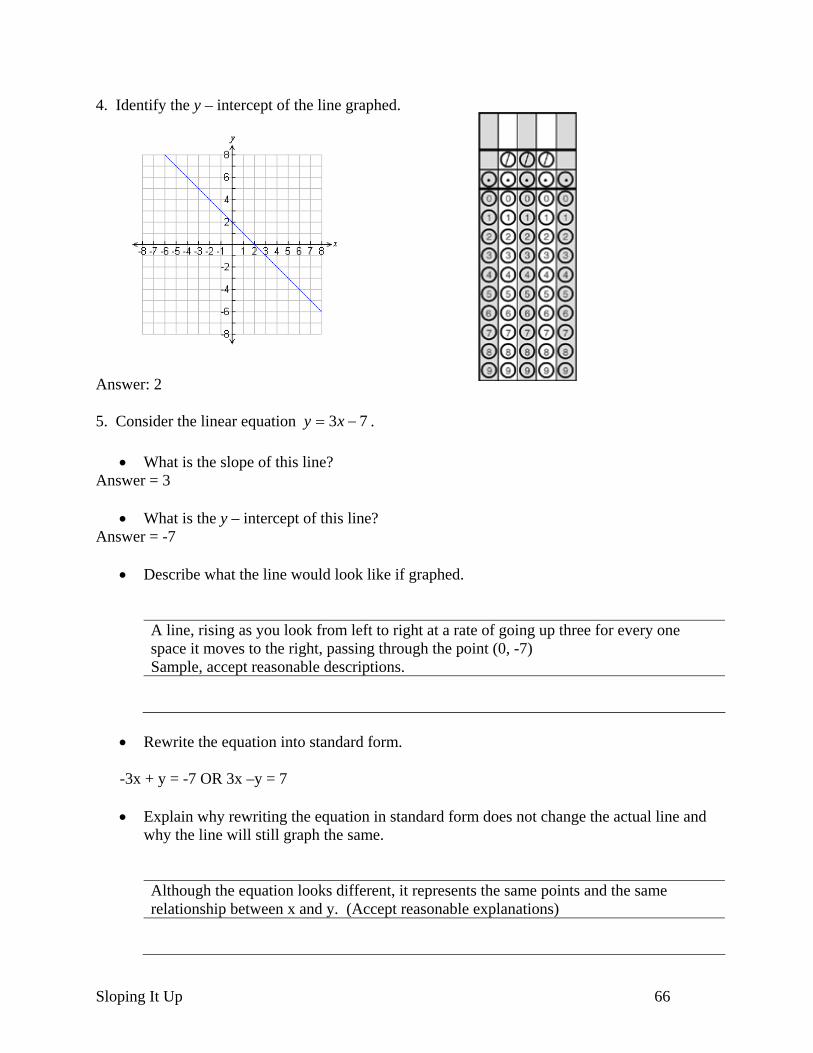
ne graphed. 4. Identify the y – intercept of the li
Answer: 2 5. Consider the linear equation 73 −= xy .
• What is the slope of this line? Answer = 3
• What is the y – intercept of this line? Answer = -7
• Describe what the line would look like if graphed.
line, rising as you look from left to right at a rate of going up three for every one space it moves to the right, passing through the point (0, -7) Sample, accept reasonable descriptions.
A
• Rewrite the equation into standard form.
-3x + y = -7 OR 3x –y = 7 • Explain why rewriting the equation in standard fo does not change the actual line and
why the line will still graph the same.
ccept reasonable explanations)
rm
Although the equation looks different, it represents the same points and the same relationship between x and y. (A

Sloping It Up 67


![[Jurnal] Ketidakstabilan Refleksi Gelombang Nonliniear Pada Sloping](https://img.dokumen.tips/doc/110x75/55cf8f47550346703b9ab688/jurnal-ketidakstabilan-refleksi-gelombang-nonliniear-pada-sloping.jpg)