Embed Size (px)
Citation preview
1
WORCESTER POLYTECHNIC INSTITUTE
Tissue-Engineered Skeletal Muscle Stimulator
Biomedical Engineering Major Qualifying Project
Syed Asaad Hussain, Spencer Ryan Keilich, Shreyas Renganathan, and Stephanie Jo Lindow
4/22/2015
This report represents the work of WPI undergraduate students submitted to the faculty as evidence of
completion of a degree requirement. WPI routinely publishes these reports on its website without editorial
or peer review. For more information about the projects program at WPI, please see
http://www.wpi.edu/academics/ugradstudies/project-learning.html
2
Abstract This project set out to mechanically stimulate in vitro skeletal muscle tissue to produce more accurate models of in
vivo tissue for use in studying human muscular diseases. Active and passive contractions play a key role in the in vivo
development of skeletal muscle. A device was produced in which tissue was cultured in fibrin gel to grow dogbone-
shaped tissue around sets of posts in the device. The device is able to: statically or cyclically strain the tissue, control
the amount of strain from -50% to +50%, allow for stimulation of up to 96 samples, and minimize the construct size
of the tissues. Mechanical stimulation by the device led to greater myofiber alignment, higher fiber density, and
overall a closer resemblance to in vivo tissue.
3
Executive Summary
Introduction
Clinical Significance
Significant research has been done to find treatments for muscular degenerative diseases such as muscular
dystrophy and multiple sclerosis. New drugs are required to go through several approval phases before they can be
tested on live animals or humans, and the approval process can be tedious and costly [1]. Even if the new drugs pass
the approval process, most fail due to lack of homology between animal muscle models and human muscle. There is
a need for a technology platform that can bridge researchers’ need for, high throughput testing with an accurate
muscle tissue model that utilizes human cells to recapitulate human tissue response. This also eliminates the time-
consuming approval process necessary for animal testing.
In Vitro Mechanical Stimulation
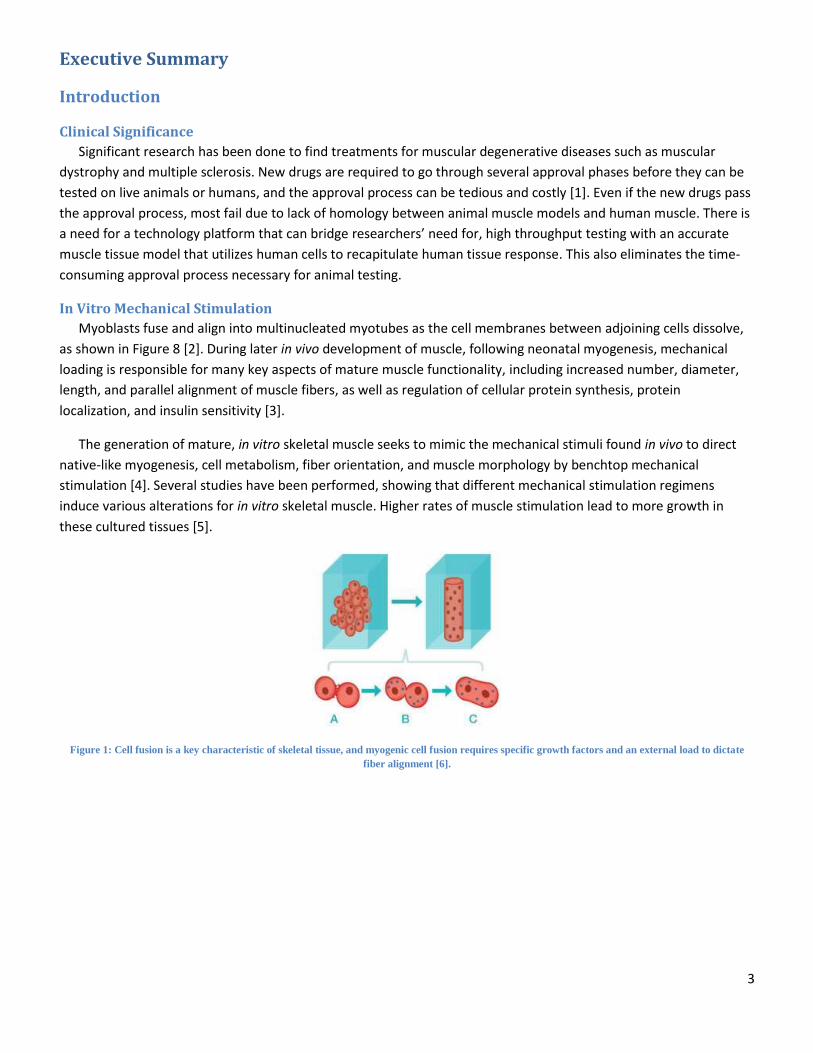
Myoblasts fuse and align into multinucleated myotubes as the cell membranes between adjoining cells dissolve,
as shown in Figure 8 [2]. During later in vivo development of muscle, following neonatal myogenesis, mechanical
loading is responsible for many key aspects of mature muscle functionality, including increased number, diameter,
length, and parallel alignment of muscle fibers, as well as regulation of cellular protein synthesis, protein
localization, and insulin sensitivity [3].
The generation of mature, in vitro skeletal muscle seeks to mimic the mechanical stimuli found in vivo to direct
native-like myogenesis, cell metabolism, fiber orientation, and muscle morphology by benchtop mechanical
stimulation [4]. Several studies have been performed, showing that different mechanical stimulation regimens
induce various alterations for in vitro skeletal muscle. Higher rates of muscle stimulation lead to more growth in
these cultured tissues [5].
Figure 1: Cell fusion is a key characteristic of skeletal tissue, and myogenic cell fusion requires specific growth factors and an external load to dictate
fiber alignment [6].
4
Design
Design Components
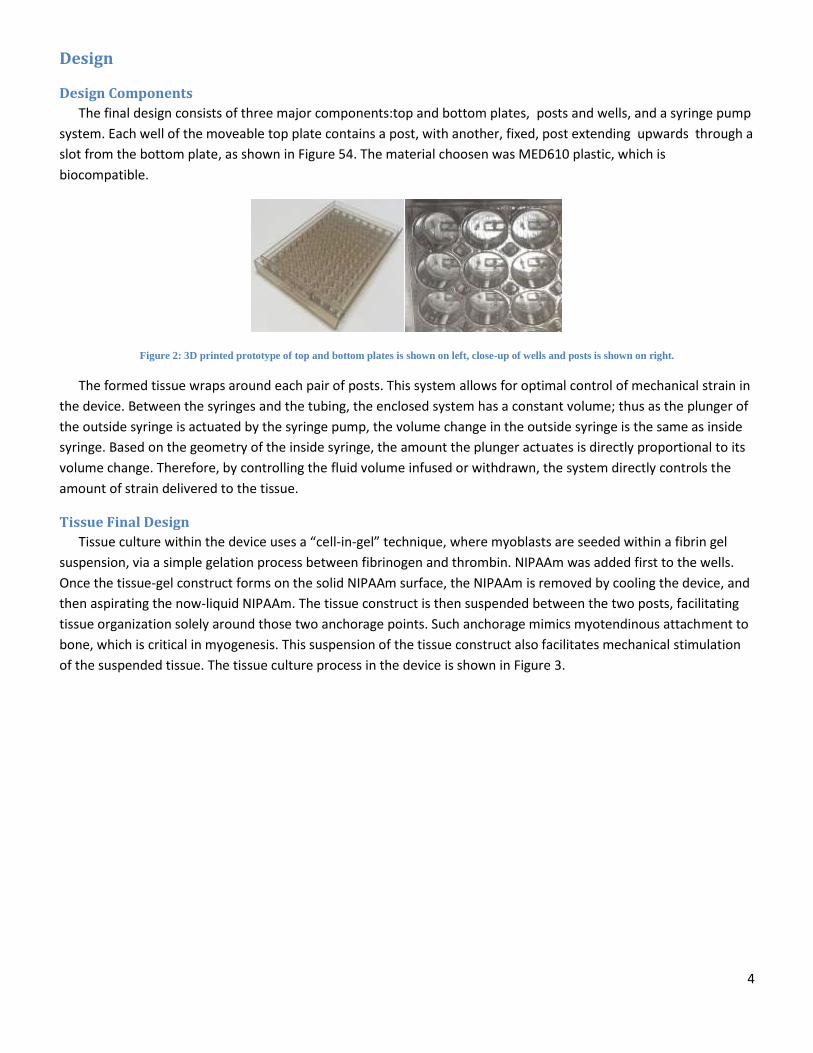
The final design consists of three major components:top and bottom plates, posts and wells, and a syringe pump
system. Each well of the moveable top plate contains a post, with another, fixed, post extending upwards through a
slot from the bottom plate, as shown in Figure 54. The material choosen was MED610 plastic, which is
biocompatible.
Figure 2: 3D printed prototype of top and bottom plates is shown on left, close-up of wells and posts is shown on right.
The formed tissue wraps around each pair of posts. This system allows for optimal control of mechanical strain in
the device. Between the syringes and the tubing, the enclosed system has a constant volume; thus as the plunger of
the outside syringe is actuated by the syringe pump, the volume change in the outside syringe is the same as inside
syringe. Based on the geometry of the inside syringe, the amount the plunger actuates is directly proportional to its
volume change. Therefore, by controlling the fluid volume infused or withdrawn, the system directly controls the
amount of strain delivered to the tissue.
Tissue Final Design
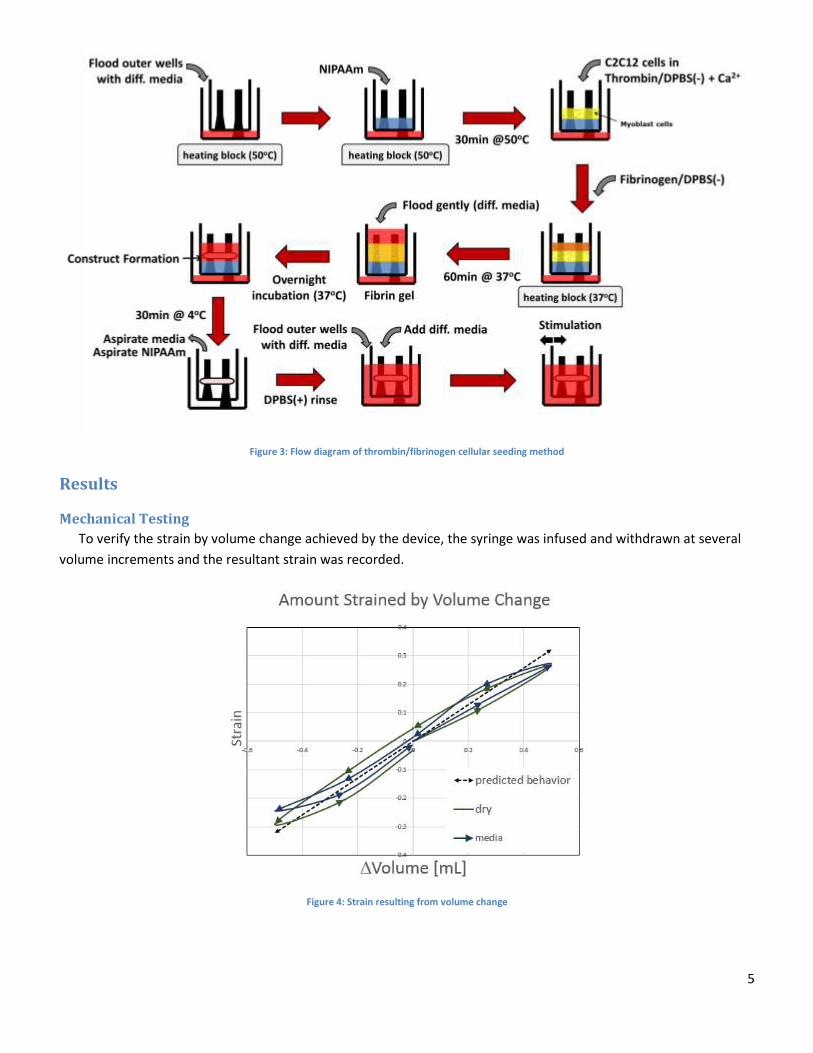
Tissue culture within the device uses a “cell-in-gel” technique, where myoblasts are seeded within a fibrin gel
suspension, via a simple gelation process between fibrinogen and thrombin. NIPAAm was added first to the wells.
Once the tissue-gel construct forms on the solid NIPAAm surface, the NIPAAm is removed by cooling the device, and
then aspirating the now-liquid NIPAAm. The tissue construct is then suspended between the two posts, facilitating
tissue organization solely around those two anchorage points. Such anchorage mimics myotendinous attachment to
bone, which is critical in myogenesis. This suspension of the tissue construct also facilitates mechanical stimulation
of the suspended tissue. The tissue culture process in the device is shown in Figure 3.
5
Figure 3: Flow diagram of thrombin/fibrinogen cellular seeding method
Results
Mechanical Testing
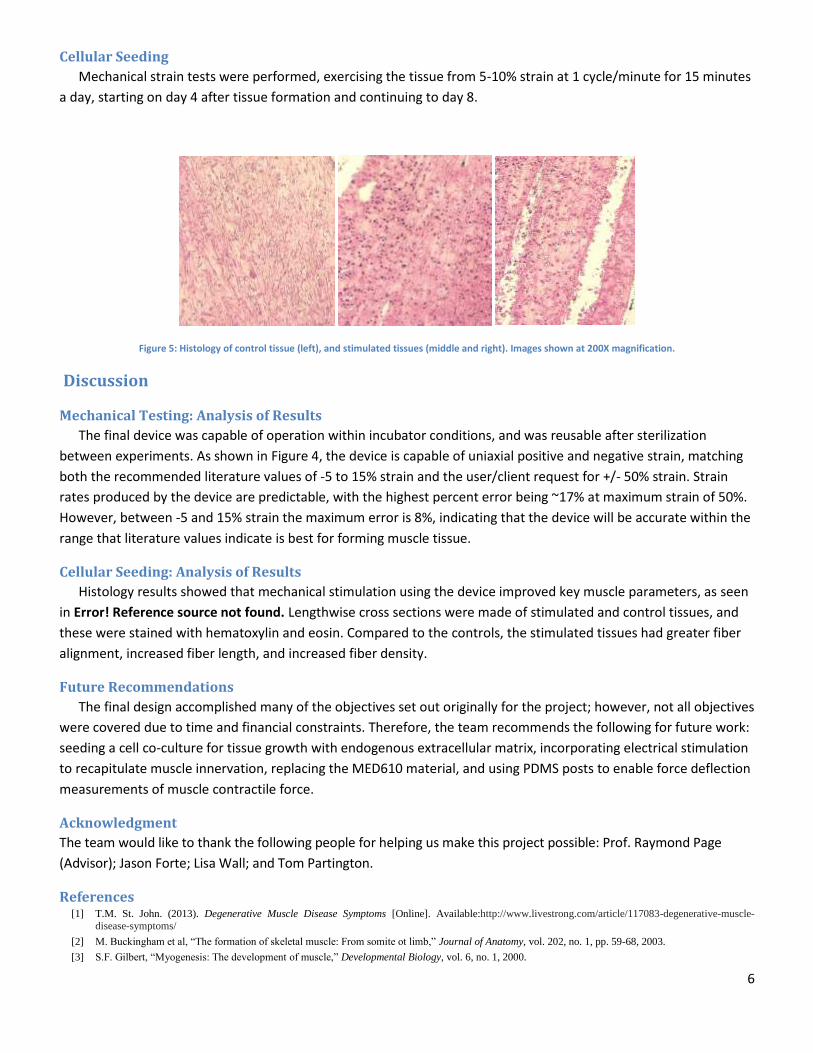
To verify the strain by volume change achieved by the device, the syringe was infused and withdrawn at several
volume increments and the resultant strain was recorded.
Figure 4: Strain resulting from volume change
6
Cellular Seeding
Mechanical strain tests were performed, exercising the tissue from 5-10% strain at 1 cycle/minute for 15 minutes
a day, starting on day 4 after tissue formation and continuing to day 8.
Figure 5: Histology of control tissue (left), and stimulated tissues (middle and right). Images shown at 200X magnification.
Discussion
Mechanical Testing: Analysis of Results
The final device was capable of operation within incubator conditions, and was reusable after sterilization
between experiments. As shown in Figure 4, the device is capable of uniaxial positive and negative strain, matching
both the recommended literature values of -5 to 15% strain and the user/client request for +/- 50% strain. Strain
rates produced by the device are predictable, with the highest percent error being ~17% at maximum strain of 50%.
However, between -5 and 15% strain the maximum error is 8%, indicating that the device will be accurate within the
range that literature values indicate is best for forming muscle tissue.
Cellular Seeding: Analysis of Results
Histology results showed that mechanical stimulation using the device improved key muscle parameters, as seen
in Error! Reference source not found. Lengthwise cross sections were made of stimulated and control tissues, and
these were stained with hematoxylin and eosin. Compared to the controls, the stimulated tissues had greater fiber
alignment, increased fiber length, and increased fiber density.
Future Recommendations
The final design accomplished many of the objectives set out originally for the project; however, not all objectives
were covered due to time and financial constraints. Therefore, the team recommends the following for future work:
seeding a cell co-culture for tissue growth with endogenous extracellular matrix, incorporating electrical stimulation
to recapitulate muscle innervation, replacing the MED610 material, and using PDMS posts to enable force deflection
measurements of muscle contractile force.
Acknowledgment
The team would like to thank the following people for helping us make this project possible: Prof. Raymond Page
(Advisor); Jason Forte; Lisa Wall; and Tom Partington.
References [1] T.M. St. John. (2013). Degenerative Muscle Disease Symptoms [Online]. Available:http://www.livestrong.com/article/117083-degenerative-muscle-
disease-symptoms/
[2] M. Buckingham et al, “The formation of skeletal muscle: From somite ot limb,” Journal of Anatomy, vol. 202, no. 1, pp. 59-68, 2003.
[3] S.F. Gilbert, “Myogenesis: The development of muscle,” Developmental Biology, vol. 6, no. 1, 2000.

7
[4] C. Powell, “Mechanical stimulation improves tissue-engineered human skeletal muscle,” American Journal of Physiology-Cell Physiology, vol. 283, no.
1, pp. 1557-1565, 2002.
[5] H.H. Vandenburgh, “Mechanically induced alterations in cutured skeletal muscle growth,” Journal of Biomechanics, vol.24, no.1, pp. 91-99, 1991.
[6] R. Brock, “NIH study uncovers details of early stages in muscle formation and regeneration,” Institute of Neurological Disordersand Stroke, 2014.

Authorship
Chapter Author(s) Editor(s)
Chapter 1: Introduction Everyone Everyone
Chapter 2: Literature Review
2.1 Clinical Significance Spencer Everyone
2.2 Disease Spencer Everyone
2.3 Injuries Spencer Everyone
2.4 Tissue Regeneration and Reconstruction Spencer Everyone
2.5 Need for an Enabling Tool Spencer Everyone
2.6 Muscle and Myoblast Physiology Spencer Everyone
2.7 In vitro Muscle Generation Shreyas Everyone
2.8 In vitro Mechanical and Electrical Stimulation
Asaad Everyone
2.9 Tests for Myocyte Culture Stephanie Everyone
2.10 Existing Patents Stephanie Everyone
2.11 Mechanical and Electrical Design Stephanie Everyone
2.12 Limitations Stephanie and Shreyas Everyone
Chapter 3: Methodology:
3.1 Initial Client Statement Raymond Page
3.2 Objectives and Constraints Stephanie and Spencer Everyone
3.3 Revised Client Statement Asaad Everyone
3.4 Project Approach Stephanie and Shreyas Everyone
Chapter 4: Alternative Designs
4.1 Needs Analysis Stephanie Everyone
4.2 Functions and Means Stephanie Everyone
4.3 Conceptual Designs Asaad Everyone
4.4 Preliminary/Alternative Designs Asaad and Spencer Everyone
4.5 Tissue Formation Techniques Spencer Everyone
4.6 Comparison of Alternative Designs Stephanie Everyone
4.7 Experimental/Design Validation Spencer and Shreyas Everyone
4.8 Modeling of Alternative Designs Asaad and Shreyas Everyone
Chapter 5: Final Design
5.1 Overall Design and Major Components Asaad Everyone
5.2 Posts and Slits Stephanie Everyone
5.3 Top and Bottom Sliding Plates Asaad Everyone
5.4 Syringe Pump System Stephanie Everyone
5.5 Tissue Final Design Shreyas Everyone
5.6 Device Operation (Flow Diagram) Shreyas Everyone
5.7 Limitations Spencer Everyone
Chapter 6: Device Verification Testing (DVT)
6.1 Cytotoxicity Test Spencer and Shreyas Everyone
6.2 “Cell-in-gel” Seeding Shreyas Everyone
6.3 Mechanical Analysis Asaad Everyone
6.4 Stimulated Tissue Results Spencer Everyone
Chapter 7: Discussion of Results
7.1 Mechanical Testing: Analysis of Results Stephanie Everyone
7.2 Cellular Seeding : Analysis of Results Shreyas Everyone
Chapter 8: Project Impact
8.1 Benchmarks and Standards Spencer Everyone
8.2 Limitations in Data Spencer Everyone
8.3 Economics Spencer Everyone
8.4 Environmental Impact Spencer Everyone
8.5 Societal Influence Spencer Everyone
8.6 Ethical Concern Spencer Everyone
8.7 Manufacturability Asaad and Steph Everyone
8.8 Sustainability, Health and Safety Issues Shreyas Everyone
Chapter 9: Conclusions and Recommendations
9.1 Conclusion Shreyas Everyone
9.2 Recommendations Asaad Everyone
References Everyone Everyone
Appendices Everyone Everyone

Table of Contents
Chapter 1: Introduction ................................................................................................................................ 1
Chapter 2: Literature Review ........................................................................................................................ 4
2.1 Clinical Significance ............................................................................................................................. 4
2.2 Disease ................................................................................................................................................ 5
2.2.1 Muscular Dystrophy ..................................................................................................................... 5
2.2.2 Multiple Sclerosis ......................................................................................................................... 6
2.2.3 Amyotrophic Lateral Sclerosis ...................................................................................................... 7
2.3 Injuries: ............................................................................................................................................... 8
2.4 Tissue Regeneration and Reconstruction ......................................................................................... 10
2.5 Need for an Enabling tool to test In Vitro Muscular Tissue .............................................................. 10
2.6 Muscle and Myoblast Physiology ...................................................................................................... 11
2.6.1 Cellular Organization and Development .................................................................................... 11
2.6.2 Myogenesis, Cell Fusion, and Cell Proliferation ......................................................................... 12
2.6.3 Myocyte Structure and Function ............................................................................................... 13
2.6.4 Motor Neurons and the Neuromuscular Junction ..................................................................... 14
2.6.5 Extracellular Matrix: ................................................................................................................... 15
2.7 In Vitro Muscle Generation ............................................................................................................... 17
2.7.1 Myogenic Cell Types................................................................................................................... 18
2.7.2 Culture Media ............................................................................................................................ 20
2.7.3 3D Culture .................................................................................................................................. 21
2.7.4 Self-Assembly and Co-culture .................................................................................................... 22
2.8 In vitro Mechanical Stimulation and Electrical Stimulation .............................................................. 25
2.8.1 In vitro Mechanical Stimulation ................................................................................................. 27
2.8.2 Anchorage of In Vitro Muscle Tissue .......................................................................................... 29
2.8.3 Electrical Stimulation ................................................................................................................. 31
2.8.4 Electrical Stimulation by Electrodes ........................................................................................... 31
2.8.5 Contactless Electrical Stimulation .............................................................................................. 33
2.9 Validation Tests for Myocyte Viability and Intracellular Organization ............................................. 36
2.9.1 Assays Methods for Cell Viability and Differentiation ............................................................... 36
2.10 Existing Patents for Tissue Mechanical/Electrical Stimulation Devices .......................................... 37
2.10.1 Herman Vandenburgh: Tissue Stretch via Substrate Expansion .............................................. 37
2.10.2 Milica Radisic: Perfusion Electric Stimulation ......................................................................... 38
2.10.3 George Christ: Cyclic Mechanical Stretching Regimens ........................................................... 39
2.10.4 Robert Dennis: In Vivo Emulation System ............................................................................... 40
2.11 CAD Mechanical and Electrical Design ............................................................................................ 43
2.11.1 Computer Aided Manufacturing .............................................................................................. 43
2.11.2 Current Designs ........................................................................................................................ 44
2.12 Project Issues/Limitations ............................................................................................................... 46
2.12.1 Fiber Diameter ......................................................................................................................... 46
2.12.2 Cell Density............................................................................................................................... 46
2.12.3 Vascularization of Constructs .................................................................................................. 47
Chapter 3: Methodology ............................................................................................................................. 47
3.1 Initial Client Statement ..................................................................................................................... 47
3.2 Objectives and Constraints ............................................................................................................... 49
3.2.1 Objectives ................................................................................................................................... 49
3.2.2 Constraints ................................................................................................................................. 53
3.3 Revised Client Statement .................................................................................................................. 55
3.4 Project Approach .............................................................................................................................. 57
3.4.1 Management Approach ............................................................................................................. 57
Chapter 4 Alternative Designs .................................................................................................................... 61
4.1 Needs Analysis .................................................................................................................................. 61
4.2 Functions (Specifications) and Means .............................................................................................. 62
4.2.1 Mechanical Stimulation ............................................................................................................. 62
4.2.2 Electrical Stimulation ................................................................................................................. 63
4.2.3 Tissue Anchorage ....................................................................................................................... 63
4.2.4 Using the Minimal Functional Unit ............................................................................................ 63
4.2.5 Differentiation ............................................................................................................................ 64
4.3 Conceptual Designs ........................................................................................................................... 64
4.3.1 Electrical Stimulation Means ..................................................................................................... 66
4.3.2 Mechanical Stimulation Means.................................................................................................. 67
4.4 Electro-Mechanical Preliminary/Alternative Designs ....................................................................... 68
4.4.1 Electrical Stimulation: Electrodes .............................................................................................. 68
4.4.2 Electrical Stimulation: Contactless Electrical Field .................................................................... 69
4.4.3 Mechanical Stimulation: Stepper and Cam ................................................................................ 70
4.4.4 Mechanical Stimulation: Screw Driven ...................................................................................... 72
4.4.5 Mechanical Stimulation: Scissor Linkage ................................................................................... 73
4.4.6 Mechanical Stimulation: Sublevel Deformation ........................................................................ 74
4.4.7 Mechanical Stimulation: Pulsatile Method ................................................................................ 75
4.4.8 Mechanical Stimulation: Fluid Dynamic Designs ....................................................................... 78
4.4.9 Mechanical Stimulation: Biomaterials Design ........................................................................... 80
4.5 Tissue Formation Techniques and Alternative Methods .................................................................. 80
4.5.1 Ring Tissue Formation ................................................................................................................ 81
4.5.2 Dog-bone Tissue Formation ....................................................................................................... 81
4.6 Comparison of alternative designs ................................................................................................... 82
4.6.1 Discussion of alternative designs comparison ........................................................................... 85
4.7 Experimental/Design Validation ....................................................................................................... 86
4.7.1 Tissue Ring Validation Testing for Preliminary Experiments ..................................................... 86
4.7.3 Staining/Cell Validation .............................................................................................................. 88
4.8.1 Scissor Linkage Model ................................................................................................................ 89
4.8.2 Sliding Plate Model .................................................................................................................... 92
Chapter 5: Final Design ............................................................................................................................... 95
5.1 Overall Design and Major Components ............................................................................................ 95
5.2 Posts and Slits ................................................................................................................................. 100
5.3 Top and Bottom Sliding Plates ........................................................................................................ 101
5.4 Syringe Pump System ...................................................................................................................... 104
5.5 Tissue Final Design .......................................................................................................................... 106
5.6 Device Operation (Flow diagram) ................................................................................................... 108
5.7 Limitations ....................................................................................................................................... 109
Chapter 6: Device Verification Testing (DVT) ............................................................................................ 110
6.1 Cytotoxicity test .............................................................................................................................. 110
6.2 “Cell-in-gel” Seeding of C2C12 cells in fibrin matrix ....................................................................... 112
6.3 Mechanical Analysis of strain ......................................................................................................... 114
6.3.1 Thermal Expansion of Fluid ...................................................................................................... 114
6.3.2 Verification of Amount Strain/Volume Change of Fluid .......................................................... 115
6.4 Tissue stimulated results ................................................................................................................ 121
Chapter 7: Discussion of Results ............................................................................................................... 122
7.1 Mechanical Testing: Analysis of Results.......................................................................................... 122
7.1.1 Thermal Expansion of Fluid ...................................................................................................... 122
7.1.2 Amount Strain/Volume Change of Fluid .................................................................................. 123
7.2 Cell Seeding and Cytotoxicity: Analysis of Results .......................................................................... 124
Chapter 8 – Project Impact ....................................................................................................................... 127
8.1 Benchmarks and Standards for Success – A Comparison to Other Works ..................................... 127
8.2 Limitations in Data .......................................................................................................................... 128
8.3 Economics ....................................................................................................................................... 128
8.4 Environmental Impact ..................................................................................................................... 129
8.5 Societal Influence ............................................................................................................................ 130
8.6 Ethical Concern ............................................................................................................................... 130
8.7 Manufacturability ........................................................................................................................... 130
8.8 Sustainability, Health and Safety Issues .......................................................................................... 131
Chapter 9: Conclusions and Recommendations ....................................................................................... 131
9.1 Conclusion ....................................................................................................................................... 131
9.2 Recommendations .......................................................................................................................... 133
References: ............................................................................................................................................... 136
Appendix ................................................................................................................................................... 142
Preliminary Experiment: Electric and Vibratory Stimuli ................................................................... 142
Table of Figures Figure 1: ........................................................................................................................................................ 6
Figure 2: ........................................................................................................................................................ 9
Figure 3:. ..................................................................................................................................................... 12
Figure 4: ...................................................................................................................................................... 13
Figure 5. ...................................................................................................................................................... 14
Figure 6: ...................................................................................................................................................... 15
Figure 7: ...................................................................................................................................................... 16
Figure 8: ...................................................................................................................................................... 25
Figure 9:. ..................................................................................................................................................... 27
Figure 10: . .................................................................................................................................................. 27
Figure 11:. ................................................................................................................................................... 28
Figure 12:. ................................................................................................................................................... 31
Figure 13: .................................................................................................................................................... 32
Figure 14: .................................................................................................................................................... 33
Figure 15:. ................................................................................................................................................... 35
Figure 16:. ................................................................................................................................................... 37
Figure 17: .................................................................................................................................................... 39
Figure 18: ................................................................................................................................................... 41
Figure 19: ................................................................................................................................................... 42
Figure 20: ................................................................................................................................................... 44
Figure 21: .................................................................................................................................................... 44
Figure 22: ................................................................................................................................................... 45
Figure 23: ................................................................................................................................................... 45
Figure 24: .................................................................................................................................................... 52
Figure 25:. ................................................................................................................................................... 58
Figure 26: .................................................................................................................................................... 60
Figure 27:. ................................................................................................................................................... 69
Figure 28: .................................................................................................................................................... 69
Figure 29:. ................................................................................................................................................... 70
Figure 30: . .................................................................................................................................................. 70
Figure 31: . .................................................................................................................................................. 71
Figure 32: . .................................................................................................................................................. 72
Figure 33:. ................................................................................................................................................... 74
Figure 34: . .................................................................................................................................................. 75
Figure 35: ................................................................................................................................................... 76
Figure 36: . .................................................................................................................................................. 77
Figure 37: ................................................................................................................................................... 79
Figure 38: .................................................................................................................................................... 79
Figure 39:. ................................................................................................................................................... 80
Figure 40: . .................................................................................................................................................. 87
Figure 41: .................................................................................................................................................... 87
Figure 42: .................................................................................................................................................... 90
Figure 43: .................................................................................................................................................... 91
Figure 44:. ................................................................................................................................................... 92
Figure 45:. ................................................................................................................................................... 93
Figure 46: ................................................................................................................................................... 94
Figure 47: .................................................................................................................................................... 96
Figure 48: .................................................................................................................................................... 96
Figure 49: .................................................................................................................................................... 97
Figure 50: ................................................................................................................................................... 98
Figure 51: ................................................................................................................................................... 99
Figure 52: . ................................................................................................................................................ 100
Figure 53: . ................................................................................................................................................ 102
Figure 54: . ................................................................................................................................................ 103
Figure 55: . ................................................................................................................................................ 103
Figure 56: ................................................................................................................................................. 105
Figure 57: ................................................................................................................................................. 106
Figure 58: .................................................................................................................................................. 108
Figure 59.. ................................................................................................................................................. 112
Figure 60. . ................................................................................................................................................ 114
Figure 61.. ................................................................................................................................................. 115
Figure 62.. ................................................................................................................................................. 120
Figure 63.. ................................................................................................................................................. 121
Figure 64.. ................................................................................................................................................. 122
Table of Tables Table 1: Objectives Pairwise Comparison Chart ......................................................................................... 50
Table 2: Revised Pairwise Comparison Chart .............................................................................................. 51
Table 3: Function-Means Table ................................................................................................................... 66
Table 4: All potential design means to perform objectives, pros, cons, and cost. ..................................... 82
Table 5: Means comparison for electrical testing ....................................................................................... 84
Table 6: Means comparison for mechanical stimulation ............................................................................ 84
Table 8. This table shows the results of the dry device strain verification test........................................ 117
Table 9. This table shows the results of the media based device strain verification test ........................ 118
Table 10: Device Bill of Materials .............................................................................................................. 129
1
Chapter 1: Introduction Human skeletal muscle tissue has the ability to self-regenerate following small injuries;
however, it is unable to functionally restore loss from congenital/systemic defects, myopathies, or large
traumatic injuries (Ahadian, 2012) (Bach et al, 2007). Examples of degenerative skeletal muscle diseases
include Muscular Dystrophy (MD) and Multiple Sclerosis (MS). Muscular Dystrophy affects 32,000
people between ages 5-24 annually in the United States, while Multiple Sclerosis affects 2.3 million
people worldwide (Center for Disease Control and Prevention, 2014) (Campellone, 2014). Care for
patients with these diseases is expensive, as the average cost of an MD patient is estimated at $4,600
annually (Center for Disease Control and Prevention, 2014). Currently no cure or effective treatments
for MD exist, therefore tissue engineering, the mimicry of organogenesis in vitro, has recently emerged
as a novel approach to engineer skeletal muscle tissue for in vitro applications (Rossi et al, 2010).
Engineered skeletal muscle tissue (ESMT) also has numerous in vitro applications— as analogous models
for drug screening and diagnostic testing (Vandenburgh, 2009), or as engineered biological actuators for
microelectromechanical devices (Fujita et al, 2011).
Though mechanically-stimulated tissue constructs have been found to be more developed than
non- stimulated constructs, they still remain morphologically dissimilar to the adult skeletal muscle
found functional in vivo. The primary challenge of ESMT in vitro is to induce the differentiation of
cultured cells into mature skeletal muscle – with morphology and functionality including contractile
force production resembling in vivo tissue. The application of directed mechanical strain and electrical
stimulation on engineering skeletal muscle tissue has been shown to promote maturation (native levels)
that more closely resembles mature tissue (Bach et al, 2004).
In addition to creating tissue sub-native levels of skeletal muscle found in vivo, current
mechanical stimulation methods for ESMTs are ineffective and inefficient. High-throughput testing is
2
limited because current testing methods only capable of producing 3-10 tissue samples at a time
(Vandenburgh et al, 1991). Current stimulation devices are not incubator compatible, which means
constructs are tested outside of in vivo conditions. Myofiber diameter and density are less in current
mechanically-stimulated ESMTs than in native skeletal muscle tissue (Collinsworth et al, 2000). Electrical
stimulation is typically applied to promote active contraction which helps in fiber alignment and fiber
density (Powell et al, 2002). Electrical Stimulation uses a pair of biologically inert electrodes inserted into
the culture with active current. This allows the observer to view muscle contraction and measure the
force of the pull. However, this method results in pH and temperature changes, culture contamination
from corrosion by-products, and surface fouling at electrodes (Ahadian et al, 2012).
This project’s device is meant to improve the rate and quantity at which these tissue cultures
can be matured through mediated mechanical and electrical stimulation. Initial prototypes of such
mechanical stimulation devices have been developed by previous MQPs, but their prototypes were not
sufficiently tested. Therefore, the design task is to develop an efficient technology platform for growth
and stimulation of skeletal muscle tissue functional units in vitro. The proposed device will encompass
an ESMT incorporated into a device that mechanically and/or electrically stimulates ESMTs to more
precisely mimic in vivo myogenesis and generate a more clinically-relevant model of skeletal muscle in
vitro.
The overall aim of this project is to develop and test an in vitro technology platform that enables
high-throughput generation of ESMT constructs with functional and morphological properties that more
closely mimic native skeletal muscle tissue than current models. The specific goals of this project are as
follows: firstly, to optimize the myogenic tissue culture process to create an environment that accurately
simulates in vivo 3D anchorage and growth conditions; secondly, to maximize the efficiency of
generating and testing ESMTs by determining parameters required for generating a minimal functional
3
unit for optimum tissue size for skeletal muscle tissue formation, and then develop a high-throughput
process to create this optimum tissue; and thirdly, to mechanically and electrically stimulate ESMTs to
maximize in vitro maturation, resulting in ESMT more closely to that of native muscle function and
structure, which will bridge the gap in skeletal muscle in vitro research.
The device will be considered successful if it meets the specific projects goals listed above by i)
enabling processing and testing of more than 24 constructs at one time; ii) tissue exhibiting maturity
closer to native muscle, versus current ESMTs created in the Page Lab; iii) all stimulation can be
conducted without affecting growth conditions. Chapter 2 further explores the clinical significance of
this work, the background on muscle and myoblast physiology, and muscle regeneration. The following
chapter also details the current process for making ESMT’s, including the limitations and potential
efficiency improvements. The literature review will also review previous work in order to analyze their
strengths and weaknesses.
4
Chapter 2: Literature Review The following chapter outlines the aspects of background research relevant to the project. The
clinical need underlying our problem statement was analyzed, along with aspects of skeletal muscle
development in vivo that in vitro tissue culture seeks to recapitulate. The importance of mechanical
stimulation to improve the resemblance of in vitro muscle to mature in vivo tissue is discussed, and
existing systems that mechanically a stimulate in vitro muscle tissue are presented. Finally, validation
tests for cell viability and intracellular organization are discussed, as well as limitations in generating in
vitro muscle tissue.
2.1 Clinical Significance Muscular degenerative diseases such as muscular dystrophy (MD) and multiple sclerosis (MS)
cause progressive and rapid muscle degeneration, with early death and severe debilitation being
common outcomes (Eagle et al, 2002). There is significant research being done to find treatments for
these diseases. The approval process can be tedious and costly. Drugs developed for treatment are
required to go through several regulatory approval phases, including live animal testing, before they can
finally be tested on humans. The preferred drug screening method continues to be the in vivo murine
model. Though muscle pathologies can be recreated to some extent in a mouse model, the disease
phenotype is substantially different than in humans. Key differences in genetics and molecular
mechanisms compared to human tissue limit the accuracy of the mouse as a model of human myopathy
(Vandenburgh et al, 2008). Consequently, many drugs that appear to successfully treat disease in the
murine model have minimal long-term benefits or adverse using side effects in humans (Vandenburgh et
al, 2009).There is a need for a technology platform that can bridge the need for rapid drug development
and approval with the need for a model of human disease that accurately recapitulates in vivo drug
efficacy in humans.
5
2.2 Disease There are several degenerative diseases affecting the muscles that do not have cures,
specifically muscular dystrophy, muscular sclerosis, and amyotrophic lateral sclerosis that cause
progressive loss and weakening of muscle tissue (St. John, 2013) (Campellone, 2014) (Amyotrophic
Lateral Sclerosis, 2013). The current treatments of these diseases are to make the patient more
comfortable by improving quality of life (St. John, 2013).
2.2.1 Muscular Dystrophy
Muscular dystrophy (MD) is a category of inherited genetic disorders that cause progressive
muscle impairment and weakening ultimately causing fatal respiratory failure (Eagle et al, 2002).
Duchenne muscular dystrophy causes progressive and relentless skeletal muscle wasting, and patients
rarely survive even to age 20 years of age. Cardiomyopathy is the ultimate cause for death for about
10% of affected males, though cardiac arrhythmia and other abnormalities are common to all patients
(Eagle et al, 2002). At present, no treatment is available to prevent or arrest the progressive muscle
degeneration. Depending on the type of MD, symptoms can appear in childhood or adulthood (Emery et
al, 1994). The most common symptoms of MD are delayed development of motor skills, eyelid drooping,
frequent falls or loss of balance, problems walking, diminishing muscle mass, and loss of strength
(Campellone, 2014).
Current diagnostic exams can identify the disorder through genetic testing via a blood or muscle
biopsy test. Severe forms of MD such as duchenne muscular dystrophy become present in young
children and degenerate muscle so expediently that, by age 12, the child is wheelchair-bound (St. John,
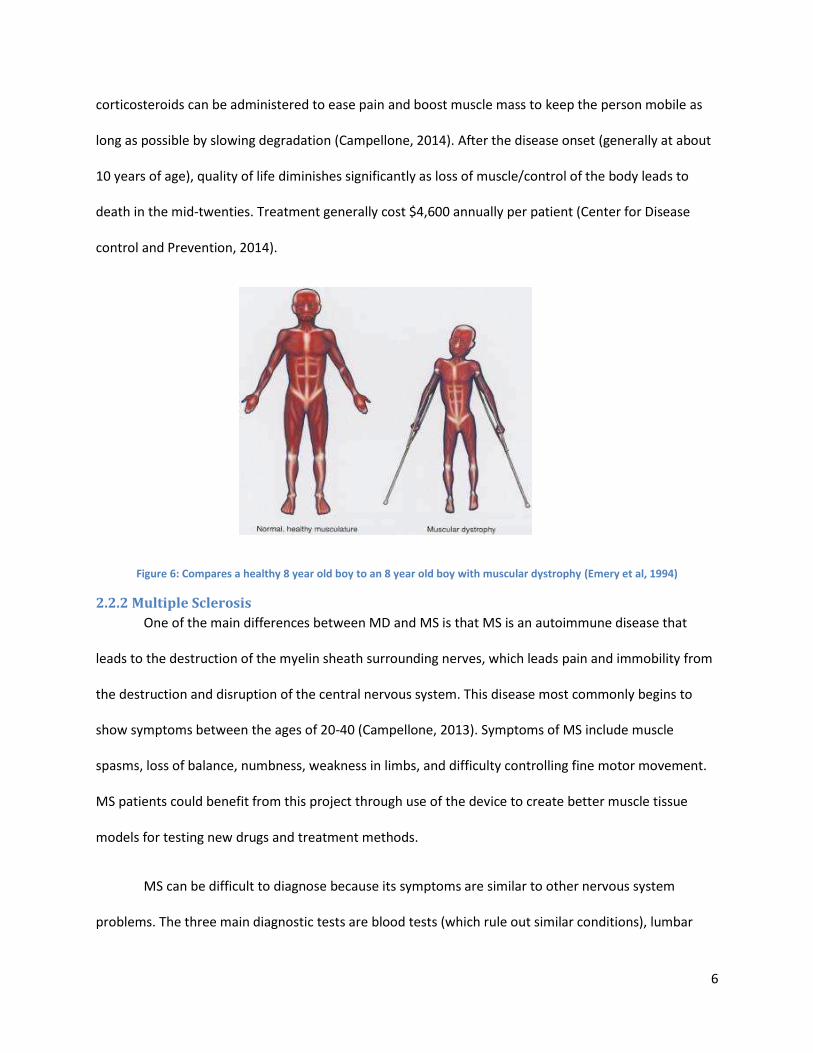
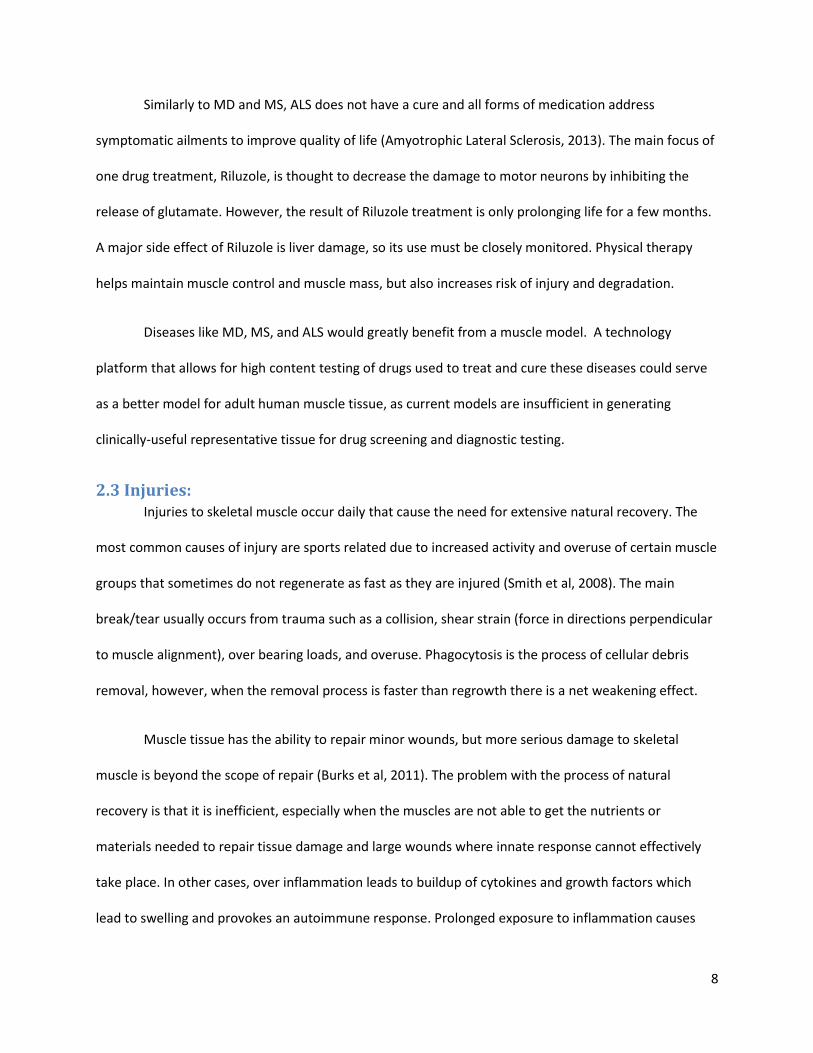
2013) (Mirski et al, 2014). Figure 6 depicts a direct comparison of a healthy eight year old boy and one
with MD. Current treatments aim to control symptoms and maintain or increase muscle mass as long as
possible. Keeping the patient active through physical therapy prolongs the strength of function of
muscular groups, while braces can improve stability and mobility. Medications such as painkillers or
6
corticosteroids can be administered to ease pain and boost muscle mass to keep the person mobile as
long as possible by slowing degradation (Campellone, 2014). After the disease onset (generally at about
10 years of age), quality of life diminishes significantly as loss of muscle/control of the body leads to
death in the mid-twenties. Treatment generally cost $4,600 annually per patient (Center for Disease
control and Prevention, 2014).
Figure 6: Compares a healthy 8 year old boy to an 8 year old boy with muscular dystrophy (Emery et al, 1994)
2.2.2 Multiple Sclerosis
One of the main differences between MD and MS is that MS is an autoimmune disease that
leads to the destruction of the myelin sheath surrounding nerves, which leads pain and immobility from
the destruction and disruption of the central nervous system. This disease most commonly begins to
show symptoms between the ages of 20-40 (Campellone, 2013). Symptoms of MS include muscle
spasms, loss of balance, numbness, weakness in limbs, and difficulty controlling fine motor movement.
MS patients could benefit from this project through use of the device to create better muscle tissue
models for testing new drugs and treatment methods.
MS can be difficult to diagnose because its symptoms are similar to other nervous system
problems. The three main diagnostic tests are blood tests (which rule out similar conditions), lumbar
7
puncture (to test cerebrospinal fluid for abnormally high antibody levels and breakdown products of
myelin), and MRI scans of the brain to diagnose and follow the natural degeneration and progression of
the disease (Campellone, 2013). There is no cure for the disease, the medications slow progression of
the disease and steroids help maintain muscle. The cost of MS treatment per patient averages at
$19,500 annually.
2.2.3 Amyotrophic Lateral Sclerosis
Amyotrophic lateral sclerosis (ALS), also known as Lou Gehrig’s disease, is classified as a fatal
neurological disease which attacks motor neurons and muscles (Amyotrophic Lateral Sclerosis, 2013).
The degeneration mainly occurs in lower motor neurons from the spinal cord to nearby muscles that are
attached to the neurons. The disease is most common in Caucasian males between the ages of 60-69,
and is usually fatal within 3-5 years from the onset of symptoms. Only 10% survive beyond 10 years. 90-
95% of the cases appear to be random, while the other 5-10% are inherited, which makes genetic
testing much more difficult. One third of inherited cases share a common genetic defect in C9orf72, but
the full function of the gene is unknown. More than 12,000 people in the United States alone had a
positive diagnosis for the disease in 2013 costing $256-$488 million.
The first symptoms that appear are related to dexterity difficulties, such as turning a key or
buttoning a shirt (Amyotrophic Lateral Sclerosis, 2013). Muscle atrophy and weakness begins to occur, in
addition to muscle cramps. Diagnosis is complete only when symptoms and signs of damage are
observed in both upper and lower motor neurons. ALS is very similar in symptoms to Human
Immunodeficiency Virus, human T-cell leukemia virus, polio, west nile virus, and Lyme; making it harder
to diagnose. Blood and urine tests eliminate the possibilities of the other diseases as well as muscle
biopsies to eliminate MS or MD. Certain electromyogram tests can measure electrical energy and act as
an early warning for the onset of the disease if abnormal results are present, as degenerated motor
neurons generate abnormal electrical signals.
8
Similarly to MD and MS, ALS does not have a cure and all forms of medication address
symptomatic ailments to improve quality of life (Amyotrophic Lateral Sclerosis, 2013). The main focus of
one drug treatment, Riluzole, is thought to decrease the damage to motor neurons by inhibiting the
release of glutamate. However, the result of Riluzole treatment is only prolonging life for a few months.
A major side effect of Riluzole is liver damage, so its use must be closely monitored. Physical therapy
helps maintain muscle control and muscle mass, but also increases risk of injury and degradation.
Diseases like MD, MS, and ALS would greatly benefit from a muscle model. A technology
platform that allows for high content testing of drugs used to treat and cure these diseases could serve
as a better model for adult human muscle tissue, as current models are insufficient in generating
clinically-useful representative tissue for drug screening and diagnostic testing.
2.3 Injuries: Injuries to skeletal muscle occur daily that cause the need for extensive natural recovery. The
most common causes of injury are sports related due to increased activity and overuse of certain muscle
groups that sometimes do not regenerate as fast as they are injured (Smith et al, 2008). The main
break/tear usually occurs from trauma such as a collision, shear strain (force in directions perpendicular
to muscle alignment), over bearing loads, and overuse. Phagocytosis is the process of cellular debris
removal, however, when the removal process is faster than regrowth there is a net weakening effect.
Muscle tissue has the ability to repair minor wounds, but more serious damage to skeletal
muscle is beyond the scope of repair (Burks et al, 2011). The problem with the process of natural
recovery is that it is inefficient, especially when the muscles are not able to get the nutrients or
materials needed to repair tissue damage and large wounds where innate response cannot effectively
take place. In other cases, over inflammation leads to buildup of cytokines and growth factors which
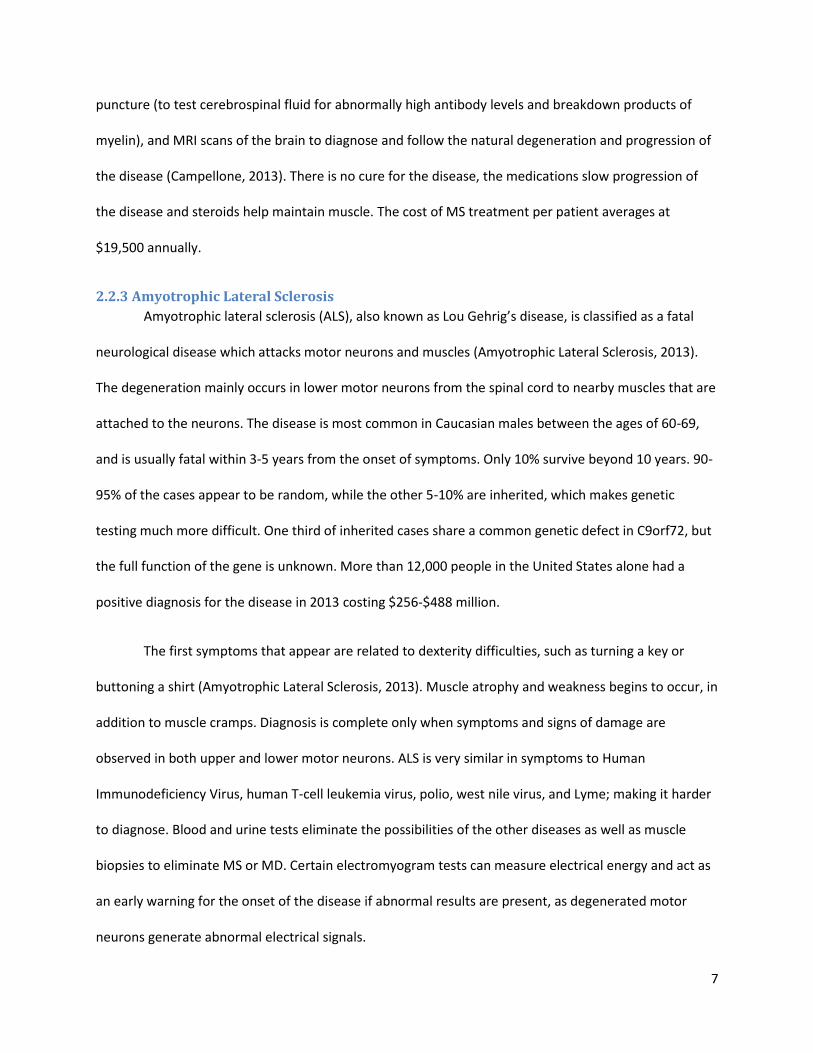
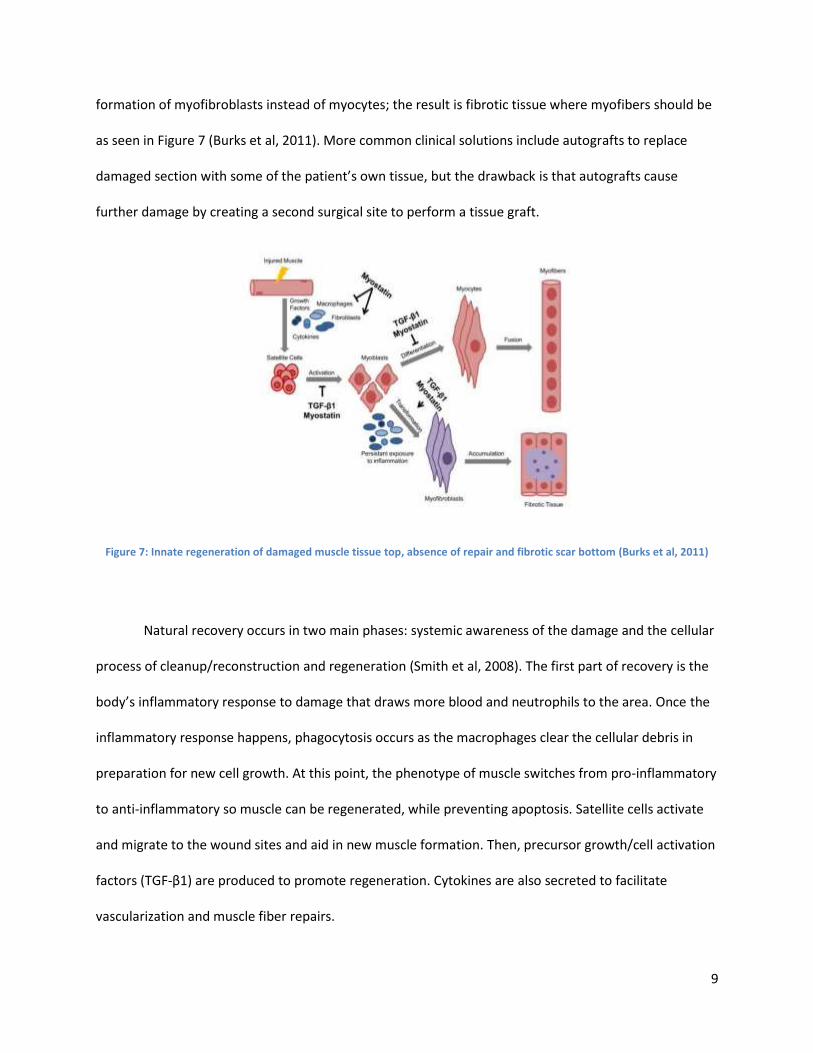
lead to swelling and provokes an autoimmune response. Prolonged exposure to inflammation causes
9
formation of myofibroblasts instead of myocytes; the result is fibrotic tissue where myofibers should be
as seen in Figure 7 (Burks et al, 2011). More common clinical solutions include autografts to replace
damaged section with some of the patient’s own tissue, but the drawback is that autografts cause
further damage by creating a second surgical site to perform a tissue graft.
Figure 7: Innate regeneration of damaged muscle tissue top, absence of repair and fibrotic scar bottom (Burks et al, 2011)
Natural recovery occurs in two main phases: systemic awareness of the damage and the cellular
process of cleanup/reconstruction and regeneration (Smith et al, 2008). The first part of recovery is the
body’s inflammatory response to damage that draws more blood and neutrophils to the area. Once the
inflammatory response happens, phagocytosis occurs as the macrophages clear the cellular debris in
preparation for new cell growth. At this point, the phenotype of muscle switches from pro-inflammatory
to anti-inflammatory so muscle can be regenerated, while preventing apoptosis. Satellite cells activate
and migrate to the wound sites and aid in new muscle formation. Then, precursor growth/cell activation
factors (TGF-β1) are produced to promote regeneration. Cytokines are also secreted to facilitate
vascularization and muscle fiber repairs.
10
2.4 Tissue Regeneration and Reconstruction The goal of tissue engineering is to regenerate and reconstruct biological cell culture to improve
the human condition. This is done through the manipulation and regulation of factors -- chemical,
physical, and electrical -- to replace or remove naturally occurring biological functions (Bach et al, 2004).
Tissue engineering encompasses a wide range of areas from drug delivery and experimentation with
pharmaceuticals to the reconstruction of extracellular matrix (ECM) scaffolds. Moreover, the creation of
biomimetic tissues enables researchers to accurately study the development and reactions of tissues, as
well as observing the tissue behavior in response to drug exposure.
Currently, when testing preclinical pharmaceuticals, live animal models are used to determine
the effects and toxicity. Alternative methods are necessary because of the rising ethical concerns that
surround animal testing. In addition, genetic diseases, including Duchenne Muscular Dystrophy and
Facioscapulohumeral Muscular Dystrophy (FSH), are not present in the genetic DNA of animals, making
results clinically irrelevant. Since it is unethical and unsafe to test directly on humans, there is a need to
be able to accurately test pharmaceuticals on in vitro models of human tissue because there is a gap
with current FDA regulations (MacArthur, 2005). The use of dmd mice has been the current practice,
even though it is not a perfect genetic model.
2.5 Need for an Enabling tool to test In Vitro Muscular Tissue There is a need for a technology platform that is able to bridge the gap between incurable
degenerative muscle diseases and pharmaceutical efforts to test the effects of their drugs. Such a tool
would ideally generate in vitro human muscle tissue that accurately depicts in vivo human muscle tissue.
This biomimetic model would circumnavigate the physiological differences and ethical concerns with
animal models and increase efficiency in the drug testing process generating a more predictive in vitro
bench top model.
11
The challenge in modeling skeletal muscle tissue is the ability to mature the tissue. If not
matured correctly, the tissue will not be representative of adult muscle tissue. Other challenges and
limitations inhibit accurate representation of in vivo conditions and recapitulation of such an
environment via these tissues on the benchtop. The overall goal of this project is to create accurate
representations of human skeletal muscle tissue.
2.6 Muscle and Myoblast Physiology The architecture of muscle in the body is composed of three main types of muscle: cardiac,
skeletal, and smooth, which control blood flow, locomotion, and digestion respectively. The team can
further organize the three groups into voluntary and involuntary muscle. The main functional unit of
skeletal muscle is the sarcomere; an arrangement of thin and thick myofilaments. Sarcomeres are
building blocks, forming a hierarchical structure of contractile myofilaments in order to form myofibers
in parallel alignment. This parallel alignment improves the speed and magnitude of lateral force
transmission (Guilak et al, 2003). This project would compare the engineered tissue to the mechanical
and chemical properties of in vivo tissue formation.
2.6.1 Cellular Organization and Development
Myocytes are cells that are multinucleated but are controlled by a motor neuron at one end
(Shier, 2009). Skeletal muscle is organized in a hierarchical structure, as shown in Figure 4. The exterior
of myocytes are encased in a sheath called the sarcoplasmic reticulum. This sheath translates the neuro-
electrical signals from motor neurons into acetylcholine, which creates a chemical gradient, signaling
contraction. Myofibrils (see Figure 4) are the contractile units of muscle comprised of bundles of
myofibers. Sarcomeres are the contractile units that contain overlapping filaments, which contract when
stimulated by a gradient of calcium ions.
12
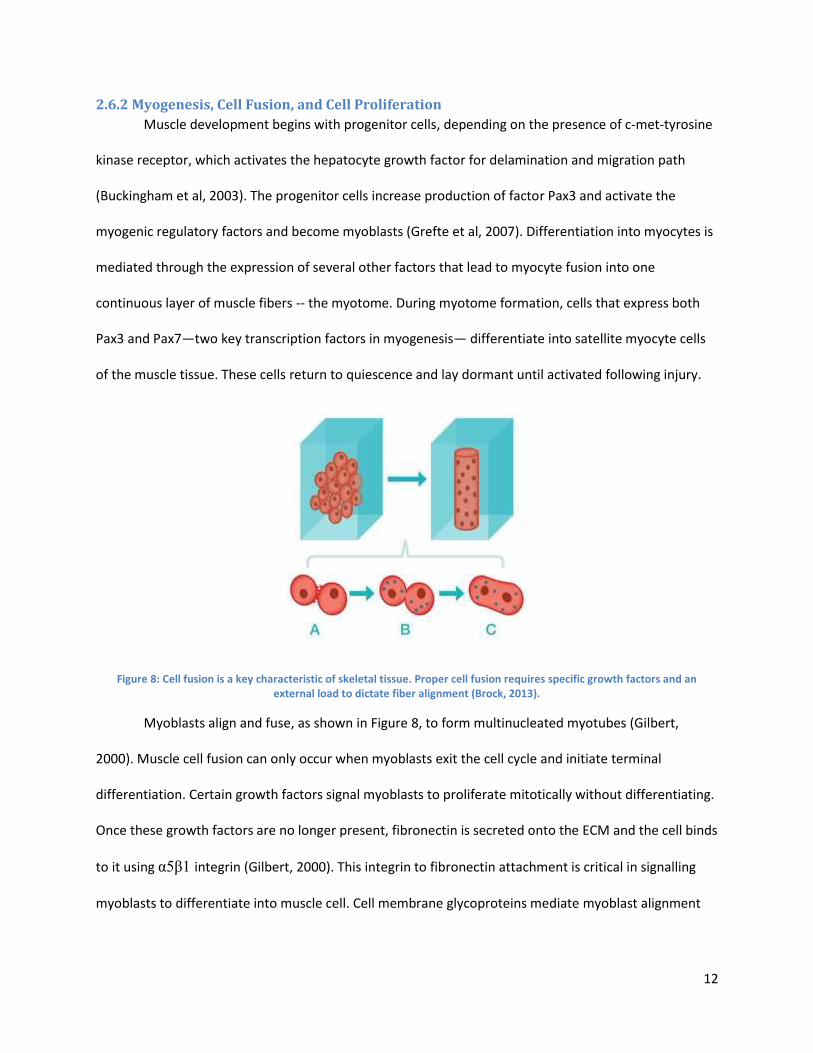
2.6.2 Myogenesis, Cell Fusion, and Cell Proliferation
Muscle development begins with progenitor cells, depending on the presence of c-met-tyrosine
kinase receptor, which activates the hepatocyte growth factor for delamination and migration path
(Buckingham et al, 2003). The progenitor cells increase production of factor Pax3 and activate the
myogenic regulatory factors and become myoblasts (Grefte et al, 2007). Differentiation into myocytes is
mediated through the expression of several other factors that lead to myocyte fusion into one
continuous layer of muscle fibers -- the myotome. During myotome formation, cells that express both
Pax3 and Pax7—two key transcription factors in myogenesis— differentiate into satellite myocyte cells
of the muscle tissue. These cells return to quiescence and lay dormant until activated following injury.
Figure 8: Cell fusion is a key characteristic of skeletal tissue. Proper cell fusion requires specific growth factors and an external load to dictate fiber alignment (Brock, 2013).
Myoblasts align and fuse, as shown in Figure 8, to form multinucleated myotubes (Gilbert,
2000). Muscle cell fusion can only occur when myoblasts exit the cell cycle and initiate terminal
differentiation. Certain growth factors signal myoblasts to proliferate mitotically without differentiating.
Once these growth factors are no longer present, fibronectin is secreted onto the ECM and the cell binds
to it using α5β1 integrin (Gilbert, 2000). This integrin to fibronectin attachment is critical in signalling
myoblasts to differentiate into muscle cell. Cell membrane glycoproteins mediate myoblast alignment
13
through an identification coupling, while metalloproteinases, called meltrins, mediate cell fusion and
initiate differentiation (Gilbert, 2000).
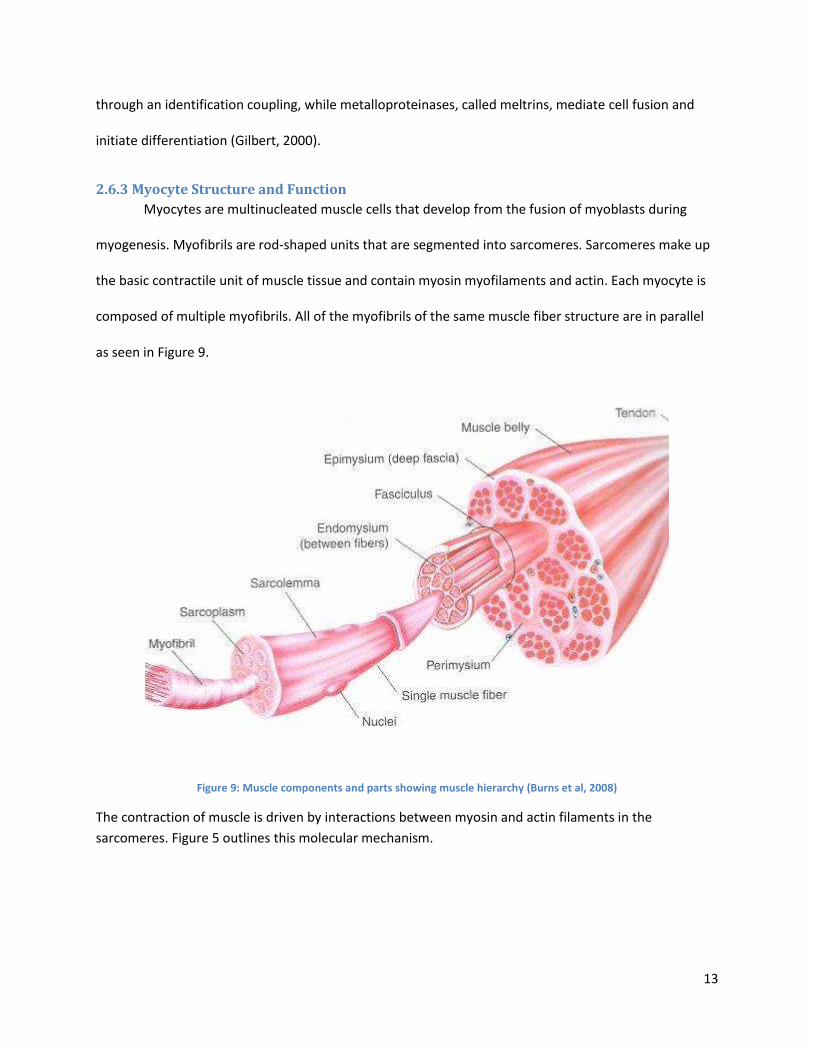
2.6.3 Myocyte Structure and Function
Myocytes are multinucleated muscle cells that develop from the fusion of myoblasts during
myogenesis. Myofibrils are rod-shaped units that are segmented into sarcomeres. Sarcomeres make up
the basic contractile unit of muscle tissue and contain myosin myofilaments and actin. Each myocyte is
composed of multiple myofibrils. All of the myofibrils of the same muscle fiber structure are in parallel
as seen in Figure 9.
Figure 9: Muscle components and parts showing muscle hierarchy (Burns et al, 2008)
The contraction of muscle is driven by interactions between myosin and actin filaments in the
sarcomeres. Figure 5 outlines this molecular mechanism.
14
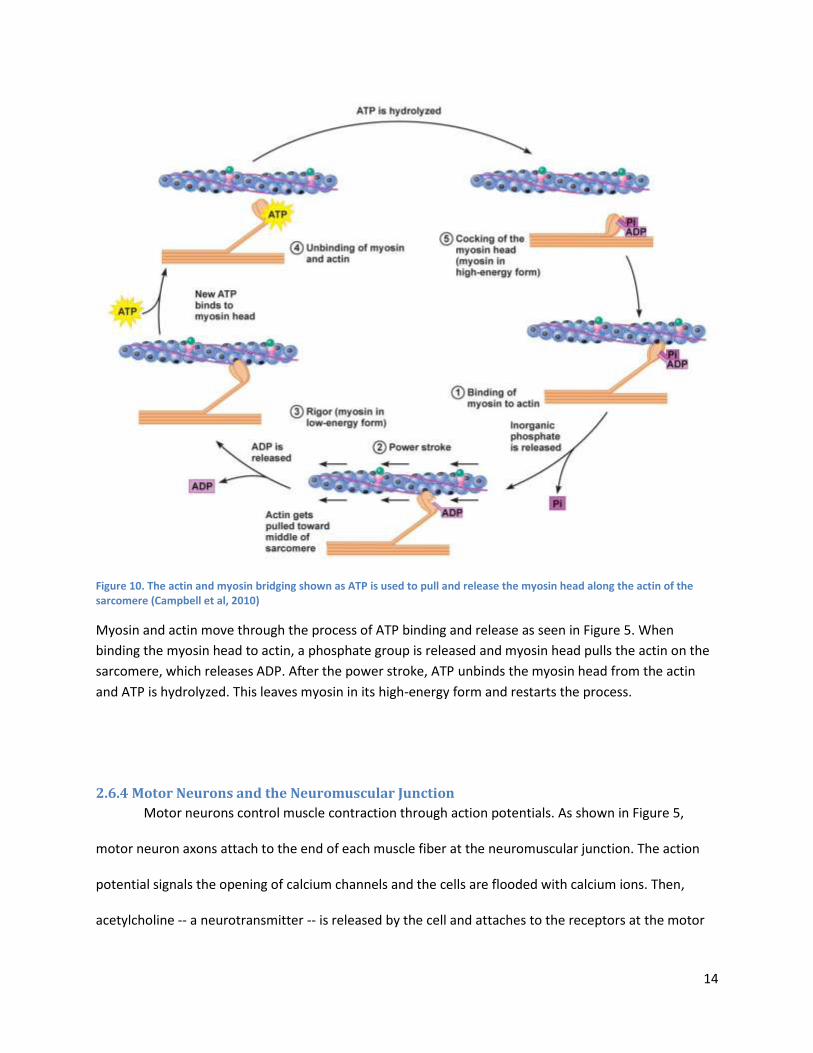
Figure 10. The actin and myosin bridging shown as ATP is used to pull and release the myosin head along the actin of the sarcomere (Campbell et al, 2010)
Myosin and actin move through the process of ATP binding and release as seen in Figure 5. When
binding the myosin head to actin, a phosphate group is released and myosin head pulls the actin on the
sarcomere, which releases ADP. After the power stroke, ATP unbinds the myosin head from the actin
and ATP is hydrolyzed. This leaves myosin in its high-energy form and restarts the process.
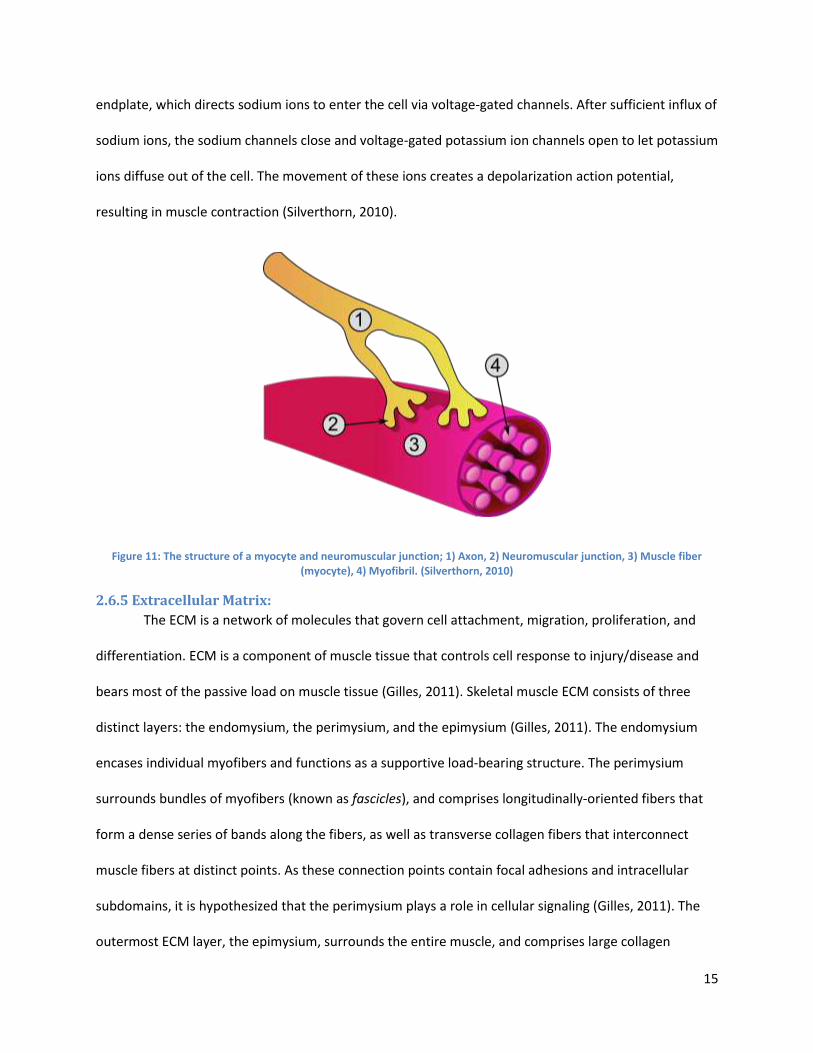
2.6.4 Motor Neurons and the Neuromuscular Junction
Motor neurons control muscle contraction through action potentials. As shown in Figure 5,
motor neuron axons attach to the end of each muscle fiber at the neuromuscular junction. The action
potential signals the opening of calcium channels and the cells are flooded with calcium ions. Then,
acetylcholine -- a neurotransmitter -- is released by the cell and attaches to the receptors at the motor
15
endplate, which directs sodium ions to enter the cell via voltage-gated channels. After sufficient influx of
sodium ions, the sodium channels close and voltage-gated potassium ion channels open to let potassium
ions diffuse out of the cell. The movement of these ions creates a depolarization action potential,
resulting in muscle contraction (Silverthorn, 2010).
Figure 11: The structure of a myocyte and neuromuscular junction; 1) Axon, 2) Neuromuscular junction, 3) Muscle fiber (myocyte), 4) Myofibril. (Silverthorn, 2010)
2.6.5 Extracellular Matrix:
The ECM is a network of molecules that govern cell attachment, migration, proliferation, and
differentiation. ECM is a component of muscle tissue that controls cell response to injury/disease and
bears most of the passive load on muscle tissue (Gilles, 2011). Skeletal muscle ECM consists of three
distinct layers: the endomysium, the perimysium, and the epimysium (Gilles, 2011). The endomysium
encases individual myofibers and functions as a supportive load-bearing structure. The perimysium
surrounds bundles of myofibers (known as fascicles), and comprises longitudinally-oriented fibers that
form a dense series of bands along the fibers, as well as transverse collagen fibers that interconnect
muscle fibers at distinct points. As these connection points contain focal adhesions and intracellular
subdomains, it is hypothesized that the perimysium plays a role in cellular signaling (Gilles, 2011). The
outermost ECM layer, the epimysium, surrounds the entire muscle, and comprises large collagen
16
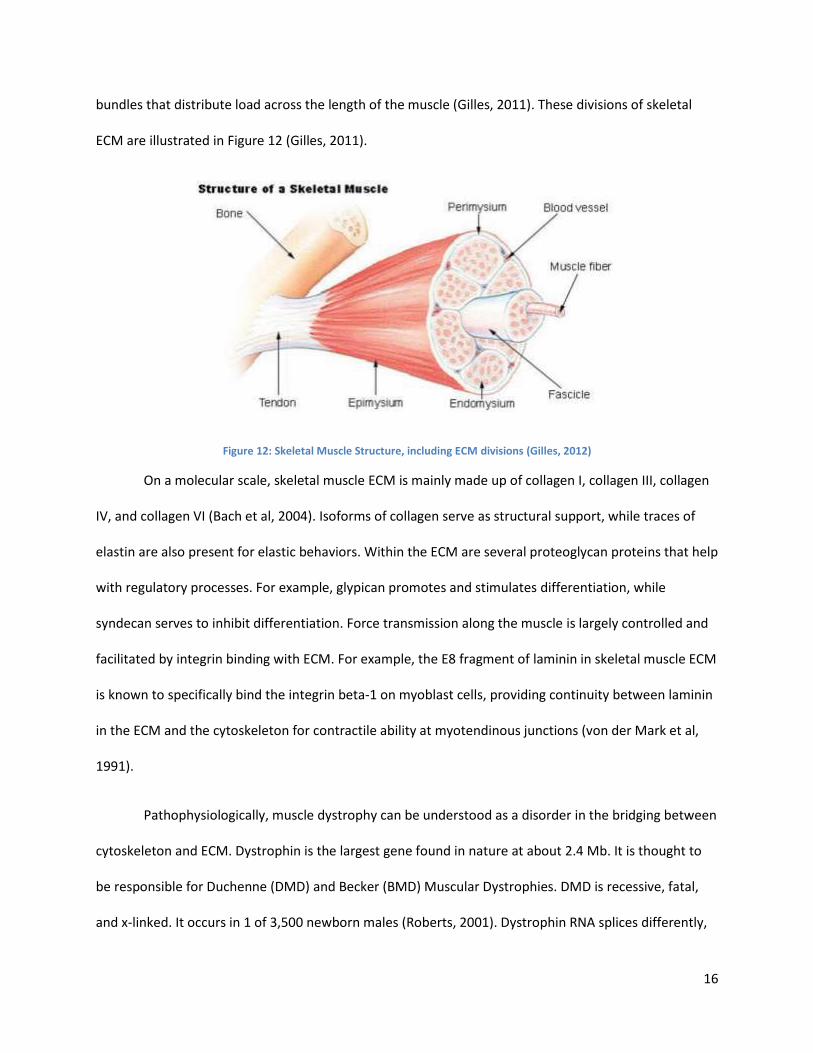
bundles that distribute load across the length of the muscle (Gilles, 2011). These divisions of skeletal
ECM are illustrated in Figure 12 (Gilles, 2011).
Figure 12: Skeletal Muscle Structure, including ECM divisions (Gilles, 2012)
On a molecular scale, skeletal muscle ECM is mainly made up of collagen I, collagen III, collagen
IV, and collagen VI (Bach et al, 2004). Isoforms of collagen serve as structural support, while traces of
elastin are also present for elastic behaviors. Within the ECM are several proteoglycan proteins that help
with regulatory processes. For example, glypican promotes and stimulates differentiation, while
syndecan serves to inhibit differentiation. Force transmission along the muscle is largely controlled and
facilitated by integrin binding with ECM. For example, the E8 fragment of laminin in skeletal muscle ECM
is known to specifically bind the integrin beta-1 on myoblast cells, providing continuity between laminin
in the ECM and the cytoskeleton for contractile ability at myotendinous junctions (von der Mark et al,
1991).
Pathophysiologically, muscle dystrophy can be understood as a disorder in the bridging between
cytoskeleton and ECM. Dystrophin is the largest gene found in nature at about 2.4 Mb. It is thought to
be responsible for Duchenne (DMD) and Becker (BMD) Muscular Dystrophies. DMD is recessive, fatal,
and x-linked. It occurs in 1 of 3,500 newborn males (Roberts, 2001). Dystrophin RNA splices differently,
17
which produces a range of varying transcripts and encodes for a large set of protein isoforms. More
specifically, Dp427 transcripts are large, rod-like cytoskeletal proteins which are found in muscle fibers.
The dystrophin-glycoprotein complex bridges the inner cytoskeleton (F-actin) and the extra-cellular
matrix. The breakdown or malicious mutation of this relationship leads to degradation and weakening of
the ECM and the F-actin in the cell cytoskeleton (Roberts, 2001). This degradation worsens until the
patient is immobilized from the inability to use their muscles and subsequently dies (Roberts, 2001).
2.7 In Vitro Muscle Generation The generation of skeletal muscle tissue in vitro represents an approach that seeks to mimic in
vivo myogenesis—the natural formation of muscle during prenatal development as well as the natural
maturation of muscle during later stages of development and adult regeneration of muscle following
small injuries (Bach et al, 2004). Therefore, the standard metrics for in vitro engineered skeletal muscle
arise from mimicking the morphology, functionality, and contractile force produced by native skeletal
muscle tissue. Key metrics include: parallel uniaxial alignment of myofibrils (myotube bundles) with
myosin and actin filaments, intracellular calcium storage, and expression of acetylcholine receptors
localized to the neuromuscular junction (Bach et al, 2004). Another important metric for tissue
formation is tissue anchorage similar to muscle-bone attachment, since continuous passive tension
applied to skeletal muscle by growing bone during embryogenesis and neonatal development influences
native levels of myofiber length and parallel myofilber alignment (Powell et al, 2002). Cell density,
myotube length, and myotube diameter similar to cell composition in native skeletal muscle is also a key
metric,. Notably, myofiber diameter for in vivo human muscle ranges from 10-100 μm and myofiber
length is averaged at 23.3 μm (Vandenburgh, 1991). In the myotubes, the density of nuclei per sectioned
slide of in vivo tissue is between 30-57 nuclei/mm^2 (Vandenburgh, 1991).In the following sections, the
role of cell density in ECM structure, muscle contractility (i.e. function), and myofiber density will be
discussed (Powell et al, 2002).
18
2.7.1 Myogenic Cell Types
Functional skeletal muscle cells have been successfully cultured in vitro as early as 1915 (Lewis,
1915). Numerous myogenic cell populations have been used for generating skeletal muscle tissue in
vivo, including primary cultures of embryonic avian or neonatal skeletal muscle cells, or C2C12 cells
(Dennis, 2000).
Primary satellite cells (myoblast precursors) for ESMT applications have been directly harvested
from the muscles of neonatal rats, birds, mice, and frogs (Koning et al, 2009). Primary satellite cells have
been obtained from minced explants of adult and neonatal soleus, latissimus dorsi, and tibialis anterior
in rats (Dennis and Kosnik, 2000), as well as the brachioradialis in frogs (Koning et al, 2009). The current
method of choice for culturing primary myogenic cells is to extract satellite cells from ex vivo myofibers
and then derive primary myoblasts from these satellite cells. Shansky et al (1997) and Dennis and Kosnik
(2000) were among the first to demonstrate in vitro generation of functional skeletal muscle tissue using
primary myoblasts derived from tissue biopsy. Being derived directly from muscle tissue, primary cell
cultures are able to produce tissue in a way that closely matches myogenesis (Bach et al, 2004). Yet,
satellite cells from different organisms and muscles result in skeletal muscle tissue with very different
properties (Koning et al, 2009). For example, skeletal muscle tissue engineered from soleus muscle
satellite cells differs substantially from tissue engineered from tibialis anterior muscle satellite cells, in
contractile force and frequency (Koning et al, 2009). The anatomical location of primary cells must
therefore be taken into consideration in the parameters of the model tissue. Accuracy of human tissue
modeling is also a concern when using xenogeneic satellite cells. There is clear evidence in studies of
mouse muscle that satellite cells— both within the same muscle and even on the same fiber— differ in
marker expression, function , density (i.e. satellite cells per fiber), and capacity to differentiate in vitro,
depending on the muscle used for the satellite cell isolation (Boldrin et al, 2010). These are all
observations of mouse muscle, and it is still unclear if the human satellite cell pool is heterogeneous like
19
the mouse satellite cell pool (Boldrin et al, 2010). Myogenic satellite cells appear to strongly imprint
their muscle source (in terms of anatomy or species), producing in vitro tissue similar to their native
tissue source (Bach et al, 2004).To obtain sufficiently large cell populations for in vitro skeletal muscle
tissue, however, primary myoblasts need to be cultured over extended periods of time. Also, with
successive passaging, differentiation becomes increasingly difficult to induce in primary cell cultures,
often due to contamination from fibroblasts (Koning et al, 2009) (Li et al, 2011). Immortalized cell lines
do not reach senescence and can split nearly indefinitely given the space and resources; whereas,
senescence cells age and lose their potential to complete mitosis. Another difficulty in obtaining primary
cell cultures in vitro is that the process of isolating primary cells will often activate SC’s and direct them
down a terminal differentiation pathway substantially reducing the differentiation potential of the cells
and, making expansion of a myogenic population in vitro to a clinically-relevant cell number very difficult
(Sabourin et al, 1999).
Recently, studies have developed engineered tissue from the well-established mouse myoblast
C2C12 cell line (Okano and Matsuda, 1998; Van Wachem et al, 1996). The C2C12 cell line is a cell line of
myoblasts that was originally derived from mouse sarcolemma skeletal muscle (Bach et al, 2004). C2C12
cultures do not recapitulate in vivo myogenesis as closely as cultures of primary myogenic cells (Bach et
al, 2004); however, the use of C2C12 cells allows for a means of standardization between researchers.
Leading not only to easier sourcing of myogenic cells, but most importantly to increased consistency of
the properties of engineered tissue useful for validation work. In addition, C2C12’s grow faster, can use
relatively inexpensive media (needing fewer specialized growth factors) to grow in, which saves time
and money. Generally C2C12 cells are used to pilot test systems, and create clinical relevance.
20
2.7.2 Culture Media
Cell culture media are rich mixtures of sugars to sustain cellular metabolism, salts for pH
buffering/ osmotic balance, and amino acids for protein synthesis (ATCC, 2014). Media mixtures, such
as Dulbecco’s Modified Eagle’s Medium (DMEM), provide amino acids and vitamins as well as trace
minerals and glucose (ATCC, 2014). As a safeguard, antibiotics may also be added to myogenic cell
cultures—commonly penicillin, streptomycin, or gentamycin is used (Dennis and Kosnik, 2000; Carosio
et al, 2013). Serum, isolated from blood, also provides many of these proteins, along with several
growth factors (ATCC, 2014). The percent composition and type of serum influences the cell cycle
because the amount of overall nutrients influences it, inducing cells to proliferate or differentiate. Fetal
serum (such as fetal bovine serum used by this project) is richer in proteins and growth factors,
promoting cell proliferation compared to adult serum (such as adult horse serum, as used in this
project), and cells favor proliferation in high-serum environments, and differentiation in low-serum
environments (ATCC, 2014; Carosio et al, 2013). Cells typically exit the cell cycle, transitioning into
terminal differentiation, upon detecting mitogen-reduced environments (Carosio et al, 2013). For
skeletal muscle cells, high concentrations of fetal bovine serum (FBS) are typically used for cell
proliferation, and low concentrations of adult horse serum are typically used for cell differentiation
(Carosio et al 2013; ATCC, 2014; Bach et al, 2004). Some examples of common formulations for
proliferation and differentiation media are presented below. The key takeaway is that reducing serum
concentration in media induces cells to exit the proliferative cell cycle and enter differentiation. Dennis
and Kosnik (2000) and Carosio et al (2013) both used primary adult rat myogenic precursor cells:
(1) Differentiation Medium (Dennis and Kosnik, 2000): 7% adult horse serum in DMEM, 100
units/ml penicillin.
(2) Differentiation Medium (Carosio et al, 2013): 5% adult horse serum in DMEM, 25 mM
HEPES buffer (for pH buffering), 4 mM L-glutamine, 0.1% penicillin/streptomycin
21
(3) Proliferation Medium (Carosio et al, 2013): 20% fetal bovine serum in DMEM, 25 mM
HEPES buffer, 4 mM L-glutamine, 0.1% penicillin/streptomycin
2.7.3 3D Culture
The presence and composition of ECM greatly influences the differentiation of myogenic cells
(Bach et al, 2004). In vivo, ECM provides myogenic cells the framework for cell adhesion and tissue
organization, which includes cell migration and differentiation (Koning et al, 2009). As 3D cultures of
C2C12 cells alone are unable to synthesize endogenously the ECM necessary for tissue formation, ECM-
based scaffolds have been utilized for cell culture (Bach et al, 2004).
Vandenburgh et al (1988) was the first to demonstrate a three-dimensional scaffold culture for
in vitro skeletal muscle tissue. Until then, studies of engineering muscle tissue had typically been
conducted with cultured cells in 2D. After myoblasts fuse to form myotubes, they begin to passively
contract. This impedes 2D culture of skeletal muscle tissue, as these contractions can detach the cell
layer from its substrate. Once in a detached and free-floating layer, cells are no longer under mechanical
tension—this causes the tissue to contract inward and form a 3D ball, diminishing its structural maturity
and making it difficult to analyze (Vandenburgh et al, 1988).
Cell culture in 3D scaffolds remains widespread in the field of developing in vitro skeletal muscle
tissue. Common substrates include: Matrigel (Shansky et al, 1997) (Vandenburgh et al, 1996), and type I
collagen (Vandenburgh et al, 1988). These substrates are derived from ECM components and attempt to
recapitulate the cues for differentiation provided by a native ECM. Synthetic scaffolds, including
scaffolds composed of polylactic-co-glycolic acid (PGA), have also been studied (Koning et al, 2009).
Aligned topography on both natural and synthetic scaffolds —via microgrooves and nanofibers— has
been found to promote controlled myoblast differentiation and direct the parallel assembly of
myofibers and cytoskeletal proteins (Koning et al, 2009).
22
However, cultures in scaffolds restrict the ability to measure and characterize the contractile
properties of the tissue in comparison to other culturing methods (Carosio et al, 2013). Tissues grown in
scaffolds also exhibit viable tissue formation only at the peripheries of the scaffold, with large regions of
cell and tissue death towards the center. Under in vitro conditions, the availability of nutrients to cells
within the scaffold is limited by diffusion of media to within 5 µm into the scaffold substrate, due to lack
of innervation and vascularization within the scaffold (Levenberg et al, 2005). Tissue decreases in
viability towards the scaffold center, following the diminishing diffusion gradient of nutrients into the
scaffold interior. One strategy to circumvent this problem is to introduce angiogenic factors into the
scaffold material, in order to stimulate vascularization (Levenberg et al, 2005).Non-contractile
substrates—as characteristic of the scaffolds listed above—also inhibit the formation of myotubes, as
well as the contractile force of the generated tissue, and therefore tissue function (Carosio et al, 2013).
2.7.4 Self-Assembly and Co-culture
Strohman et al (1990) demonstrated for the first time that primary skeletal muscle cells are able
to self-organize into a 3D tissue construct, in the absence of a scaffold. Dennis and Kosnik (2000)
developed a unique method of engineering functional units of muscle tissues, termed “myooids”, which
self-organize from a monolayer into a rolled-up cylindrical tube from primary adult rat satellite cells. 2D
cultures of myogenic cell monolayers, when provided points for anchorage and allowed to differentiate,
can self-assemble into tissues as they passively contract. These anchors act as an initial mechanical
structure for a cell layer, to align into a 3D cylindrical tissue construct, via the passive contractions that
myogenic cells increasingly produce as they advance through differentiation. Carosio et al (2013) used a
pair of stainless steel pins for tissue anchorage for their self-assembly from a cell monolayer, whereas
Dennis (2000) used silk sutures tied to pins to mimic myotendonous junctions. More viable, in-vivo-like
tissue was formed through simultaneous growth with endogenous ECM, as fibroblasts secreted ECM
that directed myoblast cell growth (Dennis ,2000). Tissues from scaffolds were not as strong, due to the
23
ingrowth of cells into pre-existing, exogenous ECM. As discussed previously, another way to set up this
initial mechanical structure is by providing the cells with a provisional ECM. A more recent approach
attempts to do this via endogenous ECM, as through a co-culture of myoblasts with ECM-secreting
fibroblasts.
Rather than a homogeneous culture of myoblasts, a heterogeneous co-culture of both
myoblasts and fibroblasts self-organizes into the tissue structure more typical of native skeletal muscle
(Dennis and Kosnik, 2000; Carosio et al, 2013). Carosio et al (2013) reported that pure cultures of
myoblasts failed to generate mature muscle tissue via self-assembly. Co-cultures with both cell types
results in tissue formation more closely resembling the symbiotic effect between native myoblasts and
fibroblasts during human in vivo myogenesis (Carosio et al, 2013)(Marzaro et al, 2002). The co-culture of
fibroblasts with myoblasts improves the self-organization and alignment of skeletal muscle
architecture—requiring only anchorage points and exogenous ECM to direct 3D tissue formation. In
vitro, NIH/3T3 fibroblasts can secrete the extracellular matrix that provides support for the adhesion,
proliferation and differentiation of myoblasts (Carosio et al, 2013). 101T1/2 fibroblasts may also be used
for this purpose (Dennis, 2000). As the fibroblasts within the culture secrete the ECM necessary for in
vitro muscle tissue, and if sufficient anchorage and shape of 3D mold is provided for developing self-
assembled tissue, there is no need to provide ECM externally, rendering the use of a scaffold
unnecessary.
Dennis and Kosnik (2000) pioneered the myooid approach, where fibroblasts and myoblasts are
cultured together to form scaffoldless 3Dmuscle tissue while also producing ECM exogenously. The co-
culture method is a more accurate representation of in vivo myogenesis than scaffold methods, as the
ECM is produced intrinsically by the cells, resulting in better recapitulation of native cell densities in
neonatal myogenesis (Dennis, 2000). In the myooids, processes such as the fusion of myoblasts into
24
myotubes, the creation of the extracellular matrix, and the formation of myofibrils with successive
recruitment of fibroblasts and myoblasts all occur more similarly to denovo synthesis of muscle tissue —
in terms of muscle morphology, as well as composition and localization of cell types (Dennis, 2000).
However, the myooids of Dennis and Kosnik (2000) were only able to generate 2-8% of the force (per
unit cross-sectional area) generated by skeletal muscles of adult mice. Myotubes within in vitro tissue
are commonly arrested in an immature state, failing to develop to a more adult-like phenotype. One
reason is that in natural myogenesis, the maturation of newly-formed myotubes to adult myotubes is
dependent on electrochemical activity, in the form of tetanic nerve impulses (Huang et al, 2005). Such
stimulation has been difficult to replicate in vitro. Additionally, several key growth factors are present in
vivo. For example, insulin-like growth factor I (IGF-I) is known to play a critical role in muscle maturation
by increasing DNA synthesis, kinase activity, amino acid uptake, and the expression of important
functional proteins (Huang et al, 2005). A twofold increase in muscle size was observed in mice
engineered with muscle-specific overexpression of IGF-I (Coleman et al, 1995).
Dennis and Kosnik (2000) cultured a monolayer of co-culture on a type-I-collagen-coated plastic
dish. After 2 days incubation in differentiation medium, the confluent monolayer was delaminated from
the substrate and affixed onto a silicone-coated dish between two steel pins. Over 2-3 days, the tissue
self-organized into a rolled-up 3D cylindrical structure, containing dense, aligned myotubes that are
contractile. Figure 7 demonstrates the cross-sectional structure of a “myooid” culture—a self-
assembling co-culture of fibroblasts and myoblasts showing large amounts of collagen from the plate
(Dennis, 2000).
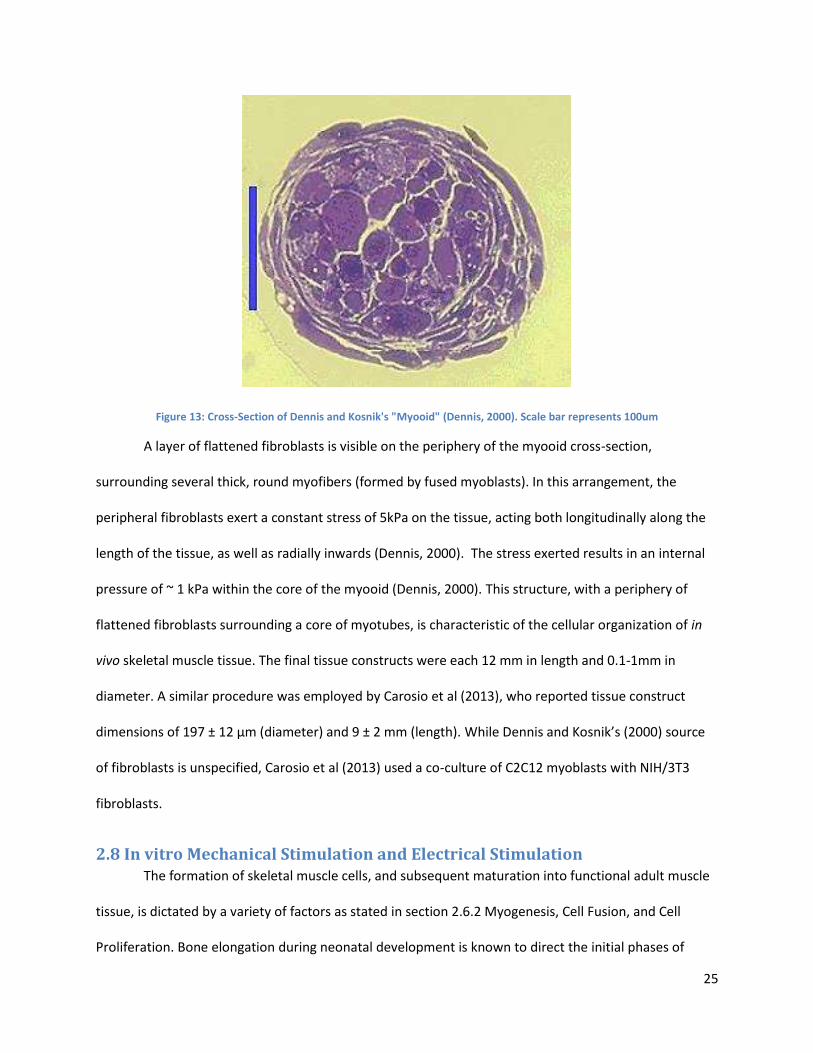
25
Figure 13: Cross-Section of Dennis and Kosnik's "Myooid" (Dennis, 2000). Scale bar represents 100um
A layer of flattened fibroblasts is visible on the periphery of the myooid cross-section,
surrounding several thick, round myofibers (formed by fused myoblasts). In this arrangement, the
peripheral fibroblasts exert a constant stress of 5kPa on the tissue, acting both longitudinally along the
length of the tissue, as well as radially inwards (Dennis, 2000). The stress exerted results in an internal
pressure of ~ 1 kPa within the core of the myooid (Dennis, 2000). This structure, with a periphery of
flattened fibroblasts surrounding a core of myotubes, is characteristic of the cellular organization of in
vivo skeletal muscle tissue. The final tissue constructs were each 12 mm in length and 0.1-1mm in
diameter. A similar procedure was employed by Carosio et al (2013), who reported tissue construct
dimensions of 197 ± 12 μm (diameter) and 9 ± 2 mm (length). While Dennis and Kosnik’s (2000) source
of fibroblasts is unspecified, Carosio et al (2013) used a co-culture of C2C12 myoblasts with NIH/3T3
fibroblasts.
2.8 In vitro Mechanical Stimulation and Electrical Stimulation The formation of skeletal muscle cells, and subsequent maturation into functional adult muscle
tissue, is dictated by a variety of factors as stated in section 2.6.2 Myogenesis, Cell Fusion, and Cell
Proliferation. Bone elongation during neonatal development is known to direct the initial phases of
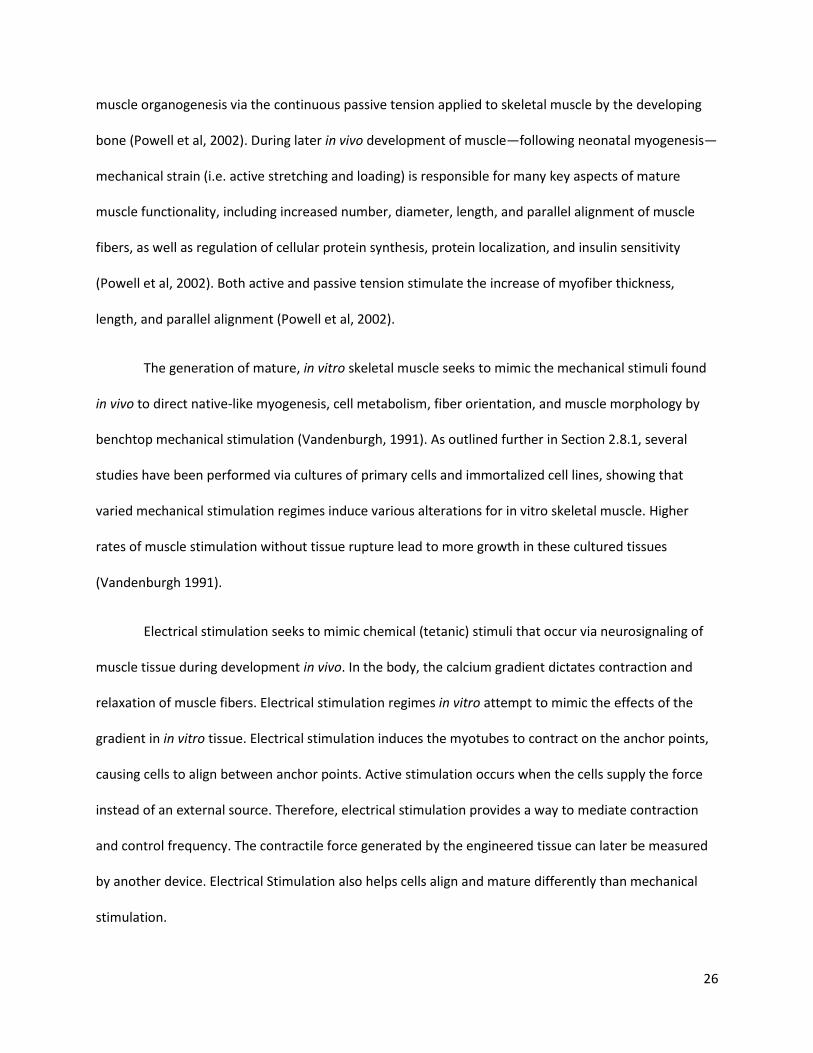
26
muscle organogenesis via the continuous passive tension applied to skeletal muscle by the developing
bone (Powell et al, 2002). During later in vivo development of muscle—following neonatal myogenesis—
mechanical strain (i.e. active stretching and loading) is responsible for many key aspects of mature
muscle functionality, including increased number, diameter, length, and parallel alignment of muscle
fibers, as well as regulation of cellular protein synthesis, protein localization, and insulin sensitivity
(Powell et al, 2002). Both active and passive tension stimulate the increase of myofiber thickness,
length, and parallel alignment (Powell et al, 2002).
The generation of mature, in vitro skeletal muscle seeks to mimic the mechanical stimuli found
in vivo to direct native-like myogenesis, cell metabolism, fiber orientation, and muscle morphology by
benchtop mechanical stimulation (Vandenburgh, 1991). As outlined further in Section 2.8.1, several
studies have been performed via cultures of primary cells and immortalized cell lines, showing that
varied mechanical stimulation regimes induce various alterations for in vitro skeletal muscle. Higher
rates of muscle stimulation without tissue rupture lead to more growth in these cultured tissues
(Vandenburgh 1991).
Electrical stimulation seeks to mimic chemical (tetanic) stimuli that occur via neurosignaling of
muscle tissue during development in vivo. In the body, the calcium gradient dictates contraction and
relaxation of muscle fibers. Electrical stimulation regimes in vitro attempt to mimic the effects of the
gradient in in vitro tissue. Electrical stimulation induces the myotubes to contract on the anchor points,
causing cells to align between anchor points. Active stimulation occurs when the cells supply the force
instead of an external source. Therefore, electrical stimulation provides a way to mediate contraction
and control frequency. The contractile force generated by the engineered tissue can later be measured
by another device. Electrical Stimulation also helps cells align and mature differently than mechanical
stimulation.
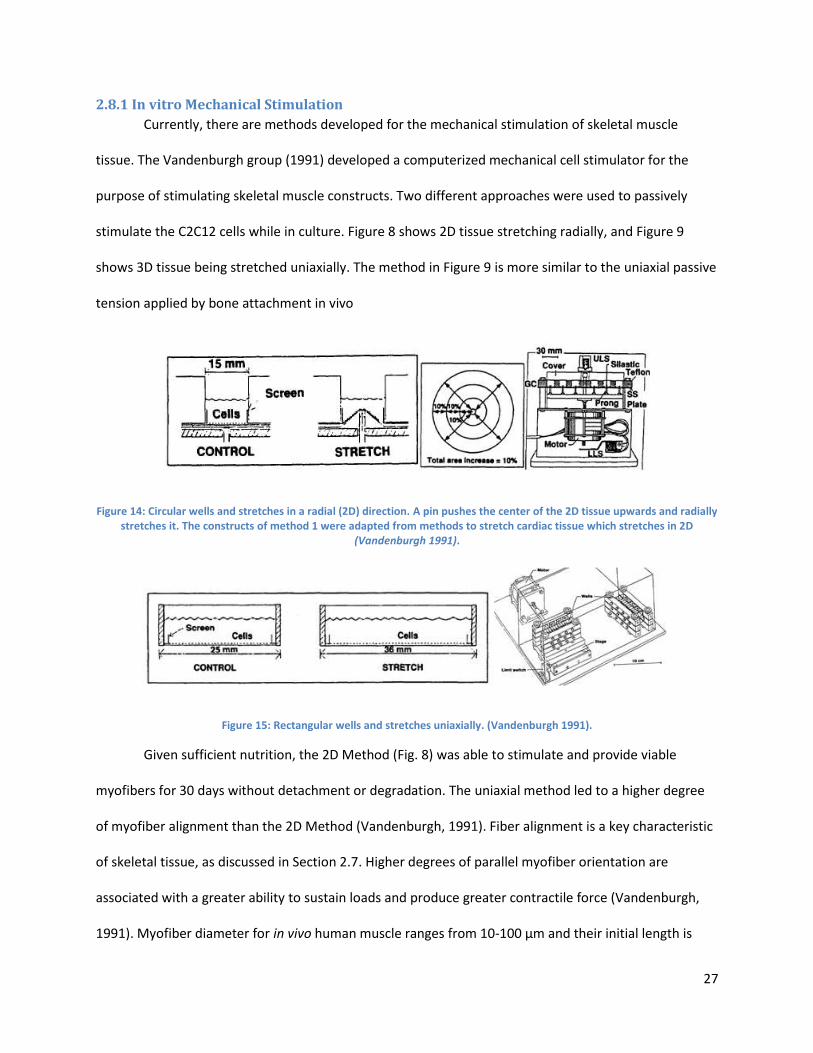
27
2.8.1 In vitro Mechanical Stimulation
Currently, there are methods developed for the mechanical stimulation of skeletal muscle
tissue. The Vandenburgh group (1991) developed a computerized mechanical cell stimulator for the
purpose of stimulating skeletal muscle constructs. Two different approaches were used to passively
stimulate the C2C12 cells while in culture. Figure 8 shows 2D tissue stretching radially, and Figure 9
shows 3D tissue being stretched uniaxially. The method in Figure 9 is more similar to the uniaxial passive
tension applied by bone attachment in vivo
Figure 14: Circular wells and stretches in a radial (2D) direction. A pin pushes the center of the 2D tissue upwards and radially stretches it. The constructs of method 1 were adapted from methods to stretch cardiac tissue which stretches in 2D
(Vandenburgh 1991).
Figure 15: Rectangular wells and stretches uniaxially. (Vandenburgh 1991).
Given sufficient nutrition, the 2D Method (Fig. 8) was able to stimulate and provide viable
myofibers for 30 days without detachment or degradation. The uniaxial method led to a higher degree
of myofiber alignment than the 2D Method (Vandenburgh, 1991). Fiber alignment is a key characteristic
of skeletal tissue, as discussed in Section 2.7. Higher degrees of parallel myofiber orientation are
associated with a greater ability to sustain loads and produce greater contractile force (Vandenburgh,
1991). Myofiber diameter for in vivo human muscle ranges from 10-100 μm and their initial length is
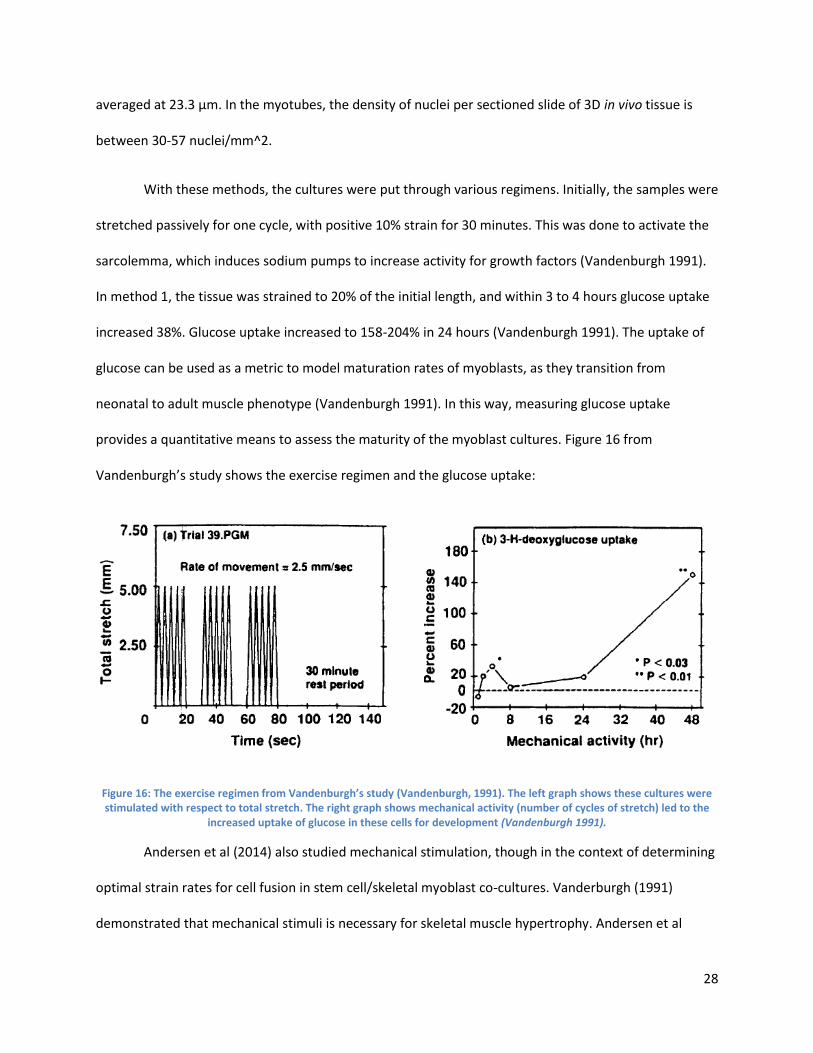
28
averaged at 23.3 μm. In the myotubes, the density of nuclei per sectioned slide of 3D in vivo tissue is
between 30-57 nuclei/mm^2.
With these methods, the cultures were put through various regimens. Initially, the samples were
stretched passively for one cycle, with positive 10% strain for 30 minutes. This was done to activate the
sarcolemma, which induces sodium pumps to increase activity for growth factors (Vandenburgh 1991).
In method 1, the tissue was strained to 20% of the initial length, and within 3 to 4 hours glucose uptake
increased 38%. Glucose uptake increased to 158-204% in 24 hours (Vandenburgh 1991). The uptake of
glucose can be used as a metric to model maturation rates of myoblasts, as they transition from
neonatal to adult muscle phenotype (Vandenburgh 1991). In this way, measuring glucose uptake
provides a quantitative means to assess the maturity of the myoblast cultures. Figure 16 from
Vandenburgh’s study shows the exercise regimen and the glucose uptake:
Figure 16: The exercise regimen from Vandenburgh’s study (Vandenburgh, 1991). The left graph shows these cultures were stimulated with respect to total stretch. The right graph shows mechanical activity (number of cycles of stretch) led to the
increased uptake of glucose in these cells for development (Vandenburgh 1991).
Andersen et al (2014) also studied mechanical stimulation, though in the context of determining
optimal strain rates for cell fusion in stem cell/skeletal myoblast co-cultures. Vanderburgh (1991)
demonstrated that mechanical stimuli is necessary for skeletal muscle hypertrophy. Andersen et al
29
(2014) placed 2D tissue cultures (density of 5000 cells/cm^2) through pulses of 15% strain at 0.5 Hz
(Andersen, 2014). After conducting variations of this regime, of 3D tissues was found to be optimal for
the stem cell /myoblast for alignment and stimulation purposes with the least rupture (Andersen, 2014).
This regime also appeared to accelerate the differentiation process in C2C12 cells, which formed a
greater number of myotubes compared to their control. Andersen et al (2014) came to this conclusion
by comparing the rate of the development of myotubes and myogenic markers, myogenin and myosin,
to the control over 48 hours.
Both Andersen (2014) and Vandenburgh (1991) conducted mechanical stimulation tests with
similar parameters. Vandenburgh (1991) strained from 10% to 20% and Andersen strained at 15% strain.
Vandenburgh strained at a slower pace than Andersen’s pulsing technique. No test in prior works has
exceeded 20% strain, possibly due to rupture with greater strains. The regimes were computerized and
programmable in terms of strain rate, amplitude, and duration. In the end, both methods concluded
that mechanically stimulating skeletal muscular tissue lead to the following:
1. “Mechanical stimulation increases myoblast fusion rates” (Andersen, 2014)
2. “Mechanical stimulation increases longitudinal myofiber growth rates” (Andersen, 2014)
3. “Mechanical stimulation induces organogenesis of artificial muscles capable of generating active
tension in the longitudinal axis” (Vandenburgh 1991)
The team determine that it would be ideal to use Andersen’s optimized 15% strain, in combination
with Vandenburgh’s slower strain rates as parameters for the team’s experiments. Slower strain rates
help protect against tissue rupture.
2.8.2 Anchorage of In Vitro Muscle Tissue
Anchorage is a key defining aspect of skeletal tissue. In vivo, myoblasts grow and anchor to
bone, causing passive tension in vivo that promotes cell differentiation. Currently in vitro, there are two
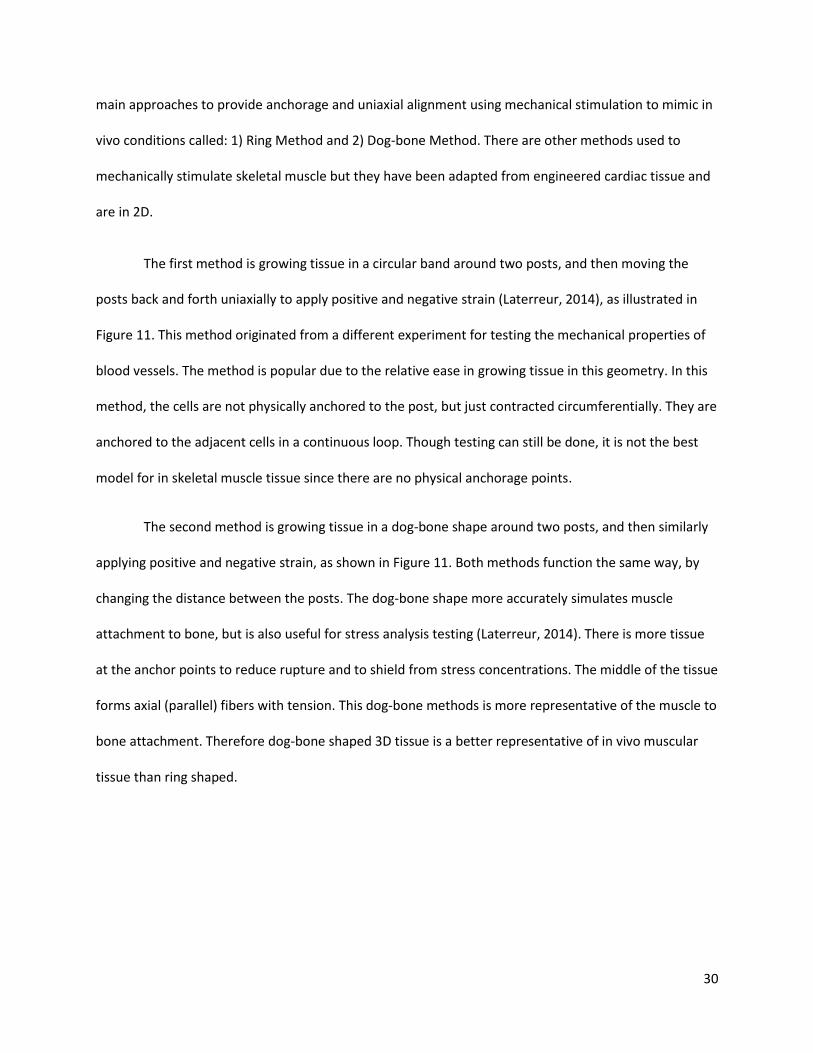
30
main approaches to provide anchorage and uniaxial alignment using mechanical stimulation to mimic in
vivo conditions called: 1) Ring Method and 2) Dog-bone Method. There are other methods used to
mechanically stimulate skeletal muscle but they have been adapted from engineered cardiac tissue and
are in 2D.
The first method is growing tissue in a circular band around two posts, and then moving the
posts back and forth uniaxially to apply positive and negative strain (Laterreur, 2014), as illustrated in
Figure 11. This method originated from a different experiment for testing the mechanical properties of
blood vessels. The method is popular due to the relative ease in growing tissue in this geometry. In this
method, the cells are not physically anchored to the post, but just contracted circumferentially. They are
anchored to the adjacent cells in a continuous loop. Though testing can still be done, it is not the best
model for in skeletal muscle tissue since there are no physical anchorage points.
The second method is growing tissue in a dog-bone shape around two posts, and then similarly
applying positive and negative strain, as shown in Figure 11. Both methods function the same way, by
changing the distance between the posts. The dog-bone shape more accurately simulates muscle
attachment to bone, but is also useful for stress analysis testing (Laterreur, 2014). There is more tissue
at the anchor points to reduce rupture and to shield from stress concentrations. The middle of the tissue
forms axial (parallel) fibers with tension. This dog-bone methods is more representative of the muscle to
bone attachment. Therefore dog-bone shaped 3D tissue is a better representative of in vivo muscular
tissue than ring shaped.
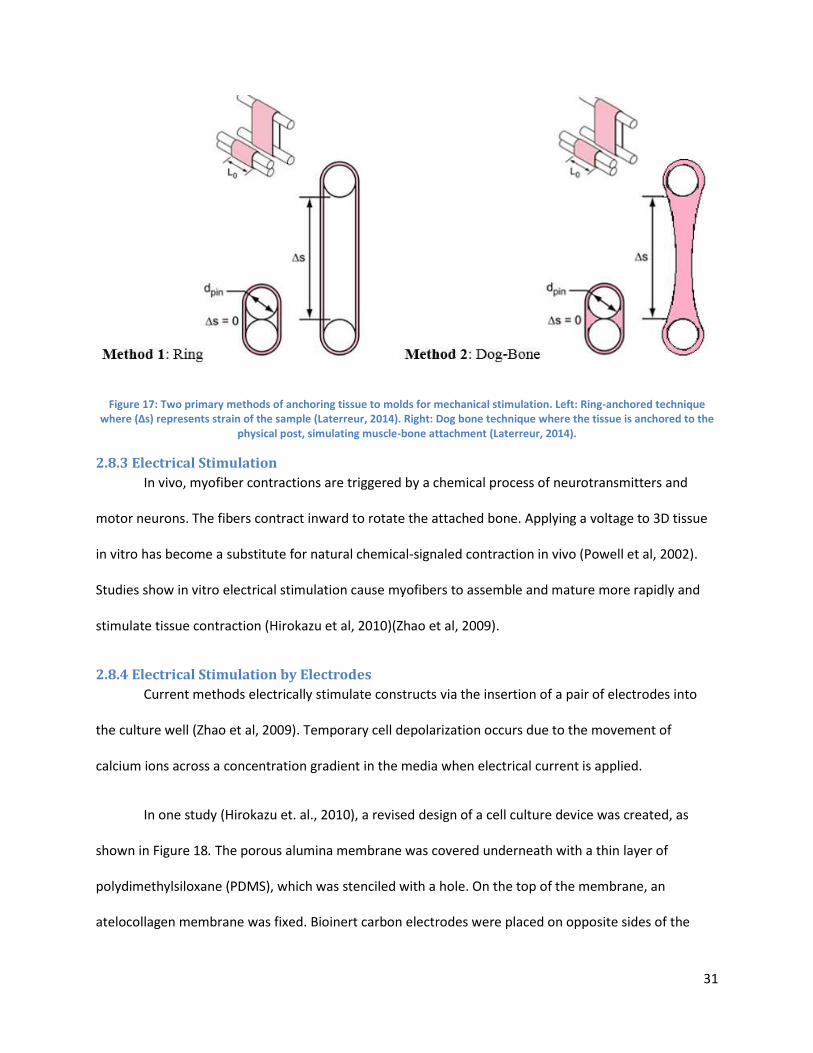
31
Figure 17: Two primary methods of anchoring tissue to molds for mechanical stimulation. Left: Ring-anchored technique where (∆s) represents strain of the sample (Laterreur, 2014). Right: Dog bone technique where the tissue is anchored to the
physical post, simulating muscle-bone attachment (Laterreur, 2014).
2.8.3 Electrical Stimulation
In vivo, myofiber contractions are triggered by a chemical process of neurotransmitters and
motor neurons. The fibers contract inward to rotate the attached bone. Applying a voltage to 3D tissue
in vitro has become a substitute for natural chemical-signaled contraction in vivo (Powell et al, 2002).
Studies show in vitro electrical stimulation cause myofibers to assemble and mature more rapidly and
stimulate tissue contraction (Hirokazu et al, 2010)(Zhao et al, 2009).
2.8.4 Electrical Stimulation by Electrodes
Current methods electrically stimulate constructs via the insertion of a pair of electrodes into
the culture well (Zhao et al, 2009). Temporary cell depolarization occurs due to the movement of
calcium ions across a concentration gradient in the media when electrical current is applied.
In one study (Hirokazu et. al., 2010), a revised design of a cell culture device was created, as
shown in Figure 18. The porous alumina membrane was covered underneath with a thin layer of
polydimethylsiloxane (PDMS), which was stenciled with a hole. On the top of the membrane, an
atelocollagen membrane was fixed. Bioinert carbon electrodes were placed on opposite sides of the
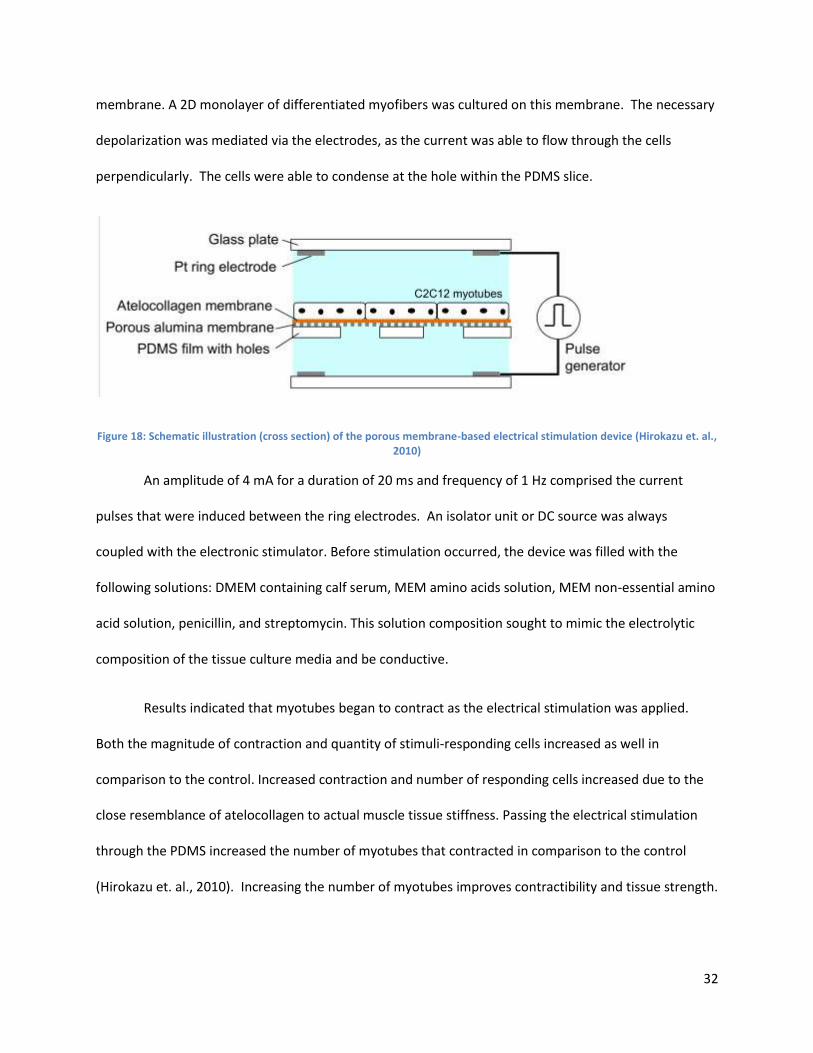
32
membrane. A 2D monolayer of differentiated myofibers was cultured on this membrane. The necessary
depolarization was mediated via the electrodes, as the current was able to flow through the cells
perpendicularly. The cells were able to condense at the hole within the PDMS slice.
Figure 18: Schematic illustration (cross section) of the porous membrane-based electrical stimulation device (Hirokazu et. al., 2010)
An amplitude of 4 mA for a duration of 20 ms and frequency of 1 Hz comprised the current
pulses that were induced between the ring electrodes. An isolator unit or DC source was always
coupled with the electronic stimulator. Before stimulation occurred, the device was filled with the
following solutions: DMEM containing calf serum, MEM amino acids solution, MEM non-essential amino
acid solution, penicillin, and streptomycin. This solution composition sought to mimic the electrolytic
composition of the tissue culture media and be conductive.
Results indicated that myotubes began to contract as the electrical stimulation was applied.
Both the magnitude of contraction and quantity of stimuli-responding cells increased as well in
comparison to the control. Increased contraction and number of responding cells increased due to the
close resemblance of atelocollagen to actual muscle tissue stiffness. Passing the electrical stimulation
through the PDMS increased the number of myotubes that contracted in comparison to the control
(Hirokazu et. al., 2010). Increasing the number of myotubes improves contractibility and tissue strength.
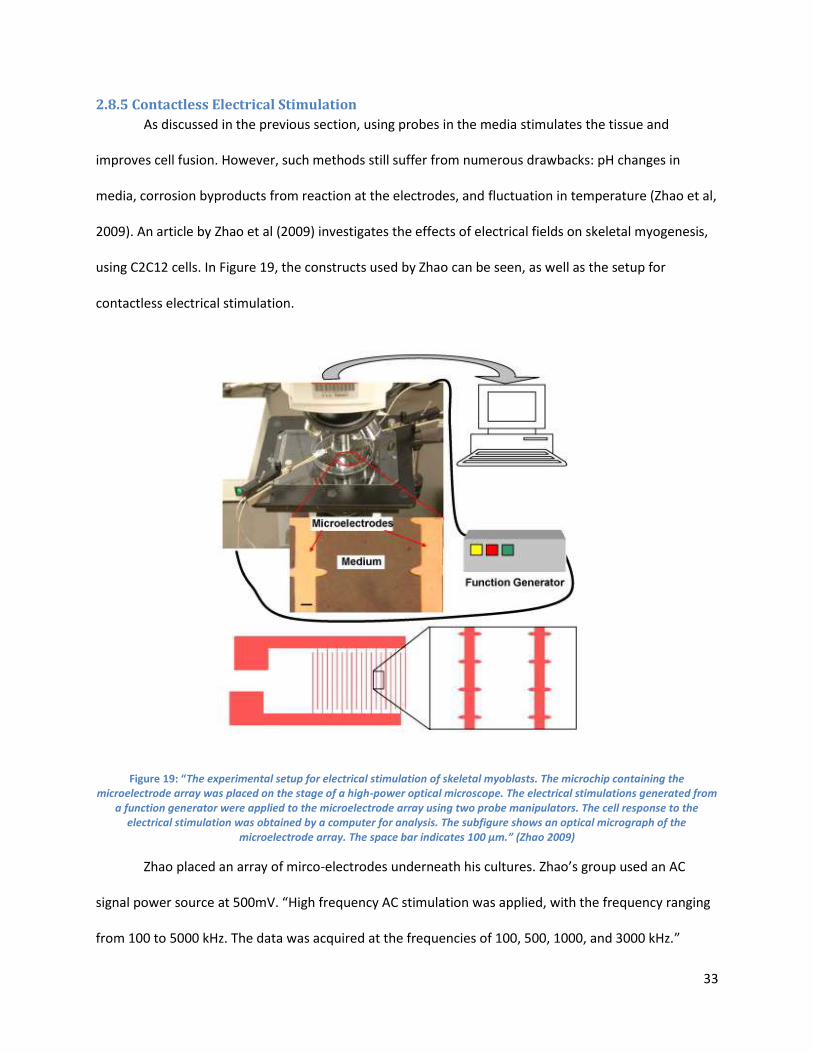
33
2.8.5 Contactless Electrical Stimulation
As discussed in the previous section, using probes in the media stimulates the tissue and
improves cell fusion. However, such methods still suffer from numerous drawbacks: pH changes in
media, corrosion byproducts from reaction at the electrodes, and fluctuation in temperature (Zhao et al,
2009). An article by Zhao et al (2009) investigates the effects of electrical fields on skeletal myogenesis,
using C2C12 cells. In Figure 19, the constructs used by Zhao can be seen, as well as the setup for
contactless electrical stimulation.
Figure 19: “The experimental setup for electrical stimulation of skeletal myoblasts. The microchip containing the microelectrode array was placed on the stage of a high-power optical microscope. The electrical stimulations generated from
a function generator were applied to the microelectrode array using two probe manipulators. The cell response to the electrical stimulation was obtained by a computer for analysis. The subfigure shows an optical micrograph of the
microelectrode array. The space bar indicates 100 μm.” (Zhao 2009)
Zhao placed an array of mirco-electrodes underneath his cultures. Zhao’s group used an AC
signal power source at 500mV. “High frequency AC stimulation was applied, with the frequency ranging
from 100 to 5000 kHz. The data was acquired at the frequencies of 100, 500, 1000, and 3000 kHz.”
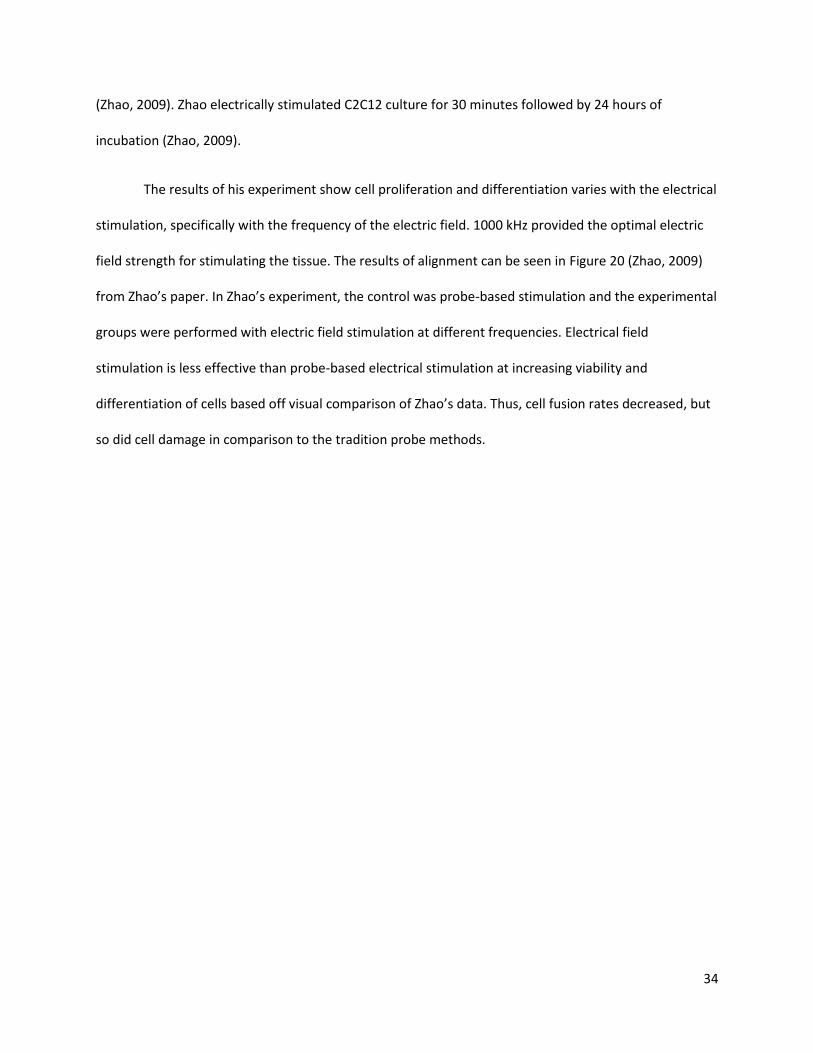
34
(Zhao, 2009). Zhao electrically stimulated C2C12 culture for 30 minutes followed by 24 hours of
incubation (Zhao, 2009).
The results of his experiment show cell proliferation and differentiation varies with the electrical
stimulation, specifically with the frequency of the electric field. 1000 kHz provided the optimal electric
field strength for stimulating the tissue. The results of alignment can be seen in Figure 20 (Zhao, 2009)
from Zhao’s paper. In Zhao’s experiment, the control was probe-based stimulation and the experimental
groups were performed with electric field stimulation at different frequencies. Electrical field
stimulation is less effective than probe-based electrical stimulation at increasing viability and
differentiation of cells based off visual comparison of Zhao’s data. Thus, cell fusion rates decreased, but
so did cell damage in comparison to the tradition probe methods.
35
Figure 20: “After 4 days electrical stimulation, the frequency-dependent cell differentiation was observed. The cells with low-frequency electrical stimulation (100 and 500 kHz) exhibited a fairly low level of differentiation. The cells with 1000 kHz
electrical stimulation exhibited extensive cell fusion, with a large number of long and thick myotubes formed. With 3000 kHz electrical stimulation, many myoblasts remained undifferentiated even with close contacts. The images are between the
opposing electrodes which were positioned on the right and left of the images, as shown in the control group. The spacebars denote 100 μm”. 1000kHz provided the best results for muscle proliferation (Zhao 2009).
Both mechanical and electrical stimulation lead to increased fiber alignment, higher fiber
density, and more accurate representations of in vivo tissue in comparison to non-stimulated tissue.
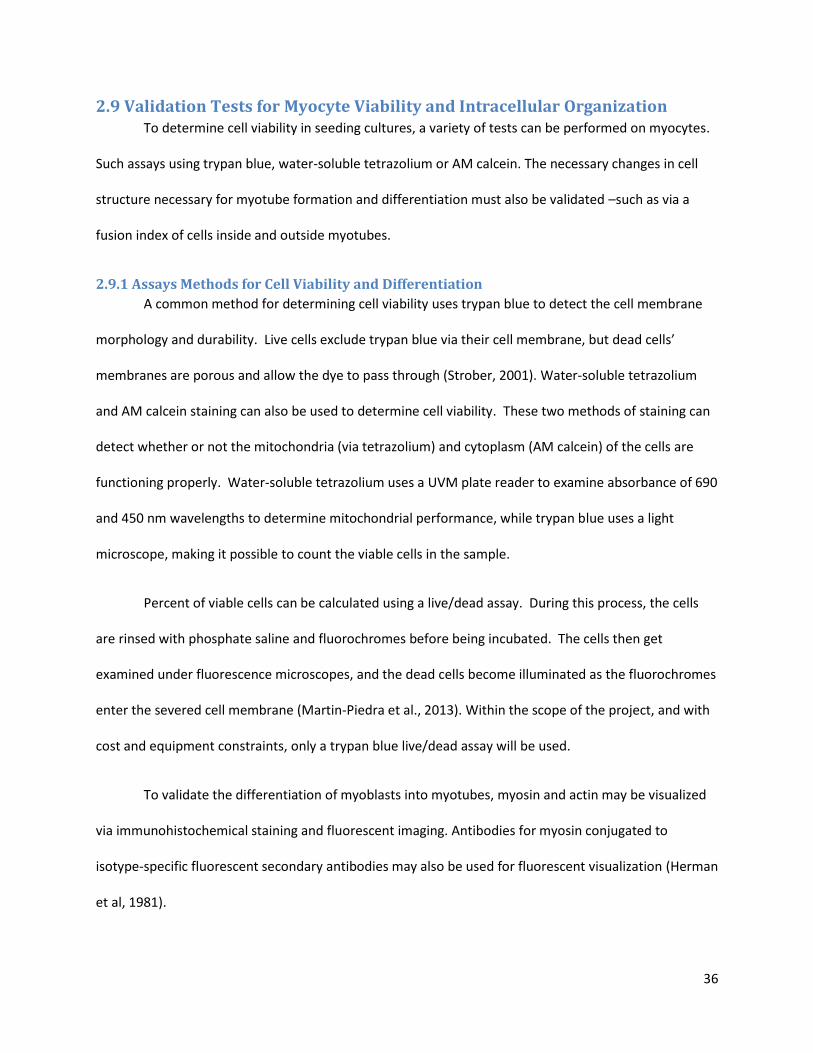
36
2.9 Validation Tests for Myocyte Viability and Intracellular Organization To determine cell viability in seeding cultures, a variety of tests can be performed on myocytes.
Such assays using trypan blue, water-soluble tetrazolium or AM calcein. The necessary changes in cell
structure necessary for myotube formation and differentiation must also be validated –such as via a
fusion index of cells inside and outside myotubes.
2.9.1 Assays Methods for Cell Viability and Differentiation
A common method for determining cell viability uses trypan blue to detect the cell membrane
morphology and durability. Live cells exclude trypan blue via their cell membrane, but dead cells’
membranes are porous and allow the dye to pass through (Strober, 2001). Water-soluble tetrazolium
and AM calcein staining can also be used to determine cell viability. These two methods of staining can
detect whether or not the mitochondria (via tetrazolium) and cytoplasm (AM calcein) of the cells are
functioning properly. Water-soluble tetrazolium uses a UVM plate reader to examine absorbance of 690
and 450 nm wavelengths to determine mitochondrial performance, while trypan blue uses a light
microscope, making it possible to count the viable cells in the sample.
Percent of viable cells can be calculated using a live/dead assay. During this process, the cells
are rinsed with phosphate saline and fluorochromes before being incubated. The cells then get
examined under fluorescence microscopes, and the dead cells become illuminated as the fluorochromes
enter the severed cell membrane (Martin-Piedra et al., 2013). Within the scope of the project, and with
cost and equipment constraints, only a trypan blue live/dead assay will be used.
To validate the differentiation of myoblasts into myotubes, myosin and actin may be visualized
via immunohistochemical staining and fluorescent imaging. Antibodies for myosin conjugated to
isotype-specific fluorescent secondary antibodies may also be used for fluorescent visualization (Herman
et al, 1981).
37
2.10 Existing Patents for Tissue Mechanical/Electrical Stimulation Devices There are several existing patents on devices used to grow and stimulate muscle tissue. Listed
below are some examples of the variety of devices currently being used in laboratory settings for use of
conditioning tissue engineered muscle.
2.10.1 Herman Vandenburgh: Tissue Stretch via Substrate Expansion
Herman Vandenburgh has one of the earliest patented devices, established in 1992, used for
growth of tissue specimens. His patent protects apparati designed for growing tissue specimens in vitro
including the following: an expandable membrane/scaffold to embed cells within for growth into tissue,
a device designed to expand a scaffold with embedded tissue specimen, and a controller to regulate the
expanding device. The expanding device allows for stimulation of the cells to mimic in vivo conditions,
consisting of positive and negative strains applicable (Vandenburgh, 1992).
Figure 21: Top figure is a sectional view of well assembly containing tissue specimens. Bottom figure is a graph of common pattern applied by device.
Figure 21 displays an illustration of the well assembly of Vandenburgh’s device containing tissue
specimens, as well as the typical pattern of stimulation onto the tissue specimen. Tissue specimens (76)
38
within the well structures (12) are stimulated via blunt pins (66) that extend upwardly from the main
plate through the holes (18) into the well membrane (20) and gasket (22). The upper plate (24) provides
support for the wells (13) and is held in place by nuts (60). Biocompatible rings (30) are placed on the
inner support surfaces (32) that allow for cell attachment (Vandenburgh, 1992). The mechanisms and
results of this device are discussed more thoroughly in section 2.8.1.
2.10.2 Milica Radisic: Perfusion Electric Stimulation
Milica Radisic, in association with MIT, was issued a patent for a biomimetic electrical
stimulation upon tissue during cultivation in vitro to improve its morphology, as well as improve
integration with the host tissue after implantation of the construct (Radisic et al, 2005). A 3D construct
was patented that consisted of forming a cell-seeded construct from a cell-gel suspension containing
mammalian cells, a cell-seeded construct exposed to an alternating flow perfusion, providing the
construct with nutrients, cultivating the construct under direct medium perfusion through which
nutrients flow through the construct to generate a uniform cell density from 100 microns to 5mm, and
stimulating the construct to an electrical stimulation to create a 3D cell structure similar to cells in vivo.
Muscle cells that exhibit electrical excitation and are exposed to electrical stimulation in vivo may use
this method for regenerating tissue. An example of the electrical stimulation setup is shown in Figure
22. Advantages of this system include its ability to provide tissue with a uniform cell density, making it
easier to distribute nutrients evenly to all cells; the ability of the system to sustain electrical stimulation
mimicking tetanic contractions in vivo; and its shown improvement of integration with host tissue
following implantation in the body. The suitability of this electrical stimulation setup to cell-in-gel tissue
culture is notable. Disadvantages include the system’s ability to only use electrical stimulation and not
mechanical stimulation and its specifications geared more to generating cardiac muscle than skeletal
muscle tissue (Radisic et al., 2005).
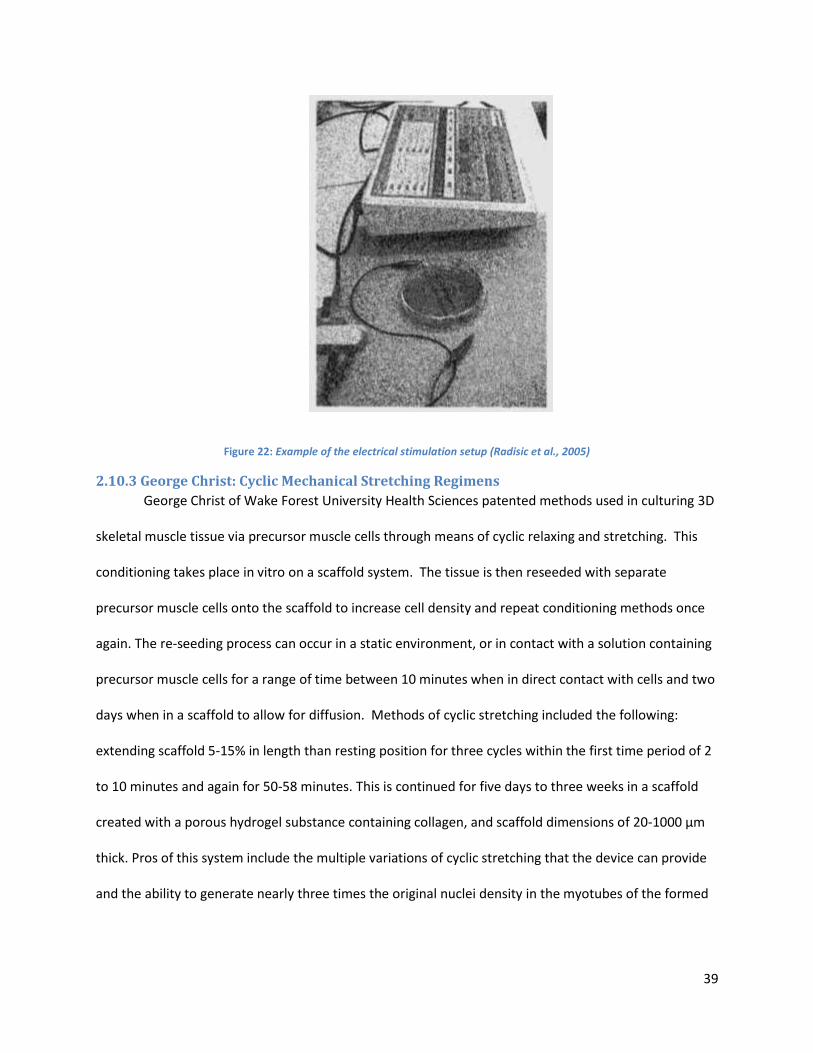
39
Figure 22: Example of the electrical stimulation setup (Radisic et al., 2005)
2.10.3 George Christ: Cyclic Mechanical Stretching Regimens
George Christ of Wake Forest University Health Sciences patented methods used in culturing 3D
skeletal muscle tissue via precursor muscle cells through means of cyclic relaxing and stretching. This
conditioning takes place in vitro on a scaffold system. The tissue is then reseeded with separate
precursor muscle cells onto the scaffold to increase cell density and repeat conditioning methods once
again. The re-seeding process can occur in a static environment, or in contact with a solution containing
precursor muscle cells for a range of time between 10 minutes when in direct contact with cells and two
days when in a scaffold to allow for diffusion. Methods of cyclic stretching included the following:
extending scaffold 5-15% in length than resting position for three cycles within the first time period of 2
to 10 minutes and again for 50-58 minutes. This is continued for five days to three weeks in a scaffold
created with a porous hydrogel substance containing collagen, and scaffold dimensions of 20-1000 µm
thick. Pros of this system include the multiple variations of cyclic stretching that the device can provide
and the ability to generate nearly three times the original nuclei density in the myotubes of the formed
40
tissue, with 800+ nuclei between protein markers of multinucleated cells (Christ et al., 2013). The
specific strain regimen used may provide a baseline for initial stimulation regimens in this project.
2.10.4 Robert Dennis: In Vivo Emulation System
Robert Dennis of the University of Michigan patented both a method and a device to emulate
the in vivo environment for stimulate muscle tissue seen in Figure 23. Stimulation can be applied via an
electrical or mechanical stimulator. The muscle tissue response to the signal generates another
stimulation signal, and represses force production of the tissue. The stimulator is able to change initial
input signals based on response signals from the muscles, allowing the testing of a wide range of
programmable regimes. The system can be used with both mechanical and electrical stimulation
occurring concurrently. Mechanical stimulation is provided by means of a force transducer, while the
electrical stimulation is provided via servomotor and electrical stimulator (Dennis et al., 2001).
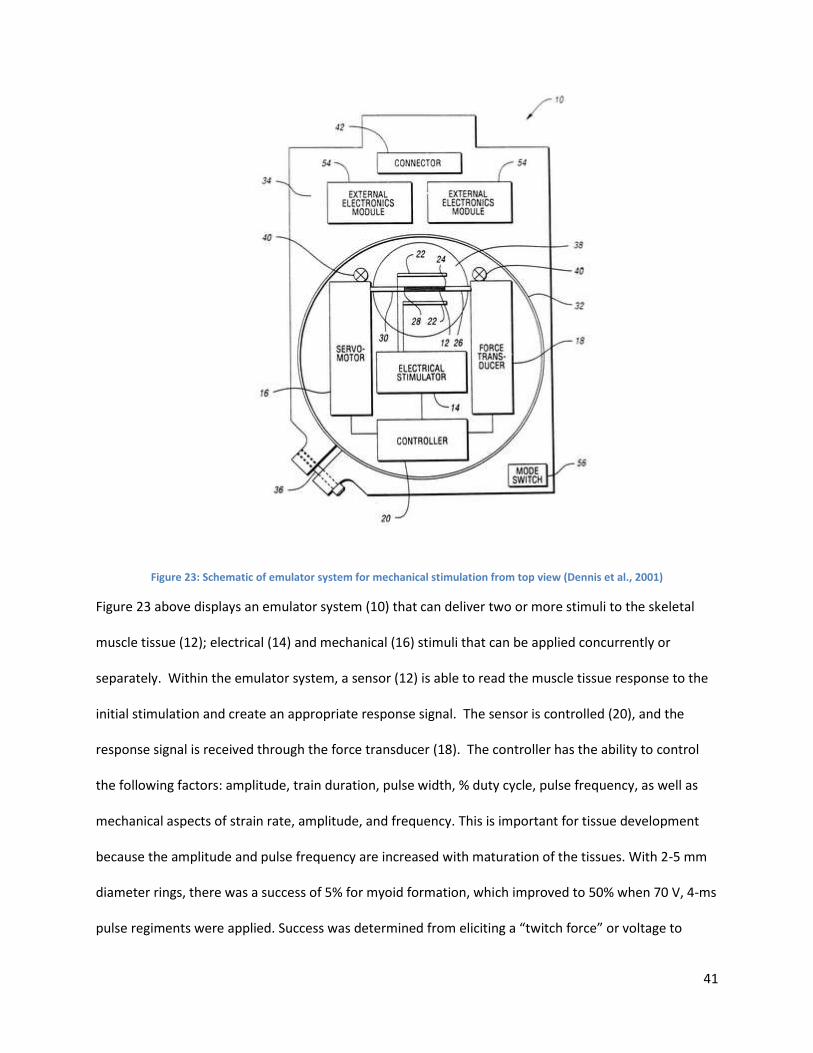
41
Figure 23: Schematic of emulator system for mechanical stimulation from top view (Dennis et al., 2001)
Figure 23 above displays an emulator system (10) that can deliver two or more stimuli to the skeletal
muscle tissue (12); electrical (14) and mechanical (16) stimuli that can be applied concurrently or
separately. Within the emulator system, a sensor (12) is able to read the muscle tissue response to the
initial stimulation and create an appropriate response signal. The sensor is controlled (20), and the
response signal is received through the force transducer (18). The controller has the ability to control
the following factors: amplitude, train duration, pulse width, % duty cycle, pulse frequency, as well as
mechanical aspects of strain rate, amplitude, and frequency. This is important for tissue development
because the amplitude and pulse frequency are increased with maturation of the tissues. With 2-5 mm
diameter rings, there was a success of 5% for myoid formation, which improved to 50% when 70 V, 4-ms
pulse regiments were applied. Success was determined from eliciting a “twitch force” or voltage to
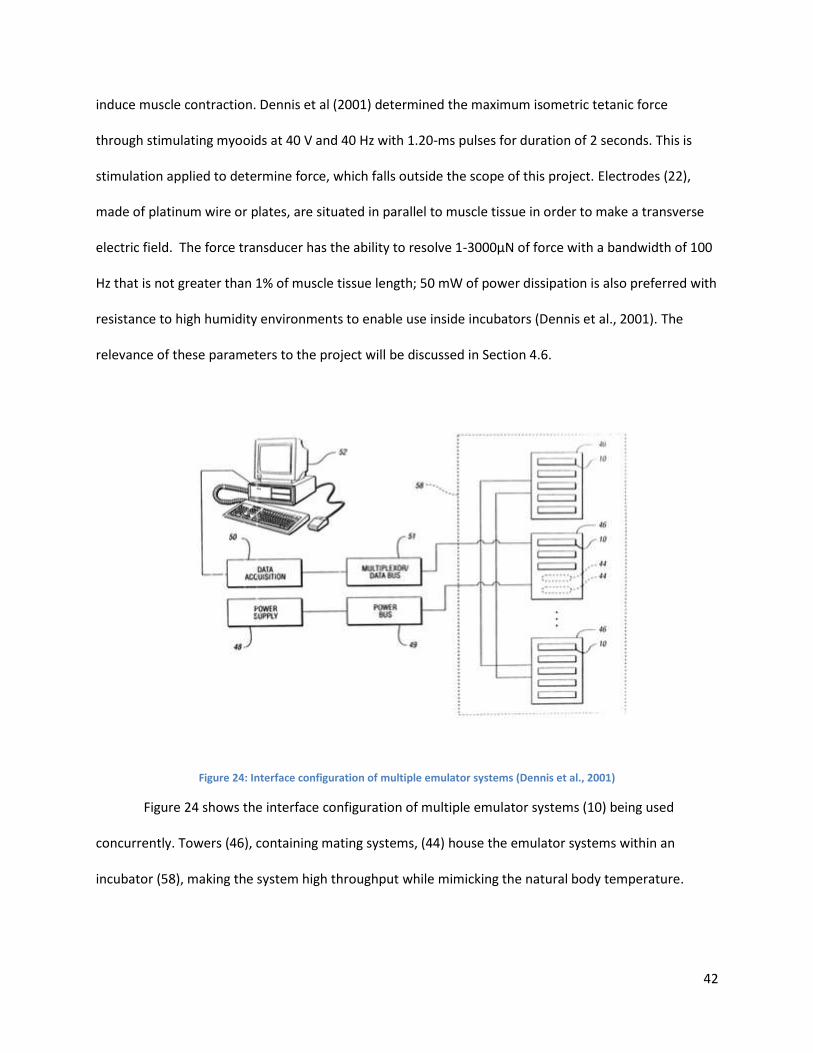
42
induce muscle contraction. Dennis et al (2001) determined the maximum isometric tetanic force
through stimulating myooids at 40 V and 40 Hz with 1.20-ms pulses for duration of 2 seconds. This is
stimulation applied to determine force, which falls outside the scope of this project. Electrodes (22),
made of platinum wire or plates, are situated in parallel to muscle tissue in order to make a transverse
electric field. The force transducer has the ability to resolve 1-3000μN of force with a bandwidth of 100
Hz that is not greater than 1% of muscle tissue length; 50 mW of power dissipation is also preferred with
resistance to high humidity environments to enable use inside incubators (Dennis et al., 2001). The
relevance of these parameters to the project will be discussed in Section 4.6.
Figure 24: Interface configuration of multiple emulator systems (Dennis et al., 2001)
Figure 24 shows the interface configuration of multiple emulator systems (10) being used
concurrently. Towers (46), containing mating systems, (44) house the emulator systems within an
incubator (58), making the system high throughput while mimicking the natural body temperature.
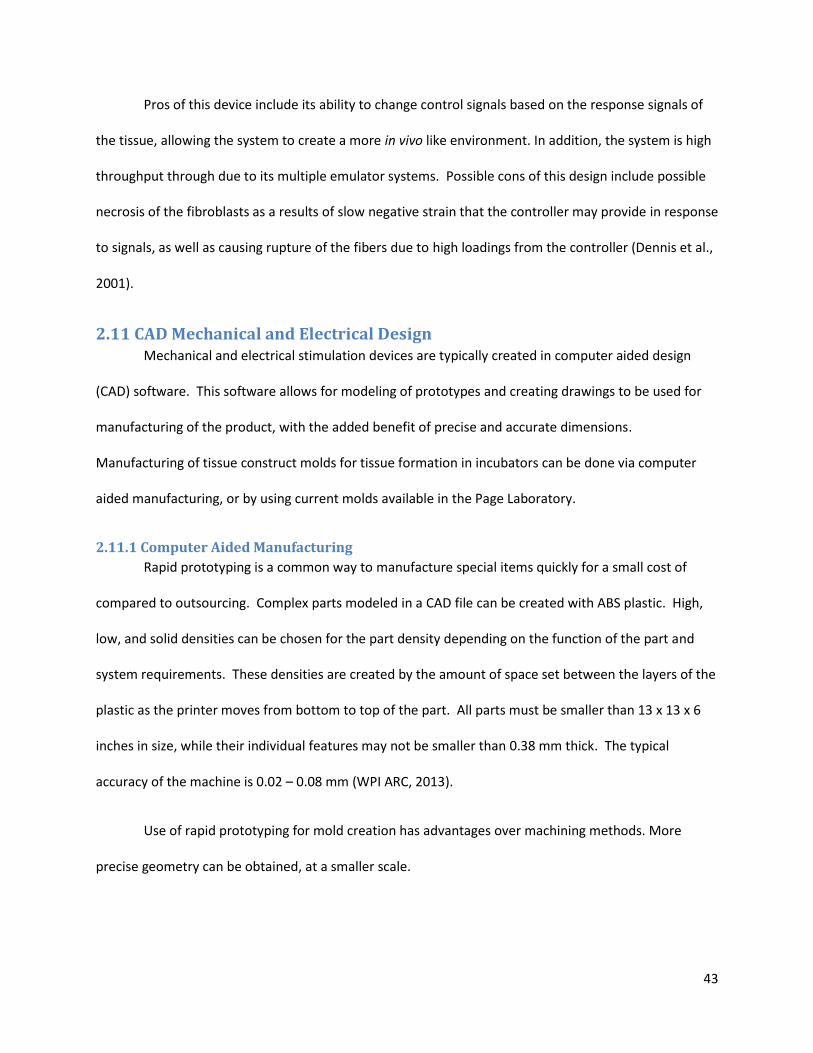
43
Pros of this device include its ability to change control signals based on the response signals of
the tissue, allowing the system to create a more in vivo like environment. In addition, the system is high
throughput through due to its multiple emulator systems. Possible cons of this design include possible
necrosis of the fibroblasts as a results of slow negative strain that the controller may provide in response
to signals, as well as causing rupture of the fibers due to high loadings from the controller (Dennis et al.,
2001).
2.11 CAD Mechanical and Electrical Design Mechanical and electrical stimulation devices are typically created in computer aided design
(CAD) software. This software allows for modeling of prototypes and creating drawings to be used for
manufacturing of the product, with the added benefit of precise and accurate dimensions.
Manufacturing of tissue construct molds for tissue formation in incubators can be done via computer
aided manufacturing, or by using current molds available in the Page Laboratory.
2.11.1 Computer Aided Manufacturing
Rapid prototyping is a common way to manufacture special items quickly for a small cost of
compared to outsourcing. Complex parts modeled in a CAD file can be created with ABS plastic. High,
low, and solid densities can be chosen for the part density depending on the function of the part and
system requirements. These densities are created by the amount of space set between the layers of the
plastic as the printer moves from bottom to top of the part. All parts must be smaller than 13 x 13 x 6
inches in size, while their individual features may not be smaller than 0.38 mm thick. The typical
accuracy of the machine is 0.02 – 0.08 mm (WPI ARC, 2013).
Use of rapid prototyping for mold creation has advantages over machining methods. More
precise geometry can be obtained, at a smaller scale.
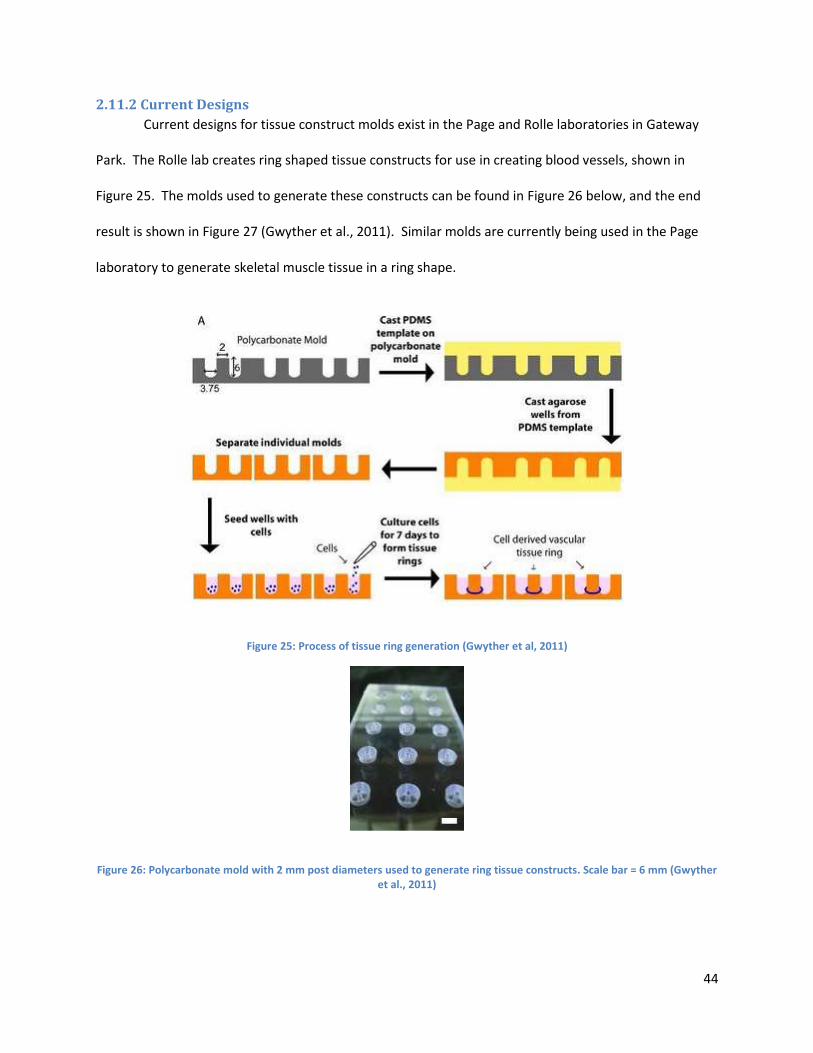
44
2.11.2 Current Designs
Current designs for tissue construct molds exist in the Page and Rolle laboratories in Gateway
Park. The Rolle lab creates ring shaped tissue constructs for use in creating blood vessels, shown in
Figure 25. The molds used to generate these constructs can be found in Figure 26 below, and the end
result is shown in Figure 27 (Gwyther et al., 2011). Similar molds are currently being used in the Page
laboratory to generate skeletal muscle tissue in a ring shape.
Figure 25: Process of tissue ring generation (Gwyther et al, 2011)
Figure 26: Polycarbonate mold with 2 mm post diameters used to generate ring tissue constructs. Scale bar = 6 mm (Gwyther et al., 2011)
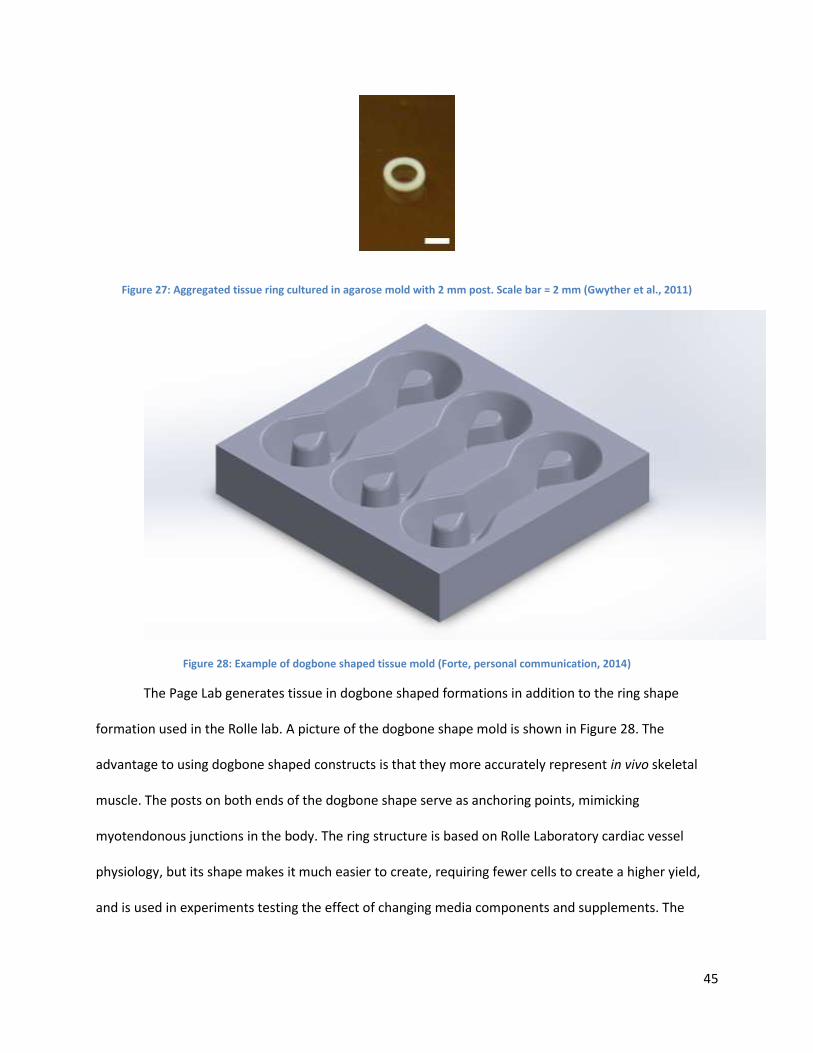
45
Figure 27: Aggregated tissue ring cultured in agarose mold with 2 mm post. Scale bar = 2 mm (Gwyther et al., 2011)
Figure 28: Example of dogbone shaped tissue mold (Forte, personal communication, 2014)
The Page Lab generates tissue in dogbone shaped formations in addition to the ring shape
formation used in the Rolle lab. A picture of the dogbone shape mold is shown in Figure 28. The
advantage to using dogbone shaped constructs is that they more accurately represent in vivo skeletal
muscle. The posts on both ends of the dogbone shape serve as anchoring points, mimicking
myotendonous junctions in the body. The ring structure is based on Rolle Laboratory cardiac vessel
physiology, but its shape makes it much easier to create, requiring fewer cells to create a higher yield,
and is used in experiments testing the effect of changing media components and supplements. The
46
dogbone constructs are used in mechanical testing, but are more fragile and more likely to self-rupture
from stress transitioning from the post to the uniaxial section.
2.12 Project Issues/Limitations There are many issues regarding the current processes, stated in the in vitro Mechanical
Stimulation and Electrical Stimulation section above, that do not promote optimal skeletal muscle tissue
formation similar to that of in vivo tissue. These limitations include small fiber diameter, low cell
density, and low vascularization of tissue, and will be discussed later in this section. All of these
limitations inhibit the tissue’s ability to mature and generate native levels of force/unit area to be
considered an accurate model adult skeletal muscle tissue.
2.12.1 Fiber Diameter
Lack of native-sized fiber diameters is one limitation to current methods of stimulation. The
literature shows the in vivo myofiber diameter ranges between 10-100 μm and the ideal fiber length is
4-6 mm (Bian et al., 2008). The mechanical characteristics of these size constructs are: 10-15% natural
strain without rupture (~3.5 μm at an initial 23.3 μm), and passive, static stress of 15.6 ± 5.4 KPa
(Powell et al., 2002). Many current methods also require that tissue constructs be removed from their
incubators for conditioning. This temperature change may limit the cell growth due to drastic changes
in its environment from body temperature to room temperature (Powell et al., 2002). The smaller
diameter of the models uses less cells in the construct seeding process thereby reducing the amount
necessary for seeding and increasing the output.
2.12.2 Cell Density
Another limitation to current methods includes tissues that are too thick and do not have
vascularization/innervation. Similar issues arise with cells/unit area in attempts to layer skeletal muscle
myoblasts within collagen matrices; however, the common result is necrotic tissue formation in the
47
middle of the constructs. This is due to the inability to incorporate vascularization/innervation to deliver
oxygen and nutrients the cells need to form contractile muscle tissue found in normal adults (Bian et al.,
2008). In order to avoid this lack of nutrition, there have been attempts to vascularize the 3D construct
to deliver the needed materials (Powell et al., 2002).
2.12.3 Vascularization of Constructs
Currently, there are limited means of embedding a vascular network within an in vitro 3D
skeletal muscle tissue construct. A few methods have been able to achieve creation of endothelial
networks within a C2C12 culture, which provided a means of blood perfusion and rapid vascularization
within the tissue after implantation. For larger in vitro tissue constructs, and tissues more
representative of in vivo tissue, tissues need to be cultured with a system that develops a blood vessel
network in a final tissue. The addition of endothelial cells and vascular endothelial growth factor, for
instance, would be a further direction to this particular project—which only focuses on a seeding culture
comprised of myoblasts and possible fibroblasts. Vascularization techniques would result in denser in
vitro tissues for testing and a better model of in vivo tissue (Bian et al., 2008).
This section presented a background examining clinical significance, muscle and myoblast
physiology, current methods for creating stimulation, and limitations of these methods. These findings
will drive the design process, as plans to address and improve upon the limitations of current simulation
systems to incorporate what has been learned from researching the physiology behind myoblasts and
the creation of tissue constructs.
Chapter 3: Methodology
3.1 Initial Client Statement At the beginning of the project, the team was presented with the following client statement:
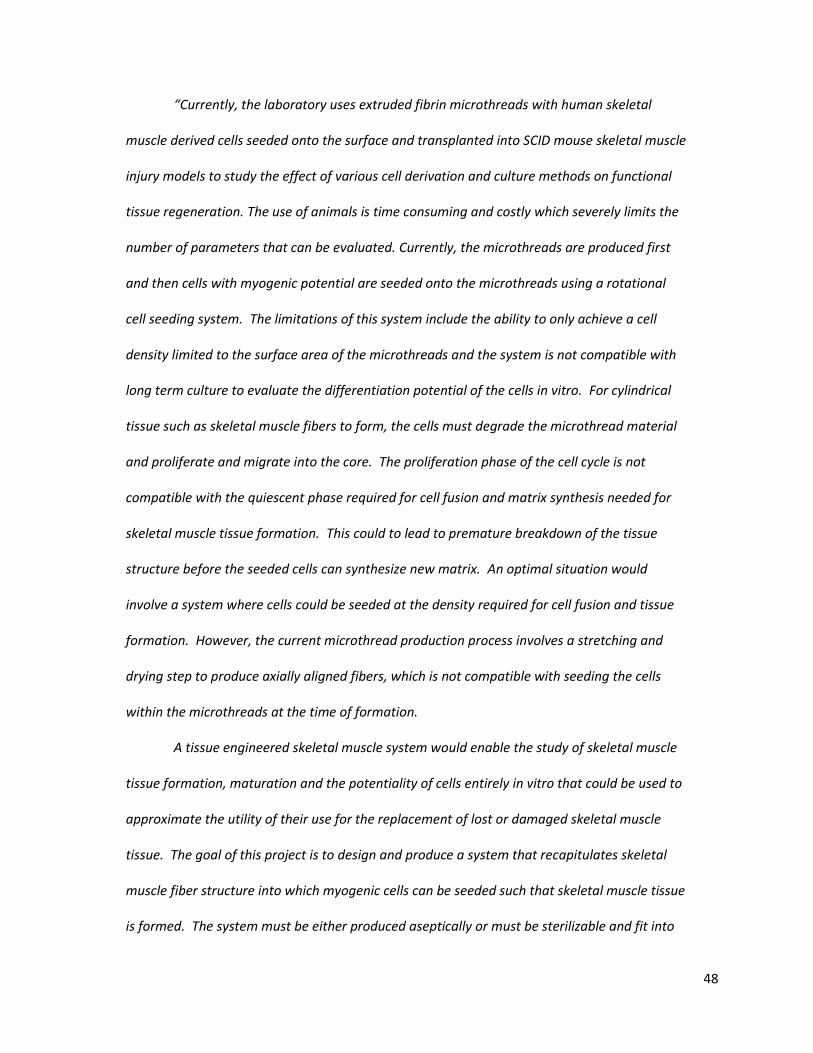
48
“Currently, the laboratory uses extruded fibrin microthreads with human skeletal
muscle derived cells seeded onto the surface and transplanted into SCID mouse skeletal muscle
injury models to study the effect of various cell derivation and culture methods on functional
tissue regeneration. The use of animals is time consuming and costly which severely limits the
number of parameters that can be evaluated. Currently, the microthreads are produced first
and then cells with myogenic potential are seeded onto the microthreads using a rotational
cell seeding system. The limitations of this system include the ability to only achieve a cell
density limited to the surface area of the microthreads and the system is not compatible with
long term culture to evaluate the differentiation potential of the cells in vitro. For cylindrical
tissue such as skeletal muscle fibers to form, the cells must degrade the microthread material
and proliferate and migrate into the core. The proliferation phase of the cell cycle is not
compatible with the quiescent phase required for cell fusion and matrix synthesis needed for
skeletal muscle tissue formation. This could to lead to premature breakdown of the tissue
structure before the seeded cells can synthesize new matrix. An optimal situation would
involve a system where cells could be seeded at the density required for cell fusion and tissue
formation. However, the current microthread production process involves a stretching and
drying step to produce axially aligned fibers, which is not compatible with seeding the cells
within the microthreads at the time of formation.
A tissue engineered skeletal muscle system would enable the study of skeletal muscle
tissue formation, maturation and the potentiality of cells entirely in vitro that could be used to
approximate the utility of their use for the replacement of lost or damaged skeletal muscle
tissue. The goal of this project is to design and produce a system that recapitulates skeletal
muscle fiber structure into which myogenic cells can be seeded such that skeletal muscle tissue
is formed. The system must be either produced aseptically or must be sterilizable and fit into
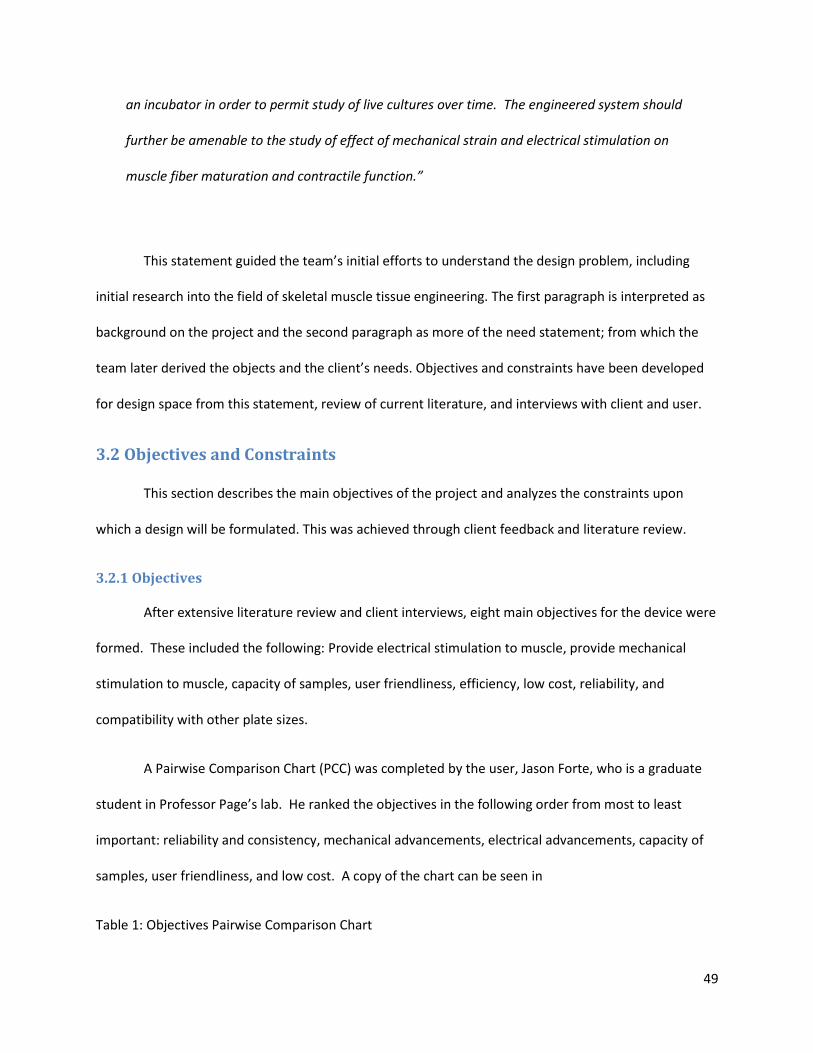
49
an incubator in order to permit study of live cultures over time. The engineered system should
further be amenable to the study of effect of mechanical strain and electrical stimulation on
muscle fiber maturation and contractile function.”
This statement guided the team’s initial efforts to understand the design problem, including
initial research into the field of skeletal muscle tissue engineering. The first paragraph is interpreted as
background on the project and the second paragraph as more of the need statement; from which the
team later derived the objects and the client’s needs. Objectives and constraints have been developed
for design space from this statement, review of current literature, and interviews with client and user.
3.2 Objectives and Constraints
This section describes the main objectives of the project and analyzes the constraints upon
which a design will be formulated. This was achieved through client feedback and literature review.
3.2.1 Objectives
After extensive literature review and client interviews, eight main objectives for the device were
formed. These included the following: Provide electrical stimulation to muscle, provide mechanical
stimulation to muscle, capacity of samples, user friendliness, efficiency, low cost, reliability, and
compatibility with other plate sizes.
A Pairwise Comparison Chart (PCC) was completed by the user, Jason Forte, who is a graduate
student in Professor Page’s lab. He ranked the objectives in the following order from most to least
important: reliability and consistency, mechanical advancements, electrical advancements, capacity of
samples, user friendliness, and low cost. A copy of the chart can be seen in
Table 1: Objectives Pairwise Comparison Chart
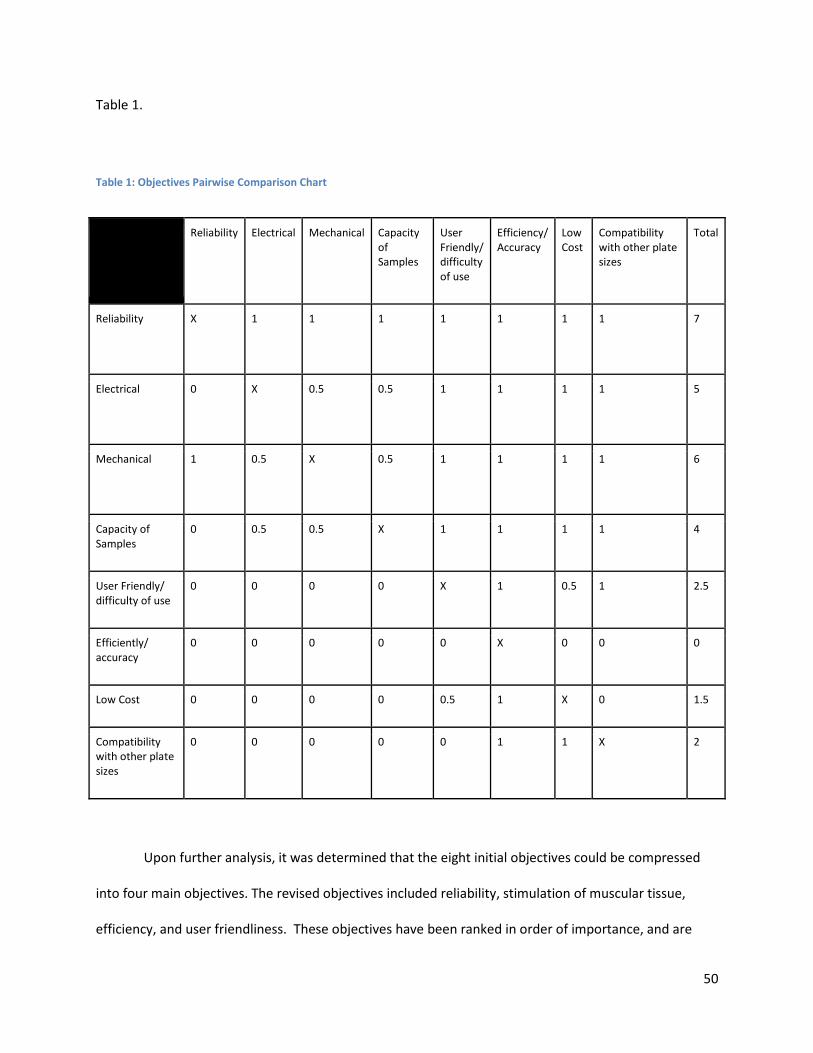
50
Table 1.
Table 1: Objectives Pairwise Comparison Chart
Reliability Electrical Mechanical Capacity of Samples
User Friendly/ difficulty of use
Efficiency/ Accuracy
Low Cost
Compatibility with other plate sizes
Total
Reliability
X 1 1 1 1 1 1 1 7
Electrical
0 X 0.5 0.5 1 1 1 1 5
Mechanical
1 0.5 X 0.5 1 1 1 1 6
Capacity of Samples
0 0.5 0.5 X 1 1 1 1 4
User Friendly/ difficulty of use
0 0 0 0 X 1 0.5 1 2.5
Efficiently/ accuracy
0 0 0 0 0 X 0 0 0
Low Cost 0 0 0 0 0.5 1 X 0 1.5
Compatibility with other plate sizes
0 0 0 0 0 1 1 X 2
Upon further analysis, it was determined that the eight initial objectives could be compressed
into four main objectives. The revised objectives included reliability, stimulation of muscular tissue,
efficiency, and user friendliness. These objectives have been ranked in order of importance, and are
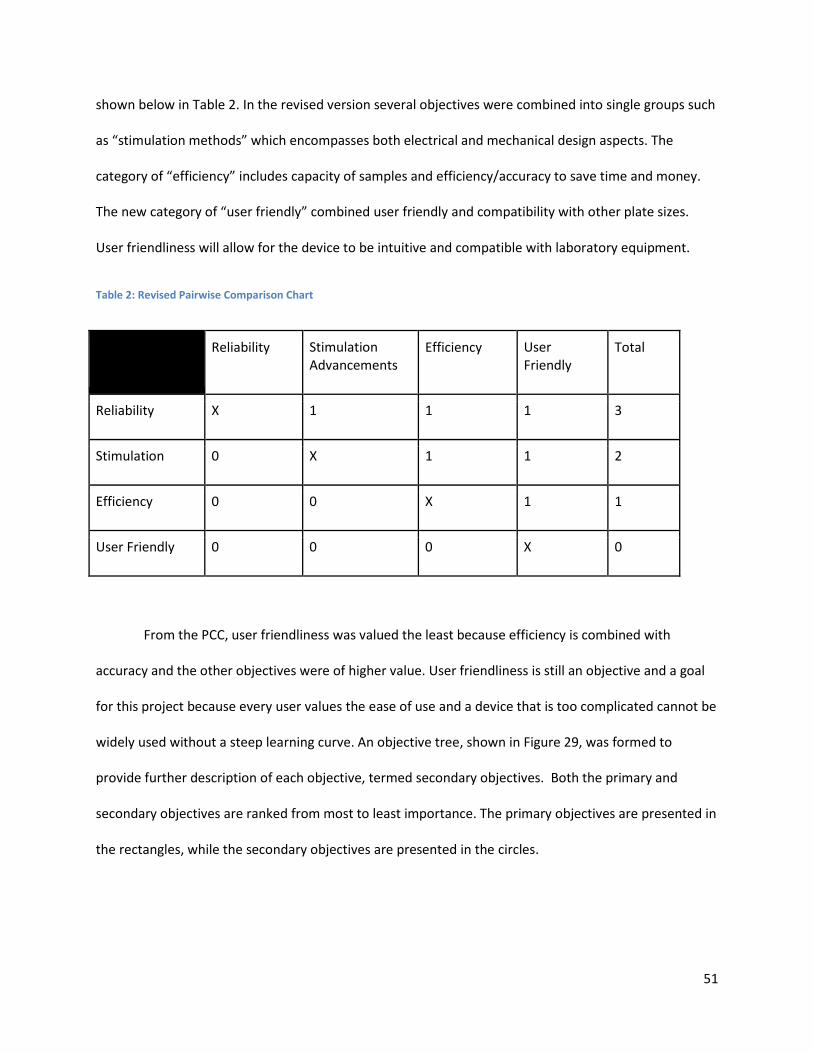
51
shown below in Table 2. In the revised version several objectives were combined into single groups such
as “stimulation methods” which encompasses both electrical and mechanical design aspects. The
category of “efficiency” includes capacity of samples and efficiency/accuracy to save time and money.
The new category of “user friendly” combined user friendly and compatibility with other plate sizes.
User friendliness will allow for the device to be intuitive and compatible with laboratory equipment.
Table 2: Revised Pairwise Comparison Chart
Reliability Stimulation Advancements
Efficiency User Friendly
Total
Reliability X 1 1 1 3
Stimulation 0 X 1 1 2
Efficiency 0 0 X 1 1
User Friendly 0 0 0 X 0
From the PCC, user friendliness was valued the least because efficiency is combined with
accuracy and the other objectives were of higher value. User friendliness is still an objective and a goal
for this project because every user values the ease of use and a device that is too complicated cannot be
widely used without a steep learning curve. An objective tree, shown in Figure 29, was formed to
provide further description of each objective, termed secondary objectives. Both the primary and
secondary objectives are ranked from most to least importance. The primary objectives are presented in
the rectangles, while the secondary objectives are presented in the circles.
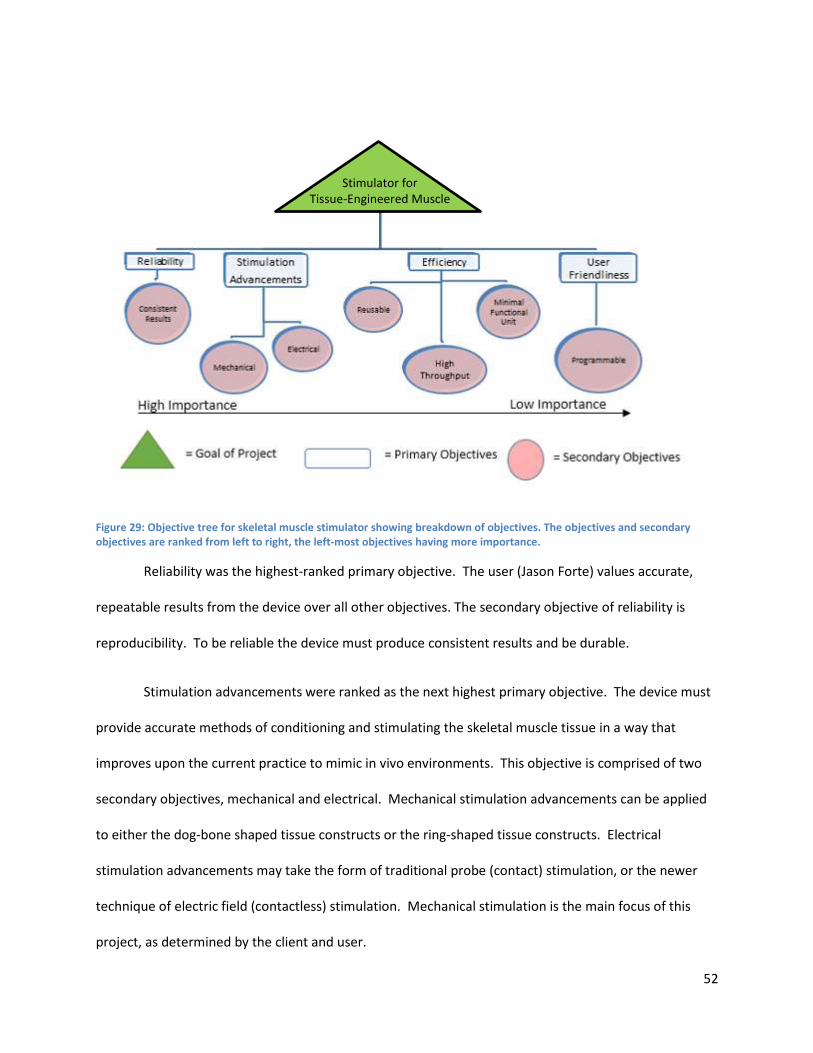
52
Figure 29: Objective tree for skeletal muscle stimulator showing breakdown of objectives. The objectives and secondary objectives are ranked from left to right, the left-most objectives having more importance.
Reliability was the highest-ranked primary objective. The user (Jason Forte) values accurate,
repeatable results from the device over all other objectives. The secondary objective of reliability is
reproducibility. To be reliable the device must produce consistent results and be durable.
Stimulation advancements were ranked as the next highest primary objective. The device must
provide accurate methods of conditioning and stimulating the skeletal muscle tissue in a way that
improves upon the current practice to mimic in vivo environments. This objective is comprised of two
secondary objectives, mechanical and electrical. Mechanical stimulation advancements can be applied
to either the dog-bone shaped tissue constructs or the ring-shaped tissue constructs. Electrical
stimulation advancements may take the form of traditional probe (contact) stimulation, or the newer
technique of electric field (contactless) stimulation. Mechanical stimulation is the main focus of this
project, as determined by the client and user.
Stimulator for
Tissue-Engineered Muscle
53
Efficiency is the third highest-ranked primary objective. The device should be reusable, capable
of high output, and require a minimum number of cells for testing (by minimizing construct size).
Minimizing the number of cells needed to create the tissue would reduce cost, minimize reagents, and
space used. Minimizing the number of cells reduces the amount of time for tissue growth prior to
stimulation. Reusability is ranked as the first secondary objective, since it would not be an efficient use
of money to buy multiple devices for the stimulation purposes. Next, generating a minimal functional
unit was ranked higher than high-throughput. Increasing the throughput for the larger scale replication
of the stimulation is less important than using a minimal number of cells to create better engineered
tissue that can function more precisely like adult skeletal muscle. To the user, it was more important to
require fewer cells per tissue construct than to have a high throughput unit.
User friendliness is ranked last among all of the objectives. It should encompass an automated
aspect of the device. If the device could condition itself, the user would not have to tend to the tissue as
often. Therefore, the secondary objective for user friendliness is programmability. This system would
ideally be programmable to run overnight and possibly over weekends to accommodate the user’s
schedule.
3.2.2 Constraints
A constraint is defined as a limitation of a factor contributing to the solution of the given
problem. Constraints serve to narrow the realm of possibilities to find an optimal solution in given
ranges, conditions, or materials. Based upon the initial client statement and research, the constraints
are as follows:
● Design and materials must be sterilizable and/or assembled in a sterile environment; avoiding
leaching/side effects of sterilization that affect cell culture.
● Design must withstand cell culture conditions (37 oC, 99% humidity, and 5% CO2)
54
● Budget consists of $156 per teammate which is $624 - $100 = $524 (for lab materials)
● Time limitation (25 weeks)
● Cell line available is the C2C12 cell line until there is proof of concept
● Cells are viable and functional only within a certain range of pH, temperature, and cell density
○ Cells can be frozen and thawed, but metabolic proteins denature around 32oC. Cells
therefore must be kept above this temperature during functional tests.
○ Optimal pH is 7.4
○ At 75-80% confluence, cells lose myogenic potential
The above constraints must be taken into consideration when creating the design for the tissue
constructs. Since the device needs to handle developing tissues, it must be sterile as to not contaminate
the cells or induce foreign body response. Thus, the device is constrained to be sterilizable. Since cells
need to be viable for testing and maturation experiments, they need to be kept at incubator conditions.
The design must withstand the temperature, atmosphere, and humidity requirements inside the
incubator. The budget restricts the expenditure and keeps the design within reasonable cost. To provide
proof of concept for the design, the project is restricted to using C2C12 cells because they grow quickly,
are readily accessible, and more easily cultured compared to human cells. However, these cells still need
to be kept under specific conditions so that their proteins do not denature. Since skeletal muscle is
anchored tissue, the constructs must be anchored to mimic bone attachment.
With these constraints in mind, a prototype will be constructed that satisfies the objectives
within the capability of the constraints.
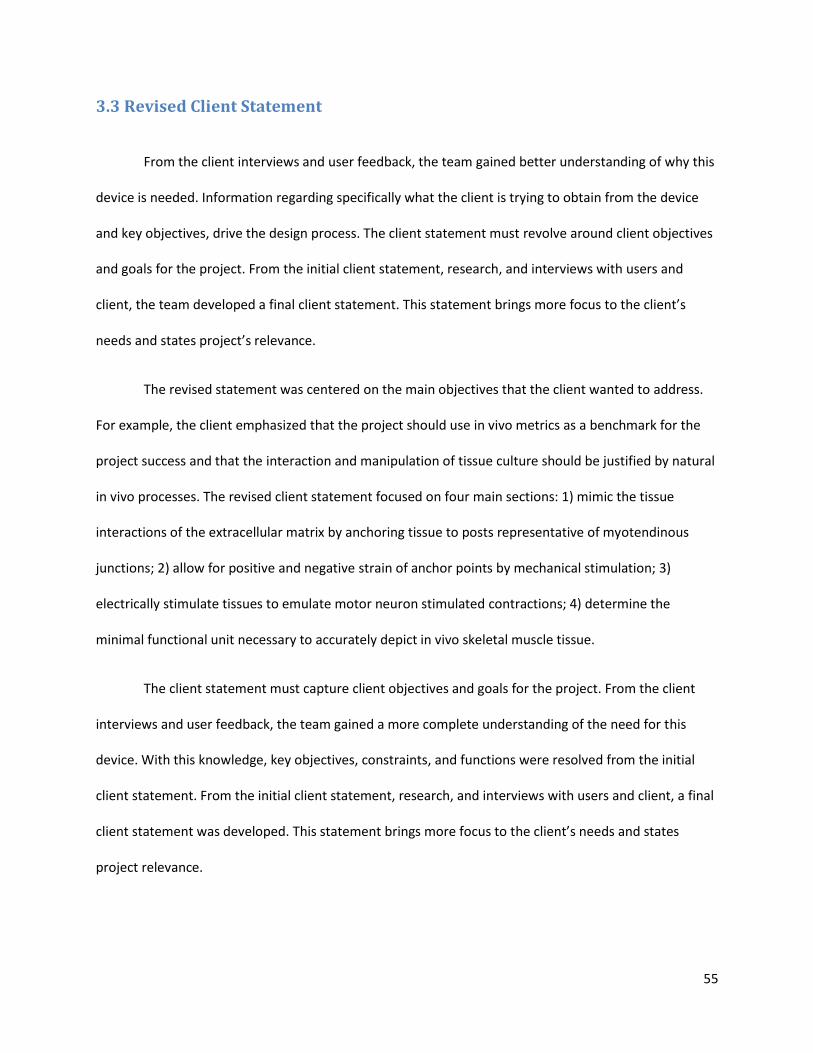
55
3.3 Revised Client Statement
From the client interviews and user feedback, the team gained better understanding of why this
device is needed. Information regarding specifically what the client is trying to obtain from the device
and key objectives, drive the design process. The client statement must revolve around client objectives
and goals for the project. From the initial client statement, research, and interviews with users and
client, the team developed a final client statement. This statement brings more focus to the client’s
needs and states project’s relevance.
The revised statement was centered on the main objectives that the client wanted to address.
For example, the client emphasized that the project should use in vivo metrics as a benchmark for the
project success and that the interaction and manipulation of tissue culture should be justified by natural
in vivo processes. The revised client statement focused on four main sections: 1) mimic the tissue
interactions of the extracellular matrix by anchoring tissue to posts representative of myotendinous
junctions; 2) allow for positive and negative strain of anchor points by mechanical stimulation; 3)
electrically stimulate tissues to emulate motor neuron stimulated contractions; 4) determine the
minimal functional unit necessary to accurately depict in vivo skeletal muscle tissue.
The client statement must capture client objectives and goals for the project. From the client
interviews and user feedback, the team gained a more complete understanding of the need for this
device. With this knowledge, key objectives, constraints, and functions were resolved from the initial
client statement. From the initial client statement, research, and interviews with users and client, a final
client statement was developed. This statement brings more focus to the client’s needs and states
project relevance.
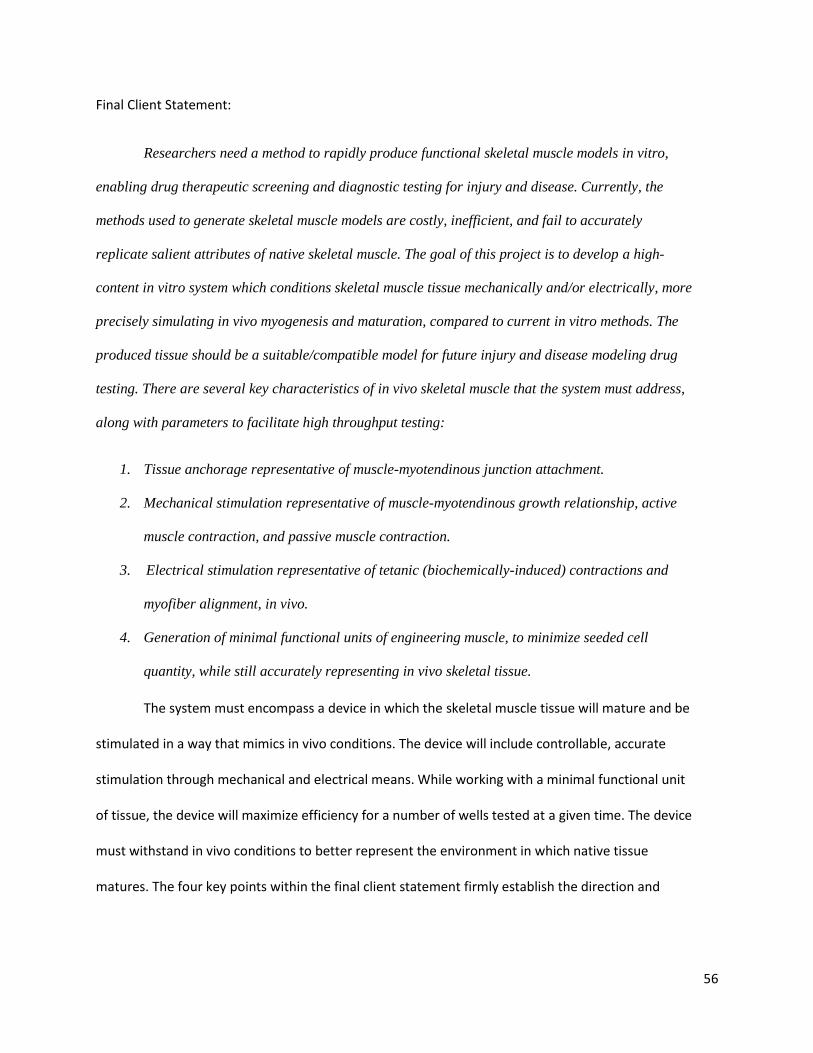
56
Final Client Statement:
Researchers need a method to rapidly produce functional skeletal muscle models in vitro,
enabling drug therapeutic screening and diagnostic testing for injury and disease. Currently, the
methods used to generate skeletal muscle models are costly, inefficient, and fail to accurately
replicate salient attributes of native skeletal muscle. The goal of this project is to develop a high-
content in vitro system which conditions skeletal muscle tissue mechanically and/or electrically, more
precisely simulating in vivo myogenesis and maturation, compared to current in vitro methods. The
produced tissue should be a suitable/compatible model for future injury and disease modeling drug
testing. There are several key characteristics of in vivo skeletal muscle that the system must address,
along with parameters to facilitate high throughput testing:
1. Tissue anchorage representative of muscle-myotendinous junction attachment.
2. Mechanical stimulation representative of muscle-myotendinous growth relationship, active
muscle contraction, and passive muscle contraction.
3. Electrical stimulation representative of tetanic (biochemically-induced) contractions and
myofiber alignment, in vivo.
4. Generation of minimal functional units of engineering muscle, to minimize seeded cell
quantity, while still accurately representing in vivo skeletal tissue.
The system must encompass a device in which the skeletal muscle tissue will mature and be
stimulated in a way that mimics in vivo conditions. The device will include controllable, accurate
stimulation through mechanical and electrical means. While working with a minimal functional unit
of tissue, the device will maximize efficiency for a number of wells tested at a given time. The device
must withstand in vivo conditions to better represent the environment in which native tissue
matures. The four key points within the final client statement firmly establish the direction and

57
areas of focus of the project. The revised client statement was the basis for a project strategy—a
means to accomplish the tasks comprising this project.
3.4 Project Approach This section outlines project approach and timeline.
3.4.1 Management Approach
For completion of the project in a timely manner, it is necessary to create a project timeline with
due dates. Division of tasks between team members also needs to occur in order to accomplish multiple
tasks concurrently. The project timeline and division of tasks is monitored through a Gantt Chart.
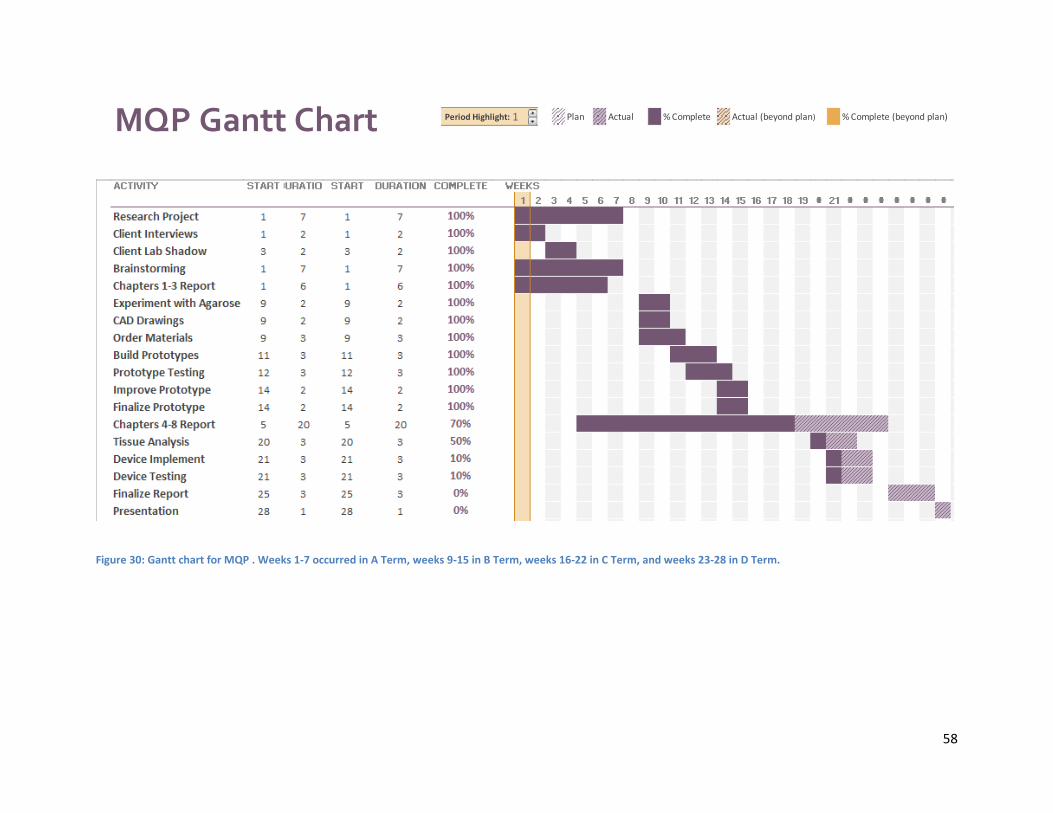
58
Figure 30: Gantt chart for MQP . Weeks 1-7 occurred in A Term, weeks 9-15 in B Term, weeks 16-22 in C Term, and weeks 23-28 in D Term.
Period Highlight: 1 Plan Actual % Complete Actual (beyond plan) % Complete (beyond plan)
PLAN PLAN ACTUAL ACTUAL PERCENT
ACTIVITY START DURATION START DURATION COMPLETE WEEKS
1 2 3 4 5 6 7 8 9 10 11 12 13 14 15 16 17 18 19 20 21 22 23 24 25 26 27 28 29 30 31 32 33 34 35 36 37 38
Research Project 1 7 1 7 100%
Client Interviews 1 2 1 2 100%
Client Lab Shadow 3 2 3 2 100%
Brainstorming 1 7 1 7 100%
Chapters 1-3 Report 1 6 1 6 100%
Experiment with Agarose 9 2 9 2 0%
CAD Drawings 9 2 9 2 0%
Order Materials 9 3 9 3 0%
Build Prototypes 11 3 11 3 0%
Prototype Testing 12 3 12 3 0%
Improve Prototype 14 2 14 2 0%
Finalize Prototype 14 2 14 2 0%
Chapters 4-8 Report 5 20 5 20 10%
Device Implement 21 3 21 3 0%
Device Testing 21 3 21 3 0%
Finalize Report 25 3 25 3 0%
Presentation 28 1 28 1 0%
MQP Gantt Chart
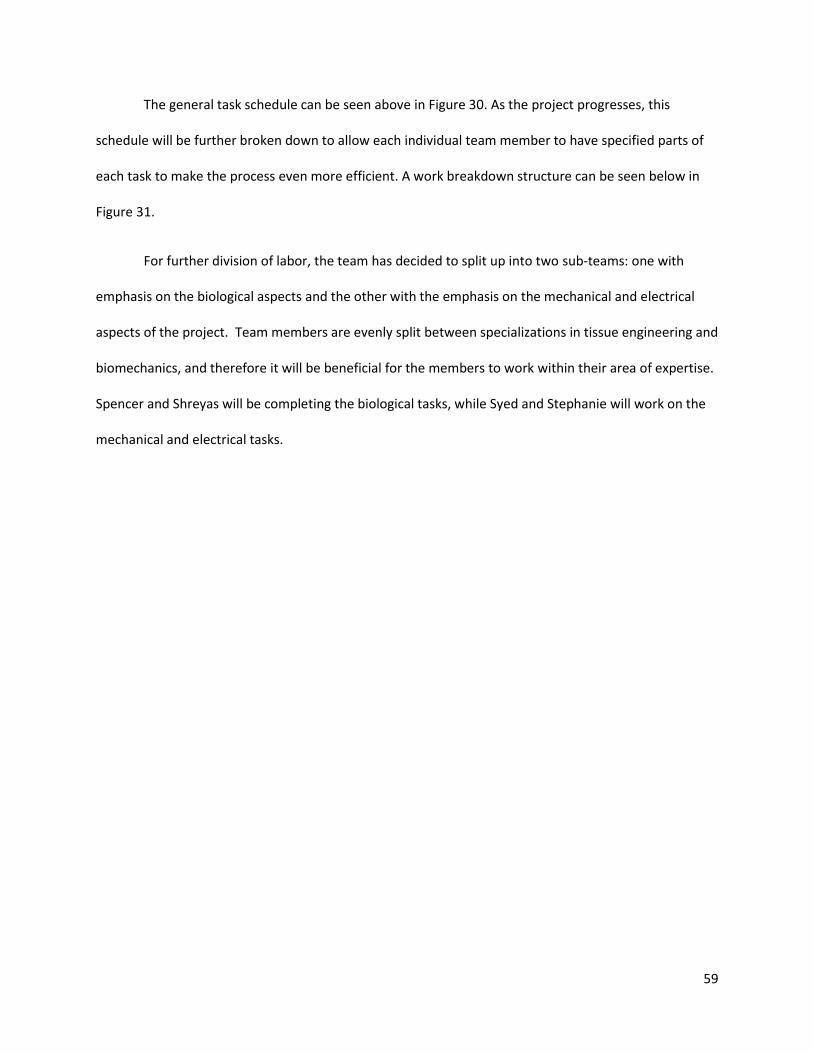
59
The general task schedule can be seen above in Figure 30. As the project progresses, this
schedule will be further broken down to allow each individual team member to have specified parts of
each task to make the process even more efficient. A work breakdown structure can be seen below in
Figure 31.
For further division of labor, the team has decided to split up into two sub-teams: one with
emphasis on the biological aspects and the other with the emphasis on the mechanical and electrical
aspects of the project. Team members are evenly split between specializations in tissue engineering and
biomechanics, and therefore it will be beneficial for the members to work within their area of expertise.
Spencer and Shreyas will be completing the biological tasks, while Syed and Stephanie will work on the
mechanical and electrical tasks.
60
Figure 31: Work Breakdown Structure of MQP displaying tasks and subtasks for the project
Stimulator for Mature In Vitro Skeletal Muscle
Tissue
Explore Procedures Involved
C2C12 Cell Culture (Spencer, Shreyas)
Experiment with removal of agarose for
stimulation
(Asaad, Shreyas)
Evaluate prior designs (All)
Develop Alternatives
Function-Means chart (Stephanie)
Compile list of feasible alternatives (Spencer,
Asaad)
Review designs with client (All)
CAD files for all designs (Stephanie, Shreyas)
Select Initial Main Design
Review with client (All)
Design Prototype / Proof of Concept (All)
Detailed Design
Build Prototype (Asaad, Stephanie)
Test Prototype (Spencer, Asaad)
Revise Prototype (All)
Validate Final Build (All)
Design Process Documentation
Draft final report (All)
Client review (All)
Final report (All--see authorship page)
Project Management
Weekly meetings (rotation basis)
Client progress reports (All)
61
Chapter 4 Alternative Designs
After iterative revisions of client statement following meetings with the users and client, the
team developed clear objectives of what the device needs to accomplish. To help move towards a final
design, the team laid out client “needs” versus “wants” listed below in the Needs Analysis section. As
the team can see there are a multitude of design concepts to perform the desired function. Focusing on
the pros and cons of each design in context to performing client needs, the team moves towards a
finalized design.
4.1 Needs Analysis From the revised client statement and discussion with the client and user, the team separated
objectives into client needs (primary objectives) and client wants (secondary objectives). Constraints of
time and budget were also considered when differentiating between needs and wants. The needs are
the team’s primary focus, and wants are desirable, but not necessary for success. The needs and wants
are listed below and heavily influence the development of alternative designs.
Needs:
1. Mechanical stimulation of skeletal muscle tissue ranging from positive 50% strain to negative
50% strain (passive contraction)
2. Tissue anchorage representative of muscle-bone attachment
3. Stimulate myogenesis and tissue maturation from C2C12 cells
4. Ability to expand design concept for high-content testing
Wants:
1. Electrical stimulation of skeletal muscle tissue to test functionality of tissue. The primary focus
of the design is on mechanical elements, which is why electrical stimulation will be addressed secondly.
62
2. Minimize the number of cells used per construct (current use is 400,000 total cells/construct,
with 3 myoblasts per fibroblast) in co-culture.
Outside of needs and wants, basic requirements for a device interacting with biological materials
include operating in a standard incubator space and incubator conditions (99% humidity and 37 degrees
C), being able to be sterilized and last, but most important, results must be reproducible.
4.2 Functions (Specifications) and Means
There are several functions that the design must have in order to satisfy the client’s wants and
needs. The device must take into account for the specifications of these functions when considering
feasibility of designs. Listed below are the five main functions with specifications needed for the project.
4.2.1 Mechanical Stimulation
The device needs to mechanical actuate in order to provide the tissue with positive and negative
strain representative of active and passive contraction found in vivo during muscle myogenesis and
maturation; this stimulation must be uniaxial. Uniaxial stimulation is more accurate of tissue
development in vivo, thus the tissue must be a linear shape (dog-bone shape). The stimulation
specifications should occur at least up to 20% positive strain and 5% negative strain at a rate of 0.5 Hz.
These specifications are justified by the current literature as previously mentioned in section 2.8.
Andersen et al 2014 performed a multitude of strain test on C2C12 cells and found optimal strains at
15% positive strain and 0.5 Hz, and to reduce the risk of tissue rupture negative 5% strain given to relax
the tissue (Andersen, 2014).
The means of mechanical stimulation can include the following: machine driven means, such as
a stepper motor driving a camshaft or scissor linkage system; fluid dynamic methods, such as a
pneumatic or hydraulic pump; or posts made of a piezoelectric or thermos-responsive “smart” material
63
that can shape modulate to allow for both positive and negative strain. The methods can be done in
patterns making them expandable to accommodate high throughput testing, 96 samples
simultaneously.
4.2.2 Electrical Stimulation
Electrical stimulation by the device provides stimulation that is representative of tetanic
contraction found naturally in the body. Specifications of electrical stimulation are dependent on the
type of stimulation technique. Means of electrical stimulation can be contact or contactless, either
through electrodes or electrical fields respectively. The ideal parameters for electrode stimulation occur
at 4mA for 20 millisecond of stimulation at 1Hz (Hirokazu et. al., 2010). These specification for electrode
stimulus not only result in a single contraction but improved magnitude of contraction and improve the
number of responding cells. Greater number of responding cells shows greater functionality of the tissue
as previously discussed in section 2.8. Optimal stimulation via contactless techniques are done using an
AC power source consisting of 500mV at a power source frequency 1000 kHz, stimulated for 30 minutes
daily with 24 hours between cycles, producing the best results for proliferation and differentiation (Zhao
et al. 2009).
4.2.3 Tissue Anchorage
Tissue anchorage is a vital aspect of the project. The 3D self-assembly of myogenic cells into
skeletal muscle tissue requires anchorage attachment points to direct the axial alignment of myofibers.
For accurate modeling of native muscle, the anchorage method should simulate de novo bone
attachment, creating uniaxial tension. Means of providing anchorage include: dog-bone, circumferential
tension (ring shaped tissue), and uniaxial (self-assembly of monolayer into cylindrical tube) .
4.2.4 Using the Minimal Functional Unit
Cell culture experiments will determine the optimal efficiency of cells seeded per construct. This
minimal functional unit will maximize efficiency of construct generation and allow for high-throughput
64
processing. The Vanderburgh group uses a gel thrombin/fibrinogen seeding method with a primary
human myoblast seeding density of 200,000 per construct. Current practice in the Page Lab uses
400,000 C2C12 myoblasts per construct. Minimizing the seeding density reduces materials and
resources needed and improves efficiency; however, past a point reducing seeding density would result
in undesirable loss in tissue functionality. Consequently, optimization testing will be conducted to
determine the least C2C12 cell seeding density required for the formation of contiguous tissue that
contracts into a dogbone shape, via active tension generated by differentiating myoblasts. C2C12
myoblasts do not differentiate as well as primary myoblasts into myotubes, and have reduced
expression of certain key components of myogenesis—notably lower expression of mRNAs that mediate
cell-cell adhesion (Grabowska et al, 2011). Compared to the Vandenburgh group’s seeding density
(using cells in gel), the optimal seeding density for the minimal functional unit would likely be higher.
Due to limited budget, time, and resources, the chosen method is using C2C12 myoblasts in an
exogenous fibrin matrix that provides an extracellular matrix for the cells.
4.2.5 Differentiation
The differentiation of C2C12 cells into functional myofibers is one of the most important
functions of this project. Media is a key design component to the design, as it influences both the
growth and differentiation of the 2D cells into 3D tissues. Serum supplements are added to basal media
to set cells to either proliferate and differentiate—typically, high serum concentrations in media
maintain cells in proliferation mode, while low serum concentration induces cells to exit the cell cycle
and enter terminal differentiation.
4.3 Conceptual Designs After clearly defining function and specifications, conceptual designs were developed. The conceptual designs are based off the group’s brainstormed means. These brainstormed means are specified in

65
Table 3. The following conceptual designs separate each function and use various means to accomplish
each individually.
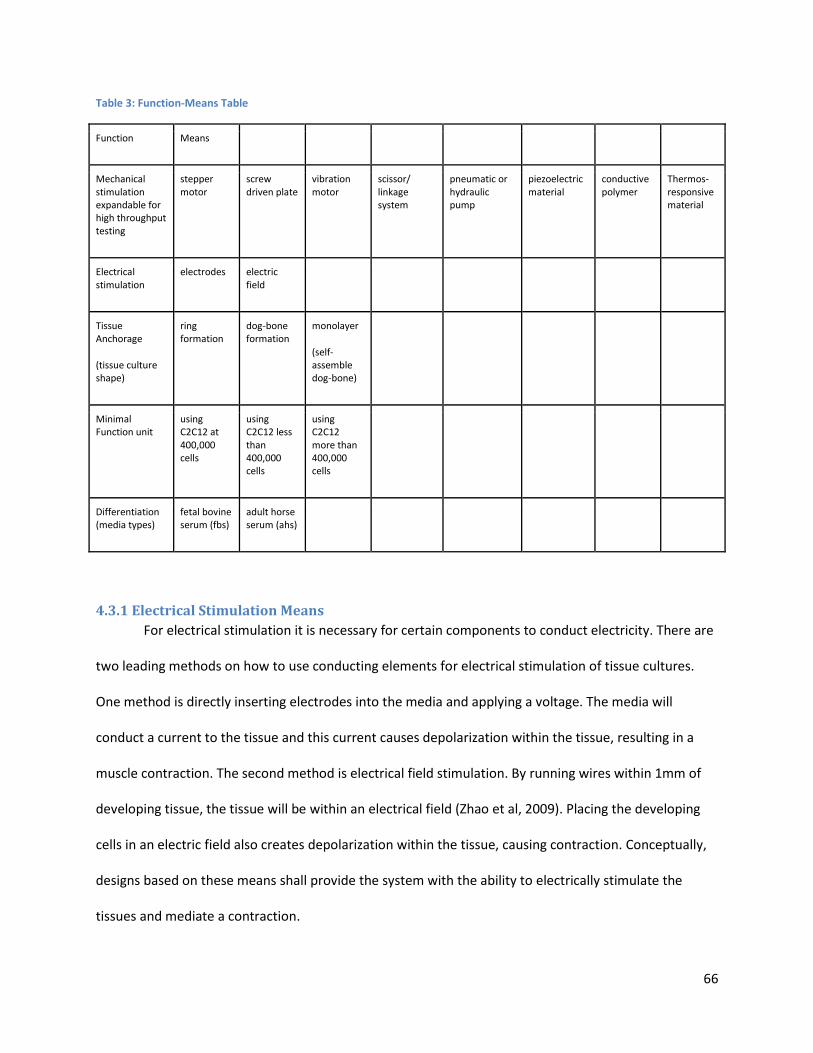
66
Table 3: Function-Means Table
Function Means
Mechanical stimulation expandable for high throughput testing
stepper motor
screw driven plate
vibration motor
scissor/ linkage system
pneumatic or hydraulic pump
piezoelectric material
conductive polymer
Thermos-responsive material
Electrical stimulation
electrodes electric field
Tissue Anchorage
(tissue culture shape)
ring formation
dog-bone formation
monolayer
(self-assemble dog-bone)
Minimal Function unit
using C2C12 at 400,000 cells
using C2C12 less than 400,000 cells
using C2C12 more than 400,000 cells
Differentiation (media types)
fetal bovine serum (fbs)
adult horse serum (ahs)
4.3.1 Electrical Stimulation Means
For electrical stimulation it is necessary for certain components to conduct electricity. There are
two leading methods on how to use conducting elements for electrical stimulation of tissue cultures.
One method is directly inserting electrodes into the media and applying a voltage. The media will
conduct a current to the tissue and this current causes depolarization within the tissue, resulting in a
muscle contraction. The second method is electrical field stimulation. By running wires within 1mm of
developing tissue, the tissue will be within an electrical field (Zhao et al, 2009). Placing the developing
cells in an electric field also creates depolarization within the tissue, causing contraction. Conceptually,
designs based on these means shall provide the system with the ability to electrically stimulate the
tissues and mediate a contraction.
67
4.3.2 Mechanical Stimulation Means
There are a multitude of means to produce linear mechanical motion. To produce -5% to 15%
strain in small tissues specimen, the design could incorporate motor and linkage systems, fluid dynamic
systems, or specialized materials.
Motor systems are the most widely used mechanical systems to generate motion. They range
from large/industrial motors to micro-scale motors, programmable for controlled use. Motor system can
be very versatile. By manipulating the torque from motors the team can provide linear motion to links.
These links can exist as sliding plates, threaded shafts, rollers and levers, and standards linkages and
joints. These links can be specialized and directly provide precise mechanical stimulation to tissue
cultures. Vibration motors can be used for small scale motion.
Fluid dynamic systems are another way to approach mechanical stimulation. The tissue cultures
have to be submersed in a media fluid to survive. By manipulating media, the device could use material
directly in contact with the tissue cultures to stimulate them. Fluid dynamic systems can also mediate
mechanical stimulation, via hydraulic or pneumatic actuators.
Biomaterials comprise a large field in biomedical engineering. Typically, materials are not used
to provide motion, but used more for their biocompatibility and as a scaffold. However, certain
materials have the ability to expand and contract at changes in temperature or changes in voltage. The
amount of force needed to strain these tissue cultures is very low, as mentioned in section 2.6. These
thin myofibers provide little to no resistance to the expanding or contracting of these materials, which
easily provide stimulation. Also, some biomaterials are bioinert and can be in direct contact with skeletal
muscle cells to provide stimulation. By culturing tissue within constructs made of these materials, strain
can be controlled through external stimuli.
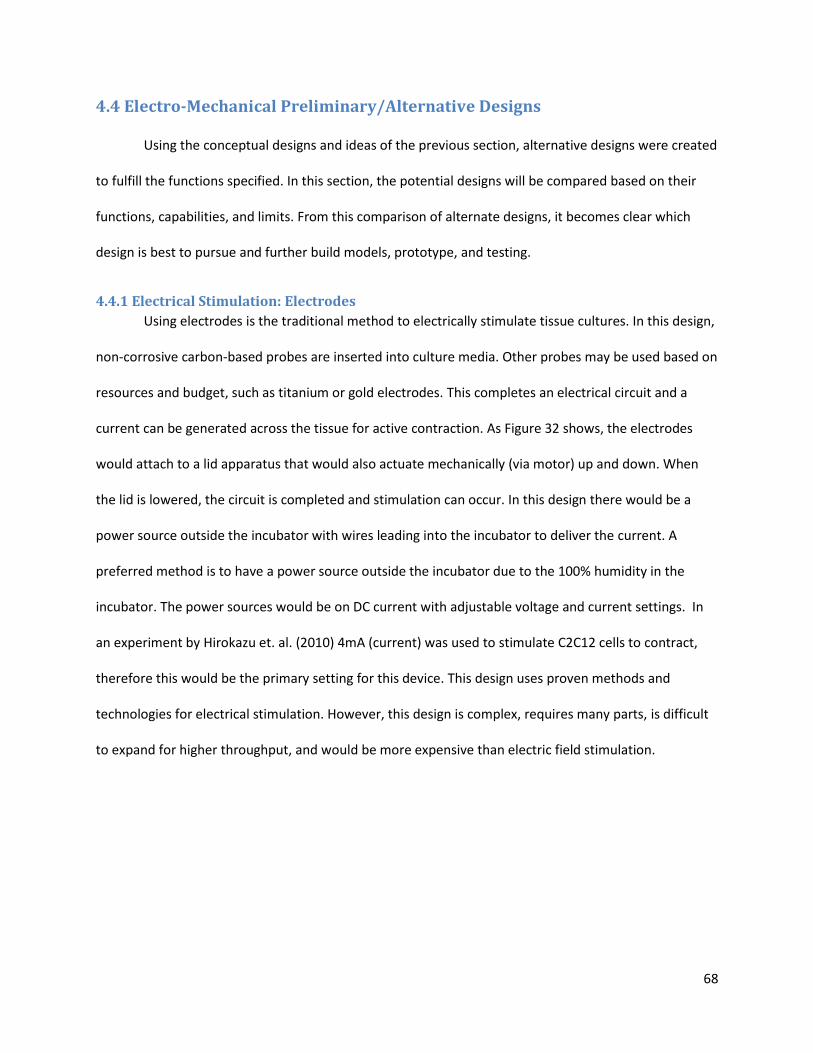
68
4.4 Electro-Mechanical Preliminary/Alternative Designs
Using the conceptual designs and ideas of the previous section, alternative designs were created
to fulfill the functions specified. In this section, the potential designs will be compared based on their
functions, capabilities, and limits. From this comparison of alternate designs, it becomes clear which
design is best to pursue and further build models, prototype, and testing.
4.4.1 Electrical Stimulation: Electrodes
Using electrodes is the traditional method to electrically stimulate tissue cultures. In this design,
non-corrosive carbon-based probes are inserted into culture media. Other probes may be used based on
resources and budget, such as titanium or gold electrodes. This completes an electrical circuit and a
current can be generated across the tissue for active contraction. As Figure 32 shows, the electrodes
would attach to a lid apparatus that would also actuate mechanically (via motor) up and down. When
the lid is lowered, the circuit is completed and stimulation can occur. In this design there would be a
power source outside the incubator with wires leading into the incubator to deliver the current. A
preferred method is to have a power source outside the incubator due to the 100% humidity in the
incubator. The power sources would be on DC current with adjustable voltage and current settings. In
an experiment by Hirokazu et. al. (2010) 4mA (current) was used to stimulate C2C12 cells to contract,
therefore this would be the primary setting for this device. This design uses proven methods and
technologies for electrical stimulation. However, this design is complex, requires many parts, is difficult
to expand for higher throughput, and would be more expensive than electric field stimulation.
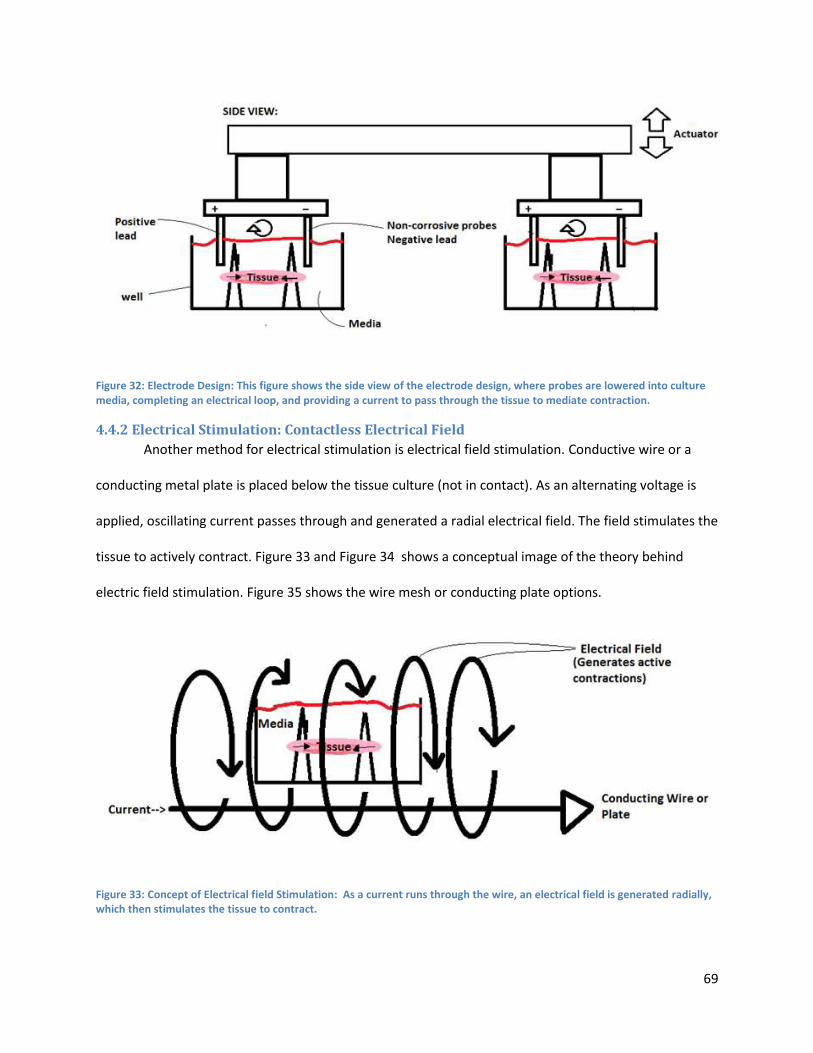
69
Figure 32: Electrode Design: This figure shows the side view of the electrode design, where probes are lowered into culture media, completing an electrical loop, and providing a current to pass through the tissue to mediate contraction.
4.4.2 Electrical Stimulation: Contactless Electrical Field
Another method for electrical stimulation is electrical field stimulation. Conductive wire or a
conducting metal plate is placed below the tissue culture (not in contact). As an alternating voltage is
applied, oscillating current passes through and generated a radial electrical field. The field stimulates the
tissue to actively contract. Figure 33 and Figure 34 shows a conceptual image of the theory behind
electric field stimulation. Figure 35 shows the wire mesh or conducting plate options.
Figure 33: Concept of Electrical field Stimulation: As a current runs through the wire, an electrical field is generated radially, which then stimulates the tissue to contract.
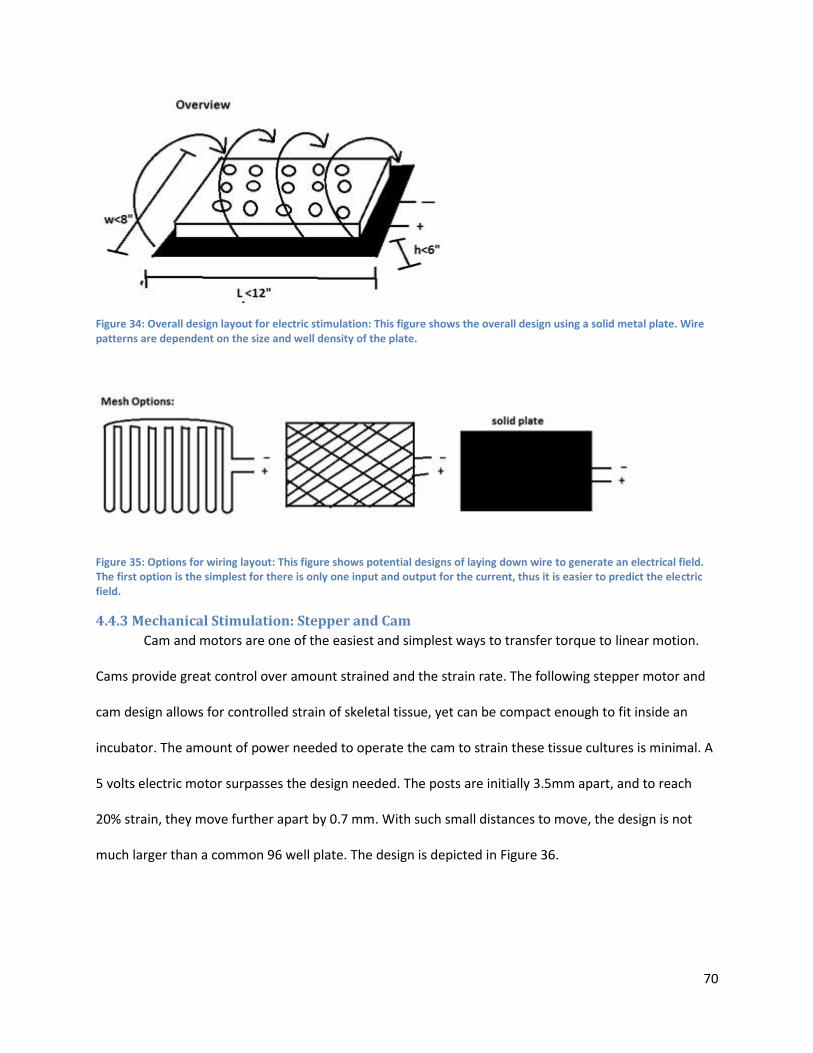
70
Figure 34: Overall design layout for electric stimulation: This figure shows the overall design using a solid metal plate. Wire patterns are dependent on the size and well density of the plate.
Figure 35: Options for wiring layout: This figure shows potential designs of laying down wire to generate an electrical field. The first option is the simplest for there is only one input and output for the current, thus it is easier to predict the electric field.
4.4.3 Mechanical Stimulation: Stepper and Cam
Cam and motors are one of the easiest and simplest ways to transfer torque to linear motion.
Cams provide great control over amount strained and the strain rate. The following stepper motor and
cam design allows for controlled strain of skeletal tissue, yet can be compact enough to fit inside an
incubator. The amount of power needed to operate the cam to strain these tissue cultures is minimal. A
5 volts electric motor surpasses the design needed. The posts are initially 3.5mm apart, and to reach
20% strain, they move further apart by 0.7 mm. With such small distances to move, the design is not
much larger than a common 96 well plate. The design is depicted in Figure 36.
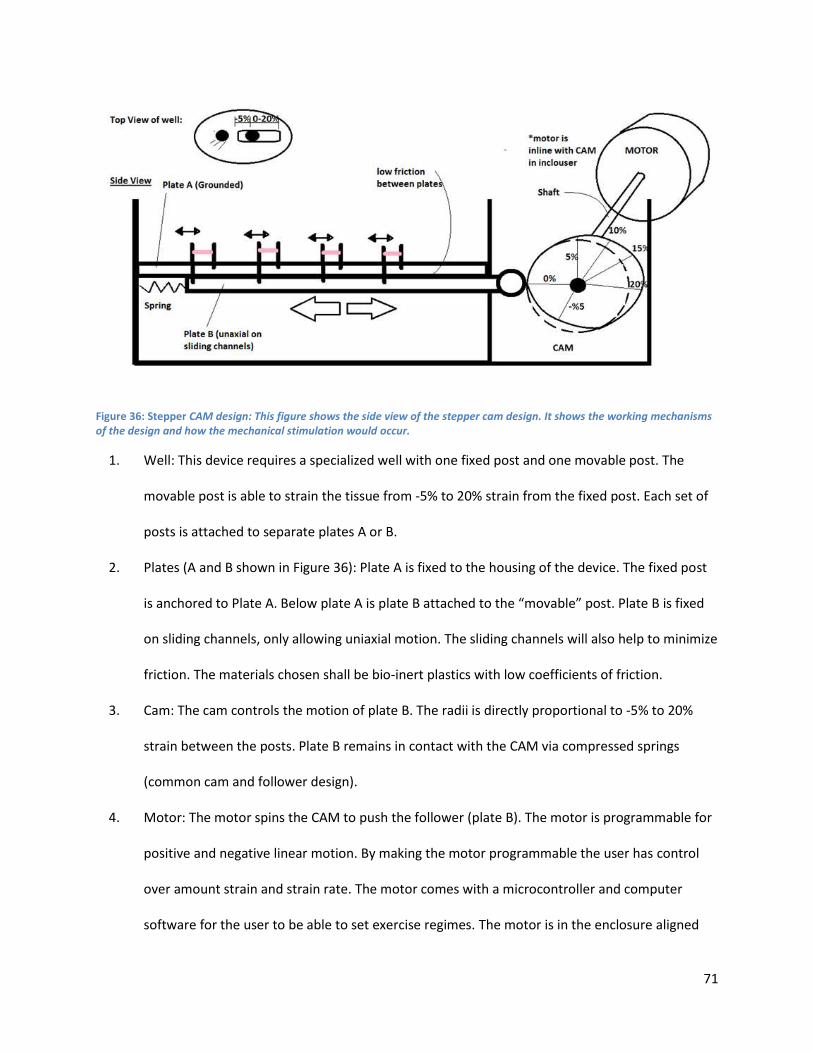
71
Figure 36: Stepper CAM design: This figure shows the side view of the stepper cam design. It shows the working mechanisms of the design and how the mechanical stimulation would occur.
1. Well: This device requires a specialized well with one fixed post and one movable post. The
movable post is able to strain the tissue from -5% to 20% strain from the fixed post. Each set of
posts is attached to separate plates A or B.
2. Plates (A and B shown in Figure 36): Plate A is fixed to the housing of the device. The fixed post
is anchored to Plate A. Below plate A is plate B attached to the “movable” post. Plate B is fixed
on sliding channels, only allowing uniaxial motion. The sliding channels will also help to minimize
friction. The materials chosen shall be bio-inert plastics with low coefficients of friction.
3. Cam: The cam controls the motion of plate B. The radii is directly proportional to -5% to 20%
strain between the posts. Plate B remains in contact with the CAM via compressed springs
(common cam and follower design).
4. Motor: The motor spins the CAM to push the follower (plate B). The motor is programmable for
positive and negative linear motion. By making the motor programmable the user has control
over amount strain and strain rate. The motor comes with a microcontroller and computer
software for the user to be able to set exercise regimes. The motor is in the enclosure aligned
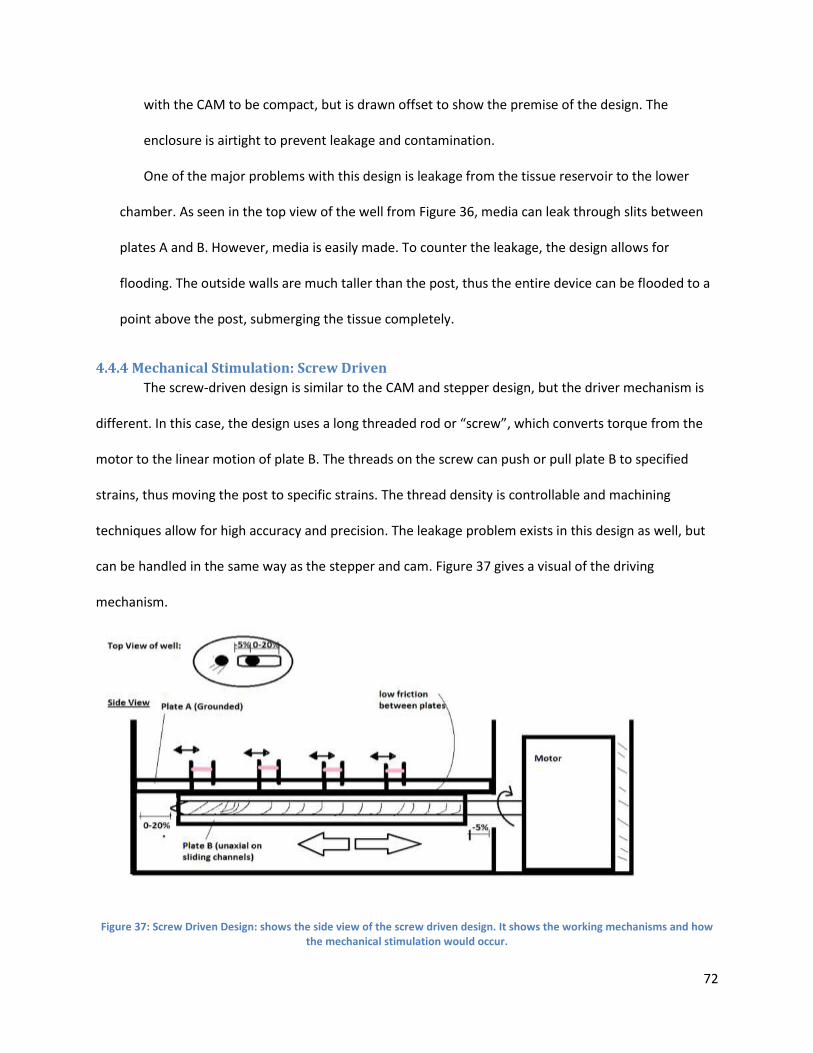
72
with the CAM to be compact, but is drawn offset to show the premise of the design. The
enclosure is airtight to prevent leakage and contamination.
One of the major problems with this design is leakage from the tissue reservoir to the lower
chamber. As seen in the top view of the well from Figure 36, media can leak through slits between
plates A and B. However, media is easily made. To counter the leakage, the design allows for
flooding. The outside walls are much taller than the post, thus the entire device can be flooded to a
point above the post, submerging the tissue completely.
4.4.4 Mechanical Stimulation: Screw Driven
The screw-driven design is similar to the CAM and stepper design, but the driver mechanism is
different. In this case, the design uses a long threaded rod or “screw”, which converts torque from the
motor to the linear motion of plate B. The threads on the screw can push or pull plate B to specified
strains, thus moving the post to specific strains. The thread density is controllable and machining
techniques allow for high accuracy and precision. The leakage problem exists in this design as well, but
can be handled in the same way as the stepper and cam. Figure 37 gives a visual of the driving
mechanism.
Figure 37: Screw Driven Design: shows the side view of the screw driven design. It shows the working mechanisms and how the mechanical stimulation would occur.
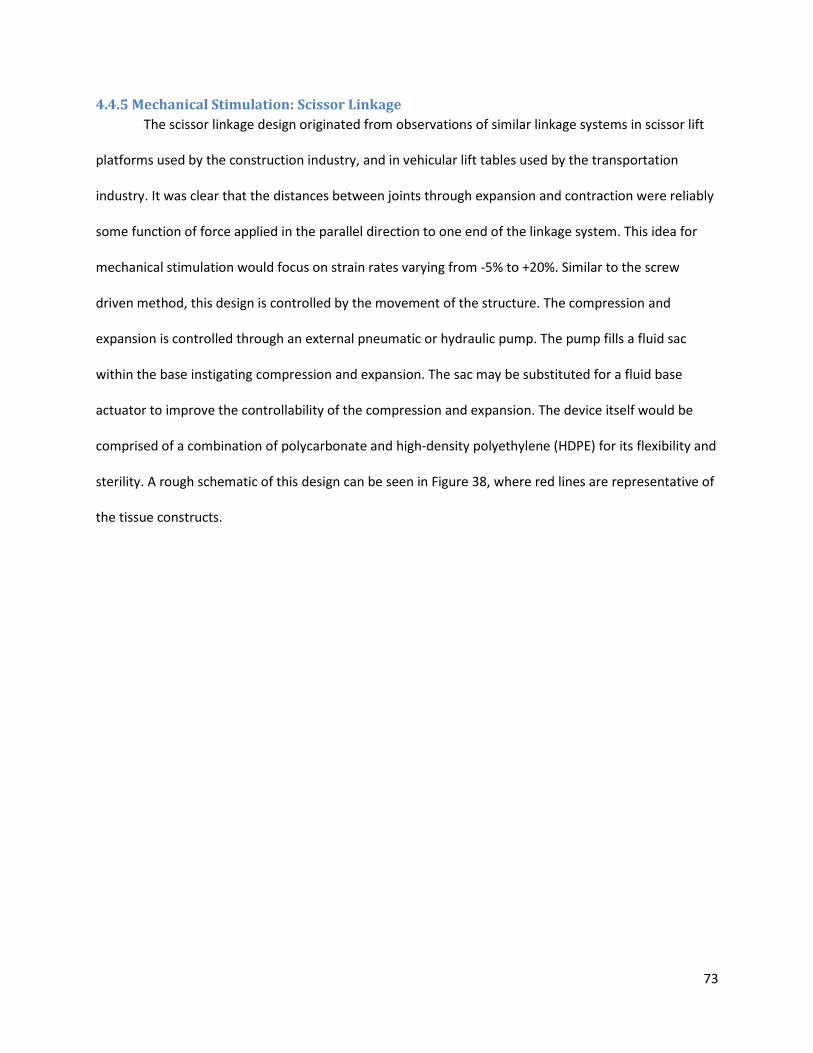
73
4.4.5 Mechanical Stimulation: Scissor Linkage
The scissor linkage design originated from observations of similar linkage systems in scissor lift
platforms used by the construction industry, and in vehicular lift tables used by the transportation
industry. It was clear that the distances between joints through expansion and contraction were reliably
some function of force applied in the parallel direction to one end of the linkage system. This idea for
mechanical stimulation would focus on strain rates varying from -5% to +20%. Similar to the screw
driven method, this design is controlled by the movement of the structure. The compression and
expansion is controlled through an external pneumatic or hydraulic pump. The pump fills a fluid sac
within the base instigating compression and expansion. The sac may be substituted for a fluid base
actuator to improve the controllability of the compression and expansion. The device itself would be
comprised of a combination of polycarbonate and high-density polyethylene (HDPE) for its flexibility and
sterility. A rough schematic of this design can be seen in Figure 38, where red lines are representative of
the tissue constructs.
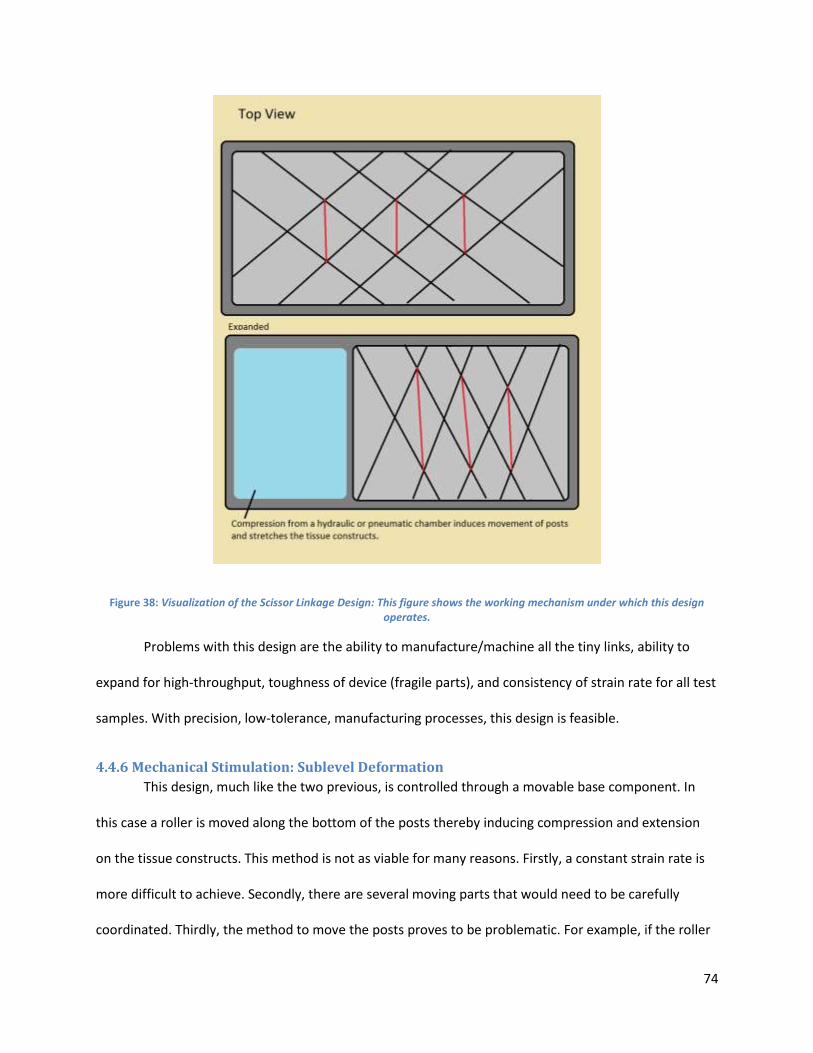
74
Figure 38: Visualization of the Scissor Linkage Design: This figure shows the working mechanism under which this design operates.
Problems with this design are the ability to manufacture/machine all the tiny links, ability to
expand for high-throughput, toughness of device (fragile parts), and consistency of strain rate for all test
samples. With precision, low-tolerance, manufacturing processes, this design is feasible.
4.4.6 Mechanical Stimulation: Sublevel Deformation
This design, much like the two previous, is controlled through a movable base component. In
this case a roller is moved along the bottom of the posts thereby inducing compression and extension
on the tissue constructs. This method is not as viable for many reasons. Firstly, a constant strain rate is
more difficult to achieve. Secondly, there are several moving parts that would need to be carefully
coordinated. Thirdly, the method to move the posts proves to be problematic. For example, if the roller
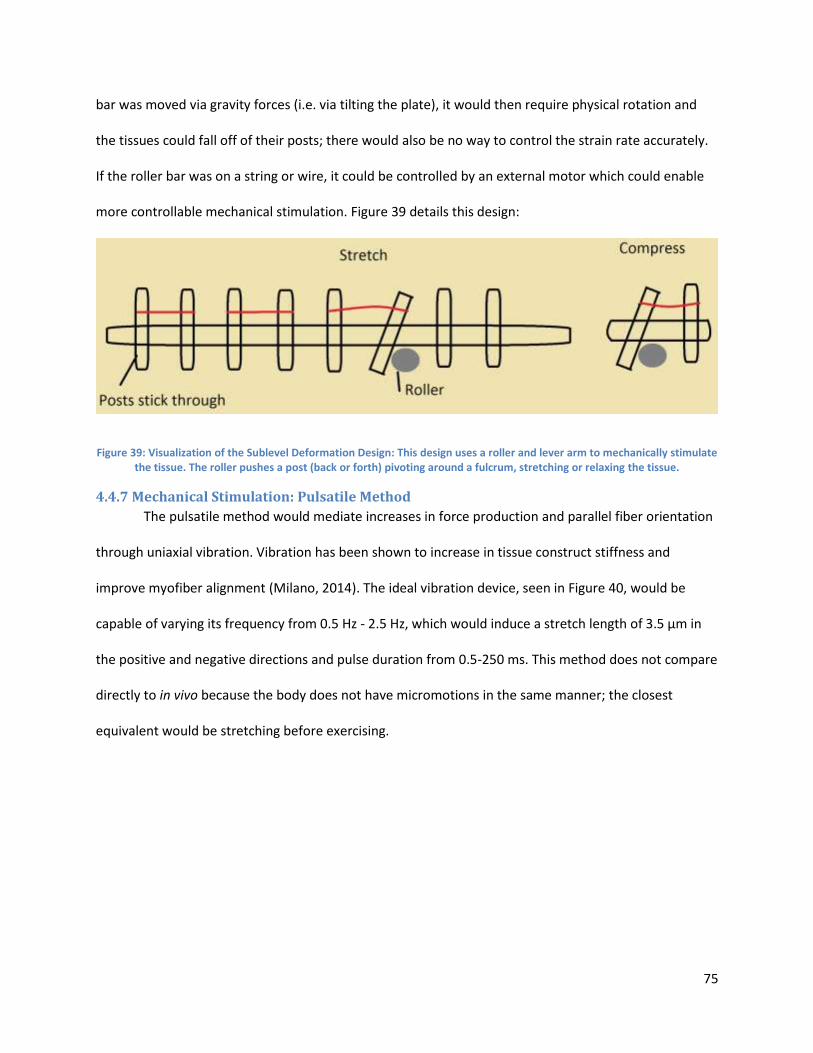
75
bar was moved via gravity forces (i.e. via tilting the plate), it would then require physical rotation and
the tissues could fall off of their posts; there would also be no way to control the strain rate accurately.
If the roller bar was on a string or wire, it could be controlled by an external motor which could enable
more controllable mechanical stimulation. Figure 39 details this design:
Figure 39: Visualization of the Sublevel Deformation Design: This design uses a roller and lever arm to mechanically stimulate the tissue. The roller pushes a post (back or forth) pivoting around a fulcrum, stretching or relaxing the tissue.
4.4.7 Mechanical Stimulation: Pulsatile Method
The pulsatile method would mediate increases in force production and parallel fiber orientation
through uniaxial vibration. Vibration has been shown to increase in tissue construct stiffness and
improve myofiber alignment (Milano, 2014). The ideal vibration device, seen in Figure 40, would be
capable of varying its frequency from 0.5 Hz - 2.5 Hz, which would induce a stretch length of 3.5 μm in
the positive and negative directions and pulse duration from 0.5-250 ms. This method does not compare
directly to in vivo because the body does not have micromotions in the same manner; the closest
equivalent would be stretching before exercising.
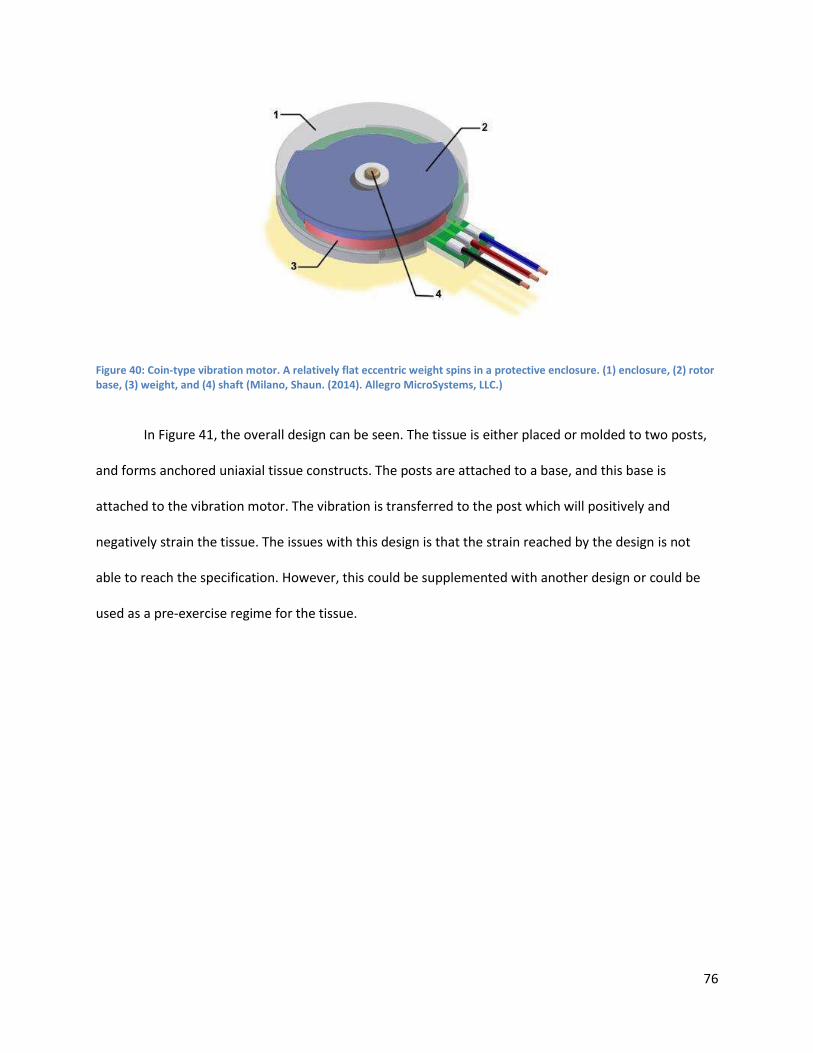
76
Figure 40: Coin-type vibration motor. A relatively flat eccentric weight spins in a protective enclosure. (1) enclosure, (2) rotor base, (3) weight, and (4) shaft (Milano, Shaun. (2014). Allegro MicroSystems, LLC.)
In Figure 41, the overall design can be seen. The tissue is either placed or molded to two posts,
and forms anchored uniaxial tissue constructs. The posts are attached to a base, and this base is
attached to the vibration motor. The vibration is transferred to the post which will positively and
negatively strain the tissue. The issues with this design is that the strain reached by the design is not
able to reach the specification. However, this could be supplemented with another design or could be
used as a pre-exercise regime for the tissue.
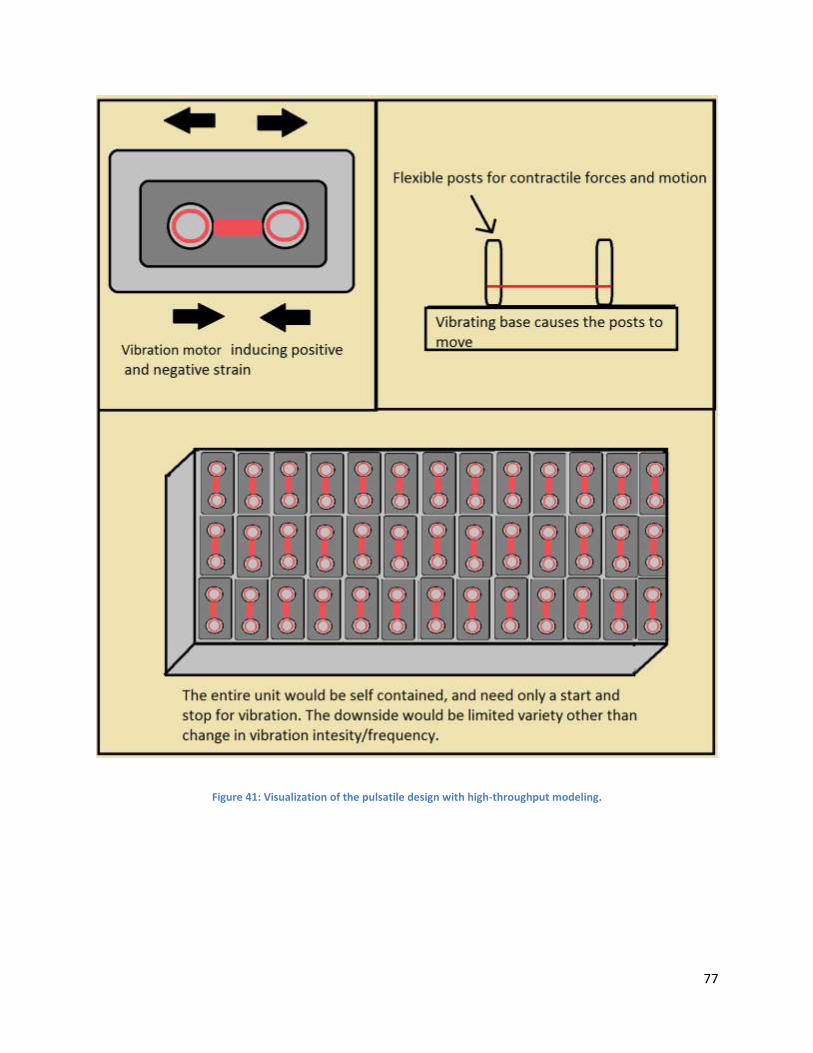
77
Figure 41: Visualization of the pulsatile design with high-throughput modeling.
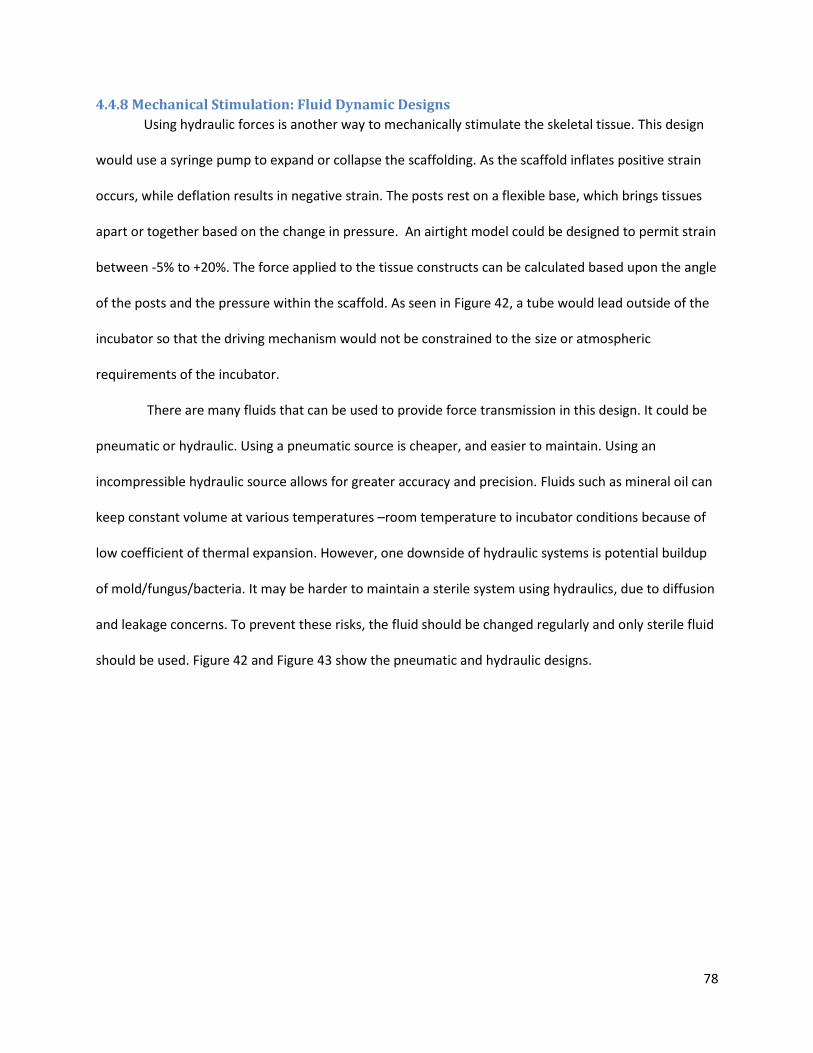
78
4.4.8 Mechanical Stimulation: Fluid Dynamic Designs
Using hydraulic forces is another way to mechanically stimulate the skeletal tissue. This design
would use a syringe pump to expand or collapse the scaffolding. As the scaffold inflates positive strain
occurs, while deflation results in negative strain. The posts rest on a flexible base, which brings tissues
apart or together based on the change in pressure. An airtight model could be designed to permit strain
between -5% to +20%. The force applied to the tissue constructs can be calculated based upon the angle
of the posts and the pressure within the scaffold. As seen in Figure 42, a tube would lead outside of the
incubator so that the driving mechanism would not be constrained to the size or atmospheric
requirements of the incubator.
There are many fluids that can be used to provide force transmission in this design. It could be
pneumatic or hydraulic. Using a pneumatic source is cheaper, and easier to maintain. Using an
incompressible hydraulic source allows for greater accuracy and precision. Fluids such as mineral oil can
keep constant volume at various temperatures –room temperature to incubator conditions because of
low coefficient of thermal expansion. However, one downside of hydraulic systems is potential buildup
of mold/fungus/bacteria. It may be harder to maintain a sterile system using hydraulics, due to diffusion
and leakage concerns. To prevent these risks, the fluid should be changed regularly and only sterile fluid
should be used. Figure 42 and Figure 43 show the pneumatic and hydraulic designs.
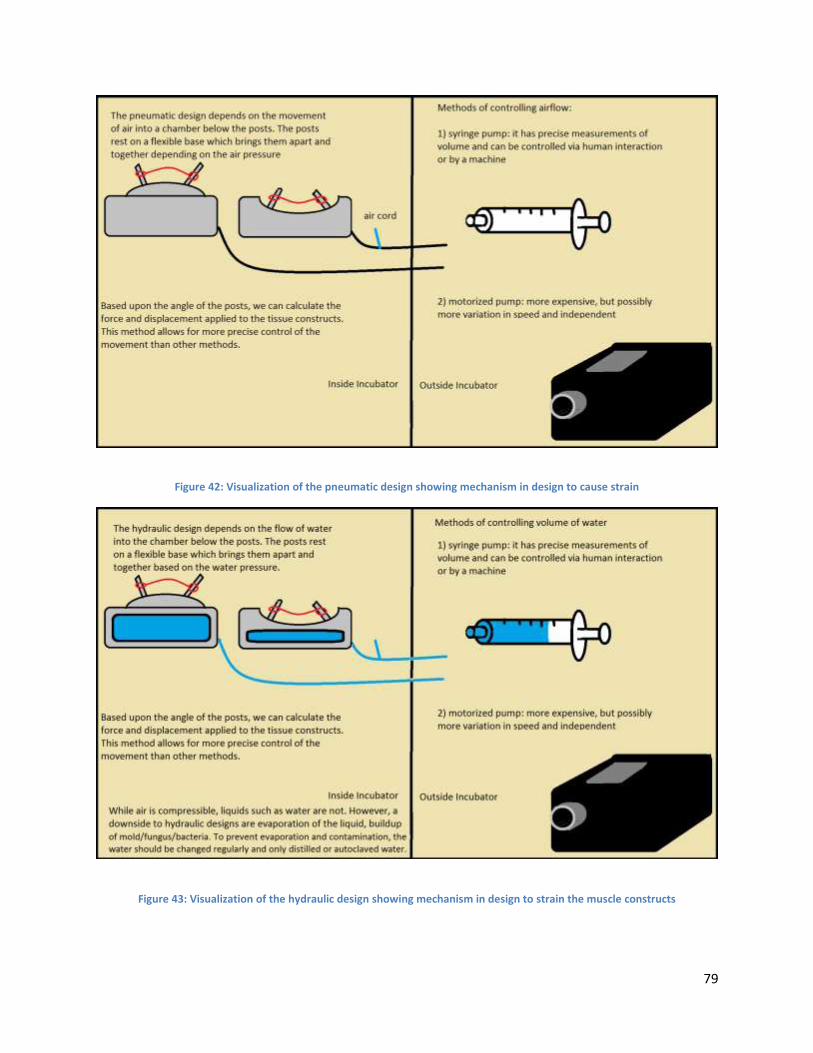
79
Figure 42: Visualization of the pneumatic design showing mechanism in design to cause strain
Figure 43: Visualization of the hydraulic design showing mechanism in design to strain the muscle constructs
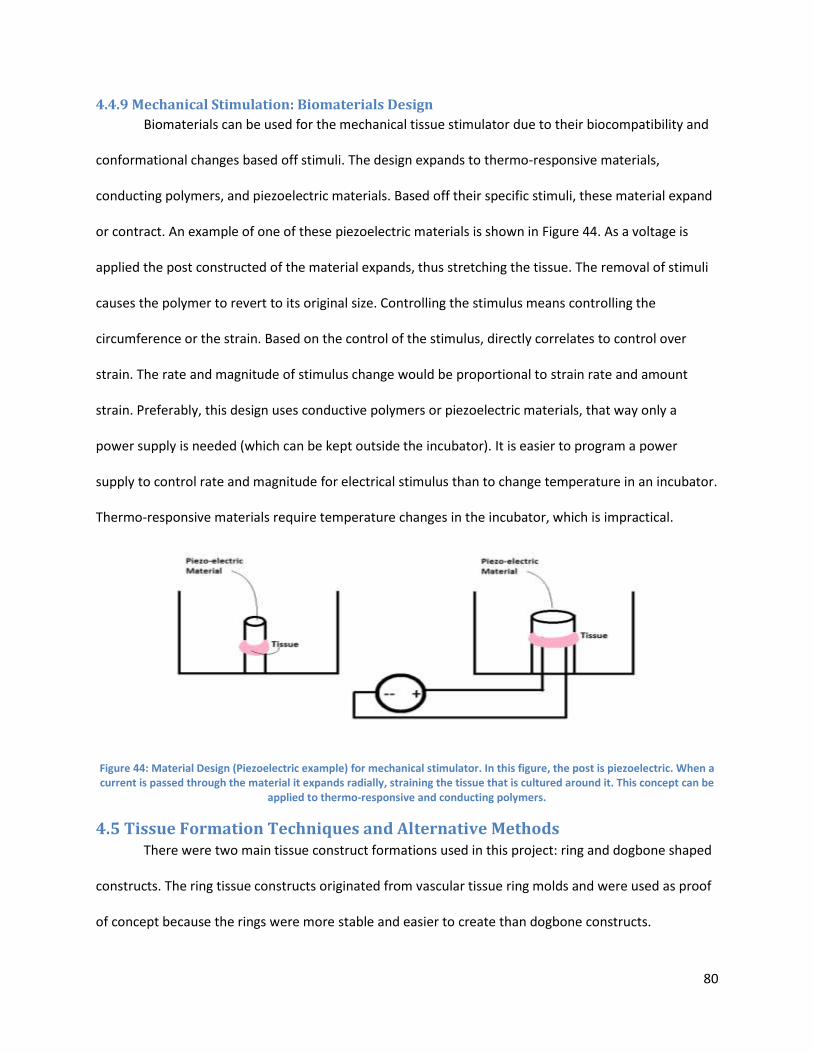
80
4.4.9 Mechanical Stimulation: Biomaterials Design
Biomaterials can be used for the mechanical tissue stimulator due to their biocompatibility and
conformational changes based off stimuli. The design expands to thermo-responsive materials,
conducting polymers, and piezoelectric materials. Based off their specific stimuli, these material expand
or contract. An example of one of these piezoelectric materials is shown in Figure 44. As a voltage is
applied the post constructed of the material expands, thus stretching the tissue. The removal of stimuli
causes the polymer to revert to its original size. Controlling the stimulus means controlling the
circumference or the strain. Based on the control of the stimulus, directly correlates to control over
strain. The rate and magnitude of stimulus change would be proportional to strain rate and amount
strain. Preferably, this design uses conductive polymers or piezoelectric materials, that way only a
power supply is needed (which can be kept outside the incubator). It is easier to program a power
supply to control rate and magnitude for electrical stimulus than to change temperature in an incubator.
Thermo-responsive materials require temperature changes in the incubator, which is impractical.
Figure 44: Material Design (Piezoelectric example) for mechanical stimulator. In this figure, the post is piezoelectric. When a current is passed through the material it expands radially, straining the tissue that is cultured around it. This concept can be
applied to thermo-responsive and conducting polymers.
4.5 Tissue Formation Techniques and Alternative Methods There were two main tissue construct formations used in this project: ring and dogbone shaped
constructs. The ring tissue constructs originated from vascular tissue ring molds and were used as proof
of concept because the rings were more stable and easier to create than dogbone constructs.
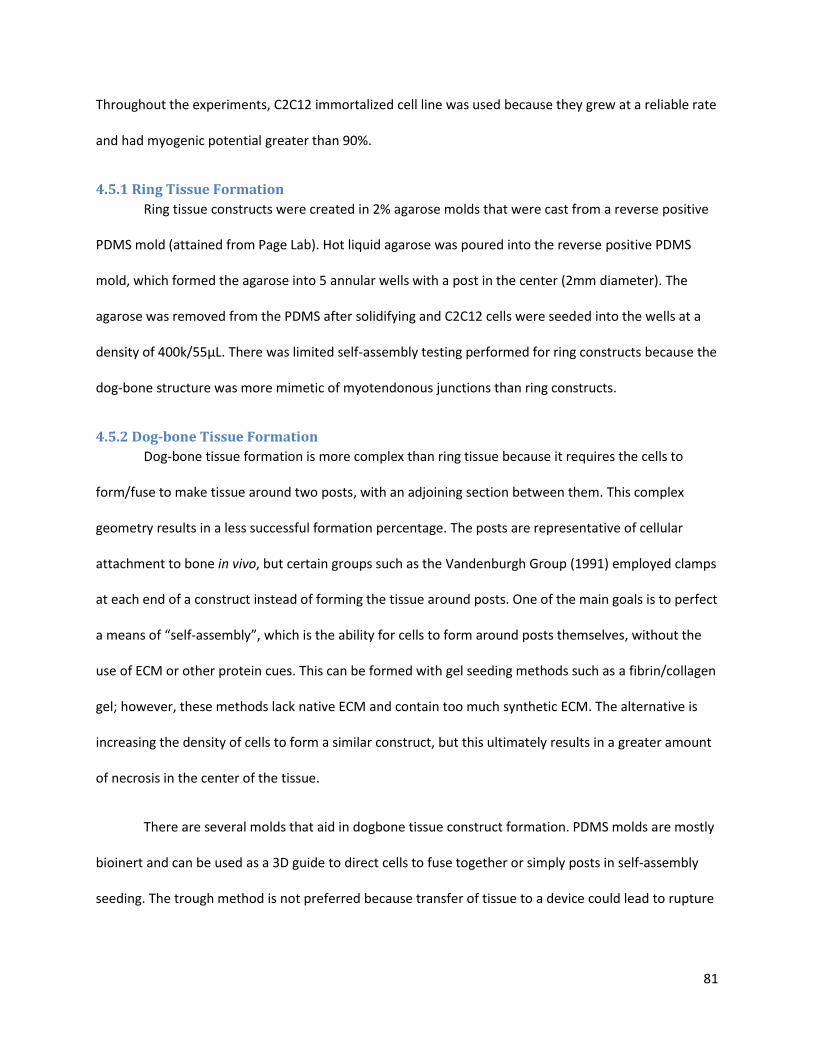
81
Throughout the experiments, C2C12 immortalized cell line was used because they grew at a reliable rate
and had myogenic potential greater than 90%.
4.5.1 Ring Tissue Formation
Ring tissue constructs were created in 2% agarose molds that were cast from a reverse positive
PDMS mold (attained from Page Lab). Hot liquid agarose was poured into the reverse positive PDMS
mold, which formed the agarose into 5 annular wells with a post in the center (2mm diameter). The
agarose was removed from the PDMS after solidifying and C2C12 cells were seeded into the wells at a
density of 400k/55μL. There was limited self-assembly testing performed for ring constructs because the
dog-bone structure was more mimetic of myotendonous junctions than ring constructs.
4.5.2 Dog-bone Tissue Formation
Dog-bone tissue formation is more complex than ring tissue because it requires the cells to
form/fuse to make tissue around two posts, with an adjoining section between them. This complex
geometry results in a less successful formation percentage. The posts are representative of cellular
attachment to bone in vivo, but certain groups such as the Vandenburgh Group (1991) employed clamps
at each end of a construct instead of forming the tissue around posts. One of the main goals is to perfect
a means of “self-assembly”, which is the ability for cells to form around posts themselves, without the
use of ECM or other protein cues. This can be formed with gel seeding methods such as a fibrin/collagen
gel; however, these methods lack native ECM and contain too much synthetic ECM. The alternative is
increasing the density of cells to form a similar construct, but this ultimately results in a greater amount
of necrosis in the center of the tissue.
There are several molds that aid in dogbone tissue construct formation. PDMS molds are mostly
bioinert and can be used as a 3D guide to direct cells to fuse together or simply posts in self-assembly
seeding. The trough method is not preferred because transfer of tissue to a device could lead to rupture
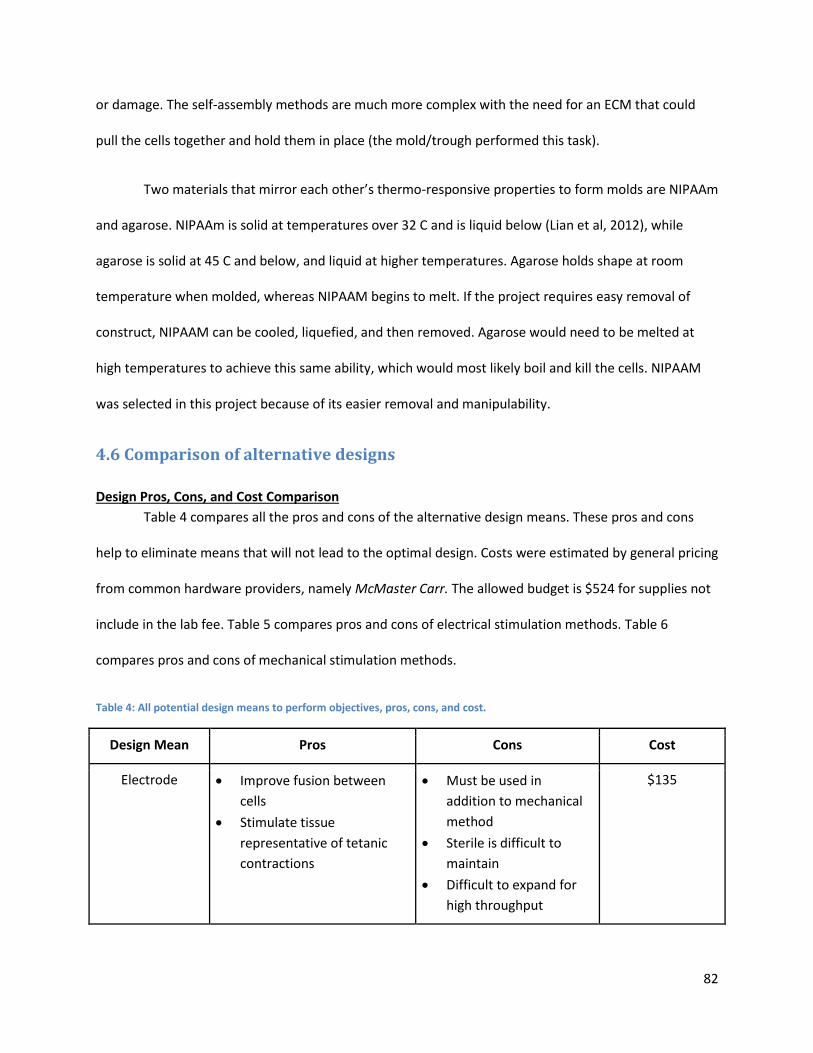
82
or damage. The self-assembly methods are much more complex with the need for an ECM that could
pull the cells together and hold them in place (the mold/trough performed this task).
Two materials that mirror each other’s thermo-responsive properties to form molds are NIPAAm
and agarose. NIPAAm is solid at temperatures over 32 C and is liquid below (Lian et al, 2012), while
agarose is solid at 45 C and below, and liquid at higher temperatures. Agarose holds shape at room
temperature when molded, whereas NIPAAM begins to melt. If the project requires easy removal of
construct, NIPAAM can be cooled, liquefied, and then removed. Agarose would need to be melted at
high temperatures to achieve this same ability, which would most likely boil and kill the cells. NIPAAM
was selected in this project because of its easier removal and manipulability.
4.6 Comparison of alternative designs
Design Pros, Cons, and Cost Comparison
Table 4 compares all the pros and cons of the alternative design means. These pros and cons
help to eliminate means that will not lead to the optimal design. Costs were estimated by general pricing
from common hardware providers, namely McMaster Carr. The allowed budget is $524 for supplies not
include in the lab fee. Table 5 compares pros and cons of electrical stimulation methods. Table 6
compares pros and cons of mechanical stimulation methods.
Table 4: All potential design means to perform objectives, pros, cons, and cost.
Design Mean Pros Cons Cost
Electrode Improve fusion between
cells
Stimulate tissue
representative of tetanic
contractions
Must be used in
addition to mechanical
method
Sterile is difficult to
maintain
Difficult to expand for
high throughput
$135
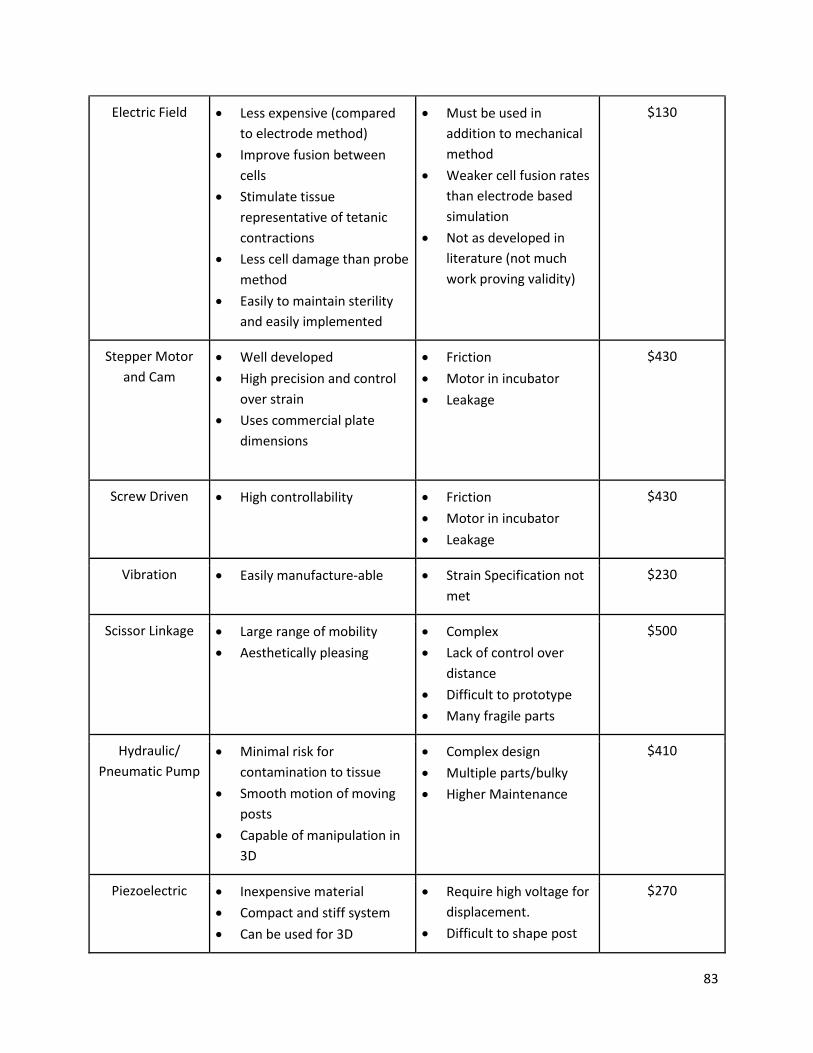
83
Electric Field Less expensive (compared
to electrode method)
Improve fusion between
cells
Stimulate tissue
representative of tetanic
contractions
Less cell damage than probe
method
Easily to maintain sterility
and easily implemented
Must be used in
addition to mechanical
method
Weaker cell fusion rates
than electrode based
simulation
Not as developed in
literature (not much
work proving validity)
$130
Stepper Motor
and Cam
Well developed
High precision and control
over strain
Uses commercial plate
dimensions
Friction
Motor in incubator
Leakage
$430
Screw Driven High controllability Friction
Motor in incubator
Leakage
$430
Vibration Easily manufacture-able Strain Specification not
met
$230
Scissor Linkage Large range of mobility
Aesthetically pleasing
Complex
Lack of control over
distance
Difficult to prototype
Many fragile parts
$500
Hydraulic/
Pneumatic Pump
Minimal risk for
contamination to tissue
Smooth motion of moving
posts
Capable of manipulation in
3D
Complex design
Multiple parts/bulky
Higher Maintenance
$410
Piezoelectric Inexpensive material
Compact and stiff system
Can be used for 3D
Require high voltage for
displacement.
Difficult to shape post
$270
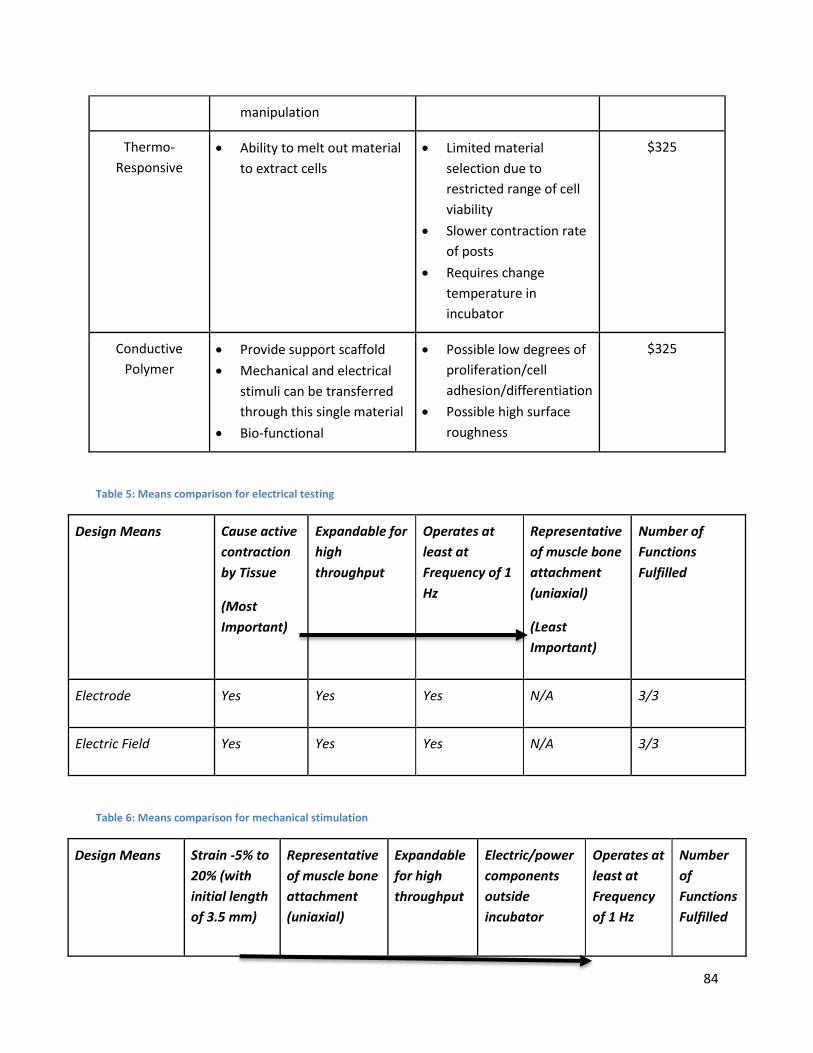
84
manipulation
Thermo-
Responsive
Ability to melt out material
to extract cells
Limited material
selection due to
restricted range of cell
viability
Slower contraction rate
of posts
Requires change
temperature in
incubator
$325
Conductive
Polymer
Provide support scaffold
Mechanical and electrical
stimuli can be transferred
through this single material
Bio-functional
Possible low degrees of
proliferation/cell
adhesion/differentiation
Possible high surface
roughness
$325
Table 5: Means comparison for electrical testing
Design Means Cause active
contraction
by Tissue
(Most
Important)
Expandable for
high
throughput
Operates at
least at
Frequency of 1
Hz
Representative
of muscle bone
attachment
(uniaxial)
(Least
Important)
Number of
Functions
Fulfilled
Electrode Yes Yes Yes N/A 3/3
Electric Field Yes Yes Yes N/A 3/3
Table 6: Means comparison for mechanical stimulation
Design Means Strain -5% to
20% (with
initial length
of 3.5 mm)
Representative
of muscle bone
attachment
(uniaxial)
Expandable
for high
throughput
Electric/power
components
outside
incubator
Operates at
least at
Frequency
of 1 Hz
Number
of
Functions
Fulfilled
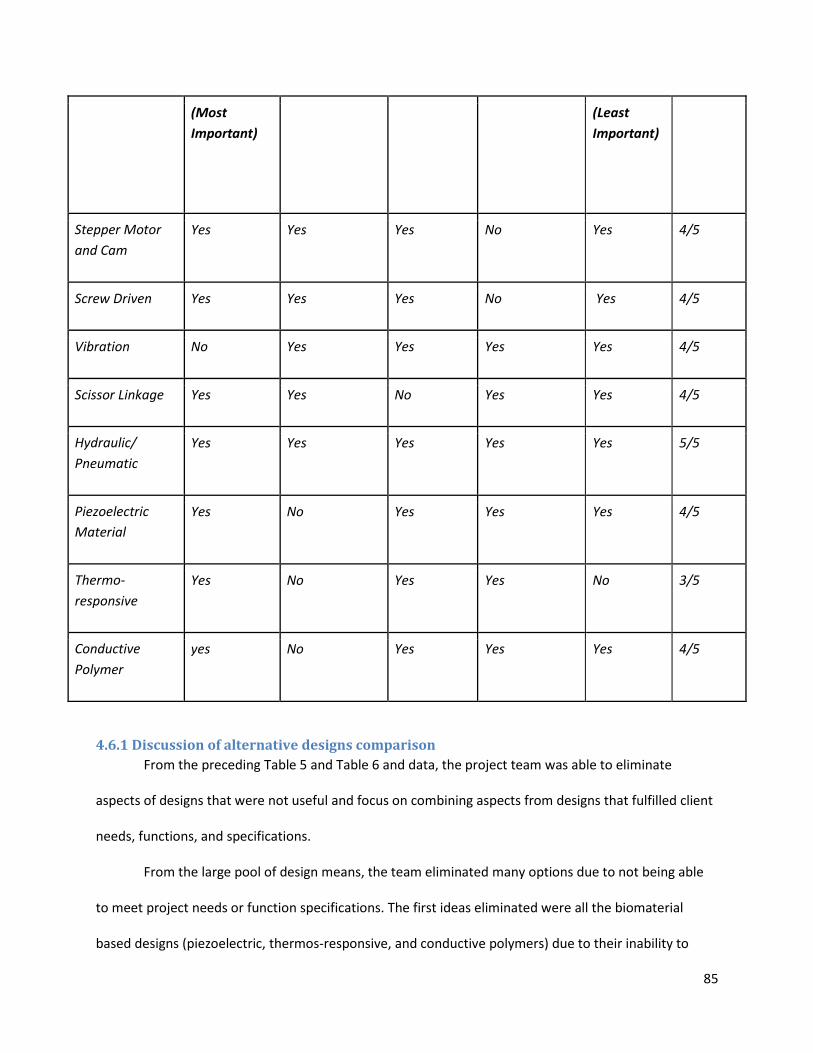
85
(Most
Important)
(Least
Important)
Stepper Motor
and Cam
Yes Yes Yes No Yes 4/5
Screw Driven Yes Yes Yes No Yes 4/5
Vibration No Yes Yes Yes Yes 4/5
Scissor Linkage Yes Yes No Yes Yes 4/5
Hydraulic/
Pneumatic
Yes Yes Yes Yes Yes 5/5
Piezoelectric
Material
Yes No Yes Yes Yes 4/5
Thermo-
responsive
Yes No Yes Yes No 3/5
Conductive
Polymer
yes No Yes Yes Yes 4/5
4.6.1 Discussion of alternative designs comparison
From the preceding Table 5 and Table 6 and data, the project team was able to eliminate
aspects of designs that were not useful and focus on combining aspects from designs that fulfilled client
needs, functions, and specifications.
From the large pool of design means, the team eliminated many options due to not being able
to meet project needs or function specifications. The first ideas eliminated were all the biomaterial
based designs (piezoelectric, thermos-responsive, and conductive polymers) due to their inability to
86
model muscle-bone attachment. The materials based designs only functioned with rings of tissue, but
dog-bone shape tissue constructs were preferred. Motors were the next aspects eliminated from
designs, because motors have to be in the incubator for the designs to function. This was undesirable.
Vibrations motors didn’t reach strain specifications.
From the pool of design means, the team pulled out aspects of designs that functioned well.
These aspects meet specifications and can be combined to form better designs. Using hydraulics for the
driving force of the mechanical stimulation optimizes the design by fulfilling all design function, unlike
other means. Pneumatic was eliminated due to the compressibility of air. Air can compress at body and
room temperature and cause overshooting in strain, thus impeding on accuracy and precision. For the
mechanisms directly straining the tissue constructs, both the sliding plate techniques and scissor linkage
method were both viable options and filled requirements. For electrical stimulation, both electrodes and
the electric field stimulation were viable options. From the viable function left, further models and
experimental testing was performed to help optimize the design.
4.7 Experimental/Design Validation This section describes the experimental and validation testing performed to further the design
ideas and improve the components of the final design. The experiments are meant to determine if
materials, methods of stimulation, and methodologies need improvement or are not compatible with
the design.
4.7.1 Tissue Ring Validation Testing for Preliminary Experiments
Successful ring formation can be seen in Figure 45 and Figure 46. The agarose posts are 2 mm in
diameter and the thickness of the cells in the table above display a thickness of less than 1 mm. This is
either evident of over-seeding, loss of myogenic potential, or lack of differentiation. Notice how the
rings below are much thinner, individual cells cannot be distinguished because of the cellular fusion, and
the tissue has contracted around the post.
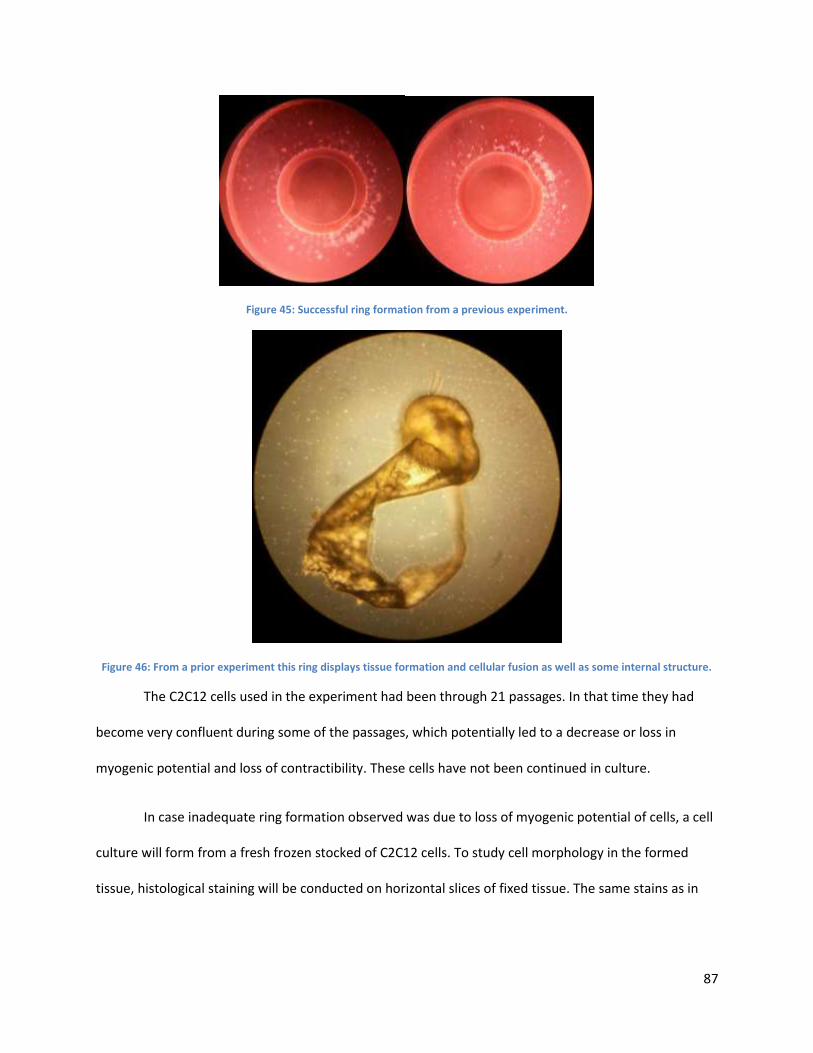
87
Figure 45: Successful ring formation from a previous experiment.
Figure 46: From a prior experiment this ring displays tissue formation and cellular fusion as well as some internal structure.
The C2C12 cells used in the experiment had been through 21 passages. In that time they had
become very confluent during some of the passages, which potentially led to a decrease or loss in
myogenic potential and loss of contractibility. These cells have not been continued in culture.
In case inadequate ring formation observed was due to loss of myogenic potential of cells, a cell
culture will form from a fresh frozen stocked of C2C12 cells. To study cell morphology in the formed
tissue, histological staining will be conducted on horizontal slices of fixed tissue. The same stains as in
88
the Cell Differentiation Assay were used —Hoechst 33342 for nuclei, AlexaFluor 488-tagged anti-myosin
for presence and morphology of myosin protein.
4.7.3 Staining/Cell Validation
Before the C2C12 cells are seeded into molds for tissue formation, the cells are incubated for a
period in mitogen-reduced differentiation media. Incubation with a large reduction in serum within the
culture media induces the cells to exit the cell cycle and enter terminal differentiation. This period is
critical to maximize myogenic potential and synchronize the culture for tissue formation from cell
seeding. It is important to study the rate at which cells differentiate during this incubation time in
differentiation media, as this provides clues about myogenic potential at cell seeding. Additionally, as
studying cell differentiation (See “Tissue Histology”, below) is a prolonged and complicated process,
studying differentiation rate in 2D culture also provides a general reference value for the rate of C2C12
cell differentiation.
To evaluate cell differentiation rate, the team conducted a staining assay on 2D cultures of
C2C12. Different, known numbers of cells were seeded in two control wells (in proliferation media) and
then in two treatment wells (in differentiation media). This variation was set up so as to observe
myotube formation at different (2D) cell densities. 5,000 cells were seeded in the first control well, and
25,000 cells were seeded in the second control well. 50,000 cells were seeded in the first treatment
well, and 75,000 cells were seeded in the second treatment well. The setup of each row (two control
wells, two treatment wells) was carried out in quadruplicate. Wells were imaged at 0 days, 3 days, 6
days, and 8 days. After at least 8 days of incubation in differentiation media, myosin fibers and cell
nuclei were assayed for. Though myosin is already present in undifferentiated myoblasts in very small
quantities, myosin quantity increases dramatically over differentiation, concentrates around the
nucleus, and forms filaments as the myoblasts fuse to form myotubes. Thus myosin serves as a late-
stage marker for C2C12 cell differentiation. Myosin fibers were visualized via a green-fluorescent
89
immunocytochemical stain, with mouse anti-myosin IgG as a primary antibody (MF 20, Developmental
Studies Hybridoma Bank), and isotype-specific goat anti-mouse IgG (Alexa Fluor® 488 conjugated Goat
Anti-Mouse IgG (H+L)) as a secondary antibody. Cell nuclei were imaged via the blue-fluorescent
Hoechst dye (Hoechst 33342, Thermo Scientific Pierce), which selectively binds to DNA, thus allowing for
visualization of the nucleus. With images from fluorescence and phase-contrast microscopy, two indices
were calculated. Using myotube formation as a measure of cell differentiation, the percentage of nuclei
in myosin-positive cells allowed for a quantitative analysis of myotube formation. The differentiation
index was calculated as the ratio of (number of nuclei inside myotubes) to 100*(number of total nuclei)
after at least 8 days of myogenic differentiation. The number of nuclei was estimated by averaging the
number of nuclei counted in twenty separate, randomly-chosen microscope fields. The number of
myotubes was similarly determined, but a myotube was defined by the presence of at least three nuclei
within a continuous cell membrane. This calculation of differentiation index follows the calculation of
Goudenege et al (2009).
4.8 Modeling of Alternative Designs From the viable means left, the team began to model two potential options for the mechanical
aspect for the final design. Modeling gives the client and user more of a hands-on view of the potential
design, and allows the inventors to map out how to manufacture the device. There are many types of
models, but the following two are functioning models (mechanisms only). This means the mechanics of
the models accurately represent how the device will function, but is not made of the ideal materials or
to the correct size yet. Both models were initially developed on a 6-well plate.
4.8.1 Scissor Linkage Model
This design was selected for modeling due to the relatability of applied hydraulic force to output
mechanical strain from the design. The final scissor linkage model was constructed using two rows of
separate scissor links. The linkage system in each row of the plate consists of interlocking stiff segments,
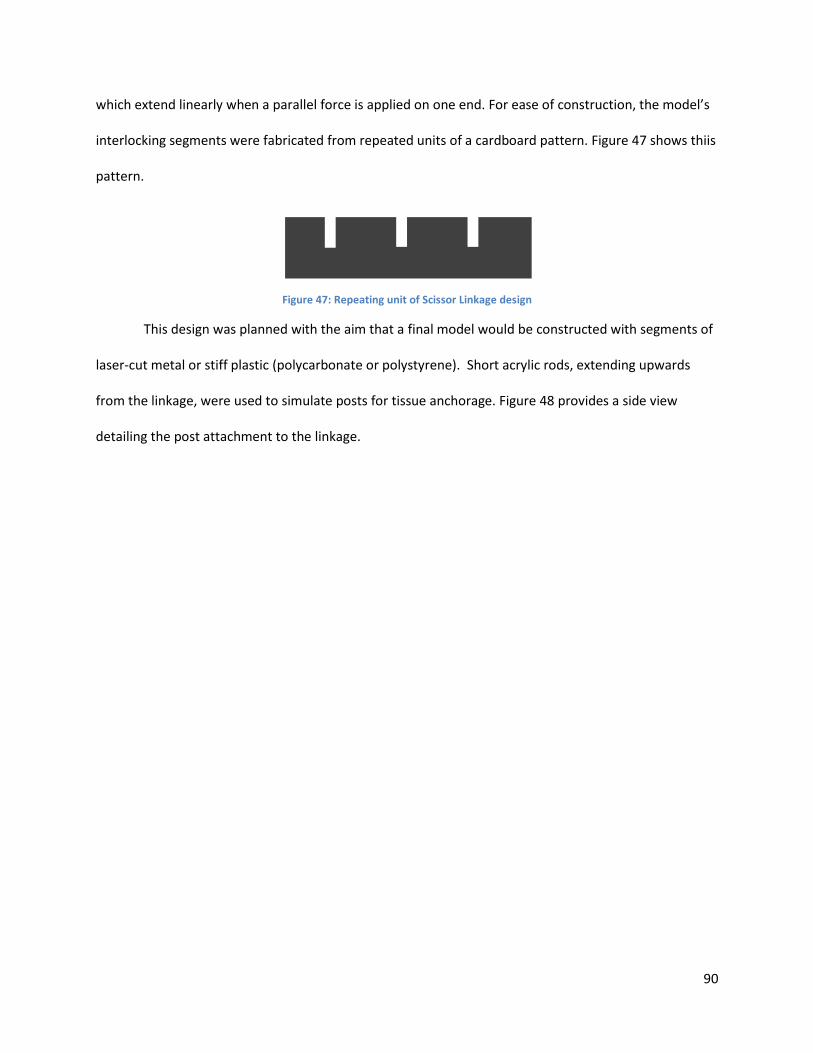
90
which extend linearly when a parallel force is applied on one end. For ease of construction, the model’s
interlocking segments were fabricated from repeated units of a cardboard pattern. Figure 47 shows thiis
pattern.
Figure 47: Repeating unit of Scissor Linkage design
This design was planned with the aim that a final model would be constructed with segments of
laser-cut metal or stiff plastic (polycarbonate or polystyrene). Short acrylic rods, extending upwards
from the linkage, were used to simulate posts for tissue anchorage. Figure 48 provides a side view
detailing the post attachment to the linkage.
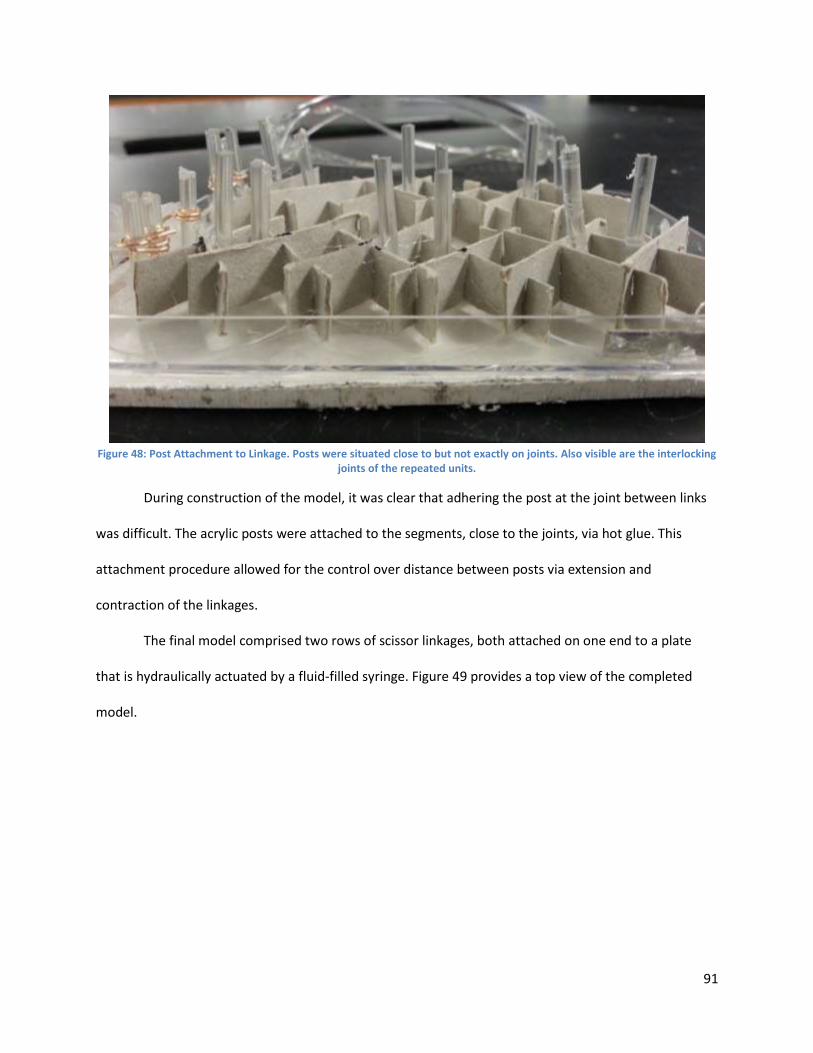
91
Figure 48: Post Attachment to Linkage. Posts were situated close to but not exactly on joints. Also visible are the interlocking
joints of the repeated units.
During construction of the model, it was clear that adhering the post at the joint between links
was difficult. The acrylic posts were attached to the segments, close to the joints, via hot glue. This
attachment procedure allowed for the control over distance between posts via extension and
contraction of the linkages.
The final model comprised two rows of scissor linkages, both attached on one end to a plate
that is hydraulically actuated by a fluid-filled syringe. Figure 49 provides a top view of the completed
model.
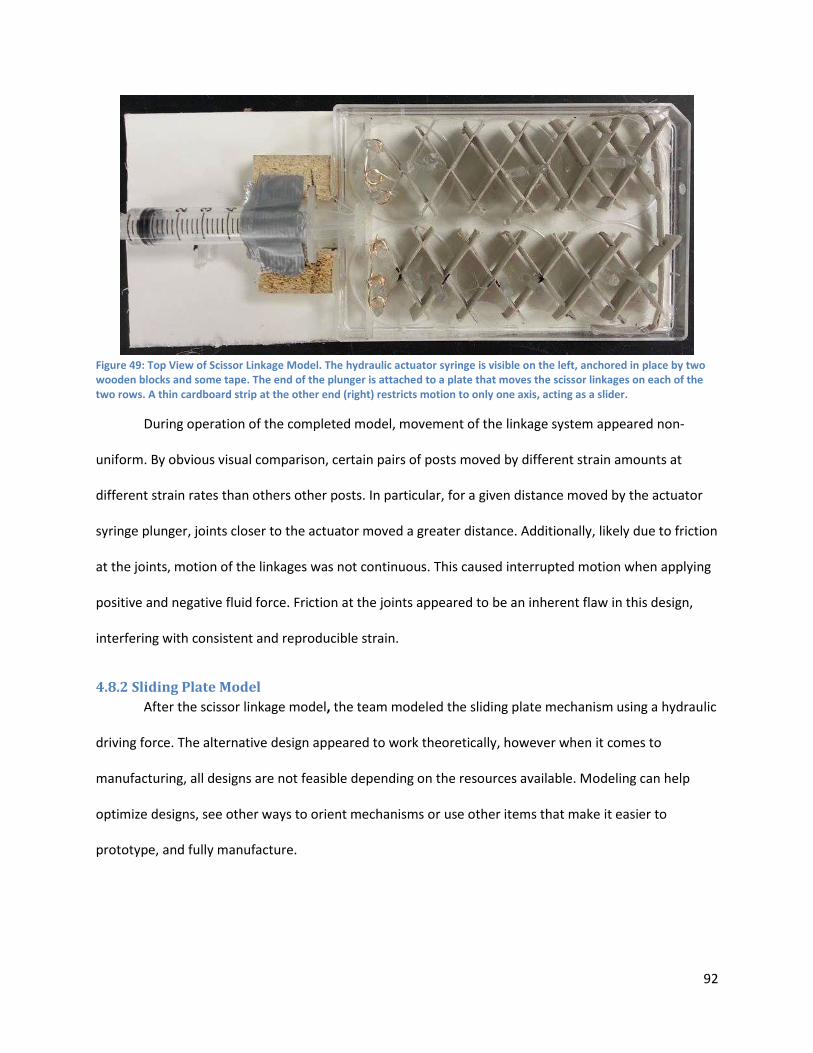
92
Figure 49: Top View of Scissor Linkage Model. The hydraulic actuator syringe is visible on the left, anchored in place by two wooden blocks and some tape. The end of the plunger is attached to a plate that moves the scissor linkages on each of the two rows. A thin cardboard strip at the other end (right) restricts motion to only one axis, acting as a slider.
During operation of the completed model, movement of the linkage system appeared non-
uniform. By obvious visual comparison, certain pairs of posts moved by different strain amounts at
different strain rates than others other posts. In particular, for a given distance moved by the actuator
syringe plunger, joints closer to the actuator moved a greater distance. Additionally, likely due to friction
at the joints, motion of the linkages was not continuous. This caused interrupted motion when applying
positive and negative fluid force. Friction at the joints appeared to be an inherent flaw in this design,
interfering with consistent and reproducible strain.
4.8.2 Sliding Plate Model
After the scissor linkage model, the team modeled the sliding plate mechanism using a hydraulic
driving force. The alternative design appeared to work theoretically, however when it comes to
manufacturing, all designs are not feasible depending on the resources available. Modeling can help
optimize designs, see other ways to orient mechanisms or use other items that make it easier to
prototype, and fully manufacture.
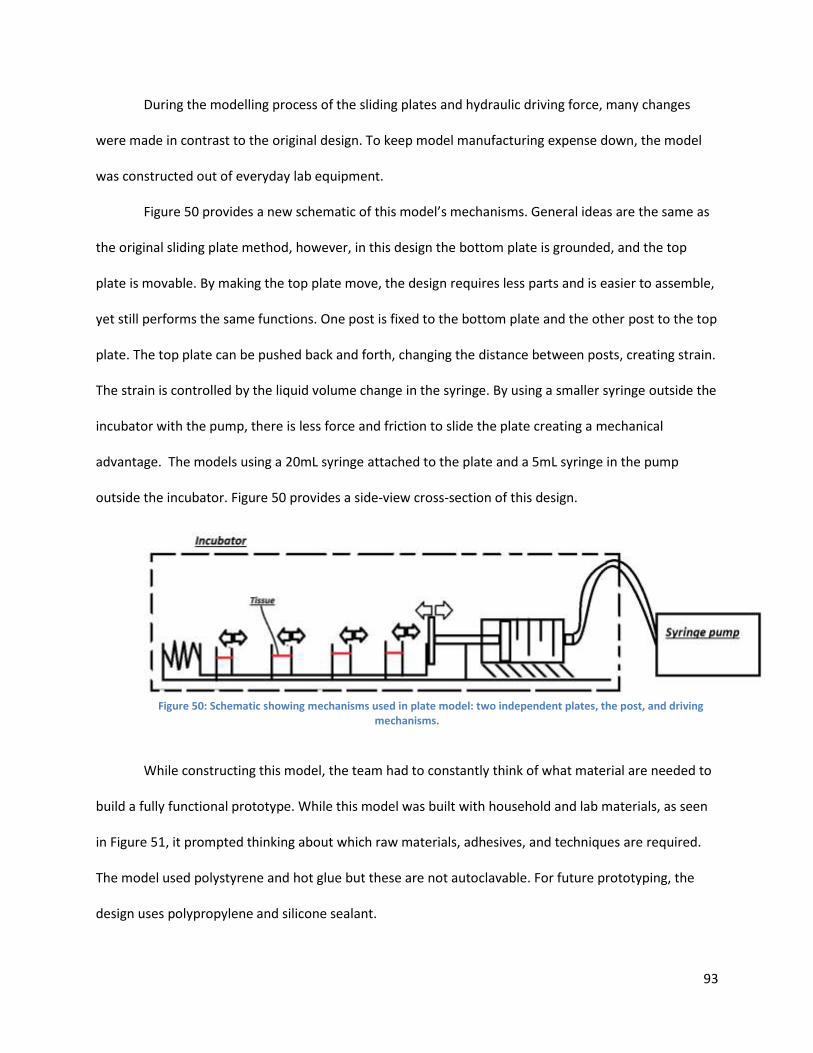
93
During the modelling process of the sliding plates and hydraulic driving force, many changes
were made in contrast to the original design. To keep model manufacturing expense down, the model
was constructed out of everyday lab equipment.
Figure 50 provides a new schematic of this model’s mechanisms. General ideas are the same as
the original sliding plate method, however, in this design the bottom plate is grounded, and the top
plate is movable. By making the top plate move, the design requires less parts and is easier to assemble,
yet still performs the same functions. One post is fixed to the bottom plate and the other post to the top
plate. The top plate can be pushed back and forth, changing the distance between posts, creating strain.
The strain is controlled by the liquid volume change in the syringe. By using a smaller syringe outside the
incubator with the pump, there is less force and friction to slide the plate creating a mechanical
advantage. The models using a 20mL syringe attached to the plate and a 5mL syringe in the pump
outside the incubator. Figure 50 provides a side-view cross-section of this design.
Figure 50: Schematic showing mechanisms used in plate model: two independent plates, the post, and driving
mechanisms.
While constructing this model, the team had to constantly think of what material are needed to
build a fully functional prototype. While this model was built with household and lab materials, as seen
in Figure 51, it prompted thinking about which raw materials, adhesives, and techniques are required.
The model used polystyrene and hot glue but these are not autoclavable. For future prototyping, the
design uses polypropylene and silicone sealant.
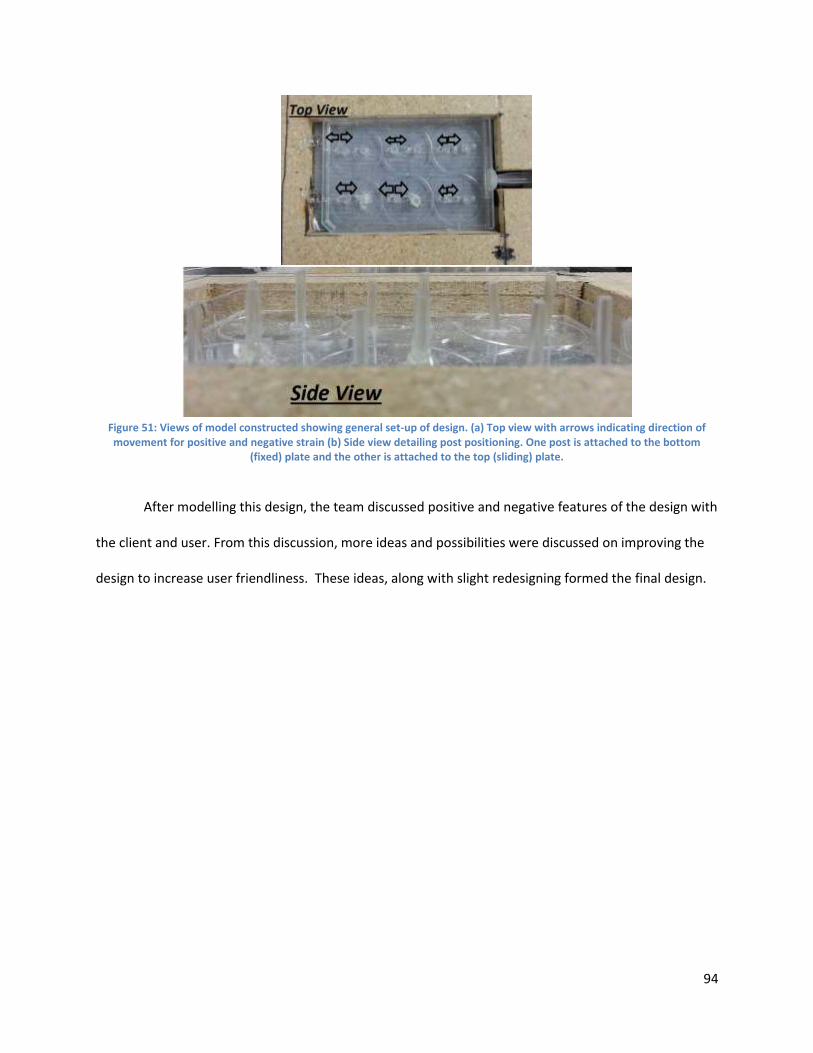
94
Figure 51: Views of model constructed showing general set-up of design. (a) Top view with arrows indicating direction of movement for positive and negative strain (b) Side view detailing post positioning. One post is attached to the bottom
(fixed) plate and the other is attached to the top (sliding) plate.
After modelling this design, the team discussed positive and negative features of the design with
the client and user. From this discussion, more ideas and possibilities were discussed on improving the
design to increase user friendliness. These ideas, along with slight redesigning formed the final design.
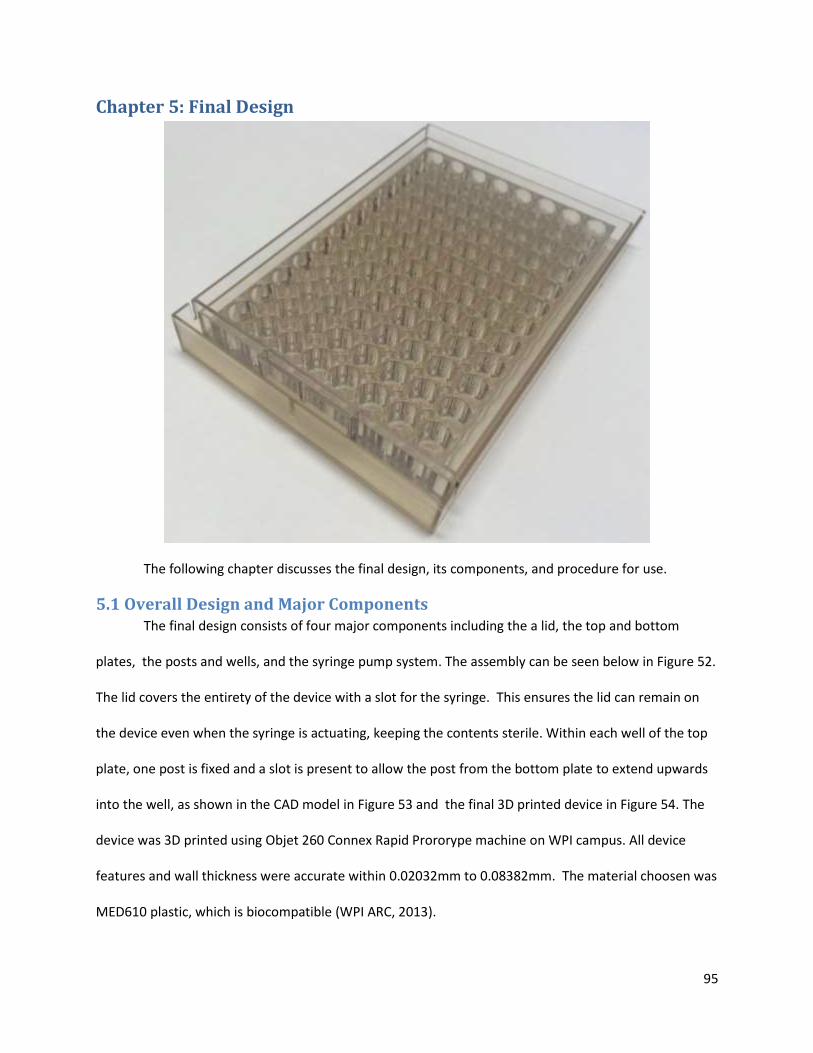
95
Chapter 5: Final Design
The following chapter discusses the final design, its components, and procedure for use.
5.1 Overall Design and Major Components The final design consists of four major components including the a lid, the top and bottom
plates, the posts and wells, and the syringe pump system. The assembly can be seen below in Figure 52.
The lid covers the entirety of the device with a slot for the syringe. This ensures the lid can remain on
the device even when the syringe is actuating, keeping the contents sterile. Within each well of the top
plate, one post is fixed and a slot is present to allow the post from the bottom plate to extend upwards
into the well, as shown in the CAD model in Figure 53 and the final 3D printed device in Figure 54. The
device was 3D printed using Objet 260 Connex Rapid Prororype machine on WPI campus. All device
features and wall thickness were accurate within 0.02032mm to 0.08382mm. The material choosen was
MED610 plastic, which is biocompatible (WPI ARC, 2013).
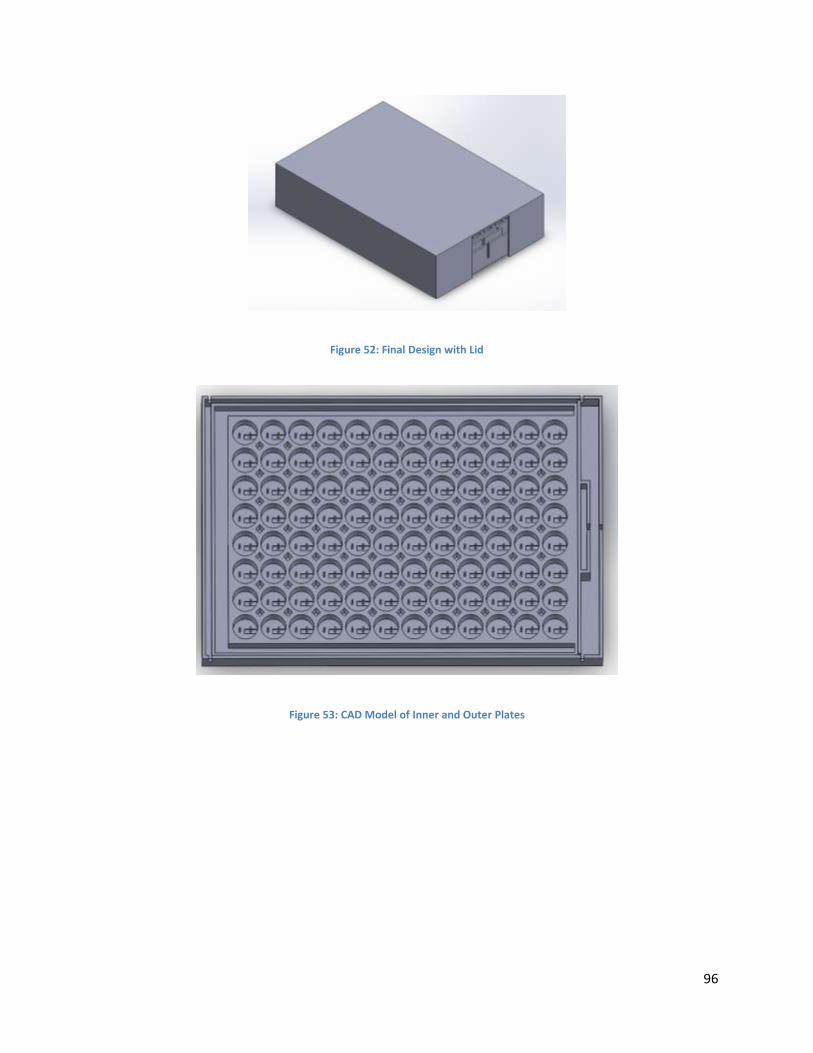
96
Figure 52: Final Design with Lid
Figure 53: CAD Model of Inner and Outer Plates
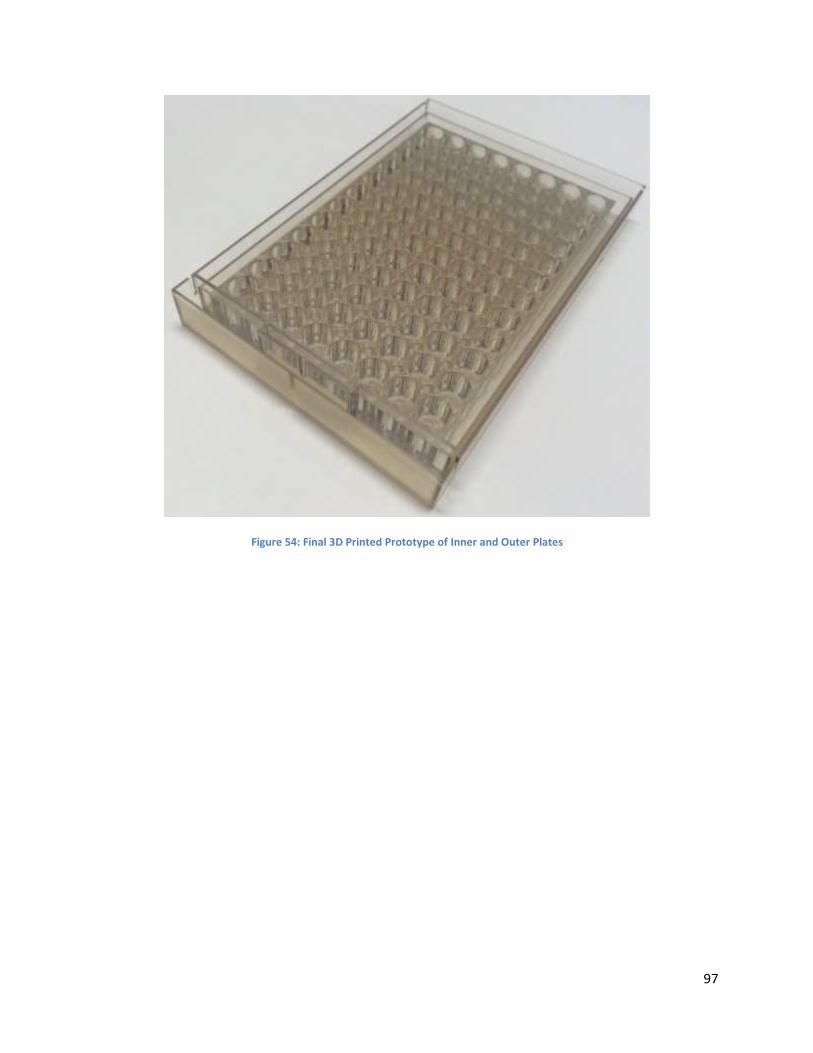
97
Figure 54: Final 3D Printed Prototype of Inner and Outer Plates
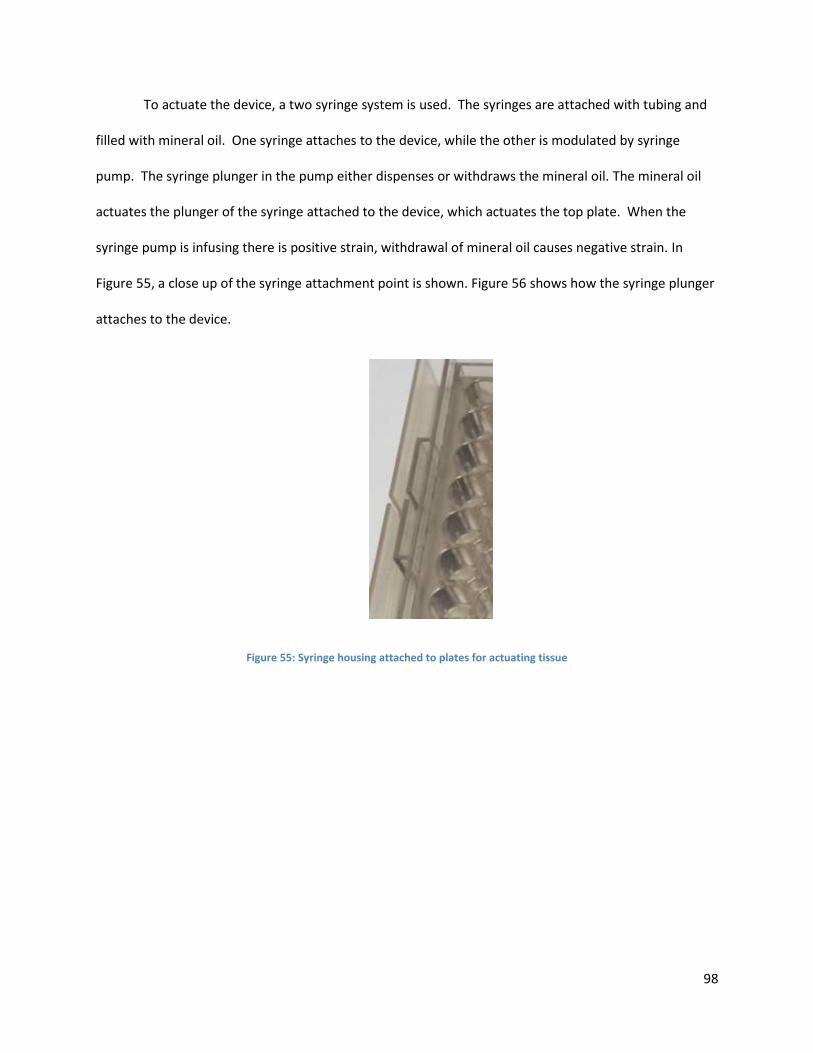
98
To actuate the device, a two syringe system is used. The syringes are attached with tubing and
filled with mineral oil. One syringe attaches to the device, while the other is modulated by syringe
pump. The syringe plunger in the pump either dispenses or withdraws the mineral oil. The mineral oil
actuates the plunger of the syringe attached to the device, which actuates the top plate. When the
syringe pump is infusing there is positive strain, withdrawal of mineral oil causes negative strain. In
Figure 55, a close up of the syringe attachment point is shown. Figure 56 shows how the syringe plunger
attaches to the device.
Figure 55: Syringe housing attached to plates for actuating tissue
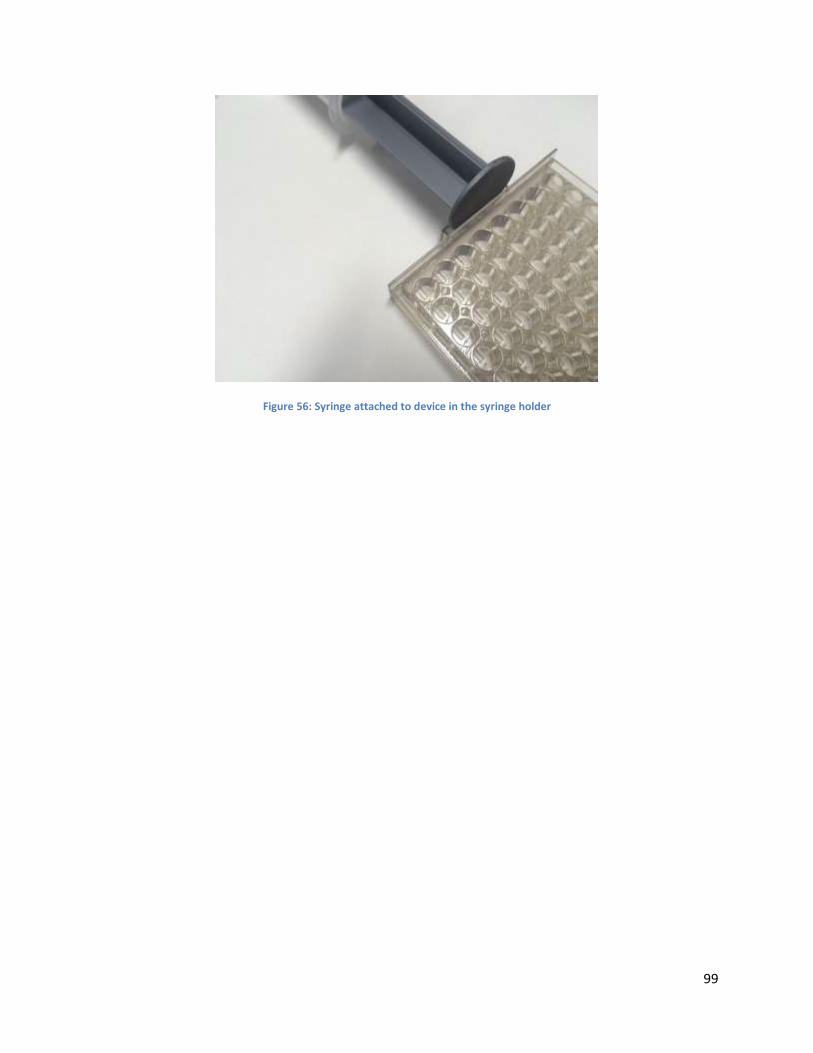
99
Figure 56: Syringe attached to device in the syringe holder
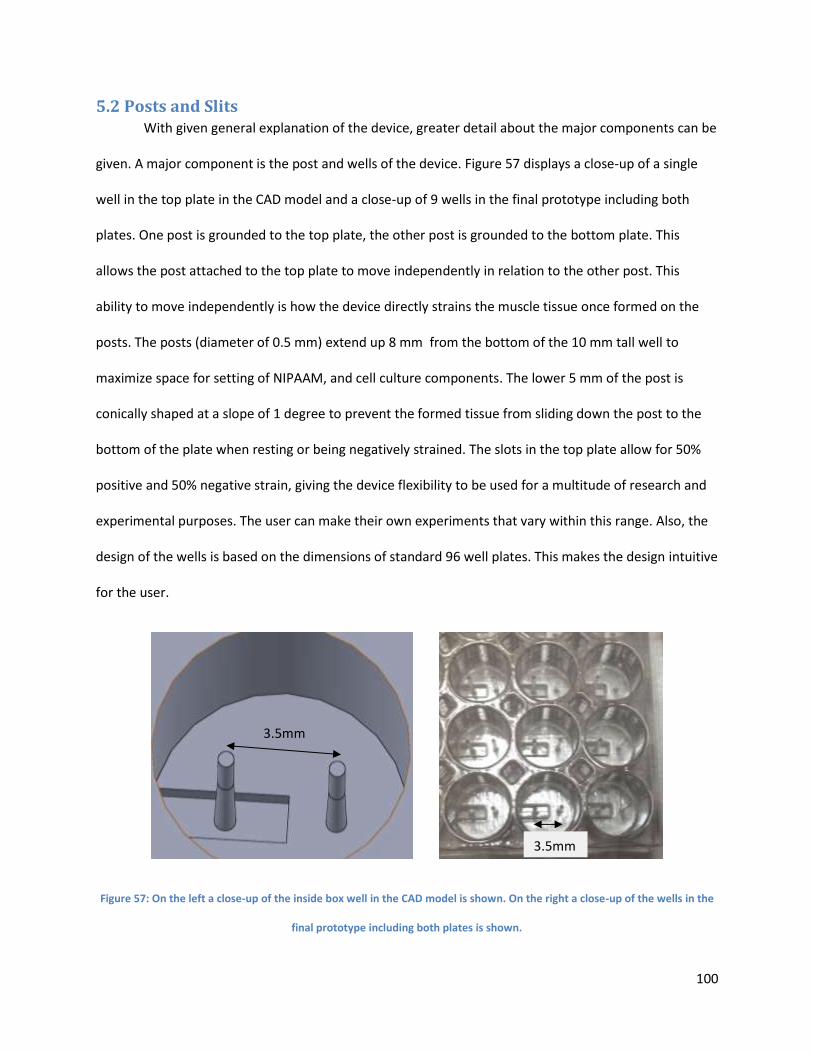
100
5.2 Posts and Slits With given general explanation of the device, greater detail about the major components can be
given. A major component is the post and wells of the device. Figure 57 displays a close-up of a single
well in the top plate in the CAD model and a close-up of 9 wells in the final prototype including both
plates. One post is grounded to the top plate, the other post is grounded to the bottom plate. This
allows the post attached to the top plate to move independently in relation to the other post. This
ability to move independently is how the device directly strains the muscle tissue once formed on the
posts. The posts (diameter of 0.5 mm) extend up 8 mm from the bottom of the 10 mm tall well to
maximize space for setting of NIPAAM, and cell culture components. The lower 5 mm of the post is
conically shaped at a slope of 1 degree to prevent the formed tissue from sliding down the post to the
bottom of the plate when resting or being negatively strained. The slots in the top plate allow for 50%
positive and 50% negative strain, giving the device flexibility to be used for a multitude of research and
experimental purposes. The user can make their own experiments that vary within this range. Also, the
design of the wells is based on the dimensions of standard 96 well plates. This makes the design intuitive
for the user.
Figure 57: On the left a close-up of the inside box well in the CAD model is shown. On the right a close-up of the wells in the
final prototype including both plates is shown.
3.5mm
3.5mm
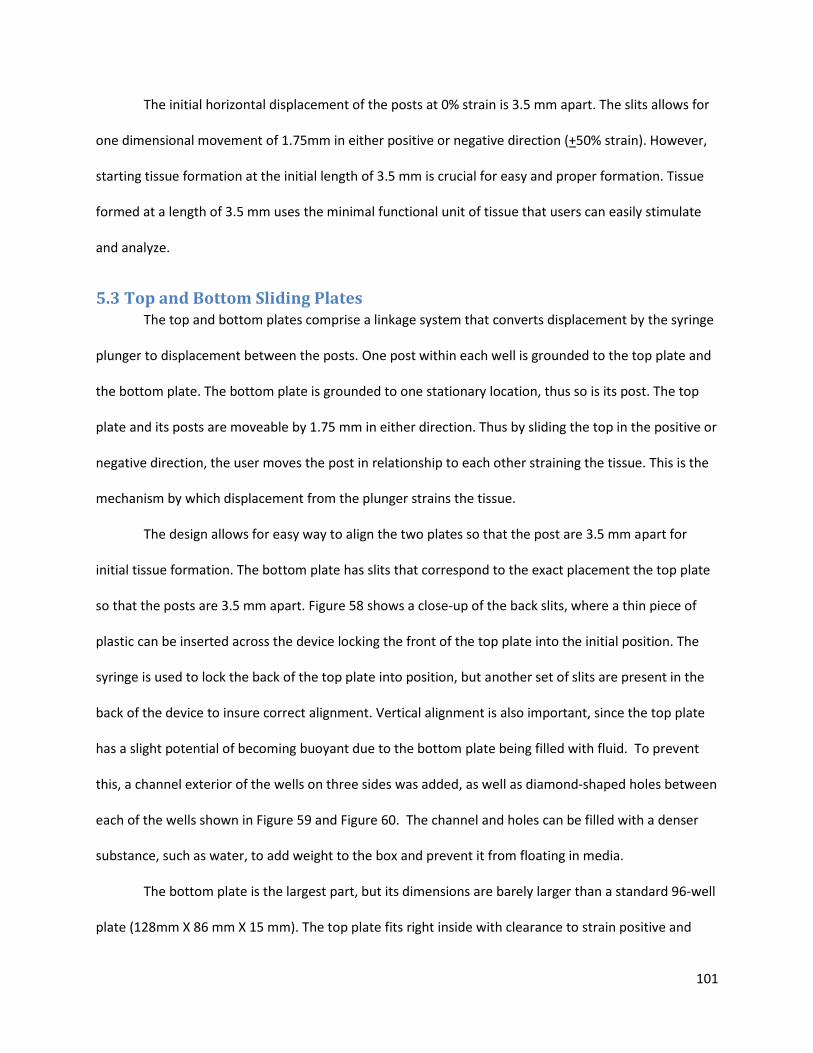
101
The initial horizontal displacement of the posts at 0% strain is 3.5 mm apart. The slits allows for
one dimensional movement of 1.75mm in either positive or negative direction (+50% strain). However,
starting tissue formation at the initial length of 3.5 mm is crucial for easy and proper formation. Tissue
formed at a length of 3.5 mm uses the minimal functional unit of tissue that users can easily stimulate
and analyze.
5.3 Top and Bottom Sliding Plates The top and bottom plates comprise a linkage system that converts displacement by the syringe
plunger to displacement between the posts. One post within each well is grounded to the top plate and
the bottom plate. The bottom plate is grounded to one stationary location, thus so is its post. The top
plate and its posts are moveable by 1.75 mm in either direction. Thus by sliding the top in the positive or
negative direction, the user moves the post in relationship to each other straining the tissue. This is the
mechanism by which displacement from the plunger strains the tissue.
The design allows for easy way to align the two plates so that the post are 3.5 mm apart for
initial tissue formation. The bottom plate has slits that correspond to the exact placement the top plate
so that the posts are 3.5 mm apart. Figure 58 shows a close-up of the back slits, where a thin piece of
plastic can be inserted across the device locking the front of the top plate into the initial position. The
syringe is used to lock the back of the top plate into position, but another set of slits are present in the
back of the device to insure correct alignment. Vertical alignment is also important, since the top plate
has a slight potential of becoming buoyant due to the bottom plate being filled with fluid. To prevent
this, a channel exterior of the wells on three sides was added, as well as diamond-shaped holes between
each of the wells shown in Figure 59 and Figure 60. The channel and holes can be filled with a denser
substance, such as water, to add weight to the box and prevent it from floating in media.
The bottom plate is the largest part, but its dimensions are barely larger than a standard 96-well
plate (128mm X 86 mm X 15 mm). The top plate fits right inside with clearance to strain positive and
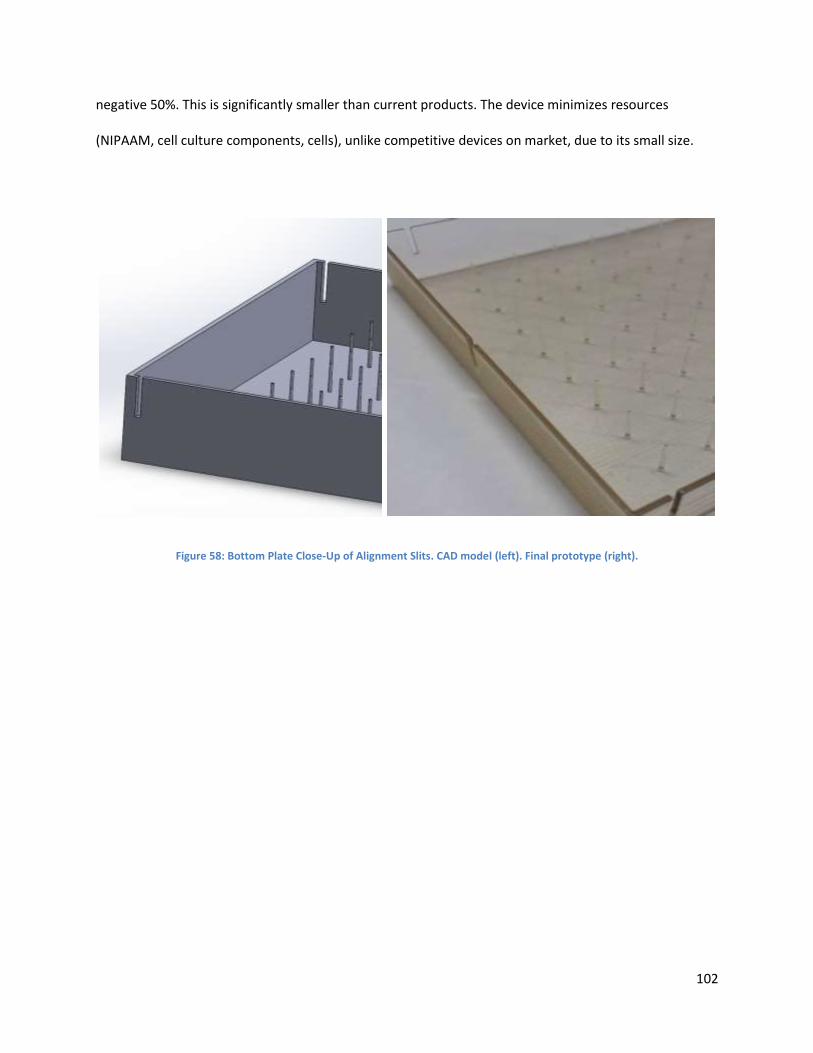
102
negative 50%. This is significantly smaller than current products. The device minimizes resources
(NIPAAM, cell culture components, cells), unlike competitive devices on market, due to its small size.
Figure 58: Bottom Plate Close-Up of Alignment Slits. CAD model (left). Final prototype (right).
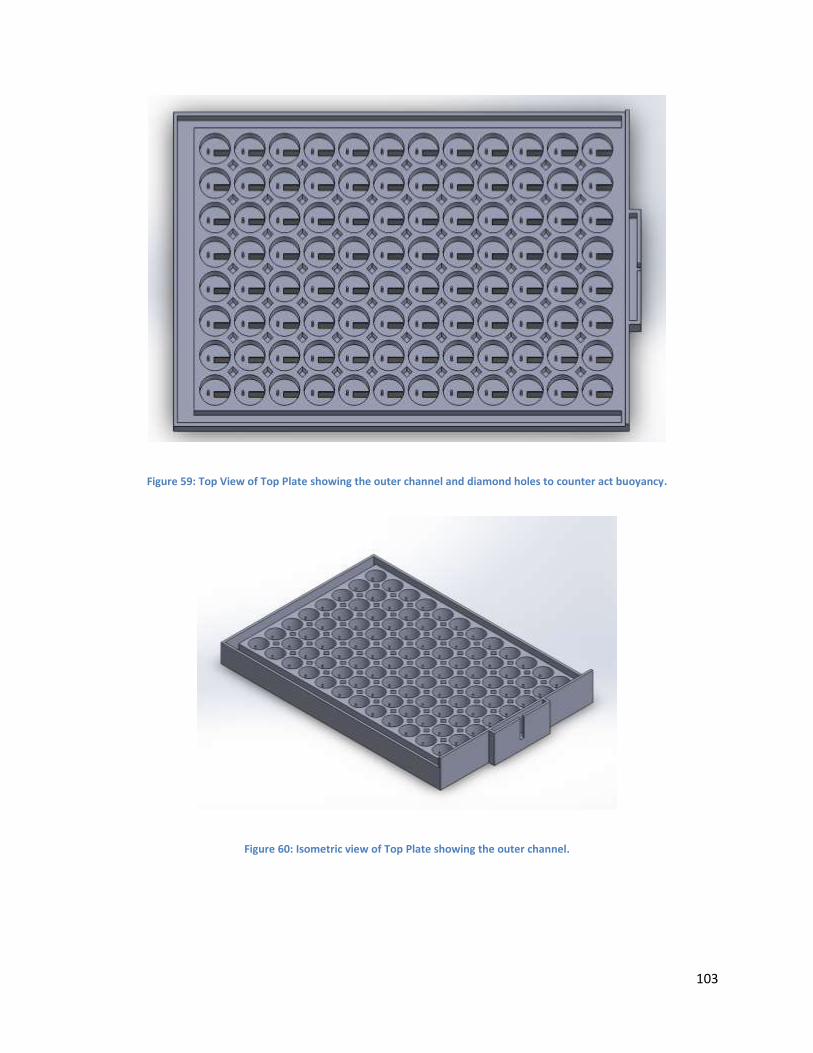
103
Figure 59: Top View of Top Plate showing the outer channel and diamond holes to counter act buoyancy.
Figure 60: Isometric view of Top Plate showing the outer channel.
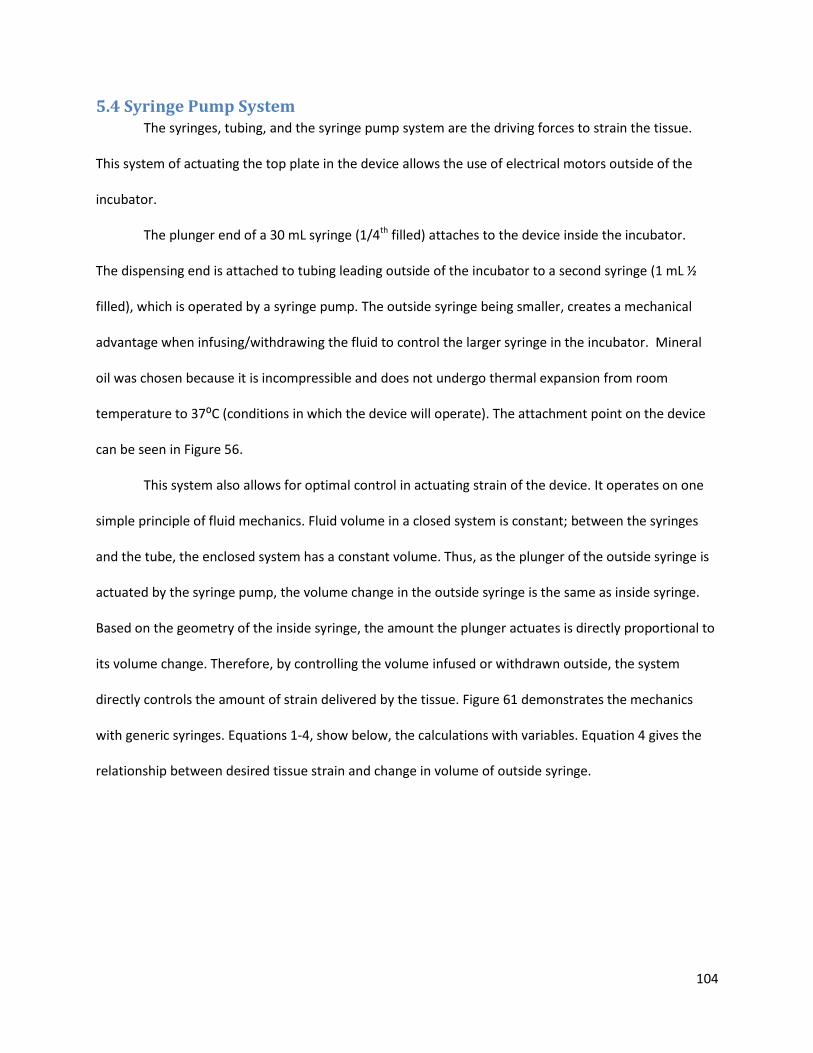
104
5.4 Syringe Pump System The syringes, tubing, and the syringe pump system are the driving forces to strain the tissue.
This system of actuating the top plate in the device allows the use of electrical motors outside of the
incubator.
The plunger end of a 30 mL syringe (1/4th filled) attaches to the device inside the incubator.
The dispensing end is attached to tubing leading outside of the incubator to a second syringe (1 mL ½
filled), which is operated by a syringe pump. The outside syringe being smaller, creates a mechanical
advantage when infusing/withdrawing the fluid to control the larger syringe in the incubator. Mineral
oil was chosen because it is incompressible and does not undergo thermal expansion from room
temperature to 37⁰C (conditions in which the device will operate). The attachment point on the device
can be seen in Figure 56.
This system also allows for optimal control in actuating strain of the device. It operates on one
simple principle of fluid mechanics. Fluid volume in a closed system is constant; between the syringes
and the tube, the enclosed system has a constant volume. Thus, as the plunger of the outside syringe is
actuated by the syringe pump, the volume change in the outside syringe is the same as inside syringe.
Based on the geometry of the inside syringe, the amount the plunger actuates is directly proportional to
its volume change. Therefore, by controlling the volume infused or withdrawn outside, the system
directly controls the amount of strain delivered by the tissue. Figure 61 demonstrates the mechanics
with generic syringes. Equations 1-4, show below, the calculations with variables. Equation 4 gives the
relationship between desired tissue strain and change in volume of outside syringe.
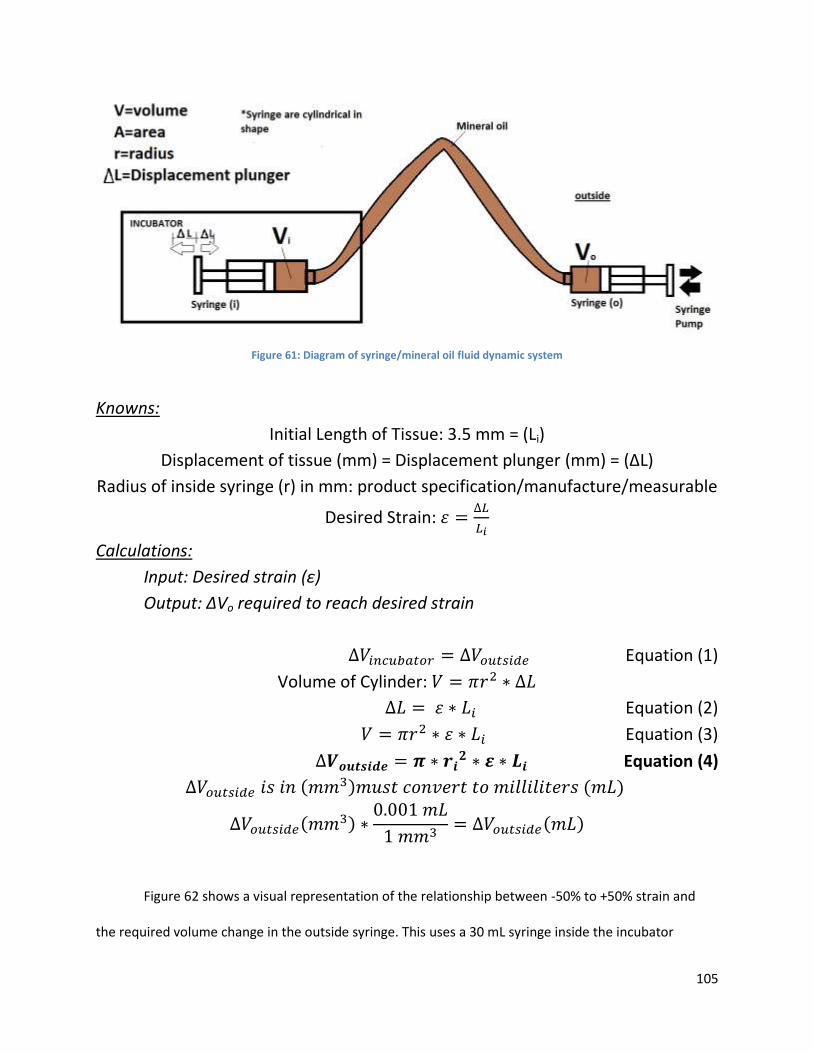
105
Figure 61: Diagram of syringe/mineral oil fluid dynamic system
Knowns:
Initial Length of Tissue: 3.5 mm = (Li)
Displacement of tissue (mm) = Displacement plunger (mm) = (∆L)
Radius of inside syringe (r) in mm: product specification/manufacture/measurable
Desired Strain: 𝜀 =∆𝐿
𝐿𝑖
Calculations:
Input: Desired strain (ε)
Output: ∆Vo required to reach desired strain
∆𝑉𝑖𝑛𝑐𝑢𝑏𝑎𝑡𝑜𝑟 = ∆𝑉𝑜𝑢𝑡𝑠𝑖𝑑𝑒 Equation (1)
Volume of Cylinder: 𝑉 = 𝜋𝑟2 ∗ ∆𝐿
∆𝐿 = 𝜀 ∗ 𝐿𝑖 Equation (2)
𝑉 = 𝜋𝑟2 ∗ 𝜀 ∗ 𝐿𝑖 Equation (3)
∆𝑽𝒐𝒖𝒕𝒔𝒊𝒅𝒆 = 𝝅 ∗ 𝒓𝒊𝟐 ∗ 𝜺 ∗ 𝑳𝒊 Equation (4)
∆𝑉𝑜𝑢𝑡𝑠𝑖𝑑𝑒 𝑖𝑠 𝑖𝑛 (𝑚𝑚3)𝑚𝑢𝑠𝑡 𝑐𝑜𝑛𝑣𝑒𝑟𝑡 𝑡𝑜 𝑚𝑖𝑙𝑙𝑖𝑙𝑖𝑡𝑒𝑟𝑠 (𝑚𝐿)
∆𝑉𝑜𝑢𝑡𝑠𝑖𝑑𝑒(𝑚𝑚3) ∗0.001 𝑚𝐿
1 𝑚𝑚3= ∆𝑉𝑜𝑢𝑡𝑠𝑖𝑑𝑒(𝑚𝐿)
Figure 62 shows a visual representation of the relationship between -50% to +50% strain and
the required volume change in the outside syringe. This uses a 30 mL syringe inside the incubator
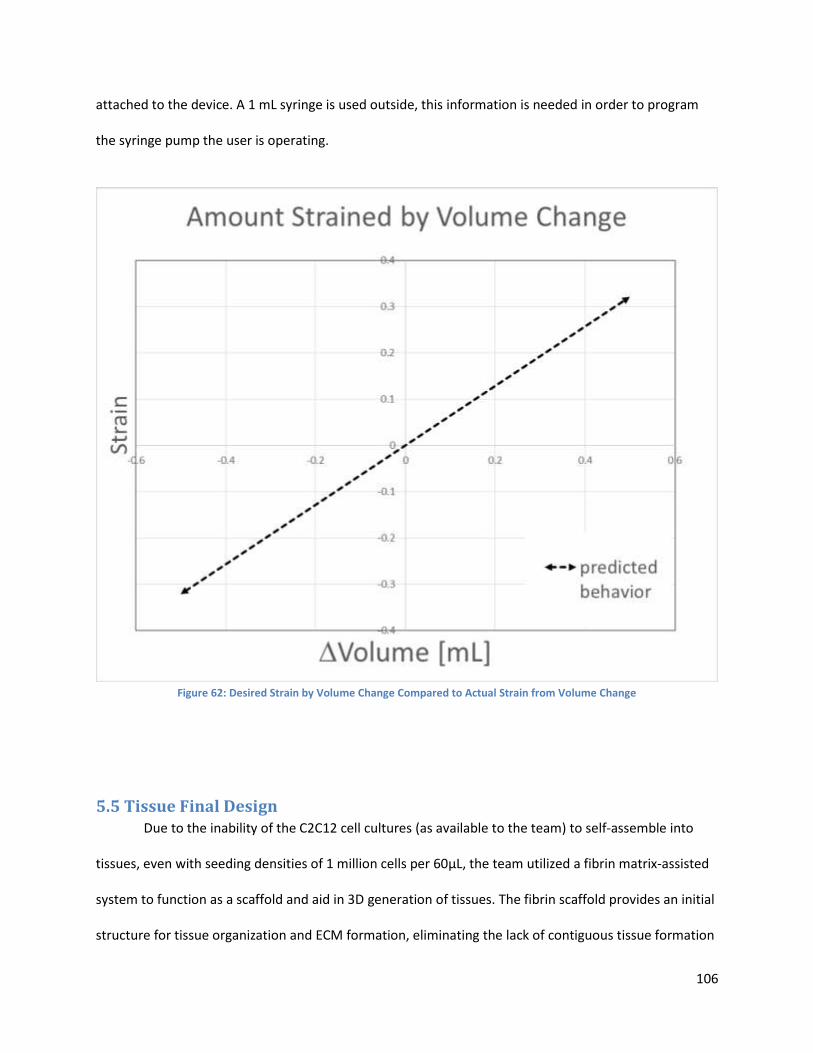
106
attached to the device. A 1 mL syringe is used outside, this information is needed in order to program
the syringe pump the user is operating.
Figure 62: Desired Strain by Volume Change Compared to Actual Strain from Volume Change
5.5 Tissue Final Design Due to the inability of the C2C12 cell cultures (as available to the team) to self-assemble into
tissues, even with seeding densities of 1 million cells per 60μL, the team utilized a fibrin matrix-assisted
system to function as a scaffold and aid in 3D generation of tissues. The fibrin scaffold provides an initial
structure for tissue organization and ECM formation, eliminating the lack of contiguous tissue formation
107
in the team’s previous attempts at self-assembly. In literature, compared to self-assembly under similar
conditions, the use of such a scaffold has proven to generate tissue more rapidly from pure myoblast
cultures (Huang et al, 2005).
The finalized methodology for tissue culture within the device resembles that used by
Vandenburgh et al (1988), and more recently, Huang et al (2005). Vandenburgh et al (1988) pioneered
the technique of seeding a cell suspension within a gel mixture, embedding primary myoblasts in a
collagen matrix via a simple gelation process. Though Vandenburgh et al (1988) used collagen gels,
recent studies have generated in vitro tissue from myoblasts with a similar “cell-in-gel” technique using
fibrin gels. Huang et al (2005) showed that seeding primary myoblasts in a fibrin gel mixture produced
completely-formed tissue in 10 days. Additionally, the tissue/gel constructs formed remained intact for
6 weeks in culture.
Fibrin gels act as provisional matrices, providing an initial structure for cells to freely migrate
and proliferate, while also stimulating cells to produce their own ECM and partially replace the gel (Ross
and Tranquillo, 2003) (Huang et al, 2005). Fibrin is known to strongly bind to several key stimulatory
factors involved in myogenesis—including FGF-2, VEGF, and IGF-binding protein 3 (Huang et al, 2005).
Fibrin gel is produced via the simple combination of two components—fibrinogen and thrombin. To
achieve homogenous seeding of cells within the fibrin gel, the team suspended cells within a thrombin
solution, and then subsequently added fibrinogen to the suspension to induce the gelation process.
Unlike previous methods as described above, the fibrin gel in this project’s procedure acts to
assist self-assembly: over time, the tissue/gel constructs contract from a disc-like shape conforming to
the surrounding well into a tubular dogbone shape stretched between two posts. This is a result of
passive contraction of cells on one another and around the posts—which facilitate tissue organization
solely around those two anchorage points. Such anchorage mimics myotendinous attachment to bone,
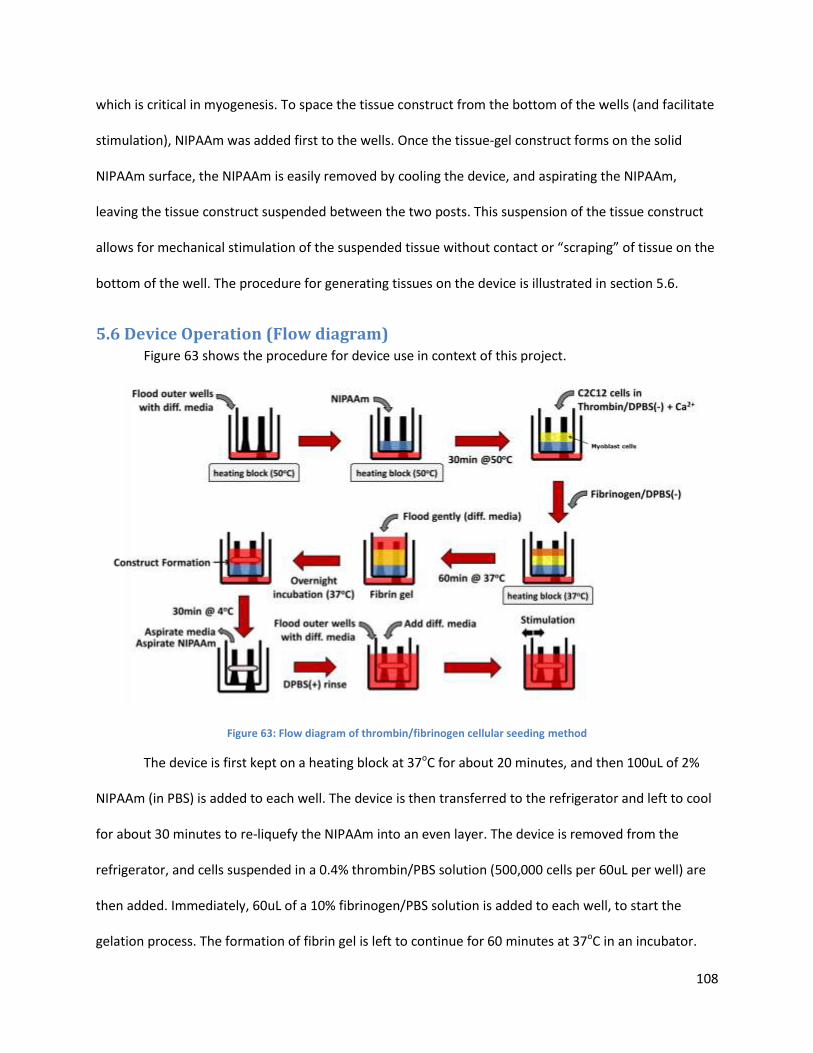
108
which is critical in myogenesis. To space the tissue construct from the bottom of the wells (and facilitate
stimulation), NIPAAm was added first to the wells. Once the tissue-gel construct forms on the solid
NIPAAm surface, the NIPAAm is easily removed by cooling the device, and aspirating the NIPAAm,
leaving the tissue construct suspended between the two posts. This suspension of the tissue construct
allows for mechanical stimulation of the suspended tissue without contact or “scraping” of tissue on the
bottom of the well. The procedure for generating tissues on the device is illustrated in section 5.6.
5.6 Device Operation (Flow diagram) Figure 63 shows the procedure for device use in context of this project.
Figure 63: Flow diagram of thrombin/fibrinogen cellular seeding method
The device is first kept on a heating block at 37oC for about 20 minutes, and then 100uL of 2%
NIPAAm (in PBS) is added to each well. The device is then transferred to the refrigerator and left to cool
for about 30 minutes to re-liquefy the NIPAAm into an even layer. The device is removed from the
refrigerator, and cells suspended in a 0.4% thrombin/PBS solution (500,000 cells per 60uL per well) are
then added. Immediately, 60uL of a 10% fibrinogen/PBS solution is added to each well, to start the
gelation process. The formation of fibrin gel is left to continue for 60 minutes at 37oC in an incubator.
109
The wells are each gently flooded with differentiation media to submerge the tops of the posts, and the
device is incubated overnight (~16 hours) in the 37oC incubator. Overnight, the cells within the gel begin
contracting, and a translucent, early construct is visible the next morning. The device is then cooled in
the refrigerator at 4oC for 30 minutes to liquefy the NIPAAm, and then both NIPAAm and media are
aspirated out gently, without disturbing the construct. 200uL of differentiation media is then added to
each well, setting the stage for the next phase of device operation: mechanical stimulation. Media is
replaced every 48 hours, to maximize stable tissue formation and minimize necrosis.
5.7 Limitations The final design accomplished many of the objectives, set out originally for the project. However
due to time constraints and allowed budget, not all objectives were covered.
Time constrained the team’s ability to master the cell culture techniques to make this device
more user-friendly. The device was intended to use self-assembly culture techniques, bypassing the
need to grow tissue in separate molds and transferring tissues. Self-assembled culture is a proven
technique, however it can be difficult to master. Therefore, the team found a provisional matrix gel
technique that achieves the same effect. Also, little time was left for the team to execute electrical
based tests and further detail design, than what is already shown in the alternative designs section in
chapter 4. This resulted in a purely mechanical stimulation device.
The budget and available resources was another limiting factor to the final design. When dealing
with biological material, the device is limited to materials that are not cytotoxic. Non-cytotoxic materials
tend to be more expensive. Being restricted by the budget, outsourcing for special manufacturing
processes was not possible. Restricted to on campus manufacturing resources, the Objet 3D printer was
the only resource to manufacture the device. However, when using biocompatible plastics (MED610),
the Objet 3D printer cannot use other plastics without compromising the biocompatibility factor of
MED610. This restricted the design to one rigid material. This impeded on the ability to use flexible
110
PDMS posts, which would have allowed the device to measure force of tissue contraction based on post
deflection. These limitations should be examined in future works to improve the final design.
Chapter 6: Device Verification Testing (DVT) This chapter compiles the experiments for validating the device and the device function. In all
these biological validation experiments (cytotoxicity and tissue-culture), growth media was used to
expand C2C12 cells in 2D culture, and then differentiation media was used to stimulate cell
differentiation and nourish tissues. These media formulations were prepared as follows:
Growth Media (per 100mL)
o 88mL Dulbecco’s Modified Eagle Medium, 10mL Fetal Bovine Serum, 1mL
Glutamax supplement, 1mL penicillin/streptomycin
Cell Differentiation Media (per 100mL)
o 95mL Dulbecco’s Modified Eagle Medium, 2mL Adult Horse Serum, 1mL insulin-
transferrin-selenium supplement, 1mL penicillin/streptomycin
Tissue Culture Differentiation Media (per 100mL)
o 89mL Dulbecco’s Modified Eagle Medium, 2mL Adult Horse Serum, 1mL insulin-
transferrin-selenium supplement, 1mL penicillin/streptomycin, 5mL aprotinin,
1mL tranexamic acid
6.1 Cytotoxicity test To validate the compatibility of the device materials with cell differentiation, a cytotoxicity test
for leachates was conducted. C2C12 cells were seeded (in 2D) on eight experimental wells and two
control wells, at a density of 500,000 cells per well. The control group was incubated in differentiation
media untouched by device materials (i.e. in contact with only tissue-culture polystyrene). Cells in the
experimental group were cultured in differentiation media pre-incubated with a device material:
111
polypropylene pre-incubated for first four wells, 3D-printing resin (MED610) pre-incubated for the
second four wells. A sterilized piece of polypropylene and a sterilized piece of MED 610 were each
separately placed in a vial of differentiation media, and allowed to leach into the differentiation media
for several days. The pre-incubated media was then aliquoted from each vial into the experimental
wells, such that there were samples pre-incubated with each material after 1, 2, 4, and 6 days. The cells
were placed in the incubator for 7 days, at the end of which a Trypan Blue stain—which selectively
stains only dead cells—was added to visualize cell death in the wells. The wells were imaged via phase
contrast microscopy at 10x magnification, and the percent of live cells out of total cells was determined
in each image frame. This percent-viability data was then graphed for each well, as shown in Figure 64.
Viability of cells cultured in media incubated for 1, 2, 4, and 6 days in polystyrene, polypropylene, or
MED610.
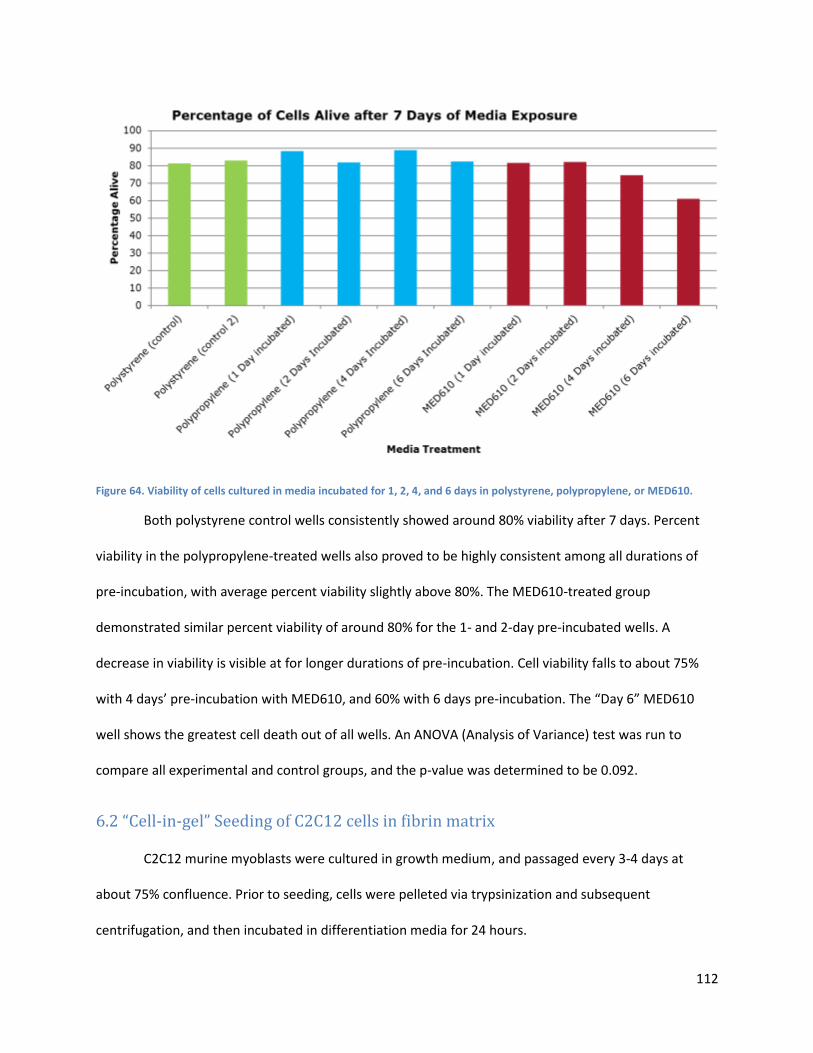
112
Figure 64. Viability of cells cultured in media incubated for 1, 2, 4, and 6 days in polystyrene, polypropylene, or MED610.
Both polystyrene control wells consistently showed around 80% viability after 7 days. Percent
viability in the polypropylene-treated wells also proved to be highly consistent among all durations of
pre-incubation, with average percent viability slightly above 80%. The MED610-treated group
demonstrated similar percent viability of around 80% for the 1- and 2-day pre-incubated wells. A
decrease in viability is visible at for longer durations of pre-incubation. Cell viability falls to about 75%
with 4 days’ pre-incubation with MED610, and 60% with 6 days pre-incubation. The “Day 6” MED610
well shows the greatest cell death out of all wells. An ANOVA (Analysis of Variance) test was run to
compare all experimental and control groups, and the p-value was determined to be 0.092.
6.2 “Cell-in-gel” Seeding of C2C12 cells in fibrin matrix
C2C12 murine myoblasts were cultured in growth medium, and passaged every 3-4 days at
about 75% confluence. Prior to seeding, cells were pelleted via trypsinization and subsequent
centrifugation, and then incubated in differentiation media for 24 hours.
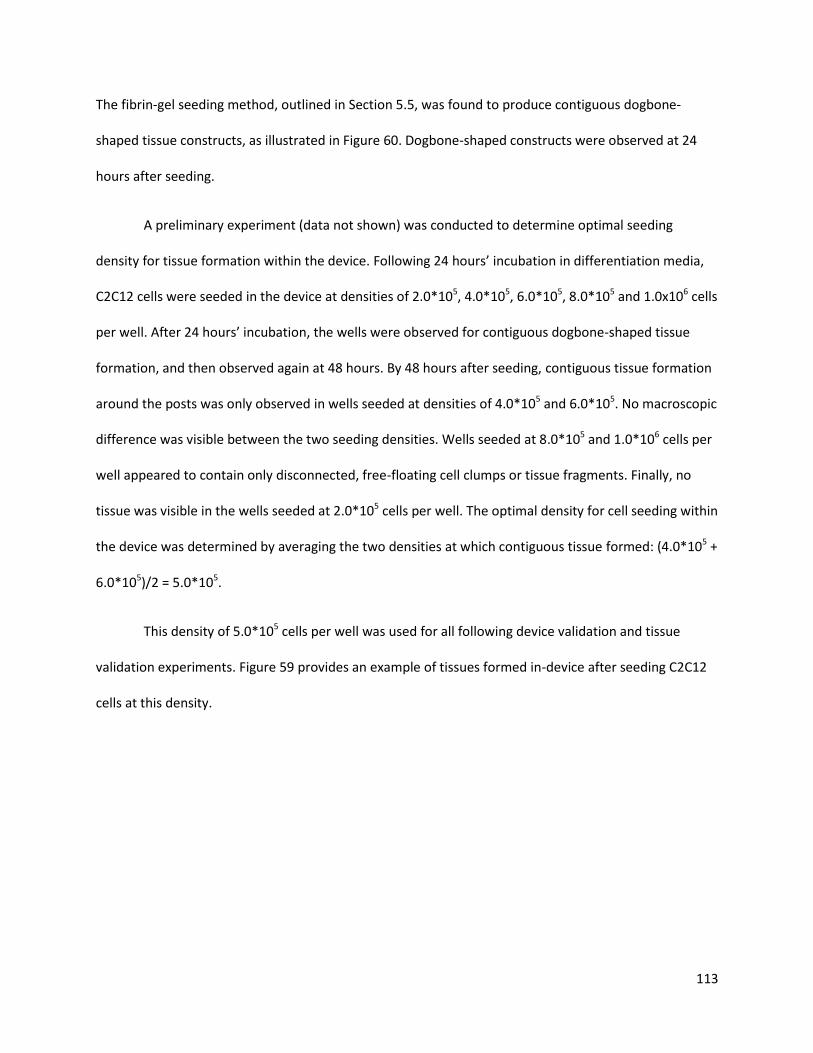
113
The fibrin-gel seeding method, outlined in Section 5.5, was found to produce contiguous dogbone-
shaped tissue constructs, as illustrated in Figure 60. Dogbone-shaped constructs were observed at 24
hours after seeding.
A preliminary experiment (data not shown) was conducted to determine optimal seeding
density for tissue formation within the device. Following 24 hours’ incubation in differentiation media,
C2C12 cells were seeded in the device at densities of 2.0*105, 4.0*105, 6.0*105, 8.0*105 and 1.0x10⁶ cells
per well. After 24 hours’ incubation, the wells were observed for contiguous dogbone-shaped tissue
formation, and then observed again at 48 hours. By 48 hours after seeding, contiguous tissue formation
around the posts was only observed in wells seeded at densities of 4.0*105 and 6.0*105. No macroscopic
difference was visible between the two seeding densities. Wells seeded at 8.0*105 and 1.0*106 cells per
well appeared to contain only disconnected, free-floating cell clumps or tissue fragments. Finally, no
tissue was visible in the wells seeded at 2.0*105 cells per well. The optimal density for cell seeding within
the device was determined by averaging the two densities at which contiguous tissue formed: (4.0*105 +
6.0*105)/2 = 5.0*105.
This density of 5.0*105 cells per well was used for all following device validation and tissue
validation experiments. Figure 59 provides an example of tissues formed in-device after seeding C2C12
cells at this density.
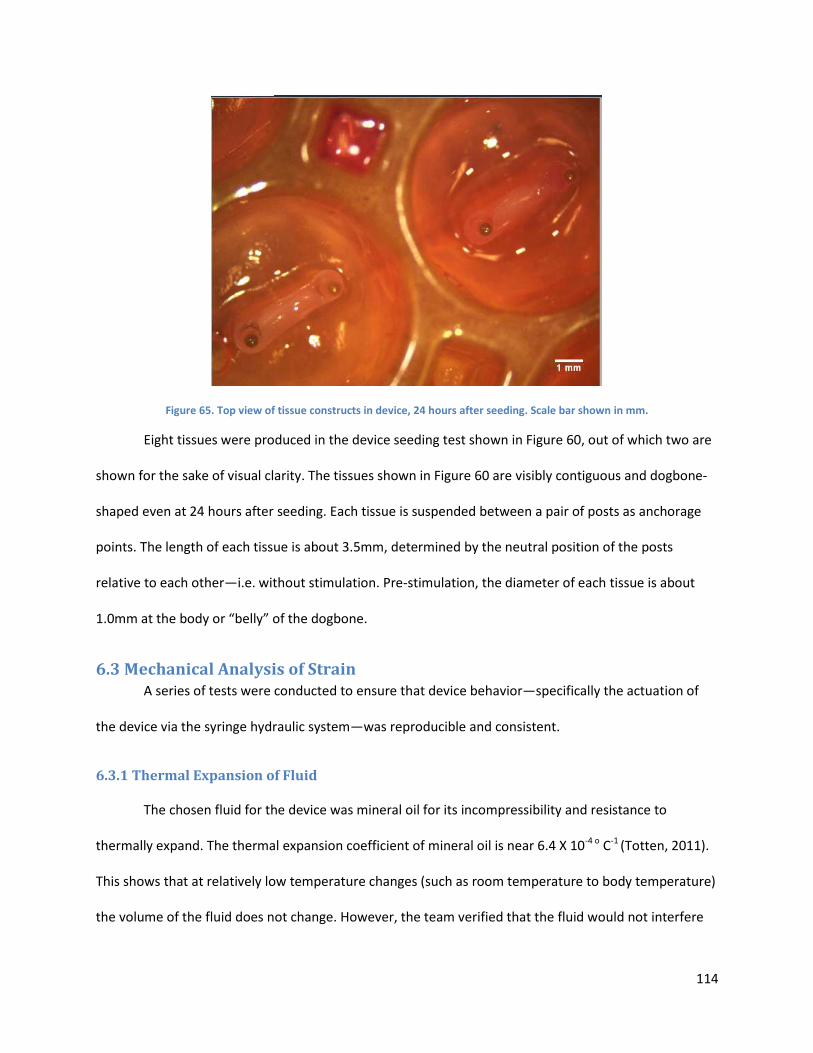
114
Figure 65. Top view of tissue constructs in device, 24 hours after seeding. Scale bar shown in mm.
Eight tissues were produced in the device seeding test shown in Figure 60, out of which two are
shown for the sake of visual clarity. The tissues shown in Figure 60 are visibly contiguous and dogbone-
shaped even at 24 hours after seeding. Each tissue is suspended between a pair of posts as anchorage
points. The length of each tissue is about 3.5mm, determined by the neutral position of the posts
relative to each other—i.e. without stimulation. Pre-stimulation, the diameter of each tissue is about
1.0mm at the body or “belly” of the dogbone.
6.3 Mechanical Analysis of Strain A series of tests were conducted to ensure that device behavior—specifically the actuation of
the device via the syringe hydraulic system—was reproducible and consistent.
6.3.1 Thermal Expansion of Fluid
The chosen fluid for the device was mineral oil for its incompressibility and resistance to
thermally expand. The thermal expansion coefficient of mineral oil is near 6.4 X 10⁻⁴ o C-1 (Totten, 2011).
This shows that at relatively low temperature changes (such as room temperature to body temperature)
the volume of the fluid does not change. However, the team verified that the fluid would not interfere
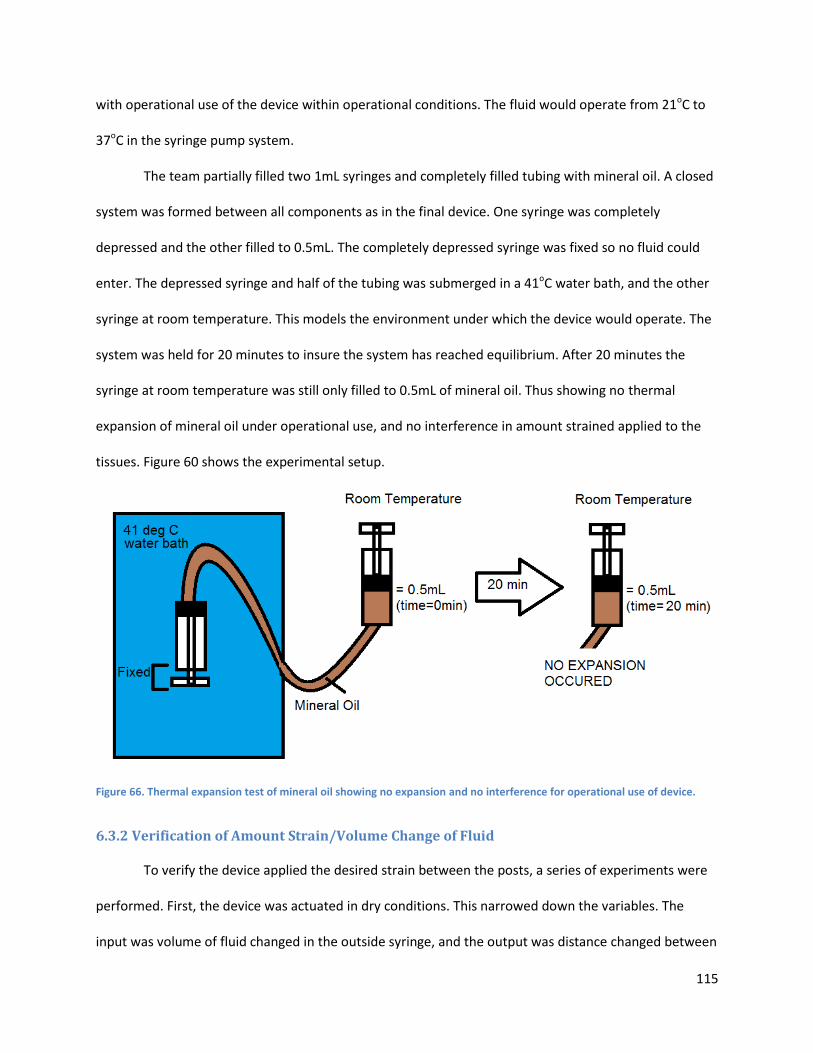
115
with operational use of the device within operational conditions. The fluid would operate from 21oC to
37oC in the syringe pump system.
The team partially filled two 1mL syringes and completely filled tubing with mineral oil. A closed
system was formed between all components as in the final device. One syringe was completely
depressed and the other filled to 0.5mL. The completely depressed syringe was fixed so no fluid could
enter. The depressed syringe and half of the tubing was submerged in a 41oC water bath, and the other
syringe at room temperature. This models the environment under which the device would operate. The
system was held for 20 minutes to insure the system has reached equilibrium. After 20 minutes the
syringe at room temperature was still only filled to 0.5mL of mineral oil. Thus showing no thermal
expansion of mineral oil under operational use, and no interference in amount strained applied to the
tissues. Figure 60 shows the experimental setup.
Figure 66. Thermal expansion test of mineral oil showing no expansion and no interference for operational use of device.
6.3.2 Verification of Amount Strain/Volume Change of Fluid
To verify the device applied the desired strain between the posts, a series of experiments were
performed. First, the device was actuated in dry conditions. This narrowed down the variables. The
input was volume of fluid changed in the outside syringe, and the output was distance changed between
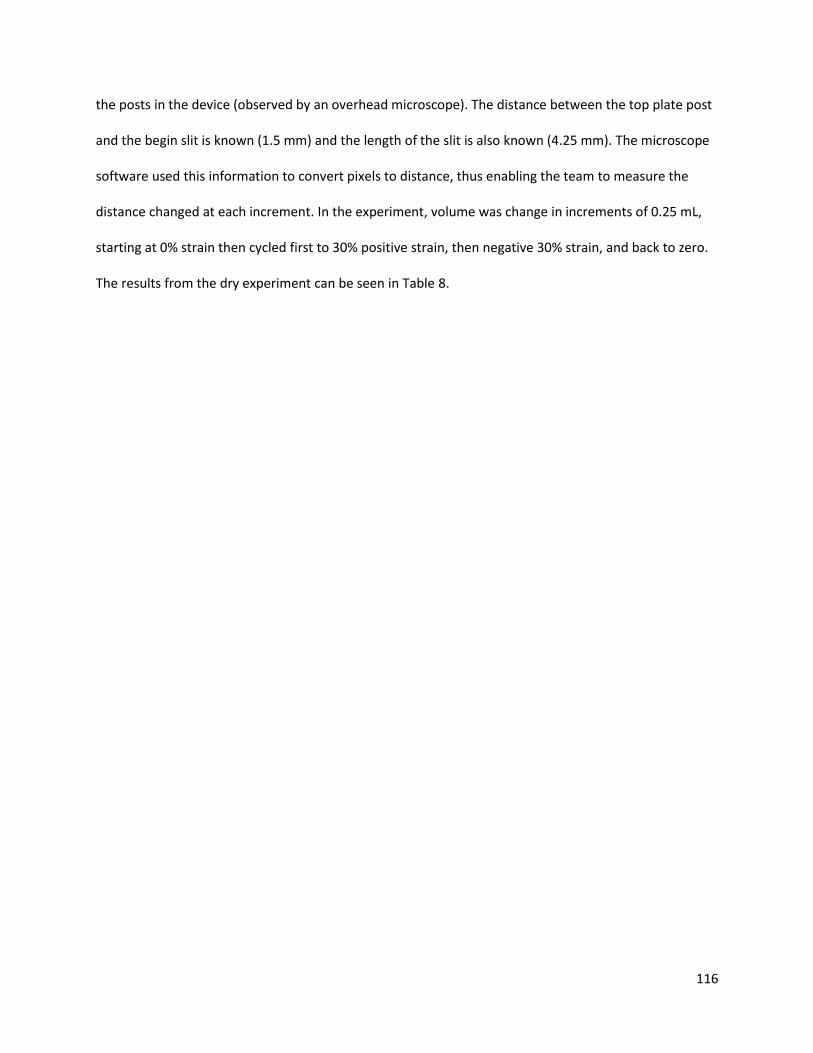
116
the posts in the device (observed by an overhead microscope). The distance between the top plate post
and the begin slit is known (1.5 mm) and the length of the slit is also known (4.25 mm). The microscope
software used this information to convert pixels to distance, thus enabling the team to measure the
distance changed at each increment. In the experiment, volume was change in increments of 0.25 mL,
starting at 0% strain then cycled first to 30% positive strain, then negative 30% strain, and back to zero.
The results from the dry experiment can be seen in Table 8.
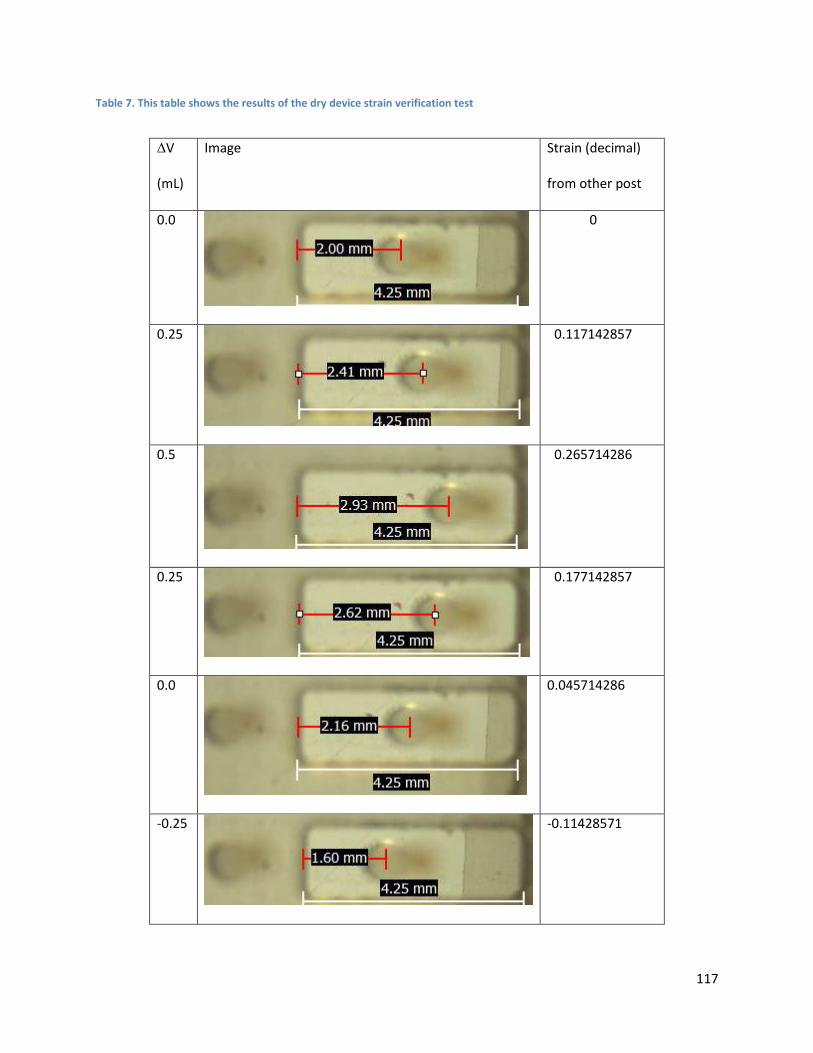
117
Table 7. This table shows the results of the dry device strain verification test
∆V
(mL)
Image Strain (decimal)
from other post
0.0
0
0.25
0.117142857
0.5
0.265714286
0.25
0.177142857
0.0
0.045714286
-0.25
-0.11428571
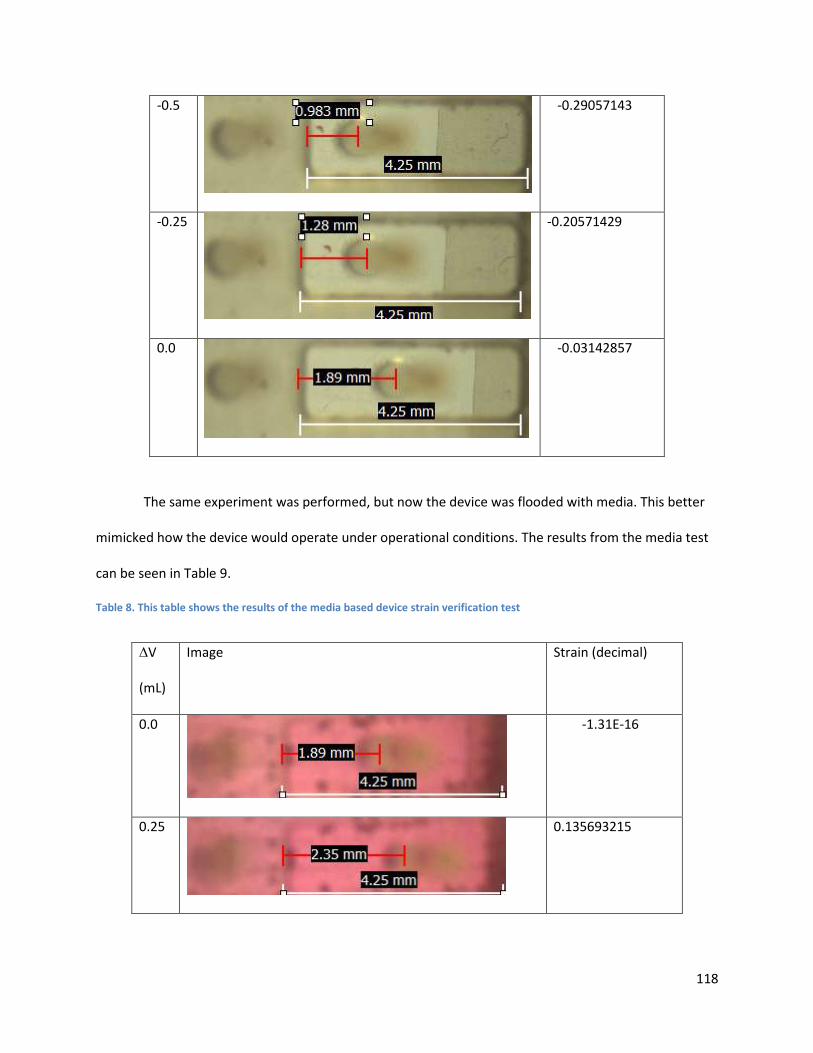
118
-0.5
-0.29057143
-0.25
-0.20571429
0.0
-0.03142857
The same experiment was performed, but now the device was flooded with media. This better
mimicked how the device would operate under operational conditions. The results from the media test
can be seen in Table 9.
Table 8. This table shows the results of the media based device strain verification test
∆V
(mL)
Image Strain (decimal)
0.0
-1.31E-16
0.25
0.135693215
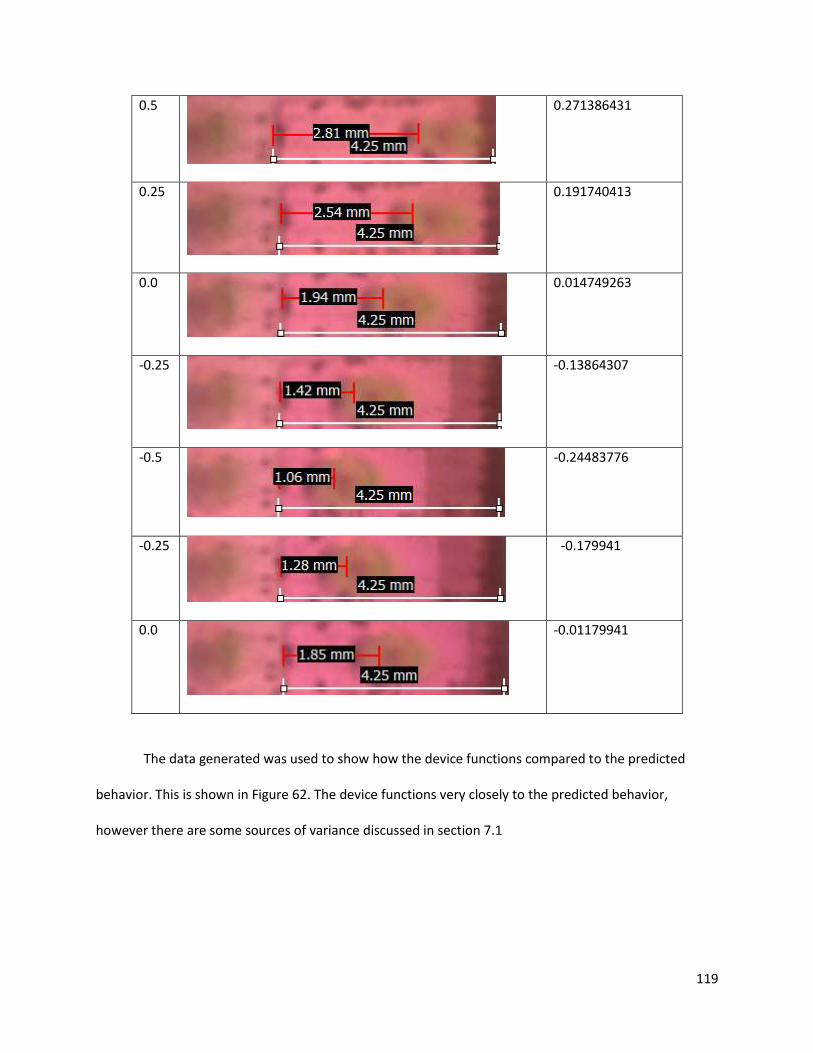
119
0.5
0.271386431
0.25
0.191740413
0.0
0.014749263
-0.25
-0.13864307
-0.5
-0.24483776
-0.25
-0.179941
0.0
-0.01179941
The data generated was used to show how the device functions compared to the predicted
behavior. This is shown in Figure 62. The device functions very closely to the predicted behavior,
however there are some sources of variance discussed in section 7.1
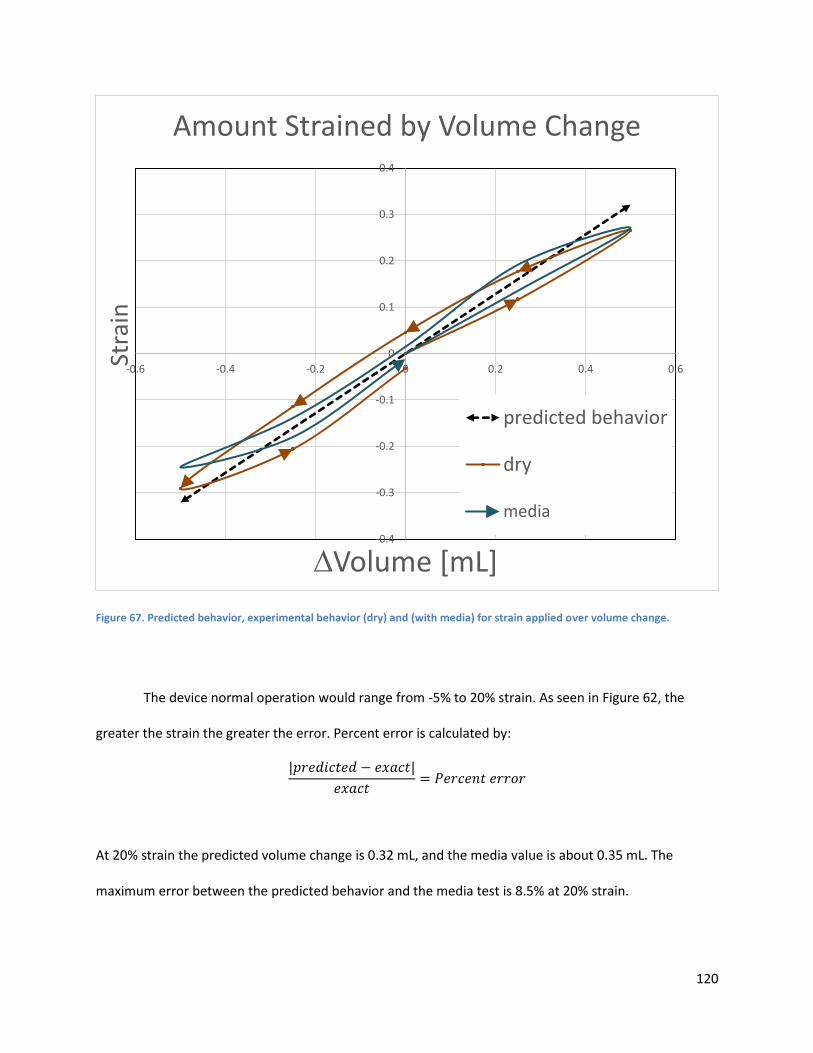
120
Figure 67. Predicted behavior, experimental behavior (dry) and (with media) for strain applied over volume change.
The device normal operation would range from -5% to 20% strain. As seen in Figure 62, the
greater the strain the greater the error. Percent error is calculated by:
|𝑝𝑟𝑒𝑑𝑖𝑐𝑡𝑒𝑑 − 𝑒𝑥𝑎𝑐𝑡|
𝑒𝑥𝑎𝑐𝑡= 𝑃𝑒𝑟𝑐𝑒𝑛𝑡 𝑒𝑟𝑟𝑜𝑟
At 20% strain the predicted volume change is 0.32 mL, and the media value is about 0.35 mL. The
maximum error between the predicted behavior and the media test is 8.5% at 20% strain.
-0.4
-0.3
-0.2
-0.1
0
0.1
0.2
0.3
0.4
-0.6 -0.4 -0.2 0 0.2 0.4 0.6
Stra
in
∆Volume [mL]
Amount Strained by Volume Change
predicted behavior
dry
media
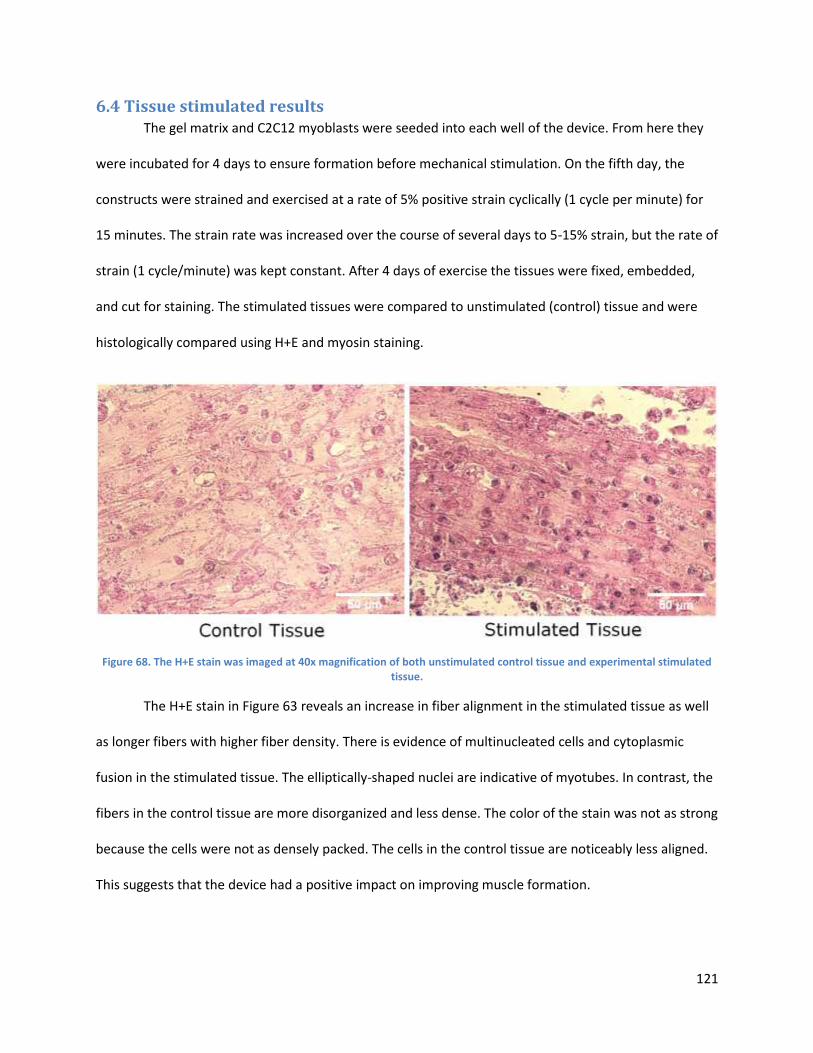
121
6.4 Tissue stimulated results The gel matrix and C2C12 myoblasts were seeded into each well of the device. From here they
were incubated for 4 days to ensure formation before mechanical stimulation. On the fifth day, the
constructs were strained and exercised at a rate of 5% positive strain cyclically (1 cycle per minute) for
15 minutes. The strain rate was increased over the course of several days to 5-15% strain, but the rate of
strain (1 cycle/minute) was kept constant. After 4 days of exercise the tissues were fixed, embedded,
and cut for staining. The stimulated tissues were compared to unstimulated (control) tissue and were
histologically compared using H+E and myosin staining.
Figure 68. The H+E stain was imaged at 40x magnification of both unstimulated control tissue and experimental stimulated tissue.
The H+E stain in Figure 63 reveals an increase in fiber alignment in the stimulated tissue as well
as longer fibers with higher fiber density. There is evidence of multinucleated cells and cytoplasmic
fusion in the stimulated tissue. The elliptically-shaped nuclei are indicative of myotubes. In contrast, the
fibers in the control tissue are more disorganized and less dense. The color of the stain was not as strong
because the cells were not as densely packed. The cells in the control tissue are noticeably less aligned.
This suggests that the device had a positive impact on improving muscle formation.
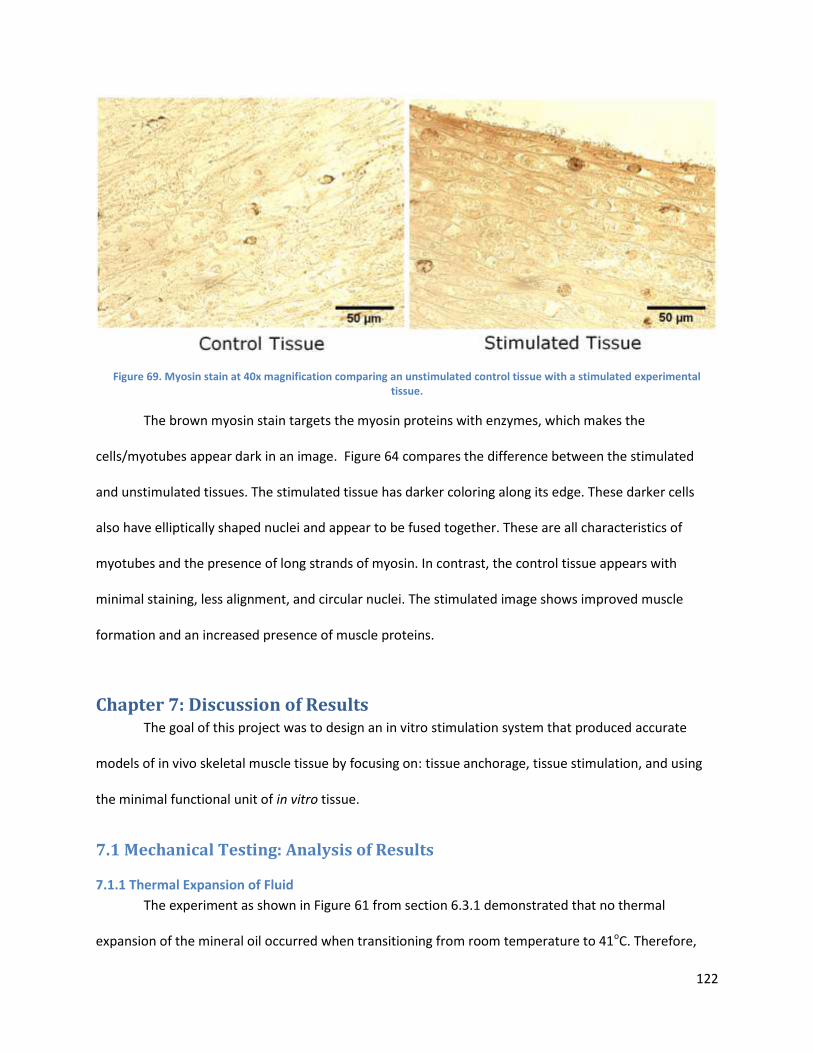
122
Figure 69. Myosin stain at 40x magnification comparing an unstimulated control tissue with a stimulated experimental tissue.
The brown myosin stain targets the myosin proteins with enzymes, which makes the
cells/myotubes appear dark in an image. Figure 64 compares the difference between the stimulated
and unstimulated tissues. The stimulated tissue has darker coloring along its edge. These darker cells
also have elliptically shaped nuclei and appear to be fused together. These are all characteristics of
myotubes and the presence of long strands of myosin. In contrast, the control tissue appears with
minimal staining, less alignment, and circular nuclei. The stimulated image shows improved muscle
formation and an increased presence of muscle proteins.
Chapter 7: Discussion of Results The goal of this project was to design an in vitro stimulation system that produced accurate
models of in vivo skeletal muscle tissue by focusing on: tissue anchorage, tissue stimulation, and using
the minimal functional unit of in vitro tissue.
7.1 Mechanical Testing: Analysis of Results
7.1.1 Thermal Expansion of Fluid
The experiment as shown in Figure 61 from section 6.3.1 demonstrated that no thermal
expansion of the mineral oil occurred when transitioning from room temperature to 41oC. Therefore,
123
mineral oil is adequate for use as the working fluid for the team’s design, as it will not affect the strain
rate per volume of fluid with the various temperatures of the system (half the tubing in the incubator
conditions of 37oC and the other half of the tubing at room temperature conditions of 21oC).
7.1.2 Amount Strain/Volume Change of Fluid
In Tables 8 and 9, the experiment images can be seen in the dry and media trials, respectively.
The device performed better in the media trial, which is ideal since the device is to be operated with
media present. This increased performance is most likely due to the decreased friction that the fluid
provides between the plates, allowing for a smoother transition between positive and negative strain.
The final device was capable of operation within incubator conditions, and was reusable after
sterilization between experiments. As shown in Figure 62 in section 6.3.2, the device is capable of
uniaxial positive and negative strain, matching both the recommended literature values of -5 to 15%
strain and the user/client request for +/- 50% strain. Strain rates produced by the device are predictable,
with the highest percent error being ~17% at maximum strain of 50%. However, between -5 and 15%
strain the maximum error is 8.5%, indicating that the device will be accurate within the range that
literature values indicate is best for forming muscle tissue.
The percent error in the device’s strain per volume change can be reduced in several ways. Since
the tubing that housed the mineral oil was very flexible, the walls of the tubing were able to expand
slightly as the fluid moved through. This expansion of the tubing causes slight error in the displacement
of the syringe, as the fluid movement is not entirely one directional in this case. By replacing the current
tubing with more rigid-walled tubing, this error can be reduced. In addition, more careful administration
of the mineral oil into the tubing and syringes could be used to prevent the formation of bubbles within
the tubing. The bubbles also restrict full movement of the syringe, as they take up volume in the tubing
that should be filled with mineral oil to provide the most uniform fluid within the tubing. Lastly,
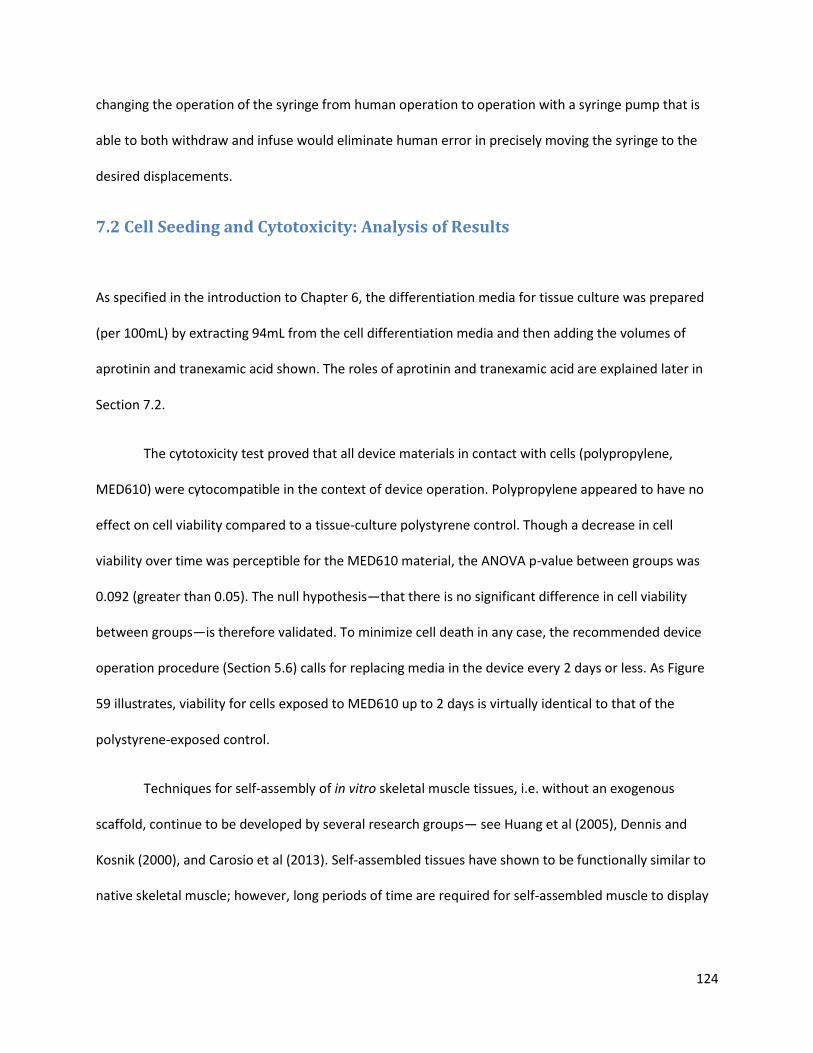
124
changing the operation of the syringe from human operation to operation with a syringe pump that is
able to both withdraw and infuse would eliminate human error in precisely moving the syringe to the
desired displacements.
7.2 Cell Seeding and Cytotoxicity: Analysis of Results
As specified in the introduction to Chapter 6, the differentiation media for tissue culture was prepared
(per 100mL) by extracting 94mL from the cell differentiation media and then adding the volumes of
aprotinin and tranexamic acid shown. The roles of aprotinin and tranexamic acid are explained later in
Section 7.2.
The cytotoxicity test proved that all device materials in contact with cells (polypropylene,
MED610) were cytocompatible in the context of device operation. Polypropylene appeared to have no
effect on cell viability compared to a tissue-culture polystyrene control. Though a decrease in cell
viability over time was perceptible for the MED610 material, the ANOVA p-value between groups was
0.092 (greater than 0.05). The null hypothesis—that there is no significant difference in cell viability
between groups—is therefore validated. To minimize cell death in any case, the recommended device
operation procedure (Section 5.6) calls for replacing media in the device every 2 days or less. As Figure
59 illustrates, viability for cells exposed to MED610 up to 2 days is virtually identical to that of the
polystyrene-exposed control.
Techniques for self-assembly of in vitro skeletal muscle tissues, i.e. without an exogenous
scaffold, continue to be developed by several research groups— see Huang et al (2005), Dennis and
Kosnik (2000), and Carosio et al (2013). Self-assembled tissues have shown to be functionally similar to
native skeletal muscle; however, long periods of time are required for self-assembled muscle to display
125
a mature phenotype. A co-culture of fibroblasts with myoblasts is typically necessary for self-assembly,
to endogenously provide ECM for directing contiguous tissue formation and alignment.
The fibrin gel-assisted assembly method allows the use of a pure myoblast population, since the
initial ECM is exogenous. Constructs created via fibrin gel were found by Huang et al (2005) to form
rapidly, in about a third of the time required for formation of tissues (of similar dimensions) via self-
assembly. Fibrin-seeded tissues also produced greater specific force than self-assembled tissues.
Because of the strong binding affinity of fibrin to muscle growth factors, the fibrin gel solution can be
mixed with these growth factors to optimize tissue maturation and hypertrophy. Huang et al (2005)
proposes that such a system could provide slow, controlled release similar to that in myogenesis, to
further direct and stimulate native-muscle-like formation of tissue.
For the tissue culture validation test outlined in Section 6.2, differentiation media was
supplemented with aprotinin and tranexamic acid, as specified in the media formulations at the
beginning of this section. Aprotinin slows the breakdown of fibrin by inhibiting plasmin, a fibrinolytic
protease secreted by differentiating C2C12 cells (Furst et al, 2007). Tranexamic acid is also anti-
fibrinolytic, inhibiting the activation of plasmin by competitively binding plasminogen (Furst et al, 2007).
As Figure 60 illustrates, the tissue culture validation test produced dogbone-shaped, contiguous
tissue, looped at each end around a post. The mimicry of muscle-bone attachment is validated by the
contiguous loops of tissue formed around each post, visible in Figure 60. The cells in fibrin attach to one
another and the fibrin exogenous matrix, and contract, inducing active tension in the cell/fibrin
construct. With the two posts as anchorage points for the developing tissue, this tension causes the
layer to contract upon itself, producing elongated tissue constructs suspended between the posts within
24 hours. The tissue fragments observed at high seeding densities (see Section 6.2) were likely a result
of the large number of cells degrading the fibrin gel too rapidly. The construct therefore was broken
126
down into fragments before cells could form tissues using the exogenous ECM. The lack of any visible
tissue formation in the 200,000 cell-seeded well was likely because sufficient numbers of cells were not
able to contact other cells and generate the active tension needed to roll up the cell-in-gel layer into the
dogbone-shaped construct around the posts.
Clinically, skeletal muscle biopsy samples obtained from humans are muscle fiber bundles of 3-
4mm in length, and commonly about 1mm in diameter (Saks et al, 1998). These samples are then used
to study contractile properties, metabolic responses, and fiber density, and are typically taken from
human soleus, gastrocnemius, tibialis anterior, or quadriceps muscles (Saks et al, 1998). The biopsy
sample dimensions therefore provide an existing clinical standard for a “minimal functional unit” of
muscle— as a means to accurately study muscle function as in native tissue in vivo while minimizing the
invasiveness and tissue loss in the patient (Saks et al, 1998). The in vitro tissues produced within the
device correspondingly fall within this size specification, with a length of about 3.5mm and a diameter of
1.0mm. This correspondence suggests that the tissues the device produces are a sort of minimal
functional unit, validating the capability of tissue culture to produce functionally-accurate muscle
models with minimal resources, in a high-throughput manner. The technique of seeding cells in fibrin gel
also demonstrates rapid formation of tissue constructs, supported by Huang et al (2005). Within 24
hours, a clear dogbone shape emerges as a result of active contraction and tissue anchorage at two
points.
The cytotoxicity test showed no substantial drop in percent cell viability over 6 days of incubation with
(cell-culture) polystyrene or (cell-culture) polypropylene. Both materials were listed as intended for cell
culture on the packaging, and these results confirm the labeling. A slight decrease in percent live cells
per image image was observed over time for the cells incubated with MED610-exposed media.
However, an Analysis of Variance (ANOVA) returned a p-value > 0.05, suggesting the decrease was not
127
statistically significant. Any detriment to cell viability caused by material leaching is further minimized
by the replacement of media every 48 hours, as in the device operation procedure (Section 5.6).
Chapter 8 – Project Impact The project not only impacts the world of engineered skeletal muscle, but also extends to many
other societal, environmental, and political areas. The gap in research will be bridged with the device as
an enabling tool between treatment and research. Beyond the scope of skeletal muscle, this device and
its methods could be slightly altered to fit cardiac tissue, cartilage, or smooth muscle. This chapter will
analyze the limitations of the project as well as the impact and influence of its usage.
8.1 Benchmarks and Standards for Success – A Comparison to Other Works The device developed in this project comprises of mechanical stimulation capabilities that vary
in comparison to the gold standard Vandenburgh device as outlined in section 2.8.1. Vandenburgh’s
device achieved -5% to 20% strain, while the device created in this project achieves strain of -50% to
50% strain. By having a larger strain range, the device is able to fulfill the needs of a wider variety of
researchers and experiments. The Vandenburgh device supported a maximum of 12 wells, while the
team’s device supports 96 wells.
The skeletal muscle tissue constructs used for device validation were constructed using a “cell-
in-gel” method similar to that used by Vandenburgh et al (1988) and Huang et al (2005). Seeding
primary myoblasts in fibrin gels, Huang et al (2005) produced tissue with diameters of 100-500 μm
within 10 days, which were functional for 6 weeks in culture. Longitudinal sections stained with
hematoxylin, eosin, and anti-myosin-heavy-chain antibody showed areas of contractile machinery
organized within discernible z-lines. Andersen et al (2014) found that mechanical stimulation over a
span of 24 hours produced fully-aligned myotubes oriented in the same parallel direction. At the end of
10 days, after a 48-hour mechanical stimulation period, the percentage of multinucleated myofibrils
128
expressing myosin was four times that in the unstimulated control. As a benchmark for in vivo tissue,
myofiber diameter for in vivo human muscle ranges from 10-100 μm and average length 23.3 μm. In
native myotubes, the density of nuclei per sectioned slide of in vivo tissue is between 30-57
nuclei/mm^2. (Vandenburgh, 1991).
8.2 Limitations in Data The project was limited in many regards based upon the resources available to the team.
Limiting resources include time, money, and experience. Time limited the amount of tests the team was
able to perform. Having a low number of experiments limited statistical significance. With more time,
more experiments could be performed to truly prove whether the device produces more accurate
models of in vivo tissue.
The allowed budget limited the team’s ability in using alternative manufacturing processes, to
manufacture a multi-functional device. The current device is a pure straining device, because the Objet
3D printer could only print with one rigid biocompatible material at a time. If more money was available,
the team could contract to a 3D printer that could print with two different biocompatible materials at
once. This would allow the device to have rigid plates and flexible PDMS posts. With flexible posts, the
user has the ability to measure deflection in the post and determine the force exerted by the tissue. But
the team was limited to the WPI Objet 3D printer. Not having flexible posts limits the potential data to
be collected.
8.3 Economics The influence of this project will impact the everyday living economy of both patients with
degenerative muscle diseases and researchers in the field. The device itself costs about $203.89 to make
in a 96 well model and it replaces animal model methods, which cost about $90 each, not including food
and containment. Animal testing for 96 samples would cost $8640. This drastically increases both higher
throughput testing as well as accuracy using human cells over animals. The more affordable research
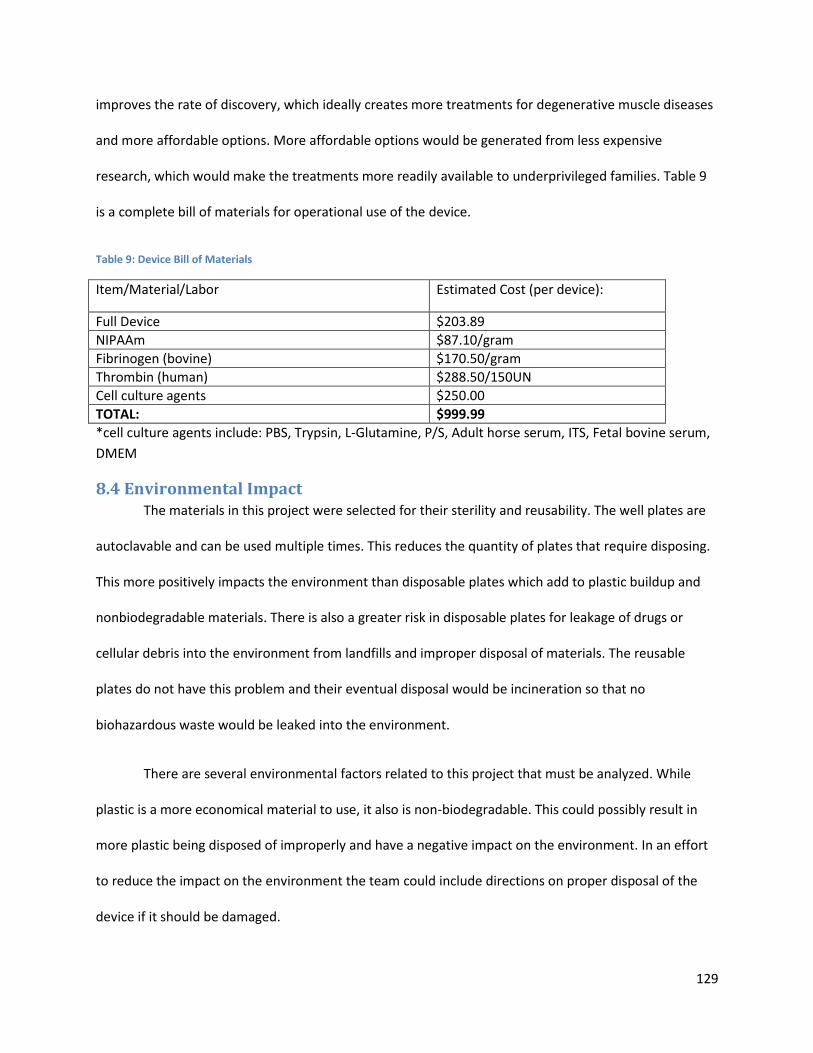
129
improves the rate of discovery, which ideally creates more treatments for degenerative muscle diseases
and more affordable options. More affordable options would be generated from less expensive
research, which would make the treatments more readily available to underprivileged families. Table 9
is a complete bill of materials for operational use of the device.
Table 9: Device Bill of Materials
Item/Material/Labor Estimated Cost (per device):
Full Device $203.89
NIPAAm $87.10/gram
Fibrinogen (bovine) $170.50/gram
Thrombin (human) $288.50/150UN
Cell culture agents $250.00
TOTAL: $999.99
*cell culture agents include: PBS, Trypsin, L-Glutamine, P/S, Adult horse serum, ITS, Fetal bovine serum,
DMEM
8.4 Environmental Impact The materials in this project were selected for their sterility and reusability. The well plates are
autoclavable and can be used multiple times. This reduces the quantity of plates that require disposing.
This more positively impacts the environment than disposable plates which add to plastic buildup and
nonbiodegradable materials. There is also a greater risk in disposable plates for leakage of drugs or
cellular debris into the environment from landfills and improper disposal of materials. The reusable
plates do not have this problem and their eventual disposal would be incineration so that no
biohazardous waste would be leaked into the environment.
There are several environmental factors related to this project that must be analyzed. While
plastic is a more economical material to use, it also is non-biodegradable. This could possibly result in
more plastic being disposed of improperly and have a negative impact on the environment. In an effort
to reduce the impact on the environment the team could include directions on proper disposal of the
device if it should be damaged.
130
8.5 Societal Influence The device will indirectly enhance the quality of life for many people because of its
enhancement of current research techniques. There are very few treatments for degenerative muscle
diseases and few ways to test pharmaceuticals for approval. This device would enable researchers an
increased rate of discovery as well as a less expensive means of research. Indirectly, this will also make
treatment products less expensive because of their cheaper cost to make/discover and improve quality
of life.
8.6 Ethical Concern The purpose of the device is to improve and enhance current research methods and strategies.
This will hopefully generate more treatments that are more affordable and widely available. The use of
the device is not offensive or unethical; embryonic stem cells for human therapeutic cloning is banned in
certain states, but that would only be a restriction on cell line. Certain religious beliefs prohibit the
transfer of bodily fluid thereby forbidding blood transfusions and other tissue transference. The ultimate
goal of the device is to help improve the human condition through improving the rate of discovery
toward a cure for degenerative muscle diseases.
8.7 Manufacturability The processes to manufacture this device are advantageous to researchers anywhere in the
world. The final design was manufactured by a 3D printer and designed in CAD drawings. The popularity
of 3D printers is spreading across the world. Thus by simply sending a CAD file of the device, any lab with
3D printing capabilities would have access to the device. By having the design readily available to be
manufactured anywhere for skeletal muscle tissue researchers, they can access the device faster and
increase the rate at which their labs can discover and test cures to skeletal muscle diseases. 3D printers
also reduce plastic waste compared to other manufacturing processes, eliminate the need to transport
the device from a manufacturing plant to laboratories, and reduce human error in production.
131
8.8 Sustainability, Health and Safety Issues In order to produce a sustainable device, several considerations were made during the design
process. Creating an environmentally-friendly device, both in the process of manufacturing and use, is
one important consideration. Since the device is created out of single material via the precise process of
3D printing, the amount of waste is negligible during production. The device can be autoclaved multiple
times, allowing reusability, minimizing device disposal. Economic sustainability was also incorporated
into the design. The product is designed for multi-functional use in both small, private laboratories and
large pharmaceutical companies. The capacity for high-throughput tissue generation and screening, up
to 96 tissue constructs, is provided. The large volume of tissues testable per use allows for a societal
impact on quality of life, once a drug is created to treat or cure muscular diseases. Compared to live
animal testing, the device improves user safety by eliminating the health hazard of being bitten or
scratched during handling. Additionally, the entire device (including syringe) is lightweight, reducing the
risk of injury from lifting or dropping the device.
Chapter 9: Conclusions and Recommendations This chapter encompasses the conclusions and recommendations of this Major Qualifying Project.
9.1 Conclusion The deliverable for this project is a mechanical stimulator of in vitro skeletal muscle tissue that
improves modeling in vivo skeletal muscle.
The device is able to generate minimal functional units of tissue from myoblast cells in vitro,
with tissue shape and anchorage mimicking muscle-bone attachment in vivo. Several tissues (up to 96)
can be generated, and then highly- reproducible uniaxial mechanical stimulation can be applied to these
tissues simultaneously. This stimulation can be applied from outside the incubator while preserving
sterility, via a programmable syringe pump, minimizing user effort. The device can therefore allow high-
132
throughput generation and stimulation in a small form factor that fits in an incubator, while also
preserving functionally-accurate muscle modelling.
With a high degree of consistency, the device is able to improve key parameters of in vivo
skeletal muscle via mechanical stimulation, including muscle fiber alignment and fiber density. In
addition to positive strain, the device is also capable of applying negative strain to tissues. This allows
the tissues to relax and recover between strain cycles, minimizing the risk of tissue rupture. The
capability for negative strain also allows our device to produce models of muscle atrophy, as absence of
passive tension causes losses in muscle mass and strength.
The hydraulic actuation of the device provides a way to stimulate tissues from outside the
incubator without heat-sensitive or humidity-sensitive components, while the virtually-zero
compressibility of the hydraulic fluid maximizes mechanical responsiveness and sensitivity at the device.
Actuation driven by a syringe pump allows for highly-reproducible, controllable stimulation regimens
with minimal user effort.
As a consistent means to generate and mechanically stimulate tissues, the device is an enabling
platform that promises to disrupt pharmacological research and development for muscle diseases.
Providing a functionally-accurate in vitro model of mature human skeletal muscle eliminates the need
for a (less accurate) live animal model during drug approval screening. A high-throughput design allows
drug screening using a large number of tissues at once, minimizing time for drug screening and
improving the ease with which drug effects can be directly observed. The 96-well format also leaves
open the possibility of compartmentalization, so that different drugs may possibly be tested in the same
device at any one time.
The device offers a higher functionality than similar devices on the market that mechanically
stimulate in vitro skeletal muscle tissue. A simple, lean design minimizes manufacturing and operating
133
costs relative to other devices. The device’s similarity to 96-well plates, which are common and familiar
to pharmacological laboratories, makes general device operation intuitive. This design familiarity also
minimizes the adaptations necessary for existing manufacturers of 96-well plates to manufacture the
device.
9.2 Recommendations Due to the limitations of the design stated in Section 5.7 and problems seen during the testing
process, there are eight main recommendations the team suggests for future improvements of this
design.
Recommendations for Tissue Development:
Perform more stimulation experiments and statistically validate results
Optimize tissue exercise regime
Adapt to engineered tissue by cell self-assembly
Optimize media composition
Recommendations for Device Construction and Future Components:
Replace MED610
Replace post to PDMS
Use more rigid tubing to reduce error
Incorporate electrical stimulation component
Based from the results in this project in terms of stimulated tissue growth, the device shows
great promise towards the overall goal. However, due to time constraints not as many tests were able to
be performed to statistically prove the device produces consistent results. The team suggests
performing more testing with the device to produce more data that supports the device function. The
teams experiments show the device can produce skeletal muscle tissue with higher fiber alignment and
134
greater fiber density by mechanical stimulation. The goal of this recommendation is to statistically prove
consistent device function.
The second recommendation for tissue development is to optimize the exercise regime of the
developing tissues to produce the best tissue models. In literature, many researchers have found their
own optimal strain amount, strain rate, and frequency. However, those optimal numbers pertain to
their specific methods of mechanical stimulation. The goal of this suggestion is to perform many
experiments with different strain magnitudes, rates, and frequency and compare results to find which
combination proves the best model of in vivo tissue or best models of various muscular disease or
atrophy. This information can later be used by pharmaceutical companies when screening drugs.
The third recommendation for tissue development is to adapt the cell seeding protocol for
engineered tissue to a cell self-assembly method. Currently, a fibrinogen/thrombin gel method is used in
the cell seeding processes to create an exogenous ECM. Self-assembly of engineered tissue is a method
to grow tissue that better mimics in vivo development. The cells produce their own ECM and develop
contiguous tissue around anchorage points mimicking native skeletal muscle tissue attachment to bone.
Also, there is a much greater fiber density in the self-assembly method. This would be a better model of
in vivo tissue.
The fourth recommendation is to optimize media composition during tissue development. By
improving media composition tissue maturation, hypertrophy, and fiber size can improve. These all lead
to more accurate models of in vivo human skeletal muscle tissue.
The fifth recommendation is to replace the prototyping material (MED610) with another more
durable material that can be used for cell culture. MED610 is a resin-plastic used in the Objet260 3D
printer and is what the team had available to manufacture the device. This is a known biocompatible
dental material. However, after 5 autoclave cycles the plastic became porous, deformed in shaped, and
began to leach more and more particles into the media. Deformation only occurred in the device where
135
wall thickness was 1 mm. Along with changing the material of the device, it is suggested to increase wall
thickness to a minimum of 2 mm. Suggested materials include titanium, polystyrene (not autoclave-able,
but makes the device cheap and disposable), polycarbonate, or polypropylene. Each material has pros
and cons.
The sixth recommendation is to replace the devices rigid post with flexible PDMS plastic post.
Currently the device is a strain only device. With flexible PDMS post the ability to measure force applied
to the tissue becomes possible by measuring the deflection in the post. The material properties of PDMS
are well defined. Using the relationships between deformation and force of PDMS and measuring the
angle at which the post deforms during stimulation or culturing, force can be calculated. Having PDMS
post instead of rigid post allows for the measurement of force in the device, information important to
know in order to match in vivo parameters.
The seventh recommendation is to use more rigid tubing in the syringe pump system to improve
accuracy. As discussed in section 7.1, the tubing is a large contributor to the error in device straining of
tissues. As pressure increases or decreases the tube expands or contracts, altering the volume change
that directly corresponds to percent strain of the tissues. More rigid tubing would prevent this variance
and make the straining processes more controlled improving accuracy.
The final recommendation is to add the electrical stimulation component to this existing device.
Due to time and budget constraints the electrical components were not looked into further than
potential designs. The electrical stimulation component is a key part in mimicking tetanic signaling in
vitro. All these recommendations will lead to a better in vitro model of in vivo skeletal muscle tissue.
136
References: "Amyotrophic Lateral Sclerosis (ALS) Fact Sheet." National Institute of Neurological Disorders and Stroke.
NINDS, June 2013. Web. 21 Sept. 2014.
Andersen, J. I., Juhl, M., Nielsen, T., Emmersen, J., Fink, T., Zachar, V., & Pennisi, C. P. (2014). Uniaxial
cyclic strain enhances adipose-derived stem cell fusion with skeletal myocytes. Biochemical and
biophysical research communications, 450(2), 1083-1088.
Bach, AD, JP Beier, J. SternStaeter, and RE Horch. (2004). "Skeletal Muscle Tissue Engineering." Journal
of Cellular and Molecular Medicine 8 (4): 413-422.
Brian, W., Bursac, N. (2008). Tissue engineering of functional skeletal muscle: Challenges and recent
advances. IEEE Eng Med Biol Mag, 27, 109-113.
Bock, R. “NIH study uncovers details of early stages in muscle formation and regeneration.” National
Institute of Neurological Disorders and Stroke. NINDS, May 2013. Web. 21 Sept. 2014.
Boldrin, L., Muntoni, F., & Morgan, J. E. (2010). Are human and mouse satellite cells really the
same? Journal of Histochemistry & Cytochemistry, 58(11), 941-955.
Buckingham, Margaret, Lola Bajard, Ted Chang, Philippe Daubas, Juliette Hadchouel, Sigolène Meilhac,
Didier Montarras, Didier Rocancourt, and Frédéric Relaix. 2003. "The Formation of Skeletal Muscle:
From Somite to Limb." Journal of Anatomy 202 (1): 59-68. doi:10.1046/j.1469-7580.2003.00139.x.
Burattini, S., Ferri, P., Battistelli, M., Curci, R., Luchetti, F., & Falcieri, E. (2009). C2C12 murine myoblasts
as a model of skeletal muscle development: morpho-functional characterization. European Journal
of Histochemistry, 48(3), 223-234.
Burks, T.N., Cohn, R.D. “Role of TGF-β signaling in inherited and acquired myopathies” Skeletal Muscle.
2011. May 4; 1(1), 1-19.
Burns, E., Krier, K., Lebel, M., & Peppel, M. (2008). Skeletal muscle tissue engineering. Retrieved
September 10, 2014, from <http://chen2820.pbworks.com/w/page/11951479/Skeletal muscle
tissue engineering>
Campellone, Joseph V., and David Zieve. "Multiple Sclerosis." Multiple Sclerosis. U.S. National Library of
Medicine, 25 Sept. 2013. Web. 21 Sept. 2014.
Campellone, Joseph V., MD, and David Zieve, MD. "Muscular Dystrophy: MedlinePlus Medical
Encyclopedia." U.S National Library of Medicine. U.S. National Library of Medicine, 24 Feb. 2014.
Web. 21 Sept. 2014. http://www.nlm.nih.gov/medlineplus/ency/article/001190.htm
Carosio, S., Barberi, L., Rizzuto, E., Nicoletti, C., Del Prete, Z., & Musarò, A. (2013). Generation of ex vivo-vascularized muscle engineered tissue (X-MET).Scientific reports, 3.
137
Chakravarthy, M. V., Abraha, T. W., Schwartz, R. J., Fiorotto, M. L., & Booth, F. W. (2000). Insulin-like
Growth Factor-I Extends in VitroReplicative Life Span of Skeletal Muscle Satellite Cells by Enhancing
G1/S Cell Cycle Progression via the Activation of Phosphatidylinositol 3′-Kinase/Akt Signaling Pathway.
Journal of Biological Chemistry, 275(46), 35942-35952.
Christ, G. (2013). U.S. Patent No. 20130197640. Washington, DC: U.S.
"Data & Statistics." Centers for Disease Control and Prevention. Centers for Disease Control and
Prevention, 18 Sept. 2014. Web.
Dennis, R. (2001). U.S. Patent No. 6114164. Washington, DC: U.S.
Dennis, R. G., & Kosnik II, P. E. (2000). Excitability and isometric contractile properties of mammalian
skeletal muscle constructs engineered in vitro. In Vitro Cellular & Developmental Biology-Animal,
36(5), 327-335.
Eagle, M., Baudouin, S. V., Chandler, C., Giddings, D. R., Bullock, R., & Bushby, K. (2002). Survival in
Duchenne muscular dystrophy: improvements in life expectancy since 1967 and the impact of home
nocturnal ventilation. Neuromuscular Disorders, 12(10), 926-929.
Emery, Alan E. M. Muscular Dystrophy: The Facts. Oxford: Oxford University Press, 1994. Web.
Generation of ex vivo-vascularized muscle engineered tissue (X-MET).Scientific reports, 3.
Gilbert SF. Developmental Biology. 6th edition. Sunderland (MA): Sinauer Associates; 2000. Myogenesis:
The Development of Muscle. Available from: http://www.ncbi.nlm.nih.gov/books/NBK10006/
Gilles AR, Lieber RL. Structure and function of the skeletal muscle extracellular matrix. Muscle Nerve.
2011;44:318-331.
Goudenege, S., Pisani, D. F., Wdziekonski, B., Di Santo, J. P., Bagnis, C., Dani, C., & Dechesne, C. A. (2009).
Enhancement of Myogenic and Muscle Repair Capacities of Human Adipose–derived Stem Cells
With Forced Expression of MyoD. Molecular Therapy, 17(6), 1064-1072.
Grabowska, I., Szeliga, A., Moraczewski, J., Czaplicka, I., & Brzóska, E. (2011). Comparison of satellite cell‐
derived myoblasts and C2C12 differentiation in two‐and three‐dimensional cultures: changes in
adhesion protein expression.Cell biology international, 35(2), 125-133.
Grefte, S., A. M. Kuijpers-Jagtman, R. Torensma, and J. W. Von den Hoff. 2007. "Skeletal Muscle
Development and Regeneration." Stem Cells and Development 16 (5): 857-868.
doi:10.1089/scd.2007.0058.
Guilak et al. (2003). Functional Tissue Engineering. Springer-Verlag New York, Inc.
138
Gwyther, T., Hu, J., Billiar, K., Rolle, M. (2011). Directed cellular self-assembly to fabricate cell-derived
tissue rings for biomechanical analysis and tissue engineering. Journal of Visualized Experiments, 57,
3366.
Herman, I. M., Crisona, N. J., & Pollard, T. D. (1981). Relation between cell activity and the distribution of
cytoplasmic actin and myosin. The Journal of cell biology, 90(1), 84-91.
Kosnik, P. E., Faulkner, J. A., & Dennis, R. G. (2001). Functional development of engineered skeletal
muscle from adult and neonatal rats. Tissue engineering,7(5), 573-584.
Laterreur, V., Ruel, J., Auger, F. A., Vallières, K., Tremblay, C., Lacroix, D., ... & Germain, L. (2014).
Comparison of the direct burst pressure and the ring tensile test methods for mechanical
characterization of tissue-engineered vascular substitutes. Journal of the mechanical behavior of
biomedical materials, 34, 253-263.
Lewis, M. R. (1915). Rhythmical contraction of the skeletal muscle tissue observed in tissue cultures. Am.
J. Physiol, 38, 153-161.
Li, M., Dickinson, C. E., Finkelstein, E. B., Neville, C. M., & Sundback, C. A. (2011). The role of fibroblasts
in self-assembled skeletal muscle. Tissue Engineering Part A, 17(21-22), 2641-2650.
MacArthur BD, Oreffo RO. 2005. "Bridging the Gap." Nature (433).
Martin-Piedra, M., Garzon, I., Oliveira, A., Alfonso-Rodriguez, C., Sanchez-Quevedo, M., Campos, A.,
Alaminos, M. (2013). Average cell viability levels of human dental pulp stem cells: an accurate
combinational index for quality control in tissue engineering. Cryotherapy, 15, 507-518.
“Myasthenia Gravis Fact Sheet,” NINDS. Published September 2010. NIH Publication No. 10-768. Web.
Okano T. & Matsuda T. (1998) Tissue engineered skeletal muscle: preparation of highly dense, highly
oriented hybrid muscular tissues. Cell Transplant 7, 71–82
Perniconi, B., & Coletti, D. (2014). Skeletal muscle tissue engineering: best bet or black beast?. Frontiers
in physiology, 5.
Powell, C., Smiley, B., Mills, J., Vandenburgh, H. (2002). Mechanical stimulation improves tissue-
engineered human skeletal muscle. American Journal of Physiology-Cell Physiology, 283, 1557-1565.
Radisic, M. (2005). U.S. Patent No. 20050112759. Washington, DC: U.S.
Roberts, R. G. (2001). Dystrophins and dystrobrevins. Genome Biol, 2(4), 1-7.
Sabourin, L. A., Girgis-Gabardo, A., Seale, P., Asakura, A., & Rudnicki, M. A. (1999). Reduced
differentiation potential of primary MyoD−/− myogenic cells derived from adult skeletal muscle. The
Journal of cell biology, 144(4), 631-643.
139
Saks, V. A., Veksler, V. I., Kuznetsov, A. V., Kay, L., Sikk, P., Tiivel, T., ... & Kunz, W. S. (1998).
Permeabilized cell and skinned fiber techniques in studies of mitochondrial function in vivo.
In Bioenergetics of the Cell: Quantitative Aspects (pp. 81-100). Springer US.
Shansky J., Del Tatto M., Chromiak J. & Vandenburgh H. (1997) A simplified method for tissue
engineering skeletal muscle organoids in vitro. In Vitro Cell Dev. Biol. Anim 33, 659–661.
Shier, David, Jackie Butler, and RickiLewis.Hole's Essentials of Human Anatomy & Physiology. Boston:
McGraw-Hill Higher Education, 2009. Print.
Smith, C., Kruger, M. J., Smith, R. M., & Myburgh, K. H. (2008). The inflammatory response to skeletal
muscle injury. Sports medicine, 38(11), 947-969.
Silverthorn, D.U. (2010). Human Physiology: An Integrated Approach. Pearson. p. 398. ISBN 978-0-321-
55980-7.
St. John, Tina M. “Degenerative Muscle Disease Symptoms.” LIVESTRONG.com. August 17, 2013. Web.
Strober, W. (2001). Trypan blue exclusion test of cell viability. Current protocols in immunology, A-3B.
Strohman RC, Bayne E, Spector D, Obinata T, Micou-Eastwood J, and Maniotis A (1990). Myogenesis and
histogenesis of skeletal muscle on flexible membranes in vitro. In Vitro Cell Dev Biol 26: 201–208.
Totten, G. E. (2011). Handbook of hydraulic fluid technology. CRC Press.
Van Wachem P. B., van Luyn M. J. & da Costa M. L. (1996). Myoblast seeding in a collagen matrix
evaluated in vitro. J. Biomed. Mater. Res. 30, 353–360.
Vandenburgh, H., Shansky, J., Benesch-Lee, F., Skelly, K., Spinazzola, J. M., Saponjian, Y., & Tseng, B. S.
(2009). Automated drug screening with contractile muscle tissue engineered from dystrophic
myoblasts. The FASEB Journal, 23(10), 3325-3334.
Vandenburgh, H., Shansky, J., Benesch‐Lee, F., Barbata, V., Reid, J., Thorrez, L., ... & Crawford, G. (2008).
Drug‐screening platform based on the contractility of tissue‐engineered muscle. Muscle &
nerve, 37(4), 438-447.
Vandenburgh, H. (1992). U.S. Patent No. 5153136.Washington, DC: U.S.
Vandenburgh H. et al (1996). Tissue-engineered skeletal muscle organoids for reversible gene
therapy.Hum. Gene Ther. 7, 2195–2200.
Vandenburgh, H. H., Hatfaludy, S., Karlisch, P., & Shansky, J. (1991). Mechanically induced alterations in
cultured skeletal muscle growth. Journal of biomechanics, 24, 91-99.
Vandenburgh, H. H., Karlisch, P., & Farr, L. (1988). Maintenance of highly contractile tissue-cultured
avian skeletal myotubes in collagen gel. In vitro cellular & developmental biology, 24(3), 166-174.
140
von der Mark, H., Dürr, J., Sonnenberg, A., von der Mark, K., Deutzmann, R., & Goodman, S. L. (1991).
Skeletal myoblasts utilize a novel beta 1-series integrin and not alpha 6 beta 1 for binding to the E8
and T8 fragments of laminin. Journal of Biological Chemistry, 266(35), 23593-23601.
WPI Academic Resource and Computing. (2013). Rapid prototyping guidelines. Web.
Zhao, Y. (2009). Investigating electrical field-affected skeletal myogenesis using a microfabricated
electrode array. Sensors and Actuators A: Physical, 154(2), 281-287.
McKeehen, J. N., Novotny, S. A., Baltgalvis, K. A., Call, J. A., Nuckley, D. J., & Lowe, D. A. (2013).
Adaptations of mouse skeletal muscle to low intensity vibration training. Medicine and science in
sports and exercise, 45(6), 1051.
Jenkyn, T. R., Ehman, R. L., & An, K. N. (2003). Noninvasive muscle tension measurement using the novel
technique of magnetic resonance elastography (MRE). Journal of biomechanics, 36(12), 1917-1921.
Blottner, D., Salanova, M., Püttmann, B., Schiffl, G., Felsenberg, D., Buehring, B., & Rittweger, J. (2006).
Human skeletal muscle structure and function preserved by vibration muscle exercise following 55
days of bed rest. European journal of applied physiology, 97(3), 261-271.
Humphries, B., Warman, G., Purton, J., Doyle, T. L., & Dugan, E. (2004). The influence of vibration on
muscle activation and rate of force development during maximal isometric contractions. Journal of
sports science & medicine, 3(1), 16.
Bosco, C., Colli, R., Introini, E., Cardinale, M., Tsarpela, O., Madella, A., ... & Viru, A. (1999). Adaptive
respsonses of human skeletal muscle to vibration exposure. CLINICAL PHYSIOLOGY-OXFORD-, 19,
183-187.
Bosco, C., Cardinale, M., & Tsarpela, O. (1998). Influence of vibration on mechanical power and
electromyogram activity in human arm flexor muscles. European journal of applied physiology and
occupational physiology, 79(4), 306-311.
Roberts, D. (2012). The Limits of Vibration Frequency for Miniature Vibration Motors. Precision
MicroDrives. Web.
Levenberg, S., J. Rouwkema, M. Macdonald, E.S. Garfein, D.S. Kohane, D.C. Darland, R. Marini, C.A. van
Blitterswijk, R.C. Mulligan, P.A. D'Amore, R. Langer R: Engineering vascularized skeletal muscle
tissue. Nat Biotechnol, 23, 879-84 (2005)
Scime, A., Caron, A. Z., & Grenier, G. (2009). Advances in myogenic cell transplantation and skeletal
muscle tissue engineering. Front Biosci, 14, 3012-3023.
Ross, J. J., & Tranquillo, R. T. (2003). ECM gene expression correlates with in vitro tissue growth and
development in fibrin gel remodeled by neonatal smooth muscle cells. Matrix biology, 22(6),
477-490.
141
Huang, Y. C., Dennis, R. G., Larkin, L., & Baar, K. (2005). Rapid formation of functional muscle in vitro
using fibrin gels. Journal of Applied Physiology, 98(2), 706-713.
Coleman, M. E., DeMayo, F., Yin, K. C., Lee, H. M., Geske, R., Montgomery, C., & Schwartz, R. J. (1995).
Myogenic vector expression of insulin-like growth factor I stimulates muscle cell differentiation
and myofiber hypertrophy in transgenic mice. Journal of Biological Chemistry, 270(20), 12109-
12116.
Lian, S., Xiao, Y., Bian, Q., Xia, Y., Guo, C., Wang, S., & Lang, M. (2012). Injectable hydrogel as stem cell
scaffolds from the thermosensitive terpolymer of NIPAAm/AAc/HEMAPCL. International journal
of nanomedicine, 7, 4893.
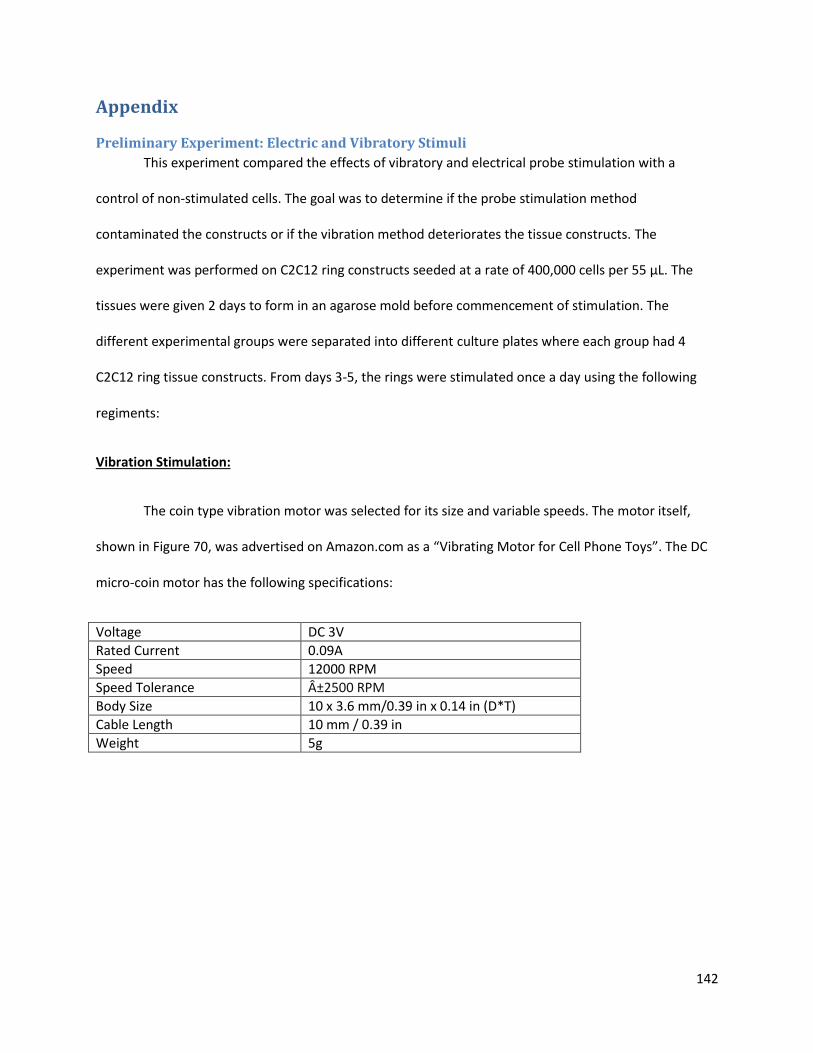
142
Appendix
Preliminary Experiment: Electric and Vibratory Stimuli
This experiment compared the effects of vibratory and electrical probe stimulation with a
control of non-stimulated cells. The goal was to determine if the probe stimulation method
contaminated the constructs or if the vibration method deteriorates the tissue constructs. The
experiment was performed on C2C12 ring constructs seeded at a rate of 400,000 cells per 55 μL. The
tissues were given 2 days to form in an agarose mold before commencement of stimulation. The
different experimental groups were separated into different culture plates where each group had 4
C2C12 ring tissue constructs. From days 3-5, the rings were stimulated once a day using the following
regiments:
Vibration Stimulation:
The coin type vibration motor was selected for its size and variable speeds. The motor itself,
shown in Figure 70, was advertised on Amazon.com as a “Vibrating Motor for Cell Phone Toys”. The DC
micro-coin motor has the following specifications:
Voltage DC 3V
Rated Current 0.09A
Speed 12000 RPM
Speed Tolerance ±2500 RPM
Body Size 10 x 3.6 mm/0.39 in x 0.14 in (D*T)
Cable Length 10 mm / 0.39 in
Weight 5g
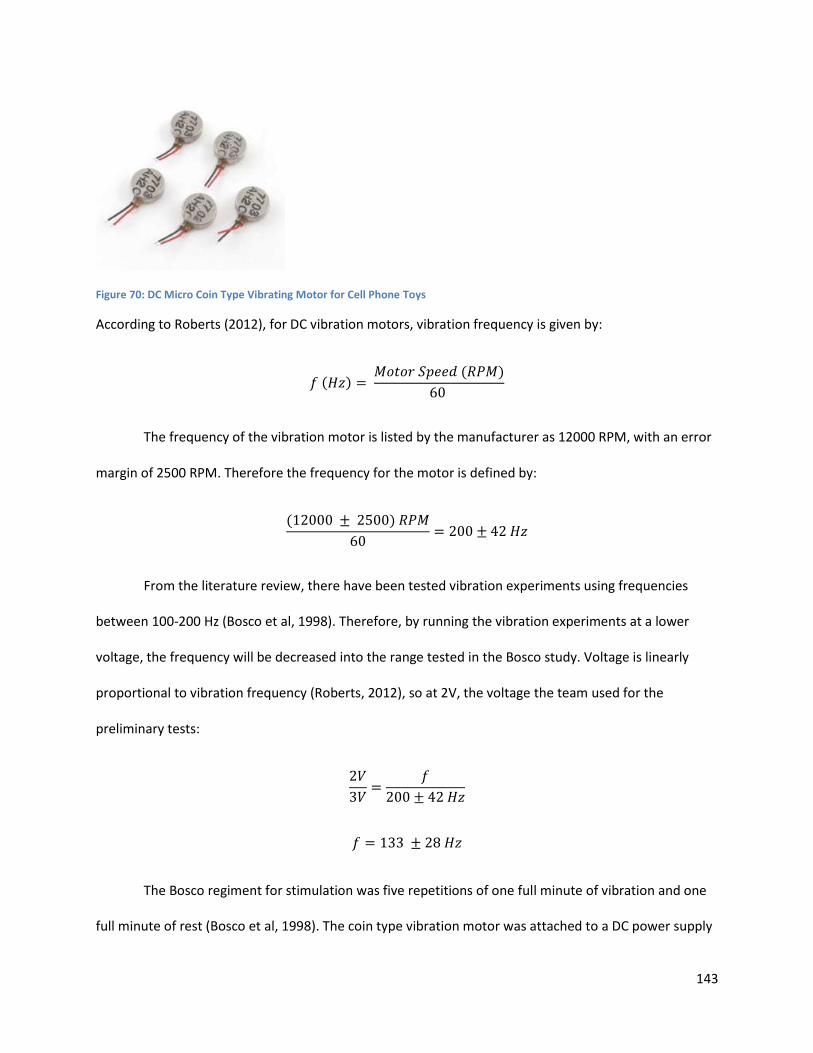
143
Figure 70: DC Micro Coin Type Vibrating Motor for Cell Phone Toys
According to Roberts (2012), for DC vibration motors, vibration frequency is given by:
𝑓 (𝐻𝑧) = 𝑀𝑜𝑡𝑜𝑟 𝑆𝑝𝑒𝑒𝑑 (𝑅𝑃𝑀)
60
The frequency of the vibration motor is listed by the manufacturer as 12000 RPM, with an error
margin of 2500 RPM. Therefore the frequency for the motor is defined by:
(12000 ± 2500) 𝑅𝑃𝑀
60= 200 ± 42 𝐻𝑧
From the literature review, there have been tested vibration experiments using frequencies
between 100-200 Hz (Bosco et al, 1998). Therefore, by running the vibration experiments at a lower
voltage, the frequency will be decreased into the range tested in the Bosco study. Voltage is linearly
proportional to vibration frequency (Roberts, 2012), so at 2V, the voltage the team used for the
preliminary tests:
2𝑉
3𝑉=
𝑓
200 ± 42 𝐻𝑧
𝑓 = 133 ± 28 𝐻𝑧
The Bosco regiment for stimulation was five repetitions of one full minute of vibration and one
full minute of rest (Bosco et al, 1998). The coin type vibration motor was attached to a DC power supply
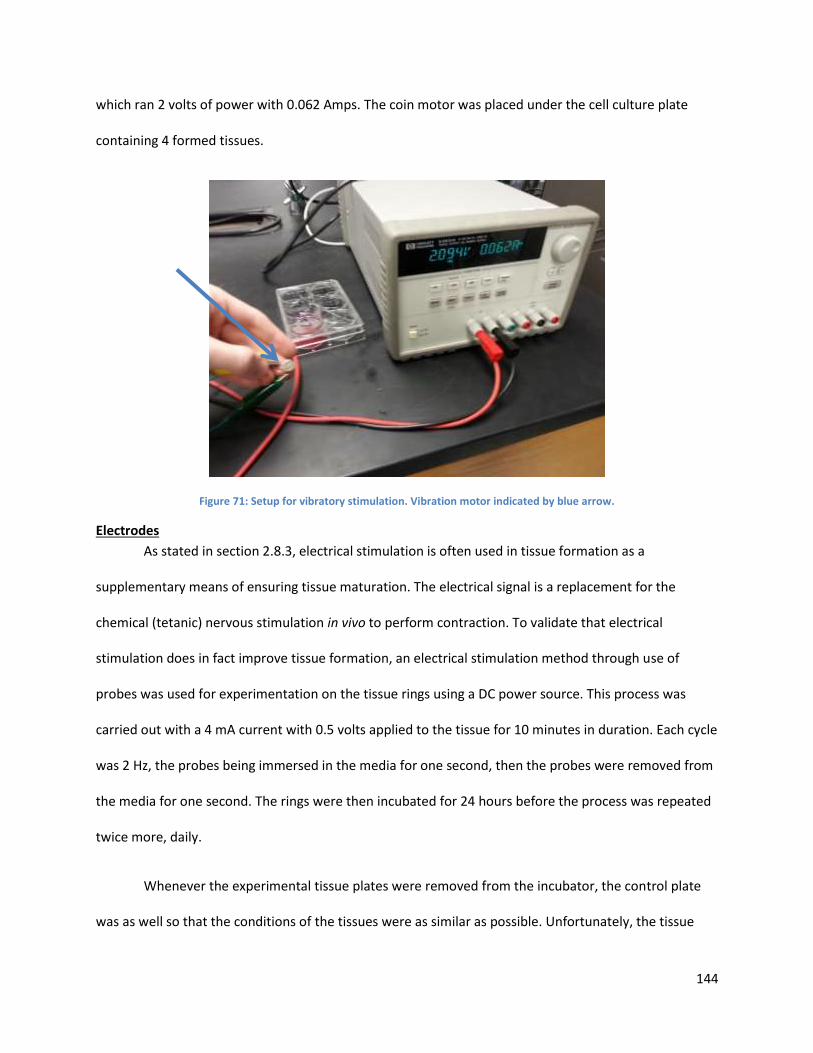
144
which ran 2 volts of power with 0.062 Amps. The coin motor was placed under the cell culture plate
containing 4 formed tissues.
Figure 71: Setup for vibratory stimulation. Vibration motor indicated by blue arrow.
Electrodes
As stated in section 2.8.3, electrical stimulation is often used in tissue formation as a
supplementary means of ensuring tissue maturation. The electrical signal is a replacement for the
chemical (tetanic) nervous stimulation in vivo to perform contraction. To validate that electrical
stimulation does in fact improve tissue formation, an electrical stimulation method through use of
probes was used for experimentation on the tissue rings using a DC power source. This process was
carried out with a 4 mA current with 0.5 volts applied to the tissue for 10 minutes in duration. Each cycle
was 2 Hz, the probes being immersed in the media for one second, then the probes were removed from
the media for one second. The rings were then incubated for 24 hours before the process was repeated
twice more, daily.
Whenever the experimental tissue plates were removed from the incubator, the control plate
was as well so that the conditions of the tissues were as similar as possible. Unfortunately, the tissue
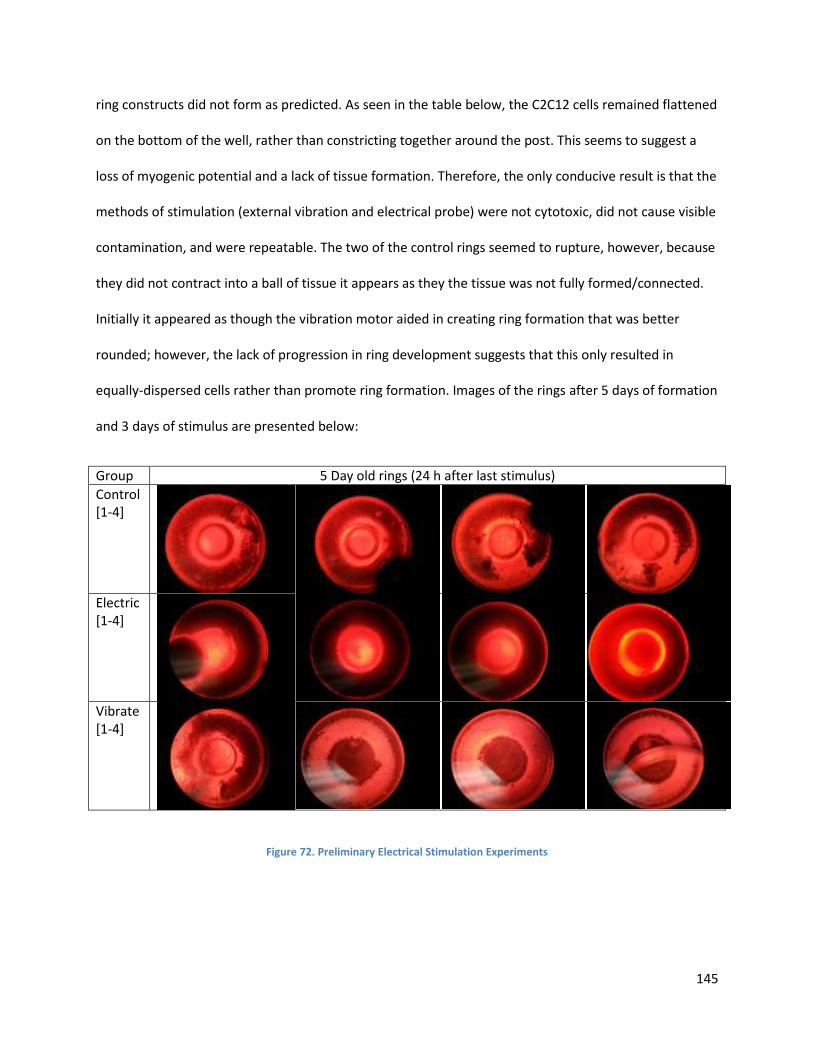
145
ring constructs did not form as predicted. As seen in the table below, the C2C12 cells remained flattened
on the bottom of the well, rather than constricting together around the post. This seems to suggest a
loss of myogenic potential and a lack of tissue formation. Therefore, the only conducive result is that the
methods of stimulation (external vibration and electrical probe) were not cytotoxic, did not cause visible
contamination, and were repeatable. The two of the control rings seemed to rupture, however, because
they did not contract into a ball of tissue it appears as they the tissue was not fully formed/connected.
Initially it appeared as though the vibration motor aided in creating ring formation that was better
rounded; however, the lack of progression in ring development suggests that this only resulted in
equally-dispersed cells rather than promote ring formation. Images of the rings after 5 days of formation
and 3 days of stimulus are presented below:
Group 5 Day old rings (24 h after last stimulus)
Control [1-4]
Electric [1-4]
Vibrate [1-4]
Figure 72. Preliminary Electrical Stimulation Experiments