Embed Size (px)
Citation preview
Tips & Tricks: GPC/SEC Method Optimization
During the development of a gel permeation chromatography/size exclusion chromatography (GPC/SEC) method, when selecting the optimum stationary and mobile phase an optimization of the default conditions is a good idea. Depending on the sample molar mass and polydispersity several adjustments are recommended.
Daniela Held, PSS Polymer Standards Service GmbH, Mainz, Germany.
Many scientists consider the development
of a gel permeation chromatography/
size exclusion chromatography (GPC/
SEC) method easy, especially when
compared to high performance liquid
chromatography (HPLC) applications. This
is true in the sense that normally only
isocratic conditions are applied, so that
a time-consuming gradient optimization
is not required. However, there are many
measures that can be taken to improve
the quality of an existing method and the
reproducibility.
Once the stationary and mobile
phases of a GPC/SEC method have been
established (where the sample chemistry
plays the most important role), method
optimization with respect to sample
molar mass and polydispersity is desirable.
Special care is required, if high molar
mass samples above 1 million dalton are
to be analysed.
Stationary Phase, Solvent
Additives and Modifiers
The importance of a matching stationary
phase for a robust method has been
discussed in previous GPC/SEC Tips &
Tricks instalments.1,2 GPC/SEC ideally
relies on interaction-free chromatography.
To reach this goal for a range of sample
chemistries and molar masses, a variety
of stationary phase polarities is
required.
Many GPC/SEC methods, especially
in medium polar and polar solvents (for
example, DMF and water) require the
addition of a low molar mass additive
or modifiers.2 Column manufacturers
provide recommendations for the
concentration of these additives that will
work for the majority of samples. In some
cases, this concentration might be either
too high or too low. Therefore, varying
the additive concentration may be useful
to learn more about the influence of this
concentration.
If the peak shape and the elution
volume of the peak maximum do
not change when a higher or lower
concentration is used, the lowest additive
concentration with constant conditions
should be used. This helps to protect
the pump seals or other parts of the
instrumentation. If, on the other hand,
a small change in additive concentration
changes the peak shape and the
elution volume, this indicates that the
method is not robust and needs further
development.
Tools to Increase the Resolution
Additional Columns: The accessible
pore volume is the parameter that mainly
influences the separation in GPC/SEC.
Pore volume can be added by adding
more separation columns to the system,
with the disadvantage that the analysis
time and solvent consumption will
increase with the resolution.
For better resolution in the actual molar
mass separation range, a column with
the same porosity (for linear columns
a column of the same type) has to be
added.
To separate system peaks or residual
monomer/solvent further away from
potential oligomers, a column with a
smaller porosity can be added. However,
the combination of the porosities of
the columns should be dislocation or
9 Packer and Dalmia13 A Shotgun Approach17 Staff23CHROMacademy20 Training & Events21
Browne2 News6 Market Trends & Analysis8 Tips & Tricks: GPC/SEC966 88
Ph
oto
Cre
dit
: In
fin
ity S
pre
ad
s -
Se
an
Ro
dw
ell
/Ge
tty I
ma
ge
s
The Column www.chromatographyonline.com
mismatch free. Therefore, linear columns
should not be combined with columns
with single small porosities, as in the
majority of cases this will result in a
mismatch or a dislocation and artifical
peak shapes.3
Smaller Particle Size: When applicable
to sample molar mass and system back
pressure, smaller particle sizes can be
used to gain a better resolution. They
are particularly useful for the analysis of
oligomers, low molar mass polymers and
proteins.
They should not be used if there is a
danger of shear degradation, for example,
when very high molar masses are
analysed. However, recent data showed
that the risk for shear degradation is less
than previously reported, opening up new
characterization paths.4
Flow Rate: The typical flow rate applied
in GPC/SEC on analytical columns with
De
tect
or
Re
spo
nse
(V
)
0.010
0.009
0.008
0.007
0.006
0.005
0.004
0.003
0.002
0.001
0.000
8 9 10
Elution Volume (mL)
11 12 13
Combination 5 µm, 2 × 100 Å
Op
tim
ized
5 µ
m, 100 Å
Trad
itio
nal 10 µ
m, 100 Å
14 15 16 17 18
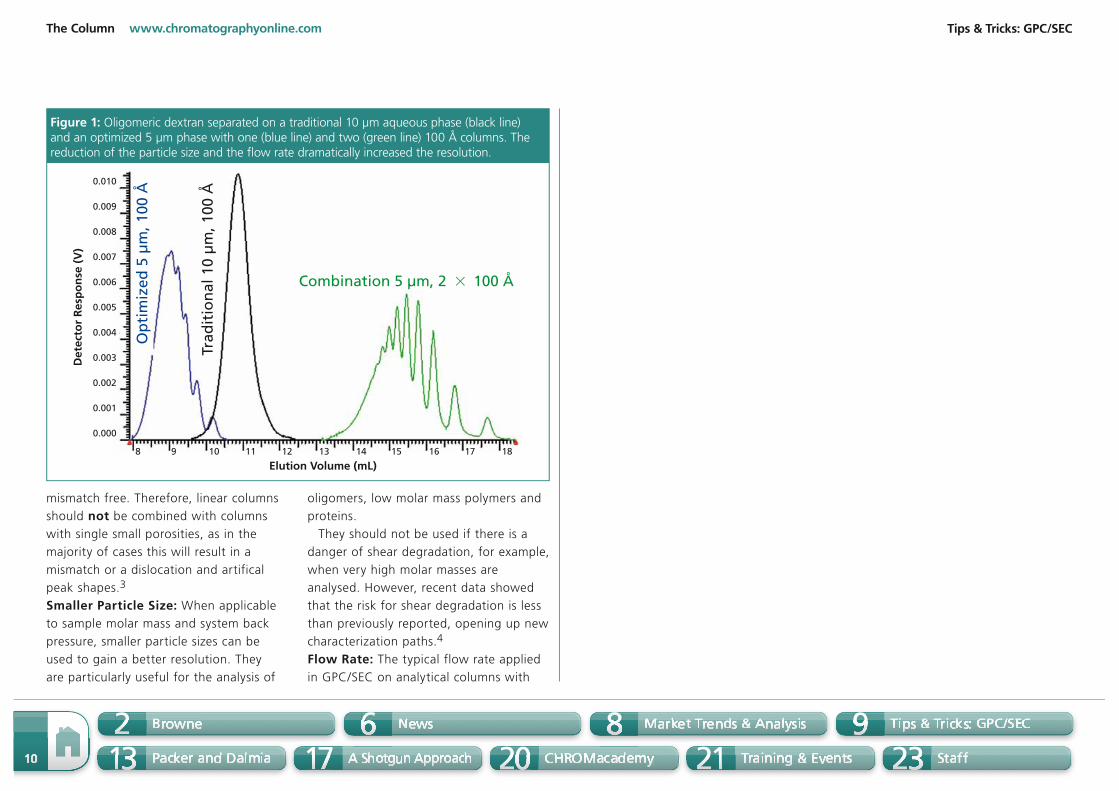
Figure 1: Oligomeric dextran separated on a traditional 10 µm aqueous phase (black line) and an optimized 5 µm phase with one (blue line) and two (green line) 100 Å columns. The reduction of the particle size and the fl ow rate dramatically increased the resolution.
Tips & Tricks: GPC/SEC
10 Packer and Dalmia13 A Shotgun Approach17 Staff23CHROMacademy20 Training & Events21
Browne2 News6 Market Trends & Analysis8 Tips & Tricks: GPC/SEC966 88
The Column www.chromatographyonline.com
However for good chromatography,
the injected mass should be as low as
possible.
As it is always better to see something
in the detector than not to be able to
analyse at all, users of GPC/SEC and
hyphenated techniques should be aware
of the consequences when they increase
concentration or injection volume. Too
high an injected mass can produce
artifical peak shapes and wrong elution.
These effects are more pronounced for
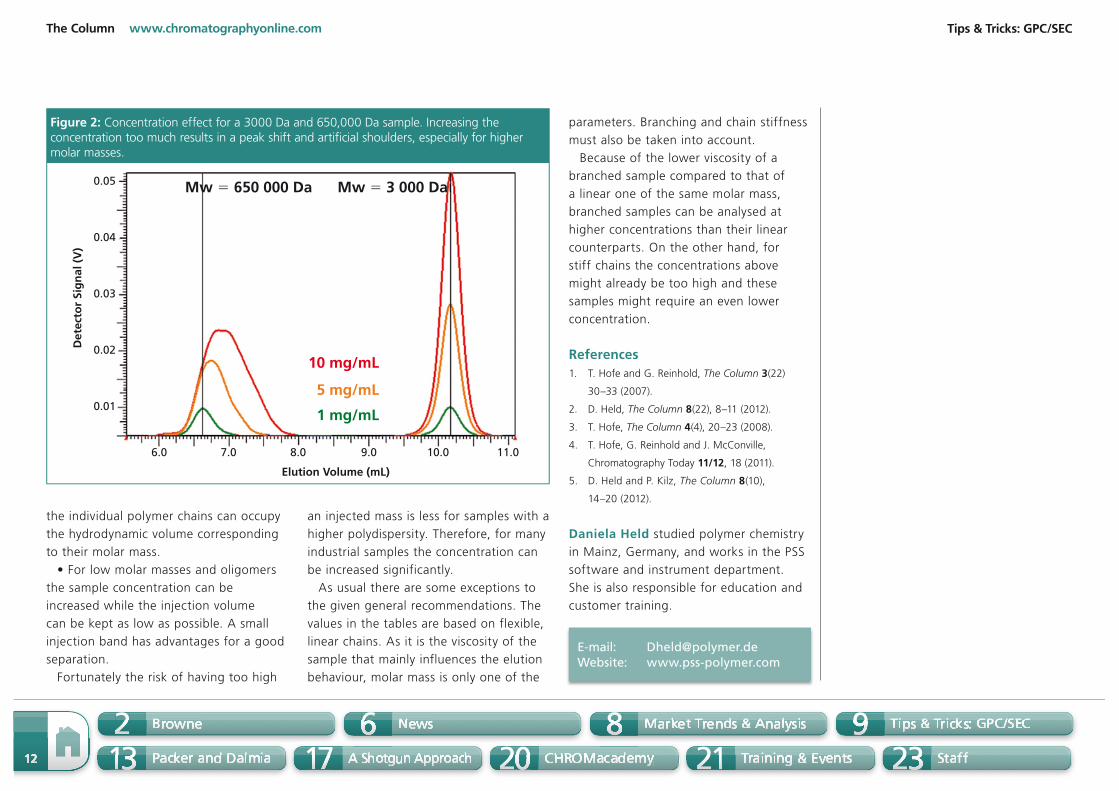
higher molar masses. Figure 2 shows the
effect of an increased concentration for
two samples with a low polydispersity
around D = 1.1 and with two different
molar masses. While the elution volume
of the peak maximum and the signal
shape change only slightly for the low
molar mass sample, the high molar mass
sample shows a shift to higher elution
volume and artifical shoulders. Not only
does the elution volume shift, but also
the chromatography can be disturbed,
resulting in erroneous distribution
information, even when using such
techniques as triple detection or on-line
light scattering.
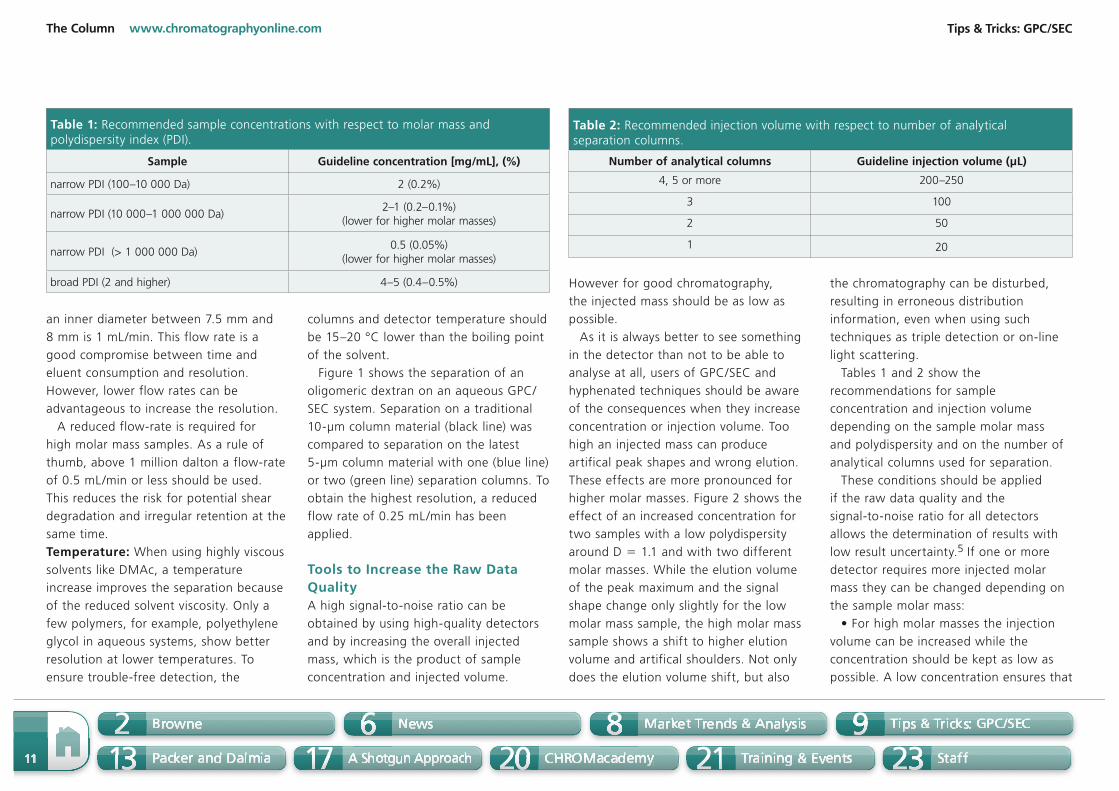
Tables 1 and 2 show the
recommendations for sample
concentration and injection volume
depending on the sample molar mass
and polydispersity and on the number of
analytical columns used for separation.
These conditions should be applied
if the raw data quality and the
signal-to-noise ratio for all detectors
allows the determination of results with
low result uncertainty.5 If one or more
detector requires more injected molar
mass they can be changed depending on
the sample molar mass:
t�'PS�IJHI�NPMBS�NBTTFT�UIF�JOKFDUJPO�
volume can be increased while the
concentration should be kept as low as
possible. A low concentration ensures that
an inner diameter between 7.5 mm and
8 mm is 1 mL/min. This flow rate is a
good compromise between time and
eluent consumption and resolution.
However, lower flow rates can be
advantageous to increase the resolution.
A reduced flow-rate is required for
high molar mass samples. As a rule of
thumb, above 1 million dalton a flow-rate
of 0.5 mL/min or less should be used.
This reduces the risk for potential shear
degradation and irregular retention at the
same time.
Temperature: When using highly viscous
solvents like DMAc, a temperature
increase improves the separation because
of the reduced solvent viscosity. Only a
few polymers, for example, polyethylene
glycol in aqueous systems, show better
resolution at lower temperatures. To
ensure trouble-free detection, the
columns and detector temperature should
be 15–20 °C lower than the boiling point
of the solvent.
Figure 1 shows the separation of an
oligomeric dextran on an aqueous GPC/
SEC system. Separation on a traditional
10-µm column material (black line) was
compared to separation on the latest
5-µm column material with one (blue line)
or two (green line) separation columns. To
obtain the highest resolution, a reduced
flow rate of 0.25 mL/min has been
applied.
Tools to Increase the Raw Data
Quality
A high signal-to-noise ratio can be
obtained by using high-quality detectors
and by increasing the overall injected
mass, which is the product of sample
concentration and injected volume.
Number of analytical columns Guideline injection volume (µL)
4, 5 or more 200–250
3 100
2 50
1 20
Table 2: Recommended injection volume with respect to number of analytical separation columns.
Sample Guideline concentration [mg/mL], (%)
narrow PDI (100–10 000 Da) 2 (0.2%)
narrow PDI (10 000–1 000 000 Da)2–1 (0.2–0.1%)
(lower for higher molar masses)
narrow PDI (> 1 000 000 Da)0.5 (0.05%)
(lower for higher molar masses)
broad PDI (2 and higher) 4–5 (0.4–0.5%)
Table 1: Recommended sample concentrations with respect to molar mass and polydispersity index (PDI).
Tips & Tricks: GPC/SEC
11 Packer and Dalmia13 A Shotgun Approach17 Staff23CHROMacademy20 Training & Events21
Browne2 News6 Market Trends & Analysis8 Tips & Tricks: GPC/SEC966 88
The Column www.chromatographyonline.com
the individual polymer chains can occupy
the hydrodynamic volume corresponding
to their molar mass.
t�'PS�MPX�NPMBS�NBTTFT�BOE�PMJHPNFST�
the sample concentration can be
increased while the injection volume
can be kept as low as possible. A small
injection band has advantages for a good
separation.
Fortunately the risk of having too high
an injected mass is less for samples with a
higher polydispersity. Therefore, for many
industrial samples the concentration can
be increased significantly.
As usual there are some exceptions to
the given general recommendations. The
values in the tables are based on flexible,
linear chains. As it is the viscosity of the
sample that mainly influences the elution
behaviour, molar mass is only one of the
E-mail: [email protected]: www.pss-polymer.com
parameters. Branching and chain stiffness
must also be taken into account.
Because of the lower viscosity of a
branched sample compared to that of
a linear one of the same molar mass,
branched samples can be analysed at
higher concentrations than their linear
counterparts. On the other hand, for
stiff chains the concentrations above
might already be too high and these
samples might require an even lower
concentration.
References
1. T. Hofe and G. Reinhold, The Column 3(22)
30–33 (2007).
2. D. Held, The Column 8(22), 8–11 (2012).
3. T. Hofe, The Column 4(4), 20–23 (2008).
4. T. Hofe, G. Reinhold and J. McConville,
Chromatography Today 11/12, 18 (2011).
5. D. Held and P. Kilz, The Column 8(10),
14–20 (2012).
Daniela Held studied polymer chemistry
in Mainz, Germany, and works in the PSS
software and instrument department.
She is also responsible for education and
customer training.
0.05Mw = 650 000 Da Mw = 3 000 Da
0.01
6.0 7.0 8.0 9.0 10.0 11.0
De
tect
or
Sig
na
l (V
)
0.04
0.03
0.02
Elution Volume (mL)
10 mg/mL
5 mg/mL
1 mg/mL
Figure 2: Concentration effect for a 3000 Da and 650,000 Da sample. Increasing the concentration too much results in a peak shift and artifi cial shoulders, especially for higher molar masses.
Tips & Tricks: GPC/SEC
12 Packer and Dalmia13 A Shotgun Approach17 Staff23CHROMacademy20 Training & Events21
Browne2 News6 Market Trends & Analysis8 Tips & Tricks: GPC/SEC966 88