Embed Size (px)
DESCRIPTION
Tips for Creating Electronic Presentations. Outline. Overview / Basics Content Visual Effects Presentation Organization and Coherence. Overview / Basics. Some general recommendations. Overview / Basics. Know your alternatives; examples include PowerPoint Prezi Be organized - PowerPoint PPT Presentation
Citation preview

Tips for Creating Electronic Presentations

Outline
• Overview / Basics• Content• Visual Effects• Presentation Organization and Coherence
2
Overview / Basics
Some general recommendations

Overview / Basics
• Know your alternatives; examples include– PowerPoint– Prezi
• Be organized– Title goes first– Agenda or outline comes next
• Always begin with an outline/agenda and stick to it• Use only main points in your outline/agenda
– Number your slides
4

Overview / Basics
• Tell a story• Keep it relevant• Proof your slides for:
– spelling misteaks– the use use of repeated words– grammatical errors you might have make
• If English is not your first language, please have someone else check your presentation!
5

Content
Elements that make up any presentation

Content: Slide Structure
• Write in bullets• Avoid wordiness• Include 4-5 bullets per slide• Use parallel structure
7
Content: Slide Structure to Avoid• This page contains too many words for a
presentation slide. It is not written in point form, making it difficult both for your audience to read and for you to present each point. Although there are exactly the same number of points on this slide as the previous slide, it looks much more complicated. In short, your audience will spend too much time trying to read this paragraph instead of listening to you.
8

Content: Credit
• Take credit for the presentation– Your name and affiliation goes with the title– Introduce yourself to the audience before
moving on from the title
9
Content: Credit
• Give credit to sources– “If you use a direct quote, put it in quotation
marks” (Dunning, 2006)– You also need to give credit when you
paraphrase (Dunning, 2006)– Include the reference at the bottom of the
page or on a final “bibliography” page
10

Content: Timing
• Allow an average of 2 minutes per slide– 30 seconds if you have a few quick bullets– 5 minutes if you have a graphic to explain
• Include transitions from one slide to the next
• Speak slowly• Allow for audience questions• Remember to leave time to breathe
11
Content: Special Effects
• Use sound and animation sparingly– They can be very distracting– Use sound only if it supports your main point– Be consistent with the animation you use
12

Visual Effects
What should your presentation look like?
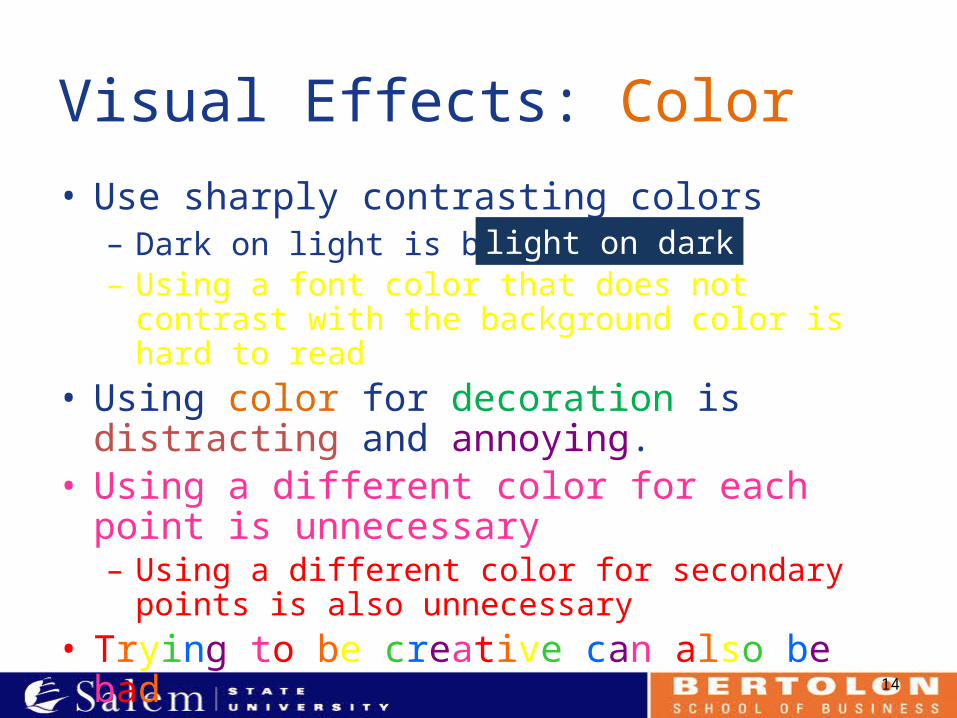
Visual Effects: Color
• Use sharply contrasting colors– Dark on light is better than– Using a font color that does not contrast with the
background color is hard to read
• Using color for decoration is distracting and annoying.
• Using a different color for each point is unnecessary– Using a different color for secondary points is also
unnecessary
• Trying to be creative can also be bad
light on dark
14

Visual Effects: Font
• Use large fonts• Use different size fonts for main points and
secondary points– This font is 24-point, the main point font is 32-point,
and the title font is 44-point– Do not go smaller than 18 point
• Use a standard font like Times New Roman or Arial
15

Visual Effects: Font• If you use a small font, your audience won’t be able to read what you have written
(this is 16 point)
• CAPITALIZE ONLY WHEN NECESSARY. IT IS DIFFICULT TO READ
• Don’t use a complicated font
• Sans-serif is better than font with serif
16

Visual Effects: Font
• Use a color of font that contrasts sharply with the background– E.g., dark blue font on white background
• Use color to reinforce the logic of your structure– Ex: Dark blue main topic and orange
secondary topic
• Use color to emphasize a point– But only use this occasionally
17

Visual Effects: Background
• Use backgrounds such as this one that are attractive but simple
• Use backgrounds which are light• Use the same background consistently
throughout your presentation
18

Visual Effects: Background – Bad
• Avoid backgrounds that are distracting or difficult to read from
• Always be consistent with the background that you use
19
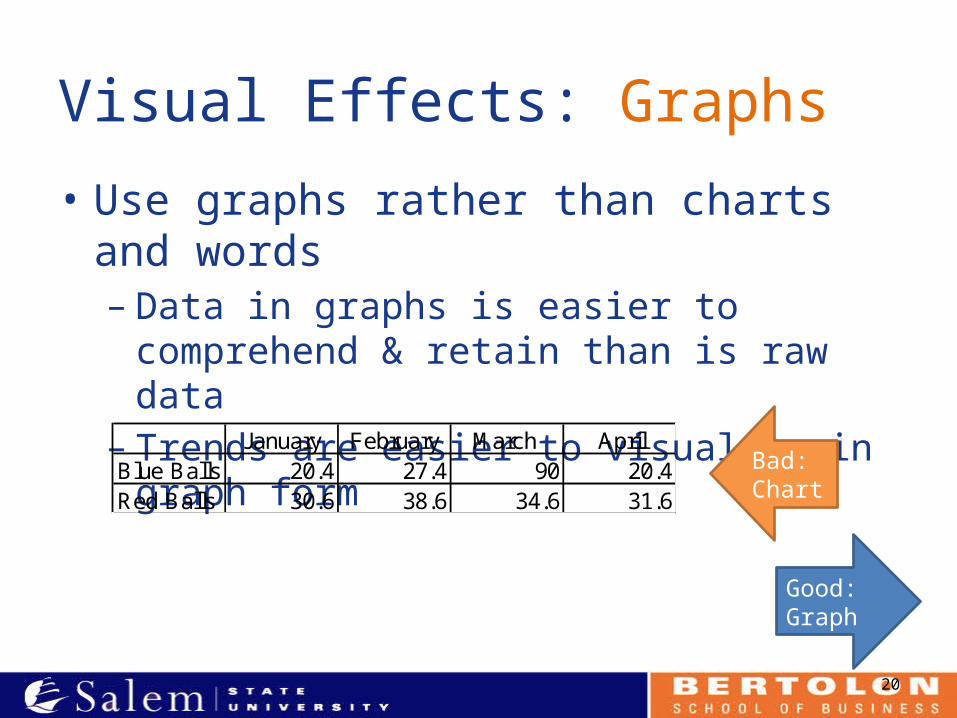
Visual Effects: Graphs
• Use graphs rather than charts and words– Data in graphs is easier to comprehend &
retain than is raw data– Trends are easier to visualize in graph form
• Always title your graphs
20
January February March AprilBlue Balls 20.4 27.4 90 20.4Red Balls 30.6 38.6 34.6 31.6
Bad: Chart
Good: Graph

Visual Effects: Graphs – good
0
10
20
30
40
50
60
70
80
90
100
January February March April
Items Sold in First Quarter of 2002
Blue Balls
Red Balls
21

Visual Effects: Graphs – bad
January February March April
0
10
20
30
40
50
60
70
80
90
20.4
27.4
90
20.4
30.6
38.6
34.631.6
Blue Balls
Red Balls
22

Visual Effects: Graphs – bad
• Minor gridlines are unnecessary• Font is too small• Colors are illogical• Title is missing• Shading and 3D effects are distracting
23

Presentation Organization and Coherence
What follows is typical content and organization of a slide presentation.
The BSB encourages students to use the BSB template.
24

This is your first slide: Put Your Title and Name Here

Introduction
– Note that this is not usually a separate slide; this should be done while the title is up
• Who you are• What this presentation is about• Your credentials for talking about this• Recognize experts in the audience
• Know your audience!!!
26

Agenda
• Presentation agenda– What you are going to tell them
• List outline of presentation
– How long you expect it to take to cover the material
– When to ask questions (during the presentation or at the end) and how much time is allotted for them
• Sample agenda and presentation follows
27

Agenda
• Executive Summary• Background• Details• Conclusion/Recap• Questions
28
[Note that this is a sample agenda for a sample presentation; you may need other topics]

Executive Summary
• Briefly do the following:– Tell the audience what the main point or bottom
line is– List facts, assumptions and caveats– Reference prior work done and conclusions
reached– Explain why conclusions reached from prior efforts
are different (where applicable)
• Try to keep this to one slide• This will all be more fully developed later
29
Background
• Review the issue • Explain prior research• Give credit
• Explain why we are talking about this issue
• Identify what the significance of this issue is with respect to current events
• This may take many slides
30
Details• Give a short overview of the approach used• Explain why this approach was used• Where appropriate show model used• Where appropriate, give a short overview on
data used– List sources for all data– Include dates for when data was pulled
• This might be better labeled “Analysis” “Model” “Methodology” or something else
• This may take many slides31

Details
• Show results (again, may require multiple slides)
– When using graphs ensure axes are properly labeled
– Avoid placing too much information on one slide
– Arrange information in so that it transitions smoothly
32
Conclusion
• Use an effective and strong closing– Your audience is likely to remember your last
words
• Use a conclusion slide to:– Summarize the main points of your
presentation– Note limitations– Suggest future avenues of research
33
Questions
• Leave time for the audience to ask questions
• Be precise in answering questions• Where necessary seek clarification• Be honest if you do not know that answer• Give the audience information on what
happens next
34
Thank You!
Contact information for further information:

References
• Dunning, A. E. (2006). The Art of Professional Presentation. Downloaded from http://www.clemson.edu/transportation/guidelines/Professional%20Presentation.doc
• Much of this slide presentation has been adapted from International Association of Science and Technology for Development (IASTED)
36