Embed Size (px)
Citation preview

Tinker Air Force Base
143
Case Study Abstract
Tinker Air Force BaseOklahoma City, OK
Site Name and Location:Tinker Air Force Base
Geophysical Technologies:ElectromagneticsSeismic reflectionSeismic Modeling
RCRA Permit #1571724391
Period of Site Operation:1942 - present
Operable Unit:Not applicable
Current Site Activities:Portions of the base are undergoinginvestigation and remediation under theInstallation Restoration Program
Point of Contact:Sara SaylerOC-ALC/EMR7701 Arnold Street, Suite 221Tinker Air Force BaseTinker, OK [email protected]
Geological Setting:Permian-age sedimentary rocksoverlain by Quaternary alluvium, sanddunes, and terrace deposits
Technology Demonstrator:IT Corporation312 Directors DriveKnoxville, TN 37923-4799Phone - 423-690-3211Fax - 423-690-3626
Purpose of Investigation:To help identify and map possible conduits for preferential groundwater flow in the shallow subsurface. The site-specificdecision being supported was to obtain additional information in planning the optimal placement of the installation ofgroundwater recovery wells.
Number of Images/Profiles Generated During Investigation: 17,510 linear feet of seismic profiles collected along 8 survey lines. This case study focuses on the modeled and interpretedcompressional (p-wave) results from a portion of Line 4 and an intersecting portion of Line 5. These lines were selected torepresent typical site data and anomalies. This intersection is also the location of an interpreted sand channel near theintersection of the two lines, making it easier to demonstrate the continuity of the interpreted sand channel.
Results: Interpretation of the seismic data indicates several places where sand channels cut into the Upper Saturated Zone/LowerSaturated Zone (USZ/LSZ) aquitard. The seismic reflection survey results will be used to recommend the placement ofPhase II recovery well drilling locations. The results of Phase I groundwater recovery well yield tests indicated goodcorrelation with several of the seismic anomalies identified in the target zones by the seismic survey. Seismic modeling wasconducted to provide support for the interpretation of the seismic results. A EM-31 terrain conductivity survey wasconducted along the eight seismic lines to screen for large scale anomalies caused by metallic objects that might interferewith the seismic survey. Most of the anomalies were due to surface metal, such as the chain-link fences, nearby structures,and monitoring well monuments.

Tinker Air Force Base
144
EXECUTIVE SUMMARY
Tinker AFB covers 4,277 acres and is located on the southeast edge of the Oklahoma City metropolitanarea. The base is situated within the North Canadian River drainage basin and drains into the Crutcho andSoldier Creeks and overlies a complex aquifer system that includes the Garber-Wellington Formation. TheSouthwest Quadrant Stabilization System (SQSS) Area is the location of two landfills that were usedsporadically for disposal over a forty-year span from the 1940s to the late 1960s for disposal of sanitaryand industrial wastes, including paints and solvents.
Near-surface geology at Tinker AFB consists of clays and clayey silts that are interbedded with thin, clayeysand layers, reaching a maximum thickness of approximately 60 feet in the western and southwestern partsof the base. The deeper geology is comprised of mostly unconsolidated materials, which are composed ofpredominantly fine-grained sandstone, with lesser amounts of siltstone and shale. Bedrock formations dipto the southwest by approximately 0.5 degrees, or by 40 to 50 feet per mile. Groundwater occurs at thesite in four water-bearing units, but only the surficial unit was the target for this study. Groundwater canoccur at depths as shallow as 20 feet, but public water supplies are drawn from depths of greater than 400feet.
The purpose of the seismic survey was to locate permeable layers in the subsurface that might indicatepreferential pathways for groundwater flow. This information is being used to site new extraction wells forthe groundwater pump and treat system. Seismic methods were chosen as a cost-effective method forgathering information on the subsurface stratigraphy. The geology of the area is highly complex and otherinvestigative methods, such as soil borings, would have yielded less information at a higher cost.
Two geophysical methods were used during this investigation: electromagnetic (EM) reconnaissancesurvey, and a seismic survey. The EM survey was conducted to screen for subsurface conditions thatmight cause interference in the seismic data collection. The seismic survey was conducted to identifyconductive layers in the subsurface that might be paths for groundwater migration. Seismic modeling wasconducted to provide analytical support for the interpretation of the seismic results.
The seismic survey revealed the presence of sand channels that were incised into the uppermost aquitardand sand lenses located within that aquitard. Seismic modeling significantly improved the investigator’sunderstanding of the seismic anomalies that were found by providing an analytical benchmark againstwhich to compare the seismic results. Strong correlation was found between the location of significantseismic anomalies and known groundwater flow pathways.
The target structures were relatively shallow and groundroll effects were not a significant source ofinterference. Poor surface conditions and cultural sources did, however, posed difficulties to datacollection. Several seismic data processing techniques, such as refraction statics, spectral whitening, andmute analysis, significantly reduced the level of interference in the data and allowed for increased frequency andresolution of the seismic results.

Tinker Air Force Base
145
Figure 1: Site Location
SITE INFORMATION
Identifying Information
Tinker Air Force Base (AFB)Oklahoma City, OKRCRA Permit # 1571724391Southwest Quadrant SMU
Background [1, 2]
Physical Description: Tinker AFB covers 4,277 acres and is located on the southeast edge of theOklahoma City metropolitan area (see Figure 1). The base is bordered by Sooner Road to the west,Douglas Boulevard to the east, interstate highway I-40 to the north, and SE 79th street to the southThe base is situated within the North Canadian River drainage basin and drains into the Crutchoand Soldier Creeks. The base overlies a complex aquifer system that includes theGarber-Wellington Formation .
The topology of the seismic study area, located in thesouthwest portion of the base, is characterized bynearly level plains to gently rolling hills, with surfaceelevations ranging from 1,240 to 1,270 feet abovemean sea level. The surface consists of alluvial soilsnear streams and flood plains, and residual soilsresulting from weathered bedrock [1].Site Use: The Southwest Quadrant StabilizationSystem (SQSS) Area is the location of two landfillsthat were used sporadically for disposal over a forty-year span from the 1940s to the late 1960s. Landfill #2 was used during the 1940s and 1950s for disposal of sanitary and industrial wastes,including paints and solvents. Landfill #4 was used from 1961 to 1968 for the disposal ofdrummed solvents, and sludges from petroleum and solvent storage tanks.
Release/Investigation History: On-site disposal of industrial wastes occurred from 1942 until1979 when off-site disposal became the standard disposal practice. Organic solvents, includingtrichloroethylene (TCE), tetrachloroethylene, and l,2-dichloroethylene, were used for degreasingand aircraft maintenance. In the past, waste oils, solvents, paint sludges, and plating wastegenerated from maintenance activities were disposed in Industrial Waste Pits Numbers 1 and 2,located about l mile south of Soldier Creek and Building 3001. In 1997, a groundwater treatmentsystem was installed to treat contaminated groundwater.
Regulatory Context: Actions at this site are being undertaken in compliance with Federal andState regulations under the Resource Conservation and Recovery Act (RCRA).

SITE INFORMATIONTinker Air Force Base
146
Figure 2: Site location map with seismic survey lines [1].

SITE INFORMATIONTinker Air Force Base
147
Site Logistics/Contacts
Federal Lead Agency: United States Air Force
Federal Oversight Agency: Environmental Protection Agency
Site Contact:Sara SaylerOC-ALC/EMR7701 Arnold Street, Suite 221Tinker Air Force BaseTinker, OK [email protected]
Remedial Project Manager:Ruby WilliamsEPA Region 6214-665-67331445 Ross Avenue Suite # 1200Dallas, TX [email protected]
Geophysical Subcontractor:IT Corporation312 Directors DriveKnoxville, TN 37923-4799423-690-3211
MEDIA AND CONTAMINANTS
Matrix Identification
Type of Matrix Sampled and Analyzed: Subsurface soil/Bedrock
Site Geology/Stratigraphy
Near-surface geology at Tinker AFB consists of the Permian-age Hennessey Group and theGarber-Wellington Formation. The Hennessey Group is composed of clays and clayey silts thatare interbedded with thin, clayey sand layers, reaching a maximum thickness of approximately 60feet in the western and southwestern parts of the base. The Hennessey Group is underlain by themostly unconsolidated materials of the Garber Formation, which are composed of predominantlyfine-grained sandstone, with lesser amounts of siltstone and shale. The deeper WellingtonFormation has a similar lithology to the Garber Formation, and together the two comprise the1,000-foot thick Garber-Wellington Formation. Bedrock formations dip to the southwest byapproximately 0.5 degrees, or by 40 to 50 feet per mile.
Groundwater occurs at the site in four water-bearing units, that include the Hennessey WaterBearing Zone (HWBZ), the Upper Saturated Zone (USZ), the Lower Saturated Zone (LSZ), andthe Producing Zone (PZ). The HWBZ consists of fine-grained sediments with very lowtransmissivity and large vertical hydraulic gradients. Beneath the HWBZ, the USZ is theuppermost waterbearing zone of the Garber-Wellington aquifer. The USZ is made up ofpermeable sand channels and lenses. It is generally believed that the HWBZ and the USZ are nothydraulically connected. The USZ/LSZ aquitard is comprised of overlapping clay layers withinterbedded thin sand lenses and is not of uniform thickness. The aquitard ranges in thickness from
MEDIA AND CONTAMINANTSTinker Air Force Base
148
less than 10 feet to more than 25 feet, with the base of the aquitard occurring at a depth ofapproximately 110 feet below ground surface (bgs) in the southwest portion of the study area. TheLSZ ranges between 140 and 200 feet in thickness, and is separated from the underlying PZ by the30- to 100-foot-thick LSZ-PZ aquitard. The PZ extends from between 210 and 280 feet bgs tomore than 1,000 feet bgs, and is used as the primary source of groundwater on the base andelsewhere in the Oklahoma City area. Groundwater can occur at depths as shallow as 20 feet, butpublic water supplies are drawn from depths of greater than 400 feet.
Contaminant Characterization
Primary Contaminant Groups: Volatile organics such as TCE.
Matrix Characteristics Affecting Characterization Cost or Performance [1, 2]
Certain subsurface structures, such as utilities and buried metallic objects, can cause interference,or noise, in the seismic data. To screen for such structures, frequency-domain electromagnetic(EM) data were acquired along the seismic lines. No significant sources of subsurface interferencewere found.
Significant interference with the seismic data collection was caused by muddy surface conditionsand standing water along portions of the survey lines, particularly along Line 8. The seismicenergy was significantly attenuated as it passed through the saturated soils, resulting in poorseismic data quality along those lines. Other surficial sources of interference included culturalnoises, such as pumps, vehicles, wind and aircraft.
Groundroll can cause interference in data collection and interpretation. Groundroll is caused byseismic waves that travel horizontally toward the geophone sometimes obscuring the collection ofseismic waves originating from deeper structures. During the investigation at Tinker AFB, the thehigh velocity surface materials reduced interference from the slow groundroll and the targets ofprincipal interest were shallow and mostly located outside of the groundroll noise cone.
GEOPHYSICAL INVESTIGATION PROCESS
Investigation Goals [2, 3]
To help identify and map permeable materials in the USZ and the USZ/LSZ aquitard that mightindicate preferential groundwater flow in the shallow subsurface. This information was used toplace extraction wells to optimize the groundwater extraction system. The primary target ofinterest was near-surface sand channels and lenses within the USZ aquifer and the USZ/LSZaquitard which may form preferential flow channels in the subsurface [2].

GEOPHYSICAL INVESTIGATION PROCESSTinker Air Force Base
149
Geophysical Methods [1, 2]
Two geophysical methods were used during this investigation: electromagnetic (EM)reconnaissance survey, and a seismic survey. The EM survey was conducted to screen forsubsurface conditions that might cause interference in the seismic data collection. The seismicsurvey was conducted to identify conductive layers in the subsurface that might be paths forgroundwater migration.
The EM survey was performed to detect sources of potential interference to seismic data collection. The EM survey sought to identify variations in the electrical conductivity of subsurface materialsthat might be caused by buried objects, conductive fluids, or geologic discontinuities. Byartificially applying a known electromagnetic field to the ground surface by means of a transmitter,investigators measure the presence of disruptions to the known electromagnetic field with areceiver. These disruptions, termed EM anomalies, can result from either geological changes or thepresence of metallic objects, such as pipes, drums, cables, tanks, etc., in the subsurface. The EMsurvey conducted at Tinker AFB was used to identify buried materials that might interfere withseismic survey by scattering or attenuating seismic waves. A Geonics Limited EM-31 terrainconductivity meter coupled to an Omnidata DL720 digital data logger was used to collectquadrature-phase and in-phase component data along the length of each seismic line in the surveyarea.
The seismic reflection method was used to collect seismic data in the subsurface with whichpermeable layers in the subsurface can be identified. These permeable layers may act asgroundwater migration pathways, and may be good locations for future extraction wells. In aseismic reflection survey, an artificial seismic source is used to create an acoustic wave thatpropagates downward through the soil layers. When the wave reaches a soil layer whose seismicconductivity is significantly different from that of the overlying soils, a portion of the wave is re-directed to the surface. A geophone, or electromechanical transducer, is used at the surface toreceive the reflected wave energy. Subsurface stratigraphy is then mapped by measuring the traveltime necessary for a wave to pass through one layer to another, refract along the interface, andreturn to the geophones at the surface. Seismic field equipment used to conduct the surveyconsisted of three 48-channel Geometrics Strataview® seismographs in a master-slaveconfiguration, totaling 144 channels. Single, 40-Hz vertical geophones were used for collection ofp-wave data.
Seismic modeling was conducted to provide support for the interpretation of the seismic results. Seismic models were developed to depict the anticipated seismic response of various types ofsubsurface stratigraphy that might be encountered in the study area, i.e. sand channels cutting intothe aquitard or sand lenses embedded in a clay layer. Well lithologies and sonic logs acquired inwells located within the survey area were used to develop estimates of the seismic velocities of thevarious soil types found within the study area. These estimates were used to construct hypotheticalseismic models of subsurface structures of varying thickness and composition. When seismicanomalies were encountered in the survey data, the actual seismic response was compared to themodeled response of different stratigraphic features to help identify the type of subsurface

GEOPHYSICAL INVESTIGATION PROCESSTinker Air Force Base
150
stratigraphy that might create such an anomalous response. The use of seismic models greatlyaided investigators in their interpretation of the seismic results by providing a set of benchmarksagainst which actual results could be compared [4].
Seismic lines were chosen to satisfy three criteria:
C The survey area should include parallel and perpendicular coverage of a known geologicstrike. The lines within the area were located so that velocity data could be acquired in atleast one well on at least one line of the survey, and each of the lines were to have at leastone tie with another line in the survey.
C The survey area should include areas in which known contaminant plumes were present;and
C The survey lines should be placed in areas whose groundwater is under hydraulic controlfrom the groundwater pump and treat system.
Prior to collecting geophysical data, each seismic survey station was geospatially surveyed using aGlobal Positioning System (GPS). The ability to geospatially reference the seismic profilesallowed investigators to understand the relationships between the individual seismic profiles and thelarger site geology. Horizontal and vertical geospatial accuracies were kept within 0.5 feet and 0.1feet, respectively.
A field test of the seismic parameters was used to evaluate the relative merits of collecting differenttypes of seismic wave during the survey, and to determine the optimal distance between the seismicsource and the geophones. Data on two types of seismic waves: compressional (p-wave) andshear(s-wave) wave, were acquired along a short test section of Line 5 to evaluate and compare theresults such surveys would produce at the site. While p-wave data, the seismic wave that isprojected downward, were less complex to collect and interpret, s-wave data often provide a higherresolution. S-wave data are collected as the seismic energy is transmitted horizontally from thesource to the receiver. Along this test section, p-wave data were recorded using vertical sourceimpacts and vertical geophones, and s-wave data were recorded using horizontal impacts andhorizontal, s-wave, geophones. Based on the noise tests conducted in the field and the depth of thetarget, a 5-foot station and l0-foot shotpoint (energy source) spacing were used for the survey. Theinvestigators decided that the p-wave data would provide sufficient resolution to identify thetargeted subsurface structures, and, therefore, no additional s-wave data were collected.

Tinker Air Force Base
151
GEOPHYSICAL FINDINGS
Technology Calibration [1, 2]
The calibration needed for a successful seismic survey is to establish the relationship between thedepth of an anomaly in the subsurface and the time it takes a seismic wave to propagate to thatanomaly and return back to the surface. In other words, the seismic time must be “tied” to depth. To establish this link at Tinker AFB, investigators collected vertical seismic profiles (VSPs) andsonic logs. The sonic logs were used to construct synthetic seismograms. A synthetic seismogramis a statistical comparison of seismic velocity, soil density, and depth values used to convertseismic velocity data into depth.
The VSP data were acquired in two monitoring wells with maximum depths of approximately 150feet in order to better understand the subsurface velocities. For each profile, a geophone is lockedin a well at regular depth intervals and used to record the energy from a surface source at eachinterval. The time lapse recorded between source and receiver is a measure of the time necessaryto go from the surface to the geophone in the well is displayed as a time versus depth graphic.
Data from an existing sonic log in a nearby well was also used to link the seismic time data todepth. Together, the sonic log and the VSP data, were used to generate a synthetic seismogram. The seismogram provides a correlated display of seismic velocities, time and known depths toreflectors. These correlations establish the link between the seismic velocity of certain subsurfacematerials and the depths at which those materials were encountered.
Investigation Results [1, 2]
The EM-31 reconnaissance survey was conducted along the eight seismic lines and revealed large-scale anomalies caused by metallic objects. Most of the anomalies were caused by surface metal,such as the chain-link fences, nearby structures, and monitoring well monuments. Subsurfaceanomalies were also identified as subsurface pipelines that cross the area, such as a north-to-southtrending pipe that exists in the western part of the site.
More than 17,000 linear feet of seismic data were collected along eight survey lines and theresulting profiles identified four reliable locations for future extraction wells. For the purposes ofthis case study, however, the discussion presented focuses only on the interpreted and modeled resultsfrom the intersecting portions of Lines 4 and 5, as shown in Figure 2 on page 3. The seismic results alongboth lines showed a sand channel near the intersection of the lines, increasing the reliability theinterpreted sand channel and its continuity. None of the EM anomalies, discussed above, werelocated within this area [3].
Muddy surface conditions and standing water along portions of the survey lines caused significantvariation in and interference with the quality of the seismic data collected. Two statistical solutionswere applied to improve the quality of the data. Refraction statics, proved most effective inminimizing the noise in the data. The adjusted data had less variation and improved resolution.

GEOPHYSICAL FINDINGSTinker Air Force Base
152
The seismic reflection survey was conducted along each line using a 5-foot interval betweengeophones and a 10-foot shotpoint interval. Data were acquired using a 0.5-millisecond (msec)sampling rate; the record length was 1,024 msec. As data quality warranted, source impacts pershotpoint were adjusted along each line.
The seismic profile generated along Line 4 at its intersection with Line 5 is shown in Figure 3. Inthis profile, the top of the USZ/LSZ aquitard was interpreted to be at approximately 70-75 feet bgs(25 msec), and the bottom of the aquitard was interpreted to be at approximately 110-115 feet bgs(35 to 40 msec). Although only the USZ was targeted for this study, other structures can be seenin Figure 3, such as the base of the LSZ, where the LSZ/PZ aquitard occurs, at approximately 295feet bgs (75 msec). One significant anomaly can be seen in this Figure, centered on Station 295,and is outlined by hash marks. This feature was interpreted to be a large sand channel within theupper portion of the USZ/LSZ aquitard which is laterally continuous and was considered to be partof a larger structure that can be seen nearby on the Line 5 section. The channel was presumed totrend north to northeast, roughly in line with the high-yield B6 and B7 recovery wells. The seismicmodel data indicate that this anomaly could be caused by the presence of a low conductivitymaterials (i.e. sand) embedded in higher conductivity materials (i.e. silts and clays). Above thischannel, the seismic data indicate the presence of a low velocity medium, likely a sand within theUSZ aquifer. This channel was suggested as a good location for a future extraction well.
The seismic profile generated along Line 5 at its intersection with Line 4 is shown in Figure 4. Thebottom of the USZ/LSZ aquitard can be seen at a depth of 110-115 feet bgs and a noticeable lowin this area (represented by the dashed line) indicated the presence of materials with similar seismicvelocity incised into the base of the aquifer, and/or the accumulation of slower velocity materialslocally, such as would be expected from a sand channel. Two anomalies appear in the Line 5 datashown in Figure 4. A broad and subtle anomaly extending between stations 680 and 693 at a depthof approximately 75-80 feet bgs was interpreted as a small incised sand lens at the bottom of theUSZ aquifer. The feature extending from station 650 to 667 at a depth of 80-90 feet bgs wasinterpreted to be part of the same large sand channel that occurs along Line 4.
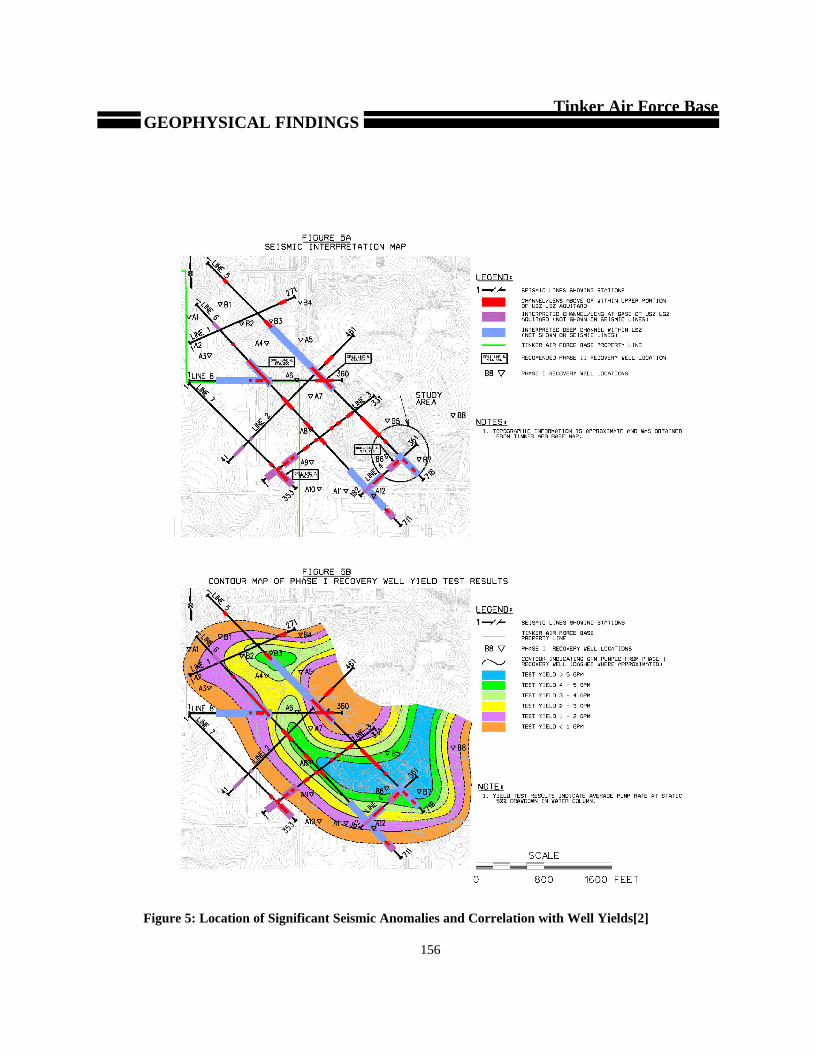
A seismic interpretation map of the entire survey area with the locations of interpreted channelsand lenses above and within the upper portion of the USZ/LSZ aquitard is shown in Figure 5A. Several channels were interpreted near the bottom of the USZ/LSZ aquitard, and several deepchannel systems were interpreted within the LSZ (not discussed here). There is a substantialconcentration of interpreted lower aquitard channels in the southern and southeastern portion of thesurvey area, and deep channel systems in the central and southeastern portions of the survey area.

GEOPHYSICAL FINDINGSTinker Air Force Base
153
Results Validation [1]
Seismic data indicating areas of high hydraulic conductivity were compared to well yield testresults from the existing Phase I recovery wells which were drilled to an average depth of 80 to 90feet. All of the Phase I wells were drilled in locations based on engineering factors, plume location,and groundwater flow direction. Wells A8, B3, B6, and B7 were drilled near anomalies identifiedby the seismic data discussed in this case study. Figures 5A and 5B show the correlation betweenhigher yield zones, as determined with pump tests on the Phase I wells, and the locations of thesand channel identified at the intersection of Lines 4 and 5. On Line 5, anomalies centered onStation 658 correspond to high yields on the B6 and B7 recovery wells. Another anomaly foundalong Line 5 and interpreted as a sand channel, centered on Station 205, corresponds to the highyield recovery well B3. On Line 6, the anomaly centered near Station 390 corresponds to the highyield A8 recovery well. Several other interpreted sand channels have not been verified at this time. These areas present target locations for possible future Phase II recovery wells.
Further validation was provided by sonic logs taken in five of the extraction wells that were locatedon or near the seismic survey lines. These helped to confirm reflector identification and alsodemonstrated good correlation between the seismic findings and well tests [3].

GEOPHYSICAL FINDINGSTinker Air Force Base
154
Fig
ure
3: I
nter
pret
ed R
efle
ctio
n Se
ctio
n on
Lin
e 4
[2].

GEOPHYSICAL FINDINGSTinker Air Force Base
155
Fig
ure
4: I
nter
pret
ed R
efle
ctio
n Se
ctio
n on
Lin
e 5
[2].
GEOPHYSICAL FINDINGSTinker Air Force Base
156
Figure 5: Location of Significant Seismic Anomalies and Correlation with Well Yields[2]

Tinker Air Force Base
157
LESSONS LEARNED
Lessons learned at the Tinker AFB study site include the following:
• The seismic survey results identified several areas in which permeable zones in thesubsurface are located and which may be favorable locations for future well installation. Four of these sites represent locations where the highest potential for drilling intosignificant sand channels is thought to exist [1].
• The EM survey successfully identified large scale anomalies caused by metallic objects,such as the chain-link fences, nearby structures, and monitoring well monuments. The EManomalies found did not present a problem for the seismic data quality.
• Existing well yield data correlates well with several of the anomalies that are interpreted aschannels. Incorporation of recently acquired sonic log data and lithologic logs fromextraction wells drilled near any of the seismic lines with the seismic data will beparticularly useful for refining stratigraphic and depth correlation [1].
• The relatively high seismic velocities in the unconsolidated sediments at this site reduce thespatial resolution that can be attained from the data. S-wave data should increaseresolution compared to the p-wave data. However, for this site, the s-wave data provedinferior when compared to p-wave data, especially when the additional cost for acquiringand processing the s-wave data is considered[2].
• The results developed for this site are only valid for two-dimensional cross sections of thesubsurface beneath each seismic line. If delineation of the spatial distribution of featuresbetween lines is required, the acquisition of three-dimensional data should be considered atthis site [2]. Three-dimensional seismic techniques were the preferred method, but due tothe large areal extent of the survey area and associated data acquisition and processingcosts, the two-dimensional method was used [1].
• The application of seismic data processing algorithms, such as refraction statics andspectral-whitening, reduced the level of interference in the data. This, combined withthorough velocity and mute analysis along the seismic lines, allowed for increasedfrequency and resolution of the seismic results [1].
• Seismic results often reveal a number of anomalous results attributable to a large varietyof conditions, such as poor surface conditions, interference from cultural sources, orvariation in seismic wave generation. These anomalies may, on the other hand, representthe target structures. The use of seismic models in this survey aided the investigators byhelping them quickly identify whether the anomalous results were due to difficulties in dataacquisition or target structures. Moreover, by comparing seismic anomalies to modelresults, investigators were able to refine their interpretation of the anomalous responses byhelping them to distinguish between different lithologic changes, such as a discontinuity ina clay layer and a sand channel incised into the clay layer [4].

Tinker Air Force Base
158
REFERENCES
• Hackworth, Jeffrey B., Sayler, Sara, Steensma, Gilein J., and Marcum, David W. SeismicReflection Survey For Mapping Groundwater Migration Pathways at Tinker Air ForceBase, Oklahoma. Proceedings of the Symposium on the Application of Geophysics toEngineering and Environmental Problems (SAGEEP) 1998.
• IT Corporation and Steensma, G. J. 2-D Seismic Reflection Survey Southwest QuadrantStabilization System Area Tinker Air Force Base Oklahoma City, Oklahoma. Draftreport. June 1997.
• Personal communication with Sara Sayler of Tinker Air Force Base. August 25, 1999.
• Personal communication with Sara Sayler of Tinker Air Force Base. December 17, 1999.