Embed Size (px)
Citation preview
land
Article
Timing of Tree Density Increases Influence of Climate Changeand a Land Use Proxy for Tree Density Increases in the EasternUnited States
Brice B Hanberry
Citation Hanberry BB Timing of
Tree Density Increases Influence of
Climate Change and a Land Use
Proxy for Tree Density Increases in
the Eastern United States Land 2021
10 1121 httpsdoiorg103390
land10111121
Academic Editor
Svetlana Turubanova
Received 30 September 2021
Accepted 19 October 2021
Published 22 October 2021
Publisherrsquos Note MDPI stays neutral
with regard to jurisdictional claims in
published maps and institutional affil-
iations
Copyright copy 2021 by the author
Licensee MDPI Basel Switzerland
This article is an open access article
distributed under the terms and
conditions of the Creative Commons
Attribution (CC BY) license (https
creativecommonsorglicensesby
40)
USDA Forest Service Rocky Mountain Research Station Rapid City SD 57702 USA bricehanberryusdagov
Abstract Long-term observations inform relationships among changes in vegetation climate andland use For the eastern United States I compared the timing of tree change comprised of densityand diversity increases with the timing of climate change as measured by change point detectionof the Palmer Modified Drought Index (PMDI) that accounts for water balance in two prairieecological provinces four grassland landscapes and four forest landscapes Historical evidencesupplied documentation of tree density increases between approximately 1860 and 1890 in thetwo prairie provinces of grasslands bordering eastern forests Additionally because timing of treeincreases paralleled when land area reached ge25 agricultural use I categorized grassland andforest landscapes that increased to ge25 agricultural area during 1860 1880 1900 and 1920 Onechange point detection method identified no significant PMDI change points during the 1800s Theother method found the southern prairie province bordering eastern forests had change points of1855 and 1865 during an interval of relative dryness Only two of four grassland landscapes andone of four forest landscapes had change points which occurred during relative dryness or werecontinuous with historical variation Inconsistent changes in moisture availability did not providecorrelations with comprehensive tree increases but land use change corresponded with tree changesbased on timing magnitude and direction of change and mechanism The agricultural thresholdmay provide the critical missing component that allows progression in analysis of land use changeeffects on vegetation
Keywords alternative state drought fire moisture PDSI PMDI state change
1 Introduction
Historical records impart the necessary context to identify general timing and magni-tude of vegetation changes and to separate land use and climate influences on vegetationchanges The degree to which climate and land use contribute to changes in vegetationis not established Climate has conventionally been used to explain distribution and typeof ecosystems and climate data typically have been more accessible than land use dataHowever examination of current trends in tree density or diversity during recent decadeswithout consideration of comprehensive forest transitions during past centuries will notdiscern whether trends are new or long-standing transitions due to changing baselineconditions If timing of tree changes in density or diversity is misidentified a mismatchbetween tree change and climate change will occur Depending on the timing of whentree change is first documented to occur examination of the corresponding climate maybe decades or centuries too late For example in the eastern United States precipitationhas generally increased during the 1900s particularly since the 1970s which can resultin confounding climate change with wholesale land use changes since Euro-Americansettlement [1ndash3]
Furthermore a lag interval may occur between when climate changes which com-monly is a 30 year period of sustained change as opposed to typical weather variationand when tree density and diversity change enough in response to override the inertia of
Land 2021 10 1121 httpsdoiorg103390land10111121 httpswwwmdpicomjournalland
Land 2021 10 1121 2 of 17
older trees in forests Trees are slow-growing long-lived and immobile after establishmentresulting in resistance to change under historical range of variation Saplings sometimesare examined but most saplings will die regardless of conditions simply because manymore saplings are produced than can become canopy trees therefore saplings are indefi-nite indicators of change because they have not yet succeeded at surviving conditions toadulthood Unless forests are extensively cleared or trees are scarce or at lower densitiessuch as in grasslands or savannas trees that are surveyed during a 30 year interval maybetter reflect conditions of the previous 30 years or longer given the mean age of forests
Even a significant climate change that corresponds with tree change in density ordiversity may not necessarily cause consistent changes in tree density or diversity particu-larly if the magnitude of change is relatively small or the sign or direction of climate changevaries Significant climate changes may not be ecologically meaningful if climate changeremains within historical variation of when trees did not change in density or diversity [3]Most tree species are distributed across a range of annual total precipitation and significantprecipitation change may not be equivalent to an effect size in tree response If the samepatterns of tree change in density or diversity occur under a variety of different climateconditions then climate is not a sufficient mechanism for tree change Indeed in somecases trees may have the same response of increased density and diversity under droughtas under increased moisture because they are actually responding to other more immedi-ately influential disturbance changes such as no longer dying from fire (ie drought canreduce the quantity of fuels available to burn trees [4ndash6])
Historical tree surveys and pollen records demonstrate that primary tree compositionof oaks and pines has remained stable at landscape scales in the eastern United Statesfor at least the past few thousand years throughout a range of moisture and temperaturevariability until changing after Euro-American settlement [78] Historical open oak- andpine-dominated forests that were most dominant during the 1800s may have persisted forhundreds of years without replacement due to low severity non-stand-replacing distur-bances [9] Long-lived oak and pine trees recorded in historical tree surveys during the1800s or earlier represent a relatively unbroken timeline That is 1000 years of climate mayrepresent two to four generations of oak and pine trees because oak and pine trees presentduring the 1800s may have established during the 1500s to 1600s and were offspring oftrees that likely similarly lived for hundreds of years and provided the major source ofpropagules and advance regeneration to the forests
Since Euro-American settlement in the eastern United States many tree species havedensified where they are present and expanded in range which has been attributed to bothincreased precipitation and exclusion of frequent surface fires in addition to other land usechanges [2810] Current closed successional forests of diverse tree species are novel andnot analogous to historical open old-growth fire-dependent oak and pine forests or closedold-growth forests of shade-tolerant tree species [71011] Most naturally regeneratedforests in the eastern US are young due to frequent overstory tree removal with a meanage of 40 to 80 years [12] The southeastern US contains even younger loblolly pine (Pinustaeda) plantations harvested in 20 to 30-year rotations in which broadleaf species typicallyare controlled with herbicides thus intensive forestry products management supplantstree response to other influences
With a hard boundary of ocean to the east eastern tree species are concurrently shiftingwestward in distribution into the central grasslands of the United States (Figure 1) [13]which has been ascribed to slight increases in precipitation [2] Based on survey recordsduring the 1800s of trees that were present historically in the tallgrass prairie provincesbordering eastern forests fire-tolerant oaks may have been about 65 of all trees alongwith some representation by upland hickories and also lowland elms and similar mesicfire-sensitive species (eg in wetland prairies and along the Missouri River and numeroustributaries) [6814] Historically rare or nearly absent fire-sensitive but drought-toleranteastern redcedar (Juniperus virginiana) and a variety of mesic fire- and drought-sensitivespecies have increased in Nebraska Illinois and Missouri [81516] In the southern
Land 2021 10 1121 3 of 17
prairie province of Texas Juniperus ashei and Prosopis glandulosa are examples of speciesthat have increased in density and expanded in grasslands [17] Furthermore easternforests as a whole are also expanding and replacing grasslands [13] Tree advancement anddensification in grasslands were well-recognized in historical accounts Scribnerrsquos statisticalatlas of the United States during 1883 [18] stated that due to arborescent vegetation ldquoTheprairie region is fast disappearing The result is that that the eastern part of what wasfifty years ago a prairie region would scarcely be recognized as such todayrdquo
Land 2021 10 x FOR PEER REVIEW 3 of 17
mesic fire-sensitive species (eg in wetland prairies and along the Missouri River and
numerous tributaries) [6814] Historically rare or nearly absent fire-sensitive but
drought-tolerant eastern redcedar (Juniperus virginiana) and a variety of mesic fire- and
drought-sensitive species have increased in Nebraska Illinois and Missouri [81516] In
the southern prairie province of Texas Juniperus ashei and Prosopis glandulosa are examples
of species that have increased in density and expanded in grasslands [17] Furthermore
eastern forests as a whole are also expanding and replacing grasslands [13] Tree advance-
ment and densification in grasslands were well-recognized in historical accounts Scrib-
nerrsquos statistical atlas of the United States during 1883 [18] stated that due to arborescent
vegetation ldquoThe prairie region is fast disappearinghellip The result is that that the eastern
part of what was fifty years ago a prairie region would scarcely be recognized as such
todayrdquo
Figure 1 Generalized boundaries of eastern tallgrass prairie grasslands (light green) and forests in
the eastern United States (purple colors with variation depicting the southeast region central east
region and northeast region) The northern (251) and southern (255) prairie ecological provinces are
also demarcated
Here I applied an approach that included a combination of historical evidence from
published accounts to isolate initiation of tree changes in density or diversity the climate
metric of water availability from the Palmer Modified Drought Index (PMDI) modeled
from tree-ring chronologies calibrated with instrumental records [19] and statistical
change point tests of PMDI to determine if significant change in climate preceded tree
expansion from eastern forests into the central grasslands during the period 1860 to 1890
in the United States I also applied change point detection to grassland and forest land-
scapes based on an index of land use change the threshold of 25 land area in agriculture
which appeared to indicate approximate timing of vegetation change throughout the east-
ern United States for four grassland and four forest landscapes representing land use
change around 1860 1880 1900 and 1920 throughout the eastern United States (Figure 2)
However if timing of tree change followed unprecedented land use change after Euro-
American settlement then land use change was determined to be the driving factor and
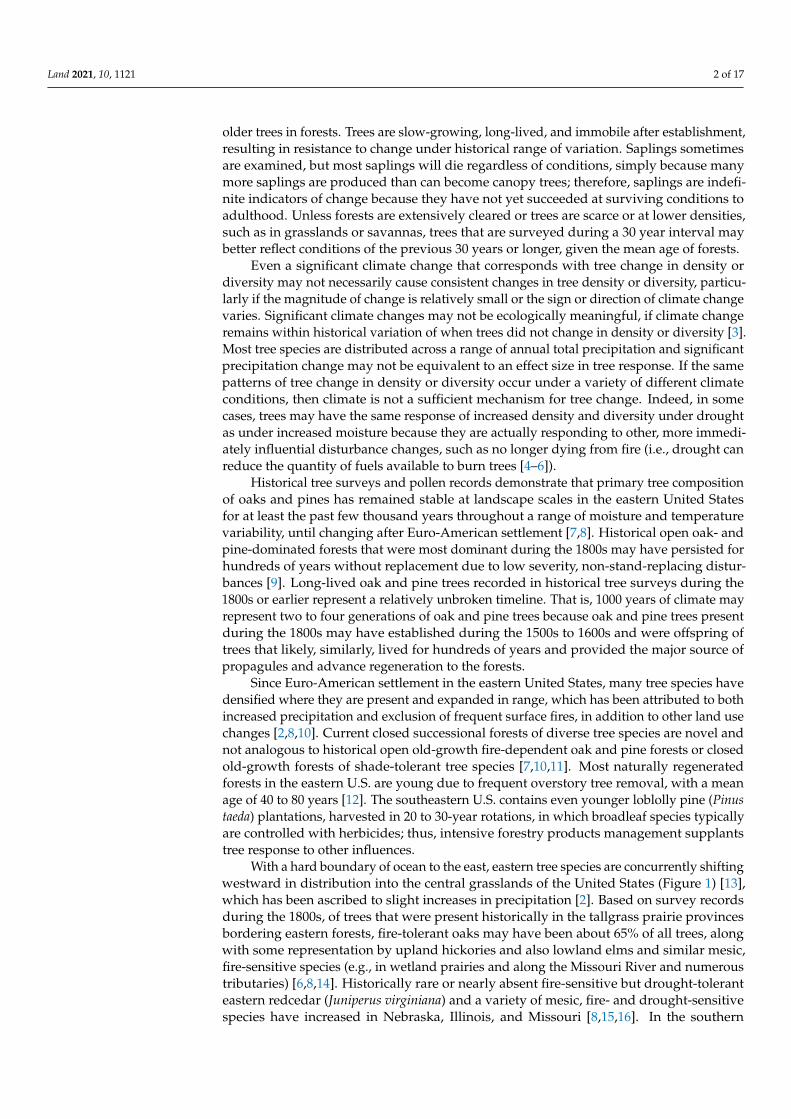
Figure 1 Generalized boundaries of eastern tallgrass prairie grasslands (light green) and forests inthe eastern United States (purple colors with variation depicting the southeast region central eastregion and northeast region) The northern (251) and southern (255) prairie ecological provinces arealso demarcated
Here I applied an approach that included a combination of historical evidence frompublished accounts to isolate initiation of tree changes in density or diversity the climatemetric of water availability from the Palmer Modified Drought Index (PMDI) modeledfrom tree-ring chronologies calibrated with instrumental records [19] and statistical changepoint tests of PMDI to determine if significant change in climate preceded tree expansionfrom eastern forests into the central grasslands during the period 1860 to 1890 in the UnitedStates I also applied change point detection to grassland and forest landscapes based onan index of land use change the threshold of 25 land area in agriculture which appearedto indicate approximate timing of vegetation change throughout the eastern United Statesfor four grassland and four forest landscapes representing land use change around 18601880 1900 and 1920 throughout the eastern United States (Figure 2) However if timingof tree change followed unprecedented land use change after Euro-American settlementthen land use change was determined to be the driving factor and any correspondingand significant climate change points would only be supporting secondary factors Ithen discussed whether climate and land use met the following criteria correspondencein timing with tree change magnitude beyond historical range of variation consistentdirection of change and mechanism
Land 2021 10 1121 4 of 17
Land 2021 10 x FOR PEER REVIEW 4 of 17
any corresponding and significant climate change points would only be supporting sec-
ondary factors I then discussed whether climate and land use met the following criteria
correspondence in timing with tree change magnitude beyond historical range of varia-
tion consistent direction of change and mechanism
Figure 2 Decade where area in agriculture reached ge25 for four grassland landscapes (green) and
four forest landscapes (purple) Gray designates where area in agriculture was ge25 by 1850 at the
beginning of the agricultural surveys
2 Materials and Methods
21 Timing of Tree Change from Historical Records
Historical evidence was compiled from published accounts to establish timing as
specifically as possible of tree expansion from eastern forests into the northern and south-
ern prairie provinces of the central grasslands in the United States Historical accounts
usually are difficult to translate into specific data points for analysis Additionally ar-
chival literature is obscure and challenging to locate and consequently fragmentary in
nature Nonetheless historical records can inform timing of trends when surveys do not
supply continuous data in space and time and in fact national surveys were suspended
during the approximate time of change Historical land surveys principally conducted by
the General Land Office recorded trees generally before 1860 in the eastern United States
The oldest available modern and spatiotemporally comprehensive tree surveys began
during the 1960s (although surveys commenced after the McSweeneyndashMcNary Forest Re-
search Act of 1928) varying by US state Well-accepted ecological divisions were used
for delineating grasslands and forests [20]
22 Decade That Agricultural Area Reached ge25 by County as an Index of Land Use Change
Further context for the issue of climate change and tree change can occur if the timing
of tree change is derived from a time series of spatial land use data This is an improve-
ment to determining tree change by imprecise literature for each ecological province
However logically if land use change dictates timing of tree change then any detection
of climate change points will be at best supporting secondary factors
One historical land use dataset is agricultural area since 1850 where area in agricul-
ture ge25 by county provides a rough approximation for tree change (Figure 3) [21] For
example during 1860 77 of Illinois the easternmost state in the northern prairie prov-
ince where Gleason [22] documented the progressive change to agriculture with fire ex-
clusion and tree increases was ge25 agricultural area During the previous decade 11
Figure 2 Decade where area in agriculture reached ge25 for four grassland landscapes (green) andfour forest landscapes (purple) Gray designates where area in agriculture was ge25 by 1850 at thebeginning of the agricultural surveys
2 Materials and Methods21 Timing of Tree Change from Historical Records
Historical evidence was compiled from published accounts to establish timing asspecifically as possible of tree expansion from eastern forests into the northern and south-ern prairie provinces of the central grasslands in the United States Historical accountsusually are difficult to translate into specific data points for analysis Additionally archivalliterature is obscure and challenging to locate and consequently fragmentary in natureNonetheless historical records can inform timing of trends when surveys do not supplycontinuous data in space and time and in fact national surveys were suspended during theapproximate time of change Historical land surveys principally conducted by the GeneralLand Office recorded trees generally before 1860 in the eastern United States The oldestavailable modern and spatiotemporally comprehensive tree surveys began during the1960s (although surveys commenced after the McSweeneyndashMcNary Forest Research Act of1928) varying by US state Well-accepted ecological divisions were used for delineatinggrasslands and forests [20]
22 Decade That Agricultural Area Reached ge25 by County as an Index of Land Use Change
Further context for the issue of climate change and tree change can occur if the timingof tree change is derived from a time series of spatial land use data This is an improvementto determining tree change by imprecise literature for each ecological province Howeverlogically if land use change dictates timing of tree change then any detection of climatechange points will be at best supporting secondary factors
One historical land use dataset is agricultural area since 1850 where area in agri-culture ge25 by county provides a rough approximation for tree change (Figure 3) [21]For example during 1860 77 of Illinois the easternmost state in the northern prairieprovince where Gleason [22] documented the progressive change to agriculture with fireexclusion and tree increases was ge25 agricultural area During the previous decade11 of Illinois was ge25 in agriculture as Gleason [22] described Oklahoma did notbecome a state officially until 1907 but based on agricultural area in Kansas to the north andTexas to the south a large part of the southern prairie province may have become ge25 inagriculture between 1870 and 1880 (Figure 4) Additionally the agricultural map capturedboth western expansion of Euro-American settlement and forested areas that were lesssuitable for agriculture due to cold temperatures mountains or wetlands Initiation of
Land 2021 10 1121 5 of 17
tree change in the eastern United States may range from as early as 1620 in the first Euro-American settlements to as late as 1950 in remote forested locations but these ending andstarting points are localized areas rather than larger landscapes where climate is likely tomatch in scale [2324] As with any threshold for continuous values values lt25 also mayindicate initiation of change particularly given a surrounding matrix of heavily modifiedland and high road densities A few areas never reached the 25 agriculture thresholdbut as little as 10 anthropogenic land cover may cause a 50 reduction in fire extentparticularly due to linear barriers of trails and roads [25] Although generalized the (15to) 25 agriculture threshold is a proxy for origination of tree change with specific timeand locations by county (Figure 2)
23 The Palmer Modified Drought Index of Climate Change
Trees are expanding westward along a moisture gradient that decreases from east towest therefore precipitation change rather than temperature change is the purported factorfor climate change However precipitation alone does not represent available water forvegetation Therefore many indices have been developed to represent available moisturethe Palmer Drought variants approximate the long-term balance between precipitationand water loss The Palmer Modified Drought Index (PMDI) modeled from tree-ringchronologies calibrated and validated with instrumental data [19] may be the most accurateand realized proxy of available water for trees over time Drought intensity is representedby negative numbers Reconstructions extend PMDI estimates to over 2000 years on a 05degree latitudelongitude grid
Land 2021 10 x FOR PEER REVIEW 5 of 17
of Illinois was ge25 in agriculture as Gleason [22] described Oklahoma did not become
a state officially until 1907 but based on agricultural area in Kansas to the north and Texas
to the south a large part of the southern prairie province may have become ge25 in agri-
culture between 1870 and 1880 (Figure 4) Additionally the agricultural map captured
both western expansion of Euro-American settlement and forested areas that were less
suitable for agriculture due to cold temperatures mountains or wetlands Initiation of
tree change in the eastern United States may range from as early as 1620 in the first Euro-
American settlements to as late as 1950 in remote forested locations but these ending and
starting points are localized areas rather than larger landscapes where climate is likely to
match in scale [2324] As with any threshold for continuous values values lt25 also may
indicate initiation of change particularly given a surrounding matrix of heavily modified
land and high road densities A few areas never reached the 25 agriculture threshold
but as little as 10 anthropogenic land cover may cause a 50 reduction in fire extent
particularly due to linear barriers of trails and roads [25] Although generalized the (15
to) 25 agriculture threshold is a proxy for origination of tree change with specific time
and locations by county (Figure 2)
Figure 3 Area in agriculture in 1850 and 1860 (modified from [21]) Figure 3 Area in agriculture in 1850 and 1860 (modified from [21])
Land 2021 10 1121 6 of 17Land 2021 10 x FOR PEER REVIEW 6 of 17
Figure 4 Area in agriculture in 1870 and 1880 (modified from [21])
23 The Palmer Modified Drought Index of Climate Change
Trees are expanding westward along a moisture gradient that decreases from east to
west therefore precipitation change rather than temperature change is the purported fac-
tor for climate change However precipitation alone does not represent available water
for vegetation Therefore many indices have been developed to represent available mois-
ture the Palmer Drought variants approximate the long-term balance between precipita-
tion and water loss The Palmer Modified Drought Index (PMDI) modeled from tree-ring
chronologies calibrated and validated with instrumental data [19] may be the most accu-
rate and realized proxy of available water for trees over time Drought intensity is repre-
sented by negative numbers Reconstructions extend PMDI estimates to over 2000 years
on a 05 degree latitudelongitude grid
24 Change Point Detection
Sequential change point detection are tests (eg t-test) to identify points at which
statistical properties of a time series of observations change Change point detection does
not require separation into time intervals for comparison particularly appropriate for de-
tecting anomalies Similarly to drought indices a variety of different approaches to iden-
tify change point detection are available one method may not identify all major change-
points efficiently [26] Therefore to detect all major changepoints I used two methods for
change point detection that applied different algorithms and options (changepoint pack-
age with PELT algorithm [27] cpm package with t-test [2829])
Figure 4 Area in agriculture in 1870 and 1880 (modified from [21])
24 Change Point Detection
Sequential change point detection are tests (eg t-test) to identify points at whichstatistical properties of a time series of observations change Change point detection doesnot require separation into time intervals for comparison particularly appropriate for de-tecting anomalies Similarly to drought indices a variety of different approaches to identifychange point detection are available one method may not identify all major changepointsefficiently [26] Therefore to detect all major changepoints I used two methods for changepoint detection that applied different algorithms and options (changepoint package withPELT algorithm [27] cpm package with t-test [2829])
25 Change Point Detection for Historical Records of Tree Change in the Prairie Provinces
In grasslands tree response is noticeable after a change in conditions and rapidtree change may occur within two decades [2230ndash32] To match documented timing ofvegetation change from about 1860 to 1880 in the northern prairie province and a decadelater in the southern prairie province based on historical information with significantchanges in PMDI values change point detection was applied Climate change was expectedto occur within the preceding 20 years of density or diversity tree changes in grasslandsalthough other reasonably adjacent change points were considered (Table 1)
Land 2021 10 1121 7 of 17
Table 1 Approximate decades of tree change in density and diversity and expected preceding PalmerModified Drought Index (PMDI) change for two prairie provinces based on historical records and forgrassland and forest areas after reaching the threshold of 25 agriculture
Extent Tree Change PMDI Change
North prairie 1860ndash1880 1840ndash1860
South prairie 1870ndash1890 1850ndash1870
Grassland 1860 (1850ndash1870) 1830ndash1850
1880 (1870ndash1890) 1850ndash1870
1900 (1890ndash1910) 1870ndash1890
1920 (1910ndash1930) 1890ndash1910
Forest 1860 (1850ndash1870) 1820ndash1850
1880 (1870ndash1890) 1840ndash1870
1900 (1890ndash1910) 1860ndash1890
1920 (1910ndash1930) 1880ndash1910
26 Change Point Detection for Grassland and Forest Landscapes Based on Land Use Change
Change points for PMDI were identified in four grassland and four forest landscapesthat reached ge25 agriculture by 1860 1880 1900 and 1920 (ie each landscape corre-sponded with a decade of land use change Figure 2 Table 1) The date of tree change isrelatively fixed albeit with some uncertainty For grasslands with rapid response by treeswithin 20 years climate change was expected to occur between 1830 to 1850 for areas ge25agriculture by 1860 that is initiation of tree increases in density and diversity from 1850 to1870 (Table 1) Because forests are resistant to change if larger trees already occupy growingspace long lags may occur However as indicated by rapid conversion to agriculture themajority of eastern forests were cleared in cycles during this time interval which openedgrowing space for trees Additionally many of these forests were savannas and woodlandsessentially a combination of grasslands and overstory trees For forests then the lag beforetree change was extended from 20 years to 30 years For example climate change wasexpected to occur between 1820 to 1850 for areas ge25 agriculture by 1860 with treechange initiating between 1850 to 1870
3 Results31 Timing of Tree Change from Historical Information
According to historical accounts tree changes commenced from about 1860 to 1880in the northern prairie province and while not unvarying in onset perhaps a decade laterfor the landscape of the southern prairie province (Table 2) Timing and location remainedrelatively general despite the search for precise information These changes encompassedboth increased tree density and diversity Moreover trees have continued to increase indensity and diversity since the 1800s
Land 2021 10 1121 8 of 17
Table 2 Location and years when tree or shrub encroachment were documented in the two prairieprovinces
Extent Location Year Reference
North prairie
Kansas before 1867 Taylor 1867Illinois Indiana Iowa Wisconsin after 1860 Gleason 1922
South prairie
Oklahoma before 1931 Bruner 1931Oklahoma and south prairies before 1844 Grigg 1844
Texas before 1878 to1898 Cook 1908
For the northern prairie province Taylor [33] documented rapid spread of treesinto the grasslands of Kansas ldquoI first witnessed a phenomenon of which I had oftenheardmdashthe spontaneous production of forests from prairie land Hundreds of acres whichthe cultivated fields beyond had protected against the annual inundation of fire werecompletely covered with young oak and hickory trees from four to six feet in heightrdquoGleason [22] who is now regarded as a prominent ecologist wrote that rapid and noticeabletree advancement into grasslands ensued after fire exclusion which he determined occurredabout 1860 in Illinois ldquoSettlement of the forested regions of the Middle West began aboutthe opening of the nineteenth century progressed steadily westward and reached theMissouri River in fifty years Actual settlement of the prairies was long avoided vast areaswere still untouched at the time of the Civil War and prairie fires did not cease being amenace in parts of Illinois until 1860 and in Iowa until somewhat later As soon as firesceased the advance of the forest was renewed and at a rate probably more rapid than theoriginal since considerable improvement of climate may have taken place since the firstadvance was stopped by fires Early literature contains many accounts of this spread of theforested area which was rapid enough to attract the attention of travelers It seems to haveprogressed in several different ways The lateral advance of the forest at right angles tothe streams and the longitudinal advance along the streams continued as before Willowscottonwoods and some hydrophytic shrubs moved rapidly up the rivers and creeks andwere followed by elms maples and ashes Thirty years after the first prairie settlementswere made in Macon and Moultrie counties Illinois these fringing forests had extended oneor two miles up the smaller streams Isolated colonies of mobile species especially willowSalix humilis and wild plum Prunus americana were established well out on the prairiegrew into thickets and frequently received further additions of forest species carried inby the birds which visited them or by wind Large areas of barrens were converted intoforest as by magic when the fires that had maintained them were stopped and the oaksprouts became trees The total afforestation during this period was considerable andin some cases almost unbelievable and may best be indicated by a few examples Thusthe driftless area of northwestern Illinois and southwestern Wisconsin which now givesthe impression of having been heavily forested was 80ndash90 prairie a century ago Alittle later we find farmers near St Louis complaining that the rapid growth of trees hadseriously restricted the natural pastures The Mississippi and Illinois rivers at that timehad long strips of prairie in their floodplains which are now completely forested exceptwhere under cultivation The dune region at the head of Lake Michigan which is nowwell forested with oak was then ldquotreeless except for a few stunted pinesrdquo Forested areasin Indiana were developed within the memory of men now living from barrens overwhich a man on horseback had been visible for six miles (personal communication fromMr C C Deam) The rapid development of forests on the sand dunes of the Illinois Riverhas been noted elsewhererdquo
For the southern prairie province Bruner [34] specified for Oklahoma ldquoBecause ofthe recurrence of prairie fires forest has not developed but there is abundant evidence
Land 2021 10 1121 9 of 17
that forests are replacing the prairie since the settlement of the country and the cessationof fires Prairie fires are assumed to be the main factor in keeping the more moistprairies free from trees and even at this early date pioneers had observed the spread offorests into various grassland areas which were protected from firerdquo The cited lsquoearly datersquorefers to Gregg [35] who stated ldquoWe are now witnessing the encroachment of the timberupon the prairies wherever the devastating conflagrations have ceased their ravagesrdquo ForTexas Cook [36] wrote ldquoIt is a matter of popular knowledge in south Texas that extensiveregions which were formerly grassy open prairies are now covered with a dense growthof mesquite (Prosopis) prickly-pear cactus (Opuntia) and many other shrubby plants ofintermediate size Testimony to this effect is definite and unanimous It differs locally onlyin the number of years since the bushes began to growmdashthirty years or twenty or tenmdashsubsequent to the establishment of the grazing industry on a large scale the annual burningof the grass by the cattlemen and finally the fencing of the land for still more intensivegrazing That such fires were evidently the cause of the former treeless condition of thesouthwestern prairies is also shown by the fact that trees are found in all situations whichafford protection against fires Trees of many kinds have thriven well where planted invillages and about homesteads in addition to the natural spread of the woody vegetationas soon as the fires cease If reforestation were to continue uninterrupted by fires orother forms of human interference the Gulf plains of Texas would again become coveredwith dense subtropical forests rdquo
32 Climate Change Points Based on Historical Accounts of Timing
As a summary of the PMDI dataset over time mean values during the period between1800 and 1899 were minus016 (standard deviation (SD) of 147 coefficient of variation (CV)of minus949) for the northern prairie province and minus011 (SD of 161 CV of minus1476) for thesouthern prairie province (Figure 5) Between 1900 and 1999 mean PMDI values were 030(SD of 162 CV of 543) for the northern prairie province and 027 (SD of 175 CV of 641)for the southern prairie province Frequent oscillations from drought to pluvials occurredsuch as above-average PMDI during the early 1900s followed by the Dust Bowl drought ofthe 1930s in the northern prairie province which created a wide range of deviation
Because tree changes were initiated from about 1860 to 1880 in the northern prairieprovince and a decade later in the southern prairie province the expected change in climatewas between 1840 and 1860 in the northern prairie province and between 1850 and 1870in the southern prairie province (Table 1) [2236] The cpm method produced many morechange points than the changepoint method which had no change points during the 1800sThe southern province had 12 significant change points since 1000 including change pointsat years 1855 and 1865 and then again at 1952 (Table 3) The interval of 1855 and 1864marked an extremely dry interval (mean of minus2 SD of 146 Figure 5) Removal of theyears 1855 to 1864 also removed those change points leaving a continuous interval ofsimilar dryness between 1494 and 1952 By 1952 tree change already had been noticed anddocumented in scientific publications
Land 2021 10 1121 10 of 17
Land 2021 10 x FOR PEER REVIEW 9 of 17
of firesPrairie fires are assumed to be the main factor in keeping the more moist prairies
free from trees and even at this early date pioneers had observed the spread of forests into
various grassland areas which were protected from firerdquo The cited lsquoearly datersquo refers to
Gregg [35] who stated ldquoWe are now witnessing the encroachment of the timber upon the
prairies wherever the devastating conflagrations have ceased their ravagesrdquo For Texas
Cook [36] wrote ldquoIt is a matter of popular knowledge in south Texas that extensive re-
gions which were formerly grassy open prairies are now covered with a dense growth of
mesquite (Prosopis) prickly-pear cactus (Opuntia) and many other shrubby plants of in-
termediate size Testimony to this effect is definite and unanimous It differs locally only
in the number of years since the bushes began to growmdashthirty years or twenty or tenmdash
subsequent to the establishment of the grazing industry on a large scale the annual burn-
ing of the grass by the cattlemen and finally the fencing of the land for still more intensive
grazinghellipThat such fires were evidently the cause of the former treeless condition of the
southwestern prairies is also shown by the fact that trees are found in all situations which
afford protection against fireshellip Trees of many kinds have thriven well where planted in
villages and about homesteads in addition to the natural spread of the woody vegetation
as soon as the fires ceasehellip If reforestation were to continue uninterrupted by fires or other
forms of human interference the Gulf plains of Texas would again become covered with
dense subtropical forestshelliprdquo
32 Climate Change Points Based on Historical Accounts of Timing
As a summary of the PMDI dataset over time mean values during the period be-
tween 1800 and 1899 were minus016 (standard deviation (SD) of 147 coefficient of variation
(CV) of minus949) for the northern prairie province and minus011 (SD of 161 CV of minus1476) for the
southern prairie province (Figure 5) Between 1900 and 1999 mean PMDI values were 030
(SD of 162 CV of 543) for the northern prairie province and 027 (SD of 175 CV of 641)
for the southern prairie province Frequent oscillations from drought to pluvials occurred
such as above-average PMDI during the early 1900s followed by the Dust Bowl drought
of the 1930s in the northern prairie province which created a wide range of deviation
Figure 5 The PMDI values for quarter-century interval box plots during years 1000 to 2000 (101equals first quarter-century of the 1000s) and all PMDI values during years 1700 to 1950 with a fittedline and 95 confidence intervals for the northern (251) and southern (255) prairie provinces
Table 3 Approximate decades of tree change in density and diversity and expected preceding change in Palmer ModifiedDrought Index (PMDI) and sequential change point detection (with two methods) for two prairie provinces and for grasslandand forest areas after reaching the threshold of 25 agriculture
Extent Tree Change PMDI Change Change Point Years
North Prairie 1860ndash1880 1840ndash1860
cpm 1011 1036 1104 1108 1115 1233 1245 1276 1440 1490 1548 1619 16271636 1664 1672 1697 1700 1903 1931 1942 1953 1973
changepoint 1104 1108 1115 1233 1245 1619 1627 1993
South prairie 1870ndash1890 1850ndash1870
cpm 1053 1061 1165 1177 1258 1455 1459 1494 1855 1865 1952 1957changepoint 1053 1061 1168 1177 1257 1973
Grassland 1860 (1850ndash1870) 1830ndash1850
cpm 1104 1107 1245 1276 1736 1738 1799 1882changepoint 1104 1107 1619
1880 (1870ndash1890) 1850ndash1870
cpm 1011 1036 1104 1108 1115 1233 1245 1276 1440 1490 1492 1619 16271636 1664 1672 1697 1700 1736 1855 1876 1894
Land 2021 10 1121 11 of 17
Table 3 Cont
Extent Tree Change PMDI Change Change Point Years
changepoint 1104 1108 1115 1233 1245 1440 1490 1492 1973
1900 (1890ndash1910) 1870ndash1890
cpm 1011 1036 1076 1104 1233 1245 1276 1282 1455 1490 1576 1619 16261673 1697 1827 1838 1855 1877 1893 1902 1931 1942 1952 1965 1993
changepoint 1076 1233 1245 1992
1920 (1910ndash1930) 1890ndash1910
cpm 1017 1040 1090 1146 1160 1233 1238 1265 1421 1425 1449 1498 15791592 1610
changepoint none
Forest 1860 (1850ndash1870) 1820ndash1850
cpm 1021 1023 1104 1142 1154 1346 1351 1563 1574 1882changepoint none
1880 (1870ndash1890) 1840ndash1870
cpm 1021 1023 1104 1265 1273 1346 1351 1555 1581 1736 1738changepoint none
1900 (1890ndash1910) 1860ndash1890
cpm 1142 1150 1265 1269 1309 1346 1402 1450 1457 1556 1575 1903changepoint none
1920 (1910ndash1930) 1880ndash1910
cpm 1035 1104 1142 1150 1179 1204 1207 1249 1309 1322 1450 1457 14881600 1608 1903
changepoint 1104 1600
The northern province had 23 significant change points since 1000 but no changepoints during the expected time interval needed to initiate tree change from 1855 to 1880However a change point occurred in 1903 which was later than the documented treechange The time between 1903 and the next change point of 1931 (ie the Dust Bowldrought) was less dry (mean of 071 SD of 161) than the antecedent same length intervalof 1875 to 1902 (mean of 016 SD of 165) If it is plausible that tree changes in the northernprairie province of the grasslands did not occur on average until 1903 or later then thequestion is whether a PMDI change between a mean of 071 and the antecedent mean of 016is ecologically necessary for change Comparable fluctuations occurred during the 1600sIndeed removal of PMDI values from 1625 to 1899 resulted in continuity until changepoints in 1930 the Dust Bowl drought indicating that the early 1900s were similar to theearly 1600s The magnitude of climate change was within historical range and multiplesignificant climate change points since 1000 were not sufficient to allow eastern redcedarand mesic eastern tree species increases into the grasslands [3738]
33 Climate Change Points Based on Timing of Land Use
All the ecological landscapes (ie gt1 million ha Figure 2) had at least eight changepoints with the cpm method (Table 3) Only two of the grassland landscapes and one ofthe forest landscapes had PMDI change points that fell within the bounds of expected treechange with the cpm method No change points occurred for the changepoint methodduring the 1800s
The grassland landscape for land use change by 1880 had change points during theperiod 1855 to 1876 for which PMDI values decreased from minus002 (SD of 143) during theperiod 1736 to 1854 to minus106 (SD of 132) during the period 1855 to 1875 therefore thisinterval was drier The PMDI values increased to 088 (SD of 123) during the period 1876to 1893 the next change points Nevertheless values in 1876 and later were continuous
Land 2021 10 1121 12 of 17
with historical values during the 1500s The grassland landscape for land use change by1900 had change points in 1877 and 1893 for which PMDI increased from minus123 (SD of140) during the period 1855 to 1876 to 083 (SD of 132) during the period 1877 to 1892 anddecreased back to minus126 (SD of 106) in 1893 and 1902 These short fluctuations from drierto wetter to drier conditions are not unusual in the PMDI record The forest landscapewith change in land use by 1920 had a change point in 1903 with similar PMDI values forchange from about minus030 (SD of 106) during the period 1608 to 1902 to 001 (SD of 146)after 1902 These PMDI values were typical and the magnitude of change was minimalconsidering the amount of variation
4 Discussion41 Influence of Climate Change
Increased moisture did not constitute a consistent correlation for tree density ordiversity change in grasslands and forests of the eastern United States Correlation ofclimate change with vegetation change was inconsistent Only one change point methoddetected changes in PMDI during the 1800s For this method less than half of the ecologicallandscapes (ie gt1 million ha) had change points in climate that matched with range ofexpected timing to influence tree density or diversity change in the United States Themagnitude of change was not unusual compared with past climate oscillations from dryto wet intervals were typical Moreover change points included droughts that transpiredduring 1855 to either 1864 or 1875 resulting in direction of change contradictions Fyeet al [39] also documented a drought analogous in magnitude to the Dust Bowl droughtfrom 1855 to 1865 that extended from the western US into the tallgrass prairie provincesof the North American grasslands
The mechanism of climate effects on trees is unreliable in temperate grasslands andforests that have moderate precipitation (eg 65 cm to 125 cm) Release of tree growthtree establishment and woodland expansion within the central grasslands have occurredduring dry climate intervals [4ndash640] Wells [37] noted that there was no range of climatetoo arid for trees in the Great Plains grasslands Gleason [41] declared ldquoIn Illinois whereforest species habitually spring up along roadsides and on un-cultivated places on theprairie it is obvious that the climate favors the forest and that forest should rapidly succeedthe prairie if no other causes were in operationrdquo
Without long-term records tree changes that have been ensuing since Euro-Americansettlement may be ascribed to short-term climate changes that are within historical rangesof variation In the eastern tallgrass prairie provinces annual precipitation increasedfrom 82 cm during the period 1951 to 1980 to 89 cm during the period 1981 to 2015which is a range of precipitation that is tolerable to eastern tree species [3742] moreoverprecipitation increases alone do not account for concurrent temperature increases that mayboost evapotranspiration Between 1980 and 2015 Fei et al [2] found 65 of 86 tree specieshad a significant westward shift in abundance centers After acknowledging that indirectand non-climatic factors could have influenced westward movement Fei et al [2] statedldquowe observed clear broad-scale evidence of the impact of climate change on forest treespatial dynamics where changes in mean annual precipitation alone explained about 19of the variability in species abundance change and spatial shiftrdquo Even so tree changesdetected between the earliest and most recent modern tree inventories will not correspondwith before and after climate changes if tree changes originated before the tree surveysAttribution of change to precipitation during the period 1951 to 1980 as compared with theperiod 1981 to 2015 is a correlation mismatch because trees increased and expanded westbefore 1980 at steady and noticeable rates after Euro-American settlement [22] Indeed theprimary implication of Fei et alrsquos [2] research may be that trees increased and expandedduring a range of mean annual precipitation
Nevertheless climate will become increasingly influential compared with land useas climate changes beyond historical variation at least of the past 20000 years In theeastern United States widely distributed temperate tree species will not face the same
Land 2021 10 1121 13 of 17
challenges as northern boreal species with genetic commitment to traits of cold and freezetolerance [43] However extreme meteorological events such as flash droughts floodingwindstorms heatwaves and fire weather days are expected to increase with warmingwhich progressively will test the ability of vegetation to survive grow and reproduce [44]For example in the United States during the 1980s 28 events occurred per year that costat least a billion dollars at USD 128 billion per year the number of events has increasedsteadily each decade and during the 2010s 119 ge billion-dollar events occurred per yearat USD 802 billion per year which surpassed inflation rates [45] Moreover extreme eventsmay interact and create more pathways for damage stressed trees may become susceptibleto insect and disease outbreaks Current standards of healthy trees which are fast-growingand healthy forests which are fully stocked may be maladaptive under climate changeMcNulty et al [44] recommended forest management such as thinning to curb maximumpotential forest growth creating a ldquoresource availability bufferrdquo as a strategy for extremeclimatic conditions and associated secondary impacts Slower-growing tree species withgreater root resources such as fire-tolerant species with early growth dedicated to rootsrather than shoots for survival of frequent surface fire may be more resistant to catastrophicepisodic mortality [44] and grassland vegetation too is likely more resistant and resilientthan current forests in the eastern US
Indeed the tree species that have increased during the past century along withtree density increases due to changing land use including agriculture probably havemade eastern US forests less resilient to climate change and extreme events Historicallydominant widespread oak and pine species are drought- and fire-tolerant but these specieshave been replaced by more mesic drought- and fire-sensitive species such as maplesashes and elms [46ndash48] Historically dominant forests occurred as low-density savannasand woodlands which provide benefits of reduced water demand and also reduced chanceof insect outbreaks and spreading crown fires compared with dense forests [44] Forestsof lower tree densities with tree continuity rather than high contrast edges comprised oftrees that allocate resources to roots (ie historical open forests and historically dominantfire-tolerant oak and pines species) are likely to be more windfirm [49]
42 Influence of Land Use Change
If increased moisture does not constitute a consistent correlation with sufficient mag-nitude and direction or mechanism for tree change in grasslands and forests of the easternUnited States then an alternative option is that land use was driving tree change in densityand diversity Intensive and extensive agricultural use was unprecedented resulting in ap-propriate magnitude and direction for driving tree change along with correlation in timingand a consistent mechanism for tree change Vegetation changes arose directly from landconversion to land uses exacerbated by cycles of conversion and abandonment Clearingremoved established vegetation and plowing damaged propagules of rootstocks and seedbanks Continued severe disturbance created opportunities for a new suite of species withtraits for responding to relatively frequent vegetation removal every 20 to 100 years [12]However in addition to direct land use change to severe vegetation disturbance landuse change excluded frequent surface fire Historical accounts described a sequence ofadvancing western Euro-American settlement gradually extinguished surface frequentfire regimes and release of young trees [30]
Surface fire occurred almost annually in eastern tallgrass prairies which have the great-est amount of precipitation of the central grasslands of North America allowing growth ofplentiful herbaceous vegetation that are fuels for frequent surface fire Tree propagules at-tempted to establish in grasslands but most tree establishment was removed by fire Treeswere limited to firebreak locations of either water and wetlands rocky outcrops or thin soilsand rough and steep topography of bluffs escarpments and ridges [343750ndash52] Becausethe prevailing winds are from the west and drove fire eastward more trees occurred on theprotected east sides of firebreaks [5051]
Land 2021 10 1121 14 of 17
Exclusion of fire includes active fire suppression discontinuation of fire as a manage-ment tool with additional restrictions by laws and changing cultural norms and passiveland use changes that prevent fire spread by reducing herbaceous vegetation that providesfine fuels Roads and other linear vegetation discontinuities specifically act as firebreaksIndeed Euro-American settlers in grasslands cleared herbaceous vegetation for somedistance around their fields and houses and wore down vegetation with wagon tracksor plowed furrows as fireguards around their holdings to disrupt fire spread and to en-courage tree growth into the disturbed soil [5053] Tree presence disrupted flammabilitywhile protected conditions under trees reduced probability of fire occurrence Equally onunburned areas woody plant cover both increased in density and invaded new locationsA combination of historical tree surveys aerial photos and field observations allowedBragg and Hulbert [32] to quantify that on unburned sites tree and shrub cover increased34 from 1937 to 1969 and tree cover alone increased 24 from 1856 to 1969 in Kansas Incontrast woody plants in regularly burned sites increased by only 2 from 1937 to 1969These measurements concurred with Kettle et al [54] for the interval between 1957 and1997 in Kansas mowing or burning limited tree cover to lt3 compared with gt97 treecover without treatment Penfound [55] wrote for Oklahoma ldquoWith heavy grazing and fireprotection a continuing increase in arborescent cover has occurred in areas which wereformerly occupied by savannardquo
Agricultural activities such harvested row crops and grazing by cattle also reducevegetation for fuels and chance of fire occurrence For example area in crop is relatedinversely to fire occurrences Mean area of cropland was about 23 for the entire UnitedStates where no fires occurred during the period 1999 to 2017 conversely area in cropwas lt2 where fires recently occurred [56] Likewise Gleason [22] in one of his keypapers documented that fire ended when agriculture increased in Illinois to 1860 levelsof agriculture compared with 1850 In Illinois agriculture averaged 36 of total areain 1860 compared with 14 in 1850 The threshold of 25 land in agriculture acts anindicator of timing for when humans influenced ecosystem change which will requireadditional evaluation and likely lessens to 10 given surrounding land conversion Incontrast agricultural area initially may need to exceed the 25 threshold to disrupt firein undeveloped grasslands and forests with low density of roads and harvested fields inparticular and additionally less area in houses combined with a persistent culture of fireuse as a management tool Although data about population densities are also available forthe 1800s humans at very low densities can affect vegetation and modulate fire regimes(eg by increasing ignitions while producing fewer firebreaks of fields and trails) so thata threshold is less apparent Relatedly housing densities and not human densities wasthe influential variable for modeling recent fire occurrences [57] Housing densities andpercent of land converted to agriculture are manifestations of the magnitude of humaninfluence on fire exclusion and vegetation
Land use change specifically fire exclusion satisfies the requirements for timingof tree change in conjunction with land use following Euro-American settlement excep-tional magnitude unidirectional sign of change and mechanism Compared with climatefluctuations around historical ranges of variation during the time of vegetation changedeparture of fire from historical frequencies is of a greater magnitude due to fire exclusionWhile fire return intervals have varied over time which may produce significant changepoints exclusion was a definitive departure in magnitude In addition to correlation intime and magnitude fire exclusion provides a consistent mechanism for change by al-lowing fire-sensitive tree species to survive Surface fire removes small diameter woodyvegetation thereby reducing tree density particularly of fire-sensitive tree species andfavoring herbaceous vegetation which is adapted to removal of aboveground growthHerbaceous vegetation provides fine fuels that ignite more readily than coarse woody fuelsincreasing fire frequency As fire exclusion is prolonged flammability markedly decreaseswith replacement of herbaceous vegetation by trees further reducing the probability of fireoccurrence A moderate range of precipitation (eg 65 cm to 125 cm) in temperate climates
Land 2021 10 1121 15 of 17
supplies both wet periods that produce abundant herbaceous fuels and dry periods thatdry herbaceous fuels which are necessary conditions for fire Climate changes that increaseor decrease moisture and continuity of herbaceous fuels may affect fire frequency
5 Conclusions
This approach to determine timing of vegetation change in tree density and diversityaccounted for both climate (ie water balance with PMDI) and land use change Cli-mate change points were frequent but not consistent with timing of tree changes and ifthey corresponded a range of climate occurred including drought indicating a problemwith mechanism Additionally the magnitude of climate change was within historicalranges Conversely novel land use provided the correct timing mechanism direction andmagnitude of change Land use has many components that influence ecosystem changeincluding the progression from Euro-American settlement to exclusion of frequent surfacefires
The other outcome of this research was the identification of a potential proxy forwhen humans influenced vegetation change a threshold of 15 to 25 land area inagriculture that is a direct index of human modification of the landscape Percent of land inagriculture is available as spatially explicit GIS layers by decade since 1850 for the UnitedStates [21] At landscape scales fit appeared to be appropriate and an improvement tosearching through archival records that cannot provide specific data points Additionalclose evaluation and refinement by experts is necessary with corroboration from multiplelines of historical evidence Thresholds of agricultural area by county may decrease assurrounding agricultural area increases In any event an approximate data layer thatindicates timing and location of vegetation change is a major progression in the ability toanalyze drivers of change
Funding This research received no external funding
Institutional Review Board Statement This study did not involve humans or animals
Informed Consent Statement This study did not involve humans
Data Availability Statement Cook ER Seager R Heim RR Vose RS Herweijer C andWoodhouse C (2010) Megadroughts in North America Placing IPCC projections of hydroclimaticchange in a long-term paleoclimate context Journal of Quaternary Science 25 48ndash61 Available athttpswwwncdcnoaagovpaleo-searchstudy19119 (accessed on 1 December 2020)
Acknowledgments The author thanks anonymous reviewers for their time and comments thatimproved the clarity of the manuscript This research was supported by the USDA Forest ServiceRocky Mountain Research Station The findings and conclusions in this publication are those of theauthor and should not be construed to represent any official USDA or US Government determinationor policy
Conflicts of Interest The author declares no conflict of interest
References1 Kangas RS Brown TJ Characteristics of US drought and pluvials from a high-resolution spatial dataset Int J Climatol 2007
27 1303ndash1325 [CrossRef]2 Fei S Desprez JM Potter KM Jo I Knott JA Oswalt CM Divergence of species responses to climate change Sci Adv
2017 3 e1603055 [CrossRef]3 Hanberry BB Abrams MD White JD Is increased precipitation during the 20th century statistically or ecologically significant
in the eastern US J Land Use Sci 2018 13 259ndash265 [CrossRef]4 Ziegler SS Larson ER Rauchfuss J Elliott GP Tree establishment during dry spells at an oak savanna in Minnesota
Tree-Ring Res 2008 64 47ndash55 [CrossRef]5 Shuman B Henderson AK Plank C Stefanova I Ziegler SS Woodland-to-forest transition during prolonged drought in
Minnesota after ca AD 1300 Ecology 2009 90 2792ndash2807 [CrossRef]6 Rogers TR Russell FL Historical patterns of oak population expansion in the Chautauqua Hills Kansas J Biogeogr 2014 41
2105ndash2114 [CrossRef]
Land 2021 10 1121 16 of 17
7 Delcourt PA Delcourt HR Late-Quaternary dynamics of temperate forests Applications of paleoecology to issues of globalenvironmental change Quat Sci Rev 1987 6 129ndash146 [CrossRef]
8 Hanberry B Kabrick JM He HS Changing tree composition by life history strategy in a grassland-forest landscape Ecosphere2014 5 art34 [CrossRef]
9 Lorimer CG Historical and ecological roles of disturbance in eastern North American forest 9000 years of change Wildl SocBull 2001 29 425ndash439
10 Hanberry BB Coursey K Kush JS Structure and composition of historical longleaf pine ecosystems in Mississippi USA HumEcol 2018 46 241ndash248 [CrossRef]
11 Hanberry BB Baseline to novel ecosystems in Michigan USA with a quantitative and qualitative assessment Eacutecoscience 202027 255ndash268 [CrossRef]
12 Pan Y Chen JM Birdsey R McCullough K He L Deng F Age structure and disturbance legacy of North American forestsBiogeosciences 2011 8 715ndash732 [CrossRef]
13 Hanberry BB Hansen MH Advancement of tree species across ecotonal borders into non-forested ecosystems Acta Oecologica2015 68 24ndash36 [CrossRef]
14 Srinath I Millington AC Evaluating the Potential of the Original Texas Land Survey for Mapping Historical Land andVegetation Cover Land 2016 5 4 [CrossRef]
15 Rothenberger SJ Extent of woody vegetation on the prairie in eastern Nebraska 1855ndash1857 In Prairie Pioneers Ecology Historyand Culture Proceedings of the Eleventh North American Prairie Conferences Bragg TB Stubbendieck J Eds University ofNebraska Lincoln NE USA 1989 pp 15ndash18
16 McLachlan J Settlement Trees Illinois Level 0 Ver 0 Environmental Data Initiative 2020 Available online httpsportaledirepositoryorgnismapbrowsepackageid=msb-paleon280 (accessed on 30 December 2020)
17 Landers RQ Native vegetation of Texas Rangel Arch 1987 9 203ndash20718 Hewes FW Gannett H Scribnerrsquos Statistical Atlas of the United States Scribnerrsquos Sons New York NY USA 1883 Available
online httpswwwlocgovitema40001834 (accessed on 7 January 2021)19 Cook ER Seager R Heim RR Vose RS Herweijer C Woodhouse C Megadroughts in North America Placing IPCC
projections of hydroclimatic change in a long-term paleoclimate context J Quat Sci 2010 25 48ndash61 Available onlinehttpswwwncdcnoaagovpaleo-searchstudy19119 (accessed on 1 December 2020) [CrossRef]
20 Keys JE Cleland DT McNab WH Delineation Peer Review and Refinement of Subregions of the Conterminous United States GenTech Report WO-76A Department of Agriculture Forest Service Washington DC USA 2007
21 Maizel M White RD Root R Gage S Stitt S Osborne L Muehlbach G Historical Interrelationships between PopulationSettlement and Farmland in the Conterminous United States 1790 to 1992 1998 Available online httpsarchiveusgsgovarchivesiteslandcoverusgsgovluhnachap2html (accessed on 21 May 2020)
22 Gleason HA The vegetational history of the Middle West Ann Assoc Am Geogr 1922 12 39ndash85 [CrossRef]23 Day GM The Indian as an ecological factor in the Northeastern forest Ecology 1953 34 329ndash346 [CrossRef]24 DeSantis RD Hallgren SW Lynch TB Burton JA Palmer MW Long-term directional changes in upland Quercus forests
throughout Oklahoma USA J Veg Sci 2010 21 606ndash618 [CrossRef]25 Duncan BW Schmalzer PA Anthropogenic influences on potential fire spread in a pyrogenic ecosystem of Florida USA
Landsc Ecol 2004 19 153ndash165 [CrossRef]26 Marine Data Science Comparison of Change Point Detection Methods 2019 Available online httpswwwmarinedatascience
coblog20190928comparison-of-change-point-detection-methods (accessed on 25 September 2021)27 Killick R Eckley I Changepoint An R package for changepoint analysis J Stat Softw 2014 58 1ndash19 [CrossRef]28 Ross GJ Parametric and nonparametric sequential change detection in R The cpm Package J Stat Softw 2015 66 1ndash19
[CrossRef]29 R Core Team R A Language and Environment for Statistical Computing R Foundation for Statistical Computing Vienna Austria
202030 Davidson R An Excursion to the Mammoth Cave and the Barrens of Kentucky AT Silliman and Son Lexington Kentucky 1840
Available online httpswwwgooglecombookseditionAn_Excursion_to_the_Mammoth_Cave_and_the71EVAAAAYAAJhl=enampgbpv=1ampprintsec=frontcover (accessed on 1 July 2021)
31 Shaler NS Kentucky A Pioneer Commonwealth Houghton Mifflin and Co Boston MA USA New York NY USA 1885Available online httpswwwgooglecombookseditionKentucky_a_Pioneer_CommonwealtheIAxAQAAMAAJhl=enampgbpv=1ampprintsec=frontcover (accessed on 2 June 2021)
32 Bragg TB Hulbert LC Woody plant invasion of unburned Kansas bluestem prairie J Range Manag 1976 29 19ndash24 [CrossRef]33 Taylor B Colorado a Summer Trip Putman New York NY USA 1867 Available online httpsbabelhathitrustorgcgipt
id=hvd32044072260284ampview=1upampseq=9 (accessed on 7 January 2021)34 Bruner WE The vegetation of Oklahoma Ecol Monogr 1931 1 100ndash188 [CrossRef]35 Gregg J Commerce of the Prairies 1844 Available online httpsatlasnmhumorgpdfsCommerceofthePrairiespdf (accessed
on 24 September 2021)
Land 2021 10 1121 17 of 17
36 Cook OF Change of Vegetation on the South Texas Prairie USDA Bureau of Plant Industry Circular Washington DC USA1908 Volume 14 Available online httpsarchiveorgdetailschangeofvegetati14cookpagen1mode2up (accessed on 7January 2021)
37 Wells PV Scarp woodlands transported grassland soils and concept of grassland climate in the Great Plains region Science1965 148 246ndash249 [CrossRef]
38 Hall SA Deteriorated pollen grains and the interpretation of Quaternary pollen diagrams Rev Palaeobot Palynol 1981 32193ndash206 [CrossRef]
39 Fye FK Stahle DW Cook ER Paleoclimatic analogs to twentieth-century moisture regimes across the United States Bull AmMeteorol Soc 2003 84 901ndash910 [CrossRef]
40 Stambaugh MC Guyette RP Marschall J Fire history in the Cherokee nation of Oklahoma Hum Ecol 2013 41 749ndash758[CrossRef]
41 Gleason HA Further views on the succession-concept Ecology 1927 8 299ndash326 [CrossRef]42 Prism Climate Group PRISM Climate Data 2020 Available online httpsprismoregonstateedu (accessed on 30
December 2020)43 Loehle C Height growth rate tradeoffs determine northern and southern range limits for trees J Biogeogr 1998 25 735ndash742
[CrossRef]44 McNulty SG Boggs JL Sun G The rise of the mediocre forest Why chronically stressed trees may better survive extreme
episodic climate variability New For 2014 4 403ndash415 [CrossRef]45 National Oceanic and Atmospheric Administration National Centers for Environmental Information (NCEI) US Billion-Dollar
Weather and Climate Disasters 2020 Available online httpswwwncdcnoaagovbillions (accessed on 25 February 2020)46 Niinemets Uuml Valladares F Tolerance to shade drought and waterlogging of temperate northern hemisphere trees and shrubs
Ecol Monogr 2006 76 521ndash547 [CrossRef]47 Hanberry BB Recent shifts in shade tolerance and disturbance traits in forests of the eastern United States Ecol Process 2019
8 32 [CrossRef]48 Hanberry BB Bragg DC Hutchinson TF A reconceptualization of open oak and pine ecosystems of eastern North America
using a forest structure spectrum Ecosphere 2018 9 e02431 [CrossRef]49 Gresham CA Williams TM Lipscomb DJ Hurricane Hugo wind damage to southeastern US coastal forest tree species
Biotropica 1991 23 420ndash426 [CrossRef]50 Christy M Why are the prairies treeless In Proceedings of the Royal Geographical Society and Monthly Record of Geography Duke
University Press Durham NC USA 1892 Volume 14 pp 78ndash10051 Gleason HA The relation of forest distribution and prairie fires in the Middle West Torreya 1913 13 173ndash18152 Davis AM The prairie-deciduous forest ecotone in the upper Middle West Ann Assoc Am Geogr 1977 67 204ndash213 [CrossRef]53 Gerhard F Illinois as It Is Keen and Lee Chicago IL USA 1857 Available online httpscataloghathitrustorgRecord0012
68669 (accessed on 10 December 2020)54 Kettle WD Rich PM Kindscher K Pittman GL Fu P Land-use history in ecosystem restoration A 40-year study in the
prairie-forest ecotone Restor Ecol 2000 8 307ndash317 [CrossRef]55 Penfound WT The savanna concept in Oklahoma Ecology 1962 43 774ndash775 [CrossRef]56 Hanberry BB Classifying large wildfires by land cover in the United States Remote Sens 2020 12 2966 [CrossRef]57 Hanberry BB Reclassifying the wildland-urban interface using fire occurrences for the United States Land 2020 9 225 [CrossRef]
Land 2021 10 1121 2 of 17
older trees in forests Trees are slow-growing long-lived and immobile after establishmentresulting in resistance to change under historical range of variation Saplings sometimesare examined but most saplings will die regardless of conditions simply because manymore saplings are produced than can become canopy trees therefore saplings are indefi-nite indicators of change because they have not yet succeeded at surviving conditions toadulthood Unless forests are extensively cleared or trees are scarce or at lower densitiessuch as in grasslands or savannas trees that are surveyed during a 30 year interval maybetter reflect conditions of the previous 30 years or longer given the mean age of forests
Even a significant climate change that corresponds with tree change in density ordiversity may not necessarily cause consistent changes in tree density or diversity particu-larly if the magnitude of change is relatively small or the sign or direction of climate changevaries Significant climate changes may not be ecologically meaningful if climate changeremains within historical variation of when trees did not change in density or diversity [3]Most tree species are distributed across a range of annual total precipitation and significantprecipitation change may not be equivalent to an effect size in tree response If the samepatterns of tree change in density or diversity occur under a variety of different climateconditions then climate is not a sufficient mechanism for tree change Indeed in somecases trees may have the same response of increased density and diversity under droughtas under increased moisture because they are actually responding to other more immedi-ately influential disturbance changes such as no longer dying from fire (ie drought canreduce the quantity of fuels available to burn trees [4ndash6])
Historical tree surveys and pollen records demonstrate that primary tree compositionof oaks and pines has remained stable at landscape scales in the eastern United Statesfor at least the past few thousand years throughout a range of moisture and temperaturevariability until changing after Euro-American settlement [78] Historical open oak- andpine-dominated forests that were most dominant during the 1800s may have persisted forhundreds of years without replacement due to low severity non-stand-replacing distur-bances [9] Long-lived oak and pine trees recorded in historical tree surveys during the1800s or earlier represent a relatively unbroken timeline That is 1000 years of climate mayrepresent two to four generations of oak and pine trees because oak and pine trees presentduring the 1800s may have established during the 1500s to 1600s and were offspring oftrees that likely similarly lived for hundreds of years and provided the major source ofpropagules and advance regeneration to the forests
Since Euro-American settlement in the eastern United States many tree species havedensified where they are present and expanded in range which has been attributed to bothincreased precipitation and exclusion of frequent surface fires in addition to other land usechanges [2810] Current closed successional forests of diverse tree species are novel andnot analogous to historical open old-growth fire-dependent oak and pine forests or closedold-growth forests of shade-tolerant tree species [71011] Most naturally regeneratedforests in the eastern US are young due to frequent overstory tree removal with a meanage of 40 to 80 years [12] The southeastern US contains even younger loblolly pine (Pinustaeda) plantations harvested in 20 to 30-year rotations in which broadleaf species typicallyare controlled with herbicides thus intensive forestry products management supplantstree response to other influences
With a hard boundary of ocean to the east eastern tree species are concurrently shiftingwestward in distribution into the central grasslands of the United States (Figure 1) [13]which has been ascribed to slight increases in precipitation [2] Based on survey recordsduring the 1800s of trees that were present historically in the tallgrass prairie provincesbordering eastern forests fire-tolerant oaks may have been about 65 of all trees alongwith some representation by upland hickories and also lowland elms and similar mesicfire-sensitive species (eg in wetland prairies and along the Missouri River and numeroustributaries) [6814] Historically rare or nearly absent fire-sensitive but drought-toleranteastern redcedar (Juniperus virginiana) and a variety of mesic fire- and drought-sensitivespecies have increased in Nebraska Illinois and Missouri [81516] In the southern
Land 2021 10 1121 3 of 17
prairie province of Texas Juniperus ashei and Prosopis glandulosa are examples of speciesthat have increased in density and expanded in grasslands [17] Furthermore easternforests as a whole are also expanding and replacing grasslands [13] Tree advancement anddensification in grasslands were well-recognized in historical accounts Scribnerrsquos statisticalatlas of the United States during 1883 [18] stated that due to arborescent vegetation ldquoTheprairie region is fast disappearing The result is that that the eastern part of what wasfifty years ago a prairie region would scarcely be recognized as such todayrdquo
Land 2021 10 x FOR PEER REVIEW 3 of 17
mesic fire-sensitive species (eg in wetland prairies and along the Missouri River and
numerous tributaries) [6814] Historically rare or nearly absent fire-sensitive but
drought-tolerant eastern redcedar (Juniperus virginiana) and a variety of mesic fire- and
drought-sensitive species have increased in Nebraska Illinois and Missouri [81516] In
the southern prairie province of Texas Juniperus ashei and Prosopis glandulosa are examples
of species that have increased in density and expanded in grasslands [17] Furthermore
eastern forests as a whole are also expanding and replacing grasslands [13] Tree advance-
ment and densification in grasslands were well-recognized in historical accounts Scrib-
nerrsquos statistical atlas of the United States during 1883 [18] stated that due to arborescent
vegetation ldquoThe prairie region is fast disappearinghellip The result is that that the eastern
part of what was fifty years ago a prairie region would scarcely be recognized as such
todayrdquo
Figure 1 Generalized boundaries of eastern tallgrass prairie grasslands (light green) and forests in
the eastern United States (purple colors with variation depicting the southeast region central east
region and northeast region) The northern (251) and southern (255) prairie ecological provinces are
also demarcated
Here I applied an approach that included a combination of historical evidence from
published accounts to isolate initiation of tree changes in density or diversity the climate
metric of water availability from the Palmer Modified Drought Index (PMDI) modeled
from tree-ring chronologies calibrated with instrumental records [19] and statistical
change point tests of PMDI to determine if significant change in climate preceded tree
expansion from eastern forests into the central grasslands during the period 1860 to 1890
in the United States I also applied change point detection to grassland and forest land-
scapes based on an index of land use change the threshold of 25 land area in agriculture
which appeared to indicate approximate timing of vegetation change throughout the east-
ern United States for four grassland and four forest landscapes representing land use
change around 1860 1880 1900 and 1920 throughout the eastern United States (Figure 2)
However if timing of tree change followed unprecedented land use change after Euro-
American settlement then land use change was determined to be the driving factor and
Figure 1 Generalized boundaries of eastern tallgrass prairie grasslands (light green) and forests inthe eastern United States (purple colors with variation depicting the southeast region central eastregion and northeast region) The northern (251) and southern (255) prairie ecological provinces arealso demarcated
Here I applied an approach that included a combination of historical evidence frompublished accounts to isolate initiation of tree changes in density or diversity the climatemetric of water availability from the Palmer Modified Drought Index (PMDI) modeledfrom tree-ring chronologies calibrated with instrumental records [19] and statistical changepoint tests of PMDI to determine if significant change in climate preceded tree expansionfrom eastern forests into the central grasslands during the period 1860 to 1890 in the UnitedStates I also applied change point detection to grassland and forest landscapes based onan index of land use change the threshold of 25 land area in agriculture which appearedto indicate approximate timing of vegetation change throughout the eastern United Statesfor four grassland and four forest landscapes representing land use change around 18601880 1900 and 1920 throughout the eastern United States (Figure 2) However if timingof tree change followed unprecedented land use change after Euro-American settlementthen land use change was determined to be the driving factor and any correspondingand significant climate change points would only be supporting secondary factors Ithen discussed whether climate and land use met the following criteria correspondencein timing with tree change magnitude beyond historical range of variation consistentdirection of change and mechanism
Land 2021 10 1121 4 of 17
Land 2021 10 x FOR PEER REVIEW 4 of 17
any corresponding and significant climate change points would only be supporting sec-
ondary factors I then discussed whether climate and land use met the following criteria
correspondence in timing with tree change magnitude beyond historical range of varia-
tion consistent direction of change and mechanism
Figure 2 Decade where area in agriculture reached ge25 for four grassland landscapes (green) and
four forest landscapes (purple) Gray designates where area in agriculture was ge25 by 1850 at the
beginning of the agricultural surveys
2 Materials and Methods
21 Timing of Tree Change from Historical Records
Historical evidence was compiled from published accounts to establish timing as
specifically as possible of tree expansion from eastern forests into the northern and south-
ern prairie provinces of the central grasslands in the United States Historical accounts
usually are difficult to translate into specific data points for analysis Additionally ar-
chival literature is obscure and challenging to locate and consequently fragmentary in
nature Nonetheless historical records can inform timing of trends when surveys do not
supply continuous data in space and time and in fact national surveys were suspended
during the approximate time of change Historical land surveys principally conducted by
the General Land Office recorded trees generally before 1860 in the eastern United States
The oldest available modern and spatiotemporally comprehensive tree surveys began
during the 1960s (although surveys commenced after the McSweeneyndashMcNary Forest Re-
search Act of 1928) varying by US state Well-accepted ecological divisions were used
for delineating grasslands and forests [20]
22 Decade That Agricultural Area Reached ge25 by County as an Index of Land Use Change
Further context for the issue of climate change and tree change can occur if the timing
of tree change is derived from a time series of spatial land use data This is an improve-
ment to determining tree change by imprecise literature for each ecological province
However logically if land use change dictates timing of tree change then any detection
of climate change points will be at best supporting secondary factors
One historical land use dataset is agricultural area since 1850 where area in agricul-
ture ge25 by county provides a rough approximation for tree change (Figure 3) [21] For
example during 1860 77 of Illinois the easternmost state in the northern prairie prov-
ince where Gleason [22] documented the progressive change to agriculture with fire ex-
clusion and tree increases was ge25 agricultural area During the previous decade 11
Figure 2 Decade where area in agriculture reached ge25 for four grassland landscapes (green) andfour forest landscapes (purple) Gray designates where area in agriculture was ge25 by 1850 at thebeginning of the agricultural surveys
2 Materials and Methods21 Timing of Tree Change from Historical Records
Historical evidence was compiled from published accounts to establish timing asspecifically as possible of tree expansion from eastern forests into the northern and south-ern prairie provinces of the central grasslands in the United States Historical accountsusually are difficult to translate into specific data points for analysis Additionally archivalliterature is obscure and challenging to locate and consequently fragmentary in natureNonetheless historical records can inform timing of trends when surveys do not supplycontinuous data in space and time and in fact national surveys were suspended during theapproximate time of change Historical land surveys principally conducted by the GeneralLand Office recorded trees generally before 1860 in the eastern United States The oldestavailable modern and spatiotemporally comprehensive tree surveys began during the1960s (although surveys commenced after the McSweeneyndashMcNary Forest Research Act of1928) varying by US state Well-accepted ecological divisions were used for delineatinggrasslands and forests [20]
22 Decade That Agricultural Area Reached ge25 by County as an Index of Land Use Change
Further context for the issue of climate change and tree change can occur if the timingof tree change is derived from a time series of spatial land use data This is an improvementto determining tree change by imprecise literature for each ecological province Howeverlogically if land use change dictates timing of tree change then any detection of climatechange points will be at best supporting secondary factors
One historical land use dataset is agricultural area since 1850 where area in agri-culture ge25 by county provides a rough approximation for tree change (Figure 3) [21]For example during 1860 77 of Illinois the easternmost state in the northern prairieprovince where Gleason [22] documented the progressive change to agriculture with fireexclusion and tree increases was ge25 agricultural area During the previous decade11 of Illinois was ge25 in agriculture as Gleason [22] described Oklahoma did notbecome a state officially until 1907 but based on agricultural area in Kansas to the north andTexas to the south a large part of the southern prairie province may have become ge25 inagriculture between 1870 and 1880 (Figure 4) Additionally the agricultural map capturedboth western expansion of Euro-American settlement and forested areas that were lesssuitable for agriculture due to cold temperatures mountains or wetlands Initiation of
Land 2021 10 1121 5 of 17
tree change in the eastern United States may range from as early as 1620 in the first Euro-American settlements to as late as 1950 in remote forested locations but these ending andstarting points are localized areas rather than larger landscapes where climate is likely tomatch in scale [2324] As with any threshold for continuous values values lt25 also mayindicate initiation of change particularly given a surrounding matrix of heavily modifiedland and high road densities A few areas never reached the 25 agriculture thresholdbut as little as 10 anthropogenic land cover may cause a 50 reduction in fire extentparticularly due to linear barriers of trails and roads [25] Although generalized the (15to) 25 agriculture threshold is a proxy for origination of tree change with specific timeand locations by county (Figure 2)
23 The Palmer Modified Drought Index of Climate Change
Trees are expanding westward along a moisture gradient that decreases from east towest therefore precipitation change rather than temperature change is the purported factorfor climate change However precipitation alone does not represent available water forvegetation Therefore many indices have been developed to represent available moisturethe Palmer Drought variants approximate the long-term balance between precipitationand water loss The Palmer Modified Drought Index (PMDI) modeled from tree-ringchronologies calibrated and validated with instrumental data [19] may be the most accurateand realized proxy of available water for trees over time Drought intensity is representedby negative numbers Reconstructions extend PMDI estimates to over 2000 years on a 05degree latitudelongitude grid
Land 2021 10 x FOR PEER REVIEW 5 of 17
of Illinois was ge25 in agriculture as Gleason [22] described Oklahoma did not become
a state officially until 1907 but based on agricultural area in Kansas to the north and Texas
to the south a large part of the southern prairie province may have become ge25 in agri-
culture between 1870 and 1880 (Figure 4) Additionally the agricultural map captured
both western expansion of Euro-American settlement and forested areas that were less
suitable for agriculture due to cold temperatures mountains or wetlands Initiation of
tree change in the eastern United States may range from as early as 1620 in the first Euro-
American settlements to as late as 1950 in remote forested locations but these ending and
starting points are localized areas rather than larger landscapes where climate is likely to
match in scale [2324] As with any threshold for continuous values values lt25 also may
indicate initiation of change particularly given a surrounding matrix of heavily modified
land and high road densities A few areas never reached the 25 agriculture threshold
but as little as 10 anthropogenic land cover may cause a 50 reduction in fire extent
particularly due to linear barriers of trails and roads [25] Although generalized the (15
to) 25 agriculture threshold is a proxy for origination of tree change with specific time
and locations by county (Figure 2)
Figure 3 Area in agriculture in 1850 and 1860 (modified from [21]) Figure 3 Area in agriculture in 1850 and 1860 (modified from [21])
Land 2021 10 1121 6 of 17Land 2021 10 x FOR PEER REVIEW 6 of 17
Figure 4 Area in agriculture in 1870 and 1880 (modified from [21])
23 The Palmer Modified Drought Index of Climate Change
Trees are expanding westward along a moisture gradient that decreases from east to
west therefore precipitation change rather than temperature change is the purported fac-
tor for climate change However precipitation alone does not represent available water
for vegetation Therefore many indices have been developed to represent available mois-
ture the Palmer Drought variants approximate the long-term balance between precipita-
tion and water loss The Palmer Modified Drought Index (PMDI) modeled from tree-ring
chronologies calibrated and validated with instrumental data [19] may be the most accu-
rate and realized proxy of available water for trees over time Drought intensity is repre-
sented by negative numbers Reconstructions extend PMDI estimates to over 2000 years
on a 05 degree latitudelongitude grid
24 Change Point Detection
Sequential change point detection are tests (eg t-test) to identify points at which
statistical properties of a time series of observations change Change point detection does
not require separation into time intervals for comparison particularly appropriate for de-
tecting anomalies Similarly to drought indices a variety of different approaches to iden-
tify change point detection are available one method may not identify all major change-
points efficiently [26] Therefore to detect all major changepoints I used two methods for
change point detection that applied different algorithms and options (changepoint pack-
age with PELT algorithm [27] cpm package with t-test [2829])
Figure 4 Area in agriculture in 1870 and 1880 (modified from [21])
24 Change Point Detection
Sequential change point detection are tests (eg t-test) to identify points at whichstatistical properties of a time series of observations change Change point detection doesnot require separation into time intervals for comparison particularly appropriate for de-tecting anomalies Similarly to drought indices a variety of different approaches to identifychange point detection are available one method may not identify all major changepointsefficiently [26] Therefore to detect all major changepoints I used two methods for changepoint detection that applied different algorithms and options (changepoint package withPELT algorithm [27] cpm package with t-test [2829])
25 Change Point Detection for Historical Records of Tree Change in the Prairie Provinces
In grasslands tree response is noticeable after a change in conditions and rapidtree change may occur within two decades [2230ndash32] To match documented timing ofvegetation change from about 1860 to 1880 in the northern prairie province and a decadelater in the southern prairie province based on historical information with significantchanges in PMDI values change point detection was applied Climate change was expectedto occur within the preceding 20 years of density or diversity tree changes in grasslandsalthough other reasonably adjacent change points were considered (Table 1)
Land 2021 10 1121 7 of 17
Table 1 Approximate decades of tree change in density and diversity and expected preceding PalmerModified Drought Index (PMDI) change for two prairie provinces based on historical records and forgrassland and forest areas after reaching the threshold of 25 agriculture
Extent Tree Change PMDI Change
North prairie 1860ndash1880 1840ndash1860
South prairie 1870ndash1890 1850ndash1870
Grassland 1860 (1850ndash1870) 1830ndash1850
1880 (1870ndash1890) 1850ndash1870
1900 (1890ndash1910) 1870ndash1890
1920 (1910ndash1930) 1890ndash1910
Forest 1860 (1850ndash1870) 1820ndash1850
1880 (1870ndash1890) 1840ndash1870
1900 (1890ndash1910) 1860ndash1890
1920 (1910ndash1930) 1880ndash1910
26 Change Point Detection for Grassland and Forest Landscapes Based on Land Use Change
Change points for PMDI were identified in four grassland and four forest landscapesthat reached ge25 agriculture by 1860 1880 1900 and 1920 (ie each landscape corre-sponded with a decade of land use change Figure 2 Table 1) The date of tree change isrelatively fixed albeit with some uncertainty For grasslands with rapid response by treeswithin 20 years climate change was expected to occur between 1830 to 1850 for areas ge25agriculture by 1860 that is initiation of tree increases in density and diversity from 1850 to1870 (Table 1) Because forests are resistant to change if larger trees already occupy growingspace long lags may occur However as indicated by rapid conversion to agriculture themajority of eastern forests were cleared in cycles during this time interval which openedgrowing space for trees Additionally many of these forests were savannas and woodlandsessentially a combination of grasslands and overstory trees For forests then the lag beforetree change was extended from 20 years to 30 years For example climate change wasexpected to occur between 1820 to 1850 for areas ge25 agriculture by 1860 with treechange initiating between 1850 to 1870
3 Results31 Timing of Tree Change from Historical Information
According to historical accounts tree changes commenced from about 1860 to 1880in the northern prairie province and while not unvarying in onset perhaps a decade laterfor the landscape of the southern prairie province (Table 2) Timing and location remainedrelatively general despite the search for precise information These changes encompassedboth increased tree density and diversity Moreover trees have continued to increase indensity and diversity since the 1800s
Land 2021 10 1121 8 of 17
Table 2 Location and years when tree or shrub encroachment were documented in the two prairieprovinces
Extent Location Year Reference
North prairie
Kansas before 1867 Taylor 1867Illinois Indiana Iowa Wisconsin after 1860 Gleason 1922
South prairie
Oklahoma before 1931 Bruner 1931Oklahoma and south prairies before 1844 Grigg 1844
Texas before 1878 to1898 Cook 1908
For the northern prairie province Taylor [33] documented rapid spread of treesinto the grasslands of Kansas ldquoI first witnessed a phenomenon of which I had oftenheardmdashthe spontaneous production of forests from prairie land Hundreds of acres whichthe cultivated fields beyond had protected against the annual inundation of fire werecompletely covered with young oak and hickory trees from four to six feet in heightrdquoGleason [22] who is now regarded as a prominent ecologist wrote that rapid and noticeabletree advancement into grasslands ensued after fire exclusion which he determined occurredabout 1860 in Illinois ldquoSettlement of the forested regions of the Middle West began aboutthe opening of the nineteenth century progressed steadily westward and reached theMissouri River in fifty years Actual settlement of the prairies was long avoided vast areaswere still untouched at the time of the Civil War and prairie fires did not cease being amenace in parts of Illinois until 1860 and in Iowa until somewhat later As soon as firesceased the advance of the forest was renewed and at a rate probably more rapid than theoriginal since considerable improvement of climate may have taken place since the firstadvance was stopped by fires Early literature contains many accounts of this spread of theforested area which was rapid enough to attract the attention of travelers It seems to haveprogressed in several different ways The lateral advance of the forest at right angles tothe streams and the longitudinal advance along the streams continued as before Willowscottonwoods and some hydrophytic shrubs moved rapidly up the rivers and creeks andwere followed by elms maples and ashes Thirty years after the first prairie settlementswere made in Macon and Moultrie counties Illinois these fringing forests had extended oneor two miles up the smaller streams Isolated colonies of mobile species especially willowSalix humilis and wild plum Prunus americana were established well out on the prairiegrew into thickets and frequently received further additions of forest species carried inby the birds which visited them or by wind Large areas of barrens were converted intoforest as by magic when the fires that had maintained them were stopped and the oaksprouts became trees The total afforestation during this period was considerable andin some cases almost unbelievable and may best be indicated by a few examples Thusthe driftless area of northwestern Illinois and southwestern Wisconsin which now givesthe impression of having been heavily forested was 80ndash90 prairie a century ago Alittle later we find farmers near St Louis complaining that the rapid growth of trees hadseriously restricted the natural pastures The Mississippi and Illinois rivers at that timehad long strips of prairie in their floodplains which are now completely forested exceptwhere under cultivation The dune region at the head of Lake Michigan which is nowwell forested with oak was then ldquotreeless except for a few stunted pinesrdquo Forested areasin Indiana were developed within the memory of men now living from barrens overwhich a man on horseback had been visible for six miles (personal communication fromMr C C Deam) The rapid development of forests on the sand dunes of the Illinois Riverhas been noted elsewhererdquo
For the southern prairie province Bruner [34] specified for Oklahoma ldquoBecause ofthe recurrence of prairie fires forest has not developed but there is abundant evidence
Land 2021 10 1121 9 of 17
that forests are replacing the prairie since the settlement of the country and the cessationof fires Prairie fires are assumed to be the main factor in keeping the more moistprairies free from trees and even at this early date pioneers had observed the spread offorests into various grassland areas which were protected from firerdquo The cited lsquoearly datersquorefers to Gregg [35] who stated ldquoWe are now witnessing the encroachment of the timberupon the prairies wherever the devastating conflagrations have ceased their ravagesrdquo ForTexas Cook [36] wrote ldquoIt is a matter of popular knowledge in south Texas that extensiveregions which were formerly grassy open prairies are now covered with a dense growthof mesquite (Prosopis) prickly-pear cactus (Opuntia) and many other shrubby plants ofintermediate size Testimony to this effect is definite and unanimous It differs locally onlyin the number of years since the bushes began to growmdashthirty years or twenty or tenmdashsubsequent to the establishment of the grazing industry on a large scale the annual burningof the grass by the cattlemen and finally the fencing of the land for still more intensivegrazing That such fires were evidently the cause of the former treeless condition of thesouthwestern prairies is also shown by the fact that trees are found in all situations whichafford protection against fires Trees of many kinds have thriven well where planted invillages and about homesteads in addition to the natural spread of the woody vegetationas soon as the fires cease If reforestation were to continue uninterrupted by fires orother forms of human interference the Gulf plains of Texas would again become coveredwith dense subtropical forests rdquo
32 Climate Change Points Based on Historical Accounts of Timing
As a summary of the PMDI dataset over time mean values during the period between1800 and 1899 were minus016 (standard deviation (SD) of 147 coefficient of variation (CV)of minus949) for the northern prairie province and minus011 (SD of 161 CV of minus1476) for thesouthern prairie province (Figure 5) Between 1900 and 1999 mean PMDI values were 030(SD of 162 CV of 543) for the northern prairie province and 027 (SD of 175 CV of 641)for the southern prairie province Frequent oscillations from drought to pluvials occurredsuch as above-average PMDI during the early 1900s followed by the Dust Bowl drought ofthe 1930s in the northern prairie province which created a wide range of deviation
Because tree changes were initiated from about 1860 to 1880 in the northern prairieprovince and a decade later in the southern prairie province the expected change in climatewas between 1840 and 1860 in the northern prairie province and between 1850 and 1870in the southern prairie province (Table 1) [2236] The cpm method produced many morechange points than the changepoint method which had no change points during the 1800sThe southern province had 12 significant change points since 1000 including change pointsat years 1855 and 1865 and then again at 1952 (Table 3) The interval of 1855 and 1864marked an extremely dry interval (mean of minus2 SD of 146 Figure 5) Removal of theyears 1855 to 1864 also removed those change points leaving a continuous interval ofsimilar dryness between 1494 and 1952 By 1952 tree change already had been noticed anddocumented in scientific publications
Land 2021 10 1121 10 of 17
Land 2021 10 x FOR PEER REVIEW 9 of 17
of firesPrairie fires are assumed to be the main factor in keeping the more moist prairies
free from trees and even at this early date pioneers had observed the spread of forests into
various grassland areas which were protected from firerdquo The cited lsquoearly datersquo refers to
Gregg [35] who stated ldquoWe are now witnessing the encroachment of the timber upon the
prairies wherever the devastating conflagrations have ceased their ravagesrdquo For Texas
Cook [36] wrote ldquoIt is a matter of popular knowledge in south Texas that extensive re-
gions which were formerly grassy open prairies are now covered with a dense growth of
mesquite (Prosopis) prickly-pear cactus (Opuntia) and many other shrubby plants of in-
termediate size Testimony to this effect is definite and unanimous It differs locally only
in the number of years since the bushes began to growmdashthirty years or twenty or tenmdash
subsequent to the establishment of the grazing industry on a large scale the annual burn-
ing of the grass by the cattlemen and finally the fencing of the land for still more intensive
grazinghellipThat such fires were evidently the cause of the former treeless condition of the
southwestern prairies is also shown by the fact that trees are found in all situations which
afford protection against fireshellip Trees of many kinds have thriven well where planted in
villages and about homesteads in addition to the natural spread of the woody vegetation
as soon as the fires ceasehellip If reforestation were to continue uninterrupted by fires or other
forms of human interference the Gulf plains of Texas would again become covered with
dense subtropical forestshelliprdquo
32 Climate Change Points Based on Historical Accounts of Timing
As a summary of the PMDI dataset over time mean values during the period be-
tween 1800 and 1899 were minus016 (standard deviation (SD) of 147 coefficient of variation
(CV) of minus949) for the northern prairie province and minus011 (SD of 161 CV of minus1476) for the
southern prairie province (Figure 5) Between 1900 and 1999 mean PMDI values were 030
(SD of 162 CV of 543) for the northern prairie province and 027 (SD of 175 CV of 641)
for the southern prairie province Frequent oscillations from drought to pluvials occurred
such as above-average PMDI during the early 1900s followed by the Dust Bowl drought
of the 1930s in the northern prairie province which created a wide range of deviation
Figure 5 The PMDI values for quarter-century interval box plots during years 1000 to 2000 (101equals first quarter-century of the 1000s) and all PMDI values during years 1700 to 1950 with a fittedline and 95 confidence intervals for the northern (251) and southern (255) prairie provinces
Table 3 Approximate decades of tree change in density and diversity and expected preceding change in Palmer ModifiedDrought Index (PMDI) and sequential change point detection (with two methods) for two prairie provinces and for grasslandand forest areas after reaching the threshold of 25 agriculture
Extent Tree Change PMDI Change Change Point Years
North Prairie 1860ndash1880 1840ndash1860
cpm 1011 1036 1104 1108 1115 1233 1245 1276 1440 1490 1548 1619 16271636 1664 1672 1697 1700 1903 1931 1942 1953 1973
changepoint 1104 1108 1115 1233 1245 1619 1627 1993
South prairie 1870ndash1890 1850ndash1870
cpm 1053 1061 1165 1177 1258 1455 1459 1494 1855 1865 1952 1957changepoint 1053 1061 1168 1177 1257 1973
Grassland 1860 (1850ndash1870) 1830ndash1850
cpm 1104 1107 1245 1276 1736 1738 1799 1882changepoint 1104 1107 1619
1880 (1870ndash1890) 1850ndash1870
cpm 1011 1036 1104 1108 1115 1233 1245 1276 1440 1490 1492 1619 16271636 1664 1672 1697 1700 1736 1855 1876 1894
Land 2021 10 1121 11 of 17
Table 3 Cont
Extent Tree Change PMDI Change Change Point Years
changepoint 1104 1108 1115 1233 1245 1440 1490 1492 1973
1900 (1890ndash1910) 1870ndash1890
cpm 1011 1036 1076 1104 1233 1245 1276 1282 1455 1490 1576 1619 16261673 1697 1827 1838 1855 1877 1893 1902 1931 1942 1952 1965 1993
changepoint 1076 1233 1245 1992
1920 (1910ndash1930) 1890ndash1910
cpm 1017 1040 1090 1146 1160 1233 1238 1265 1421 1425 1449 1498 15791592 1610
changepoint none
Forest 1860 (1850ndash1870) 1820ndash1850
cpm 1021 1023 1104 1142 1154 1346 1351 1563 1574 1882changepoint none
1880 (1870ndash1890) 1840ndash1870
cpm 1021 1023 1104 1265 1273 1346 1351 1555 1581 1736 1738changepoint none
1900 (1890ndash1910) 1860ndash1890
cpm 1142 1150 1265 1269 1309 1346 1402 1450 1457 1556 1575 1903changepoint none
1920 (1910ndash1930) 1880ndash1910
cpm 1035 1104 1142 1150 1179 1204 1207 1249 1309 1322 1450 1457 14881600 1608 1903
changepoint 1104 1600
The northern province had 23 significant change points since 1000 but no changepoints during the expected time interval needed to initiate tree change from 1855 to 1880However a change point occurred in 1903 which was later than the documented treechange The time between 1903 and the next change point of 1931 (ie the Dust Bowldrought) was less dry (mean of 071 SD of 161) than the antecedent same length intervalof 1875 to 1902 (mean of 016 SD of 165) If it is plausible that tree changes in the northernprairie province of the grasslands did not occur on average until 1903 or later then thequestion is whether a PMDI change between a mean of 071 and the antecedent mean of 016is ecologically necessary for change Comparable fluctuations occurred during the 1600sIndeed removal of PMDI values from 1625 to 1899 resulted in continuity until changepoints in 1930 the Dust Bowl drought indicating that the early 1900s were similar to theearly 1600s The magnitude of climate change was within historical range and multiplesignificant climate change points since 1000 were not sufficient to allow eastern redcedarand mesic eastern tree species increases into the grasslands [3738]
33 Climate Change Points Based on Timing of Land Use
All the ecological landscapes (ie gt1 million ha Figure 2) had at least eight changepoints with the cpm method (Table 3) Only two of the grassland landscapes and one ofthe forest landscapes had PMDI change points that fell within the bounds of expected treechange with the cpm method No change points occurred for the changepoint methodduring the 1800s
The grassland landscape for land use change by 1880 had change points during theperiod 1855 to 1876 for which PMDI values decreased from minus002 (SD of 143) during theperiod 1736 to 1854 to minus106 (SD of 132) during the period 1855 to 1875 therefore thisinterval was drier The PMDI values increased to 088 (SD of 123) during the period 1876to 1893 the next change points Nevertheless values in 1876 and later were continuous
Land 2021 10 1121 12 of 17
with historical values during the 1500s The grassland landscape for land use change by1900 had change points in 1877 and 1893 for which PMDI increased from minus123 (SD of140) during the period 1855 to 1876 to 083 (SD of 132) during the period 1877 to 1892 anddecreased back to minus126 (SD of 106) in 1893 and 1902 These short fluctuations from drierto wetter to drier conditions are not unusual in the PMDI record The forest landscapewith change in land use by 1920 had a change point in 1903 with similar PMDI values forchange from about minus030 (SD of 106) during the period 1608 to 1902 to 001 (SD of 146)after 1902 These PMDI values were typical and the magnitude of change was minimalconsidering the amount of variation
4 Discussion41 Influence of Climate Change
Increased moisture did not constitute a consistent correlation for tree density ordiversity change in grasslands and forests of the eastern United States Correlation ofclimate change with vegetation change was inconsistent Only one change point methoddetected changes in PMDI during the 1800s For this method less than half of the ecologicallandscapes (ie gt1 million ha) had change points in climate that matched with range ofexpected timing to influence tree density or diversity change in the United States Themagnitude of change was not unusual compared with past climate oscillations from dryto wet intervals were typical Moreover change points included droughts that transpiredduring 1855 to either 1864 or 1875 resulting in direction of change contradictions Fyeet al [39] also documented a drought analogous in magnitude to the Dust Bowl droughtfrom 1855 to 1865 that extended from the western US into the tallgrass prairie provincesof the North American grasslands
The mechanism of climate effects on trees is unreliable in temperate grasslands andforests that have moderate precipitation (eg 65 cm to 125 cm) Release of tree growthtree establishment and woodland expansion within the central grasslands have occurredduring dry climate intervals [4ndash640] Wells [37] noted that there was no range of climatetoo arid for trees in the Great Plains grasslands Gleason [41] declared ldquoIn Illinois whereforest species habitually spring up along roadsides and on un-cultivated places on theprairie it is obvious that the climate favors the forest and that forest should rapidly succeedthe prairie if no other causes were in operationrdquo
Without long-term records tree changes that have been ensuing since Euro-Americansettlement may be ascribed to short-term climate changes that are within historical rangesof variation In the eastern tallgrass prairie provinces annual precipitation increasedfrom 82 cm during the period 1951 to 1980 to 89 cm during the period 1981 to 2015which is a range of precipitation that is tolerable to eastern tree species [3742] moreoverprecipitation increases alone do not account for concurrent temperature increases that mayboost evapotranspiration Between 1980 and 2015 Fei et al [2] found 65 of 86 tree specieshad a significant westward shift in abundance centers After acknowledging that indirectand non-climatic factors could have influenced westward movement Fei et al [2] statedldquowe observed clear broad-scale evidence of the impact of climate change on forest treespatial dynamics where changes in mean annual precipitation alone explained about 19of the variability in species abundance change and spatial shiftrdquo Even so tree changesdetected between the earliest and most recent modern tree inventories will not correspondwith before and after climate changes if tree changes originated before the tree surveysAttribution of change to precipitation during the period 1951 to 1980 as compared with theperiod 1981 to 2015 is a correlation mismatch because trees increased and expanded westbefore 1980 at steady and noticeable rates after Euro-American settlement [22] Indeed theprimary implication of Fei et alrsquos [2] research may be that trees increased and expandedduring a range of mean annual precipitation
Nevertheless climate will become increasingly influential compared with land useas climate changes beyond historical variation at least of the past 20000 years In theeastern United States widely distributed temperate tree species will not face the same
Land 2021 10 1121 13 of 17
challenges as northern boreal species with genetic commitment to traits of cold and freezetolerance [43] However extreme meteorological events such as flash droughts floodingwindstorms heatwaves and fire weather days are expected to increase with warmingwhich progressively will test the ability of vegetation to survive grow and reproduce [44]For example in the United States during the 1980s 28 events occurred per year that costat least a billion dollars at USD 128 billion per year the number of events has increasedsteadily each decade and during the 2010s 119 ge billion-dollar events occurred per yearat USD 802 billion per year which surpassed inflation rates [45] Moreover extreme eventsmay interact and create more pathways for damage stressed trees may become susceptibleto insect and disease outbreaks Current standards of healthy trees which are fast-growingand healthy forests which are fully stocked may be maladaptive under climate changeMcNulty et al [44] recommended forest management such as thinning to curb maximumpotential forest growth creating a ldquoresource availability bufferrdquo as a strategy for extremeclimatic conditions and associated secondary impacts Slower-growing tree species withgreater root resources such as fire-tolerant species with early growth dedicated to rootsrather than shoots for survival of frequent surface fire may be more resistant to catastrophicepisodic mortality [44] and grassland vegetation too is likely more resistant and resilientthan current forests in the eastern US
Indeed the tree species that have increased during the past century along withtree density increases due to changing land use including agriculture probably havemade eastern US forests less resilient to climate change and extreme events Historicallydominant widespread oak and pine species are drought- and fire-tolerant but these specieshave been replaced by more mesic drought- and fire-sensitive species such as maplesashes and elms [46ndash48] Historically dominant forests occurred as low-density savannasand woodlands which provide benefits of reduced water demand and also reduced chanceof insect outbreaks and spreading crown fires compared with dense forests [44] Forestsof lower tree densities with tree continuity rather than high contrast edges comprised oftrees that allocate resources to roots (ie historical open forests and historically dominantfire-tolerant oak and pines species) are likely to be more windfirm [49]
42 Influence of Land Use Change
If increased moisture does not constitute a consistent correlation with sufficient mag-nitude and direction or mechanism for tree change in grasslands and forests of the easternUnited States then an alternative option is that land use was driving tree change in densityand diversity Intensive and extensive agricultural use was unprecedented resulting in ap-propriate magnitude and direction for driving tree change along with correlation in timingand a consistent mechanism for tree change Vegetation changes arose directly from landconversion to land uses exacerbated by cycles of conversion and abandonment Clearingremoved established vegetation and plowing damaged propagules of rootstocks and seedbanks Continued severe disturbance created opportunities for a new suite of species withtraits for responding to relatively frequent vegetation removal every 20 to 100 years [12]However in addition to direct land use change to severe vegetation disturbance landuse change excluded frequent surface fire Historical accounts described a sequence ofadvancing western Euro-American settlement gradually extinguished surface frequentfire regimes and release of young trees [30]
Surface fire occurred almost annually in eastern tallgrass prairies which have the great-est amount of precipitation of the central grasslands of North America allowing growth ofplentiful herbaceous vegetation that are fuels for frequent surface fire Tree propagules at-tempted to establish in grasslands but most tree establishment was removed by fire Treeswere limited to firebreak locations of either water and wetlands rocky outcrops or thin soilsand rough and steep topography of bluffs escarpments and ridges [343750ndash52] Becausethe prevailing winds are from the west and drove fire eastward more trees occurred on theprotected east sides of firebreaks [5051]
Land 2021 10 1121 14 of 17
Exclusion of fire includes active fire suppression discontinuation of fire as a manage-ment tool with additional restrictions by laws and changing cultural norms and passiveland use changes that prevent fire spread by reducing herbaceous vegetation that providesfine fuels Roads and other linear vegetation discontinuities specifically act as firebreaksIndeed Euro-American settlers in grasslands cleared herbaceous vegetation for somedistance around their fields and houses and wore down vegetation with wagon tracksor plowed furrows as fireguards around their holdings to disrupt fire spread and to en-courage tree growth into the disturbed soil [5053] Tree presence disrupted flammabilitywhile protected conditions under trees reduced probability of fire occurrence Equally onunburned areas woody plant cover both increased in density and invaded new locationsA combination of historical tree surveys aerial photos and field observations allowedBragg and Hulbert [32] to quantify that on unburned sites tree and shrub cover increased34 from 1937 to 1969 and tree cover alone increased 24 from 1856 to 1969 in Kansas Incontrast woody plants in regularly burned sites increased by only 2 from 1937 to 1969These measurements concurred with Kettle et al [54] for the interval between 1957 and1997 in Kansas mowing or burning limited tree cover to lt3 compared with gt97 treecover without treatment Penfound [55] wrote for Oklahoma ldquoWith heavy grazing and fireprotection a continuing increase in arborescent cover has occurred in areas which wereformerly occupied by savannardquo
Agricultural activities such harvested row crops and grazing by cattle also reducevegetation for fuels and chance of fire occurrence For example area in crop is relatedinversely to fire occurrences Mean area of cropland was about 23 for the entire UnitedStates where no fires occurred during the period 1999 to 2017 conversely area in cropwas lt2 where fires recently occurred [56] Likewise Gleason [22] in one of his keypapers documented that fire ended when agriculture increased in Illinois to 1860 levelsof agriculture compared with 1850 In Illinois agriculture averaged 36 of total areain 1860 compared with 14 in 1850 The threshold of 25 land in agriculture acts anindicator of timing for when humans influenced ecosystem change which will requireadditional evaluation and likely lessens to 10 given surrounding land conversion Incontrast agricultural area initially may need to exceed the 25 threshold to disrupt firein undeveloped grasslands and forests with low density of roads and harvested fields inparticular and additionally less area in houses combined with a persistent culture of fireuse as a management tool Although data about population densities are also available forthe 1800s humans at very low densities can affect vegetation and modulate fire regimes(eg by increasing ignitions while producing fewer firebreaks of fields and trails) so thata threshold is less apparent Relatedly housing densities and not human densities wasthe influential variable for modeling recent fire occurrences [57] Housing densities andpercent of land converted to agriculture are manifestations of the magnitude of humaninfluence on fire exclusion and vegetation
Land use change specifically fire exclusion satisfies the requirements for timingof tree change in conjunction with land use following Euro-American settlement excep-tional magnitude unidirectional sign of change and mechanism Compared with climatefluctuations around historical ranges of variation during the time of vegetation changedeparture of fire from historical frequencies is of a greater magnitude due to fire exclusionWhile fire return intervals have varied over time which may produce significant changepoints exclusion was a definitive departure in magnitude In addition to correlation intime and magnitude fire exclusion provides a consistent mechanism for change by al-lowing fire-sensitive tree species to survive Surface fire removes small diameter woodyvegetation thereby reducing tree density particularly of fire-sensitive tree species andfavoring herbaceous vegetation which is adapted to removal of aboveground growthHerbaceous vegetation provides fine fuels that ignite more readily than coarse woody fuelsincreasing fire frequency As fire exclusion is prolonged flammability markedly decreaseswith replacement of herbaceous vegetation by trees further reducing the probability of fireoccurrence A moderate range of precipitation (eg 65 cm to 125 cm) in temperate climates
Land 2021 10 1121 15 of 17
supplies both wet periods that produce abundant herbaceous fuels and dry periods thatdry herbaceous fuels which are necessary conditions for fire Climate changes that increaseor decrease moisture and continuity of herbaceous fuels may affect fire frequency
5 Conclusions
This approach to determine timing of vegetation change in tree density and diversityaccounted for both climate (ie water balance with PMDI) and land use change Cli-mate change points were frequent but not consistent with timing of tree changes and ifthey corresponded a range of climate occurred including drought indicating a problemwith mechanism Additionally the magnitude of climate change was within historicalranges Conversely novel land use provided the correct timing mechanism direction andmagnitude of change Land use has many components that influence ecosystem changeincluding the progression from Euro-American settlement to exclusion of frequent surfacefires
The other outcome of this research was the identification of a potential proxy forwhen humans influenced vegetation change a threshold of 15 to 25 land area inagriculture that is a direct index of human modification of the landscape Percent of land inagriculture is available as spatially explicit GIS layers by decade since 1850 for the UnitedStates [21] At landscape scales fit appeared to be appropriate and an improvement tosearching through archival records that cannot provide specific data points Additionalclose evaluation and refinement by experts is necessary with corroboration from multiplelines of historical evidence Thresholds of agricultural area by county may decrease assurrounding agricultural area increases In any event an approximate data layer thatindicates timing and location of vegetation change is a major progression in the ability toanalyze drivers of change
Funding This research received no external funding
Institutional Review Board Statement This study did not involve humans or animals
Informed Consent Statement This study did not involve humans
Data Availability Statement Cook ER Seager R Heim RR Vose RS Herweijer C andWoodhouse C (2010) Megadroughts in North America Placing IPCC projections of hydroclimaticchange in a long-term paleoclimate context Journal of Quaternary Science 25 48ndash61 Available athttpswwwncdcnoaagovpaleo-searchstudy19119 (accessed on 1 December 2020)
Acknowledgments The author thanks anonymous reviewers for their time and comments thatimproved the clarity of the manuscript This research was supported by the USDA Forest ServiceRocky Mountain Research Station The findings and conclusions in this publication are those of theauthor and should not be construed to represent any official USDA or US Government determinationor policy
Conflicts of Interest The author declares no conflict of interest
References1 Kangas RS Brown TJ Characteristics of US drought and pluvials from a high-resolution spatial dataset Int J Climatol 2007
27 1303ndash1325 [CrossRef]2 Fei S Desprez JM Potter KM Jo I Knott JA Oswalt CM Divergence of species responses to climate change Sci Adv
2017 3 e1603055 [CrossRef]3 Hanberry BB Abrams MD White JD Is increased precipitation during the 20th century statistically or ecologically significant
in the eastern US J Land Use Sci 2018 13 259ndash265 [CrossRef]4 Ziegler SS Larson ER Rauchfuss J Elliott GP Tree establishment during dry spells at an oak savanna in Minnesota
Tree-Ring Res 2008 64 47ndash55 [CrossRef]5 Shuman B Henderson AK Plank C Stefanova I Ziegler SS Woodland-to-forest transition during prolonged drought in
Minnesota after ca AD 1300 Ecology 2009 90 2792ndash2807 [CrossRef]6 Rogers TR Russell FL Historical patterns of oak population expansion in the Chautauqua Hills Kansas J Biogeogr 2014 41
2105ndash2114 [CrossRef]
Land 2021 10 1121 16 of 17
7 Delcourt PA Delcourt HR Late-Quaternary dynamics of temperate forests Applications of paleoecology to issues of globalenvironmental change Quat Sci Rev 1987 6 129ndash146 [CrossRef]
8 Hanberry B Kabrick JM He HS Changing tree composition by life history strategy in a grassland-forest landscape Ecosphere2014 5 art34 [CrossRef]
9 Lorimer CG Historical and ecological roles of disturbance in eastern North American forest 9000 years of change Wildl SocBull 2001 29 425ndash439
10 Hanberry BB Coursey K Kush JS Structure and composition of historical longleaf pine ecosystems in Mississippi USA HumEcol 2018 46 241ndash248 [CrossRef]
11 Hanberry BB Baseline to novel ecosystems in Michigan USA with a quantitative and qualitative assessment Eacutecoscience 202027 255ndash268 [CrossRef]
12 Pan Y Chen JM Birdsey R McCullough K He L Deng F Age structure and disturbance legacy of North American forestsBiogeosciences 2011 8 715ndash732 [CrossRef]
13 Hanberry BB Hansen MH Advancement of tree species across ecotonal borders into non-forested ecosystems Acta Oecologica2015 68 24ndash36 [CrossRef]
14 Srinath I Millington AC Evaluating the Potential of the Original Texas Land Survey for Mapping Historical Land andVegetation Cover Land 2016 5 4 [CrossRef]
15 Rothenberger SJ Extent of woody vegetation on the prairie in eastern Nebraska 1855ndash1857 In Prairie Pioneers Ecology Historyand Culture Proceedings of the Eleventh North American Prairie Conferences Bragg TB Stubbendieck J Eds University ofNebraska Lincoln NE USA 1989 pp 15ndash18
16 McLachlan J Settlement Trees Illinois Level 0 Ver 0 Environmental Data Initiative 2020 Available online httpsportaledirepositoryorgnismapbrowsepackageid=msb-paleon280 (accessed on 30 December 2020)
17 Landers RQ Native vegetation of Texas Rangel Arch 1987 9 203ndash20718 Hewes FW Gannett H Scribnerrsquos Statistical Atlas of the United States Scribnerrsquos Sons New York NY USA 1883 Available
online httpswwwlocgovitema40001834 (accessed on 7 January 2021)19 Cook ER Seager R Heim RR Vose RS Herweijer C Woodhouse C Megadroughts in North America Placing IPCC
projections of hydroclimatic change in a long-term paleoclimate context J Quat Sci 2010 25 48ndash61 Available onlinehttpswwwncdcnoaagovpaleo-searchstudy19119 (accessed on 1 December 2020) [CrossRef]
20 Keys JE Cleland DT McNab WH Delineation Peer Review and Refinement of Subregions of the Conterminous United States GenTech Report WO-76A Department of Agriculture Forest Service Washington DC USA 2007
21 Maizel M White RD Root R Gage S Stitt S Osborne L Muehlbach G Historical Interrelationships between PopulationSettlement and Farmland in the Conterminous United States 1790 to 1992 1998 Available online httpsarchiveusgsgovarchivesiteslandcoverusgsgovluhnachap2html (accessed on 21 May 2020)
22 Gleason HA The vegetational history of the Middle West Ann Assoc Am Geogr 1922 12 39ndash85 [CrossRef]23 Day GM The Indian as an ecological factor in the Northeastern forest Ecology 1953 34 329ndash346 [CrossRef]24 DeSantis RD Hallgren SW Lynch TB Burton JA Palmer MW Long-term directional changes in upland Quercus forests
throughout Oklahoma USA J Veg Sci 2010 21 606ndash618 [CrossRef]25 Duncan BW Schmalzer PA Anthropogenic influences on potential fire spread in a pyrogenic ecosystem of Florida USA
Landsc Ecol 2004 19 153ndash165 [CrossRef]26 Marine Data Science Comparison of Change Point Detection Methods 2019 Available online httpswwwmarinedatascience
coblog20190928comparison-of-change-point-detection-methods (accessed on 25 September 2021)27 Killick R Eckley I Changepoint An R package for changepoint analysis J Stat Softw 2014 58 1ndash19 [CrossRef]28 Ross GJ Parametric and nonparametric sequential change detection in R The cpm Package J Stat Softw 2015 66 1ndash19
[CrossRef]29 R Core Team R A Language and Environment for Statistical Computing R Foundation for Statistical Computing Vienna Austria
202030 Davidson R An Excursion to the Mammoth Cave and the Barrens of Kentucky AT Silliman and Son Lexington Kentucky 1840
Available online httpswwwgooglecombookseditionAn_Excursion_to_the_Mammoth_Cave_and_the71EVAAAAYAAJhl=enampgbpv=1ampprintsec=frontcover (accessed on 1 July 2021)
31 Shaler NS Kentucky A Pioneer Commonwealth Houghton Mifflin and Co Boston MA USA New York NY USA 1885Available online httpswwwgooglecombookseditionKentucky_a_Pioneer_CommonwealtheIAxAQAAMAAJhl=enampgbpv=1ampprintsec=frontcover (accessed on 2 June 2021)
32 Bragg TB Hulbert LC Woody plant invasion of unburned Kansas bluestem prairie J Range Manag 1976 29 19ndash24 [CrossRef]33 Taylor B Colorado a Summer Trip Putman New York NY USA 1867 Available online httpsbabelhathitrustorgcgipt
id=hvd32044072260284ampview=1upampseq=9 (accessed on 7 January 2021)34 Bruner WE The vegetation of Oklahoma Ecol Monogr 1931 1 100ndash188 [CrossRef]35 Gregg J Commerce of the Prairies 1844 Available online httpsatlasnmhumorgpdfsCommerceofthePrairiespdf (accessed
on 24 September 2021)
Land 2021 10 1121 17 of 17
36 Cook OF Change of Vegetation on the South Texas Prairie USDA Bureau of Plant Industry Circular Washington DC USA1908 Volume 14 Available online httpsarchiveorgdetailschangeofvegetati14cookpagen1mode2up (accessed on 7January 2021)
37 Wells PV Scarp woodlands transported grassland soils and concept of grassland climate in the Great Plains region Science1965 148 246ndash249 [CrossRef]
38 Hall SA Deteriorated pollen grains and the interpretation of Quaternary pollen diagrams Rev Palaeobot Palynol 1981 32193ndash206 [CrossRef]
39 Fye FK Stahle DW Cook ER Paleoclimatic analogs to twentieth-century moisture regimes across the United States Bull AmMeteorol Soc 2003 84 901ndash910 [CrossRef]
40 Stambaugh MC Guyette RP Marschall J Fire history in the Cherokee nation of Oklahoma Hum Ecol 2013 41 749ndash758[CrossRef]
41 Gleason HA Further views on the succession-concept Ecology 1927 8 299ndash326 [CrossRef]42 Prism Climate Group PRISM Climate Data 2020 Available online httpsprismoregonstateedu (accessed on 30
December 2020)43 Loehle C Height growth rate tradeoffs determine northern and southern range limits for trees J Biogeogr 1998 25 735ndash742
[CrossRef]44 McNulty SG Boggs JL Sun G The rise of the mediocre forest Why chronically stressed trees may better survive extreme
episodic climate variability New For 2014 4 403ndash415 [CrossRef]45 National Oceanic and Atmospheric Administration National Centers for Environmental Information (NCEI) US Billion-Dollar
Weather and Climate Disasters 2020 Available online httpswwwncdcnoaagovbillions (accessed on 25 February 2020)46 Niinemets Uuml Valladares F Tolerance to shade drought and waterlogging of temperate northern hemisphere trees and shrubs
Ecol Monogr 2006 76 521ndash547 [CrossRef]47 Hanberry BB Recent shifts in shade tolerance and disturbance traits in forests of the eastern United States Ecol Process 2019
8 32 [CrossRef]48 Hanberry BB Bragg DC Hutchinson TF A reconceptualization of open oak and pine ecosystems of eastern North America
using a forest structure spectrum Ecosphere 2018 9 e02431 [CrossRef]49 Gresham CA Williams TM Lipscomb DJ Hurricane Hugo wind damage to southeastern US coastal forest tree species
Biotropica 1991 23 420ndash426 [CrossRef]50 Christy M Why are the prairies treeless In Proceedings of the Royal Geographical Society and Monthly Record of Geography Duke
University Press Durham NC USA 1892 Volume 14 pp 78ndash10051 Gleason HA The relation of forest distribution and prairie fires in the Middle West Torreya 1913 13 173ndash18152 Davis AM The prairie-deciduous forest ecotone in the upper Middle West Ann Assoc Am Geogr 1977 67 204ndash213 [CrossRef]53 Gerhard F Illinois as It Is Keen and Lee Chicago IL USA 1857 Available online httpscataloghathitrustorgRecord0012
68669 (accessed on 10 December 2020)54 Kettle WD Rich PM Kindscher K Pittman GL Fu P Land-use history in ecosystem restoration A 40-year study in the
prairie-forest ecotone Restor Ecol 2000 8 307ndash317 [CrossRef]55 Penfound WT The savanna concept in Oklahoma Ecology 1962 43 774ndash775 [CrossRef]56 Hanberry BB Classifying large wildfires by land cover in the United States Remote Sens 2020 12 2966 [CrossRef]57 Hanberry BB Reclassifying the wildland-urban interface using fire occurrences for the United States Land 2020 9 225 [CrossRef]
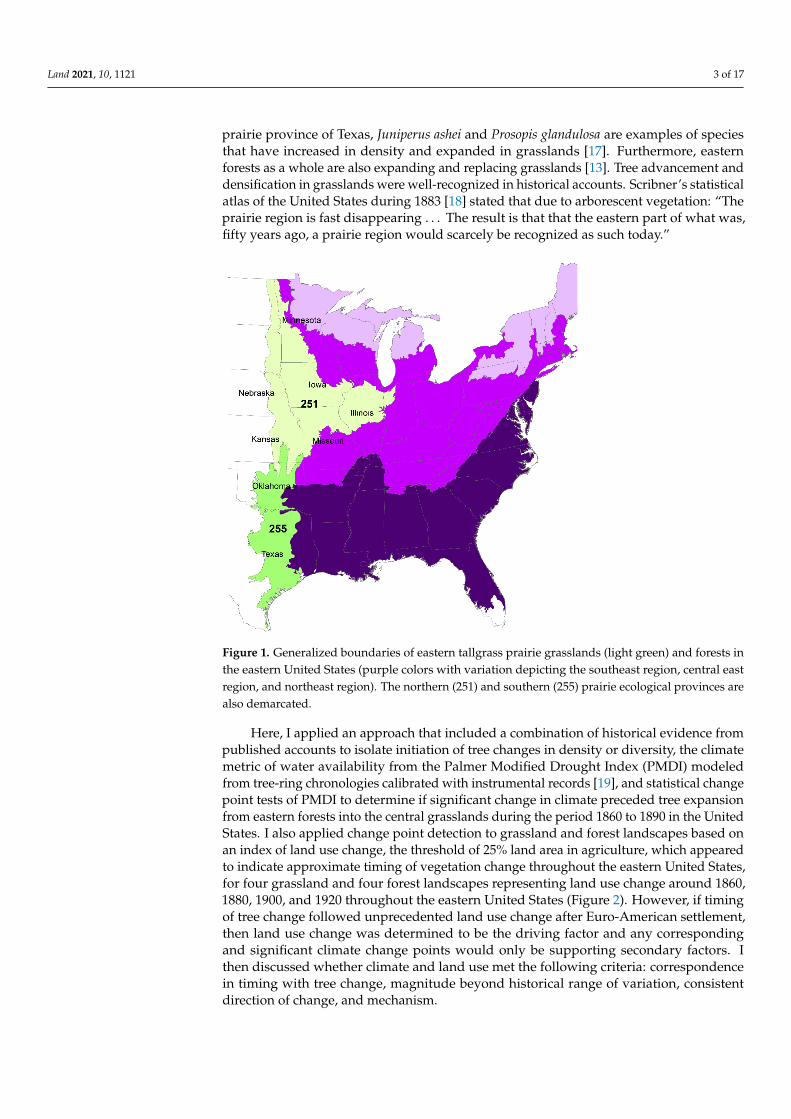
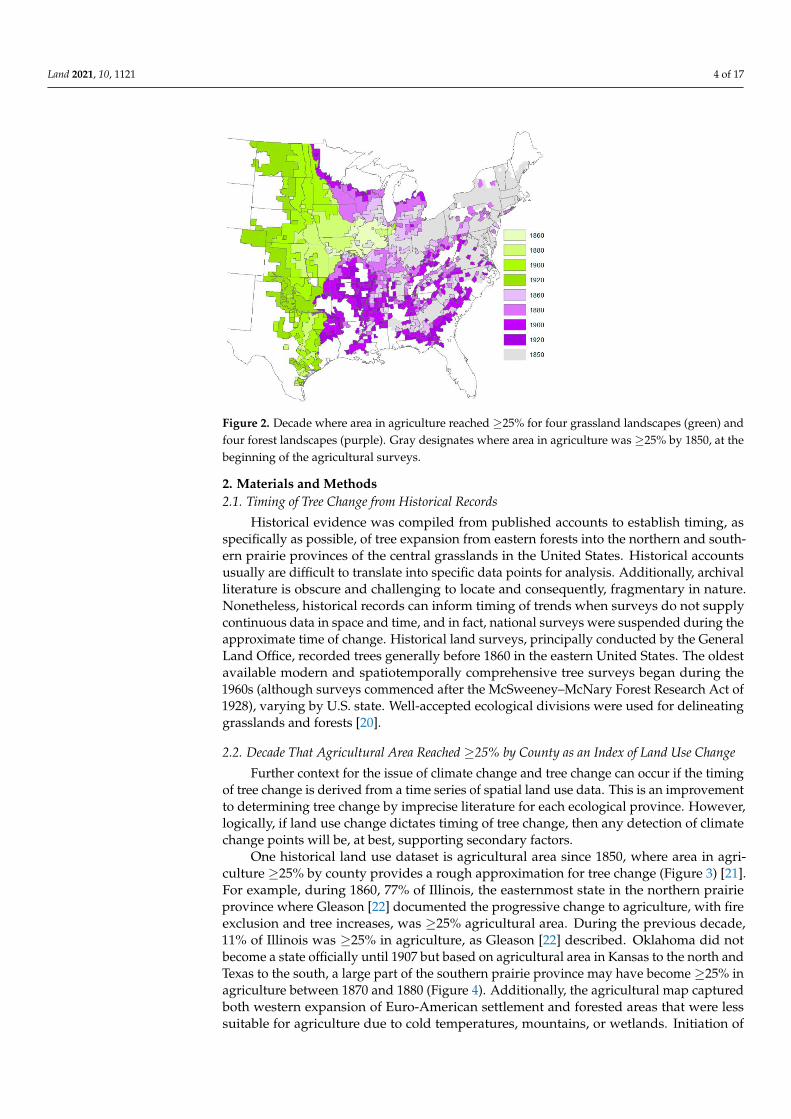
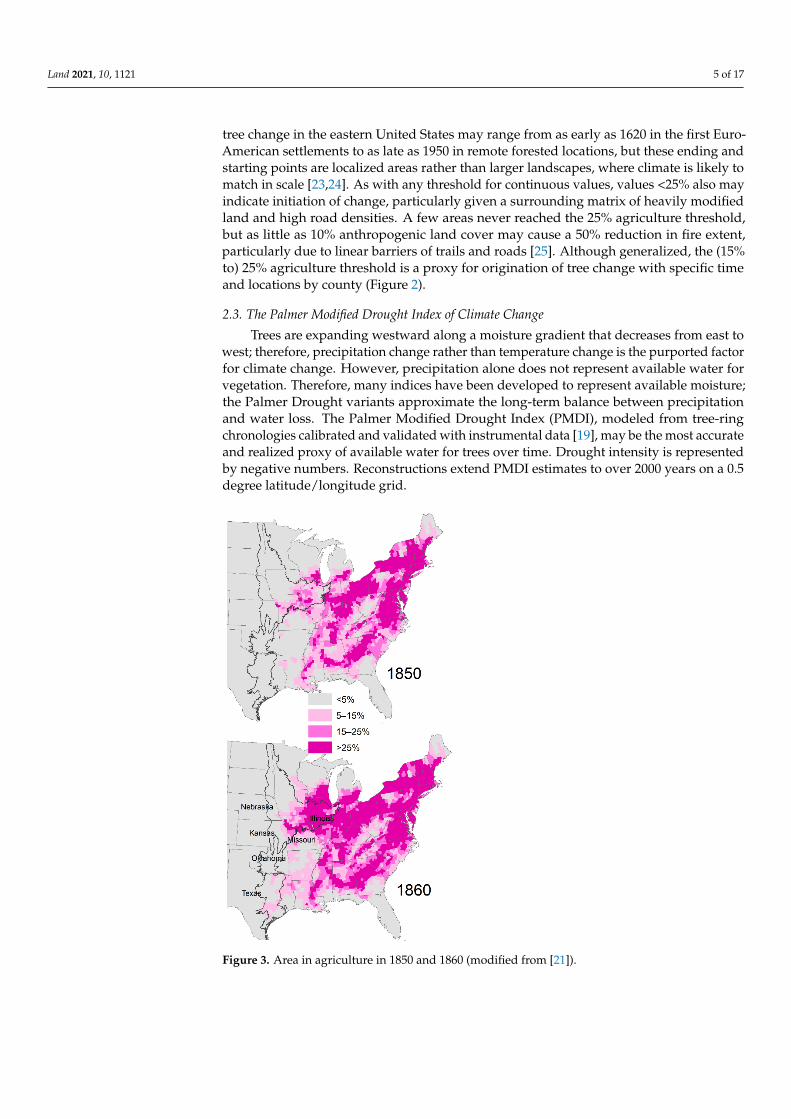
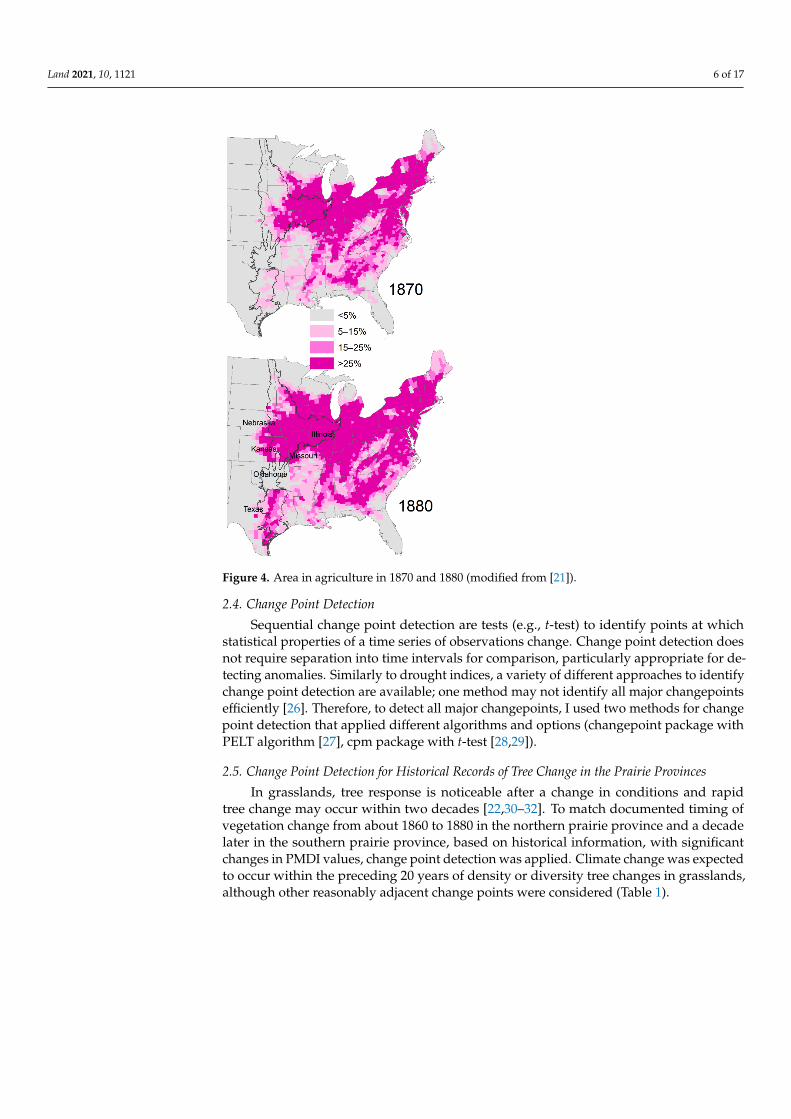
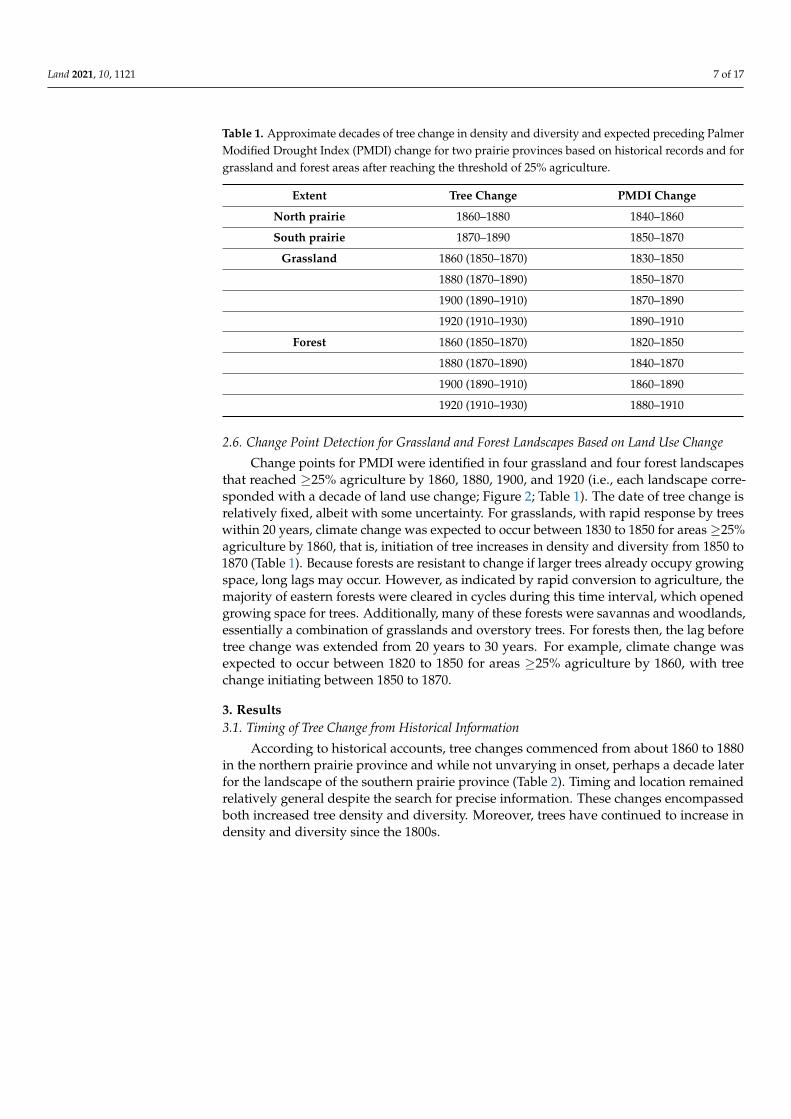
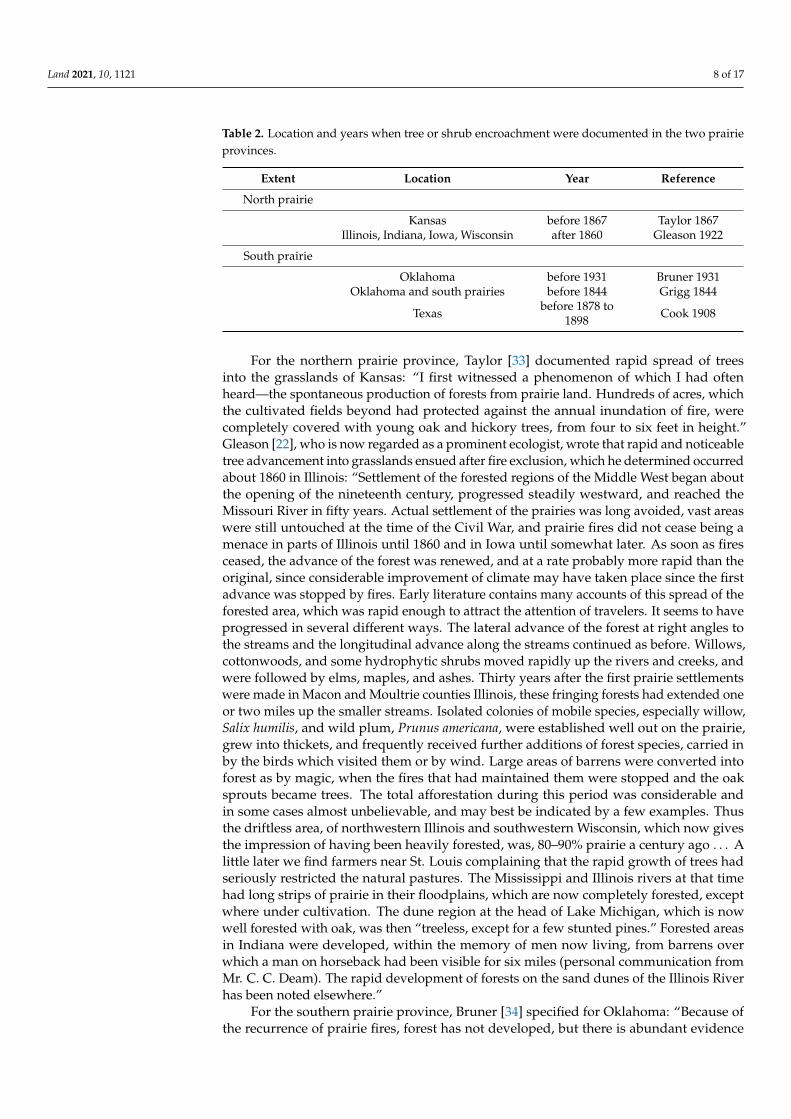
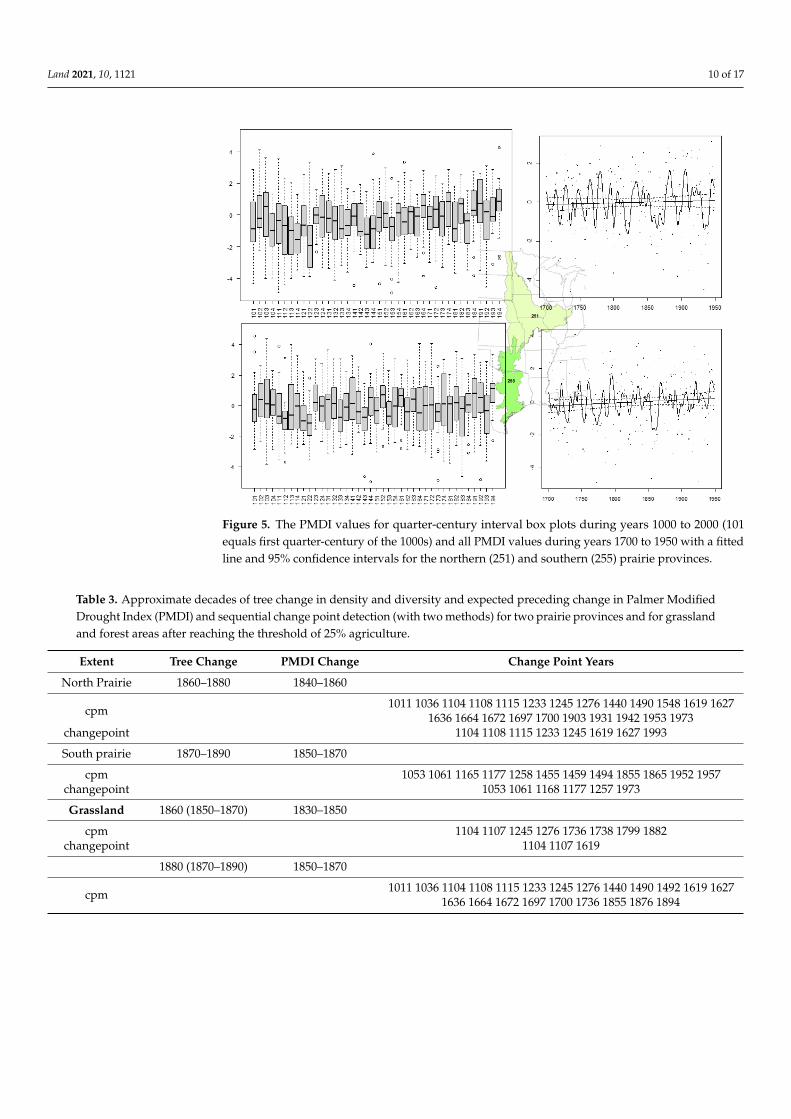