Embed Size (px)
Citation preview
Slide1LabyrinthConsultingServices,Inc. artberman.com
Tight Oil Money Return on Investment Eagle Ford Shale Case History
Art Berman Labyrinth Consulting Services, Inc.
American Chemical Society New Orleans, LA March 21, 2018
Slide2LabyrinthConsultingServices,Inc. artberman.com
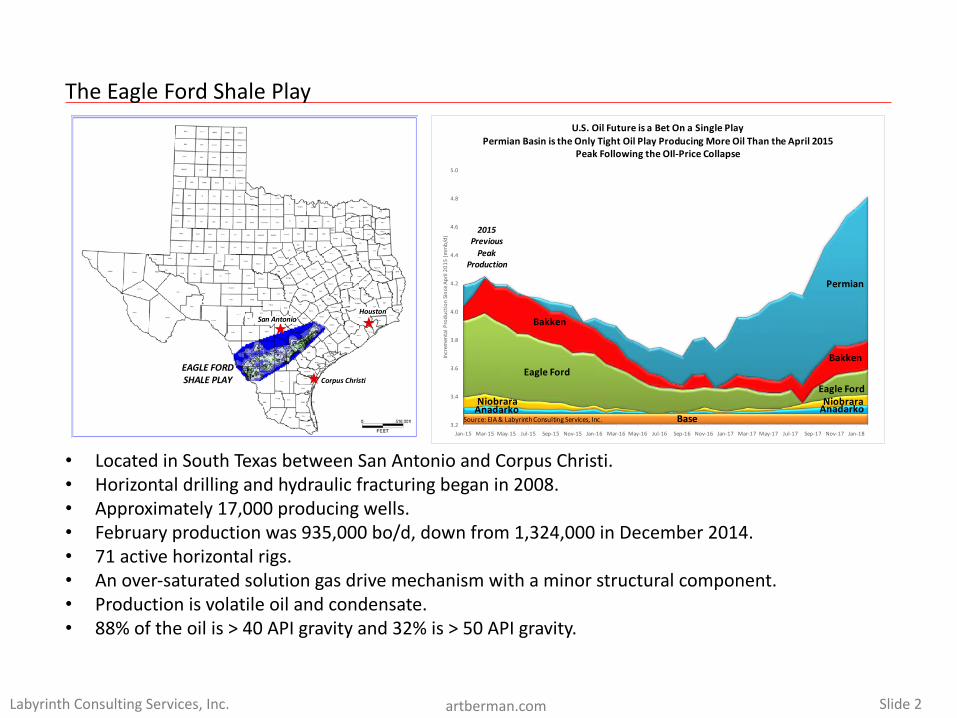
TheEagleFordShalePlay
• LocatedinSouthTexasbetweenSanAntonioandCorpusChristi.• Horizontaldrillingandhydraulicfracturingbeganin2008.• Approximately17,000producingwells.• Februaryproductionwas935,000bo/d,downfrom1,324,000inDecember2014.• 71activehorizontalrigs.• Anover-saturatedsolutiongasdrivemechanismwithaminorstructuralcomponent.• Productionisvolatileoilandcondensate.• 88%oftheoilis>40APIgravityand32%is>50APIgravity.
Corpus Christi
HoustonSan Antonio
EAGLE FORDSHALE PLAY
3.2
3.4
3.6
3.8
4.0
4.2
4.4
4.6
4.8
5.0
Jan-15 Mar-15 May-15 Jul-15 Sep-15 Nov-15 Jan-16 Mar-16 May-16 Jul-16 Sep-16 Nov-16 Jan-17 Mar-17 May-17 Jul-17 Sep-17 Nov-17 Jan-18 IncrementalProductionSinceApril2015(mmb/d)
U.S.OilFutureisaBetOnaSinglePlayPermianBasinistheOnlyTightOilPlayProducingMoreOilThantheApril2015
PeakFollowingtheOIl-PriceCollapse
Source:EIA&LabyrinthConsultingServices,Inc.
EagleFord
Bakken
AnadarkoNiobrara
Permian
EagleFord
Bakken
Base
2015PreviousPeak
Production
AnadarkoNiobrara
Slide3LabyrinthConsultingServices,Inc. artberman.com
EagleFordWellPerformanceEvaluationbyDecline-CurveAnalysis
100
1,000
10,000
100,000
1 10 100
Rate,bblsorM
scf/mon
thTimemonths
LogLogPlotRatevsTime
Points=ActualDataLine=ForecastOil=Green,Gas=Red
100
1,000
10,000
100,000
0 5 10 15 20 25 30 35 40 45 50 55 60
Mon
thlyRate,bblso
rMscf
MonthsfromFirstProduction
Semi-LogPlotofRatevs.Time
Points=ActualDataLine=Forecast
Oil=Green,Gas=Red
EOG 2013OIL GAS
Max 57,000 53,000b 1.25 1.30
Di 20.00 12.00EUR 401,691 295,699
100
1,000
10,000
100,000
1 10 100
Rate,bblsorM
scf/mon
th
Timemonths
LogLogPlotRatevsTime
Points=ActualDataLine=ForecastOil=Green,Gas=Red
100
1,000
10,000
100,000
0 5 10 15 20 25 30 35 40 45 50 55 60
Mon
thlyRate,bblso
rMscf
MonthsfromFirstProduction
Semi-LogPlotofRatevs.Time
Points=ActualDataLine=Forecast
Oil=Green,Gas=Red
DVN 2014OIL GAS
Max 30,000 70,000b 0.475 0.45
Di 1.80 1.20EUR 370,863 1,100,892
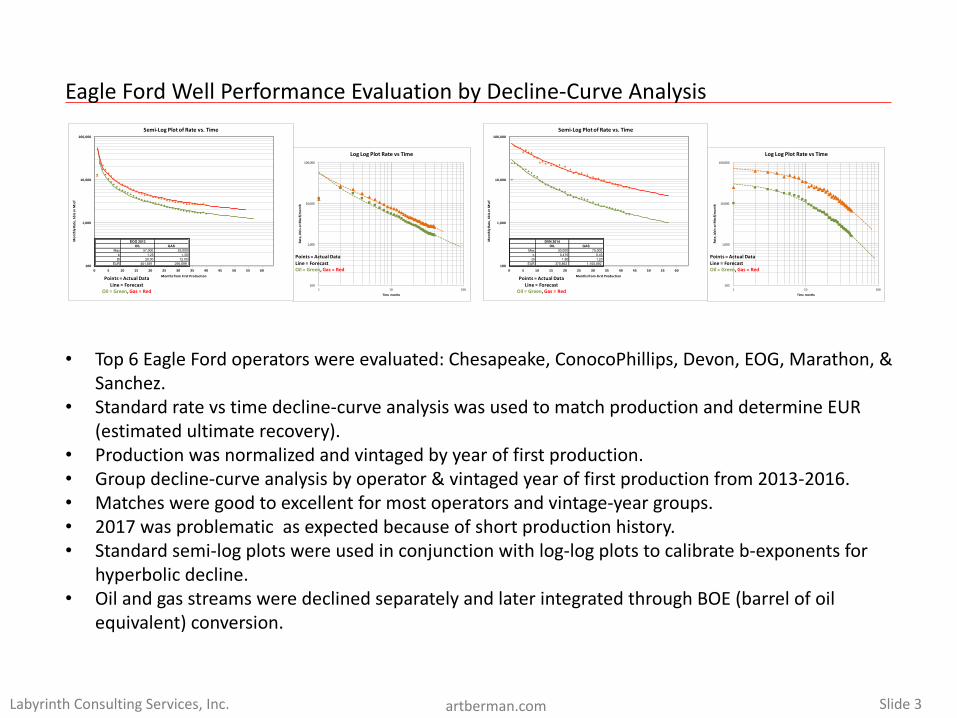
• Top6EagleFordoperatorswereevaluated:Chesapeake,ConocoPhillips,Devon,EOG,Marathon,&Sanchez.
• Standardratevstimedecline-curveanalysiswasusedtomatchproductionanddetermineEUR(estimatedultimaterecovery).
• Productionwasnormalizedandvintaged byyearoffirstproduction.• Groupdecline-curveanalysisbyoperator&vintaged yearoffirstproductionfrom2013-2016.• Matchesweregoodtoexcellentformostoperatorsandvintage-yeargroups.• 2017wasproblematicasexpectedbecauseofshortproductionhistory.• Standardsemi-logplotswereusedinconjunctionwithlog-logplotstocalibrateb-exponentsfor
hyperbolicdecline.• OilandgasstreamsweredeclinedseparatelyandlaterintegratedthroughBOE(barrelofoil
equivalent)conversion.
Slide4LabyrinthConsultingServices,Inc. artberman.com
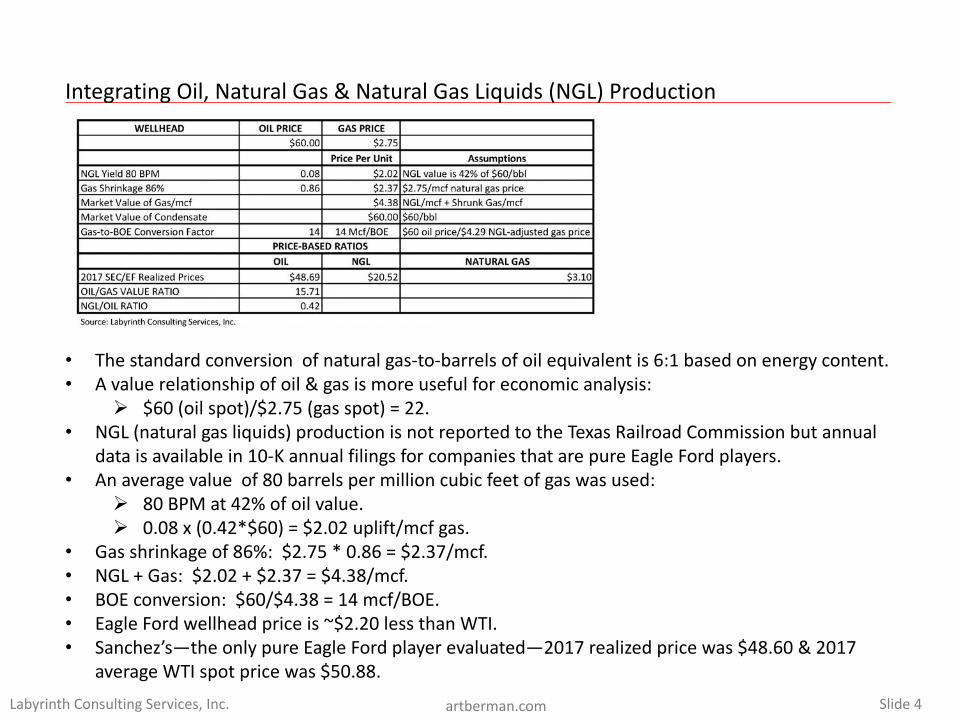
IntegratingOil,NaturalGas&NaturalGasLiquids(NGL)Production
• Thestandardconversionofnaturalgas-to-barrelsofoilequivalentis6:1basedonenergycontent.• Avaluerelationshipofoil&gasismoreusefulforeconomicanalysis:
Ø $60(oilspot)/$2.75(gasspot)=22.• NGL(naturalgasliquids)productionisnotreportedtotheTexasRailroadCommissionbutannual
dataisavailablein10-KannualfilingsforcompaniesthatarepureEagleFordplayers.• Anaveragevalueof80barrelspermillioncubicfeetofgaswasused:
Ø 80BPMat42%ofoilvalue.Ø 0.08x(0.42*$60)=$2.02uplift/mcf gas.
• Gasshrinkageof86%:$2.75*0.86=$2.37/mcf.• NGL+Gas:$2.02+$2.37=$4.38/mcf.• BOEconversion:$60/$4.38=14mcf/BOE.• EagleFordwellheadpriceis~$2.20lessthanWTI.• Sanchez’s—theonlypureEagleFordplayerevaluated—2017realizedpricewas$48.60&2017
averageWTIspotpricewas$50.88.
Slide5LabyrinthConsultingServices,Inc. artberman.com
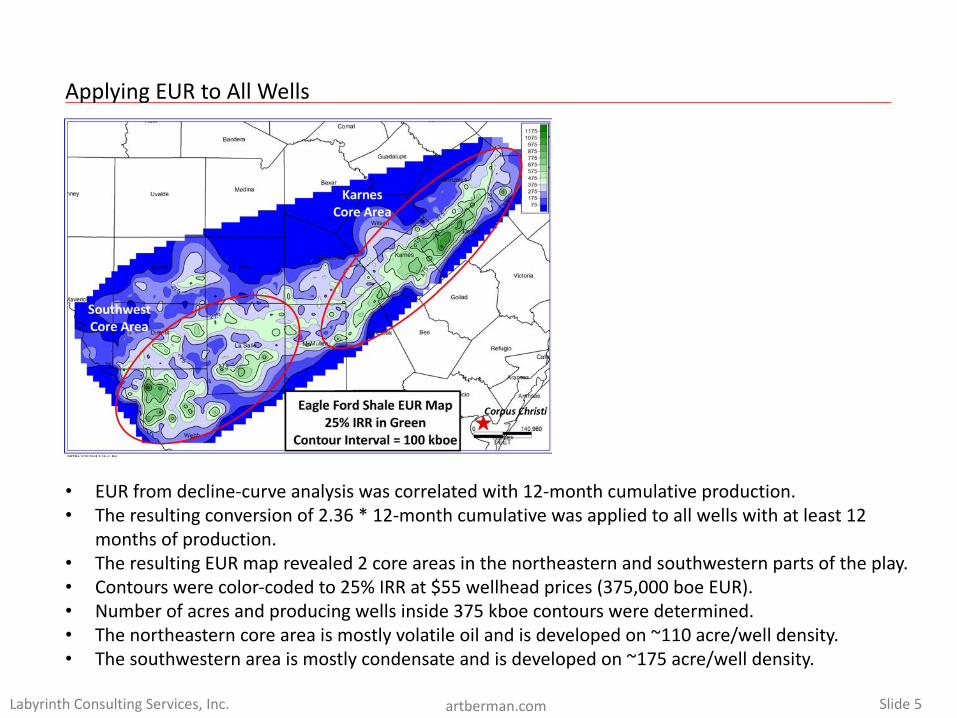
ApplyingEURtoAllWells
• EURfromdecline-curveanalysiswascorrelatedwith12-monthcumulativeproduction.• Theresultingconversionof2.36*12-monthcumulativewasappliedtoallwellswithatleast12
monthsofproduction.• TheresultingEURmaprevealed2coreareasinthenortheasternandsouthwesternpartsoftheplay.• Contourswerecolor-codedto25%IRRat$55wellheadprices(375,000boe EUR).• Numberofacresandproducingwellsinside375kboe contoursweredetermined.• Thenortheasterncoreareaismostlyvolatileoilandisdevelopedon~110acre/welldensity.• Thesouthwesternareaismostlycondensateandisdevelopedon~175acre/welldensity.
Slide6LabyrinthConsultingServices,Inc. artberman.com
EagleFordVariableOperatingExpenses
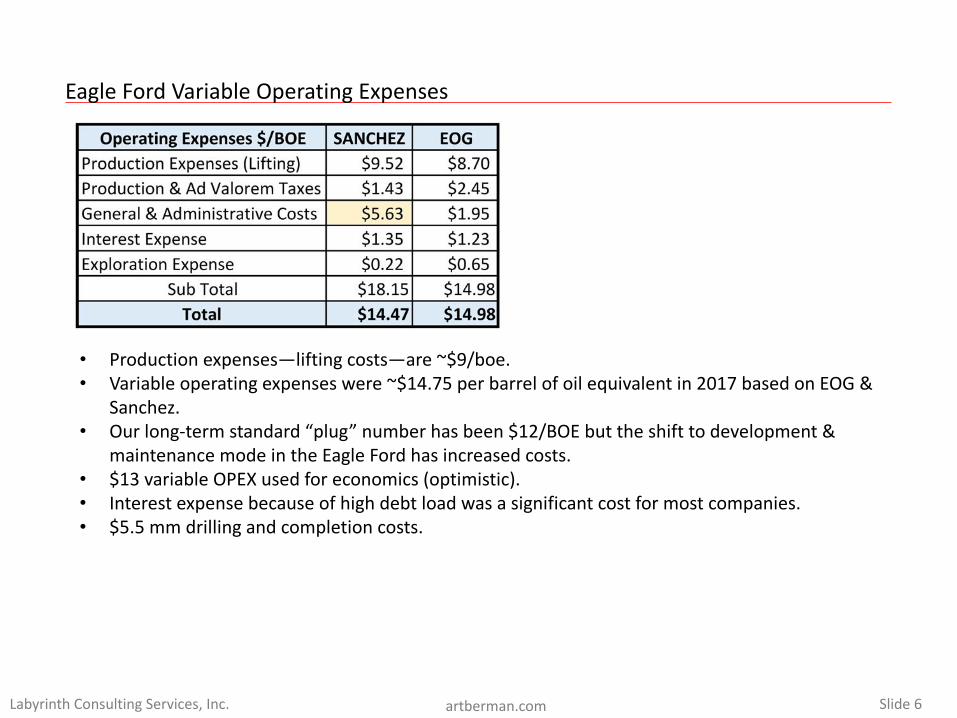
• Productionexpenses—liftingcosts—are~$9/boe.• Variableoperatingexpenseswere~$14.75perbarrelofoilequivalentin2017basedonEOG&
Sanchez.• Ourlong-termstandard“plug”numberhasbeen$12/BOEbuttheshifttodevelopment&
maintenancemodeintheEagleFordhasincreasedcosts.• $13variableOPEXusedforeconomics(optimistic).• Interestexpensebecauseofhighdebtloadwasasignificantcostformostcompanies.• $5.5mmdrillingandcompletioncosts.
Slide7LabyrinthConsultingServices,Inc. artberman.com
EagleFordEURandEconomicResults
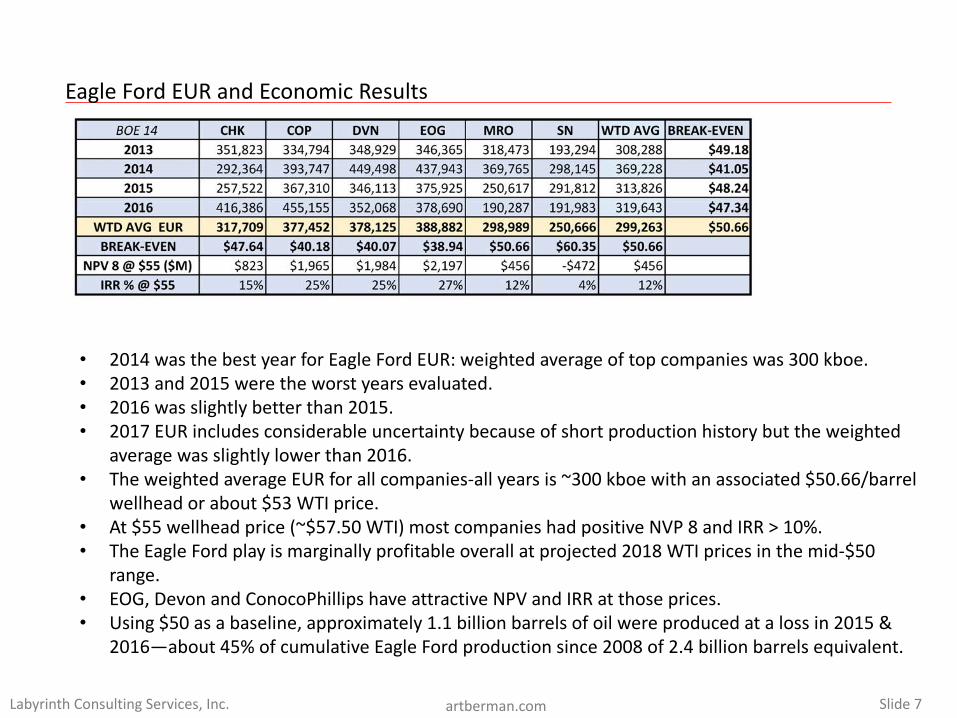
• 2014wasthebestyearforEagleFordEUR:weightedaverageoftopcompanieswas300kboe.• 2013and2015weretheworstyearsevaluated.• 2016wasslightlybetterthan2015.• 2017EURincludesconsiderableuncertaintybecauseofshortproductionhistorybuttheweighted
averagewasslightlylowerthan2016.• TheweightedaverageEURforallcompanies-allyearsis~300kboe withanassociated$50.66/barrel
wellheadorabout$53WTIprice.• At$55wellheadprice(~$57.50WTI)mostcompanieshadpositiveNVP8andIRR>10%.• TheEagleFordplayismarginallyprofitableoverallatprojected2018WTIpricesinthemid-$50
range.• EOG,DevonandConocoPhillipshaveattractiveNPVandIRRatthoseprices.• Using$50asabaseline,approximately1.1billionbarrelsofoilwereproducedatalossin2015&
2016—about45%ofcumulativeEagleFordproductionsince2008of2.4billionbarrelsequivalent.
Slide8LabyrinthConsultingServices,Inc. artberman.com
$0
$10
$20
$30
$40
$50
$60
$70
$80
$90
$100
$110
$120
$130
$140
0.0
50.0
100.0
150.0
200.0
250.0
300.0
350.0
400.0
450.0
500.0
Dec-85
Oct-86
Aug-87
Jun-88
Apr-89
Feb-90
Dec-90
Oct-91
Aug-92
Jun-93
Apr-94
Feb-95
Dec-95
Oct-96
Aug-97
Jun-98
Apr-99
Feb-00
Dec-00
Oct-01
Aug-02
Jun-03
Apr-04
Feb-05
Dec-05
Oct-06
Aug-07
Jun-08
Apr-09
Feb-10
Dec-10
Oct-11
Aug-12
Jun-13
Apr-14
Feb-15
Dec-15
Oct-16
Aug-17
WTIPrice($/barrel)
Oil&GasW
ellD
rillingProducerPriceIndex(1985=100)
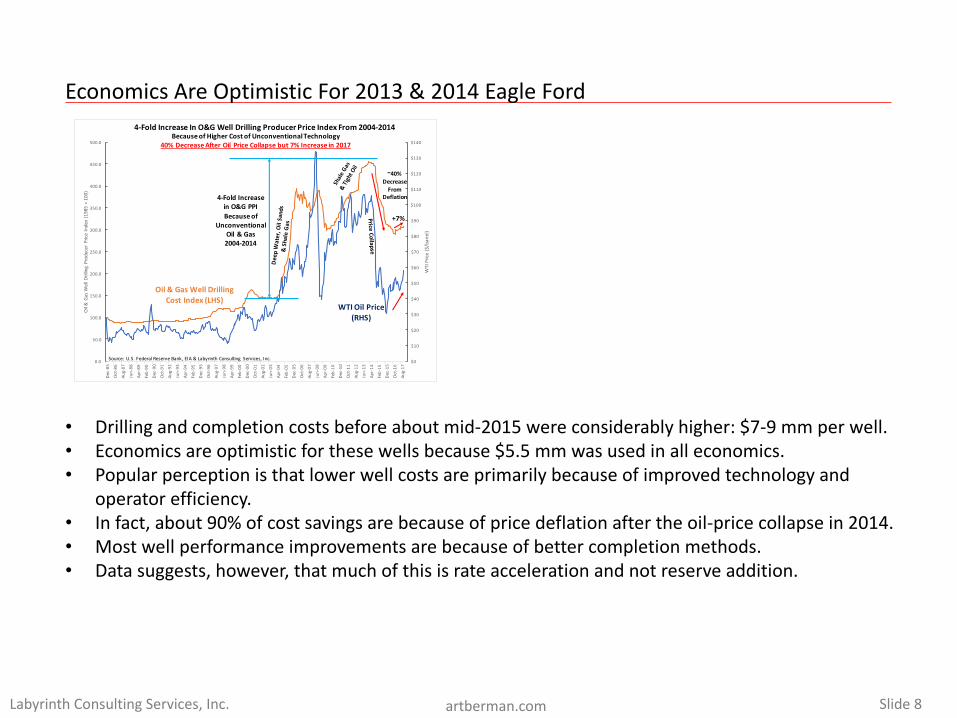
4-FoldIncreaseInO&GWellDrillingProducerPriceIndexFrom2004-2014
WTIOilPrice(RHS)
Oil&GasWell DrillingCostIndex(LHS)
Source:U.S.Federal ReserveBank,EIA&LabyrinthConsulting Services,Inc.
4-FoldIncreaseinO&GPPIBecauseof
UnconventionalOil&Gas2004-2014
BecauseofHigherCostofUnconventionalTechnology40%DecreaseAfterOil PriceCollapsebut7% Increasein2017
+7%
~40%DecreaseFrom
Deflation
EconomicsAreOptimisticFor2013&2014EagleFord
• Drillingandcompletioncostsbeforeaboutmid-2015wereconsiderablyhigher:$7-9mmperwell.• Economicsareoptimisticforthesewellsbecause$5.5mmwasusedinalleconomics.• Popularperceptionisthatlowerwellcostsareprimarilybecauseofimprovedtechnologyand
operatorefficiency.• Infact,about90%ofcostsavingsarebecauseofpricedeflationaftertheoil-pricecollapsein2014.• Mostwellperformanceimprovementsarebecauseofbettercompletionmethods.• Datasuggests,however,thatmuchofthisisrateaccelerationandnotreserveaddition.
Slide9LabyrinthConsultingServices,Inc. artberman.com
8.3
5.3
2.01.8
1.6 1.5 1.5 1.5 1.4 1.4 1.31.2 1.1 1.1 1.1 1.1 1.0 0.9 0.9
0.7 0.7 0.6
0
1
2
3
4
5
6
7
8
9
Parsley
Oasis
Hess
Sanchez
Callon
Energen
Concho
Whitin
g
Laredo
New
field
Statoil
Maratho
n
Apache
Pion
eer
EOG
Diamon
dback
Devon
Continental
Murph
y
OXY EPE
Cono
coPh
illips
RatioofC
apitalExpenditurestoCashFrom
Operations
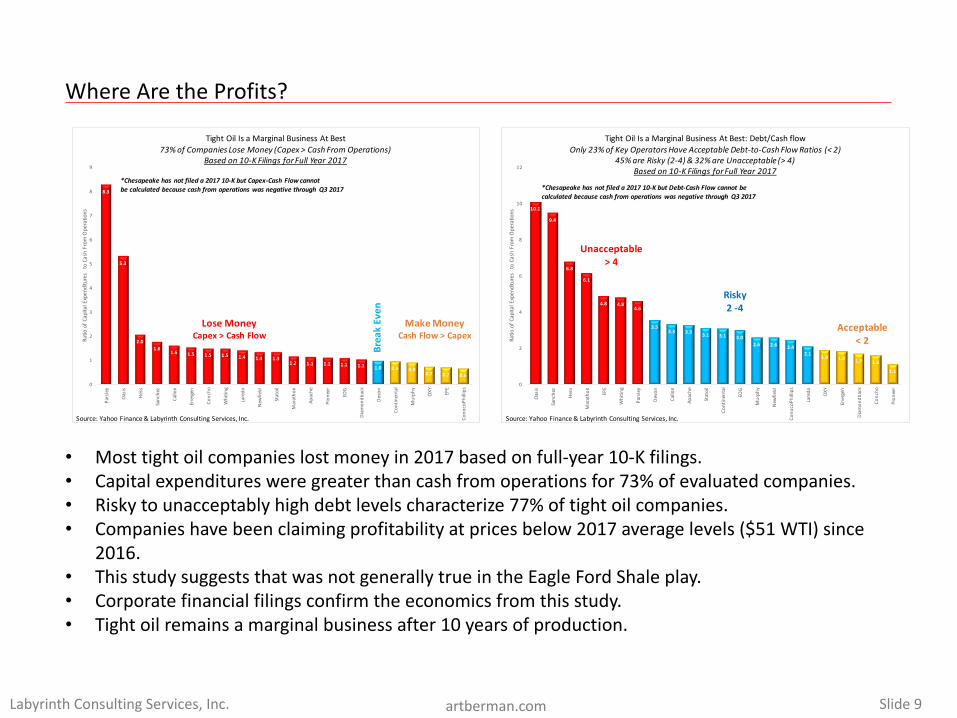
TightOilIsaMarginalBusinessAtBest73%ofCompaniesLoseMoney(Capex>CashFromOperations)
Basedon10-KFilingsforFullYear2017
MakeMoneyCashFlow>Capex
Lose MoneyCapex>CashFlow
Source:YahooFinance&LabyrinthConsultingServices,Inc.
BreakEven
*Chesapeake hasnotfileda201710-KbutCapex-CashFlowcannotbecalculatedbecausecashfromoperationswasnegativethrough Q32017
10.1
9.4
6.8
6.1
4.8 4.84.6
3.53.3 3.3 3.1 3.1 3.0
2.6 2.6 2.42.1 1.9 1.8 1.7 1.6
1.1
0
2
4
6
8
10
12
Oasis
Sanchez
Hess
Marathon
EPE
Whiting
Parsley
Devon
Callon
Apache
Statoil
Continental
EOG
Murphy
New
field
ConocoPhillips
Laredo
OXY
Energen
Diamondback
Concho
Pioneer
RatioofCapitalExpenditurestoCashFrom
Operations
TightOilIsaMarginalBusinessAtBest:Debt/CashflowOnly23%ofKeyOperatorsHaveAcceptableDebt-to-CashFlowRatios(<2)
45%areRisky(2-4)&32%areUnacceptable(>4)Basedon10-KFilingsforFullYear2017
Source:YahooFinance&LabyrinthConsultingServices,Inc.
Acceptable<2
Risky2-4
Unacceptable>4
*Chesapeake hasnotfileda201710-KbutDebt-CashFlowcannotbecalculatedbecausecashfromoperationswasnegativethrough Q32017
WhereAretheProfits?
• Mosttightoilcompanieslostmoneyin2017basedonfull-year10-Kfilings.• Capitalexpendituresweregreaterthancashfromoperationsfor73%ofevaluatedcompanies.• Riskytounacceptablyhighdebtlevelscharacterize77%oftightoilcompanies.• Companieshavebeenclaimingprofitabilityatpricesbelow2017averagelevels($51WTI)since
2016.• ThisstudysuggeststhatwasnotgenerallytrueintheEagleFordShaleplay.• Corporatefinancialfilingsconfirmtheeconomicsfromthisstudy.• Tightoilremainsamarginalbusinessafter10yearsofproduction.
Slide10LabyrinthConsultingServices,Inc. artberman.com
0
5,000
10,000
15,000
20,000
25,000
1 2 3 4 5 6 7 8 9 10 11 12 13 14 15 16 17 18 19 20 21 22 23 24 25 26 27 28 29 30 31 32 33 34 35 36 37 38 39 40 41 42 43 44 45 46 47 48 49 50
MonthlyOilP
roduction(barrels)
MonthsofProduction
ConocoPhillips 2017Wells EagleFordWellsHaveSteeperDeclineRateThanWells FromPrevious YearsDespiteHigherInitialProduction Levels
20132015 2014
2017
Source:Drilling Info&LabyrinthConsultingServices,Inc.
0
1,000
2,000
3,000
4,000
5,000
6,000
7,000
8,000
9,000
1 2 3 4 5 6 7 8 9 10 11 12 13 14 15 16 17 18 19 20 21 22 23 24 25 26 27 28 29 30 31 32 33 34 35 36 37 38 39 40 41 42 43 44 45 46 47 48 49 50
MonthlyOilProduction(barrels)
MonthsofProduction
Sanchez2016&2017EagleFordWellsHaveSteeperDeclineRatesThanWells FromPrevious Years
2016 20132015 20142017
Source:Drilling Info&LabyrinthConsultingServices,Inc.
0
5,000
10,000
15,000
20,000
25,000
30,000
35,000
40,000
1 2 3 4 5 6 7 8 9 10 11 12 13 14 15 16 17 18 19 20 21 22 23 24 25 26 27 28 29 30 31 32 33 34 35 36 37 38 39 40
MonthllyOilProduction(barrels)
MonthsofProduction
EOG2016&2017Wells EagleFordWellsHaveSteeperDeclineRateThanWells FromPreviousYearsDespiteHigherInitialProduction Levels
2013
20152014
2017
Source:Drilling Info&LabyrinthConsultingServices,Inc.
2016
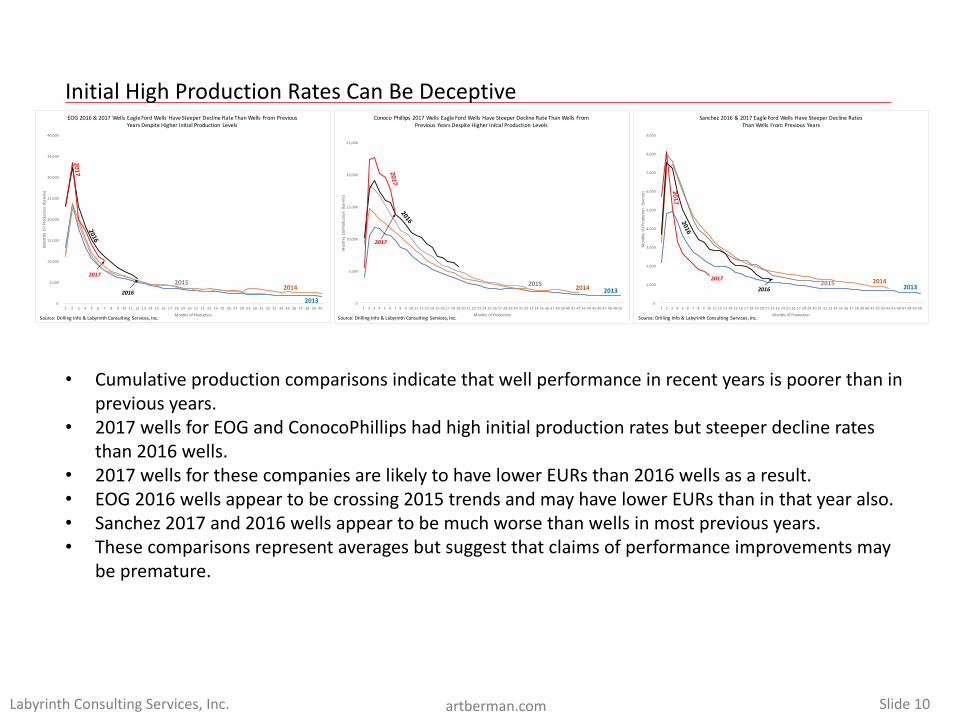
InitialHighProductionRatesCanBeDeceptive
• Cumulativeproductioncomparisonsindicatethatwellperformanceinrecentyearsispoorerthaninpreviousyears.
• 2017wellsforEOGandConocoPhillipshadhighinitialproductionratesbutsteeperdeclineratesthan2016wells.
• 2017wellsforthesecompaniesarelikelytohavelowerEURsthan2016wellsasaresult.• EOG2016wellsappeartobecrossing2015trendsandmayhavelowerEURsthaninthatyearalso.• Sanchez2017and2016wellsappeartobemuchworsethanwellsinmostpreviousyears.• Thesecomparisonsrepresentaveragesbutsuggestthatclaimsofperformanceimprovementsmay
bepremature.
Slide11LabyrinthConsultingServices,Inc. artberman.com
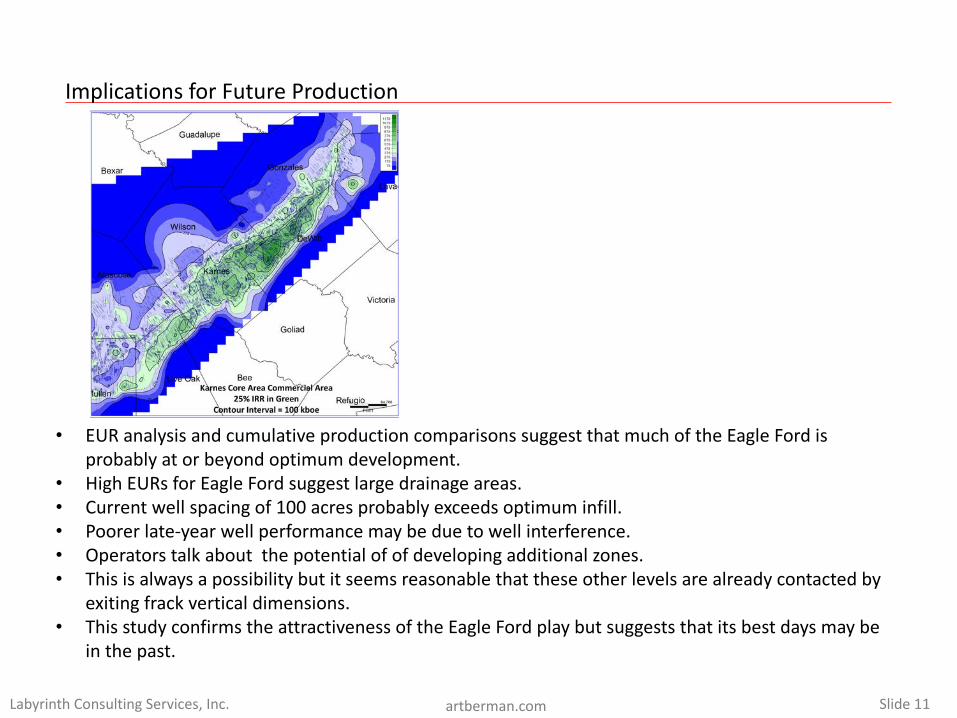
ImplicationsforFutureProduction
• EURanalysisandcumulativeproductioncomparisonssuggestthatmuchoftheEagleFordisprobablyatorbeyondoptimumdevelopment.
• HighEURsforEagleFordsuggestlargedrainageareas.• Currentwellspacingof100acresprobablyexceedsoptimuminfill.• Poorerlate-yearwellperformancemaybeduetowellinterference.• Operatorstalkaboutthepotentialofofdevelopingadditionalzones.• Thisisalwaysapossibilitybutitseemsreasonablethattheseotherlevelsarealreadycontactedby
exitingfrackverticaldimensions.• ThisstudyconfirmstheattractivenessoftheEagleFordplaybutsuggeststhatitsbestdaysmaybe
inthepast.
Slide12LabyrinthConsultingServices,Inc. artberman.com
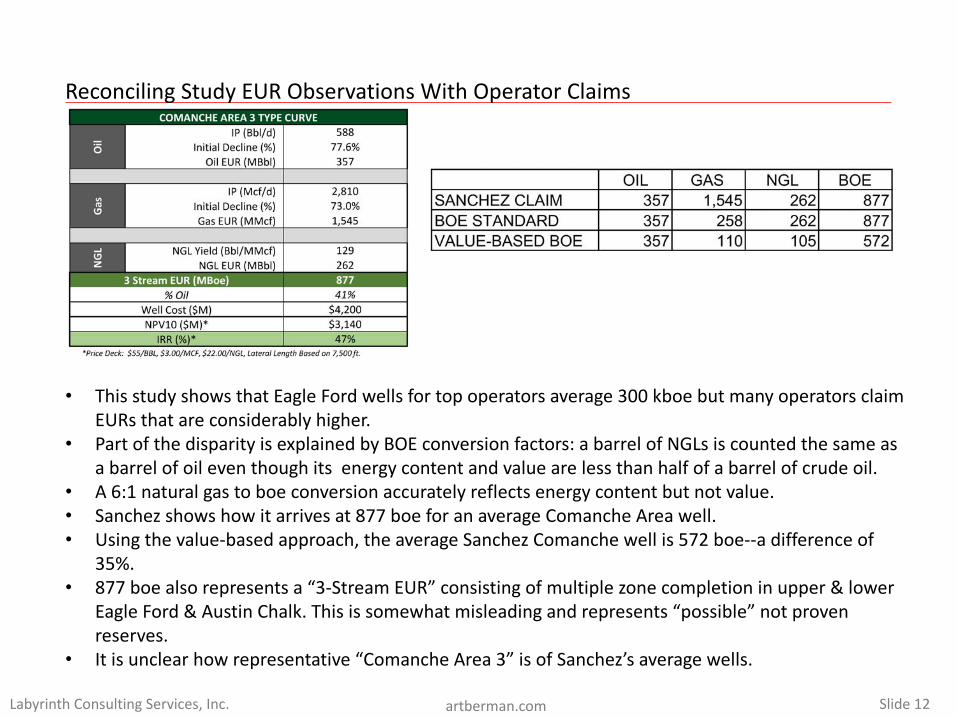
• ThisstudyshowsthatEagleFordwellsfortopoperatorsaverage300kboe butmanyoperatorsclaimEURsthatareconsiderablyhigher.
• PartofthedisparityisexplainedbyBOEconversionfactors:abarrelofNGLsiscountedthesameasabarrelofoileventhoughitsenergycontentandvaluearelessthanhalfofabarrelofcrudeoil.
• A6:1naturalgastoboe conversionaccuratelyreflectsenergycontentbutnotvalue.• Sanchezshowshowitarrivesat877boe foranaverageComancheAreawell.• Usingthevalue-basedapproach,theaverageSanchezComanchewellis572boe--adifferenceof
35%.• 877boe alsorepresentsa“3-StreamEUR”consistingofmultiplezonecompletioninupper&lower
EagleFord&AustinChalk.Thisissomewhatmisleadingandrepresents“possible”notprovenreserves.
• Itisunclearhowrepresentative“ComancheArea3”isofSanchez’saveragewells.
ReconcilingStudyEURObservationsWithOperatorClaims
Slide13LabyrinthConsultingServices,Inc. artberman.com
1177
1492
0
200
400
600
800
1000
1200
1400
1600
1800
(100)
-
100
200
300
400
500
Jan-14
Mar-14
May-14
Jul-1
4
Sep-14
Nov-14
Jan-15
Mar-15
May-15
Jul-1
5
Sep-15
Nov-15
Jan-16
Mar-16
May-16
Jul-1
6
Sep-16
Nov-16
Jan-17
Mar-17
May-17
Jul-1
7
Sep-17
Nov-17
Jan-18
DrilledUncom
peted(DUC)W
ells
WellsDrilled&Com
pletedPerM
onth
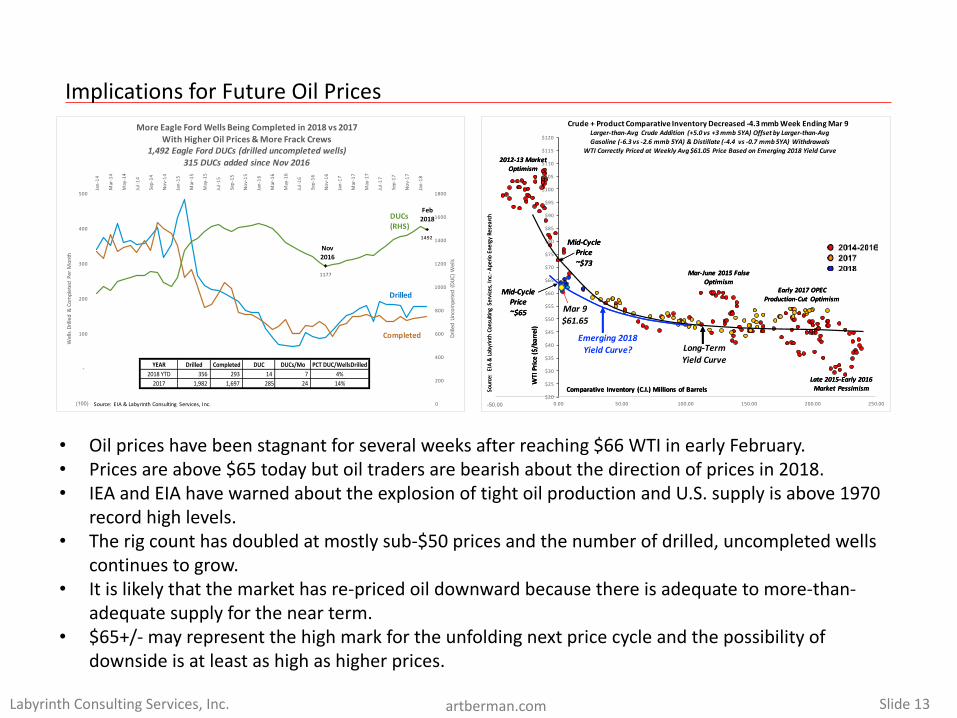
MoreEagleFordWellsBeingCompletedin2018vs2017WithHigherOilPrices&MoreFrackCrews
1,492EagleFordDUCs(drilleduncompletedwells)315DUCsaddedsinceNov2016
DUCs(RHS)
Drilled
Completed
Source:EIA&LabyrinthConsulting Services,Inc.
EAGLEFORD
YEAR Drilled Completed DUC DUCs/Mo PCTDUC/WellsDrilled2018YTD 356 293 14 7 4%2017 1,982 1,697 285 24 14%
Nov2016
Feb2018
$20
$25
$30
$35
$40
$45
$50
$55
$60
$65
$70
$75
$80
$85
$90
$95
$100
$105
$110
$115
$120
-50.00 0.00 50.00 100.00 150.00 200.00 250.00
Crude+ProductComparativeInventoryDecreased-4.3mmbWeekEndingMar9
Comparative Inventory (C.I.)Millionsof Barrels
WTIPrice($/barrel)
Source:EIA
&LabyrinthConsultingServices,Inc.-Aperio
EnergyResearch
Mar-June 2015FalseOptimism
Early 2017OPECProduction-Cut Optimism
2012-13MarketOptimism
Late2015-Early2016MarketPessimism
Mid-CyclePrice~$65
Mid-CyclePrice~$73
Long-TermYieldCurve
Emerging2018YieldCurve?
Comparative Inventory (C.I.)Millionsof Barrels
WTIPrice($/barrel)
Source:EIA
&LabyrinthConsultingServices,Inc.-Aperio
EnergyResearch
Mar-June 2015FalseOptimism
Early 2017OPECProduction-Cut Optimism
2012-13MarketOptimism
Late2015-Early2016MarketPessimism
Mid-CyclePrice~$65
Mid-CyclePrice~$73
Mar9$61.65
Larger-than-Avg CrudeAddition (+5.0vs+3mmb5YA)OffsetbyLarger-than-AvgGasoline(-6.3vs-2.6mmb5YA)&Distillate(-4.4vs-0.7mmb5YA)Withdrawals
WTICorrectly PricedatWeeklyAvg$61.05PriceBasedonEmerging2018YieldCurve
ImplicationsforFutureOilPrices
• Oilpriceshavebeenstagnantforseveralweeksafterreaching$66WTIinearlyFebruary.• Pricesareabove$65todaybutoiltradersarebearishaboutthedirectionofpricesin2018.• IEAandEIAhavewarnedabouttheexplosionoftightoilproductionandU.S.supplyisabove1970
recordhighlevels.• Therigcounthasdoubledatmostlysub-$50pricesandthenumberofdrilled,uncompletedwells
continuestogrow.• Itislikelythatthemarkethasre-pricedoildownwardbecausethereisadequatetomore-than-
adequatesupplyforthenearterm.• $65+/- mayrepresentthehighmarkfortheunfoldingnextpricecycleandthepossibilityof
downsideisatleastashighashigherprices.
Slide14LabyrinthConsultingServices,Inc. artberman.com
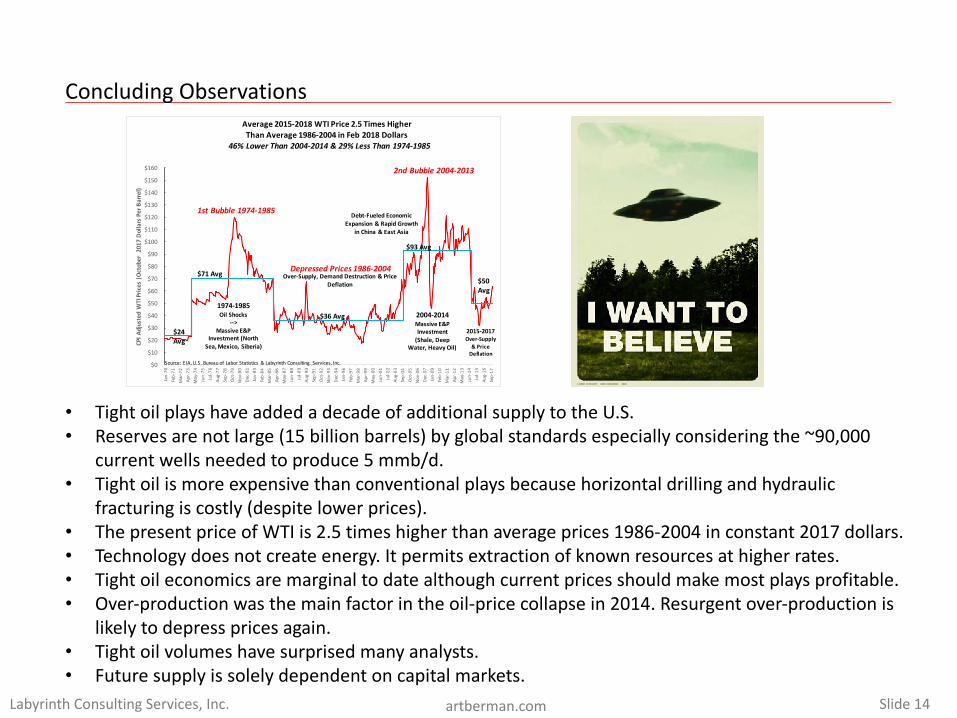
ConcludingObservations
• TightoilplayshaveaddedadecadeofadditionalsupplytotheU.S.• Reservesarenotlarge(15billionbarrels)byglobalstandardsespeciallyconsideringthe~90,000
currentwellsneededtoproduce5mmb/d.• Tightoilismoreexpensivethanconventionalplaysbecausehorizontaldrillingandhydraulic
fracturingiscostly(despitelowerprices).• ThepresentpriceofWTIis2.5timeshigherthanaverageprices1986-2004inconstant2017dollars.• Technologydoesnotcreateenergy.Itpermitsextractionofknownresourcesathigherrates.• Tightoileconomicsaremarginaltodatealthoughcurrentpricesshouldmakemostplaysprofitable.• Over-productionwasthemainfactorintheoil-pricecollapsein2014.Resurgentover-productionis
likelytodepresspricesagain.• Tightoilvolumeshavesurprisedmanyanalysts.• Futuresupplyissolelydependentoncapitalmarkets.
$0
$10
$20
$30
$40
$50
$60
$70
$80
$90
$100
$110
$120
$130
$140
$150
$160Jan-70
Feb-71
Mar-72
Apr-73
May-74
Jun-75
Jul-7
6 Au
g-77
Sep-78
Oct-79
Nov-80
Dec-81
Jan-83
Feb-84
Mar-85
Apr-86
May-87
Jun-88
Jul-8
9 Au
g-90
Sep-91
Oct-92
Nov-93
Dec-94
Jan-96
Feb-97
Mar-98
Apr-99
May-00
Jun-01
Jul-0
2 Au
g-03
Sep-04
Oct-05
Nov-06
Dec-07
Jan-09
Feb-10
Mar-11
Apr-12
May-13
Jun-14
Jul-1
5 Au
g-16
Sep-17
CPIAdjustedW
TIPrices(October2017DollarsPerBarrel)
1974-1985OilShocks
-->
Massive E&PInvestment(North
Sea,Mexico,Siberia)
Over-Supply, DemandDestruction&Price
Deflation
Debt-FueledEconomic
Expansion&RapidGrowth
inChina&EastAsia
2004-2014MassiveE&PInvestment
(Shale, DeepWater,HeavyOil)
2015-2017Over-Supply
&Price
Deflation
Average2015-2018WTIPrice2.5TimesHigher
ThanAverage1986-2004inFeb2018Dollars
Source:EIA, U.S.Bureau ofLaborStatistics &LabyrinthConsulting Services,Inc.
$36Avg
1stBubble 1974-1985
2ndBubble2004-2013
$93Avg
$71Avg
$24
Avg
$50
Avg
DepressedPrices 1986-2004
46%LowerThan2004-2014&29%LessThan1974-1985


