Embed Size (px)
Citation preview
THRESHOLD ACHIEVEMENT TESTFOR
INFORMATION LITERACY
Evaluating Process & AuthorityFall 2019 Evaluating Process & Authority Module
Texas A&M University-Corpus ChristiOctober 24, 2019
Copyright © 2019 Carrick Enterprises, Inc. All rights reserved.CarrickEnterprises.com

Threshold Achievement Test Information Literacy Assessment
Copyright © 2019 Carrick Enterprises, Inc. All rights reserved.
Table of ContentsSection 1: About the Test 1 .............................................................................................................. Section 2: About this Report 3 ......................................................................................................... Section 3: Summary of Results 7 .................................................................................................... Section 4: Overall Knowledge Results 10 ....................................................................................... Section 5: Individual Knowledge Outcome Results 13 ................................................................. Section 6: Individual Disposition Results 21 ................................................................................. Section 7: Targeted Reading Recommendations 31 ..................................................................... Appendix A. Student Profile 34 ........................................................................................................ Appendix B. Institutions 36 ..............................................................................................................

Copyright © 2019 Carrick Enterprises, Inc. All rights reserved.

Threshold Achievement Test Information Literacy Assessment
Copyright © 2019 Carrick Enterprises, Inc. All rights reserved. 1
Section 1: About the TestThe Threshold Achievement Test for Information Literacy is a tool for measuring student knowledge anddispositions regarding information literacy. The test is inspired by the Association of College andResearch Libraries' Framework for Information Literacy for Higher Education and by expectations set bythe nation's accrediting agencies. The Evaluating Process & Authority module focuses on the process ofinformation creation and the constructed and contextual nature of source authority. It tests students'ability to recall and apply their knowledge of evaluating sources and it tests their metacognition aboutcore information literacy dispositions that underlie their behaviors.
Information Literacy Knowledge
The knowledge items are based on information literacy outcomes and performance indicators created bythe test developers and advisory board of librarians and other educators. Items assess an array ofcognitive processes that college students develop as they transition from pre-college to college ready toresearch ready. The items are presented in a variety of structured response formats to assess students'information literacy knowledge, skills, and abilities ranging from understanding to critical thinking toproblem solving.
Figure 1.1 Knowledge Outcomes for Evaluating Process & Authority
Outcome 1.1 Apply knowledge of source creation processes and context to evaluate the authority of a source.
Outcome 1.2 Apply knowledge of authority to analyze others' claims and to support one's own claims
Information Literacy Dispositions
Dispositions play an important role in learning transfer, indicating students' willingness to consistentlyapply the skills they have learned in one setting to novel problems in new settings. The ACRL Frameworkhighlights dispositions, which constitute affective facets of information literacy, because they areessential to students' information literacy outcomes. Dispositions interact with a student's process ofdefining ill-structured information problems within a new environment so that the student can transferthis learning to new problems. Dispositions are latent traits that function at an unconscious level anddetermine whether or not a student can transfer learning and move beyond a superficial understandingof material.
Dispositions are at the heart of a student's temperament. While some dispositions can be seen as naturaltendencies, they may also be cultivated over time through intentionally-designed instruction and throughexposure to tacit expectations for student behavior.
Threshold Achievement Test Information Literacy Assessment
Copyright © 2019 Carrick Enterprises, Inc. All rights reserved. 2
To address dispositions in the test, we use scenario-based problem solving items. Students are presentedwith a scenario describing an ill-defined information literacy challenge related to the content of themodule. Following the scenario, students are presented with strategies for addressing the challenge.Students evaluate the usefulness of each strategy.
Information Literacy Dispositions for Evaluating Process & Authority
Students who can evaluate sources based on the processes used to create them are more likely tocritically examine the authority of information within a given context, rather than simply using a one-size-fits-all judgment of credibility. Since the credibility of a source is not absolute or stable, and varies, forexample, by discourse community, students must be (1) mindful about the processes used to create theinformation, (2) comfortable with the fact that the same sources may be considered authoritative in onecontext but not in another, and (3) responsible to their academic community in looking beneath surface-level markers of authority.
The test assesses how students understand and value authority, how they define their role in evaluatingsources, and how they perceive the relative value of different types of sources for common academicneeds.
Figure 1.2 Dispositions for Evaluating Process & Authority
Disposition 1.1 Mindful self-reflection
Disposition 1.2 Toleration of ambiguity
Disposition 1.3 Responsibility to community

Threshold Achievement Test Information Literacy Assessment
Copyright © 2019 Carrick Enterprises, Inc. All rights reserved. 3
Section 2: About this ReportThe report that follows is designed to help educators identify areas of strength and areas that needimprovement in their students' ability to evaluate the process used to create information and thecontext-specific criteria that give sources their authority. The report will support evidence-baseddecision-making and inform actions for strengthening student outcomes.
How the Report is Organized
The report presents overall and detailed results for your students. The high-level summary of results onboth the knowledge and disposition dimensions for students at your institution is provided in Section 3,along with cross-institutional comparisons. Your local results are compared to other institutions in orderto give an indication of how your students performed relative to other students who may have similarexposure to information literacy instruction.
Sections 4 and 5 offer details about knowledge performance. Section 4 shows the overall mean score forall students and subgroup breakouts for the standard questions you selected and your custom questions.Section 4 also gives cross-institutional comparisons.
Section 5 provides more detail on the knowledge results by presenting data on each knowledge outcome,along with breakouts and cross-institutional comparisons. Section 5 also explores the performanceindicators that make up each knowledge outcome by listing performance indicator rankings that identifyyour students' relative strengths and weaknesses.
Section 6 presents details about dispositional performance. Your disposition results are presented withlevel descriptions that align with your students' mean scores.
Section 7 offers suggestions for targeted readings that can assist you in following up on these results.
Knowledge Performance Levels
Three performance levels are used to describe student achievement on the knowledge section of thetest. Students are assigned to one of the levels based on their mean score on the knowledge items.Levels are shown in Sections 4 and 5 and indicated by color.
Conditionally ready. Students who are conditionally ready define authorities as people who havegained expertise through relevant experiences. They are able to use familiar types of information butwithout consideration for how they were created. They are able to evaluate a source based on how easilythey can incorporate it into their own knowledge base and research paper. Conditionally ready studentsaccept information that they have used before and rely on sources that are easy to understand ratherthan sources created through a rigorous process of review and editing. The conditionally ready color inthe charts is yellow.
College ready. Students who are college ready are able to select sources based on the idea thatauthority is more than simply having relevant experiences because it includes considerations like theauthor's field of study. They are able to define basic differences among sources when they are told aboutthe process that was used to create them and they have an intuitive understanding of how sources fitinto the information cycle. Based on their understanding of generic processes of information creation and

Threshold Achievement Test Information Literacy Assessment
Copyright © 2019 Carrick Enterprises, Inc. All rights reserved. 4
of the information cycle, they are able to make basic distinctions among the information sources they areevaluating in order to select the more authoritative and the more appropriate source for their informationneed. College ready students are prepared to follow clear and detailed assignment instructions aboutwhat types of information they are expected to use for their college papers or projects. The college readycolor in the charts is green.
Research ready. Students who are research ready are able to determine if a source will strengthentheir own authority by considering markers of the author's authority (e.g., credentials and priorpublications) within the context of the student's own field and audience. They are able to judge how wella source is likely to satisfy their information need by identifying indicators of the process used to createthat source (e.g., quoted sources, methods, citations). They know that standards for authority are sociallyconstructed by people who share a set of scholarly or professional values and apply that knowledge toselect information sources that are appropriate for the social context within which they will use thesources. They are confident enough in their own judgments about authority to selectively use sourcesthat are not scholarly when the research literature is silent on the experience or topic they are studying.Research ready students are prepared to strategically employ sources as part of strengthening their ownauthority. The research ready color in the charts is blue.
Disposition Levels
Students who are weakly-disposed toward the dispositions in this module are unlikely to spontaneouslydemonstrate these traits without guided instruction and scaffolding to support their development. Theymay demonstrate strong dispositions in other areas not associated with information literacy, but theseare not covered by this test. The weakly-disposed color in the charts is orange.
Students who are moderately-disposed toward the traits assessed by this test are more easily guided toapply them but may not consistently demonstrate these strengths when they are faced with newchallenges. They may experience strain when there is a conflict between their information literacydispositions and other strong dispositions. The moderately-disposed color in the charts is pink.
Students with strong dispositions toward the values and behaviors associated with information literacyare most likely to consistently react to new situations by drawing upon these underlying traits. Thestrongly-disposed color in the charts is blue.
Mean Scores and Standard Errors
Scoring on the knowledge portion is based on a partial credit model and on difficulty level. Students canachieve full, partial, or no credit on an item. Imagine a test item that has 4 possible answers, A, B, C, andD, with A and B being the correct responses. To achieve full credit, a student must select A and B andmust not select C or D. A student who chooses A and B and C will receive less credit than someone whochooses just A and B.
The score a student achieves on an item is based on the difficulty of receiving a particular amount ofcredit for that item. Difficulties are calibrated based on a database of student scores from allparticipating institutions. Items have different levels of difficulty and therefore different maximum scores.Scores are presented on a 1,000-point scale, where a perfect score is 1,000.
A student's overall score is the mean of their item scores. The overall score for a group or institution is

Threshold Achievement Test Information Literacy Assessment
Copyright © 2019 Carrick Enterprises, Inc. All rights reserved. 5
the mean of the students' scores.
The standard error indicates the likely range of scores if the test were given again to the same students.For example, a mean score of 500 ±10 for freshmen indicates that the true score for freshmen fallsbetween 490 and 510. To determine if mean scores of groups are meaningfully different, it is importantto take the standard error into account. For example, if the mean score for sophomores is 505 ±10, thenit is accurate to say that the freshmen and sophomores who were tested did not score differently. Samplesize effects the standard error. An increase in sample size can result in a smaller standard error.
Note that a subgroup must consist of at least three students in order for a score to be generated. We donot recommend making results for subgroups public if they include fewer than 10 students because ofconcerns about identifiability and privacy.
Scoring for disposition items is based on a student's judgments regarding strategies. Students earn highscores on these items if they judge behaviors associated with the disposition to be useful and behaviorsnot associated with the disposition to be not useful. A student's score for a disposition is the sum of thepoints they score on each of the strategies. Scores with their standard errors are presented on a 100-point scale.
Performance Bars, Histograms, and Pie Charts
Performance bars display where the mean score, shown in orange,for a group or subgroup falls within the three performance levels. The standard error associated with themean is shown in black. Each performance level has a different background color: Conditionally ready isyellow, college ready is green, and research ready is blue.
Histograms are used to visually represent the relative distributionof scores in a group or subgroup. These graphs allow you to havean overall sense of how the scores fall around the mean.
Pie charts in the knowledge sections show the number andpercentage of students who scored in each of the threeperformance levels for a group or subgroup. Each performancelevel has a different background color: Conditionally ready isyellow, college ready is green, and research ready is blue.
Pie charts in the disposition section show the number andpercentage of students who scored in each of the three dispositionlevels for a group or subgroup. Each disposition level has a differentbackground color: Weakly-disposed is orange, moderately-disposedis pink, and strongly-disposed is blue.
Associated Files
In addition to this report, the following files are included in your zip file:
1. Test Item document. A PDF document with a description of each test item.2. Raw data file. Contains all of the scores presented in this report.

Threshold Achievement Test Information Literacy Assessment
Copyright © 2019 Carrick Enterprises, Inc. All rights reserved. 6
3. Student data file. Contains scores for each of your students.4. Student data codebook. Describes the demographic options that you configured for your test.5. Student Report zip file. Contains a directory of PDF documents with an analysis of each student's
performance.

Threshold Achievement Test Information Literacy Assessment
Copyright © 2019 Carrick Enterprises, Inc. All rights reserved. 7
Section 3: Summary of ResultsThis section provides an overview of how your students performed on the Threshold Achievement Testfor Information Literacy: Evaluating Process & Authority. For detailed knowledge results organized bysubgroups, including standard and custom questions, refer to Section 4 and Section 5. For detaileddisposition results, refer to Section 6. For additional analysis, you may wish to collaborate with yourinstitution's research office. Consultants are also available through Carrick Enterprises.
Knowledge Results
Students who attain knowledge of information literacy concepts and practices are well-positioned toeffectively address their information needs and contribute meaningfully to the information ecosystem.The knowledge dimension measured by this module specifically addresses students' ability to apply theirknowledge of source context and creation processes to judging source authority, analyzing claims, andsupporting their own claims.
Figure 3.1 shows the average score for your students and the averages for institutional groups. Theaverage score for your students, 471, falls within the performance level of college ready. The bluehistograms show how scores were distributed.
Figure 3.1 Knowledge Results
Your Institution 471 ±12
Your Peer Institutions 487 ±10
Your Institution Types 491 ±5
All Institutions 475 ±2
Threshold Achievement Test Information Literacy Assessment
Copyright © 2019 Carrick Enterprises, Inc. All rights reserved. 8
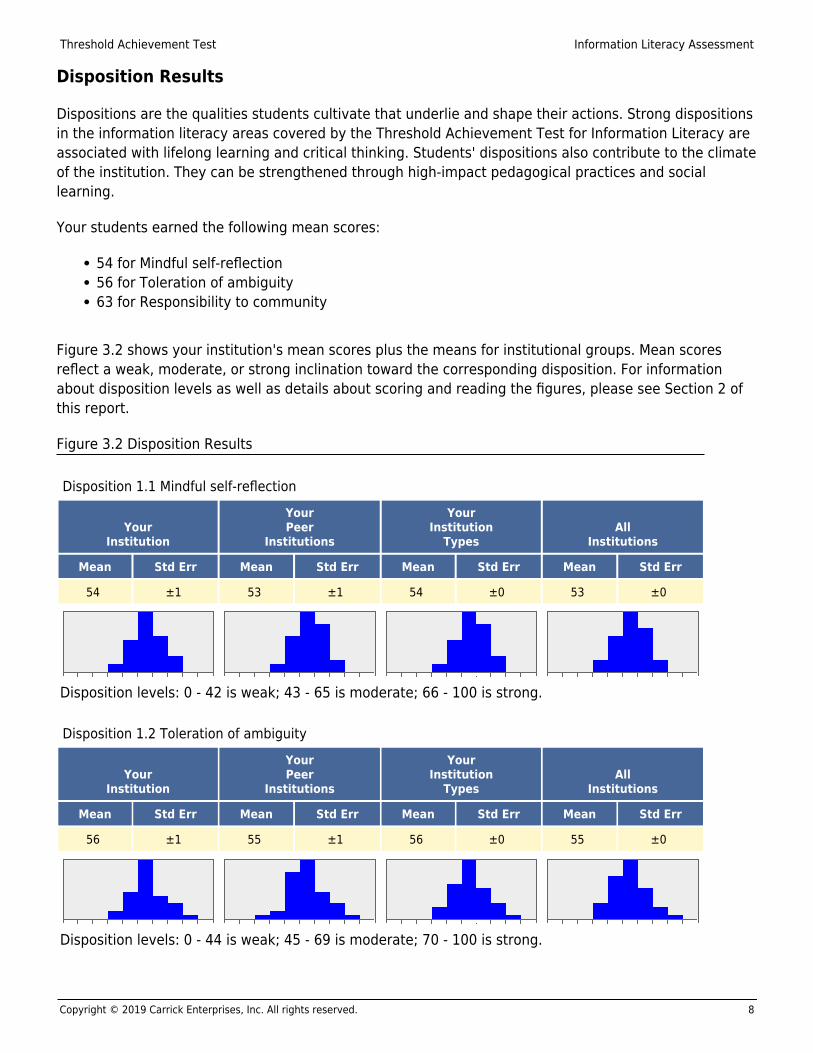
Disposition Results
Dispositions are the qualities students cultivate that underlie and shape their actions. Strong dispositionsin the information literacy areas covered by the Threshold Achievement Test for Information Literacy areassociated with lifelong learning and critical thinking. Students' dispositions also contribute to the climateof the institution. They can be strengthened through high-impact pedagogical practices and sociallearning.
Your students earned the following mean scores:
54 for Mindful self-reflection56 for Toleration of ambiguity63 for Responsibility to community
Figure 3.2 shows your institution's mean scores plus the means for institutional groups. Mean scoresreflect a weak, moderate, or strong inclination toward the corresponding disposition. For informationabout disposition levels as well as details about scoring and reading the figures, please see Section 2 ofthis report.
Figure 3.2 Disposition Results
Disposition 1.1 Mindful self-reflection
YourInstitution
YourPeer
Institutions
YourInstitution
TypesAll
Institutions
Mean Std Err Mean Std Err Mean Std Err Mean Std Err
54 ±1 53 ±1 54 ±0 53 ±0
Disposition levels: 0 - 42 is weak; 43 - 65 is moderate; 66 - 100 is strong.
Disposition 1.2 Toleration of ambiguity
YourInstitution
YourPeer
Institutions
YourInstitution
TypesAll
Institutions
Mean Std Err Mean Std Err Mean Std Err Mean Std Err
56 ±1 55 ±1 56 ±0 55 ±0
Disposition levels: 0 - 44 is weak; 45 - 69 is moderate; 70 - 100 is strong.

Threshold Achievement Test Information Literacy Assessment
Copyright © 2019 Carrick Enterprises, Inc. All rights reserved. 9
Disposition 1.3 Responsibility to community
YourInstitution
YourPeer
Institutions
YourInstitution
TypesAll
Institutions
Mean Std Err Mean Std Err Mean Std Err Mean Std Err
63 ±1 67 ±1 66 ±0 64 ±0
Disposition levels: 0 - 52 is weak; 53 - 79 is moderate; 80 - 100 is strong.

Threshold Achievement Test Information Literacy Assessment
Copyright © 2019 Carrick Enterprises, Inc. All rights reserved. 10
Section 4: Overall Knowledge ResultsYour students answered 24 knowledge items in the Evaluating Process & Authority module. Theknowledge items are based on the outcomes listed in Figure 1.1. Figure 4.1 shows the mean score andstandard error for your students.
The number and percentage of students in the three performance levels is displayed in thecorresponding pie chart, with the legend underneath. Also shown are your selected peer institutions, yourselected institution types, and all institutions. See Section 2 for descriptions of performance levels.Students are assigned to performance levels based on their mean scores as follows:
Score of 1-313: conditionally ready (in yellow)Score of 314-874: college ready (in green)Over 874: research ready (in blue)
Figure 4.2 presents mean scores and standard errors for breakouts based on the standard questions youselected and your custom questions.
'n/a' is used when there is no score for the group. A subgroup must consist of at least three students inorder for a score to be generated.
Figure 4.1 Knowledge Results
YourInstitution
YourPeer
Institutions
YourInstitution
TypesAll
Institutions
Mean Std Err Mean Std Err Mean Std Err Mean Std Err
471 ±12 487 ±10 491 ±5 475 ±2
11 9%
111 91%
0 0%
14 9%
142 91%
0 0%
96 9%
840 78%
137 13%
742 12%
5,110 82%
372 6%

Threshold Achievement Test Information Literacy Assessment
Copyright © 2019 Carrick Enterprises, Inc. All rights reserved. 11
Figure 4.2 Subgroup Knowledge Results
Your
Institution
YourPeer
Institutions
YourInstitution
TypesAll
Institutions
Subgroups MeanStdErr Mean
StdErr Mean
StdErr Mean
StdErr
CLASS STANDING
Freshman 465 ±16 477 ±24 562 ±39 468 ±5
Senior 478 ±16 530 ±33 540 ±15 481 ±7
TRANSFER STUDENTS
No, I am not a transfer student 456 ±13 469 ±17 526 ±12 466 ±4
Yes, as Freshman student 546 ±51 469 ±60 n/a 440 ±17
Yes, as Senior student 490 ±29 n/a n/a 488 ±17
MAJORS
Accounting 373 ±74 n/a 509 ±35 442 ±11
Applied Leadership 435 ±36 431 ±52 532 ±45 448 ±12
Art 515 ±25 484 ±21 489 ±55 497 ±11
Athletic Training n/a 452 ±21 401 ±44 447 ±6
Athmospheric Sciences n/a n/a 572 ±23 519 ±15
Biology 480 ±55 612 ±64 677 ±57 522 ±14
Biomedical Sciences 503 ±60 612 ±64 677 ±57 522 ±14
Chemistry n/a n/a 572 ±23 519 ±15
Childhood Development n/a 419 ±41 507 ±55 482 ±14
Clinical Laboratory Science n/a 452 ±21 401 ±44 447 ±6
Communication n/a 394 ±47 n/a 450 ±14
Community & Mental Health n/a n/a n/a 425 ±18
Computer Science 466 ±68 468 ±37 527 ±15 520 ±15
Criminal Justice 372 ±65 n/a n/a 426 ±39
Economics n/a n/a 509 ±35 442 ±11
Education 442 ±5 419 ±41 507 ±55 482 ±14
Electrical Engineering n/a 539 ±86 558 ±16 547 ±14
English n/a 425 ±65 n/a 543 ±18
Environmental Science 467 ±83 n/a 572 ±23 519 ±15
Env Occ Safety & Emer Response n/a n/a n/a n/a
Finance n/a n/a 509 ±35 442 ±11
General Business 365 ±32 n/a 509 ±35 442 ±11

Threshold Achievement Test Information Literacy Assessment
Copyright © 2019 Carrick Enterprises, Inc. All rights reserved. 12
Geographic Information Science n/a n/a n/a 432 ±41
Geology n/a n/a 572 ±23 519 ±15
Graphic Design n/a 484 ±21 489 ±55 497 ±11
Health Science n/a 452 ±21 401 ±44 447 ±6
History n/a 616 ±12 n/a 535 ±22
Industrial Electronics/Manufac n/a n/a n/a 432 ±41
Information Technology n/a 468 ±37 527 ±15 520 ±15
Kinesiology 534 ±32 n/a n/a 534 ±32
Legal Studies n/a n/a n/a 700 ±79
Management 486 ±26 n/a 509 ±35 442 ±11
Management Information Systems n/a n/a 509 ±35 442 ±11
Marketing 423 ±21 n/a 509 ±35 442 ±11
Mathematics n/a n/a n/a 493 ±45
Mechanical Engineering 545 ±47 539 ±86 558 ±16 547 ±14
Media Arts n/a 484 ±21 489 ±55 497 ±11
Music n/a 484 ±21 489 ±55 497 ±11
Nursing 433 ±20 452 ±21 401 ±44 447 ±6
Philosophy n/a n/a n/a n/a
Physics n/a n/a 572 ±23 519 ±15
Political Science n/a 589 ±43 543 ±29 499 ±18
Psychology 464 ±28 519 ±29 545 ±20 518 ±9
Sociology 422 ±96 589 ±43 543 ±29 499 ±18
Spanish n/a n/a n/a 583 ±103
Technical Communication/Digita n/a n/a n/a n/a
Theatre n/a 484 ±21 489 ±55 497 ±11
Undeclared 496 ±34 n/a 542 ±44 456 ±18
University Studies n/a 431 ±52 532 ±45 448 ±12

Threshold Achievement Test Information Literacy Assessment
Copyright © 2019 Carrick Enterprises, Inc. All rights reserved. 13
Section 5: Individual Knowledge Outcome ResultsThis section provides details for the individual knowledge outcomes in this module. Under each outcome,the first figure presents the mean score and standard error for your students. The number andpercentage of students in the three performance levels is displayed in the corresponding pie chart, withthe legend underneath. Also shown are your selected peer institutions, your selected institution types,and all institutions. See Section 2 for descriptions of performance levels. Students are assigned toperformance levels based on their mean scores as follows:
Outcome 1.1 Outcome 1.2Score of 1-270: conditionally ready (in yellow) Score of 1-374: conditionally ready (in yellow)Score of 271-809: college ready (in green) Score of 375-956: college ready (in green)Over 809: research ready (in blue) Over 956: research ready (in blue)
The second figure shows mean scores and standard errors for breakouts based on the standard questionsyou selected and your custom questions.
The third figure is a listing of the performance indicators for each outcome ranked by your students'overall performance from the strongest to the weakest. The ranking is a relative ordering and does notindicate how well your students performed on a particular performance indicator. Through the use ofcolor bars, these figures also compare your students' performance with your peer institutions on eachperformance indicator. A blue bar indicates that your students' mean score is higher than or equal to themean score of your peer institutions. A red bar indicates that your students' mean score is lower than themean score of your peer institutions.
Outcome 1.1: Apply knowledge of source creation processes and context toevaluate the authority of a source.

Threshold Achievement Test Information Literacy Assessment
Copyright © 2019 Carrick Enterprises, Inc. All rights reserved. 14
Figure 5.1 Overall Results
YourInstitution
YourPeer
Institutions
YourInstitution
TypesAll
Institutions
Mean Std Err Mean Std Err Mean Std Err Mean Std Err
476 ±12 493 ±11 483 ±5 466 ±2
8 7%
113 93%
1 1%
11 7%
145 93%
0 0%
72 7%
746 70%
255 24%
538 9%
4,976 80%
710 11%
Figure 5.2 Subgroup Results
Your
Institution
YourPeer
Institutions
YourInstitution
TypesAll
Institutions
Subgroups MeanStdErr Mean
StdErr Mean
StdErr Mean
StdErr
CLASS STANDING
Freshman 473 ±18 470 ±27 538 ±42 459 ±5
Senior 479 ±17 534 ±36 537 ±15 478 ±7
TRANSFER STUDENTS
No, I am not a transfer student 461 ±15 474 ±19 519 ±13 460 ±4
Yes, as Freshman student 565 ±37 483 ±72 n/a 424 ±18
Yes, as Senior student 491 ±33 n/a n/a 485 ±20
MAJORS
Accounting 378 ±39 n/a 501 ±37 438 ±11
Applied Leadership 434 ±51 444 ±52 513 ±41 438 ±13
Art 452 ±60 546 ±28 482 ±61 479 ±12
Athletic Training n/a 446 ±22 469 ±73 438 ±7
Athmospheric Sciences n/a n/a 574 ±27 514 ±17
Biology 489 ±54 639 ±73 658 ±44 532 ±15
Biomedical Sciences 530 ±65 639 ±73 658 ±44 532 ±15

Threshold Achievement Test Information Literacy Assessment
Copyright © 2019 Carrick Enterprises, Inc. All rights reserved. 15
Chemistry n/a n/a 574 ±27 514 ±17
Childhood Development n/a 424 ±39 542 ±60 476 ±15
Clinical Laboratory Science n/a 446 ±22 469 ±73 438 ±7
Communication n/a 410 ±55 n/a 461 ±15
Community & Mental Health n/a n/a n/a 435 ±23
Computer Science 453 ±81 480 ±45 530 ±18 524 ±17
Criminal Justice 390 ±103 n/a n/a 445 ±41
Economics n/a n/a 501 ±37 438 ±11
Education 444 ±25 424 ±39 542 ±60 476 ±15
Electrical Engineering n/a 544 ±84 566 ±17 552 ±15
English n/a 424 ±77 n/a 532 ±21
Environmental Science 489 ±85 n/a 574 ±27 514 ±17
Env Occ Safety & Emer Response n/a n/a n/a n/a
Finance n/a n/a 501 ±37 438 ±11
General Business 384 ±11 n/a 501 ±37 438 ±11
Geographic Information Science n/a n/a n/a 411 ±38
Geology n/a n/a 574 ±27 514 ±17
Graphic Design n/a 546 ±28 482 ±61 479 ±12
Health Science n/a 446 ±22 469 ±73 438 ±7
History n/a 587 ±16 n/a 541 ±24
Industrial Electronics/Manufac n/a n/a n/a 411 ±38
Information Technology n/a 480 ±45 530 ±18 524 ±17
Kinesiology 475 ±31 n/a n/a 475 ±31
Legal Studies n/a n/a n/a 742 ±100
Management 473 ±7 n/a 501 ±37 438 ±11
Management Information Systems n/a n/a 501 ±37 438 ±11
Marketing 419 ±49 n/a 501 ±37 438 ±11
Mathematics n/a n/a n/a 518 ±65
Mechanical Engineering 562 ±41 544 ±84 566 ±17 552 ±15
Media Arts n/a 546 ±28 482 ±61 479 ±12
Music n/a 546 ±28 482 ±61 479 ±12
Nursing 428 ±21 446 ±22 469 ±73 438 ±7
Philosophy n/a n/a n/a n/a
Physics n/a n/a 574 ±27 514 ±17

Threshold Achievement Test Information Literacy Assessment
Copyright © 2019 Carrick Enterprises, Inc. All rights reserved. 16
Political Science n/a 570 ±47 536 ±33 503 ±18
Psychology 502 ±37 526 ±32 538 ±19 516 ±9
Sociology 455 ±127 570 ±47 536 ±33 503 ±18
Spanish n/a n/a n/a 659 ±65
Technical Communication/Digita n/a n/a n/a n/a
Theatre n/a 546 ±28 482 ±61 479 ±12
Undeclared 553 ±88 n/a 501 ±56 456 ±19
University Studies n/a 444 ±52 513 ±41 438 ±13
Figure 5.3 Performance Indicators Ranked
Performance indicators are ranked by your students' overall performance from strongest to weakest.The ranking is a relative ordering and does not indicate how well your students performed on aparticular performance indicator. A blue bar indicates that your students' mean score is higher than orequal to the mean score of your peer institutions. A red bar indicates that your students' mean score islower than the mean score of your peer institutions.
Identify types of scholarly products and communication modes that fall outside of the typicalpublication processes but are still worthy of use (e.g., conference presentations, contributedpapers, discussions on association websites). (1.1.8)Match the elements of a source record to what they reveal about the process used to createthe source (e.g., publisher name, authors' names, date, subject terms, source type). (1.1.3)Arrange a sample set of sources into their appropriate positions on the information cycle.(1.1.5)Identify the audience for whom a source was created. (1.1.7)Identify relevant questions to ask about sources' origins and context when considering themas support for a claim. (1.1.9)Identify factors that would compromise the authority of the peer review process. (1.1.10)Match a description of a creation process to the source type it describes. (1.1.1)Match an information need to the most authoritative source types (e.g., news agency,government website, scholarly article) for fulfilling that need. (1.1.6)Match a description of a review process, such as editorial and peer review, to the source typeit describes. (1.1.4)Match the source type with the amount of time it usually takes to publish it. (1.1.2)Match descriptions of popular, polemic, and primary documents to scenarios where it wouldbe appropriate to use them. (1.1.11)Recognize that information is created to serve varying interests of information consumers.(1.1.12)

Threshold Achievement Test Information Literacy Assessment
Copyright © 2019 Carrick Enterprises, Inc. All rights reserved. 17
Outcome 1.2: Apply knowledge of authority to analyze others' claims and tosupport one's own claims
Figure 5.4 Overall Results
YourInstitution
YourPeer
Institutions
YourInstitution
TypesAll
Institutions
Mean Std Err Mean Std Err Mean Std Err Mean Std Err
465 ±15 479 ±13 501 ±5 486 ±2
37 30%
85 70%
0 0%
43 28%
113 72%
0 0%
248 23%
752 70%
73 7%
1,694 27%
4,312 69%
218 4%
Figure 5.5 Subgroup Results
Your
Institution
YourPeer
Institutions
YourInstitution
TypesAll
Institutions
Subgroups MeanStdErr Mean
StdErr Mean
StdErr Mean
StdErr
CLASS STANDING
Freshman 454 ±20 485 ±28 592 ±41 481 ±6
Senior 476 ±22 523 ±40 544 ±17 486 ±8
TRANSFER STUDENTS
No, I am not a transfer student 448 ±17 463 ±22 534 ±15 473 ±5
Yes, as Freshman student 520 ±80 451 ±57 n/a 460 ±19
Yes, as Senior student 488 ±36 n/a n/a 491 ±23
MAJORS
Accounting 366 ±120 n/a 518 ±43 449 ±14
Applied Leadership 435 ±65 414 ±65 556 ±56 461 ±15
Art 594 ±18 405 ±13 497 ±56 519 ±16
Athletic Training n/a 460 ±29 316 ±40 458 ±8

Threshold Achievement Test Information Literacy Assessment
Copyright © 2019 Carrick Enterprises, Inc. All rights reserved. 18
Athmospheric Sciences n/a n/a 571 ±30 526 ±19
Biology 467 ±80 576 ±55 702 ±77 509 ±17
Biomedical Sciences 470 ±72 576 ±55 702 ±77 509 ±17
Chemistry n/a n/a 571 ±30 526 ±19
Childhood Development n/a 412 ±61 463 ±60 492 ±16
Clinical Laboratory Science n/a 460 ±29 316 ±40 458 ±8
Communication n/a 372 ±42 n/a 435 ±17
Community & Mental Health n/a n/a n/a 411 ±24
Computer Science 482 ±56 452 ±44 523 ±17 515 ±15
Criminal Justice 350 ±66 n/a n/a 402 ±48
Economics n/a n/a 518 ±43 449 ±14
Education 439 ±38 412 ±61 463 ±60 492 ±16
Electrical Engineering n/a 530 ±96 548 ±20 541 ±18
English n/a 424 ±78 n/a 559 ±20
Environmental Science 438 ±81 n/a 571 ±30 526 ±19
Env Occ Safety & Emer Response n/a n/a n/a n/a
Finance n/a n/a 518 ±43 449 ±14
General Business 340 ±66 n/a 518 ±43 449 ±14
Geographic Information Science n/a n/a n/a 461 ±54
Geology n/a n/a 571 ±30 526 ±19
Graphic Design n/a 405 ±13 497 ±56 519 ±16
Health Science n/a 460 ±29 316 ±40 458 ±8
History n/a 653 ±23 n/a 528 ±26
Industrial Electronics/Manufac n/a n/a n/a 461 ±54
Information Technology n/a 452 ±44 523 ±17 515 ±15
Kinesiology 607 ±45 n/a n/a 607 ±45
Legal Studies n/a n/a n/a 647 ±59
Management 502 ±57 n/a 518 ±43 449 ±14
Management Information Systems n/a n/a 518 ±43 449 ±14
Marketing 425 ±14 n/a 518 ±43 449 ±14
Mathematics n/a n/a n/a 461 ±32
Mechanical Engineering 522 ±62 530 ±96 548 ±20 541 ±18
Media Arts n/a 405 ±13 497 ±56 519 ±16
Music n/a 405 ±13 497 ±56 519 ±16

Threshold Achievement Test Information Literacy Assessment
Copyright © 2019 Carrick Enterprises, Inc. All rights reserved. 19
Nursing 437 ±31 460 ±29 316 ±40 458 ±8
Philosophy n/a n/a n/a n/a
Physics n/a n/a 571 ±30 526 ±19
Political Science n/a 613 ±73 552 ±34 495 ±24
Psychology 416 ±37 509 ±36 554 ±27 521 ±12
Sociology 380 ±58 613 ±73 552 ±34 495 ±24
Spanish n/a n/a n/a 482 ±157
Technical Communication/Digita n/a n/a n/a n/a
Theatre n/a 405 ±13 497 ±56 519 ±16
Undeclared 423 ±43 n/a 594 ±47 457 ±22
University Studies n/a 414 ±65 556 ±56 461 ±15

Threshold Achievement Test Information Literacy Assessment
Copyright © 2019 Carrick Enterprises, Inc. All rights reserved. 20
Figure 5.6 Performance Indicators Ranked
Performance indicators are ranked by your students' overall performance from strongest to weakest.The ranking is a relative ordering and does not indicate how well your students performed on aparticular performance indicator. A blue bar indicates that your students' mean score is higher than orequal to the mean score of your peer institutions. A red bar indicates that your students' mean score islower than the mean score of your peer institutions.
Evaluate the effectiveness of an author's use of different source types (e.g., news, researcharticles, blogs) to support arguments. (1.2.10)Identify relevant questions to ask about the suitability of a source when considering it assupport for a claim. (1.2.6)Determine the reason why a quote is used in a given passage (e.g., show significance, giveauthoritative support, provide context, emphasize, summarize). (1.2.11)Distinguish the key works cited in a passage from the peripheral works. (1.2.12)Recognize that expertise is contextual and positional (e.g., credentials alone are not a per seindicator of author's expertise). (1.2.5)Recognize that polished, visually appealing presentation of web content does not equate toauthoritative, high-quality content. (1.2.4)Know the importance of determining the author when evaluating the authority of a source.(1.2.3)Recognize when a quote from a well-known author or recognized expert is being used by anauthor to gain authority. (1.2.9)Identify information directly relevant to an argument. (1.2.7)Recognize the pitfalls of using the superficial indicator "peer review" when evaluatingsources for authority. (1.2.8)Identify the sponsor, organization, or institution that provides support for a site. (1.2.1)Identify relevant elements of an author's expertise. (1.2.2)

Threshold Achievement Test Information Literacy Assessment
Copyright © 2019 Carrick Enterprises, Inc. All rights reserved. 21
Section 6: Individual Disposition ResultsThis test measures the strength of students' information literacy dispositions. See Section 1, About theTest, for more information about dispositions and Section 2 for details about disposition performancelevels. In the pie charts below, each disposition level has a different background color: Weakly-disposedis orange, moderately-disposed is pink, and strongly-disposed is blue.
Although dispositions related to personality are generally thought to be relatively stable over time, thesituational dispositions assessed in this module should be expected to strengthen as students havesustained exposure to an academic community that cultivates these approaches to problem solving.
Each results section below is introduced with an explanation of your students' mean score on the itemsassociated with that disposition, followed by students' overall and subgroup results.
Unlike the overall knowledge results detailed in Section 4, there is no overall dispositional score for thismodule because each disposition is distinct and some dispositions may work in opposition to oneanother. For example, feeling responsible to conform to the norms and values of the academiccommunity may sometimes be at odds with mindfully reflecting on one's own assumptions and actions.Higher-scored dispositions should represent an area of relative strength for your students while lower-scored dispositions should represent an area of relative weakness. Areas of strength can be built upon byintensifying the challenges presented to students. Areas of weakness can be directly targeted forimprovement through assignments that strengthen metacognition about associated information literacybehaviors.

Threshold Achievement Test Information Literacy Assessment
Copyright © 2019 Carrick Enterprises, Inc. All rights reserved. 22
Disposition 1.1: Mindful self-reflection
Learners who are disposed to demonstrate self-reflection when they are evaluating sources ofinformation consistently question their assumptions about what makes a source authoritative.
Example behaviors:Looking for features that challenge one's assumptions about the trustworthiness of one'spreferred sources.Questioning one's own assumptions about the reliability of traditional forms of scholarlyauthority.Recognizing when there are good reasons to change one's position on an issue.
Your students' mean score for the set of problem-solving items about mindful self-reflection fell in themoderately-disposed range. Scores in this range suggest that students are able to recognize thedifference between their own information preferences and the sources considered authoritative by theacademic community so they are likely to follow their professors' and librarians' guidelines about thetypes of sources to select. They are less likely to consider outsider or non-traditional sources withoutdirect guidance. They are unlikely to see the relevance of criteria they associate with academicinformation needs when they are evaluating information for other purposes even if those criteria wouldhelp them identify more authoritative and reliable sources.
Figure 6.1 Overall Results
YourInstitution
YourPeer
Institutions
YourInstitution
TypesAll
Institutions
Mean Std Err Mean Std Err Mean Std Err Mean Std Err
54 ±1 53 ±1 54 ±0 53 ±0
16 13%
87 71%
19 16%
24 15%
113 72%
19 12%
193 18%
743 69%
137 13%
1,249 20%
4,218 68%
757 12%
Threshold Achievement Test Information Literacy Assessment
Copyright © 2019 Carrick Enterprises, Inc. All rights reserved. 23
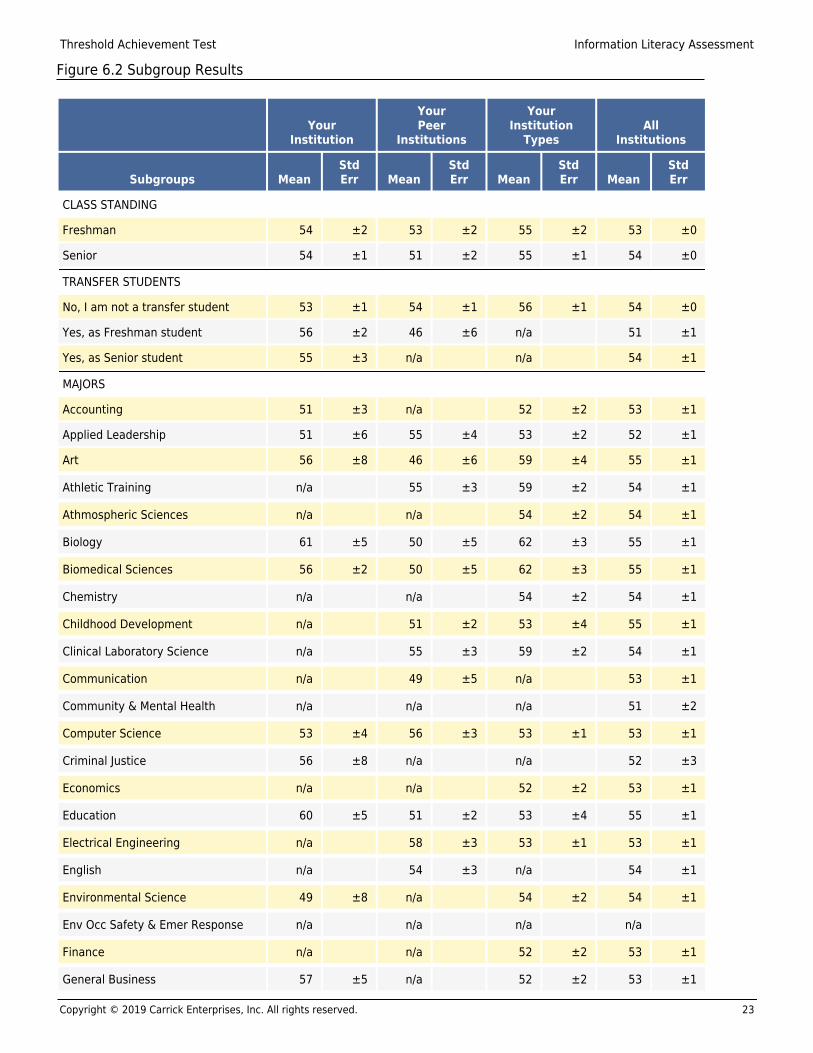
Figure 6.2 Subgroup Results
Your
Institution
YourPeer
Institutions
YourInstitution
TypesAll
Institutions
Subgroups MeanStdErr Mean
StdErr Mean
StdErr Mean
StdErr
CLASS STANDING
Freshman 54 ±2 53 ±2 55 ±2 53 ±0
Senior 54 ±1 51 ±2 55 ±1 54 ±0
TRANSFER STUDENTS
No, I am not a transfer student 53 ±1 54 ±1 56 ±1 54 ±0
Yes, as Freshman student 56 ±2 46 ±6 n/a 51 ±1
Yes, as Senior student 55 ±3 n/a n/a 54 ±1
MAJORS
Accounting 51 ±3 n/a 52 ±2 53 ±1
Applied Leadership 51 ±6 55 ±4 53 ±2 52 ±1
Art 56 ±8 46 ±6 59 ±4 55 ±1
Athletic Training n/a 55 ±3 59 ±2 54 ±1
Athmospheric Sciences n/a n/a 54 ±2 54 ±1
Biology 61 ±5 50 ±5 62 ±3 55 ±1
Biomedical Sciences 56 ±2 50 ±5 62 ±3 55 ±1
Chemistry n/a n/a 54 ±2 54 ±1
Childhood Development n/a 51 ±2 53 ±4 55 ±1
Clinical Laboratory Science n/a 55 ±3 59 ±2 54 ±1
Communication n/a 49 ±5 n/a 53 ±1
Community & Mental Health n/a n/a n/a 51 ±2
Computer Science 53 ±4 56 ±3 53 ±1 53 ±1
Criminal Justice 56 ±8 n/a n/a 52 ±3
Economics n/a n/a 52 ±2 53 ±1
Education 60 ±5 51 ±2 53 ±4 55 ±1
Electrical Engineering n/a 58 ±3 53 ±1 53 ±1
English n/a 54 ±3 n/a 54 ±1
Environmental Science 49 ±8 n/a 54 ±2 54 ±1
Env Occ Safety & Emer Response n/a n/a n/a n/a
Finance n/a n/a 52 ±2 53 ±1
General Business 57 ±5 n/a 52 ±2 53 ±1

Threshold Achievement Test Information Literacy Assessment
Copyright © 2019 Carrick Enterprises, Inc. All rights reserved. 24
Geographic Information Science n/a n/a n/a 46 ±4
Geology n/a n/a 54 ±2 54 ±1
Graphic Design n/a 46 ±6 59 ±4 55 ±1
Health Science n/a 55 ±3 59 ±2 54 ±1
History n/a 55 ±4 n/a 52 ±2
Industrial Electronics/Manufac n/a n/a n/a 46 ±4
Information Technology n/a 56 ±3 53 ±1 53 ±1
Kinesiology 60 ±4 n/a n/a 60 ±4
Legal Studies n/a n/a n/a 50 ±1
Management 47 ±10 n/a 52 ±2 53 ±1
Management Information Systems n/a n/a 52 ±2 53 ±1
Marketing 48 ±4 n/a 52 ±2 53 ±1
Mathematics n/a n/a n/a 50 ±3
Mechanical Engineering 52 ±1 58 ±3 53 ±1 53 ±1
Media Arts n/a 46 ±6 59 ±4 55 ±1
Music n/a 46 ±6 59 ±4 55 ±1
Nursing 53 ±2 55 ±3 59 ±2 54 ±1
Philosophy n/a n/a n/a n/a
Physics n/a n/a 54 ±2 54 ±1
Political Science n/a 55 ±4 56 ±3 55 ±1
Psychology 55 ±5 49 ±3 50 ±2 53 ±1
Sociology 46 ±9 55 ±4 56 ±3 55 ±1
Spanish n/a n/a n/a 58 ±7
Technical Communication/Digita n/a n/a n/a n/a
Theatre n/a 46 ±6 59 ±4 55 ±1
Undeclared 65 ±3 n/a 58 ±3 54 ±1
University Studies n/a 55 ±4 53 ±2 52 ±1

Threshold Achievement Test Information Literacy Assessment
Copyright © 2019 Carrick Enterprises, Inc. All rights reserved. 25
Disposition 1.2: Toleration of ambiguity
Learners who are disposed to demonstrate toleration for ambiguity when they are evaluating sources ofinformation treat authority as subjective because it is based on the context of the information need.
Example behaviors:Deciding what to do when authorities disagree.Flexibly using traditional and non-traditional information sources at appropriate points in theresearch process.Treating authority as a flexible concept when information needs can only be met with lesstraditional sources.
Your students' mean score for the set of problem-solving items about tolerating ambiguity and thinkingflexibly about evaluating sources fell in the moderately-disposed range. Scores in this range suggest thatstudents are likely to approach source evaluation with some flexibility because they have learned fromtheir professors the value of using challenging academic sources alongside the familiar sources theyprefer. However, because these students perceive authority primarily through the lens of relevance andutility, once they meet the minimum standards set by their professors, they are unlikely to address thenuances of authority among the sources within the paper itself.
Figure 6.3 Overall Results
YourInstitution
YourPeer
Institutions
YourInstitution
TypesAll
Institutions
Mean Std Err Mean Std Err Mean Std Err Mean Std Err
56 ±1 55 ±1 56 ±0 55 ±0
21 17%
83 68%
18 15%
31 20%
107 69%
18 12%
221 21%
676 63%
176 16%
1,424 23%
3,948 63%
852 14%

Threshold Achievement Test Information Literacy Assessment
Copyright © 2019 Carrick Enterprises, Inc. All rights reserved. 26
Figure 6.4 Subgroup Results
Your
Institution
YourPeer
Institutions
YourInstitution
TypesAll
Institutions
Subgroups MeanStdErr Mean
StdErr Mean
StdErr Mean
StdErr
CLASS STANDING
Freshman 57 ±2 55 ±2 56 ±3 56 ±0
Senior 56 ±1 54 ±2 56 ±1 55 ±1
TRANSFER STUDENTS
No, I am not a transfer student 57 ±1 56 ±2 58 ±1 56 ±0
Yes, as Freshman student 60 ±5 51 ±4 n/a 54 ±1
Yes, as Senior student 54 ±2 n/a n/a 57 ±1
MAJORS
Accounting 53 ±3 n/a 57 ±3 55 ±1
Applied Leadership 54 ±2 51 ±4 64 ±4 56 ±1
Art 68 ±5 60 ±8 54 ±2 56 ±1
Athletic Training n/a 56 ±3 58 ±5 55 ±1
Athmospheric Sciences n/a n/a 57 ±2 56 ±1
Biology 60 ±6 53 ±5 62 ±6 56 ±1
Biomedical Sciences 54 ±3 53 ±5 62 ±6 56 ±1
Chemistry n/a n/a 57 ±2 56 ±1
Childhood Development n/a 54 ±8 57 ±5 56 ±1
Clinical Laboratory Science n/a 56 ±3 58 ±5 55 ±1
Communication n/a 52 ±5 n/a 54 ±1
Community & Mental Health n/a n/a n/a 56 ±2
Computer Science 62 ±3 59 ±4 56 ±1 56 ±1
Criminal Justice 59 ±9 n/a n/a 54 ±3
Economics n/a n/a 57 ±3 55 ±1
Education 54 ±1 54 ±8 57 ±5 56 ±1
Electrical Engineering n/a 49 ±3 57 ±1 57 ±1
English n/a 56 ±4 n/a 61 ±2
Environmental Science 56 ±7 n/a 57 ±2 56 ±1
Env Occ Safety & Emer Response n/a n/a n/a n/a
Finance n/a n/a 57 ±3 55 ±1
General Business 53 ±6 n/a 57 ±3 55 ±1

Threshold Achievement Test Information Literacy Assessment
Copyright © 2019 Carrick Enterprises, Inc. All rights reserved. 27
Geographic Information Science n/a n/a n/a 60 ±4
Geology n/a n/a 57 ±2 56 ±1
Graphic Design n/a 60 ±8 54 ±2 56 ±1
Health Science n/a 56 ±3 58 ±5 55 ±1
History n/a 59 ±6 n/a 55 ±2
Industrial Electronics/Manufac n/a n/a n/a 60 ±4
Information Technology n/a 59 ±4 56 ±1 56 ±1
Kinesiology 59 ±2 n/a n/a 59 ±2
Legal Studies n/a n/a n/a 64 ±7
Management 53 ±6 n/a 57 ±3 55 ±1
Management Information Systems n/a n/a 57 ±3 55 ±1
Marketing 57 ±7 n/a 57 ±3 55 ±1
Mathematics n/a n/a n/a 52 ±4
Mechanical Engineering 53 ±2 49 ±3 57 ±1 57 ±1
Media Arts n/a 60 ±8 54 ±2 56 ±1
Music n/a 60 ±8 54 ±2 56 ±1
Nursing 54 ±3 56 ±3 58 ±5 55 ±1
Philosophy n/a n/a n/a n/a
Physics n/a n/a 57 ±2 56 ±1
Political Science n/a 51 ±5 54 ±4 56 ±2
Psychology 57 ±3 60 ±3 56 ±3 55 ±1
Sociology 56 ±8 51 ±5 54 ±4 56 ±2
Spanish n/a n/a n/a 56 ±3
Technical Communication/Digita n/a n/a n/a n/a
Theatre n/a 60 ±8 54 ±2 56 ±1
Undeclared 51 ±2 n/a 54 ±3 55 ±2
University Studies n/a 51 ±4 64 ±4 56 ±1

Threshold Achievement Test Information Literacy Assessment
Copyright © 2019 Carrick Enterprises, Inc. All rights reserved. 28
Disposition 1.3: Responsibility to community
Learners who are disposed to demonstrate a sense of responsibility to their community when they areevaluating sources of information are conscientious about how they invoke authority in order to gaincredibility with their audiences.
Example behaviors:Fulfilling one's responsibility to one's discourse community by using sources carefully.Recognizing that the sources one is permitted to use will depend on one's discourse community.Taking responsibility for critically evaluating and explaining sources' authority to one's audiencewhen stating and standing by their claims.
Your students' mean score for the set of problem-solving items about internalizing the norms and valuesof the academic community fell in the moderately-disposed range. Scores in this range suggest thatstudents are likely to have an appreciation for how the academic community values, creates, and usessources and are thus likely to incorporate some of these sources into their own work. Students who aremoderately-disposed to feel responsible to the academic community see the strengths of this approachfor evaluating information during their research but have not yet internalized these values as part of theirresponsibility as information creators.
Figure 6.5 Overall Results
YourInstitution
YourPeer
Institutions
YourInstitution
TypesAll
Institutions
Mean Std Err Mean Std Err Mean Std Err Mean Std Err
63 ±1 67 ±1 66 ±0 64 ±0
31 25%
76 62%
15 12%
26 17%
106 68%
24 15%
202 19%
712 66%
159 15%
1,402 23%
4,052 65%
770 12%

Threshold Achievement Test Information Literacy Assessment
Copyright © 2019 Carrick Enterprises, Inc. All rights reserved. 29
Figure 6.6 Subgroup Results
Your
Institution
YourPeer
Institutions
YourInstitution
TypesAll
Institutions
Subgroups MeanStdErr Mean
StdErr Mean
StdErr Mean
StdErr
CLASS STANDING
Freshman 62 ±2 67 ±3 63 ±3 64 ±1
Senior 63 ±2 71 ±3 69 ±1 65 ±1
TRANSFER STUDENTS
No, I am not a transfer student 63 ±2 68 ±2 68 ±1 65 ±0
Yes, as Freshman student 65 ±3 67 ±7 n/a 64 ±2
Yes, as Senior student 62 ±3 n/a n/a 63 ±2
MAJORS
Accounting 57 ±6 n/a 64 ±3 64 ±1
Applied Leadership 80 ±3 70 ±5 63 ±3 63 ±1
Art 58 ±7 58 ±3 80 ±6 67 ±1
Athletic Training n/a 72 ±3 64 ±3 66 ±1
Athmospheric Sciences n/a n/a 68 ±2 65 ±2
Biology 65 ±4 70 ±3 71 ±2 66 ±1
Biomedical Sciences 62 ±7 70 ±3 71 ±2 66 ±1
Chemistry n/a n/a 68 ±2 65 ±2
Childhood Development n/a 66 ±2 72 ±6 66 ±2
Clinical Laboratory Science n/a 72 ±3 64 ±3 66 ±1
Communication n/a 54 ±5 n/a 62 ±1
Community & Mental Health n/a n/a n/a 61 ±3
Computer Science 58 ±4 70 ±5 68 ±2 66 ±1
Criminal Justice 67 ±10 n/a n/a 63 ±4
Economics n/a n/a 64 ±3 64 ±1
Education 64 ±15 66 ±2 72 ±6 66 ±2
Electrical Engineering n/a 73 ±5 68 ±2 67 ±1
English n/a 67 ±4 n/a 68 ±2
Environmental Science 71 ±4 n/a 68 ±2 65 ±2
Env Occ Safety & Emer Response n/a n/a n/a n/a
Finance n/a n/a 64 ±3 64 ±1
General Business 54 ±13 n/a 64 ±3 64 ±1

Threshold Achievement Test Information Literacy Assessment
Copyright © 2019 Carrick Enterprises, Inc. All rights reserved. 30
Geographic Information Science n/a n/a n/a 63 ±5
Geology n/a n/a 68 ±2 65 ±2
Graphic Design n/a 58 ±3 80 ±6 67 ±1
Health Science n/a 72 ±3 64 ±3 66 ±1
History n/a 72 ±5 n/a 70 ±2
Industrial Electronics/Manufac n/a n/a n/a 63 ±5
Information Technology n/a 70 ±5 68 ±2 66 ±1
Kinesiology 70 ±8 n/a n/a 70 ±8
Legal Studies n/a n/a n/a 63 ±4
Management 75 ±10 n/a 64 ±3 64 ±1
Management Information Systems n/a n/a 64 ±3 64 ±1
Marketing 63 ±4 n/a 64 ±3 64 ±1
Mathematics n/a n/a n/a 60 ±3
Mechanical Engineering 60 ±3 73 ±5 68 ±2 67 ±1
Media Arts n/a 58 ±3 80 ±6 67 ±1
Music n/a 58 ±3 80 ±6 67 ±1
Nursing 61 ±3 72 ±3 64 ±3 66 ±1
Philosophy n/a n/a n/a n/a
Physics n/a n/a 68 ±2 65 ±2
Political Science n/a 74 ±4 65 ±3 66 ±2
Psychology 60 ±3 65 ±3 68 ±2 66 ±1
Sociology 62 ±3 74 ±4 65 ±3 66 ±2
Spanish n/a n/a n/a 69 ±5
Technical Communication/Digita n/a n/a n/a n/a
Theatre n/a 58 ±3 80 ±6 67 ±1
Undeclared 68 ±4 n/a 65 ±6 62 ±2
University Studies n/a 70 ±5 63 ±3 63 ±1

Threshold Achievement Test Information Literacy Assessment
Copyright © 2019 Carrick Enterprises, Inc. All rights reserved. 31
Section 7: Targeted Reading RecommendationsFollowing up on assessment results is the most important step in the assessment cycle. Below are somearticles and reports that may help you to formulate a plan for next steps based on the results of yourThreshold Achievement assessment.
Corrall, S. (2017). Crossing the threshold: Reflective practice in information literacydevelopment. Journal of Information Literacy, 11(1), 23-53.http://dx.doi.org/10.11645/11.1.2241Graf, A. J., & Harris, B. R. (2016). Reflective assessment: Opportunities and challenges.Reference Services Review, 44(1), 38-47. https://doi.org/10.1108/RSR-06-2015-0027Hinchliffe, L. J. (2015). Professional development for assessment: Lessons from reflectivepractice. Journal of Academic Librarianship, 41(6), 850-852. doi:10.1016/j.acalib.2015.10.004Markless, S., & Streatfield, D. (2017). How can you tell if it’s working? Recent developmentsin impact evaluation and their implications for information literacy practice. Journal ofInformation Literacy, 11(1), 106-119. http://dx.doi.org/10.11645/11.1.2201Tewell, E. (2016). Putting critical information literacy into context: How and why librariansadopt critical practices in their teaching. In the Library with the Lead Pipe.http://www.inthelibrarywiththeleadpipe.org/2016/10/
You assessed students as part of an effort to measure information literacy at the institution-level. YourTATIL results may provide evidence for your accreditation self-study report. The following resources mayhelp you to draft an ongoing assessment plan as you think about how to contribute to a culture ofassessment on your campus:
Baker, G. R., Jankowski, N., Provezis, S. & Kinzie, J. (2012). Using assessment results:Promising practices of institutions that do it well. Urbana, IL: University of Illinois and IndianaUniversity, National Institute for Learning Outcomes Assessment (NILOA).Blank, J. M., McGaughey, K. J., Keeling, E. L., Thorp, K. L., Shannon, C. C., & Scaramozzino, J. M.(2016). A novel assessment tool for quantitative evaluation of science literature searchperformance: Application to first-year and senior undergraduate biology majors. College &Research Libraries, 77(6), 682-702. https://doi.org/10.5860/crl.77.6.16551Gross, M., Latham, D., & Armstrong, B. (2012). Improving below-proficient information literacyskills: Designing an evidence-based educational intervention. College Teaching, 60(3),104-111. doi:10.1080/87567555.2011.645257Squibb, S. D., & Mikkelsen, S. (2016). Assessing the value of course-embedded informationliteracy on student learning and achievement. College & Research Libraries, 77(2), 164–183.https://doi.org/10/5860/crl.77.2.164Suskie, L. A. (2018). Assessing student learning: A common sense guide. 3d ed. San Francisco,CA: Jossey-Bass.Wakimoto, D. K., Alexander, S., Bussman, J. D., Winkelman, P. & Jiansheng, G. (2016). Campus-wide information literacy assessment: An opportunity for library leadership throughunderstanding faculty perspectives. Library Leadership & Management, 31(1), 1-19.Whitlock, B. & Ebrahimi, N. (2016). Beyond the library: Using multiple, mixed measuressimultaneously in a college-wide assessment of information literacy. College & ResearchLibraries, 77, 236-262. doi:10.5860/crl.77.2.236

Threshold Achievement Test Information Literacy Assessment
Copyright © 2019 Carrick Enterprises, Inc. All rights reserved. 32
If you have not already completed a curriculum map at Texas A&M University-Corpus Christi, curriculumanalysis may be an important next step for identifying courses or milestones where information literacyinstruction could significantly affect student outcomes. Your TATIL results could provide you with thefoundational findings you need to get faculty interested in helping you map their curriculum. Thefollowing resources explain the process and provide case studies:
Buchanan, H., Webb, K. K., Houk, A. H., & Tingelstad, C. (2015). Curriculum mapping inacademic libraries. New Review of Academic Librarianship, 21(1), 94-111.doi:10.1080/13614533.2014.1001413Franzen, S., & Bannon, C. M. (2016). Merging information literacy and evidence-based practicein an undergraduate health sciences curriculum map. Communications in Information Literacy,10(2), 245-263.
If your results suggest a need to develop new curriculum or create a college-wide dialogue aboutstudents' information literacy among faculty, the following resources suggest possible models:
Bowles-Terry, M., & Donovan, C. (2016). Serving notice on the one-shot: Changing roles forinstruction librarians. International Information & Library Review, 48(2), 137-142.Cowan, S. & Eva, N. (2016). Changing our aim: Infiltrating faculty with information literacy.Communications in Information Literacy, 10(2), 163-177.Hoffmann, D., & Wallace, A. (2013). Intentional informationists: Re-envisioning informationliteracy and re-designing instructional programs around faculty librarians' strengths as campusconnectors, information professionals, and course designers. Journal of Academic Librarianship,39, 546-551. doi:10.1016/j.acalib.2013.06.004Johnson-Grau, G., Archambault, S. G., Acosta, E. S., & McLean, L. (2016). Patience, persistence,and process: Embedding a campus-wide information literacy program across the curriculum.Journal of Academic Librarianship, 42(6), 750-756. https://doi.org/10.1016/j.acalib.2016.10.013Jumonville, A. (2014). The role of faculty autonomy in a course-integrated information literacyprogram. Reference Services Review, 42, 536-551.http://dx.doi.org/10.1108/RSR-07-2014-0020Junisbai, B., Lowe, M. S., & Tagge, N. (2016). A pragmatic and flexible approach to informationliteracy: Findings from a three-year study of faculty-librarian collaboration. Journal of AcademicLibrarianship, 42(5), 604-611. https://doi.org/10.1016/j.acalib.2016.07.001Smith, P. A. (2016). Integrate and assess: Information literacy as quality enhancement ofundergraduate curriculum. Communications in Information Literacy, 10(2), 214-244.
If you are interested in the disposition portion of the test, you may want to learn more about theconnection between dispositions and learning. Consider how understanding of dispositions can be usedto promote training transfer, as described in the following sources:
Bereiter, C. (1995). A dispositional view of transfer. In A. McKeough, J. Lupart, & A. Marini(Eds.), Teaching for transfer: Fostering generalization in learning (pp. 21–34). Mahwah, NJ:Lawrence Erlbaum.Bonnet, J. L., Cordell, S. A., Cordell, J., Duque, G. J., MacKintosh, P. J., & Peters, A. J. (2013). Theapprentice researcher: Using undergraduate researchers' personal essays to shape instructionand services. portal: Libraries and the Academy, 13, 37-59.https://doi.org/10.1353/pla.2013.0007
Threshold Achievement Test Information Literacy Assessment
Copyright © 2019 Carrick Enterprises, Inc. All rights reserved. 33
Dempsey, P. R., & Jagman, H. (2016). �I felt like such a freshman�: First-year studentscrossing the library threshold. portal: Libraries & the Academy, 16(1), 89-107.doi:10.1353/pla.2016.0011Duckworth, A. L., & Yeager, D. S. (2015). Measurement matters: Assessing personal qualitiesother than cognitive ability for educational purposes. Educational Researcher, 44, 237-251.doi:10.3102/0013189X15584327Farrington, C. A., Roderick, M., Allensworth, E., Nagaoka, J., Keyes, T. S., Johnson, D. W., &Beechum, N. O. (2012). Teaching Adolescents to Become Learners: The Role of NoncognitiveFactors in Shaping School Performance: A Critical Literature Review. Chicago, IL: University ofChicago Consortium on Chicago School Research.Folk, A. L. (2016). Academic reference and instruction librarians and Dweck’s theories ofintelligence. College & Research Libraries, 77(3), 302-313. https://doi.org/10.5860/crl.77.3.302Lenker, M. (2016). Motivated reasoning, political information, and information literacyeducation. portal: Libraries & the Academy, 16(3), 511-528.http://dx.doi.org/10.1353/pla.2016.0030Perkins, D. N., & Salomon, G. (2012). Knowledge to go: A motivational and dispositional view oftransfer. Educational Psychologist, 47(3), 248–258.https://doi.org/10.1080/00461520.2012.693354Ross, M., Perkins, H., & Bodey, K. (2016). Academic motivation and information literacy self-efficacy: The importance of a simple desire to know. Library & Information Science Research,38(1), 2-9. https://doi.org/10.1016/j.lisr.2016.01.002

Threshold Achievement Test Information Literacy Assessment
Copyright © 2019 Carrick Enterprises, Inc. All rights reserved. 34
Appendix A. Student ProfileThe figure below reports the available demographic data; not all elements of demographic data werereported for all students.
Figure A.1 Student Profile
Your
Institution
YourPeer
Institutions
YourInstitution
TypesAll
Institutions
Subgroups N % N % N % N %
TOTAL 122 100 156 100 1,073 100 6,224 100
CLASS STANDING
Freshman 61 50 31 20 21 2 740 12
Senior 61 50 20 13 104 10 486 8
TRANSFER STUDENTS
No, I am not a transfer student 86 70 57 37 137 13 1,352 22
Yes, as Freshman student 7 6 4 3 2 0 72 1
Yes, as Senior student 21 17 2 1 0 0 53 1
MAJORS
Accounting 3 2 1 1 20 2 151 2
Applied Leadership 3 2 7 4 13 1 114 2
Art 3 2 3 2 7 1 101 2
Athletic Training 0 0 24 15 6 1 347 6
Athmospheric Sciences 0 0 1 1 36 3 86 1
Biology 7 6 3 2 4 0 104 2
Biomedical Sciences 5 4 3 2 4 0 104 2
Chemistry 1 1 1 1 36 3 86 1
Childhood Development 2 2 3 2 9 1 88 1
Clinical Laboratory Science 0 0 24 15 6 1 347 6
Communication 2 2 5 3 0 0 87 1
Community & Mental Health 0 0 1 1 0 0 19 0
Computer Science 5 4 12 8 76 7 94 2
Criminal Justice 3 2 0 0 0 0 14 0
Economics 0 0 1 1 20 2 151 2
Education 3 2 3 2 9 1 88 1
Electrical Engineering 0 0 6 4 72 7 95 2
English 2 2 6 4 0 0 47 1
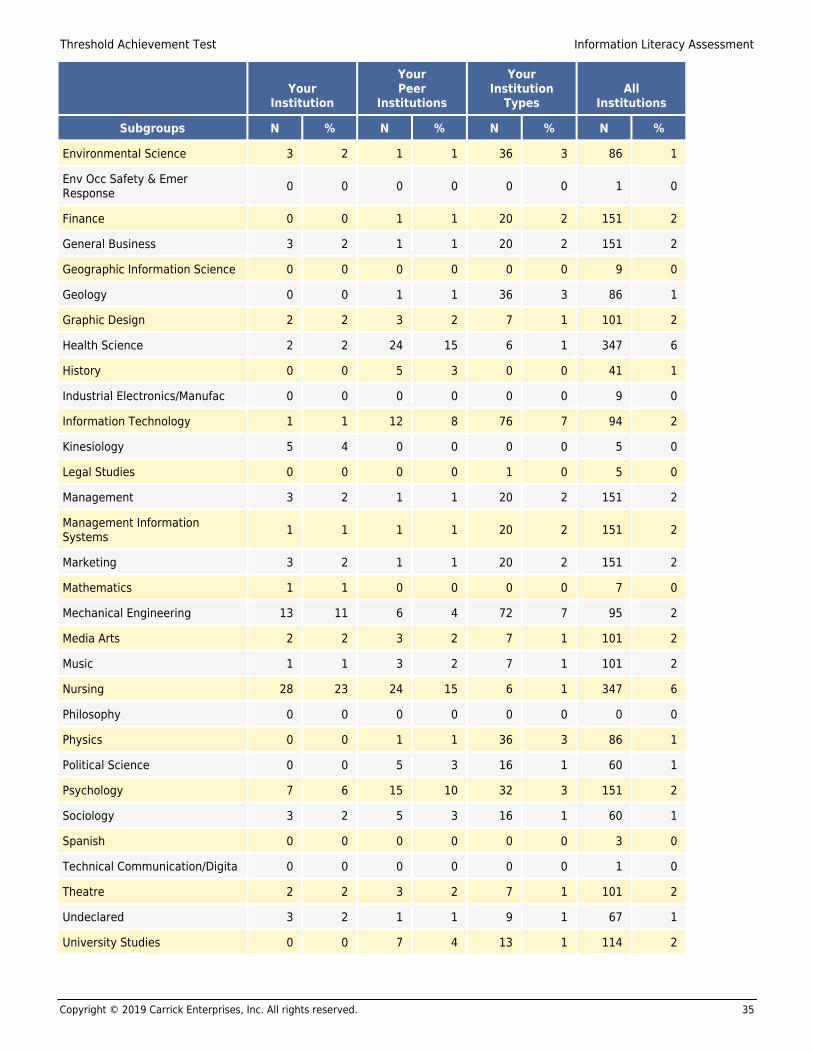
Threshold Achievement Test Information Literacy Assessment
Copyright © 2019 Carrick Enterprises, Inc. All rights reserved. 35
Your
Institution
YourPeer
Institutions
YourInstitution
TypesAll
Institutions
Subgroups N % N % N % N %
Environmental Science 3 2 1 1 36 3 86 1
Env Occ Safety & EmerResponse 0 0 0 0 0 0 1 0
Finance 0 0 1 1 20 2 151 2
General Business 3 2 1 1 20 2 151 2
Geographic Information Science 0 0 0 0 0 0 9 0
Geology 0 0 1 1 36 3 86 1
Graphic Design 2 2 3 2 7 1 101 2
Health Science 2 2 24 15 6 1 347 6
History 0 0 5 3 0 0 41 1
Industrial Electronics/Manufac 0 0 0 0 0 0 9 0
Information Technology 1 1 12 8 76 7 94 2
Kinesiology 5 4 0 0 0 0 5 0
Legal Studies 0 0 0 0 1 0 5 0
Management 3 2 1 1 20 2 151 2
Management InformationSystems 1 1 1 1 20 2 151 2
Marketing 3 2 1 1 20 2 151 2
Mathematics 1 1 0 0 0 0 7 0
Mechanical Engineering 13 11 6 4 72 7 95 2
Media Arts 2 2 3 2 7 1 101 2
Music 1 1 3 2 7 1 101 2
Nursing 28 23 24 15 6 1 347 6
Philosophy 0 0 0 0 0 0 0 0
Physics 0 0 1 1 36 3 86 1
Political Science 0 0 5 3 16 1 60 1
Psychology 7 6 15 10 32 3 151 2
Sociology 3 2 5 3 16 1 60 1
Spanish 0 0 0 0 0 0 3 0
Technical Communication/Digita 0 0 0 0 0 0 1 0
Theatre 2 2 3 2 7 1 101 2
Undeclared 3 2 1 1 9 1 67 1
University Studies 0 0 7 4 13 1 114 2

Threshold Achievement Test Information Literacy Assessment
Copyright © 2019 Carrick Enterprises, Inc. All rights reserved. 36
Appendix B. Institutions
Your Peer Institutions
Emporia State UniversityFlorida Institute of Technology
Members of Your Institution Types
Auburn UniversityFlorida Institute of TechnologyOklahoma State UniversityTexas A&M UniversityTexas A&M University-Corpus ChristiUniversity of KansasUniversity of Lethbridge
All Institutions
Auburn UniversityBrigham Young UniversityBryant & Stratton CollegeBryn Athyn CollegeCalifornia State University at San MarcosCalifornia State University, FresnoChapman UniversityEmporia State UniversityFlorida Institute of TechnologyGoldfinch UniversityJames Madison UniversityKEENE STATE COLLEGEOklahoma State UniversityPalomar CollegePurdue Fort WayneTemple UniversityTexas A&M UniversityTexas A&M University-Corpus ChristiThe Harker SchoolUniversity of GuamUniversity of KansasUniversity of LethbridgeUniversity of North Carolina at GreensboroValencia College