Embed Size (px)
Citation preview

Three-Stage Prediction of Protein Beta-Sheets Using
Neural Networks, Alignments, and Graph Algorithms
Jianlin Cheng and Pierre Baldi
Institute for Genomics and BioinformaticsSchool of Information and Computer Sciences
University of California Irvine

Importance of Predicting Beta-Sheet Structure
Ab-initio Structure Prediction
Fold Recognition Model Refinement Protein Design Protein Folding
Rendered in Protein Explorer
beta-sheethelix
Coil

An Example of Beta-Sheet Architecture
Structure ofProtein 1VJG
Beta Sheets
Level 1
4 5
2 1 3 6 7

An Example of Beta-Sheet Architecture
Structure ofProtein 1VJG
Beta Sheets StrandStrand PairStrand AlignmentPairing Direction
Level 1 Level 2
Antiparallel
Parallel
4 5
2 1 3 6 7

An Example of Beta-Sheet Architecture
Structure ofProtein 1VJG
Beta Sheets StrandStrand PairStrand AlignmentPairing Direction
Beta ResidueResidue Pair
Level 1 Level 2 Level 3
Antiparallel
Parallel
4 5
2 1 3 6 7
H-bond

Previous Work
Statistical potential approach for strand alignment (Hubbard, 1994; Zhu and Braun, 1999)
Statistical potentials to improve beta-sheet secondary structure prediction (Asogawa,1997)
Information theory approach for strand alignment (Steward and Thornton, 2000)
Neural networks for beta-residue pairs (Baldi, et al., 2000)

Three-Stage Prediction of Beta-Sheets
Stage 1 Predict beta-residue pairing probabilities
using 2D-Recursive Neural Networks (2D-
RNN, Baldi and Pollastri, 2003)
Stage 2 Use beta-residue pairing probabilities to
align beta-strands
Stage 3 Predict beta-strand pairs and beta-sheet
architecture using graph algorithms
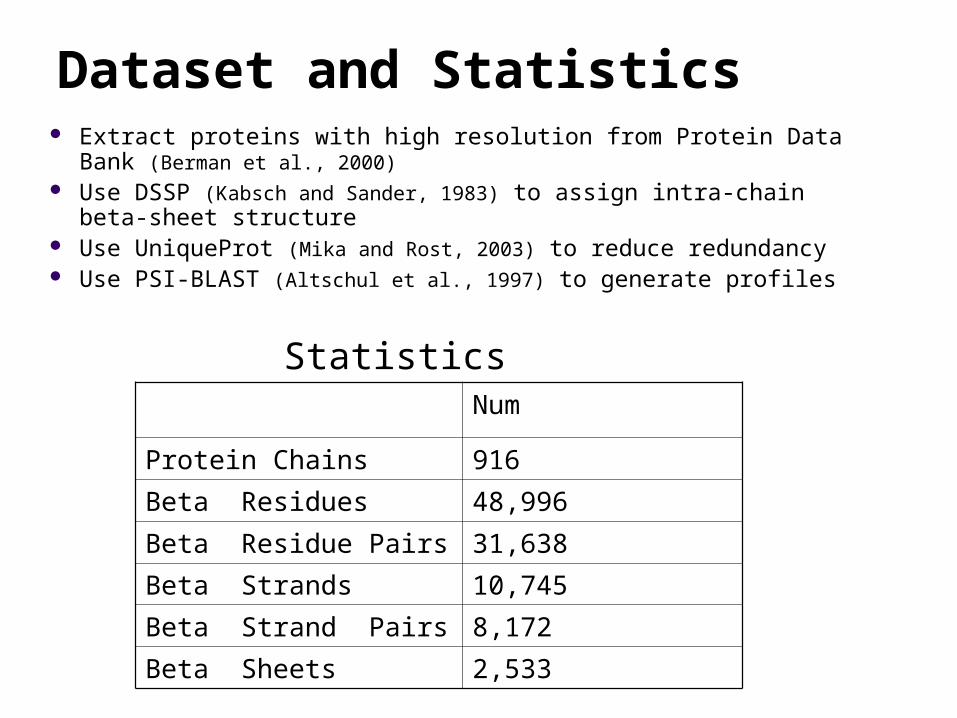
Dataset and Statistics
Num
Protein Chains 916
Beta Residues 48,996
Beta Residue Pairs 31,638
Beta Strands 10,745
Beta Strand Pairs 8,172
Beta Sheets 2,533
Extract proteins with high resolution from Protein Data Bank (Berman et al., 2000)
Use DSSP (Kabsch and Sander, 1983) to assign intra-chain beta-sheet structure
Use UniqueProt (Mika and Rost, 2003) to reduce redundancy Use PSI-BLAST (Altschul et al., 1997) to generate profiles
Statistics

Stage 1: Prediction of Beta-Residue Pairings Using 2D-RNN
Input Matrix I (m×m)
2D-RNNO = f(I)
Target / Output Matrix (m×m)
(i,j)
20 profiles 3 SS 2 SA
Tij: 0/1
Oij: Pairing Prob.
(i,j)
Iij
Xi-2 Xi-1 Xi Xi+1 Xi+2 Xj-2 Xj-1 Xj X j+1 Xj+2 |Xi – Xj|
Xi or Xj is the position of beta-residue i or j in the sequence

An Example (Target)
Protein 1VJGBeta-Residue Pairing Map (Target Matrix)
1 2 3 4 5 6 7

An Example (Target)
Protein 1VJGBeta-Residue Pairing Map (Target Matrix)
1 2 3 4 5 6 7Antiparallel
Parallel

An Example (Prediction)

Stage 2: Beta-Strand Alignment
Use output probability matrix as scoring matrix
Dynamic programming Disallow gaps and use
the simplified search algorithm
1 m
n 1
1 m
1 n
Antiparallel
Parallel
Total number of alignments = 2(m+n-1)

Strand Alignment and Pairing Matrix
The alignment score is the sum of the pairing probabilities of the aligned residues
The best alignment is the alignment with the maximum score
Strand Pairing Matrix
Strand Pairing Matrix of 1VJG

Stage 3: Prediction of Beta-Strand Pairings and Beta-Sheet Architecture (Constraints)
(a) Seven strands of protein 1VJG in sequence order
(b) Beta-sheet topology of protein 1VJG

Stage 3: Prediction of Beta-Strand Pairings and Beta-Sheet Architecture (Constraints)
(a) Seven strands of protein 1VJG in sequence order
(b) Beta-sheet topology of protein 1VJG
Protein: 1B7G
Rendered in Rasmol
3 partners

Minimum Spanning Tree Like Algorithm
Strand Pairing Graph (SPG)
(a) Complete SPGStrand Pairing Matrix

Minimum Spanning Tree Like Algorithm
Strand Pairing Graph (SPG)
Goal: Find a set of connected subgraphs that maximize the sum of the alignment scores and satisfy the constraints
Algorithm: Minimum Spanning Tree Like Algorithm
(a) Complete SPG (b) True Weighted SPGStrand Pairing Matrix

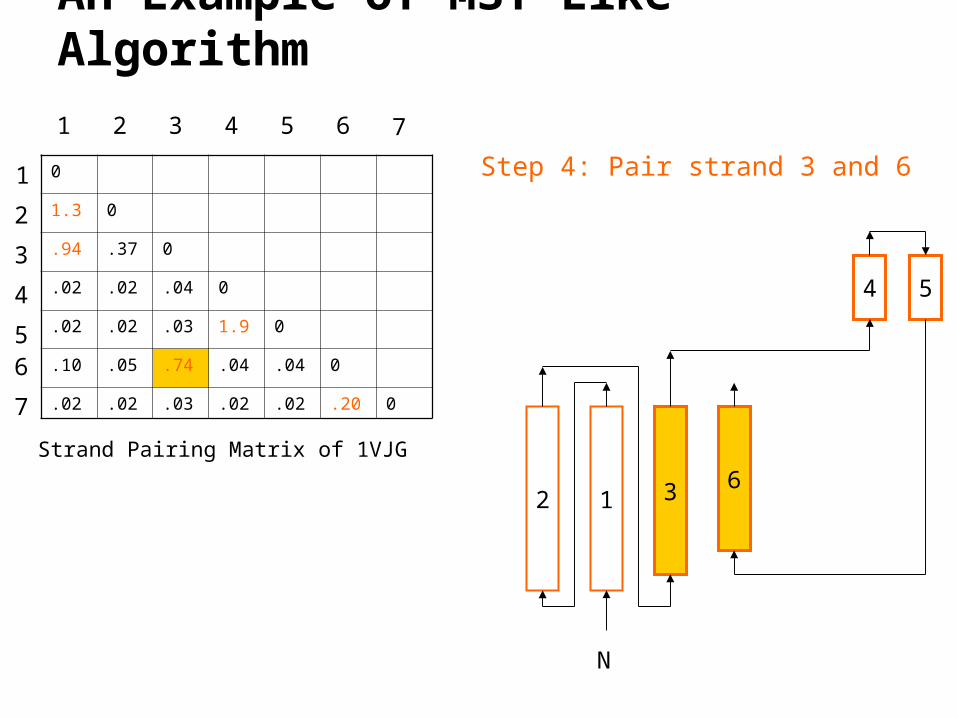
An Example of MST Like Algorithm
0
1.3 0
.94 .37 0
.02 .02 .04 0
.02 .02 .03 1.9 0
.10 .05 .74 .04 .04 0
.02 .02 .03 .02 .02 .20 0
1
2
3
4
56
7
1 2 3 4 5 6 7
4 5
Strand Pairing Matrix of 1VJG
Step 1: Pair strand 4 and 5

An Example of MST Like Algorithm
0
1.3 0
.94 .37 0
.02 .02 .04 0
.02 .02 .03 1.9 0
.10 .05 .74 .04 .04 0
.02 .02 .03 .02 .02 .20 0
1
2
3
4
56
7
1 2 3 4 5 6 7
4 5
2 1
Strand Pairing Matrix of 1VJG
N
Step 2: Pair strand 1 and 2

An Example of MST Like Algorithm
0
1.3 0
.94 .37 0
.02 .02 .04 0
.02 .02 .03 1.9 0
.10 .05 .74 .04 .04 0
.02 .02 .03 .02 .02 .20 0
1
2
3
4
56
7
1 2 3 4 5 6 7
4 5
2 1 3
Strand Pairing Matrix of 1VJG
N
Step 3: Pair strand 1 and 3
An Example of MST Like Algorithm
0
1.3 0
.94 .37 0
.02 .02 .04 0
.02 .02 .03 1.9 0
.10 .05 .74 .04 .04 0
.02 .02 .03 .02 .02 .20 0
1
2
3
4
56
7
1 2 3 4 5 6 7
4 5
2 1 3 6Strand Pairing Matrix of 1VJG
N
Step 4: Pair strand 3 and 6

An Example of MST Like Algorithm
0
1.3 0
.94 .37 0
.02 .02 .04 0
.02 .02 .03 1.9 0
.10 .05 .74 .04 .04 0
.02 .02 .03 .02 .02 .20 0
1
2
3
4
56
7
1 2 3 4 5 6 7
4 5
2 1 3 67Strand Pairing Matrix of 1VJG
N
C
Step 5: Pair strand 6 and 7

A New Fold Example (Last CASP)
1S12 (94 residues)
1 2 3 4 5
1 0 1.71 .05 .29 .33
2 0 .06 .41 .12
3 0 .22 .04
4 0 .53
5 0
CEEEEEECCEEEECCCCCCCCHHHHHHHHHHHHHHHHHHHHHHHEHHCCCCEEEEHHHHHHHHHHHHHHHHHHHHHHHHHCCCCEEEEEEECCC
Predicted: 1-2, 2-4, 3-4, 4-5
CEEEEECCCEEEEECCCCCHHHHHHHHHHHHHHHHHHHHCCCEEEEEECCEEEEEECCCCHHHHHHHHHHHHHHHHHHHHCCCCEEEEECCCCCC
True: 1-2, 2-4, 3-4, 1-5
True secondary structure
Predicted secondary structure by SSpro (Pollastri, et al., 2002)
124
3
5
Rendered in Rasmol
Strand Pairing Matrix
1s12
Beta Sheet Topology

Beta-Residue Pairing ResultsMethod Specificity/
Sensitivity
Ratio of
Improvement
ROC
Area
TPR at
5% FPR
BetaPairing 41% 17.8 0.86 58%
CMAPpro(Pollastri and Baldi, 2002)
27% 11.7 0.80 42%
The accuracy of random algorithm is 2.3%.
ROC Plot

Strand Pairing Results
Naïve algorithm of pairing all adjacent strands Specificity = 42% Sensitivity = 50% All strand pairs are local strand pairs.
MST like algorithm Specificity = 53% Sensitivity = 59% >20% correctly predicted strand pairs are non-local strand pairs.

Strand Alignment Results
Paring Direction
Alignment
Accuracy 93% 72%
On the correctly predicted strand pairs
Pairing Direction
Alignment
Accuracy 84% 66%
On all native strand pairs
•The accuracy of pairing direction is 15% higher than that of the base-line algorithm.•The alignment accuracy is significantly higher than previous methods.

Future Work and Applications
Allow a cycle to handle beta-barrel, allow gaps in alignment for beta bulge, add more inputs (Punta
and Rost, 2005) for beta residue pairing prediction Applications
Contact map Fold recognition Ab-initio structure prediction Model refinement
Web server and dataset (SCRATCH suite)http://www.ics.uci.edu/~baldig/betasheet.html

Acknowledgement
Pierre Baldi, Arlo Randall, Michael Sweredoski NIH grant (LM-07443-01) NSF grant (EIA-0321390)