Embed Size (px)
Citation preview
Nuclear Instruments and Methods in Physics Research A 452 (2000) 223}238
Three-dimensional position sensitivity in two-dimensionallysegmented HP-Ge detectors
K. Vetter!,*, A. Kuhn!, M.A. Deleplanque!, I.Y. Lee!, F.S. Stephens!, G.J. Schmid",D. Beckedahl", J.J. Blair#, R.M. Clark!, M. Cromaz!, R.M. Diamond!, P. Fallon!,
G.J. Lane!, J.E. Kammeraad", A.O. Macchiavelli!, C.E. Svensson!
!Nuclear Science Division, Lawrence Berkeley National Laboratory, Berkeley, CA 94720, USA"Lawrence Livermore National Laboratory, Livermore, CA 94550, USA
#Bechtel Nevada, North Las Vegas, NV 89130-4134, USA
Received 8 February 2000; accepted 3 March 2000
Abstract
Measured- and simulated-pulse shapes in electrically segmented coaxial Ge detectors have been investigated. Three-dimensional position sensitivities have been determined experimentally and theoretically in a 36-fold segmented Gedetector. By using the two-dimensional segmentation in conjunction with pulse-shape analysis, a position sensitivity ofbetter than 1 mm can be obtained in three dimensions at an energy of 374 keV. This is achieved by analyzing the shape ofnet charge signals of segments containing interactions and of transient image charge signals of neighboring segments. Theability to locate interactions in three-dimensions is one of the crucial properties in the proposed c-ray energy trackingarray (GRETA). The concept of c-ray tracking will not only increase the e$ciency in detecting c radiation but alsoenables the localization and characterization of unknown c-ray sources with much higher accuracy than is possible withcurrent instruments. ( 2000 Elsevier Science B.V. All rights reserved.
PACS: 07.85; 29.40; 29.40.K; 29.40.W
Keywords: HPGe detectors; Position-sensitive detectors; GRETA; c-ray tracking
1. Introduction
Currently, a new technique to enable the track-ing of c radiation is being developed which willallow the determination of the time sequence ofinteractions of c rays and their respective positions
*Corresponding author. Tel.: #1-510-486-5708; fax: #1-510-486-7983.
E-mail address: [email protected] (K. Vetter).
in a detector as well as their energies [1]. An im-plementation of this concept, the c-ray energytracking array, known as GRETA, is currently be-ing developed at the Lawrence Berkeley NationalLaboratory (LBNL) and focuses on improving theperformance of c-ray spectrometers primarily inthe "eld of nuclear structure physics. It is anticip-ated that GRETA will improve the resolving powerover existing arrays, such as Gammasphere, by atleast two orders of magnitude [1,2]. This largegain is based on an increased e$ciency and
0168-9002/00/$ - see front matter ( 2000 Elsevier Science B.V. All rights reserved.PII: S 0 1 6 8 - 9 0 0 2 ( 0 0 ) 0 0 4 3 0 - 7
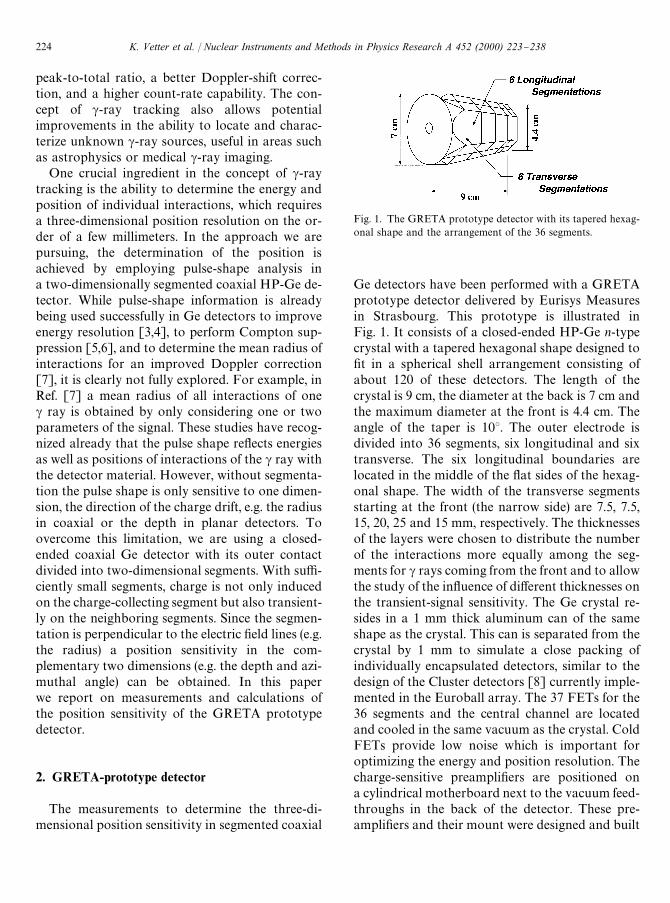
Fig. 1. The GRETA prototype detector with its tapered hexag-onal shape and the arrangement of the 36 segments.
peak-to-total ratio, a better Doppler-shift correc-tion, and a higher count-rate capability. The con-cept of c-ray tracking also allows potentialimprovements in the ability to locate and charac-terize unknown c-ray sources, useful in areas suchas astrophysics or medical c-ray imaging.
One crucial ingredient in the concept of c-raytracking is the ability to determine the energy andposition of individual interactions, which requiresa three-dimensional position resolution on the or-der of a few millimeters. In the approach we arepursuing, the determination of the position isachieved by employing pulse-shape analysis ina two-dimensionally segmented coaxial HP-Ge de-tector. While pulse-shape information is alreadybeing used successfully in Ge detectors to improveenergy resolution [3,4], to perform Compton sup-pression [5,6], and to determine the mean radius ofinteractions for an improved Doppler correction[7], it is clearly not fully explored. For example, inRef. [7] a mean radius of all interactions of onec ray is obtained by only considering one or twoparameters of the signal. These studies have recog-nized already that the pulse shape re#ects energiesas well as positions of interactions of the c ray withthe detector material. However, without segmenta-tion the pulse shape is only sensitive to one dimen-sion, the direction of the charge drift, e.g. the radiusin coaxial or the depth in planar detectors. Toovercome this limitation, we are using a closed-ended coaxial Ge detector with its outer contactdivided into two-dimensional segments. With su$-ciently small segments, charge is not only inducedon the charge-collecting segment but also transient-ly on the neighboring segments. Since the segmen-tation is perpendicular to the electric "eld lines (e.g.the radius) a position sensitivity in the com-plementary two dimensions (e.g. the depth and azi-muthal angle) can be obtained. In this paperwe report on measurements and calculations ofthe position sensitivity of the GRETA prototypedetector.
2. GRETA-prototype detector
The measurements to determine the three-di-mensional position sensitivity in segmented coaxial
Ge detectors have been performed with a GRETAprototype detector delivered by Eurisys Measuresin Strasbourg. This prototype is illustrated inFig. 1. It consists of a closed-ended HP-Ge n-typecrystal with a tapered hexagonal shape designed to"t in a spherical shell arrangement consisting ofabout 120 of these detectors. The length of thecrystal is 9 cm, the diameter at the back is 7 cm andthe maximum diameter at the front is 4.4 cm. Theangle of the taper is 103. The outer electrode isdivided into 36 segments, six longitudinal and sixtransverse. The six longitudinal boundaries arelocated in the middle of the #at sides of the hexag-onal shape. The width of the transverse segmentsstarting at the front (the narrow side) are 7.5, 7.5,15, 20, 25 and 15 mm, respectively. The thicknessesof the layers were chosen to distribute the numberof the interactions more equally among the seg-ments for c rays coming from the front and to allowthe study of the in#uence of di!erent thicknesses onthe transient-signal sensitivity. The Ge crystal re-sides in a 1 mm thick aluminum can of the sameshape as the crystal. This can is separated from thecrystal by 1 mm to simulate a close packing ofindividually encapsulated detectors, similar to thedesign of the Cluster detectors [8] currently imple-mented in the Euroball array. The 37 FETs for the36 segments and the central channel are locatedand cooled in the same vacuum as the crystal. ColdFETs provide low noise which is important foroptimizing the energy and position resolution. Thecharge-sensitive preampli"ers are positioned ona cylindrical motherboard next to the vacuum feed-throughs in the back of the detector. These pre-ampli"ers and their mount were designed and built
224 K. Vetter et al. / Nuclear Instruments and Methods in Physics Research A 452 (2000) 223}238

at LBNL and are characterized by their small size,fast risetime, low noise, and excellent responseproperties [9]. More details on the GRETA proto-type detector and the preampli"ers can be found inRef. [10].
3. Origin and calculation of charge signals in asegmented Ge detector
To determine the position in three dimensionsbased on pulse-shape analysis, a detailed under-standing of the pulse shapes is necessary. In thedetector, a signal is produced when electrons andholes, formed by the slowing down of the photo- orCompton-electrons, induce an image charge of op-posite sign on the electrodes. As the charge driftstoward the electrodes, the amount of the imagecharge changes and currents #ow into or out of theelectrodes. When the charge is at a large distancefrom the electrodes, the induced charge is distrib-uted over several electrodes. As the charge movescloser to the destination electrode, the inducedcharge on this electrode increases and charges onthe other electrodes decrease until the charge"nally reaches the electrode and neutralizes theimage charge. The observation of a net charge onthe destination or charge-collecting electrode canbe used to identify the electrode which contains theinteraction. The predominant characteristic of thetransient image signals is that they vanish when thecharge carriers are collected and that either polar-ity is possible, dependent on the di!erent contribu-tions of holes and electrons. The fact that eitherpolarity is possible is useful since it increases thedynamic range of signals, increasing the positionsensitivity. For instance, simply observing the po-larity of the induced signal allows to distinguishbetween an interaction at small and large radius.However, the drawback of the two polarities is thatthe contributions of holes and electrons can com-pensate each other, generally close to the mid-pointbetween the two electrodes, which results in a re-duced sensitivity at these locations.
Net charge, as well as transient image chargesignals can be calculated in the following manner:"rst we have to calculate the path of the chargecarrier for a given position of the interaction. The
motion of the charge carriers is determined by theelectric "eld E(r), which itself depends on the de-tector geometry, applied voltage <
0, and intrinsic
space-charge density o and mobility k. To obtainthe electric "eld the Poisson equation
*U(r)"!o(z)/e (1)
for the potential U is solved. Here, e is the dielectricconstant for Ge and o(z) re#ects the dependence ofthe space-charge density on the depth. We useda linear variation for the impurity density from!11]10~9 cm~3 at the front to!6]10~9 cm~3 at the back of the detector, assuggested by the manufacturer. After solving thePoisson equation numerically employing either therelaxation method or "nite element methods, thepotential is obtained on a three-dimensional gridwith a grid size of, e.g. 1 mm. The calculated poten-tial for the tapered hexagon geometry at a depth of4 cm is shown on the left-hand side of Fig. 2. Theelectric "eld is then calculated on these grid pointsas
E(r)"!+U(r). (2)
Using the relation
*(E(r))"k (¹,E(r),f,0 )E(r) (3)
for the velocity, we can calculate the trajectory forelectrons and holes for any given start position byinterpolating the electric "eld between the gridpoints and a given time interval *t of (e.g.) 2 ns,small enough to prevent discontinuities in the driftvelocity. We have to point out that the mobility isnot only a function of the temperature and electric"eld but depends also on the angle f between thedrift direction and the crystal orientation and theangle 0 between the electric "eld and the crystalorientation. The temperature, electric "eld strengthand crystal orientation dependence for the magni-tude of the mobility of electrons and holes in ger-manium can be taken from Refs. [11] and [12],respectively. The e!ect of a velocity vector which isnot parallel to the electric "eld direction due to theanisotropic e!ective mass tensor in Ge [13] is dis-cussed in Ref. [14]. We assume that the slowingdown time of the original Compton electrons, withthe related creation of the electron}hole pairs, aswell as the time for these pairs to reach the velocity
K. Vetter et al. / Nuclear Instruments and Methods in Physics Research A 452 (2000) 223}238 225
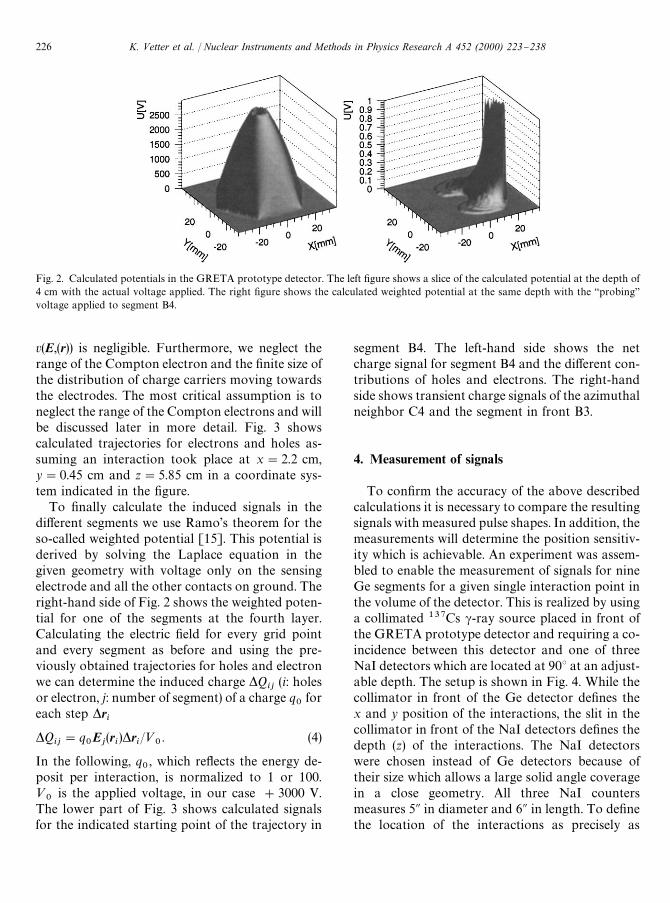
Fig. 2. Calculated potentials in the GRETA prototype detector. The left "gure shows a slice of the calculated potential at the depth of4 cm with the actual voltage applied. The right "gure shows the calculated weighted potential at the same depth with the `probingavoltage applied to segment B4.
v(E,(r)) is negligible. Furthermore, we neglect therange of the Compton electron and the "nite size ofthe distribution of charge carriers moving towardsthe electrodes. The most critical assumption is toneglect the range of the Compton electrons and willbe discussed later in more detail. Fig. 3 showscalculated trajectories for electrons and holes as-suming an interaction took place at x"2.2 cm,y"0.45 cm and z"5.85 cm in a coordinate sys-tem indicated in the "gure.
To "nally calculate the induced signals in thedi!erent segments we use Ramo's theorem for theso-called weighted potential [15]. This potential isderived by solving the Laplace equation in thegiven geometry with voltage only on the sensingelectrode and all the other contacts on ground. Theright-hand side of Fig. 2 shows the weighted poten-tial for one of the segments at the fourth layer.Calculating the electric "eld for every grid pointand every segment as before and using the pre-viously obtained trajectories for holes and electronwe can determine the induced charge *Q
ij(i: holes
or electron, j: number of segment) of a charge q0
foreach step *r
i
*Qij"q
0Ej(ri)*r
i/<
0. (4)
In the following, q0, which re#ects the energy de-
posit per interaction, is normalized to 1 or 100.<
0is the applied voltage, in our case #3000 V.
The lower part of Fig. 3 shows calculated signalsfor the indicated starting point of the trajectory in
segment B4. The left-hand side shows the netcharge signal for segment B4 and the di!erent con-tributions of holes and electrons. The right-handside shows transient charge signals of the azimuthalneighbor C4 and the segment in front B3.
4. Measurement of signals
To con"rm the accuracy of the above describedcalculations it is necessary to compare the resultingsignals with measured pulse shapes. In addition, themeasurements will determine the position sensitiv-ity which is achievable. An experiment was assem-bled to enable the measurement of signals for nineGe segments for a given single interaction point inthe volume of the detector. This is realized by usinga collimated 137Cs c-ray source placed in front ofthe GRETA prototype detector and requiring a co-incidence between this detector and one of threeNaI detectors which are located at 903 at an adjust-able depth. The setup is shown in Fig. 4. While thecollimator in front of the Ge detector de"nes thex and y position of the interactions, the slit in thecollimator in front of the NaI detectors de"nes thedepth (z) of the interactions. The NaI detectorswere chosen instead of Ge detectors because oftheir size which allows a large solid angle coveragein a close geometry. All three NaI countersmeasures 5A in diameter and 6A in length. To de"nethe location of the interactions as precisely as
226 K. Vetter et al. / Nuclear Instruments and Methods in Physics Research A 452 (2000) 223}238
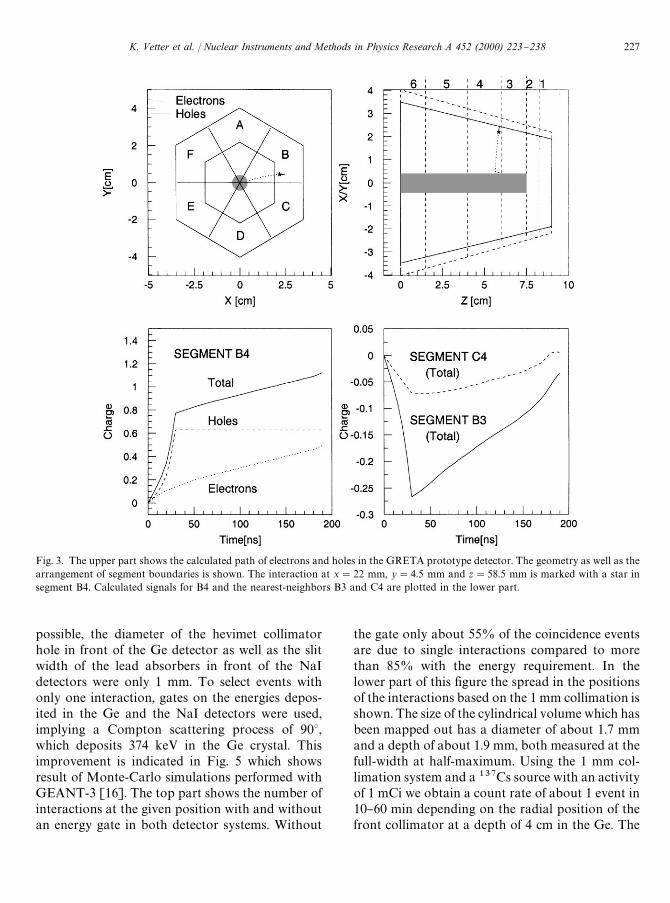
Fig. 3. The upper part shows the calculated path of electrons and holes in the GRETA prototype detector. The geometry as well as thearrangement of segment boundaries is shown. The interaction at x"22 mm, y"4.5 mm and z"58.5 mm is marked with a star insegment B4. Calculated signals for B4 and the nearest-neighbors B3 and C4 are plotted in the lower part.
possible, the diameter of the hevimet collimatorhole in front of the Ge detector as well as the slitwidth of the lead absorbers in front of the NaIdetectors were only 1 mm. To select events withonly one interaction, gates on the energies depos-ited in the Ge and the NaI detectors were used,implying a Compton scattering process of 903,which deposits 374 keV in the Ge crystal. Thisimprovement is indicated in Fig. 5 which showsresult of Monte-Carlo simulations performed withGEANT-3 [16]. The top part shows the number ofinteractions at the given position with and withoutan energy gate in both detector systems. Without
the gate only about 55% of the coincidence eventsare due to single interactions compared to morethan 85% with the energy requirement. In thelower part of this "gure the spread in the positionsof the interactions based on the 1 mm collimation isshown. The size of the cylindrical volume which hasbeen mapped out has a diameter of about 1.7 mmand a depth of about 1.9 mm, both measured at thefull-width at half-maximum. Using the 1 mm col-limation system and a 137Cs source with an activityof 1 mCi we obtain a count rate of about 1 event in10}60 min depending on the radial position of thefront collimator at a depth of 4 cm in the Ge. The
K. Vetter et al. / Nuclear Instruments and Methods in Physics Research A 452 (2000) 223}238 227

Fig. 4. Experimental setup used for the measurements. The upper "gure shows a top view on the coincidence setup and the lower partillustrates a side view of the vertical arrangement of collimation and detector systems.
137Cs source was specially built to have all theactivity in a cylinder with a diameter of 1 mm.Comparing with a source of higher c-ray energy(e.g. 60Co), the advantage of the lower c-ray energyof 137Cs is that the collimators can be shorterproviding a higher count rate.
The signals of nine segments which are arrangedin a 3]3 matrix were taken from the preampli"erinto fast ampli"ers to match the input range of thewave form digitizers. In addition, the preampli"ersignals of the three NaI detectors were also ampli-"ed and fed into the waveform digitizer system.
Each of the 12 channels of the waveform digitizerhas a 500 MHz sampling rate and a purse heightresolution of 8 bits. The collimation system wasarranged to allow the central segment (B4) of the3]3 matrix of segments to contain the interactionresulting in a net charge signal while the 8 neighborsegments observe only the transient image chargesignals. Measured sets of signals of the 9 segmentsare shown in Figs. 6 and 7 at di!erent radii of theinteraction point. The numbering of the segments isthe same as in Fig. 3. For comparison, calculatedsignals at the given positions are plotted as dashed
228 K. Vetter et al. / Nuclear Instruments and Methods in Physics Research A 452 (2000) 223}238
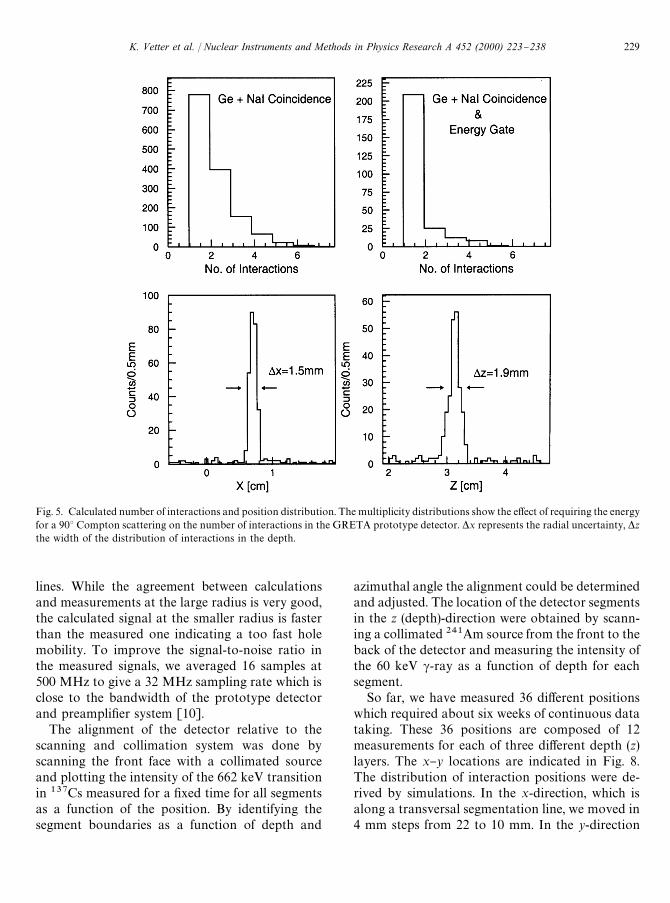
Fig. 5. Calculated number of interactions and position distribution. The multiplicity distributions show the e!ect of requiring the energyfor a 903 Compton scattering on the number of interactions in the GRETA prototype detector. *x represents the radial uncertainty, *zthe width of the distribution of interactions in the depth.
lines. While the agreement between calculationsand measurements at the large radius is very good,the calculated signal at the smaller radius is fasterthan the measured one indicating a too fast holemobility. To improve the signal-to-noise ratio inthe measured signals, we averaged 16 samples at500 MHz to give a 32 MHz sampling rate which isclose to the bandwidth of the prototype detectorand preampli"er system [10].
The alignment of the detector relative to thescanning and collimation system was done byscanning the front face with a collimated sourceand plotting the intensity of the 662 keV transitionin 137Cs measured for a "xed time for all segmentsas a function of the position. By identifying thesegment boundaries as a function of depth and
azimuthal angle the alignment could be determinedand adjusted. The location of the detector segmentsin the z (depth)-direction were obtained by scann-ing a collimated 241Am source from the front to theback of the detector and measuring the intensity ofthe 60 keV c-ray as a function of depth for eachsegment.
So far, we have measured 36 di!erent positionswhich required about six weeks of continuous datataking. These 36 positions are composed of 12measurements for each of three di!erent depth (z)layers. The x}y locations are indicated in Fig. 8.The distribution of interaction positions were de-rived by simulations. In the x-direction, which isalong a transversal segmentation line, we moved in4 mm steps from 22 to 10 mm. In the y-direction
K. Vetter et al. / Nuclear Instruments and Methods in Physics Research A 452 (2000) 223}238 229
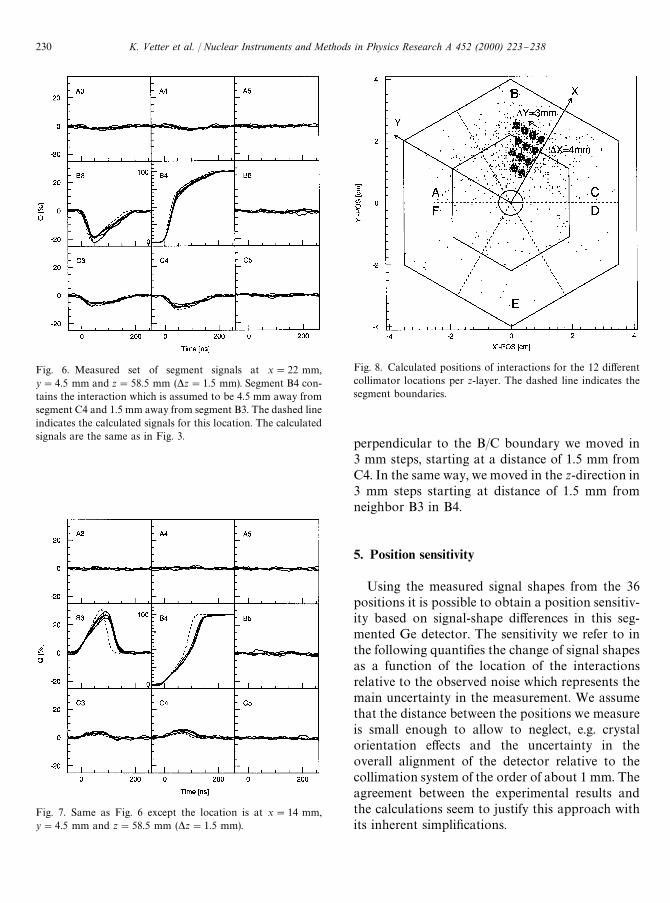
Fig. 6. Measured set of segment signals at x"22 mm,y"4.5 mm and z"58.5 mm (*z"1.5 mm). Segment B4 con-tains the interaction which is assumed to be 4.5 mm away fromsegment C4 and 1.5 mm away from segment B3. The dashed lineindicates the calculated signals for this location. The calculatedsignals are the same as in Fig. 3.
Fig. 7. Same as Fig. 6 except the location is at x"14 mm,y"4.5 mm and z"58.5 mm (*z"1.5 mm).
Fig. 8. Calculated positions of interactions for the 12 di!erentcollimator locations per z-layer. The dashed line indicates thesegment boundaries.
perpendicular to the B/C boundary we moved in3 mm steps, starting at a distance of 1.5 mm fromC4. In the same way, we moved in the z-direction in3 mm steps starting at distance of 1.5 mm fromneighbor B3 in B4.
5. Position sensitivity
Using the measured signal shapes from the 36positions it is possible to obtain a position sensitiv-ity based on signal-shape di!erences in this seg-mented Ge detector. The sensitivity we refer to inthe following quanti"es the change of signal shapesas a function of the location of the interactionsrelative to the observed noise which represents themain uncertainty in the measurement. We assumethat the distance between the positions we measureis small enough to allow to neglect, e.g. crystalorientation e!ects and the uncertainty in theoverall alignment of the detector relative to thecollimation system of the order of about 1 mm. Theagreement between the experimental results andthe calculations seem to justify this approach withits inherent simpli"cations.
230 K. Vetter et al. / Nuclear Instruments and Methods in Physics Research A 452 (2000) 223}238
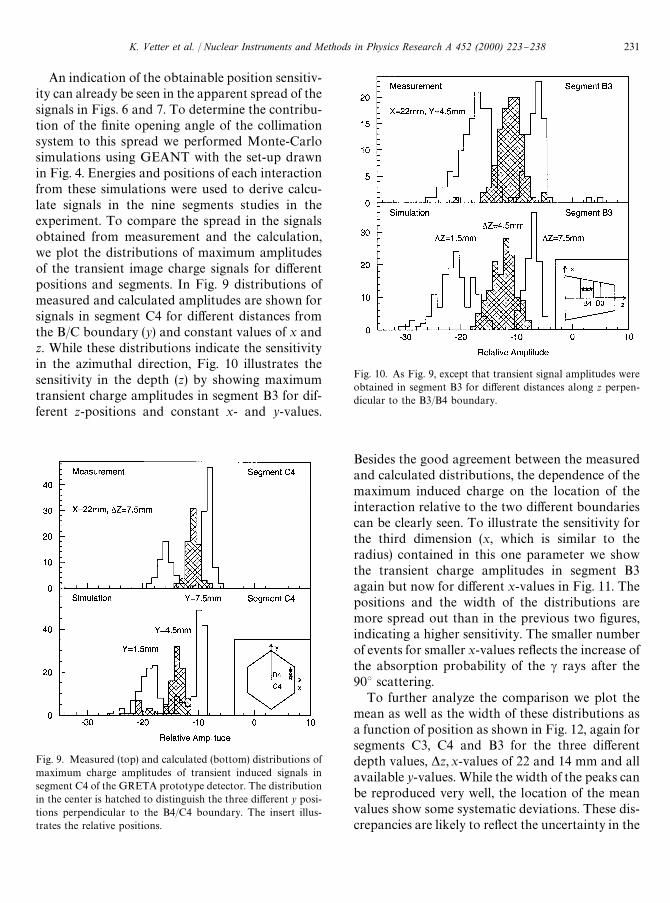
Fig. 9. Measured (top) and calculated (bottom) distributions ofmaximum charge amplitudes of transient induced signals insegment C4 of the GRETA prototype detector. The distributionin the center is hatched to distinguish the three di!erent y posi-tions perpendicular to the B4/C4 boundary. The insert illus-trates the relative positions.
Fig. 10. As Fig. 9, except that transient signal amplitudes wereobtained in segment B3 for di!erent distances along z perpen-dicular to the B3/B4 boundary.
An indication of the obtainable position sensitiv-ity can already be seen in the apparent spread of thesignals in Figs. 6 and 7. To determine the contribu-tion of the "nite opening angle of the collimationsystem to this spread we performed Monte-Carlosimulations using GEANT with the set-up drawnin Fig. 4. Energies and positions of each interactionfrom these simulations were used to derive calcu-late signals in the nine segments studies in theexperiment. To compare the spread in the signalsobtained from measurement and the calculation,we plot the distributions of maximum amplitudesof the transient image charge signals for di!erentpositions and segments. In Fig. 9 distributions ofmeasured and calculated amplitudes are shown forsignals in segment C4 for di!erent distances fromthe B/C boundary (y) and constant values of x andz. While these distributions indicate the sensitivityin the azimuthal direction, Fig. 10 illustrates thesensitivity in the depth (z) by showing maximumtransient charge amplitudes in segment B3 for dif-ferent z-positions and constant x- and y-values.
Besides the good agreement between the measuredand calculated distributions, the dependence of themaximum induced charge on the location of theinteraction relative to the two di!erent boundariescan be clearly seen. To illustrate the sensitivity forthe third dimension (x, which is similar to theradius) contained in this one parameter we showthe transient charge amplitudes in segment B3again but now for di!erent x-values in Fig. 11. Thepositions and the width of the distributions aremore spread out than in the previous two "gures,indicating a higher sensitivity. The smaller numberof events for smaller x-values re#ects the increase ofthe absorption probability of the c rays after the903 scattering.
To further analyze the comparison we plot themean as well as the width of these distributions asa function of position as shown in Fig. 12, again forsegments C3, C4 and B3 for the three di!erentdepth values, *z,x-values of 22 and 14 mm and allavailable y-values. While the width of the peaks canbe reproduced very well, the location of the meanvalues show some systematic deviations. These dis-crepancies are likely to re#ect the uncertainty in the
K. Vetter et al. / Nuclear Instruments and Methods in Physics Research A 452 (2000) 223}238 231
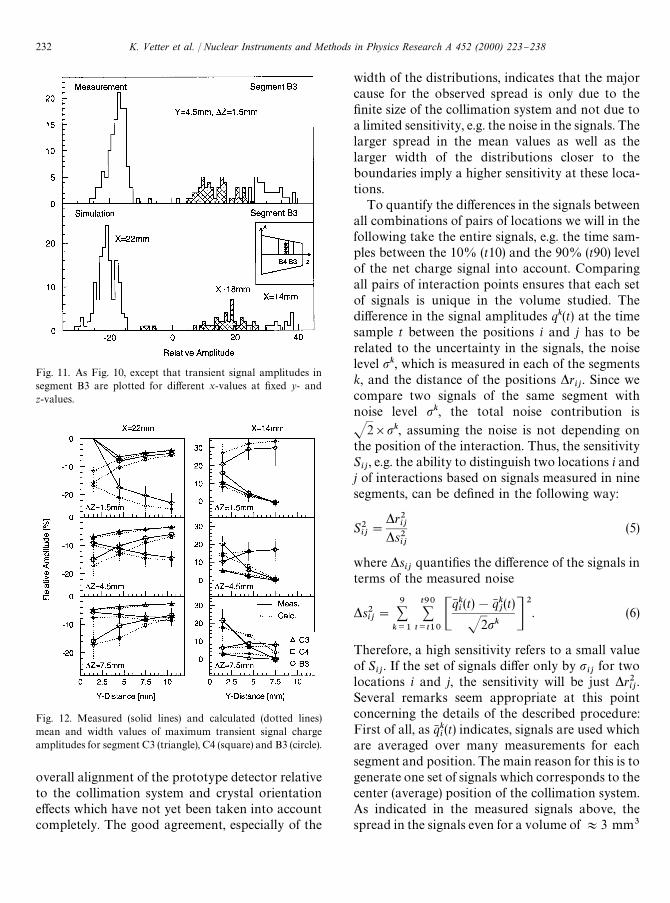
Fig. 11. As Fig. 10, except that transient signal amplitudes insegment B3 are plotted for di!erent x-values at "xed y- andz-values.
Fig. 12. Measured (solid lines) and calculated (dotted lines)mean and width values of maximum transient signal chargeamplitudes for segment C3 (triangle), C4 (square) and B3 (circle).
overall alignment of the prototype detector relativeto the collimation system and crystal orientatione!ects which have not yet been taken into accountcompletely. The good agreement, especially of the
width of the distributions, indicates that the majorcause for the observed spread is only due to the"nite size of the collimation system and not due toa limited sensitivity, e.g. the noise in the signals. Thelarger spread in the mean values as well as thelarger width of the distributions closer to theboundaries imply a higher sensitivity at these loca-tions.
To quantify the di!erences in the signals betweenall combinations of pairs of locations we will in thefollowing take the entire signals, e.g. the time sam-ples between the 10% (t10) and the 90% (t90) levelof the net charge signal into account. Comparingall pairs of interaction points ensures that each setof signals is unique in the volume studied. Thedi!erence in the signal amplitudes qk(t) at the timesample t between the positions i and j has to berelated to the uncertainty in the signals, the noiselevel pk, which is measured in each of the segmentsk, and the distance of the positions *r
ij. Since we
compare two signals of the same segment withnoise level pk, the total noise contribution is
J2]pk, assuming the noise is not depending onthe position of the interaction. Thus, the sensitivitySij, e.g. the ability to distinguish two locations i and
j of interactions based on signals measured in ninesegments, can be de"ned in the following way:
S2ij"
*r2ij
*s2ij
(5)
where *sij
quanti"es the di!erence of the signals interms of the measured noise
*s2ij"
9+k/1
t90+
t/t10Cq6 ki(t)!q6 k
j(t)
J2pk D2. (6)
Therefore, a high sensitivity refers to a small valueof S
ij. If the set of signals di!er only by p
ijfor two
locations i and j, the sensitivity will be just *r2ij.
Several remarks seem appropriate at this pointconcerning the details of the described procedure:First of all, as q6 k
i(t) indicates, signals are used which
are averaged over many measurements for eachsegment and position. The main reason for this is togenerate one set of signals which corresponds to thecenter (average) position of the collimation system.As indicated in the measured signals above, thespread in the signals even for a volume of +3 mm3
232 K. Vetter et al. / Nuclear Instruments and Methods in Physics Research A 452 (2000) 223}238
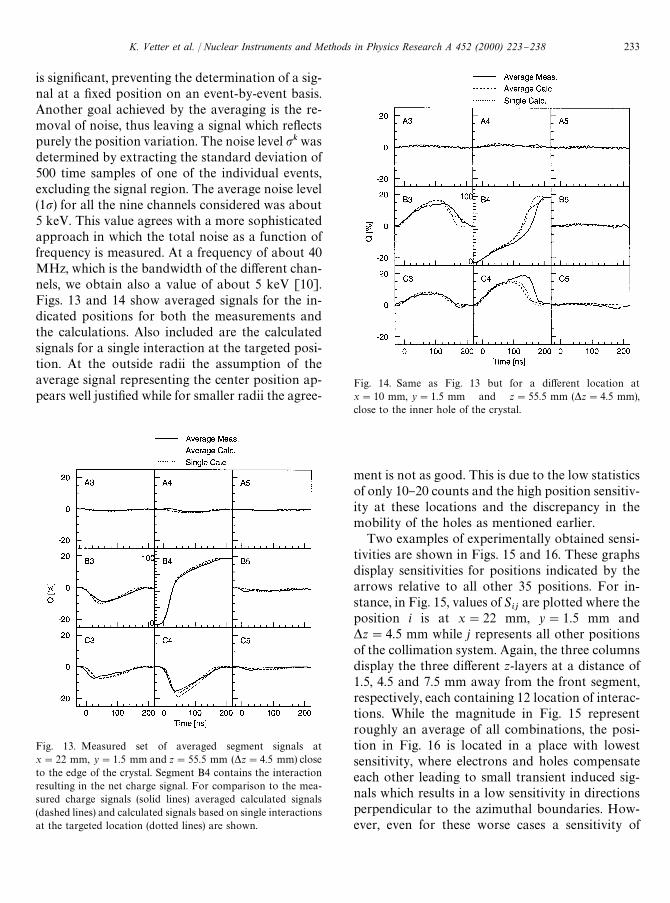
Fig. 13. Measured set of averaged segment signals atx"22 mm, y"1.5 mm and z"55.5 mm (*z"4.5 mm) closeto the edge of the crystal. Segment B4 contains the interactionresulting in the net charge signal. For comparison to the mea-sured charge signals (solid lines) averaged calculated signals(dashed lines) and calculated signals based on single interactionsat the targeted location (dotted lines) are shown.
Fig. 14. Same as Fig. 13 but for a di!erent location atx"10 mm, y"1.5 mm and z"55.5 mm (*z"4.5 mm),close to the inner hole of the crystal.
is signi"cant, preventing the determination of a sig-nal at a "xed position on an event-by-event basis.Another goal achieved by the averaging is the re-moval of noise, thus leaving a signal which re#ectspurely the position variation. The noise level pk wasdetermined by extracting the standard deviation of500 time samples of one of the individual events,excluding the signal region. The average noise level(1p) for all the nine channels considered was about5 keV. This value agrees with a more sophisticatedapproach in which the total noise as a function offrequency is measured. At a frequency of about 40MHz, which is the bandwidth of the di!erent chan-nels, we obtain also a value of about 5 keV [10].Figs. 13 and 14 show averaged signals for the in-dicated positions for both the measurements andthe calculations. Also included are the calculatedsignals for a single interaction at the targeted posi-tion. At the outside radii the assumption of theaverage signal representing the center position ap-pears well justi"ed while for smaller radii the agree-
ment is not as good. This is due to the low statisticsof only 10}20 counts and the high position sensitiv-ity at these locations and the discrepancy in themobility of the holes as mentioned earlier.
Two examples of experimentally obtained sensi-tivities are shown in Figs. 15 and 16. These graphsdisplay sensitivities for positions indicated by thearrows relative to all other 35 positions. For in-stance, in Fig. 15, values of S
ijare plotted where the
position i is at x"22 mm, y"1.5 mm and*z"4.5 mm while j represents all other positionsof the collimation system. Again, the three columnsdisplay the three di!erent z-layers at a distance of1.5, 4.5 and 7.5 mm away from the front segment,respectively, each containing 12 location of interac-tions. While the magnitude in Fig. 15 representroughly an average of all combinations, the posi-tion in Fig. 16 is located in a place with lowestsensitivity, where electrons and holes compensateeach other leading to small transient induced sig-nals which results in a low sensitivity in directionsperpendicular to the azimuthal boundaries. How-ever, even for these worse cases a sensitivity of
K. Vetter et al. / Nuclear Instruments and Methods in Physics Research A 452 (2000) 223}238 233
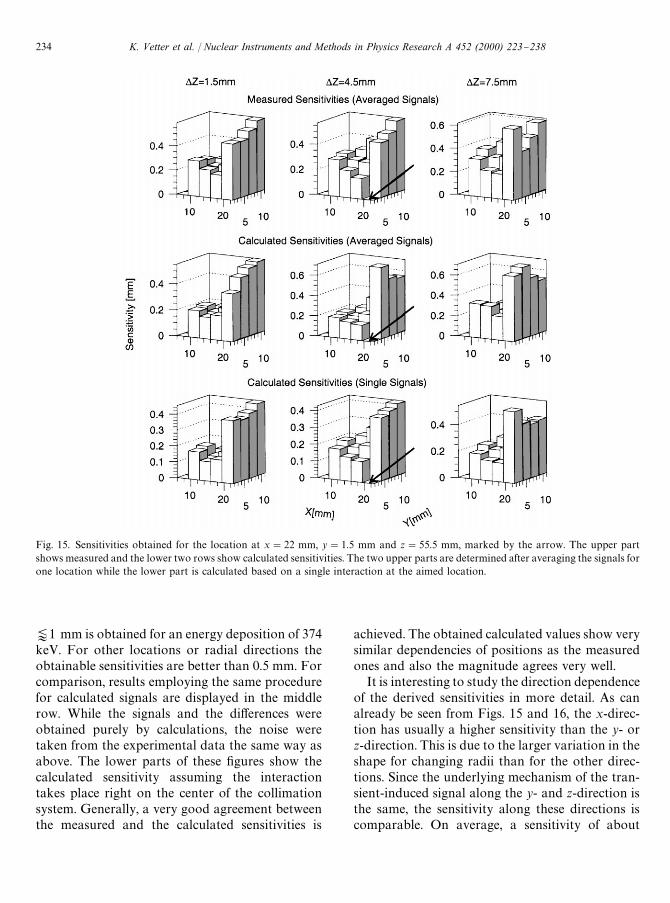
Fig. 15. Sensitivities obtained for the location at x"22 mm, y"1.5 mm and z"55.5 mm, marked by the arrow. The upper partshows measured and the lower two rows show calculated sensitivities. The two upper parts are determined after averaging the signals forone location while the lower part is calculated based on a single interaction at the aimed location.
~1 mm is obtained for an energy deposition of 374keV. For other locations or radial directions theobtainable sensitivities are better than 0.5 mm. Forcomparison, results employing the same procedurefor calculated signals are displayed in the middlerow. While the signals and the di!erences wereobtained purely by calculations, the noise weretaken from the experimental data the same way asabove. The lower parts of these "gures show thecalculated sensitivity assuming the interactiontakes place right on the center of the collimationsystem. Generally, a very good agreement betweenthe measured and the calculated sensitivities is
achieved. The obtained calculated values show verysimilar dependencies of positions as the measuredones and also the magnitude agrees very well.
It is interesting to study the direction dependenceof the derived sensitivities in more detail. As canalready be seen from Figs. 15 and 16, the x-direc-tion has usually a higher sensitivity than the y- orz-direction. This is due to the larger variation in theshape for changing radii than for the other direc-tions. Since the underlying mechanism of the tran-sient-induced signal along the y- and z-direction isthe same, the sensitivity along these directions iscomparable. On average, a sensitivity of about
234 K. Vetter et al. / Nuclear Instruments and Methods in Physics Research A 452 (2000) 223}238
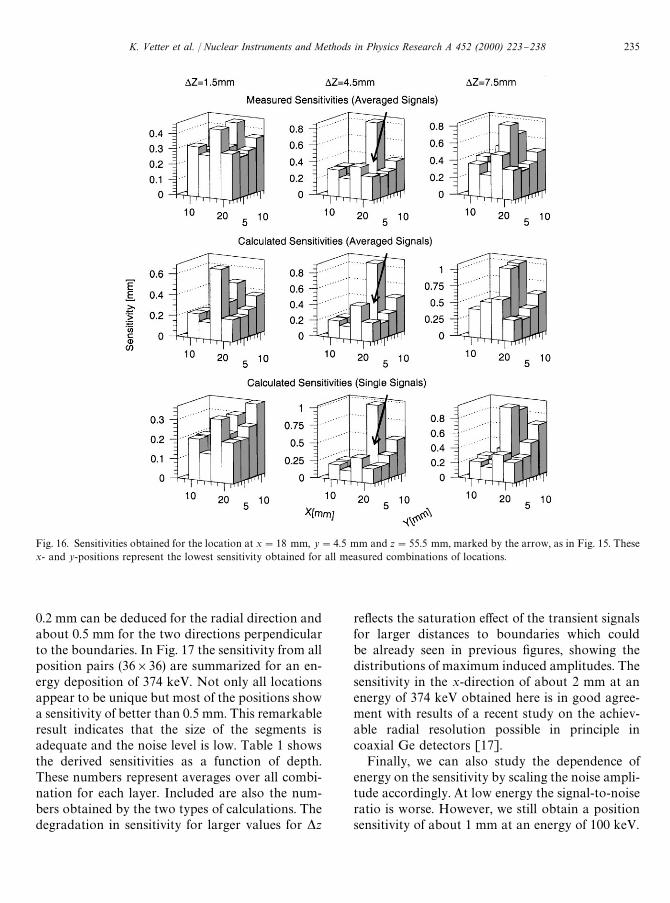
Fig. 16. Sensitivities obtained for the location at x"18 mm, y"4.5 mm and z"55.5 mm, marked by the arrow, as in Fig. 15. Thesex- and y-positions represent the lowest sensitivity obtained for all measured combinations of locations.
0.2 mm can be deduced for the radial direction andabout 0.5 mm for the two directions perpendicularto the boundaries. In Fig. 17 the sensitivity from allposition pairs (36]36) are summarized for an en-ergy deposition of 374 keV. Not only all locationsappear to be unique but most of the positions showa sensitivity of better than 0.5 mm. This remarkableresult indicates that the size of the segments isadequate and the noise level is low. Table 1 showsthe derived sensitivities as a function of depth.These numbers represent averages over all combi-nation for each layer. Included are also the num-bers obtained by the two types of calculations. Thedegradation in sensitivity for larger values for *z
re#ects the saturation e!ect of the transient signalsfor larger distances to boundaries which couldbe already seen in previous "gures, showing thedistributions of maximum induced amplitudes. Thesensitivity in the x-direction of about 2 mm at anenergy of 374 keV obtained here is in good agree-ment with results of a recent study on the achiev-able radial resolution possible in principle incoaxial Ge detectors [17].
Finally, we can also study the dependence ofenergy on the sensitivity by scaling the noise ampli-tude accordingly. At low energy the signal-to-noiseratio is worse. However, we still obtain a positionsensitivity of about 1 mm at an energy of 100 keV.
K. Vetter et al. / Nuclear Instruments and Methods in Physics Research A 452 (2000) 223}238 235
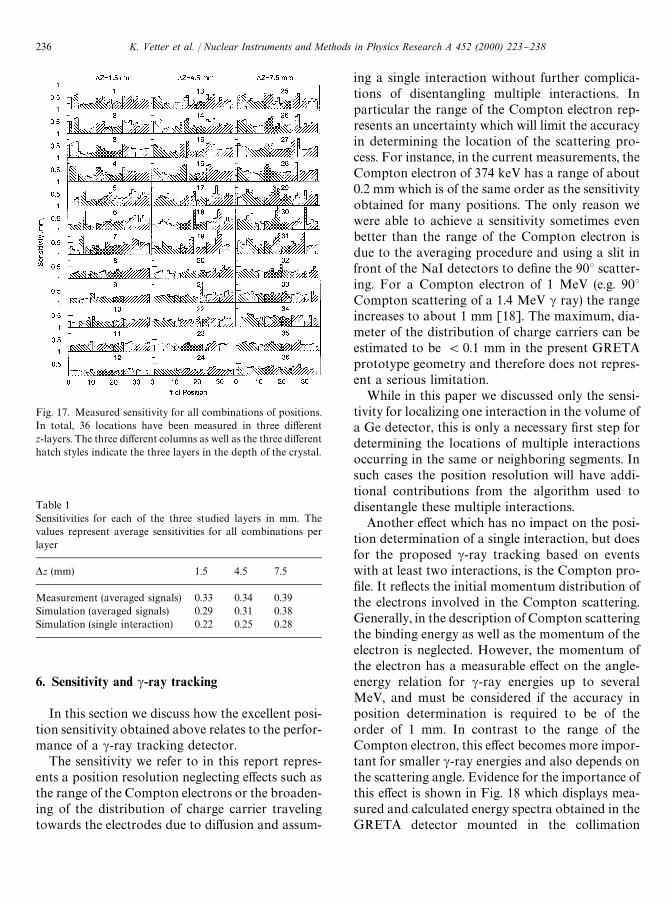
Fig. 17. Measured sensitivity for all combinations of positions.In total, 36 locations have been measured in three di!erentz-layers. The three di!erent columns as well as the three di!erenthatch styles indicate the three layers in the depth of the crystal.
Table 1Sensitivities for each of the three studied layers in mm. Thevalues represent average sensitivities for all combinations perlayer
*z (mm) 1.5 4.5 7.5
Measurement (averaged signals) 0.33 0.34 0.39Simulation (averaged signals) 0.29 0.31 0.38Simulation (single interaction) 0.22 0.25 0.28
6. Sensitivity and c-ray tracking
In this section we discuss how the excellent posi-tion sensitivity obtained above relates to the perfor-mance of a c-ray tracking detector.
The sensitivity we refer to in this report repres-ents a position resolution neglecting e!ects such asthe range of the Compton electrons or the broaden-ing of the distribution of charge carrier travelingtowards the electrodes due to di!usion and assum-
ing a single interaction without further complica-tions of disentangling multiple interactions. Inparticular the range of the Compton electron rep-resents an uncertainty which will limit the accuracyin determining the location of the scattering pro-cess. For instance, in the current measurements, theCompton electron of 374 keV has a range of about0.2 mm which is of the same order as the sensitivityobtained for many positions. The only reason wewere able to achieve a sensitivity sometimes evenbetter than the range of the Compton electron isdue to the averaging procedure and using a slit infront of the NaI detectors to de"ne the 903 scatter-ing. For a Compton electron of 1 MeV (e.g. 903Compton scattering of a 1.4 MeV c ray) the rangeincreases to about 1 mm [18]. The maximum, dia-meter of the distribution of charge carriers can beestimated to be (0.1 mm in the present GRETAprototype geometry and therefore does not repres-ent a serious limitation.
While in this paper we discussed only the sensi-tivity for localizing one interaction in the volume ofa Ge detector, this is only a necessary "rst step fordetermining the locations of multiple interactionsoccurring in the same or neighboring segments. Insuch cases the position resolution will have addi-tional contributions from the algorithm used todisentangle these multiple interactions.
Another e!ect which has no impact on the posi-tion determination of a single interaction, but doesfor the proposed c-ray tracking based on eventswith at least two interactions, is the Compton pro-"le. It re#ects the initial momentum distribution ofthe electrons involved in the Compton scattering.Generally, in the description of Compton scatteringthe binding energy as well as the momentum of theelectron is neglected. However, the momentum ofthe electron has a measurable e!ect on the angle-energy relation for c-ray energies up to severalMeV, and must be considered if the accuracy inposition determination is required to be of theorder of 1 mm. In contrast to the range of theCompton electron, this e!ect becomes more impor-tant for smaller c-ray energies and also depends onthe scattering angle. Evidence for the importance ofthis e!ect is shown in Fig. 18 which displays mea-sured and calculated energy spectra obtained in theGRETA detector mounted in the collimation
236 K. Vetter et al. / Nuclear Instruments and Methods in Physics Research A 452 (2000) 223}238
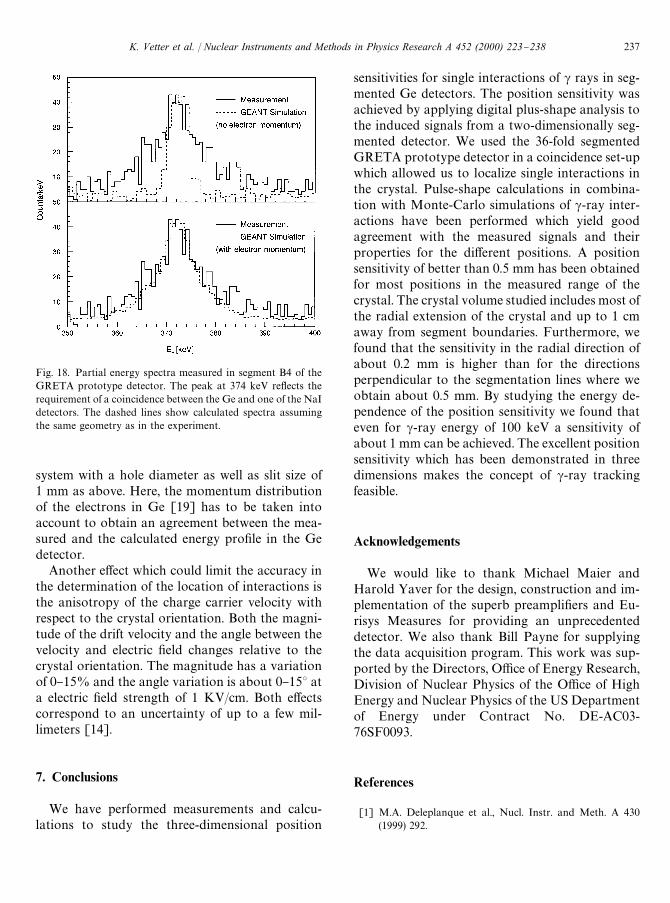
Fig. 18. Partial energy spectra measured in segment B4 of theGRETA prototype detector. The peak at 374 keV re#ects therequirement of a coincidence between the Ge and one of the NaIdetectors. The dashed lines show calculated spectra assumingthe same geometry as in the experiment.
system with a hole diameter as well as slit size of1 mm as above. Here, the momentum distributionof the electrons in Ge [19] has to be taken intoaccount to obtain an agreement between the mea-sured and the calculated energy pro"le in the Gedetector.
Another e!ect which could limit the accuracy inthe determination of the location of interactions isthe anisotropy of the charge carrier velocity withrespect to the crystal orientation. Both the magni-tude of the drift velocity and the angle between thevelocity and electric "eld changes relative to thecrystal orientation. The magnitude has a variationof 0}15% and the angle variation is about 0}153 ata electric "eld strength of 1 KV/cm. Both e!ectscorrespond to an uncertainty of up to a few mil-limeters [14].
7. Conclusions
We have performed measurements and calcu-lations to study the three-dimensional position
sensitivities for single interactions of c rays in seg-mented Ge detectors. The position sensitivity wasachieved by applying digital plus-shape analysis tothe induced signals from a two-dimensionally seg-mented detector. We used the 36-fold segmentedGRETA prototype detector in a coincidence set-upwhich allowed us to localize single interactions inthe crystal. Pulse-shape calculations in combina-tion with Monte-Carlo simulations of c-ray inter-actions have been performed which yield goodagreement with the measured signals and theirproperties for the di!erent positions. A positionsensitivity of better than 0.5 mm has been obtainedfor most positions in the measured range of thecrystal. The crystal volume studied includes most ofthe radial extension of the crystal and up to 1 cmaway from segment boundaries. Furthermore, wefound that the sensitivity in the radial direction ofabout 0.2 mm is higher than for the directionsperpendicular to the segmentation lines where weobtain about 0.5 mm. By studying the energy de-pendence of the position sensitivity we found thateven for c-ray energy of 100 keV a sensitivity ofabout 1 mm can be achieved. The excellent positionsensitivity which has been demonstrated in threedimensions makes the concept of c-ray trackingfeasible.
Acknowledgements
We would like to thank Michael Maier andHarold Yaver for the design, construction and im-plementation of the superb preampli"ers and Eu-risys Measures for providing an unprecedenteddetector. We also thank Bill Payne for supplyingthe data acquisition program. This work was sup-ported by the Directors, O$ce of Energy Research,Division of Nuclear Physics of the O$ce of HighEnergy and Nuclear Physics of the US Departmentof Energy under Contract No. DE-AC03-76SF0093.
References
[1] M.A. Deleplanque et al., Nucl. Instr. and Meth. A 430(1999) 292.
K. Vetter et al. / Nuclear Instruments and Methods in Physics Research A 452 (2000) 223}238 237
[2] G.J. Schmid et al., Nucl. Instr. and Meth. A 430 (1999) 69.[3] W. Gast et al., Nucl. Instr. and Meth. A 171 (1980) 49.[4] B. Hubbard-Nelson et al., Nucl. Instr. and Meth. A 422
(1999) 411.[5] B. Philour et al., Nucl. Instr. and Meth. A 403 (1998)
136.[6] G.J. Schmid et al., Nucl. Instr. and Meth. A 422 (1999)
368.[7] Th. KroK ll et al., Nucl. Instr. and Meth. A 371 (1996) 489.[8] J. Eberth et al., Nucl. Instr. and Meth. A 369 (1996) 135.[9] M.R. Maier et al., Proceedings of the IEEE Symposium on
Nuclear Science, Seattle, October 1999, IEEE Trans. Nucl.Sci., accepted.
[10] K. Vetter et al., Nucl. Instr. and Meth. A 452 (2000) 105.
[11] G. Ottaviani, C. Canali, A. Alberigi Quaranta, IEEETrans. Nucl. Sci. NS-22 (1975) 192.
[12] L. Reggiani, C. Canali, F. Nava, G. Ottaviani, Phys. Rev.B 16 (1977) 2781.
[13] W. Sasazaki, M. Shibuya, J. Phys. Soc. Japan 11 (1956) 1202.[14] K. Vetter et al., Nucl. Instr. and Meth. A (2000), in prepara-
tion.[15] S. Ramo, Proc. IRE 27 (1939) 584.[16] GEANT3, Detector Description and Simulation Tool,
CERN, Geneva, 1993.[17] J. Blair et al., Nucl. Instr. and Meth. A 422 (1999) 331.[18] T. Mukoyama, Nucl. Instr. and Meth. A 134 (1976) 125.[19] F. Briggs et al., Atomic data nuclear data tables 16 (1975)
201.
238 K. Vetter et al. / Nuclear Instruments and Methods in Physics Research A 452 (2000) 223}238