Embed Size (px)
Citation preview
Three-dimensional finite element thermal analysis in selective laser melting of Al-Al2O3
powder
Quanquan Han, Rossitza Setchi, Sam L. Evans and Chunlei Qiu
School of Engineering, Cardiff University, Cardiff, CF24 3AA, UK
Abstract
The selective laser melting (SLM) of aluminium-based composites continues to be a
challenge due to the high reflectivity, high thermal conductivity and oxidation of aluminium, all
of which directly influence the thermal performance of each layer during SLM. Due to the
extremely rapid melting and cooling rate of aluminium, however, it is difficult to measure thermal
performance within practical SLM applications. A three-dimensional finite element simulation
model is thus developed in this study to simulate the transient temperature distribution and molten
pool dimensions of the premier layer during the SLM of Al-Al2O3 composite powder. In order to
produce high-quality parts with minimum defects in a highly efficient manner, the predicted
optimum volumetric energy density is found to be 40 J/mm3, with laser power 300 W, scanning
speed 1000 mm/s, hatch spacing 150 μm and layer thickness 50 μm; the molten pool size that is
produced is 165 μm in length, 160 μm in width and 77 μm in depth, with a predicted maximum
temperature of around 3400°C. All of these factors may contribute to the creation of good
metallurgic bonding.
Introduction
One of the main advantages of selective laser melting (SLM) is that the technique provides
an integrated way of manufacturing three-dimensional metallic components from computer-aided
design files using a layer-by-layer principle [1]. It also shows potential in the fabrication of
advanced engineering components in order to meet the demanding requirements of the aerospace,
automotive and biomedical industries [2].
Due to its light weight, high specific strength and good corrosion resistance, aluminium is
widely used in various domains, including within the automotive and aerospace industries [3].
Several studies have been conducted on the SLM of aluminium alloys [4]. In comparison with
aluminium alloys, aluminium based composites exhibit better mechanical strength, wear resistance
131
Solid Freeform Fabrication 2016: Proceedings of the 27th Annual International Solid Freeform Fabrication Symposium – An Additive Manufacturing Conference
Reviewed Paper
Solid Freeform Fabrication 2016: Proceedings of the 27th Annual International
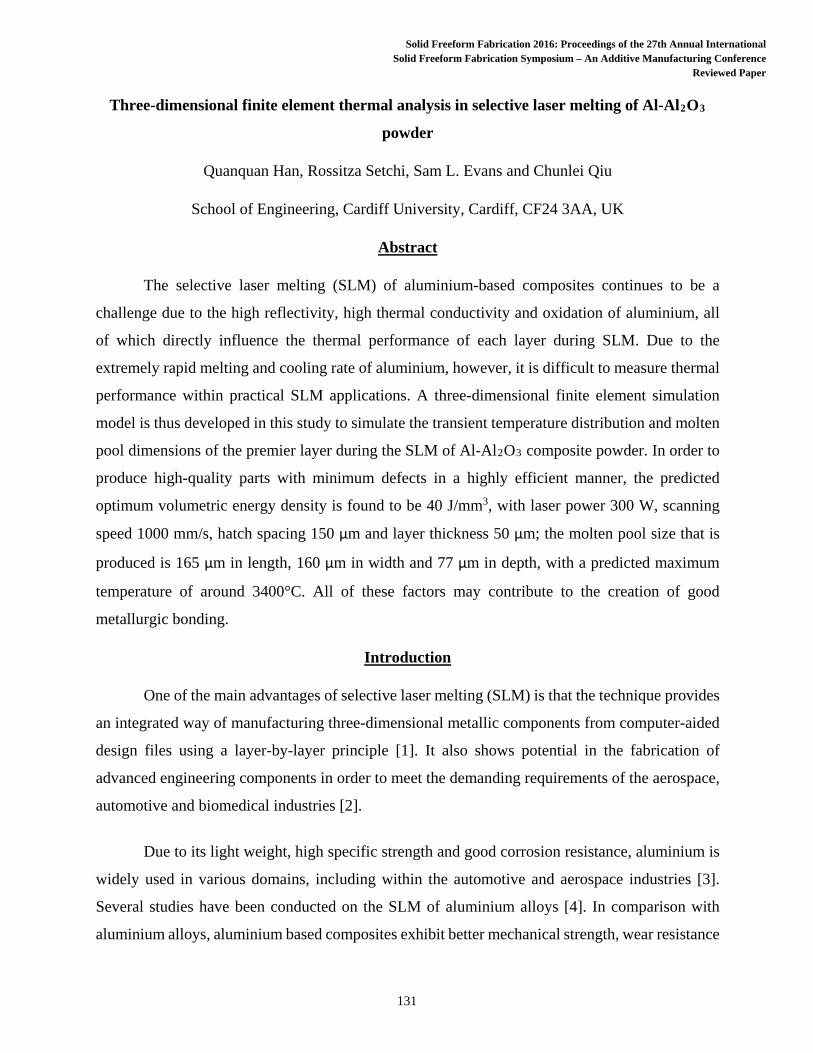
and high temperature properties; the SLM of Al-Al2O3 nanocomposites is currently used in new
applications within the automotive and aerospace industries [5]. The quality of the parts produced
via SLM generally depends on the temperature distribution under various operating parameters,
such as laser power, scanning speed, hatch spacing and scanning strategy [6]. In order to obtain
the desired SLM components, further research is thus required to explore the relationship between
process parameters and thermal behaviour during SLM [7]. It is difficult to measure thermal
performance within practical SLM applications, however, due to the extremely rapid melting and
cooling rate; researcher therefore consider numerical simulation to be a suitable approach for
exploring these issues.
This paper explores the thermal behaviour within a scan of the premier layer’s Al-Al2O3
nanocomposites through the numerical simulation approach. It is important to scan the premier
layer, as doing so not only determines the subsequent layers’ coating behaviour but also affects the
dimensional accuracy and mechanical properties of the final parts. The properties of a part
produced by this process therefore depend strongly on the quality of the premier layer, as that layer
determines the nature and shape of the molten pool. Gaining an understanding of the thermal
behaviour during the scanning of the premier layer is crucial for engineers in order to optimise the
laser strategy and to improve component quality using SLM technology.
This paper thus has two objectives: first, to develop a three-dimensional finite element
model for the scanning of the premier layer’s Al-Al2O3 powder, and second, to employ different
combinations of process parameters (such as laser power and scanning speed) to predict thermal
behaviour and to explore the optimum volumetric energy density for fabricating high-quality
components.
Related work
Researchers have employed finite element analysis (FEA), one of the most widely used
numerical methods in use today, for temperature field analysis of various additive layer
manufacturing processes. In early papers, Childs [8] investigated the influence of process
parameters on the mass of melted single layers in SLM and found that an increase in scanning
speed resulted in a larger melted mass. Matsumoto et al. [9] proposed a method for calculating the
132

distribution of temperature and stress in the SLM of single metallic layers; they found that the solid
layer on the powder bed warped due to heating and cooling while the laser travelled on the track.
When the neighbouring track began to solidify, large tensile stresses occurred at the side end of
the solid part. Dai and Shaw [10] investigated the effect of the laser scanning strategy on residual
stress and distortion and found that a scanning pattern with frequent 90° changes in the scanning
direction at every turn could lead to a reduction of concave upwards and downwards distortions.
More recently, Hussein et al. [11] developed a transient finite element model for the
analysis of temperature and stress fields in single layers built without support in SLM. They found
that the predicted length of the molten pool increased at higher scanning speeds, while both the
width and depth of the molten pool decreased. Li and Gu [12] analysed thermal behaviour during
the SLM of aluminium alloy powders and obtained the optimum molten pool width (111.4 μm)
and depth (67.5 μm) for a specific combination of parameters (laser power 250 W and scan speed
200 mm/s). Roberts et al. [13] employed an element birth-and-death strategy to analyse the 3D
temperature field in multiple layers within a powder bed. Similar studies have explored the
behaviour of other materials during SLM. For example, Kolossov et al. [14] proposed a 3D finite
element model to predict the temperature distribution on the top surface of a titanium powder bed
during the laser sintering process; their studies showed that changes in thermal conductivity
determined the behaviour and development of thermal processes. In addition, Patil and Yadava [1]
investigated the temperature distribution in a single metallic powder layer during metal laser
sintering and found that temperature increased with increases in laser power and laser on-time, but
decreased with increases in laser off-time and hatch spacing.
A basic heat transfer model consists primarily of a heat source module and a thermal
physics module. The fibre laser (Nd: YAG, λ=1.06 μm) employed in the SLM process normally
operates in continuous-wave mode. The heat flux I(r) follows a Gaussian distribution and can be
expressed as [11]:
𝐼𝐼(𝑟𝑟) = 2𝐴𝐴𝐴𝐴𝜋𝜋𝑟𝑟02
exp (−2𝑟𝑟2
𝑟𝑟02) (1)
where A is absorptivity, P and r are laser power and radial distance from the laser centre,
respectively, and r0 denotes the laser spot radius.
133
The absorptivity of a composite powder containing n components can be calculated using
the following equation [15]:
𝐴𝐴 = ∑ 𝐴𝐴𝑖𝑖𝛾𝛾𝑖𝑖𝑛𝑛𝑖𝑖=1 (2)
where Ai and γi denote the absorptivity and volume fraction of a component, respectively.
Tolochko et al. [15] measured the absorptivity of Al2O3 powder to be 3% under a pulsed Nd-YAG
laser (λ=1.06μm pulse duration of 5ms, repetition rate up to 20Hz, energy content per pulse up to
20J) . In the present work, the nanocomposite powder was composed of 96 vol.% Al and 4 vol.%
Al2O3 powder. Before the laser melting process, the employed aluminium plate was preheated to
150°C (423K) to reduce the thermal distortion of the final parts; thus, considering the porosity of
the powder bed, the temperature of the powder bed could be around 90°C. The corresponding
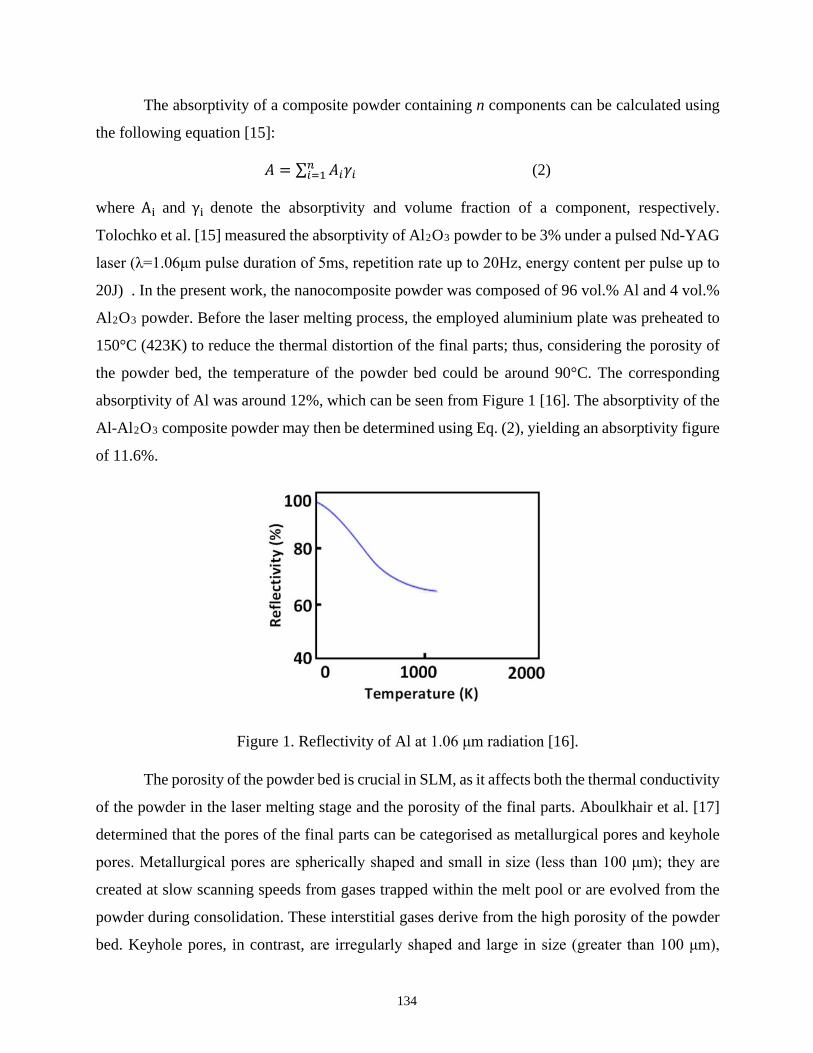
absorptivity of Al was around 12%, which can be seen from Figure 1 [16]. The absorptivity of the
Al-Al2O3 composite powder may then be determined using Eq. (2), yielding an absorptivity figure
of 11.6%.
Figure 1. Reflectivity of Al at 1.06 μm radiation [16].
The porosity of the powder bed is crucial in SLM, as it affects both the thermal conductivity
of the powder in the laser melting stage and the porosity of the final parts. Aboulkhair et al. [17]
determined that the pores of the final parts can be categorised as metallurgical pores and keyhole
pores. Metallurgical pores are spherically shaped and small in size (less than 100 μm); they are
created at slow scanning speeds from gases trapped within the melt pool or are evolved from the
powder during consolidation. These interstitial gases derive from the high porosity of the powder
bed. Keyhole pores, in contrast, are irregularly shaped and large in size (greater than 100 μm),
134
which can be attributed to the rapid solidification of the metal without the complete filling of gaps
with molten metal. Oxidation-caused pores can be classified as keyhole pores, because when a thin
film meets another film, few non-melted powders will be trapped. The content of the metallurgical
pores also decreases with an increase in the scanning speed, while keyhole pores increase as the
scanning speed exceeds a critical speed. In general, the formation of metallurgical pores can be
partially attributed to the powder bed porosity (φ) and can be expressed as [12]:
𝜑𝜑 = 1 − 𝜌𝜌𝑝𝑝𝜌𝜌𝑏𝑏
(3)
where ρp and ρb represent the density of powder and bulk materials, respectively. The density of
the bulk composite material can be calculated using the following equation:
𝜌𝜌𝑏𝑏 = ∑ 𝜌𝜌𝑖𝑖𝛾𝛾𝑖𝑖𝑛𝑛𝑖𝑖=1 (4)
Where ρi and γi denote the density and volume, respectively, of component i. The density ρb of
2.75 g/cm3 is found when the composite powder comprises 96 vol.% Al and 4 vol.% Al2O3. The
density of the powder 𝜌𝜌𝑝𝑝 can be evaluated by the apparent density, which is roughly 1.65 g/cm3.
Thus, the porosity of the powder bed is calculated to be 40%, which is in agreement with the
findings of Dong et al. [18], who suggested that the porosity can evolve from 50% (initial powder
bed) to the minimum value of 0 (fully dense material) during the laser sintering process.
Using a thermal physics module is necessary because SLM involves a phase-change
process; this type of thermal analysis is thus a nonlinear transient analysis and a number of
thermophysical properties should be determined for the ANSYS simulation. In order to analyse the
phase transformation, the latent heat should be considered: this represents the heat energy that the
system stores or releases during a phase change. To account for latent heat, the enthalpy of the
material H as a function of the temperature is defined: it is the integral of material density 𝑝𝑝 times
specific heat 𝑐𝑐(𝑇𝑇) with respect to temperature T:
𝐻𝐻 = ∫𝑝𝑝𝑐𝑐(𝑇𝑇)𝑑𝑑𝑇𝑇 (5)
Other thermophysical properties to consider include the density and thermal conductivity
of the aluminium powder bed, which can be expressed as [19]:
𝑘𝑘𝑝𝑝 = 𝑘𝑘𝑏𝑏(1 − 𝜑𝜑) (6)
135
where 𝑘𝑘𝑝𝑝 and 𝑘𝑘𝑏𝑏 denote the thermal conductivity of the powder bed and bulk materials,
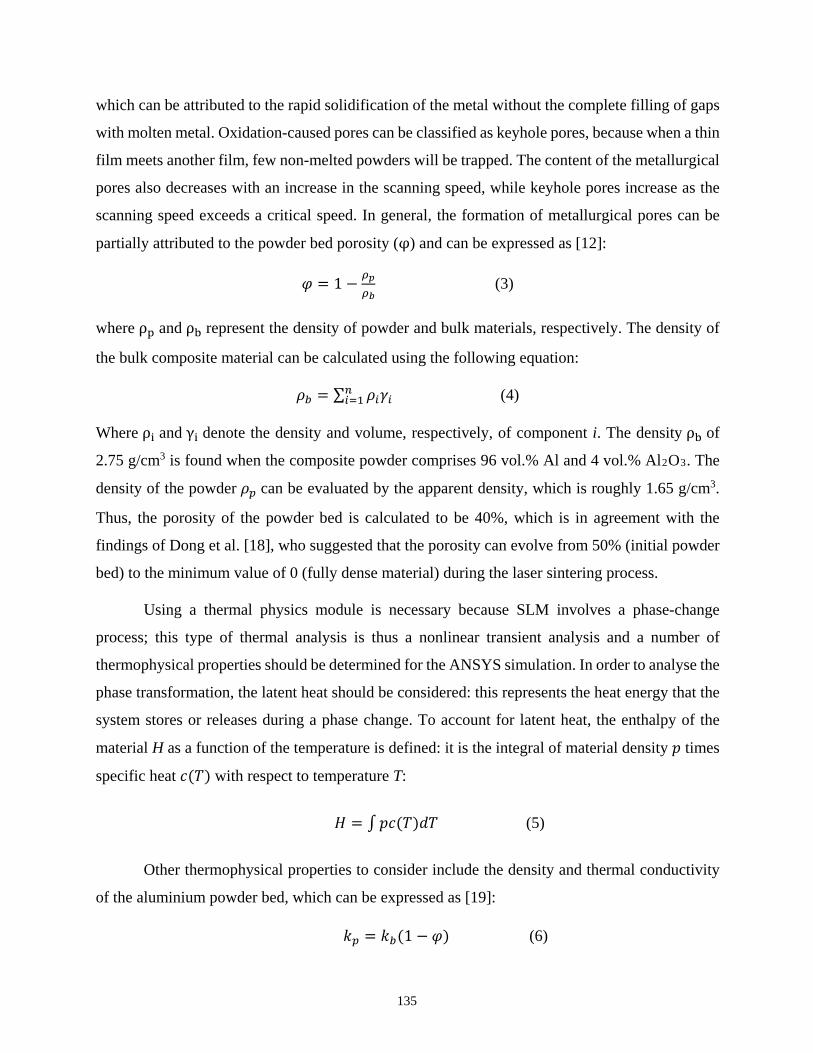
respectively; φ is the porosity of the powder bed. Typical solid thermophysical properties of
aluminium and alumina are shown in Figure 2 [19].
Figure 2. Thermophysical properties of Al and Al2O3 with temperature [20].
Within practical SLM applications, the volumetric energy density (ε) is used to
systematically evaluate the influence of the process parameters that are employed; it can be
expressed as [21]:
𝜀𝜀 = 𝐴𝐴𝑣𝑣ℎ𝑑𝑑
(7)
where P denotes the laser power, v and h represent the scanning speed and hatch spacing,
respectively, and d is the powder layer thickness. An optimal volumetric energy density is required
to produce high-quality component; finite element thermal analysis provides an effective and
simple approach for predicting the optimal combination of process parameters.
Several existing studies( e.g. [8] [11] [13] )have employed this basic heat-transfer model
to investigate the thermal behaviour in SLM of metal powders such as stainless steel and titanium
alloys and have proposed FEA techniques to simulate the addition of layers with time. Few studies
136
have concentrated on the thermal behaviour of aluminium alloy powder during SLM, however
(one example is [12]), and none have focused on Al composites. In addition, certain limitations of
previous work still exist that offer interesting directions for future studies. First, since the substrate
is normally preheated to a specific temperature to avoid thermal distortion, the effect of
temperature on absorptivity should thus be considered during SLM modelling and numerical
simulation. Second, the high temperature that is produced at the laser-material interface may cause
vaporisation, and the recoil pressure induced by vaporisation will give rise to spatter; thus, the
potential vaporisation should be considered during the optimisation of process parameters.
To address this gap in the literature, this paper therefore investigates thermal behaviour
during the scanning of the premier layer’s Al-Al2O3 composite. The temperature dependent
absorptivity was considered in the modelling, and the vaporisation that is induced by excessively
high surface temperatures was considered when optimising the laser power and scanning speed.
The consideration of the temperature-dependent absorptivity and vaporisation during the
modelling and numerical simulation may thus be considered to be the main novelty of this work.
The Finite Element Model
This study used the ANSYS Multiphysics finite element package to build the premier
layer’s scanning model and to conduct the heat transfer numerical simulation used in the study.
The 3D finite element model that was developed does not rely on 2D assumptions. Figure 3 shows
the model and the scanning strategy in the premier layer. A rectangular composite powder layer of
5 x 1 x 0.05 mm was built on a 5 x 1 x 0.1 mm aluminium substrate. The nearly spherical ball-
milled composite powder offered around 40% porosity, which was considered when defining the
thermophysical properties during the modelling. The composite powder layer was meshed with
0.025 x 0.025 x 0.025 mm SOLID70 hexahedron element to improve calculation accuracy; coarse
mesh was used for the substrate.
137

Figure 3. 3D finite element model and scanning strategy
In order to reduce the simulation time, the premier layer that was built was reduced to three
scanning tracks; a bidirectional scanning strategy was employed to conduct the simulation. The
heat flux I(r) followed a Gaussian distribution (Eq. [1]); the laser radial distance r can be expressed
as:
𝑟𝑟 = �(𝑋𝑋 − 𝑎𝑎)2 + (𝑌𝑌 − 𝑏𝑏)2 (0 ≤ 𝑟𝑟 ≤ 𝑟𝑟0 ) (8)
where variables a and b can be determined as:
(𝑎𝑎, 𝑏𝑏) = � (𝑣𝑣𝑣𝑣 − (𝑛𝑛 − 1)𝑙𝑙, (𝑛𝑛 − 1)ℎ) (𝑛𝑛 = 1, 3, 5, . . . )
(𝑛𝑛𝑙𝑙 − 𝑣𝑣𝑣𝑣, (𝑛𝑛 − 1)ℎ) (𝑛𝑛 = 2, 4, 6, . . . ) (9)
138

where v and t denote the scanning speed and scanning time, respectively; n and l represent track
number and track length, respectively, and h is the hatch spacing. When three tracks are simulated,
the variables a and b can then be determined as:
(𝑎𝑎, 𝑏𝑏) =
⎩⎪⎨
⎪⎧ (𝑣𝑣𝑣𝑣, 0) (0 ≤ 𝑣𝑣 ≤ 𝑙𝑙
𝑣𝑣)
(2𝑙𝑙 − 𝑣𝑣𝑣𝑣, ℎ) (𝑙𝑙𝑣𝑣
< 𝑣𝑣 ≤ 2𝑙𝑙𝑣𝑣
)
(𝑣𝑣𝑣𝑣 − 2𝑙𝑙, 2ℎ) (2𝑙𝑙𝑣𝑣
< 𝑣𝑣 ≤ 3𝑙𝑙𝑣𝑣
)
(10)
In terms of Eq. (1), the heat-flux magnitude strongly depends on the laser power and
powder absorptivity; Figure 4 shows the heat flux magnitude as a function of these two parameters.
More specifically, when the absorptivity was fixed at 0.088 (at room temperature), the heat-flux
magnitude was around 9 GW/m2 when the laser power was relatively low, at 200 W; the heat-flux
magnitude increased to 14 GW/m2 when the laser power increased to 300 W; a 19 GW/m2 heat-
flux magnitude was reached when the laser power was increased to 400 W. Figure 4b shows the
heat-flux magnitude increased from 14 GW/m2 to 18 GW/m2 when the powder absorptivity
increased from 0.088 to 0.116. In general, a higher heat-flux magnitude leads to stronger laser
energy and further generates higher temperatures at the laser-material interface.
Figure 4. Heat-flux magnitude with laser power and absorptivity.
The following assumptions are made in this simulation in order to create a mathematically
tractable model:
139
• The composite powder bed was assumed to be homogeneous and continuous.
• The heat flux from the laser beam was modelled as Gaussian-distributed heat flux and was
given directly on the top of the composite powder bed.
• The laser spot was assumed to have a circular shape.
• The convective heat transfer coefficient between the environment and the powder bed was
assumed to be a constant.
• Radiation was ignored.
Due to the laser scanning-induced temperature gradient in the powder bed, heat transfer
occurred via convection between the powder bed and the ambient environment. The ambient
temperature was maintained at 20°C; the convective heat transfer coefficient (H) can be expressed
in Z direction, as follows:
−𝑘𝑘𝑝𝑝𝜕𝜕𝜕𝜕𝜕𝜕𝜕𝜕
= 𝐻𝐻(𝑇𝑇𝑠𝑠 − 𝑇𝑇𝑎𝑎) (11)
where 𝑘𝑘𝑝𝑝 is thermal conductivity and 𝑇𝑇𝑠𝑠 𝑎𝑎𝑛𝑛𝑑𝑑 𝑇𝑇𝑎𝑎 denote the powder bed surface temperature and
ambient temperature, respectively. In general, H is set as 10 W/(m2°C) in finite element simulation
[11]. Both the heat-flux and thermal-convection loads should be applied on the top surface of the
composite powder layer; in order to prevent heat flux from overriding the applied convection load,
it is necessary to create surface effect elements. Thermal convection was thus applied on the
surface effect elements, and the heat flux was applied on the powder layer surface. The finite
element simulation parameters that are chosen to simulate the scanning of the premier layer’s
composite powders are shown in Table 1.
Table 1. Finite element simulation parameters.
Parameters Value Parameters Value
Absorptivity, A 11.6% Convective heat transfer
coefficient, H
10 W/(m2°C)
Powder bed thickness, d 50 μm Laser power, P 200, 300, 400 W
Laser spot radius, ro 35 μm Scanning speed, v 500, 1000,1250 and 1600 mm/s
Ambient temperature, Ta 20°C Track length, l 4 mm
Number of tracks 3 Hatch spacing, h 100 and 150 μm
140
Results and Discussion
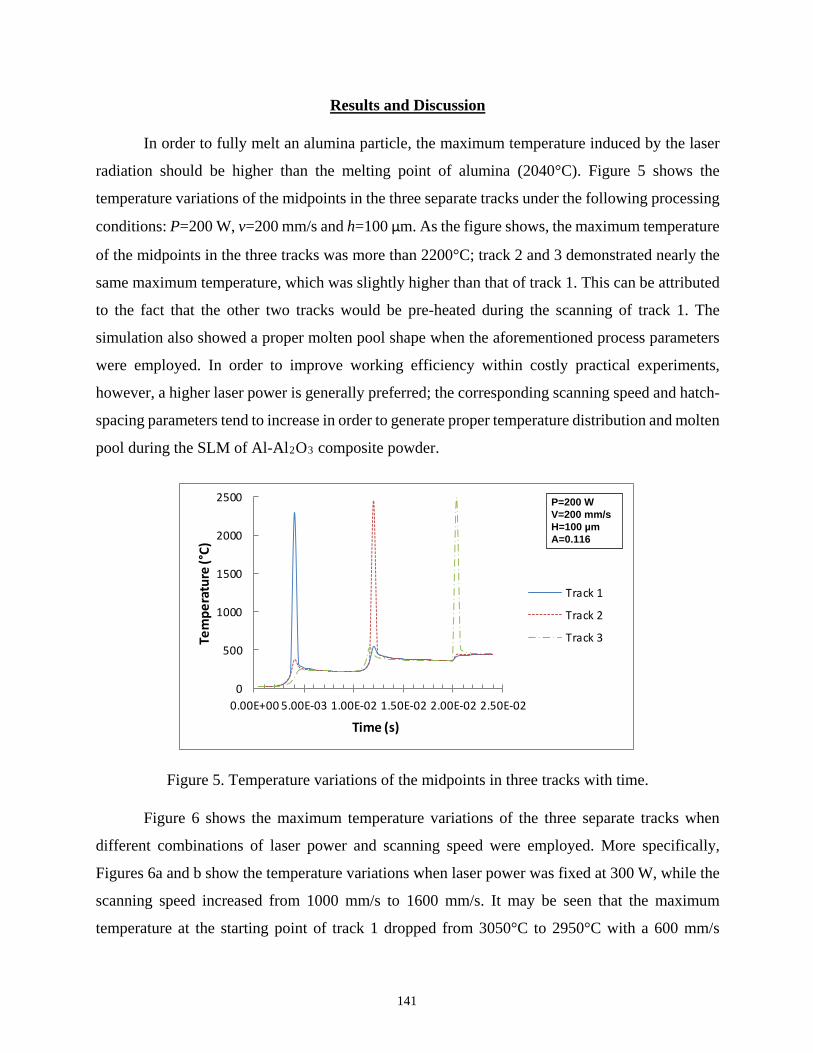
In order to fully melt an alumina particle, the maximum temperature induced by the laser
radiation should be higher than the melting point of alumina (2040°C). Figure 5 shows the
temperature variations of the midpoints in the three separate tracks under the following processing
conditions: P=200 W, v=200 mm/s and h=100 μm. As the figure shows, the maximum temperature
of the midpoints in the three tracks was more than 2200°C; track 2 and 3 demonstrated nearly the
same maximum temperature, which was slightly higher than that of track 1. This can be attributed
to the fact that the other two tracks would be pre-heated during the scanning of track 1. The
simulation also showed a proper molten pool shape when the aforementioned process parameters
were employed. In order to improve working efficiency within costly practical experiments,
however, a higher laser power is generally preferred; the corresponding scanning speed and hatch-
spacing parameters tend to increase in order to generate proper temperature distribution and molten
pool during the SLM of Al-Al2O3 composite powder.
0
500
1000
1500
2000
2500
0.00E+00 5.00E-03 1.00E-02 1.50E-02 2.00E-02 2.50E-02
Tem
pera
ture
(°C)
Time (s)
Track 1
Track 2
Track 3
P=200 WV=200 mm/sH=100 µmA=0.116
Figure 5. Temperature variations of the midpoints in three tracks with time.
Figure 6 shows the maximum temperature variations of the three separate tracks when
different combinations of laser power and scanning speed were employed. More specifically,
Figures 6a and b show the temperature variations when laser power was fixed at 300 W, while the
scanning speed increased from 1000 mm/s to 1600 mm/s. It may be seen that the maximum
temperature at the starting point of track 1 dropped from 3050°C to 2950°C with a 600 mm/s
141
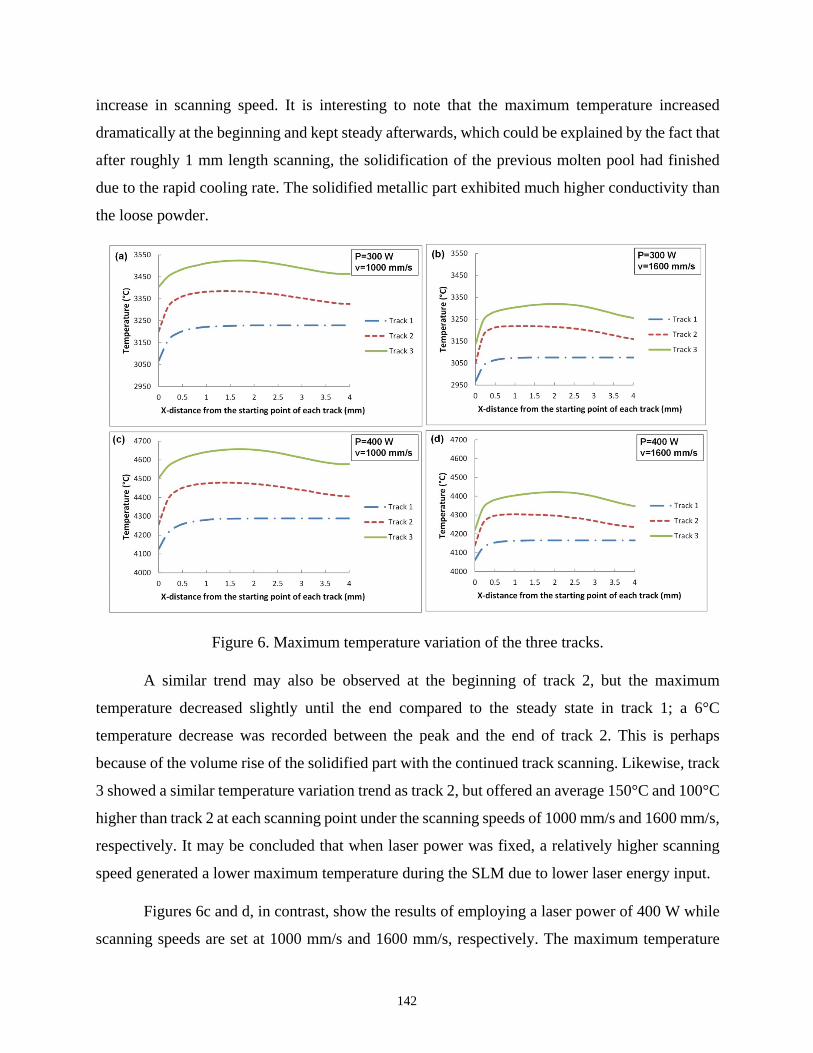
increase in scanning speed. It is interesting to note that the maximum temperature increased
dramatically at the beginning and kept steady afterwards, which could be explained by the fact that
after roughly 1 mm length scanning, the solidification of the previous molten pool had finished
due to the rapid cooling rate. The solidified metallic part exhibited much higher conductivity than
the loose powder.
Figure 6. Maximum temperature variation of the three tracks.
A similar trend may also be observed at the beginning of track 2, but the maximum
temperature decreased slightly until the end compared to the steady state in track 1; a 6°C
temperature decrease was recorded between the peak and the end of track 2. This is perhaps
because of the volume rise of the solidified part with the continued track scanning. Likewise, track
3 showed a similar temperature variation trend as track 2, but offered an average 150°C and 100°C
higher than track 2 at each scanning point under the scanning speeds of 1000 mm/s and 1600 mm/s,
respectively. It may be concluded that when laser power was fixed, a relatively higher scanning
speed generated a lower maximum temperature during the SLM due to lower laser energy input.
Figures 6c and d, in contrast, show the results of employing a laser power of 400 W while
scanning speeds are set at 1000 mm/s and 1600 mm/s, respectively. The maximum temperature
142
variation of the three tracks exhibited a trend similar to the variation observed when the laser power
was 300 W. It should be noted, however, that the increased 100 W in laser power led to roughly
1000°C increase in temperature. The maximum temperatures in track 3 were 4657°C and 3522°C,
as shown in Figures 6c and a, respectively, which indicates that when the scanning speed was fixed
at 1000 mm/s, the increased laser power of 100 W led to a more than 1000°C temperature increase
in the powder bed. The super high temperature tended to evaporate the liquid phase from the molten
pool, however, and the recoil pressure induced by vaporisation could cause spatter and further
decrease the layer thickness. It may also be concluded that the temperature generated was more
sensitive to the laser power than to the scanning speed.
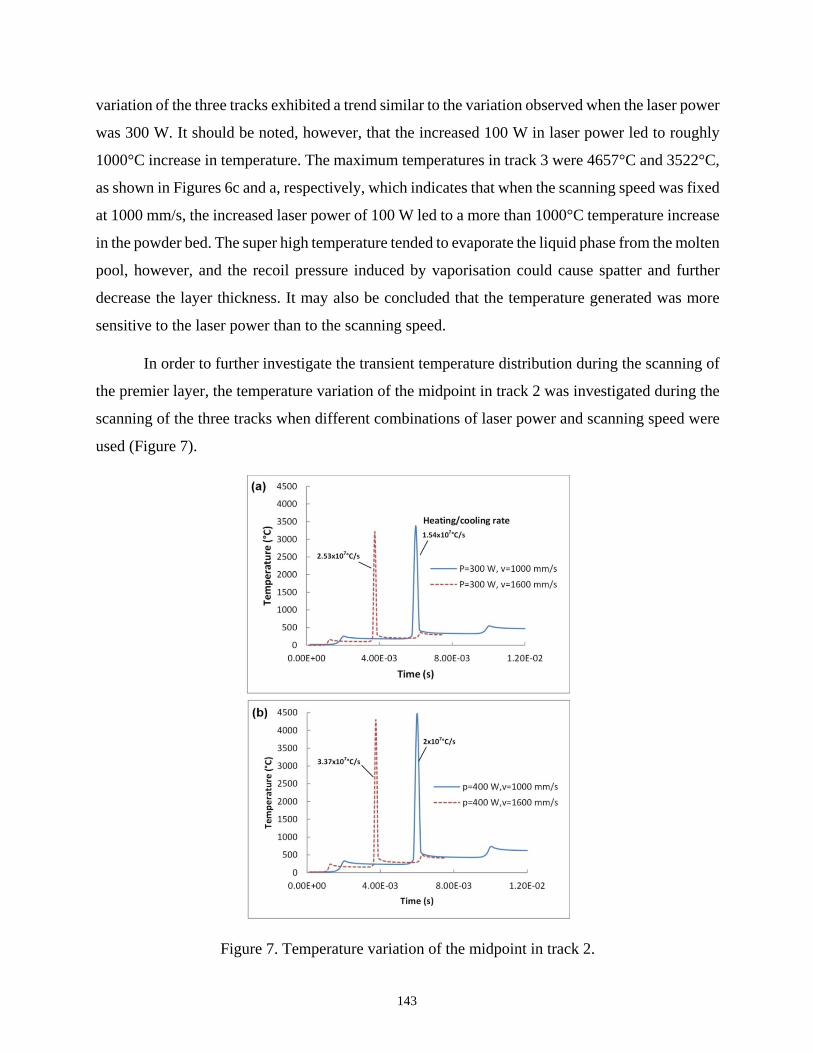
In order to further investigate the transient temperature distribution during the scanning of
the premier layer, the temperature variation of the midpoint in track 2 was investigated during the
scanning of the three tracks when different combinations of laser power and scanning speed were
used (Figure 7).
Figure 7. Temperature variation of the midpoint in track 2.
143

Figure 7a shows the temperature variation of the midpoint in track 2 when the laser power
was fixed at 300 W. It may be seen that the temperature reached a peak of 3380°C at 0.006s when
the scanning speed was at 1000 mm/s; a cooling rate of 1.54x10⁷°C/s could then be determined.
Likewise, when the scanning speed increased to 1600 mm/s, the peak reached 0.00375s with the
temperature of 3215°C; the calculated cooling rate was 2.53x10⁷ °C/s. It may be concluded that
when the laser power was set at 300 W, the scanning speeds of both 1000 mm/s and 1600 mm/s
could generate rapid cooling rates to produce very fine microstructures in the as-built parts. Figure
7b shows the temperature variation of the midpoint in track 2 when the laser power is fixed at 400
W and the determined peak temperature was 4473°C and 4299°C, respectively. Furthermore, the
calculated cooling rate was 2x10⁷°C/s and 3.37x10⁷°C/s when the scanning speed was set at 1000
mm/s and 1600 mm/s, respectively.
It may be concluded that when the laser power was fixed, a lower maximum temperature
and higher cooling rate could be generated with an increase in scanning speed. When the scanning
speed was fixed, however, both the maximum temperature and the heating/cooling rate increased
dramatically with an increase in laser power. The cooling rates are generally thought to be more
sensitive to scanning speed rather than to laser power. In order to determine the laser power and
scanning speed that are best suited for SLM of the composite powder, one should not only consider
the maximum temperature and cooling rate but also take into account the molten pool dimensions.
Figure 8a shows the molten pool temperature contours of the midpoint in track 2 when the laser
power and scanning speed were set at 300 W and 1000 mm/s, from which three dimensions of the
molten pool were measured from both the top surface and the cross-sectional profile. The predicted
molten length was 165 μm compared to the width of 160 μm. It should be noted that the predicted
molten pool width could guarantee an overlapping between two adjacent tracks; this overlapping
further contributed to a strong bonding of the two rapidly solidified tracks. Under the process
conditions, the predicted molten pool depth was 77 μm greater than the single powder layer
thickness (50 μm) which implies that strong metallurgical bonding had occurred between the
powder bed and the substrate.
144

Figure 8. Molten pool dimensions of the midpoint in track 2 with laser power of 300W.
Figure 8b shows the predicted molten dimensions when the scanning speed increased to
1600 mm/s, from which the molten pool had the same measured length and width of 140 μm. The
predicted pool depth was around 51 μm, which was very close to the single powder layer thickness;
this situation implied poor metallurgical bonding between the powder bed and the substrate. It
should be noted that poor metallurgical bonding leads to higher porosity levels whereas good
bonding lead to minimum porosity. Our simulation results are thought to be consistent with the
experimental results in [22], where the measured porosity increased from 0.7% to 2.3% when the
scanning speed varied from 1000 mm/s to 1600 mm/s while maintaining laser power at 170 W.
Qiu et al. [23] also determined similar findings (Figure 9a), from which the porosity of the as-built
145

Ti6Al4V specimens was relatively low when the scanning speeds were below 2700 mm/s; the
measured porosity did increase with an increase in scanning speed, however (but below 4250
mm/s).
Figure 9. (a) Variation of porosity with laser power fixed at 400 W; (b) spatter and pores induced
by recoil pressure and Marangoni [23] [24].
It should also be noted that the heat-affected zone (greater than 400°C) offered a significant
difference in shape when the scanning speed increased from 1000 mm/s to 1600 mm/s. This can
be explained by the fact that a lower scanning speed leads to a longer laser irradiation time, and
the high temperature generated at the laser-material interface could be conducted to the rapidly
solidified regions and produce a nearly elliptical heat-affected zone (Figure 8a). The predicted
molten pool dimensions of the midpoint in track 2 are shown in Figures 8c and d when the laser
power increased to 400 W. It may be seen that Figure 8c displays a similar heat-affected zone
shape to Figure 8a, but it shows a much larger molten pool; this situation may be attributed this
situation to higher laser energy input when a higher laser power was employed. Likewise, Figure
8d shows a similar heat-affected zone to Figure 8b, as well as a larger molten pool size.
Furthermore, the situations shown in Figure 8c and d could guarantee strong bonding behaviours
of the two adjacent tracks and two powder layers. It should be noted, however, that the generated
maximum temperatures of 4473°C and 4299°C could evaporate the fluid out of the molten pool,
thus resulting in porosity and spatter, both of which could contribute to poor mechanical properties
of the as-built parts. This observation appears to be consistent with Khairallah et al.’ findings [24]
(Figure 9b), from which the recoil pressure induced by the vaporisation, together with the
Marangoni convection, led to the spatter and depression of the molten pool. When the depression
146

collapsed, however, porosity could be formed in the as-built parts; the formed pores were
detrimental to mechanical properties (e.g. yield strength, elongation).
Experimental work was conducted using the Renishaw AM250 in order to validate the
simulation results. The laser power was maintained at 200 W while scanning speed varied between
200 mm/s and 600 mm/s (Figure 10). It can be seen that the measured melt pool with and depth
decrease with an increase in scanning speed; the predicted melt pool depth decrease from 29 µm
to 10 µm, which shows proper agreement with experimental results. It should be noted that,
however, the track height that was produced using a layer thickness of 50 µm is less than the layer
thickness and this might be attributed to the porosity of the powder bed and the spreading out of
the melted metallic powder.
Figure 10. Experimental validation with laser power of 200 W
Conclusions
This study has developed a three-dimensional transient finite element model for predicting
thermal behaviour during the scanning of the premier layer in SLM of Al-Al2O3 composite
powders. The following conclusions have been drawn from the simulation results.
• The maximum temperature at each scanning point decreased with an increase in scanning
speed and rose with an increase in laser power. Apart from the first scanned track, the
147
maximum temperature in the other tracks increased at the beginning and then decreased
until the track scan was completed.
• The cooling rate was predicted to rise with an increase in both scanning speed and laser
power, but it is thought to be more sensitive to scanning speed than to laser power. When
laser power and scanning speed were fixed, however, the cooling rate that was determined
remained constant; it was considered to be independent of the scanning positions. The
dimensions of the molten pool are predicted to rise with an increase in laser power but
decrease with an increase in scanning speed.
• When the laser power was set at 400 W, the predicted maximum temperature was above
4000°C when the scanning speeds employed were 1000 mm/s and 1600 mm/s. It is believed
that he excessively high temperature resulted in vaporisation and other defects; in order to
obtain high-quality parts, the recommended volumetric energy density is thus 40 J/mm3
with laser power 300 W, scanning speed 1000 mm/s, hatch spacing 150 μm and layer
thickness 50 μm. These findings will aid in developing an understanding of thermal
behaviour during the SLM of AL-Al2O3 composites when optimising process parameters
in order to produce high-quality parts with minimal defects and maximal efficiency.
References
[1] R. B. Patil and V. Yadava, “Finite element analysis of temperature distribution in single metallic powder layer during metal laser sintering,” Int. J. Mach. Tools Manuf., vol. 47, no. 7–8, pp. 1069–1080, 2007.
[2] S. Dadbakhsh and L. Hao, “Effect of Al alloys on selective laser melting behaviour and microstructure of in-situ formed particle reinforced composites,” J. Alloys Compd., vol. 541, pp. 328–334, 2012.
[3] L. Thijs, K. Kempen, J. P. Kruth, and J. Van Humbeeck, “Fine-structured aluminium products with controllable texture by selective laser melting of pre-alloyed AlSi10Mg powder,” Acta Mater., vol. 61, no. 5, pp. 1809–1819, 2013.
[4] M. Wong, S. Tsopanos, C. J. Sutcliffe, and I. Owen, “Selective laser melting of heat transfer devices,” Rapid Prototyp. J., vol. 13, no. 5, pp. 291–297, 2007.
[5] Q. Han, R. Setchi, and S. L. Evans, “Synthesis and characterisation of advanced ball-milled Al-Al2O3 nanocomposites for selective laser melting,” Powder Technol., vol. 297, pp. 183–192, 2016.
148
[6] P. Mercelis and J.-P. Kruth, “Residual stresses in selective laser sintering and selective laser melting,” Rapid Prototyp. J., vol. 12, no. 5, pp. 254–265, 2006.
[7] T. H. C. Childs, C. Hauser, and M. Badrossamay, “Mapping and Modelling Single Scan Track Formation in Direct Metal Selective Laser Melting,” CIRP Annals - Manufacturing Technology, vol. 53, no. 1. pp. 191–194, 2004.
[8] T. Childs, “Selective laser sintering (melting) of stainless and tool steel powders: experiments and modelling,” Proc. …, vol. 219, no. 4, pp. 339–357, 2005.
[9] M. Matsumoto, M. Shiomi, K. Osakada, and F. Abe, “Finite element analysis of single layer forming on metallic powder bed in rapid prototyping by selective laser processing,” Int. J. Mach. Tools Manuf., vol. 42, no. 1, pp. 61–67, 2002.
[10] K. Dai and L. Shaw, “Distortion minimization of laser-processed components through control of laser scanning patterns,” Rapid Prototyping Journal, vol. 8, no. 5. pp. 270–276, 2002.
[11] A. Hussein, L. Hao, C. Yan, and R. Everson, “Finite element simulation of the temperature and stress fields in single layers built without-support in selective laser melting,” Mater. Des., vol. 52, pp. 638–647, 2013.
[12] Y. Li and D. Gu, “Parametric analysis of thermal behavior during selective laser melting additive manufacturing of aluminum alloy powder,” Mater. Des., 2014.
[13] I. A. Roberts, C. J. Wang, R. Esterlein, M. Stanford, and D. J. Mynors, “A three-dimensional finite element analysis of the temperature field during laser melting of metal powders in additive layer manufacturing,” Int. J. Mach. Tools Manuf., vol. 49, no. 12–13, pp. 916–923, 2009.
[14] Kolossov, E. Boillat, R. Glardon, P. Fischer, and M. Locher, “3D FE simulation for temperature evolution in the selective laser sintering process,” Int. J. Mach. Tools Manuf., vol. 44, no. 2–3, pp. 117–123, 2004.
[15] N. K. Tolochko, Y. V. Khlopkov, S. E. Mozzharov, M. B. Ignatiev, T. Laoui, and V. I. Titov, “Absorptance of powder materials suitable for laser sintering,” Rapid Prototyping Journal, vol. 6, no. 3. pp. 155–161, 2000.
[16] W. Steen, K. Watkins, and J. Mazumder, Laser matrial processing. Springer Science & Business Media, 2010.
[17] N. T. Aboulkhair, N. M. Everitt, I. Ashcroft, and C. Tuck, “Reducing porosity in AlSi10Mg parts processed by selective laser melting,” Addit. Manuf., vol. 1–4, pp. 77–86, 2014.
[18] L. Dong, a. Makradi, S. Ahzi, and Y. Remond, “Three-dimensional transient finite
149

element analysis of the selective laser sintering process,” J. Mater. Process. Technol., vol. 209, no. 2, pp. 700–706, 2009.
[19] F. Thummler and R. Oberacker, An Introduction to Powder Technology. London: The University Press, 1993.
[20] Hatch J.E., “Aluminum Properties and Physical Metallurgy,” ASM ,Ohio, US, 1984.
[21] D. Gu, Y. C. Hagedorn, W. Meiners, K. Wissenbach, and R. Poprawe, “Nanocrystalline TiC reinforced Ti matrix bulk-form nanocomposites by Selective Laser Melting (SLM): Densification, growth mechanism and wear behavior,” Compos. Sci. Technol., vol. 71, pp. 1612–1620, 2011.
[22] K. Kempen, L. Thijs, E. Yasa, M. Badrossamay, W. Verheecke, and J. P. Kruth, “Process optimization and microstructural analysis for selective laser melting of AlSi10Mg,” in 22nd Annual International Solid Freeform Fabrication Symposium - An Additive Manufacturing Conference, SFF 2011, 2011, pp. 484–495.
[23] C. Qiu, C. Panwisawas, M. Ward, H. C. Basoalto, J. W. Brooks, and M. M. Attallah, “On the role of melt flow into the surface structure and porosity development during selective laser melting,” Acta Mater., vol. 96, pp. 72–79, 2015.
[24] S. A. Khairallah, A. T. Anderson, A. Rubenchik, and W. E. King, “Laser powder-bed fusion additive manufacturing: Physics of complex melt flow and formation mechanisms of pores, spatter, and denudation zones,” Acta Mater., vol. 108, pp. 36–45, 2016.
150